Embed Size (px)
DESCRIPTION
Interim Results Presentation. 15 August 2012. Agenda. Key Events Operations 2012 Interim Results Outlook Questions & Answers. Key Events. 3. Key Events. Robust recurring pre-tax profit of £9.2m, up 5% from H1 2011 EPRA NAV of £0.60 pence compared to £0.63 pence at 30 December 2011 - PowerPoint PPT Presentation
Citation preview

Interim Results Presentation
15 August 2012

2
Agenda
Key Events
Operations
2012 Interim Results
Outlook
Questions & Answers

33
Key Events
4
Key Events
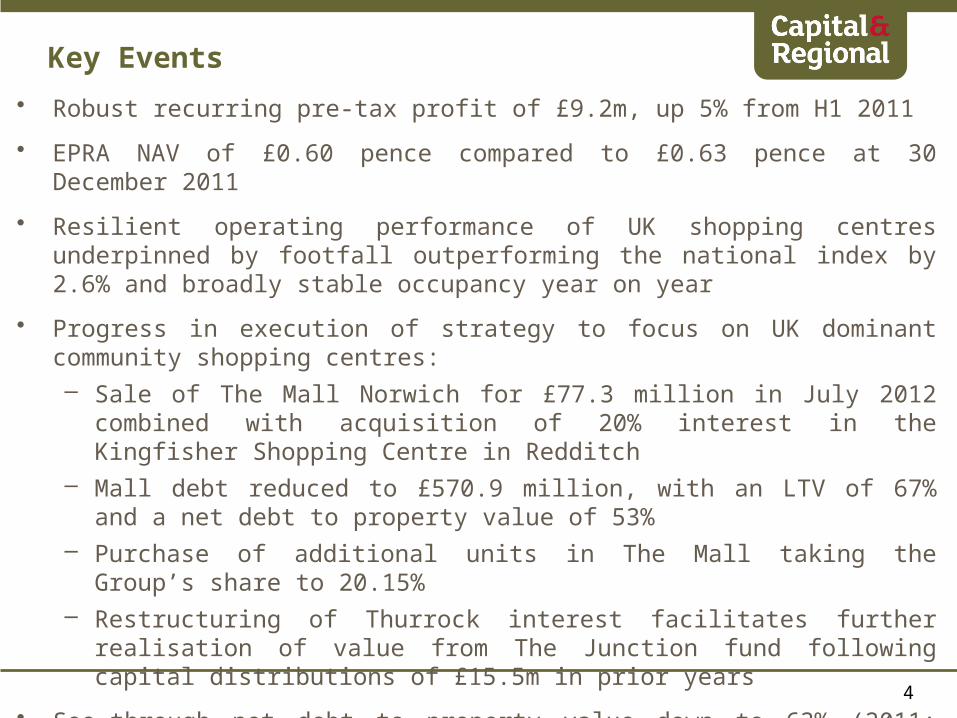
• Robust recurring pre-tax profit of £9.2m, up 5% from H1 2011
• EPRA NAV of £0.60 pence compared to £0.63 pence at 30 December 2011
• Resilient operating performance of UK shopping centres underpinned by footfall outperforming the national index by 2.6% and broadly stable occupancy year on year
• Progress in execution of strategy to focus on UK dominant community shopping centres:– Sale of The Mall Norwich for £77.3 million in July 2012 combined with
acquisition of 20% interest in the Kingfisher Shopping Centre in Redditch– Mall debt reduced to £570.9 million, with an LTV of 67% and a net debt to
property value of 53%– Purchase of additional units in The Mall taking the Group’s share to 20.15%– Restructuring of Thurrock interest facilitates further realisation of value from
The Junction fund following capital distributions of £15.5m in prior years
• See-through net debt to property value down to 63% (2011: 65%); UK fund see-through net debt to property value flat at 54%

55
Operations
6
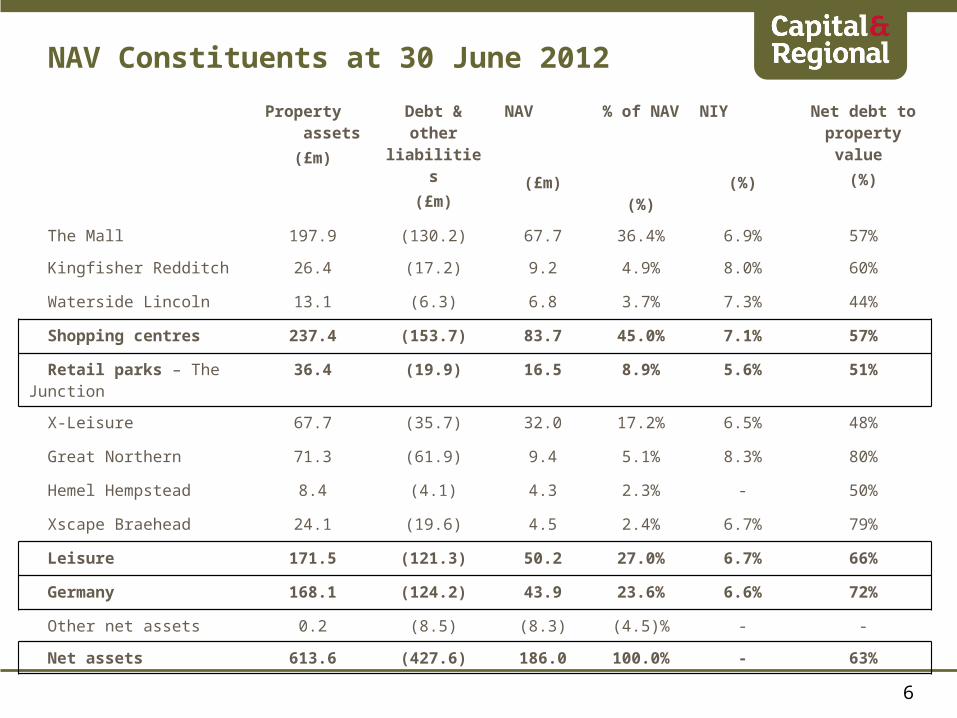
NAV Constituents at 30 June 2012
Property assets(£m)
Debt & other liabilities
(£m)
NAV
(£m)
% of NAV
(%)
NIY
(%)
Net debt to property value
(%)
The Mall 197.9 (130.2) 67.7 36.4% 6.9% 57%
Kingfisher Redditch 26.4 (17.2) 9.2 4.9% 8.0% 60%
Waterside Lincoln 13.1 (6.3) 6.8 3.7% 7.3% 44%
Shopping centres 237.4 (153.7) 83.7 45.0% 7.1% 57%
Retail parks – The Junction 36.4 (19.9) 16.5 8.9% 5.6% 51%
X-Leisure 67.7 (35.7) 32.0 17.2% 6.5% 48%
Great Northern 71.3 (61.9) 9.4 5.1% 8.3% 80%
Hemel Hempstead 8.4 (4.1) 4.3 2.3% - 50%
Xscape Braehead 24.1 (19.6) 4.5 2.4% 6.7% 79%
Leisure 171.5 (121.3) 50.2 27.0% 6.7% 66%
Germany 168.1 (124.2) 43.9 23.6% 6.6% 72%
Other net assets 0.2 (8.5) (8.3) (4.5)% - -
Net assets 613.6 (427.6) 186.0 100.0% - 63%
7
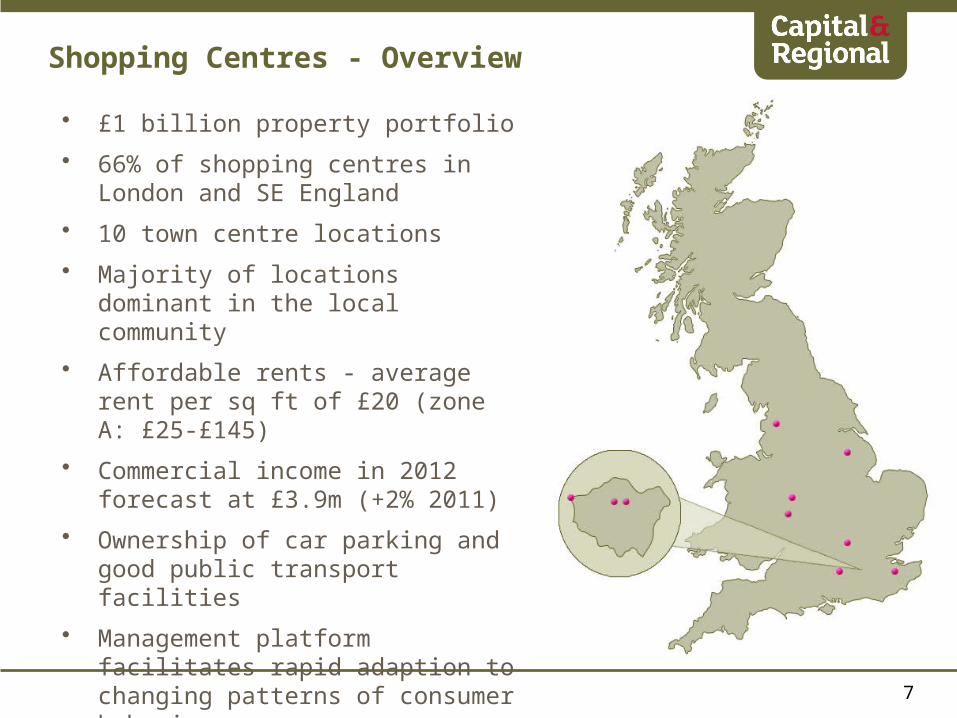
Shopping Centres - Overview
• £1 billion property portfolio
• 66% of shopping centres in London and SE England
• 10 town centre locations
• Majority of locations dominant in the local community
• Affordable rents - average rent per sq ft of £20 (zone A: £25-£145)
• Commercial income in 2012 forecast at £3.9m (+2% 2011)
• Ownership of car parking and good public transport facilities
• Management platform facilitates rapid adaption to changing patterns of consumer behaviour
8
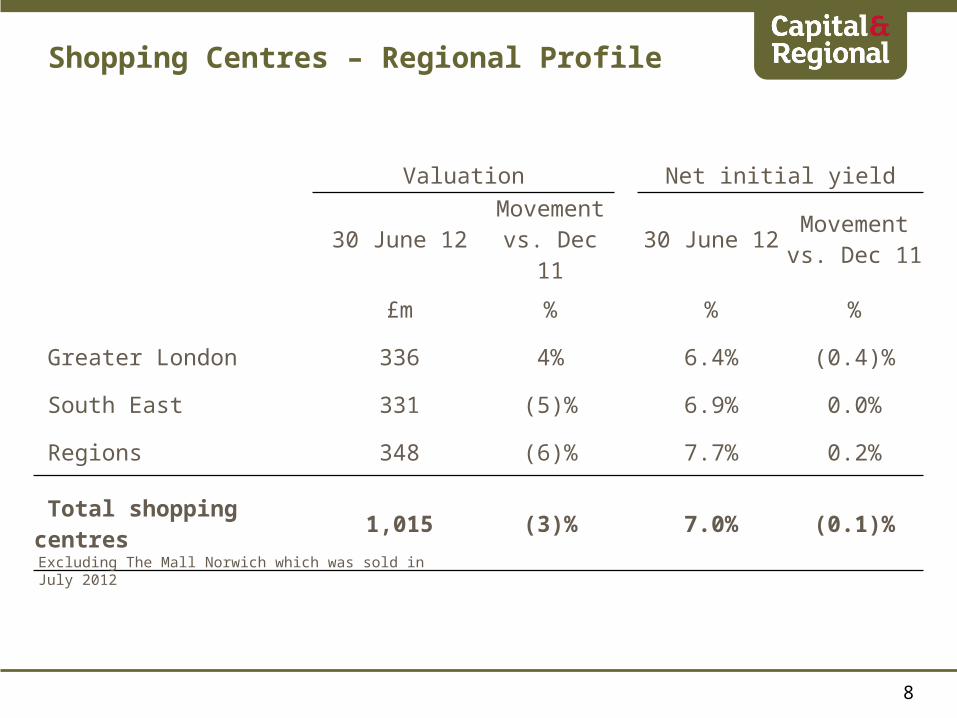
Shopping Centres – Regional Profile
Valuation Net initial yield
30 June 12
Movement vs. Dec 11
30 June 12Movement vs. Dec 11
£m % % %
Greater London 336 4% 6.4% (0.4)%
South East 331 (5)% 6.9% 0.0%
Regions 348 (6)% 7.7% 0.2%
Total shopping centres 1,015 (3)% 7.0% (0.1)%
Excluding The Mall Norwich which was sold in July 2012
99
• Footfall outperformed the national index by 2.6% a decline of 1.8% for the first seven months compared to a 4.4% decline in the national index
• 34 new lettings at 1.5% below ERV
• 10 lease renewals at 0.2% above ERV
• 37 rent reviews completed at 7.0% above ERV
• Occupancy 94.6% at 30 June 2012, stable year on year
• Passing rent down 1.8% year on year
Shopping Centres – Operating Performance
Information above excluding The Mall Norwich which was sold in July 2012
1010
• 49 units put into administration during H1, 2012 with passing rent of £4.8 million
• Strategy to maintain occupancy and trading vibrancy
• 23 re-let or assigned with a rent reduction of £0.9 million
• 8 still open and trading
• 12 under offer or held for asset management initiatives
• Leaving only six units that have yet to be re-let
• Of the 94.6% occupancy, 1.0% of relates to units that are in administration but are still open and trading
Shopping Centres – Administrations
Information above excluding The Mall Norwich which was sold in July 2012

1111
Positive new lettings and detailed negotiations ongoing with the following tenants:
Shopping Centres – Asset Management
1212
Waterside Lincoln
• Further upgrade to tenant mix with introduction of Office Shoes on a new 10 year letting without break at ERV
• Strategy to improve scheme expiry profile making progress:– Terms agreed with three national retailers to either regear or relocate within
the scheme – New letting to Office Shoes on key entrance unit
• Reconfiguration gaining momentum:– Settled scheme design– Terms agreed with Next for 14,000 sq ft two level unit – Terms agreed with catering operator for newly created Riverside unit– Advanced negotiations with second national fashion anchor for 23,000 sq ft
unit – Projected site start during H1 2013
Shopping Centres – Asset Management
1313
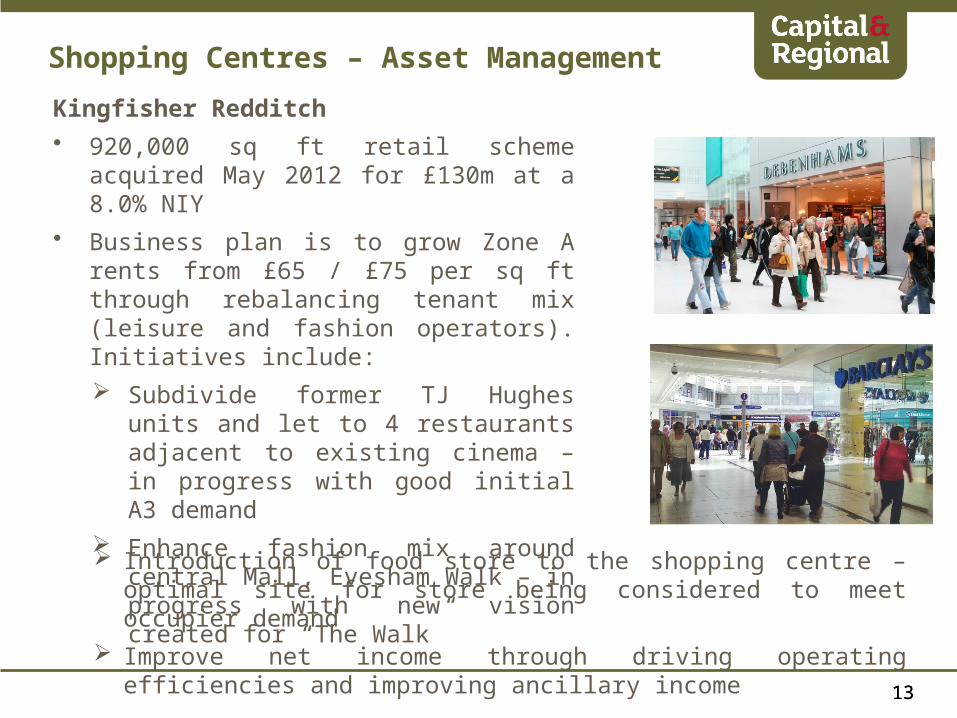
Kingfisher Redditch
• 920,000 sq ft retail scheme acquired May 2012 for £130m at a 8.0% NIY
• Business plan is to grow Zone A rents from £65 / £75 per sq ft through rebalancing tenant mix (leisure and fashion operators). Initiatives include:
Subdivide former TJ Hughes units and let to 4 restaurants adjacent to existing cinema – in progress with good initial A3 demand
Enhance fashion mix around central Mall, Evesham Walk – in progress with new vision created for “The Walk”
Shopping Centres – Asset Management
Introduction of food store to the shopping centre – optimal site for store being considered to meet occupier demand
Improve net income through driving operating efficiencies and improving ancillary income
1414
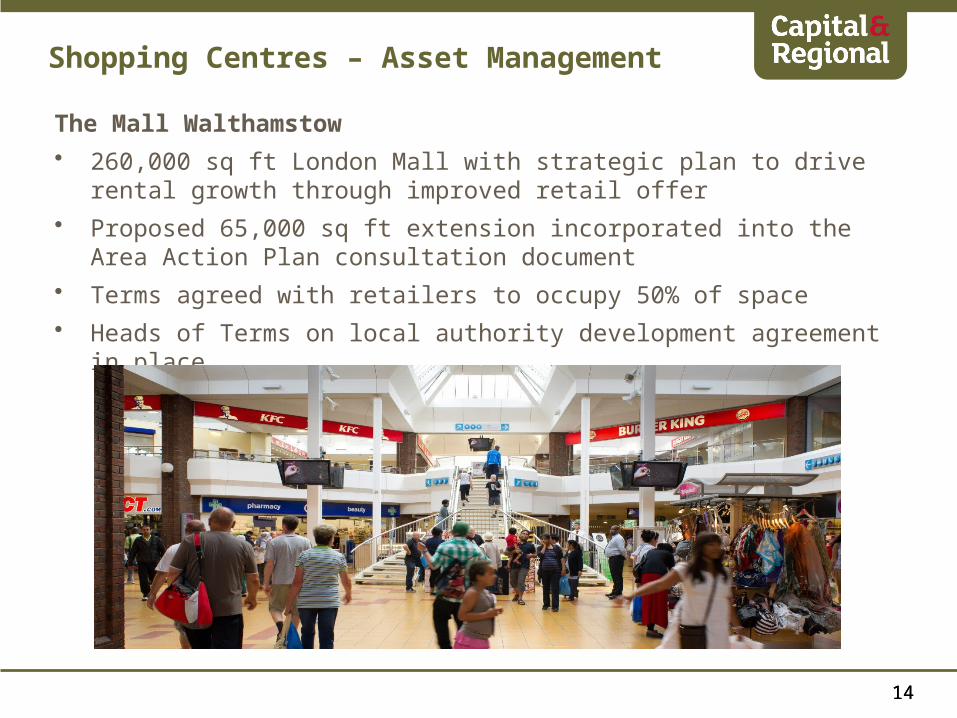
The Mall Walthamstow
• 260,000 sq ft London Mall with strategic plan to drive rental growth through improved retail offer
• Proposed 65,000 sq ft extension incorporated into the Area Action Plan consultation document
• Terms agreed with retailers to occupy 50% of space
• Heads of Terms on local authority development agreement in place
Shopping Centres – Asset Management
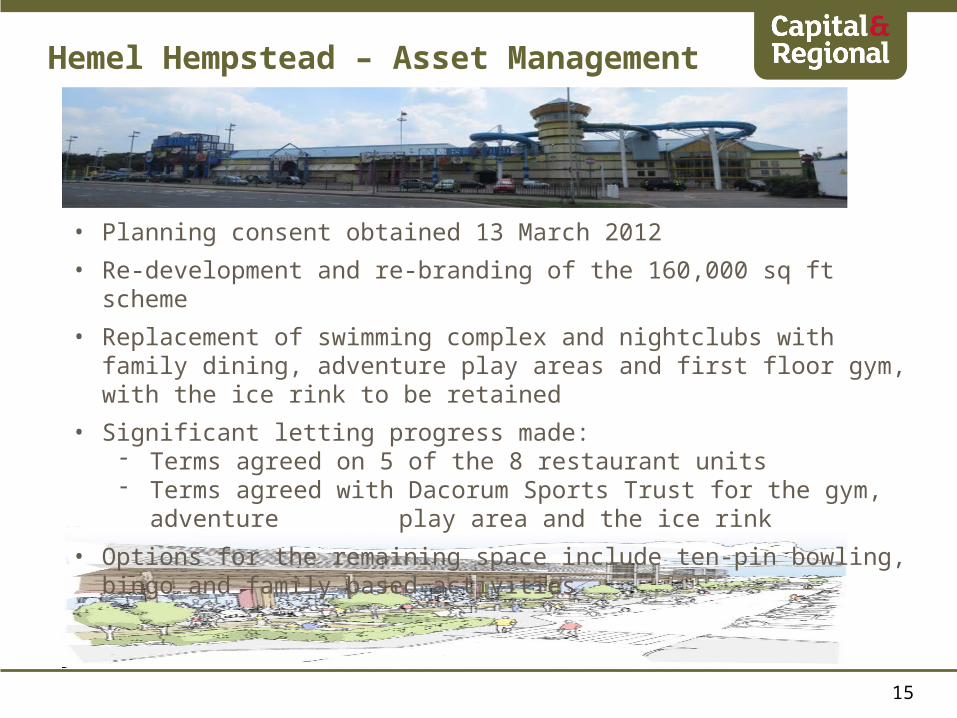
Hemel Hempstead – Asset Management
• Planning consent obtained 13 March 2012
• Re-development and re-branding of the 160,000 sq ft scheme
• Replacement of swimming complex and nightclubs with family dining, adventure play areas and first floor gym, with the ice rink to be retained
• Significant letting progress made:- Terms agreed on 5 of the 8 restaurant units - Terms agreed with Dacorum Sports Trust for the gym, adventure
play area and the ice rink
• Options for the remaining space include ten-pin bowling, bingo and family based activities
15
1616
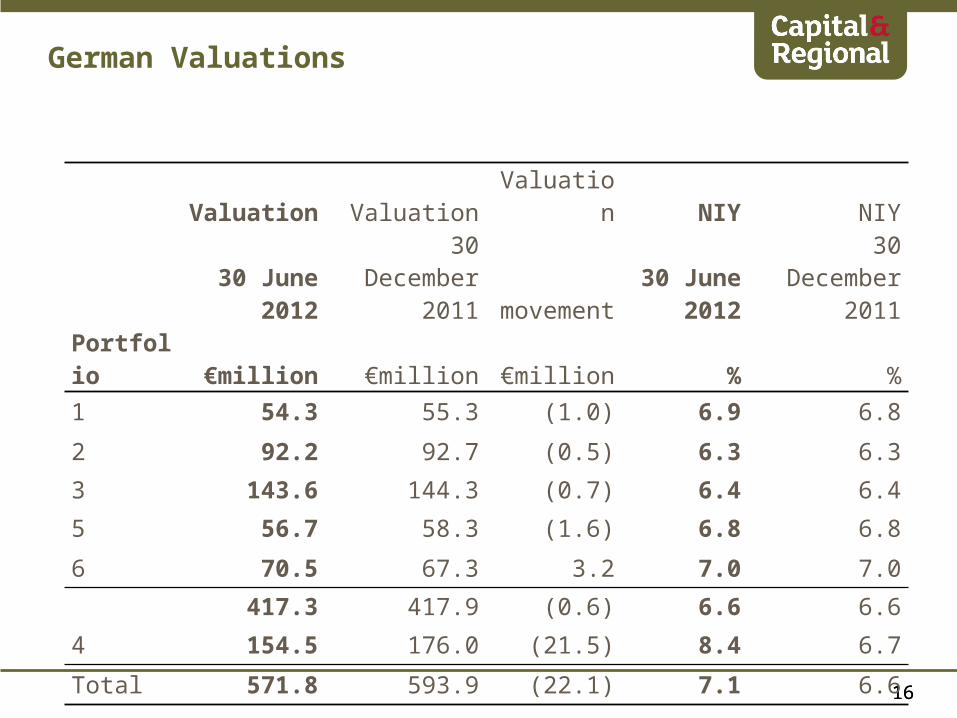
German Valuations
Valuation Valuation Valuation NIY NIY
30 June
201230 December
2011 movement30 June
201230 December
2011
Portfolio €million €million €million % %1 54.3 55.3 (1.0) 6.9 6.8
2 92.2 92.7 (0.5) 6.3 6.3
3 143.6 144.3 (0.7) 6.4 6.4
5 56.7 58.3 (1.6) 6.8 6.8
6 70.5 67.3 3.2 7.0 7.0
417.3 417.9 (0.6) 6.6 6.6
4 154.5 176.0 (21.5) 8.4 6.7
Total 571.8 593.9 (22.1) 7.1 6.6
1717
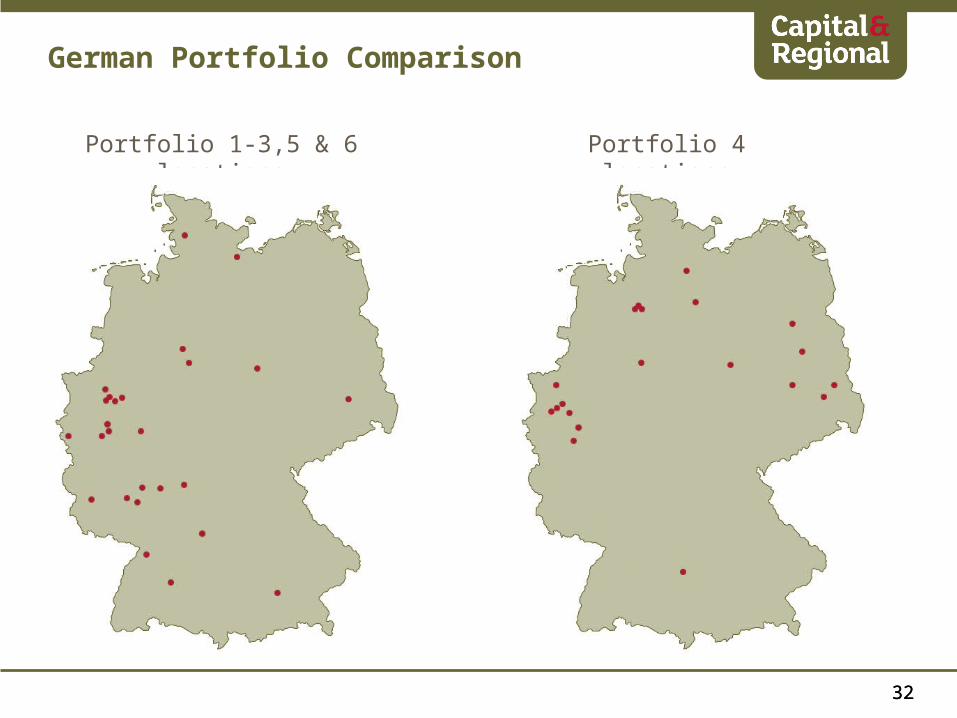
The German joint venture comprises six separate portfolios
There are significant differences between portfolio 4 and the other five portfolios which are stronger due to the following key factors:
• Longer weighted average lease lengths of 7.8 years compared to portfolio 4 of 5.4 years;
• Higher occupancy levels of 98.7% compared to portfolio 4 of 91.5%;
• Anchor tenants which are primarily major food retailers with strong covenants;
• Located primarily in western Germany (93%) whilst portfolio 4 consists of smaller properties in more challenging locations with 29% in the east of Germany;
• Institutional type properties, with an average property value of €16.1 million compared to portfolio 4 with €7.7 million; and
• Lower gearing with an average loan to value of 74% compared to portfolio 4 of 102%.
German Portfolio Comparison
1818
2012 Interim Results
1919
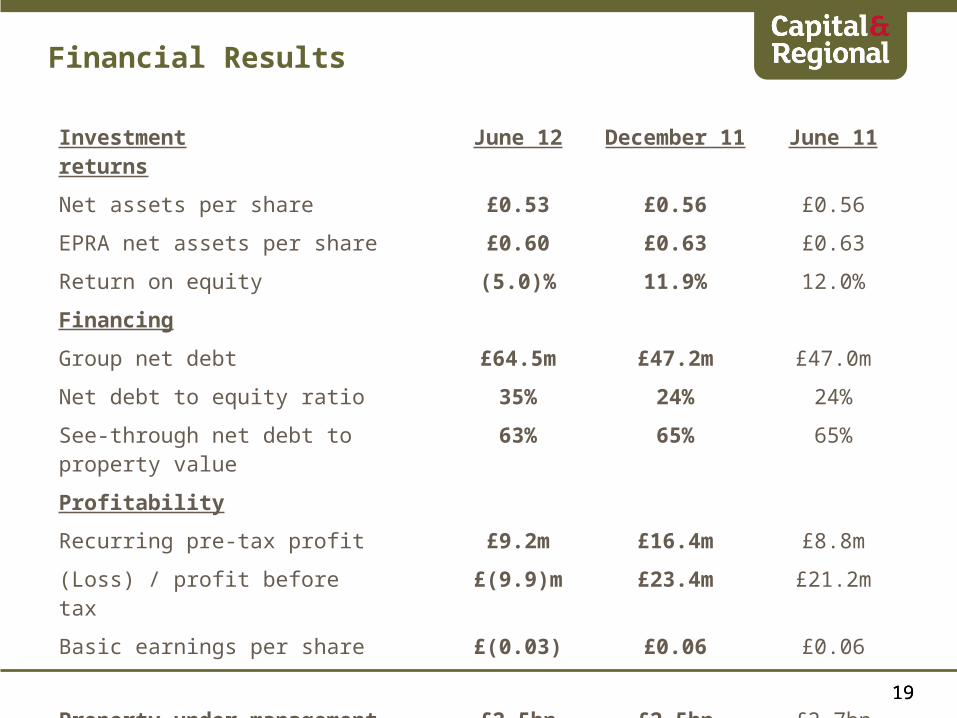
Financial Results
Investment returns June 12 December 11 June 11
Net assets per share £0.53 £0.56 £0.56
EPRA net assets per share £0.60 £0.63 £0.63
Return on equity (5.0)% 11.9% 12.0%
Financing
Group net debt £64.5m £47.2m £47.0m
Net debt to equity ratio 35% 24% 24%
See-through net debt to property value
63% 65% 65%
Profitability
Recurring pre-tax profit £9.2m £16.4m £8.8m
(Loss) / profit before tax £(9.9)m £23.4m £21.2m
Basic earnings per share £(0.03) £0.06 £0.06
Property under management £2.5bn £2.5bn £2.7bn
20
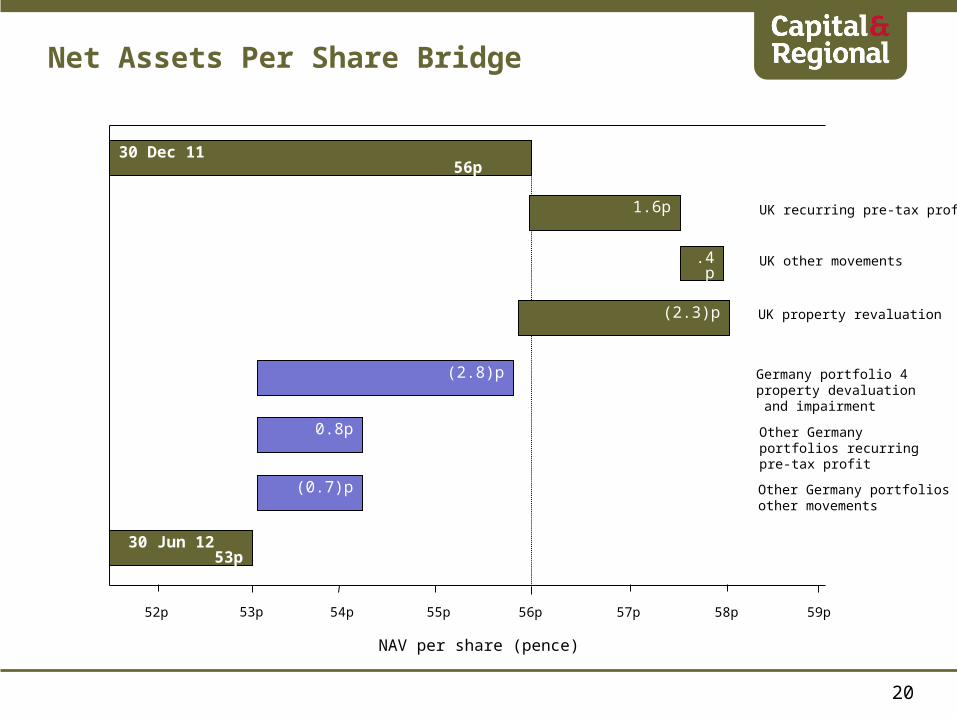
Net Assets Per Share Bridge
53p 54p 55p 56p
30 Jun 12 53p
30 Dec 11 56p
NAV per share (pence)
1.6p
(2.3)p
UK recurring pre-tax profit
UK property revaluation
(2.8)p
59p58p57p
.4p
52p
UK other movements
0.8p Other Germany portfolios recurring pre-tax profit
(0.7)p Other Germany portfolios other movements
Germany portfolio 4 property devaluation and impairment
2121
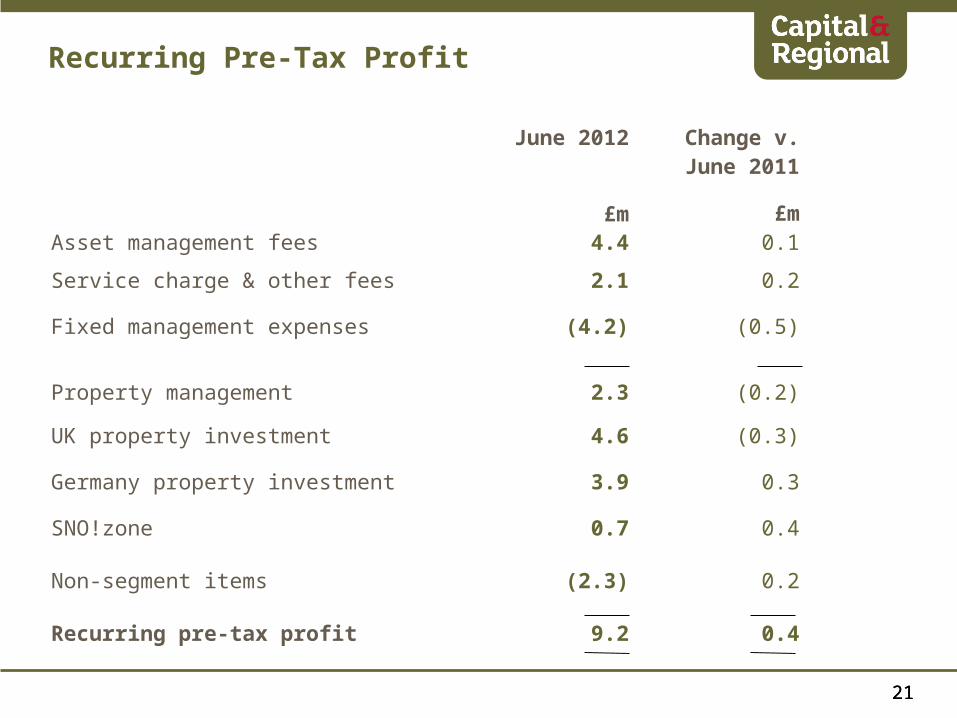
June 2012
£m
Change v. June 2011
£m
Asset management fees 4.4 0.1
Service charge & other fees 2.1 0.2
Fixed management expenses (4.2) (0.5)
Property management 2.3 (0.2)
UK property investment 4.6 (0.3)
Germany property investment 3.9 0.3
SNO!zone 0.7 0.4
Non-segment items (2.3) 0.2
Recurring pre-tax profit 9.2 0.4
Recurring Pre-Tax Profit
2222
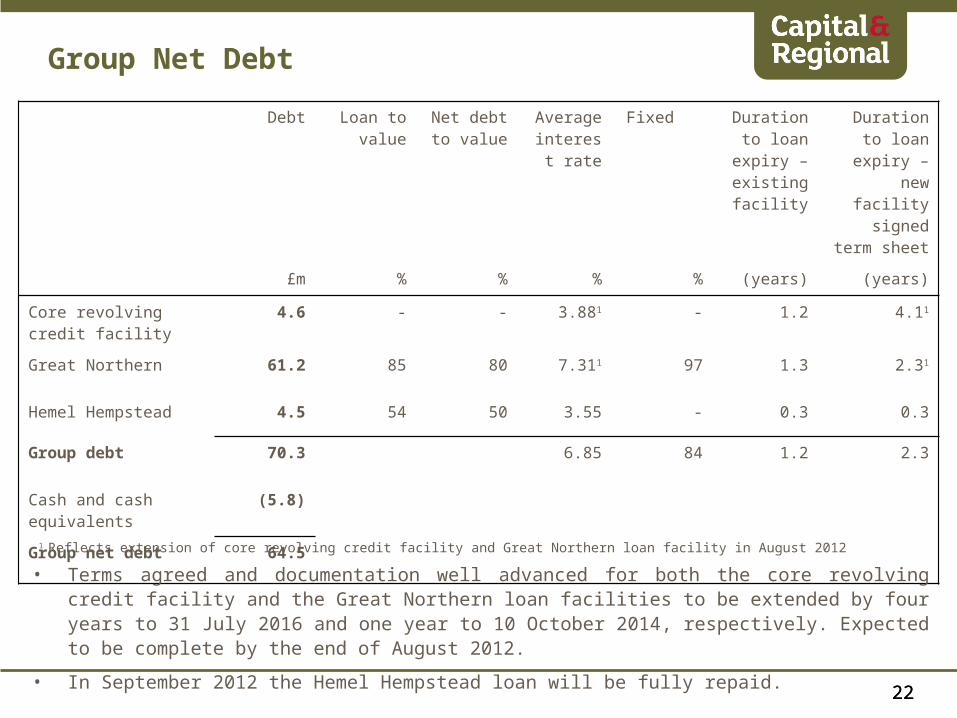
Group Net Debt
Debt Loan to value
Net debt to value
Average interest
rate
Fixed
Duration to loan expiry
– existing facility
Duration to loan expiry –
new facility signed term
sheet
£m % % % % (years) (years)
Core revolving credit facility
4.6 - - 3.881 - 1.2 4.11
Great Northern 61.2 85 80 7.311 97 1.3 2.31
Hemel Hempstead 4.5 54 50 3.55 - 0.3 0.3
Group debt 70.3 6.85 84 1.2 2.3
Cash and cash equivalents
(5.8)
Group net debt 64.5
• Terms agreed and documentation well advanced for both the core revolving credit facility and the Great Northern loan facilities to be extended by four years to 31 July 2016 and one year to 10 October 2014, respectively. Expected to be complete by the end of August 2012.
• In September 2012 the Hemel Hempstead loan will be fully repaid.
1 Reflects extension of core revolving credit facility and Great Northern loan facility in August 2012
2323
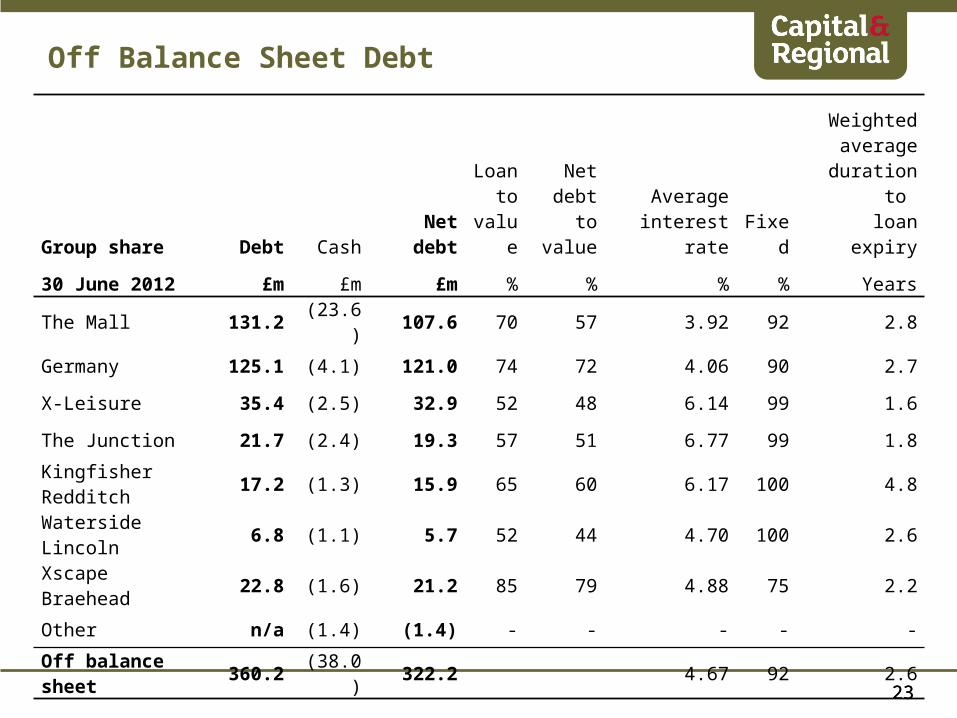
Off Balance Sheet Debt
Weighted
Loan
toNet
debt Average average
duration to
Group share Debt Cash Net debt valueto
value interest rate Fixed loan expiry
30 June 2012 £m £m £m % % % % Years
The Mall 131.2 (23.6) 107.6 70 57 3.92 92 2.8
Germany 125.1 (4.1) 121.0 74 72 4.06 90 2.7
X-Leisure 35.4 (2.5) 32.9 52 48 6.14 99 1.6
The Junction 21.7 (2.4) 19.3 57 51 6.77 99 1.8
Kingfisher Redditch 17.2 (1.3) 15.9 65 60 6.17 100 4.8
Waterside Lincoln 6.8 (1.1) 5.7 52 44 4.70 100 2.6
Xscape Braehead 22.8 (1.6) 21.2 85 79 4.88 75 2.2
Other n/a (1.4) (1.4) - - - - -
Off balance sheet 360.2 (38.0) 322.2 4.67 92 2.6
2424
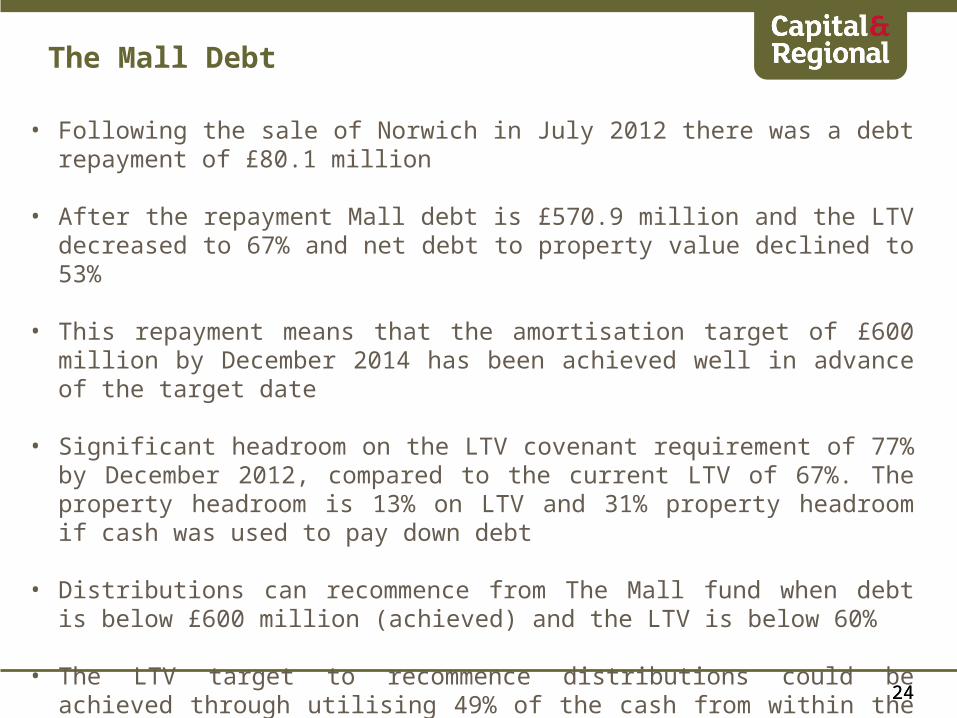
The Mall Debt
• Following the sale of Norwich in July 2012 there was a debt repayment of £80.1 million
• After the repayment Mall debt is £570.9 million and the LTV decreased to 67% and net debt to property value declined to 53%
• This repayment means that the amortisation target of £600 million by December 2014 has been achieved well in advance of the target date
• Significant headroom on the LTV covenant requirement of 77% by December 2012, compared to the current LTV of 67%. The property headroom is 13% on LTV and 31% property headroom if cash was used to pay down debt
• Distributions can recommence from The Mall fund when debt is below £600 million (achieved) and the LTV is below 60%
• The LTV target to recommence distributions could be achieved through utilising 49% of the cash from within the fund to pay down debt
2525
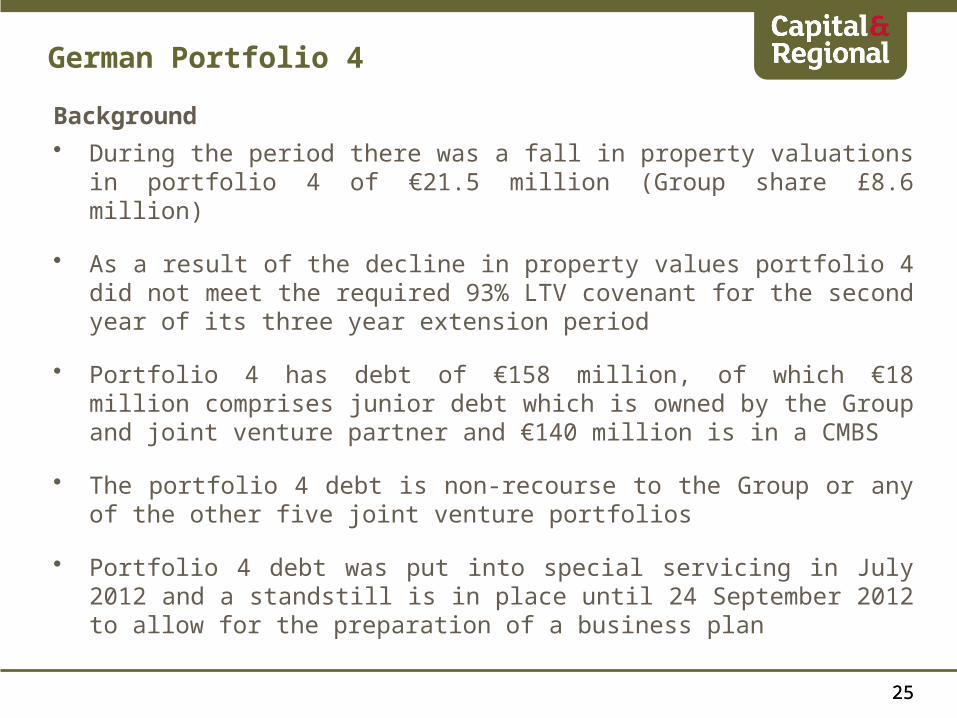
Background
• During the period there was a fall in property valuations in portfolio 4 of €21.5 million (Group share £8.6 million)
• As a result of the decline in property values portfolio 4 did not meet the required 93% LTV covenant for the second year of its three year extension period
• Portfolio 4 has debt of €158 million, of which €18 million comprises junior debt which is owned by the Group and joint venture partner and €140 million is in a CMBS
• The portfolio 4 debt is non-recourse to the Group or any of the other five joint venture portfolios
• Portfolio 4 debt was put into special servicing in July 2012 and a standstill is in place until 24 September 2012 to allow for the preparation of a business plan
German Portfolio 4
2626
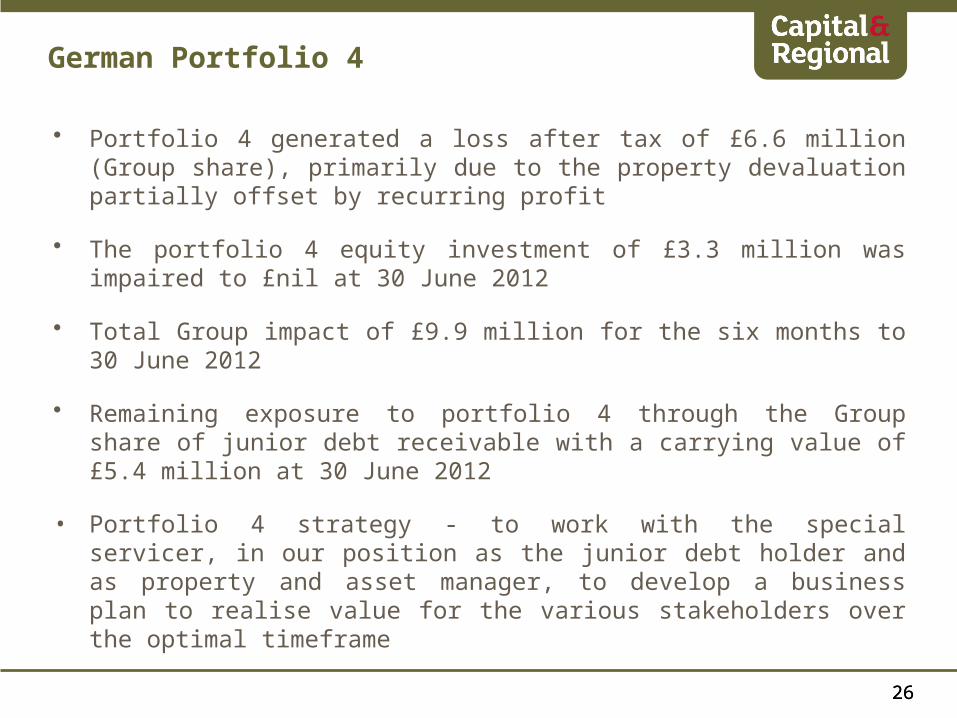
• Portfolio 4 generated a loss after tax of £6.6 million (Group share), primarily due to the property devaluation partially offset by recurring profit
• The portfolio 4 equity investment of £3.3 million was impaired to £nil at 30 June 2012
• Total Group impact of £9.9 million for the six months to 30 June 2012
• Remaining exposure to portfolio 4 through the Group share of junior debt receivable with a carrying value of £5.4 million at 30 June 2012
• Portfolio 4 strategy - to work with the special servicer, in our position as the junior debt holder and as property and asset manager, to develop a business plan to realise value for the various stakeholders over the optimal timeframe
German Portfolio 4

2727
Outlook
28
Outlook
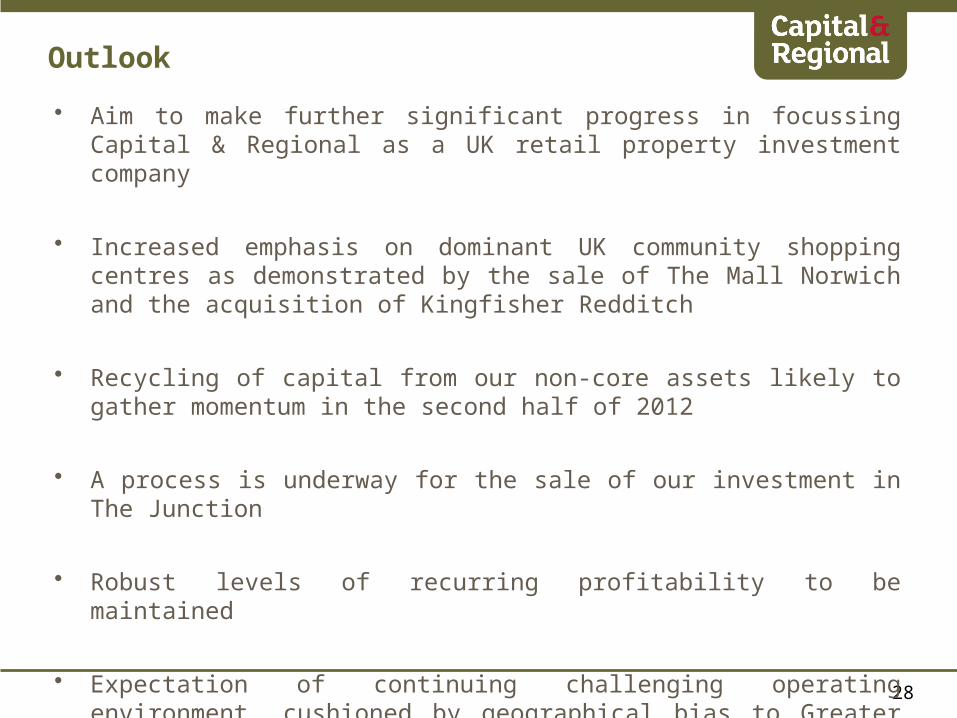
• Aim to make further significant progress in focussing Capital & Regional as a UK retail property investment company
• Increased emphasis on dominant UK community shopping centres as demonstrated by the sale of The Mall Norwich and the acquisition of Kingfisher Redditch
• Recycling of capital from our non-core assets likely to gather momentum in the second half of 2012
• A process is underway for the sale of our investment in The Junction
• Robust levels of recurring profitability to be maintained
• Expectation of continuing challenging operating environment, cushioned by geographical bias to Greater London and the South East

2929
Questions & Answers
3030
Appendix
3131
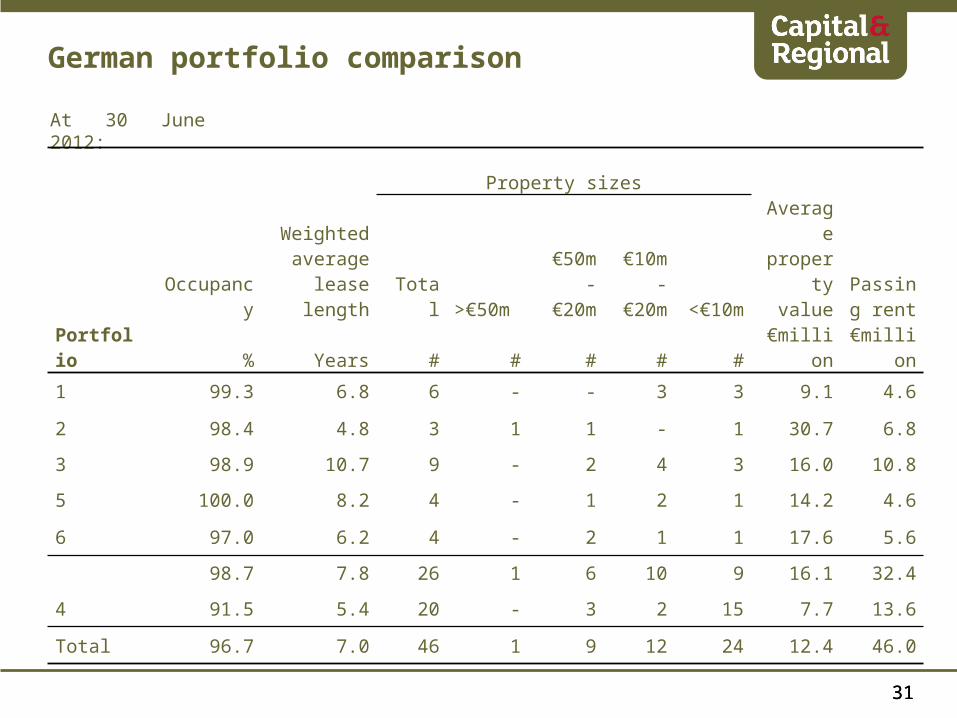
German portfolio comparison
At 30 June 2012:
Property sizes
Occupancy
Weighted average
lease length Total >€50m €50m -
€20m
€10m -
€20m <€10m
Average property
valuePassing
rent
Portfolio % Years # # # # # €million €million
1 99.3 6.8 6 - - 3 3 9.1 4.6
2 98.4 4.8 3 1 1 - 1 30.7 6.8
3 98.9 10.7 9 - 2 4 3 16.0 10.8
5 100.0 8.2 4 - 1 2 1 14.2 4.6
6 97.0 6.2 4 - 2 1 1 17.6 5.6
98.7 7.8 26 1 6 10 9 16.1 32.4
4 91.5 5.4 20 - 3 2 15 7.7 13.6
Total 96.7 7.0 46 1 9 12 24 12.4 46.0
3232
German Portfolio Comparison
Portfolio 4 locationsPortfolio 1-3,5 & 6 locations
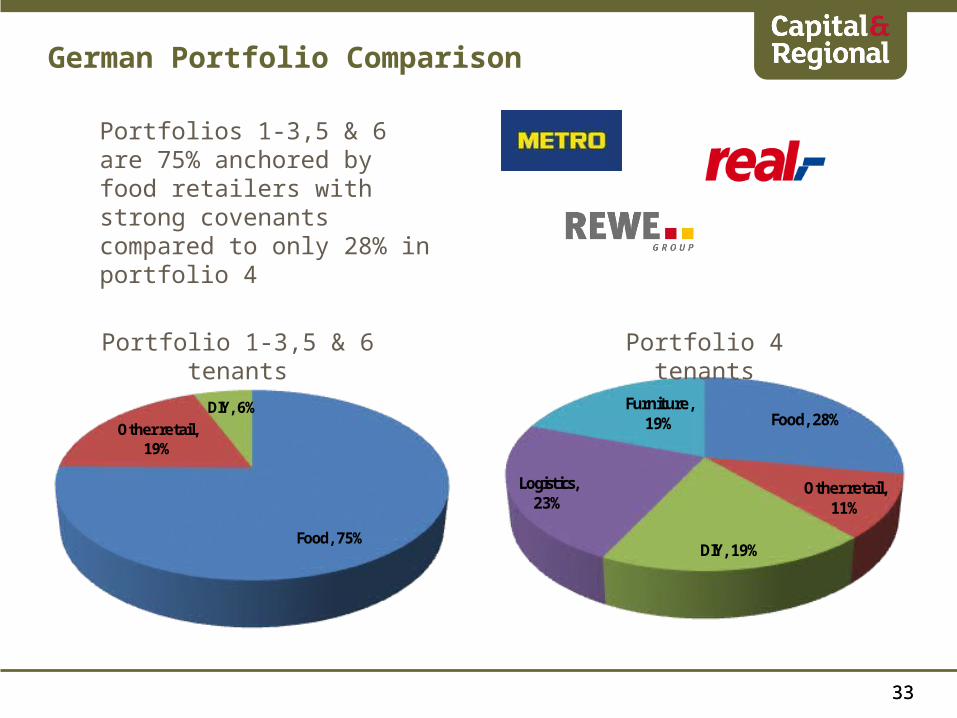
Food, 28%
Other retail, 11%
DIY, 19%
Logistics, 23%
Furniture, 19%
3333
German Portfolio Comparison
Food, 75%
Other retail, 19%
DIY, 6%
Portfolio 1-3,5 & 6 tenants Portfolio 4 tenants
Portfolios 1-3,5 & 6 are 75% anchored by food retailers with strong covenants compared to only 28% in portfolio 4
3434
Forward Looking Statement
This document contains certain statements that are neither reported financial results nor other historical information. These statements are forward-looking in nature and are subject to risks and uncertainties.
Actual future results may differ materially from those expressed in or implied by these statements. Many of these risks and uncertainties relate to factors that are beyond the Group’s ability to control or estimate precisely, such as future market conditions, currency fluctuations, the behaviour of other market participants, the actions of government regulators and other risk factors such as the Group’s ability to continue to obtain financing to meet its liquidity needs, changes in the political, social and regulatory framework in which the Group operates or in economic or technological trends or conditions, including inflation and consumer confidence, on a global, regional or national basis.
Readers are cautioned not to place undue reliance on these forward-looking statements, which apply only as of the date of this document. The Group does not undertake any obligation to publicly release any revisions to these forward-looking statements to reflect events or circumstances after the date of this document. Information contained in this document relating to the Group should not be relied upon as a guide to future performance.