Embed Size (px)
Citation preview
Q12014
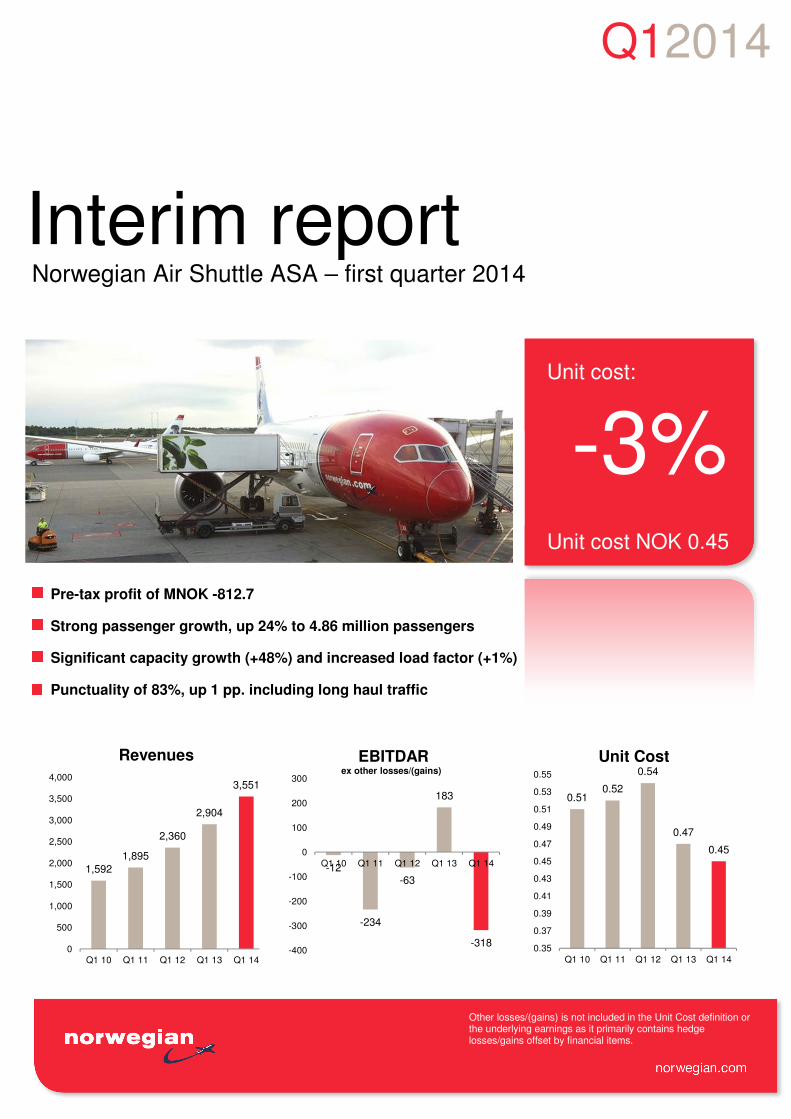
Other losses/(gains) is not included in the Unit Cost definition or the underlying earnings as it primarily contains hedge losses/gains offset by financial items.
Interim report Norwegian Air Shuttle ASA – first quarter 2014
Unit cost:
-3%
Unit cost NOK 0.45
1,592
1,895
2,360
2,904
3,551
0
500
1,000
1,500
2,000
2,500
3,000
3,500
4,000
Q1 10 Q1 11 Q1 12 Q1 13 Q1 14
Revenues
0.510.52
0.54
0.47
0.45
0.35
0.37
0.39
0.41
0.43
0.45
0.47
0.49
0.51
0.53
0.55
Q1 10 Q1 11 Q1 12 Q1 13 Q1 14
Unit Cost
-12
-234
-63
183
-318-400
-300
-200
-100
0
100
200
300
Q1 10 Q1 11 Q1 12 Q1 13 Q1 14
EBITDAR ex other losses/(gains)
Pre-tax profit of MNOK -812.7
Strong passenger growth, up 24% to 4.86 million passengers
Significant capacity growth (+48%) and increased load factor (+1%)
Punctuality of 83%, up 1 pp. including long haul traffic
Q12014
2| Report for the first quarter 2014
Other losses/(gains) is not included in the Unit Cost concept or the underlying earnings as it primarily contains hedge losses/gains offset under financial items.
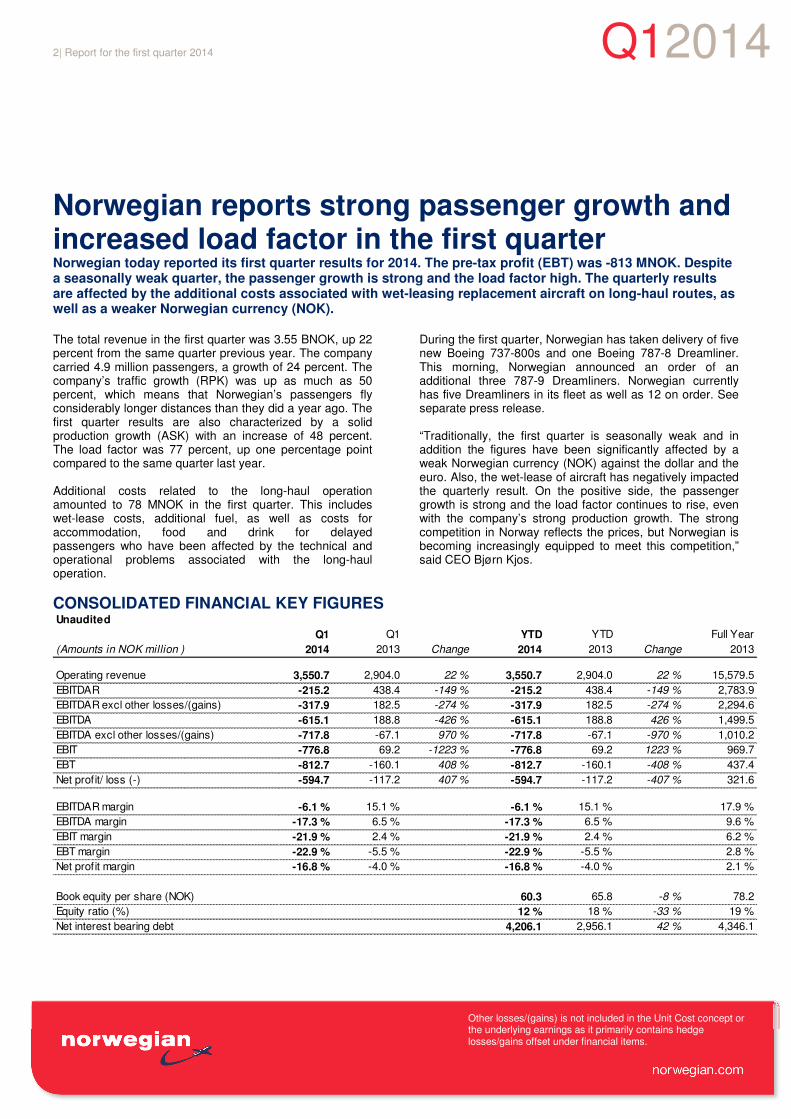
Norwegian reports strong passenger growth and increased load factor in the first quarter Norwegian today reported its first quarter results for 2014. The pre-tax profit (EBT) was -813 MNOK. Despite a seasonally weak quarter, the passenger growth is strong and the load factor high. The quarterly results are affected by the additional costs associated with wet-leasing replacement aircraft on long-haul routes, as well as a weaker Norwegian currency (NOK).
The total revenue in the first quarter was 3.55 BNOK, up 22 percent from the same quarter previous year. The company carried 4.9 million passengers, a growth of 24 percent. The company’s traffic growth (RPK) was up as much as 50 percent, which means that Norwegian’s passengers fly considerably longer distances than they did a year ago. The first quarter results are also characterized by a solid production growth (ASK) with an increase of 48 percent. The load factor was 77 percent, up one percentage point compared to the same quarter last year. Additional costs related to the long-haul operation amounted to 78 MNOK in the first quarter. This includes wet-lease costs, additional fuel, as well as costs for accommodation, food and drink for delayed passengers who have been affected by the technical and operational problems associated with the long-haul operation.
During the first quarter, Norwegian has taken delivery of five new Boeing 737-800s and one Boeing 787-8 Dreamliner. This morning, Norwegian announced an order of an additional three 787-9 Dreamliners. Norwegian currently has five Dreamliners in its fleet as well as 12 on order. See separate press release. “Traditionally, the first quarter is seasonally weak and in addition the figures have been significantly affected by a weak Norwegian currency (NOK) against the dollar and the euro. Also, the wet-lease of aircraft has negatively impacted the quarterly result. On the positive side, the passenger growth is strong and the load factor continues to rise, even with the company’s strong production growth. The strong competition in Norway reflects the prices, but Norwegian is becoming increasingly equipped to meet this competition,” said CEO Bjørn Kjos.
CONSOLIDATED FINANCIAL KEY FIGURESUnaudited
Q1 Q1 YTD YTD Full Year
(Amounts in NOK million ) 2014 2013 Change 2014 2013 Change 2013
Operating revenue 3,550.7 2,904.0 22 % 3,550.7 2,904.0 22 % 15,579.5
EBITDAR -215.2 438.4 -149 % -215.2 438.4 -149 % 2,783.9
EBITDAR excl other losses/(gains) -317.9 182.5 -274 % -317.9 182.5 -274 % 2,294.6
EBITDA -615.1 188.8 -426 % -615.1 188.8 426 % 1,499.5
EBITDA excl other losses/(gains) -717.8 -67.1 970 % -717.8 -67.1 -970 % 1,010.2
EBIT -776.8 69.2 -1223 % -776.8 69.2 1223 % 969.7
EBT -812.7 -160.1 408 % -812.7 -160.1 -408 % 437.4
Net profit/ loss (-) -594.7 -117.2 407 % -594.7 -117.2 -407 % 321.6
EBITDAR margin -6.1 % 15.1 % -6.1 % 15.1 % 17.9 %
EBITDA margin -17.3 % 6.5 % -17.3 % 6.5 % 9.6 %
EBIT margin -21.9 % 2.4 % -21.9 % 2.4 % 6.2 %
EBT margin -22.9 % -5.5 % -22.9 % -5.5 % 2.8 %
Net profit margin -16.8 % -4.0 % -16.8 % -4.0 % 2.1 %
Book equity per share (NOK) 60.3 65.8 -8 % 78.2
Equity ratio (%) 12 % 18 % -33 % 19 %
Net interest bearing debt 4,206.1 2,956.1 42 % 4,346.1
Q12014
3| Report for the first quarter 2014
Other losses/(gains) is not included in the Unit Cost definition or the underlying earnings as it primarily contains hedge losses/gains offset by financial items.
OPERATIONAL REVIEW
CONSOLIDATED TRAFFIC FIGURES AND RATIOS
Unaudited
Q1 Q1 YTD YTD Full Year
(Ratios in NOK) 2014 2013 Change 2014 2013 Change 2013
Yield 0.40 0.51 -22 % 0.40 0.51 -22 % 0.50
Unit Revenue 0.31 0.39 -21 % 0.31 0.39 -21 % 0.39
Unit Cost 0.45 0.47 -3 % 0.45 0.47 -3 % 0.42
Unit Cost ex fuel 0.32 0.33 -4 % 0.32 0.33 -4 % 0.29
Ancillary Revenue/Sched. PAX 110 88 25 % 110 88 25 % 87
Internet bookings 83 % 82 % 1 pp 83 % 82 % 1 pp 80 %
ASK (million) 9,421 6,378 48 % 9,421 6,378 48 % 34,318
RPK (million) 7,279 4,852 50 % 7,279 4,852 50 % 26,881
Passengers (million) 4.86 3.93 24 % 4.86 3.93 24 % 20.71
Load Factor 77 % 76 % 1 pp 77 % 76 % 1 pp 78 %
Average sector length (km) 1,261 1,096 15 % 1,261 1,096 15 % 1,168
Fuel consumption (metric tonnes) 199,497 135,482 47 % 199,497 135,482 47 % 735,154
CO2 per RPK 86 88 -2 % 86 88 -2 % 87
Traffic Development
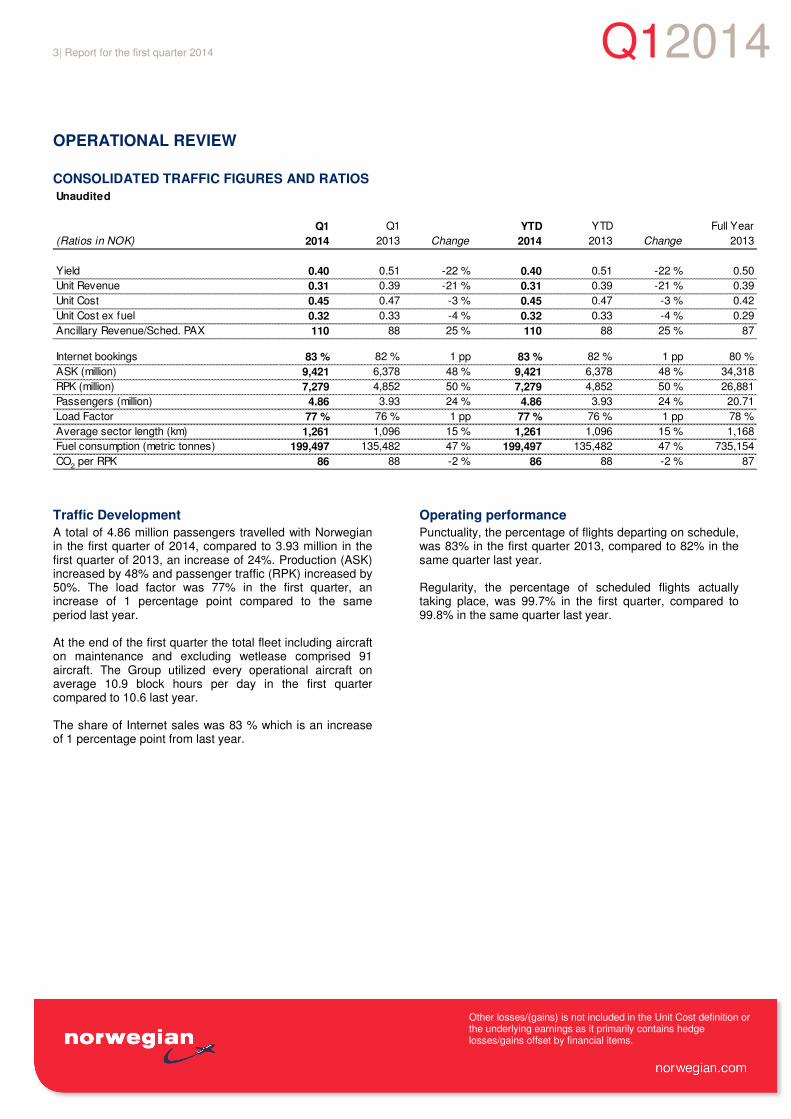
A total of 4.86 million passengers travelled with Norwegian in the first quarter of 2014, compared to 3.93 million in the first quarter of 2013, an increase of 24%. Production (ASK) increased by 48% and passenger traffic (RPK) increased by 50%. The load factor was 77% in the first quarter, an increase of 1 percentage point compared to the same period last year. At the end of the first quarter the total fleet including aircraft on maintenance and excluding wetlease comprised 91 aircraft. The Group utilized every operational aircraft on average 10.9 block hours per day in the first quarter compared to 10.6 last year. The share of Internet sales was 83 % which is an increase of 1 percentage point from last year.
Operating performance
Punctuality, the percentage of flights departing on schedule, was 83% in the first quarter 2013, compared to 82% in the same quarter last year. Regularity, the percentage of scheduled flights actually taking place, was 99.7% in the first quarter, compared to 99.8% in the same quarter last year.
Q12014
4| Report for the first quarter 2014
Other losses/(gains) is not included in the Unit Cost concept or the underlying earnings as it primarily contains hedge losses/gains offset under financial items.
FINANCIAL REVIEW
Profit and loss statement
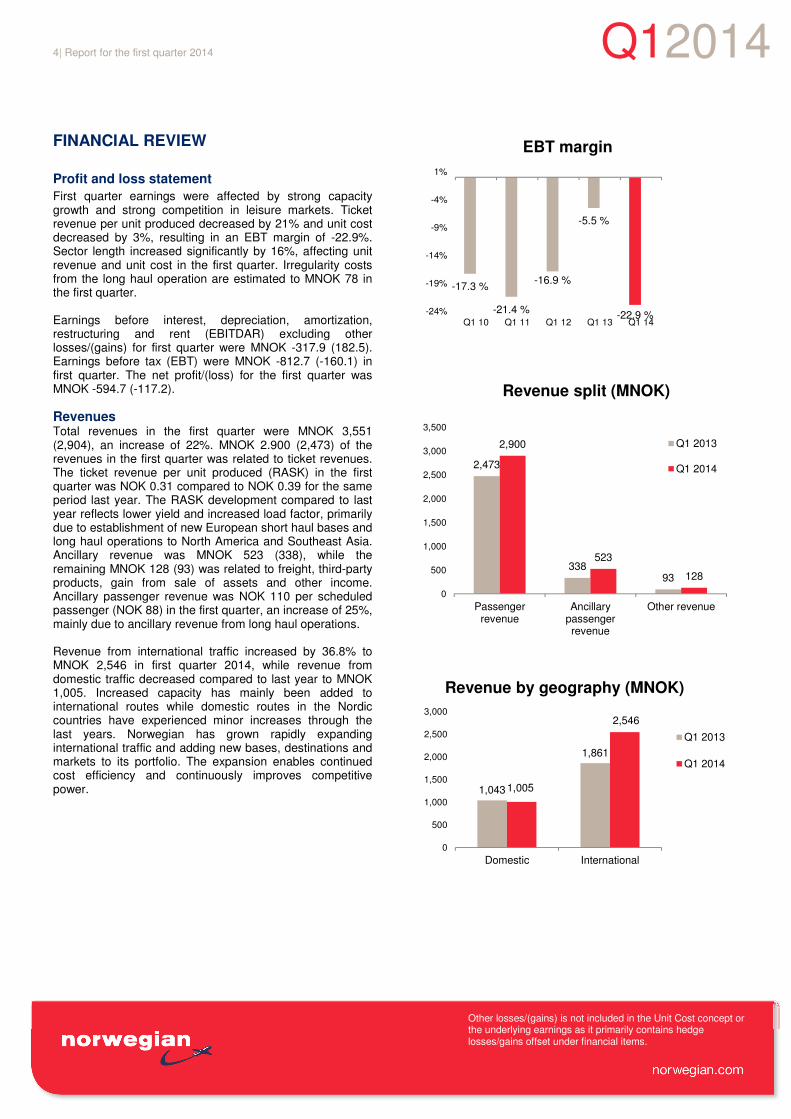
First quarter earnings were affected by strong capacity growth and strong competition in leisure markets. Ticket revenue per unit produced decreased by 21% and unit cost decreased by 3%, resulting in an EBT margin of -22.9%. Sector length increased significantly by 16%, affecting unit revenue and unit cost in the first quarter. Irregularity costs from the long haul operation are estimated to MNOK 78 in the first quarter. Earnings before interest, depreciation, amortization, restructuring and rent (EBITDAR) excluding other losses/(gains) for first quarter were MNOK -317.9 (182.5). Earnings before tax (EBT) were MNOK -812.7 (-160.1) in first quarter. The net profit/(loss) for the first quarter was MNOK -594.7 (-117.2).
Revenues Total revenues in the first quarter were MNOK 3,551 (2,904), an increase of 22%. MNOK 2.900 (2,473) of the revenues in the first quarter was related to ticket revenues. The ticket revenue per unit produced (RASK) in the first quarter was NOK 0.31 compared to NOK 0.39 for the same period last year. The RASK development compared to last year reflects lower yield and increased load factor, primarily due to establishment of new European short haul bases and long haul operations to North America and Southeast Asia. Ancillary revenue was MNOK 523 (338), while the remaining MNOK 128 (93) was related to freight, third-party products, gain from sale of assets and other income. Ancillary passenger revenue was NOK 110 per scheduled passenger (NOK 88) in the first quarter, an increase of 25%, mainly due to ancillary revenue from long haul operations. Revenue from international traffic increased by 36.8% to MNOK 2,546 in first quarter 2014, while revenue from domestic traffic decreased compared to last year to MNOK 1,005. Increased capacity has mainly been added to international routes while domestic routes in the Nordic countries have experienced minor increases through the last years. Norwegian has grown rapidly expanding international traffic and adding new bases, destinations and markets to its portfolio. The expansion enables continued cost efficiency and continuously improves competitive power.
-17.3 %
-21.4 %
-16.9 %
-5.5 %
-22.9 %-24%
-19%
-14%
-9%
-4%
1%
Q1 10 Q1 11 Q1 12 Q1 13 Q1 14
EBT margin
2,473
33893
2,900
523
128
0
500
1,000
1,500
2,000
2,500
3,000
3,500
Passengerrevenue
Ancillarypassengerrevenue
Other revenue
Revenue split (MNOK)
Q1 2013
Q1 2014
1,043
1,861
1,005
2,546
0
500
1,000
1,500
2,000
2,500
3,000
Domestic International
Revenue by geography (MNOK)
Q1 2013
Q1 2014
Q120145| Report for the first quarter 2014
Other losses/(gains) is not included in the Unit Cost definition or the underlying earnings as it primarily contains hedge losses/gains offset by financial items.
Operating expenses
COST BREAKDOWN
Unaudited
Q1 Q1 YTD YTD Full Year
(Amounts in NOK million ) 2014 2013 Change 2014 2013 Change 2013
Personell expenses 759.8 624.0 22 % 759.8 624.0 22 % 2,478.3
Sales/ distribution expenses 121.1 82.7 46 % 121.1 82.7 46 % 339.4
Aviation fuel 1,274.7 859.7 48 % 1,274.7 859.7 48 % 4,694.3
Airport and ATC charges 577.3 401.3 44 % 577.3 401.3 44 % 2,185.3
Handling charges 376.1 252.6 49 % 376.1 252.6 49 % 1,339.4
Technical maintenance expenses 272.4 163.2 67 % 272.4 163.2 67 % 927.8
Other f light operation expenses 217.5 171.2 27 % 217.5 171.2 27 % 587.0
General and administrative expenses 269.6 166.8 62 % 269.6 166.8 62 % 733.3
Other losses/(gains) - net -102.7 -255.9 -60 % -102.7 -255.9 -60 % -489.3
Total operating expenses 3,765.9 2,465.6 53 % 3,765.9 2,465.6 53 % 12,795.7
Leasing 399.9 249.6 60 % 399.9 249.6 60 % 1,284.4
Total operating expenses incl lease 4,165.8 2,715.2 53 % 4,165.8 2,715.2 53 % 14,080.1
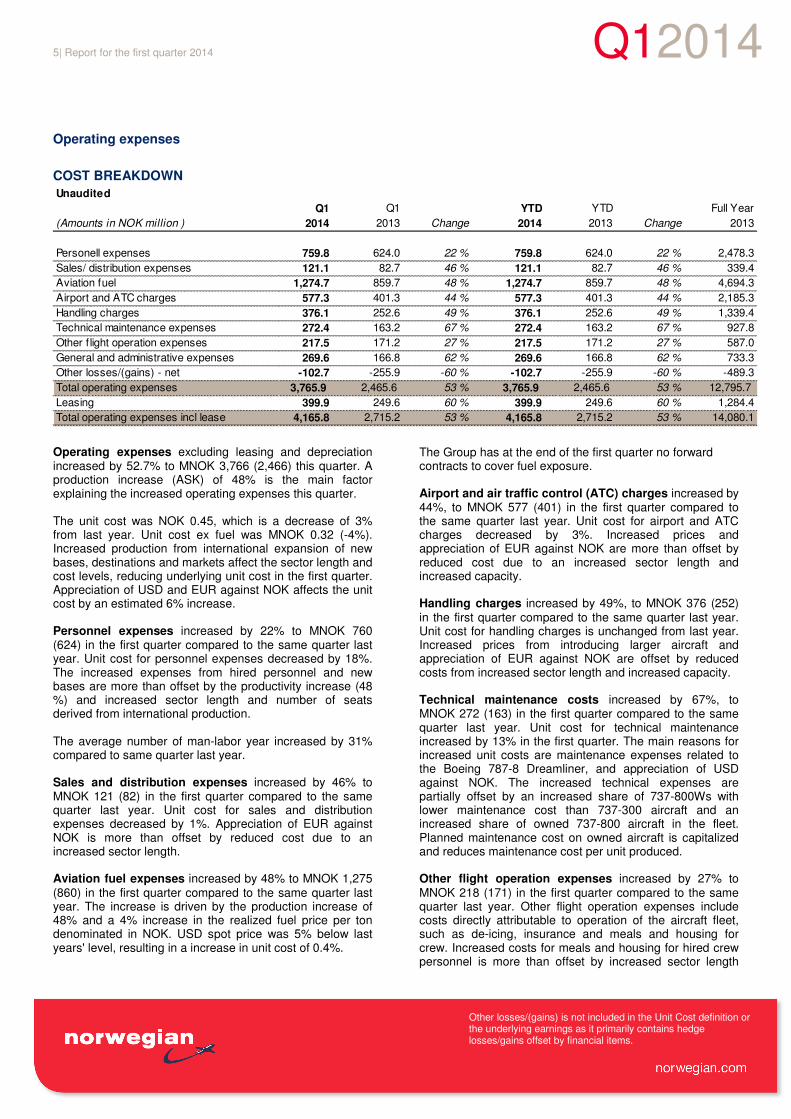
Operating expenses excluding leasing and depreciation increased by 52.7% to MNOK 3,766 (2,466) this quarter. A production increase (ASK) of 48% is the main factor explaining the increased operating expenses this quarter. The unit cost was NOK 0.45, which is a decrease of 3% from last year. Unit cost ex fuel was MNOK 0.32 (-4%). Increased production from international expansion of new bases, destinations and markets affect the sector length and cost levels, reducing underlying unit cost in the first quarter. Appreciation of USD and EUR against NOK affects the unit cost by an estimated 6% increase. Personnel expenses increased by 22% to MNOK 760 (624) in the first quarter compared to the same quarter last year. Unit cost for personnel expenses decreased by 18%. The increased expenses from hired personnel and new bases are more than offset by the productivity increase (48 %) and increased sector length and number of seats derived from international production. The average number of man-labor year increased by 31% compared to same quarter last year. Sales and distribution expenses increased by 46% to MNOK 121 (82) in the first quarter compared to the same quarter last year. Unit cost for sales and distribution expenses decreased by 1%. Appreciation of EUR against NOK is more than offset by reduced cost due to an increased sector length. Aviation fuel expenses increased by 48% to MNOK 1,275 (860) in the first quarter compared to the same quarter last year. The increase is driven by the production increase of 48% and a 4% increase in the realized fuel price per ton denominated in NOK. USD spot price was 5% below last years' level, resulting in a increase in unit cost of 0.4%.
The Group has at the end of the first quarter no forward contracts to cover fuel exposure. Airport and air traffic control (ATC) charges increased by 44%, to MNOK 577 (401) in the first quarter compared to the same quarter last year. Unit cost for airport and ATC charges decreased by 3%. Increased prices and appreciation of EUR against NOK are more than offset by reduced cost due to an increased sector length and increased capacity. Handling charges increased by 49%, to MNOK 376 (252) in the first quarter compared to the same quarter last year. Unit cost for handling charges is unchanged from last year. Increased prices from introducing larger aircraft and appreciation of EUR against NOK are offset by reduced costs from increased sector length and increased capacity. Technical maintenance costs increased by 67%, to MNOK 272 (163) in the first quarter compared to the same quarter last year. Unit cost for technical maintenance increased by 13% in the first quarter. The main reasons for increased unit costs are maintenance expenses related to the Boeing 787-8 Dreamliner, and appreciation of USD against NOK. The increased technical expenses are partially offset by an increased share of 737-800Ws with lower maintenance cost than 737-300 aircraft and an increased share of owned 737-800 aircraft in the fleet. Planned maintenance cost on owned aircraft is capitalized and reduces maintenance cost per unit produced. Other flight operation expenses increased by 27% to MNOK 218 (171) in the first quarter compared to the same quarter last year. Other flight operation expenses include costs directly attributable to operation of the aircraft fleet, such as de-icing, insurance and meals and housing for crew. Increased costs for meals and housing for hired crew personnel is more than offset by increased sector length
Q12014
6| Report for the first quarter 2014
Other losses/(gains) is not included in the Unit Cost concept or the underlying earnings as it primarily contains hedge losses/gains offset under financial items.
and increased capacity, resulting in a decreased unit cost for other flight operation expenses by 14%. General and administrative expenses increased by 62% to MNOK 270 (167) in the first quarter compared to the same quarter last year due to the introduction of new markets, products and international bases. Unit cost for general and administrative expenses increased by 9%. Other losses/(gains)-net; a gain of MNOK 103 was recognized in the first quarter compared to a gain of MNOK 256 in the first quarter last year. Included in other losses/(gains)-net are gains/losses from foreign currency contracts and gains/losses on working capital in foreign currency. Up until December 31 2013 the Group had currency hedges designated to counter currency revaluation on USD borrowings. These were realized during first quarter, amounting to a gain of MNOK 91. Leasing costs increased by 60% to MNOK 400 (250) in the first quarter compared to the same quarter last year. Unit cost for leasing increased by 9% due to the use of wetlease aircraft in international operation and by an increased number of leased 737-800Ws and the introduction of Boeing 787-8 Dreamliner in the fleet. Appreciation of USD against NOK increases unit cost in the period. During the first quarter the Group operated 35 (23) owned Boeing 737-800Ws, 1 (0) owned Boeing 787-8 Dreamliner and 5 (5) Boeing 737-300s. Profit/Loss from Associated Company in the first quarter was estimated to MNOK 14 (11) which represents the 20 % share of Bank Norwegian’s third quarter results. Financial Items were MNOK -50 (-241) in the first quarter. Interest on prepayments of MNOK 21 (28) was capitalized, reducing interest expenses. Included in other financial income (expense) is a currency gain on USD denominated borrowings amounting to MNOK 94 (227), due to depreciation of USD against NOK. At the end of 2013, the Group transferred owned aircraft to subsidiaries with USD as functional currency, and a loss of MNOK 96 on currency translation is included in financial items in first quarter 2013, offsetting the gains from borrowings. These gains and losses have no cash effects. Income taxes amounted to an income of MNOK 218 (43) in the first quarter.
Financial position and liquidity
The significant transactions contemplating the financial aspect of the restructuring took effect as of 31.12.2013. After the restructuring, the aircraft assets are accounted for in USD, creating a natural hedge against USD denominated borrowings. Net interest bearing debt at the end of the first quarter was MNOK 4,206 compared to MNOK 4,346 at the end of last
year. The financial position is highly affected by increased production and asset acquisitions. At the end of first quarter, the financial position continues to be solid with an equity ratio of 12%, a decrease of 7 percentage point from 19% at year-end 2013. Net change in cash and cash equivalents in first quarter was MNOK 994. Investments in new aircraft and equipment were MNOK -1,034 with net cash from financing activities of MNOK 927. Operational activities continue to derive sufficient cash to maintain a solid financial position and high levels of investments in new aircraft. Total non-current assets amount to MNOK 11,690 at the end of the first quarter, compared to MNOK 10,851 at the end of last year. The main investments during the quarter are related to prepayments to aircraft manufacturers for aircraft on order and delivery of five new owned Boeing 737-800Ws. Total current assets amount to MNOK 5,608 at the end of the first quarter, compared to MNOK 3,912 at the end of last year. Investments have increased by MNOK 2 during the quarter due to changes in fair value of term contracts. Receivables have increased by MNOK 701 during the year due to increased production. Cash and cash equivalents have increased by MNOK 994 during the year. Total non-current liabilities at the end of the first quarter were MNOK 7,434, compared to MNOK 6,728 at the end of last year. Long-term borrowings increased by MNOK 835 during the quarter. The increase in borrowings is mainly related to external borrowings on five Boeing 737-800Ws. Additionally, mark-to-market adjustment of USD denominated borrowings decrease the value of borrowings. Down-payments on aircraft financing partially offsets the increase. Other non-current liabilities decrease by MNOK 129 due to increased accruals for MRC offset by reduction in deferred tax. Total short-term liabilities at the end of the first quarter were MNOK 7,744, compared to MNOK 5,285 at the end of last year. Current liabilities increased by MNOK 312 during the quarter due to increased production. Short-term borrowings increased by MNOK 19 during the quarter due to increase in borrowings offset by down-payments of pre-delivery payment financing, which is replaced by long term borrowings at delivery of aircraft. Decreased value of borrowings from mark-to-market adjustment of USD denominated borrowings partially offset the increase. Air traffic liability increased by MNOK 2,128 during the quarter due to increased production. Equity at the end of the first quarter was MNOK 2,119 compared to MNOK 2,750 at the end of last year. The decrease in equity is mainly related to net loss of MNOK 595.
Q12014
7| Report for the first quarter 2014
Other losses/(gains) is not included in the Unit Cost concept or the underlying earnings as it primarily contains hedge losses/gains offset under financial items.
Cash flow
Cash and cash equivalents were MNOK 3,160 at the end of the first quarter compared to MNOK 2,166 at the end of last year.
Cash flow from operating activities in the first quarter amounted to MNOK 1,102 compared to MNOK 962 in the first quarter last year, mainly due to higher loss in the period, offset by changes in air traffic settlement liability. Due to increased production and seasonality, air traffic settlement liability increased by MNOK 2,128 during the first quarter compared to an increase of MNOK 1,529 during the same quarter last year. Cash from other adjustments amounted to MNOK -375 during first quarter compared to MNOK -527 in the same quarter last year. Other adjustments mainly consist of changes in accounts receivable, current liabilities and currency gain/loss with no cash effects. Cash flow from investment activities in the first quarter was MNOK -1,034, compared to MNOK 158 in the first quarter last year. Prepayments to aircraft manufacturers and delivery of five new Boeing 737-800Ws are the main investments in the quarter. In comparison, three new Boeing 737-800Ws were delivered and financed as sales and leaseback transactions in the first quarter last year. Cash flow from financing activities in the first quarter was MNOK 927 compared to MNOK -407 in the first quarter last year. Proceeds from long term financing of five new aircraft and pre-delivery payment financing are partially offset by down-payment on borrowings and financing costs in the quarter.
RISK AND UNCERTAINTIES The airline industry is undergoing a challenging time as a consequence of the financial crisis and global downturn. Future demand is dependent on sustained consumer and business confidence in the Company’s key markets. A market place where capacity growth exceeds market growth will increase the risk of yield pressure. However, low yield stimulates new demand, thus growing the market further. This necessitates a similar reduction in the cost level in order to maintain profitability. In the event of industrial actions, operations may be disrupted, causing inconvenience for passengers and impacting financial performance. Fuel price and currency fluctuations are risks which can have a significant impact on Norwegian’s business and financial results. Sudden and significant changes in fuel price and foreign exchange rates could significantly impact fuel and other costs, and debt denominated in foreign currency.
OUTLOOK The demand for travelling with Norwegian and advance bookings have been satisfactory entering the second
quarter of 2014. Norwegian will continue to take advantage of its increasing competitive power realized through continuous cost efficiency, and from introducing larger aircraft (14 new 737-800Ws will be delivered in 2014) with a lower operating cost. Going forward, the Company expects increased competitive pressure in the Nordic market place. Norwegians short haul operations have, in addition to the Nordic countries, at the present six bases operational in Spain (Malaga, Alicante, Las Palmas, Tenerife, Madrid and Barcelona) and a base in London. Norwegian guides for a production growth (ASK) of 40% for 2014, including the long haul production. The growth in short haul production is mainly from increasing the fleet by adding 737-800s and through increasing the average sector length. Norwegian may decide to adjust capacity in order to optimize the route portfolio depending on the development in the overall economy and in the marketplace.
Assuming a fuel price of USD 950 per ton and USD/NOK 6.00 for the year 2014 (excluding hedged volumes) and with the currently planned route portfolio, the Company is targeting a unit cost (CASK) in the area of NOK 0.40 for 2014. Despite technical and operational issues related to the start-up of the long haul operation, the establishment of the long haul operation has developed in accordance with plan. The long haul production will grow in accordance with the phasing in of aircraft and the company will have 7 Boeing 787 by the end of 2014. Norwegian has established and prepared for an organizational structure which secures cost efficient international expansion and necessary traffic rights for the future. Fornebu, 7 May 2014 CEO Bjørn Kjos
Q120148| Report for the first quarter 2014
Other losses/(gains) is not included in the Unit Cost definition or the underlying earnings as it primarily contains hedge losses/gains offset by financial items.
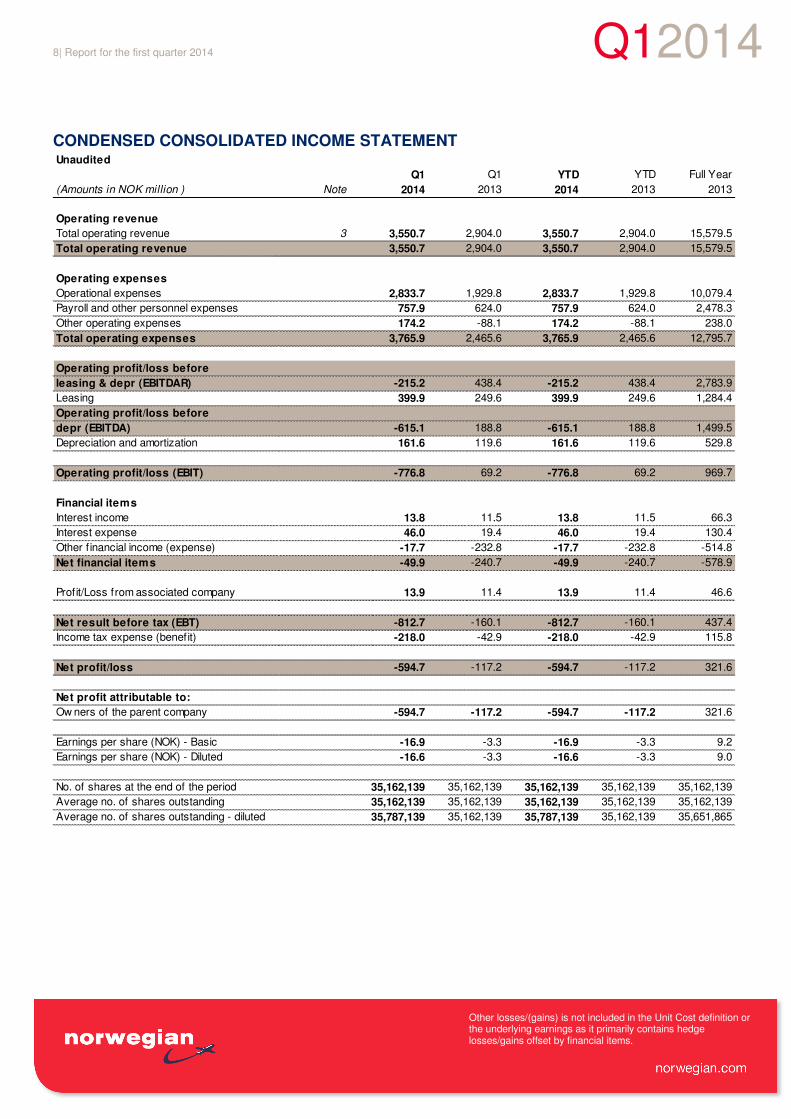
CONDENSED CONSOLIDATED INCOME STATEMENT Unaudited
Q1 Q1 YTD YTD Full Year
(Amounts in NOK million ) Note 2014 2013 2014 2013 2013
Operating revenue
Total operating revenue 3 3,550.7 2,904.0 3,550.7 2,904.0 15,579.5
Total operating revenue 3,550.7 2,904.0 3,550.7 2,904.0 15,579.5
Operating expenses
Operational expenses 2,833.7 1,929.8 2,833.7 1,929.8 10,079.4
Payroll and other personnel expenses 757.9 624.0 757.9 624.0 2,478.3
Other operating expenses 174.2 -88.1 174.2 -88.1 238.0
Total operating expenses 3,765.9 2,465.6 3,765.9 2,465.6 12,795.7
Operating profit/loss before
leasing & depr (EBITDAR) -215.2 438.4 -215.2 438.4 2,783.9
Leasing 399.9 249.6 399.9 249.6 1,284.4
Operating profit/loss before
depr (EBITDA) -615.1 188.8 -615.1 188.8 1,499.5
Depreciation and amortization 161.6 119.6 161.6 119.6 529.8
Operating profit/loss (EBIT) -776.8 69.2 -776.8 69.2 969.7
Financial items
Interest income 13.8 11.5 13.8 11.5 66.3
Interest expense 46.0 19.4 46.0 19.4 130.4
Other f inancial income (expense) -17.7 -232.8 -17.7 -232.8 -514.8
Net financial items -49.9 -240.7 -49.9 -240.7 -578.9
Profit/Loss from associated company 13.9 11.4 13.9 11.4 46.6
Net result before tax (EBT) -812.7 -160.1 -812.7 -160.1 437.4
Income tax expense (benefit) -218.0 -42.9 -218.0 -42.9 115.8
Net profit/loss -594.7 -117.2 -594.7 -117.2 321.6
Net profit attributable to:
Ow ners of the parent company -594.7 -117.2 -594.7 -117.2 321.6
Earnings per share (NOK) - Basic -16.9 -3.3 -16.9 -3.3 9.2
Earnings per share (NOK) - Diluted -16.6 -3.3 -16.6 -3.3 9.0
No. of shares at the end of the period 35,162,139 35,162,139 35,162,139 35,162,139 35,162,139
Average no. of shares outstanding 35,162,139 35,162,139 35,162,139 35,162,139 35,162,139
Average no. of shares outstanding - diluted 35,787,139 35,162,139 35,787,139 35,162,139 35,651,865
Q120149| Report for the first quarter 2014
Other losses/(gains) is not included in the Unit Cost definition or the underlying earnings as it primarily contains hedge losses/gains offset by financial items.
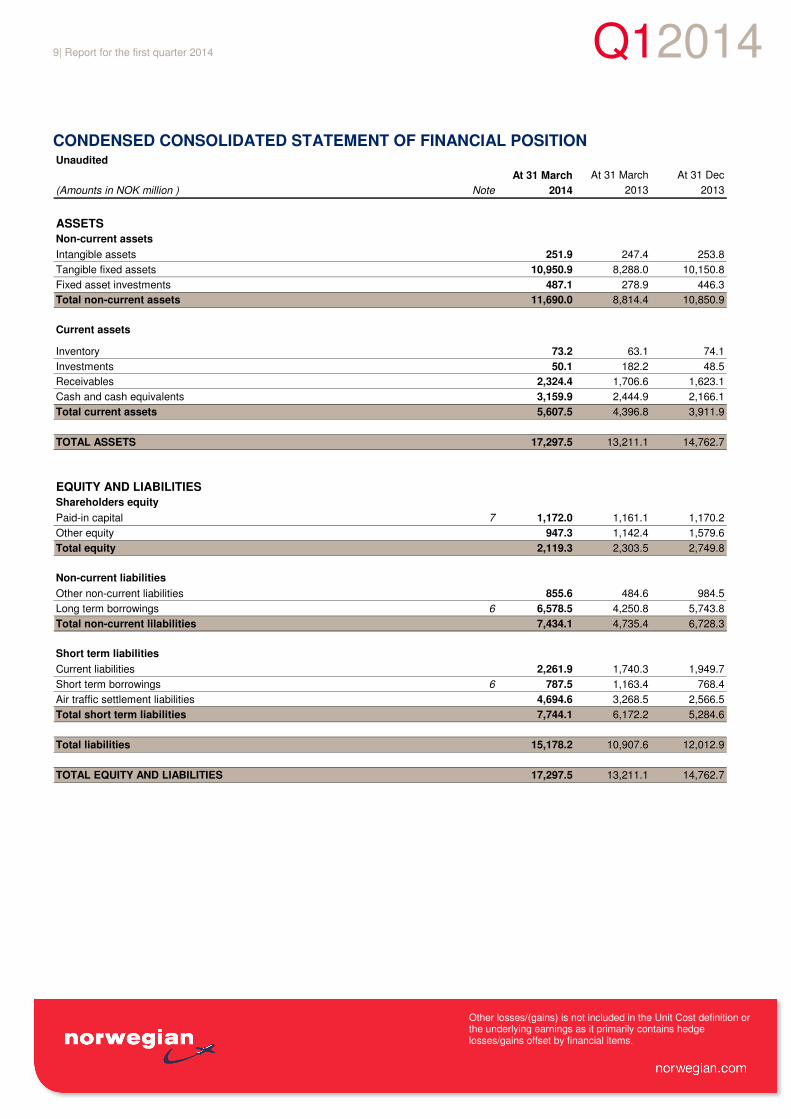
CONDENSED CONSOLIDATED STATEMENT OF FINANCIAL POSITION Unaudited
At 31 March At 31 March At 31 Dec
(Amounts in NOK million ) Note 2014 2013 2013
ASSETS
Non-current assets
Intangible assets 251.9 247.4 253.8
Tangible fixed assets 10,950.9 8,288.0 10,150.8
Fixed asset investments 487.1 278.9 446.3
Total non-current assets 11,690.0 8,814.4 10,850.9
Current assets
Inventory 73.2 63.1 74.1
Investments 50.1 182.2 48.5
Receivables 2,324.4 1,706.6 1,623.1
Cash and cash equivalents 3,159.9 2,444.9 2,166.1
Total current assets 5,607.5 4,396.8 3,911.9
TOTAL ASSETS 17,297.5 13,211.1 14,762.7
EQUITY AND LIABILITIES
Shareholders equity
Paid-in capital 7 1,172.0 1,161.1 1,170.2
Other equity 947.3 1,142.4 1,579.6
Total equity 2,119.3 2,303.5 2,749.8
Non-current liabilities
Other non-current liabilities 855.6 484.6 984.5
Long term borrowings 6 6,578.5 4,250.8 5,743.8
Total non-current lilabilities 7,434.1 4,735.4 6,728.3
Short term liabilities
Current liabilities 2,261.9 1,740.3 1,949.7
Short term borrowings 6 787.5 1,163.4 768.4
Air traffic settlement liabilities 4,694.6 3,268.5 2,566.5
Total short term liabilities 7,744.1 6,172.2 5,284.6
Total liabilities 15,178.2 10,907.6 12,012.9
TOTAL EQUITY AND LIABILITIES 17,297.5 13,211.1 14,762.7
Q1201410| Report for the first quarter 2014
Other losses/(gains) is not included in the Unit Cost definition or the underlying earnings as it primarily contains hedge losses/gains offset by financial items.
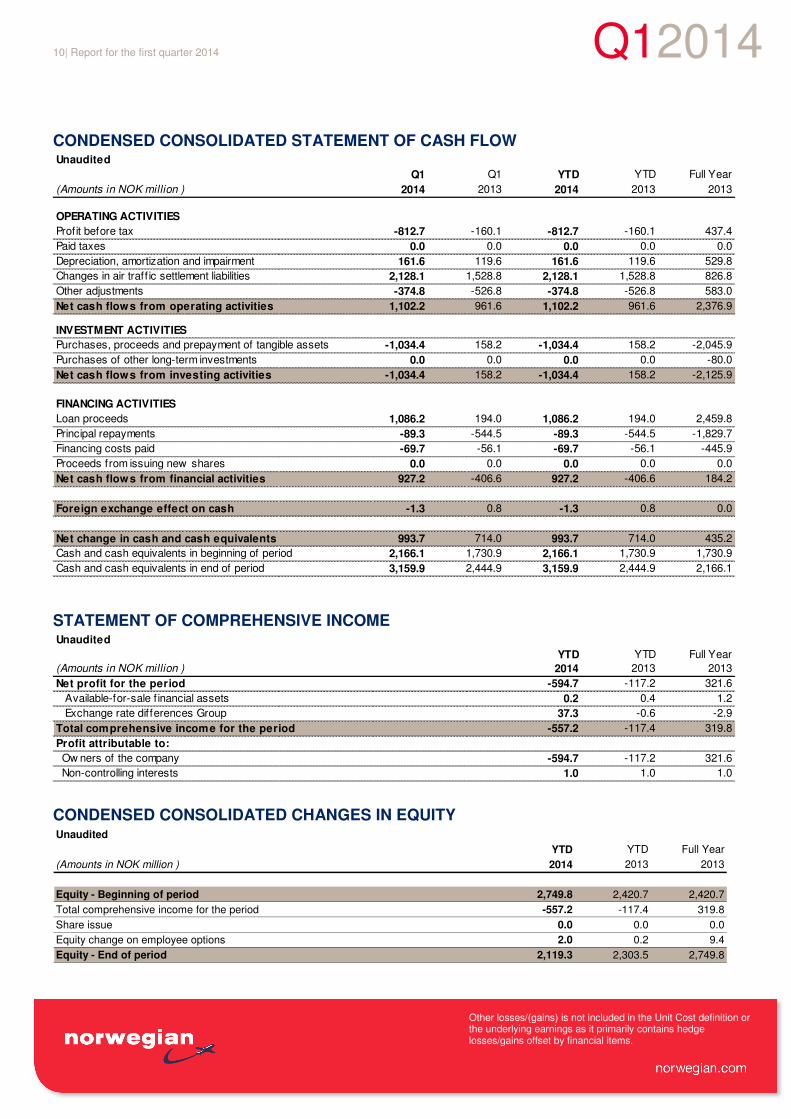
CONDENSED CONSOLIDATED STATEMENT OF CASH FLOW Unaudited
Q1 Q1 YTD YTD Full Year
(Amounts in NOK million ) 2014 2013 2014 2013 2013
OPERATING ACTIVITIES
Profit before tax -812.7 -160.1 -812.7 -160.1 437.4
Paid taxes 0.0 0.0 0.0 0.0 0.0
Depreciation, amortization and impairment 161.6 119.6 161.6 119.6 529.8
Changes in air traff ic settlement liabilities 2,128.1 1,528.8 2,128.1 1,528.8 826.8
Other adjustments -374.8 -526.8 -374.8 -526.8 583.0
Net cash flows from operating activities 1,102.2 961.6 1,102.2 961.6 2,376.9
INVESTMENT ACTIVITIES
Purchases, proceeds and prepayment of tangible assets -1,034.4 158.2 -1,034.4 158.2 -2,045.9
Purchases of other long-term investments 0.0 0.0 0.0 0.0 -80.0
Net cash flows from investing activities -1,034.4 158.2 -1,034.4 158.2 -2,125.9
FINANCING ACTIVITIES
Loan proceeds 1,086.2 194.0 1,086.2 194.0 2,459.8
Principal repayments -89.3 -544.5 -89.3 -544.5 -1,829.7
Financing costs paid -69.7 -56.1 -69.7 -56.1 -445.9
Proceeds from issuing new shares 0.0 0.0 0.0 0.0 0.0
Net cash flows from financial activities 927.2 -406.6 927.2 -406.6 184.2
Foreign exchange effect on cash -1.3 0.8 -1.3 0.8 0.0
Net change in cash and cash equivalents 993.7 714.0 993.7 714.0 435.2
Cash and cash equivalents in beginning of period 2,166.1 1,730.9 2,166.1 1,730.9 1,730.9
Cash and cash equivalents in end of period 3,159.9 2,444.9 3,159.9 2,444.9 2,166.1
STATEMENT OF COMPREHENSIVE INCOME Unaudited
YTD YTD Full Year
(Amounts in NOK million ) 2014 2013 2013
Net profit for the period -594.7 -117.2 321.6
Available-for-sale f inancial assets 0.2 0.4 1.2
Exchange rate differences Group 37.3 -0.6 -2.9
Total comprehensive income for the period -557.2 -117.4 319.8
Profit attributable to:
Ow ners of the company -594.7 -117.2 321.6
Non-controlling interests 1.0 1.0 1.0
CONDENSED CONSOLIDATED CHANGES IN EQUITY Unaudited
YTD YTD Full Year
(Amounts in NOK million ) 2014 2013 2013
Equity - Beginning of period 2,749.8 2,420.7 2,420.7
Total comprehensive income for the period -557.2 -117.4 319.8
Share issue 0.0 0.0 0.0
Equity change on employee options 2.0 0.2 9.4
Equity - End of period 2,119.3 2,303.5 2,749.8
Q1201411| Report for the first quarter 2014
Other losses/(gains) is not included in the Unit Cost definition or the underlying earnings as it primarily contains hedge losses/gains offset by financial items.
NOTES TO THE CONDENSED CONSOLIDATED INTERIM FINANCIAL STATEMENTS
Note 1 General and accounting principles
Norwegian Air Shuttle ASA (the Group) consists of Norwegian Air Shuttle ASA and its subsidiaries. The Company is a limited liability company incorporated in Norway. The condensed consolidated interim financial statements comprise the Group. The consolidated financial statements of the Group for the year ended 31 December 2013 is available upon request from the company’s registered office at Oksenøyveien 3, 1330 Fornebu, Norway, or at www.norwegian.com. These condensed consolidated interim financial statements have been prepared in accordance with rules and regulations of Oslo Stock Exchange and International Financial Reporting Standard (IAS) 34 Interim Financial Reporting. They do not include all of the information required for full annual consolidated financial statements, and should be read in conjunction with consolidated financial statements for the Group at 31 December 2013. These condensed interim financial statements are unaudited. The accounting policies applied by the Group in these condensed consolidated financial statements are the same as those applied by the Group in its consolidated financial statements for the year ended 31 December 2013.
Judgments, estimates and assumptions The preparation of condensed consolidated interim financial statements in accordance with IFRS and applying the chosen accounting policies requires management to make judgments, estimates and assumptions that affect the reported amounts of assets, liabilities, income and expenses. The estimates and associated assumptions are based on historical experience and various other factors
that are believed to be reasonable under the circumstances. Actual results may differ from these estimates. The estimates and the underlying assumptions are reviewed on an ongoing basis. Revisions to accounting estimates are recognized in the period in which the estimate is revised if the revision affects only that period or in the period of the revision and future periods if the revision affects both current and future periods. In preparing these condensed consolidated interim financial statements, the significant judgments made by management in applying the Group’s accounting policies and the key sources of estimation uncertainty were the same as those that applied to the consolidated financial statements for the period ended 31 December 2013.
Note 2 Risk
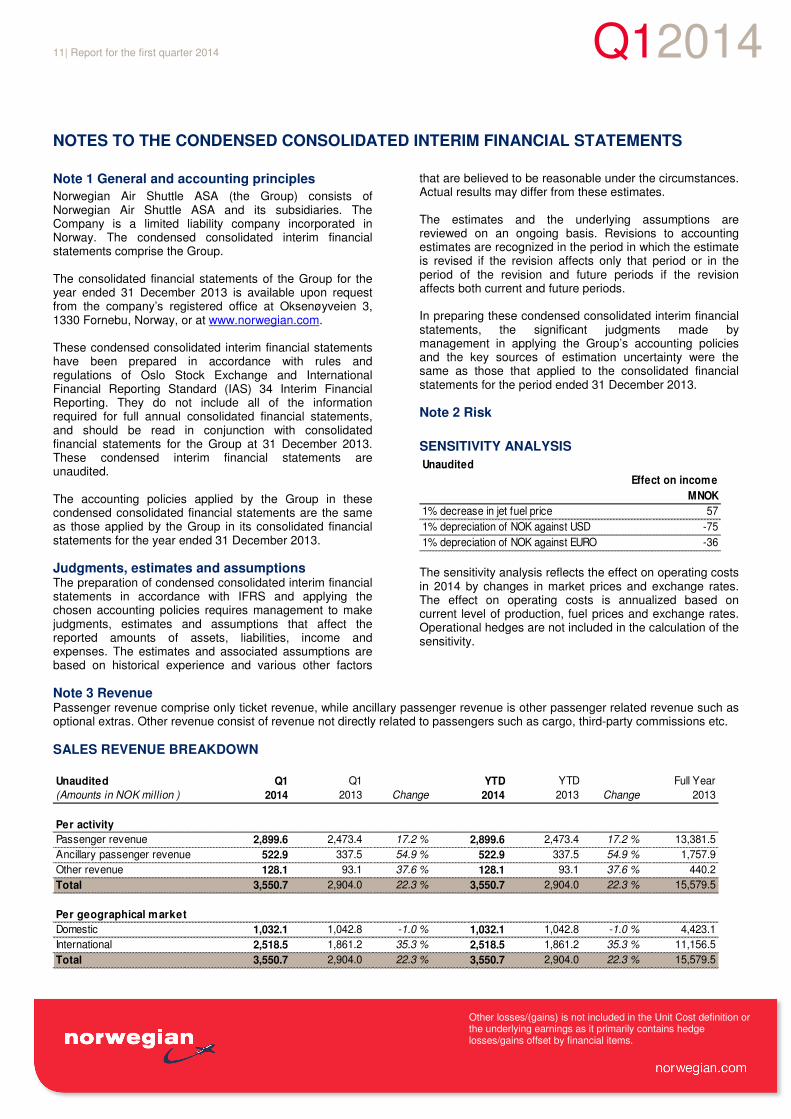
SENSITIVITY ANALYSIS
Unaudited
Effect on income
MNOK
1% decrease in jet fuel price 57
1% depreciation of NOK against USD -75
1% depreciation of NOK against EURO -36
The sensitivity analysis reflects the effect on operating costs in 2014 by changes in market prices and exchange rates. The effect on operating costs is annualized based on current level of production, fuel prices and exchange rates. Operational hedges are not included in the calculation of the sensitivity.
Note 3 Revenue Passenger revenue comprise only ticket revenue, while ancillary passenger revenue is other passenger related revenue such as optional extras. Other revenue consist of revenue not directly related to passengers such as cargo, third-party commissions etc.
SALES REVENUE BREAKDOWN
Unaudited Q1 Q1 YTD YTD Full Year
(Amounts in NOK million ) 2014 2013 Change 2014 2013 Change 2013
Per activity
Passenger revenue 2,899.6 2,473.4 17.2 % 2,899.6 2,473.4 17.2 % 13,381.5
Ancillary passenger revenue 522.9 337.5 54.9 % 522.9 337.5 54.9 % 1,757.9
Other revenue 128.1 93.1 37.6 % 128.1 93.1 37.6 % 440.2
Total 3,550.7 2,904.0 22.3 % 3,550.7 2,904.0 22.3 % 15,579.5
Per geographical market
Domestic 1,032.1 1,042.8 -1.0 % 1,032.1 1,042.8 -1.0 % 4,423.1
International 2,518.5 1,861.2 35.3 % 2,518.5 1,861.2 35.3 % 11,156.5
Total 3,550.7 2,904.0 22.3 % 3,550.7 2,904.0 22.3 % 15,579.5
Q1201412| Report for the first quarter 2014
Other losses/(gains) is not included in the Unit Cost definition or the underlying earnings as it primarily contains hedge losses/gains offset by financial items.
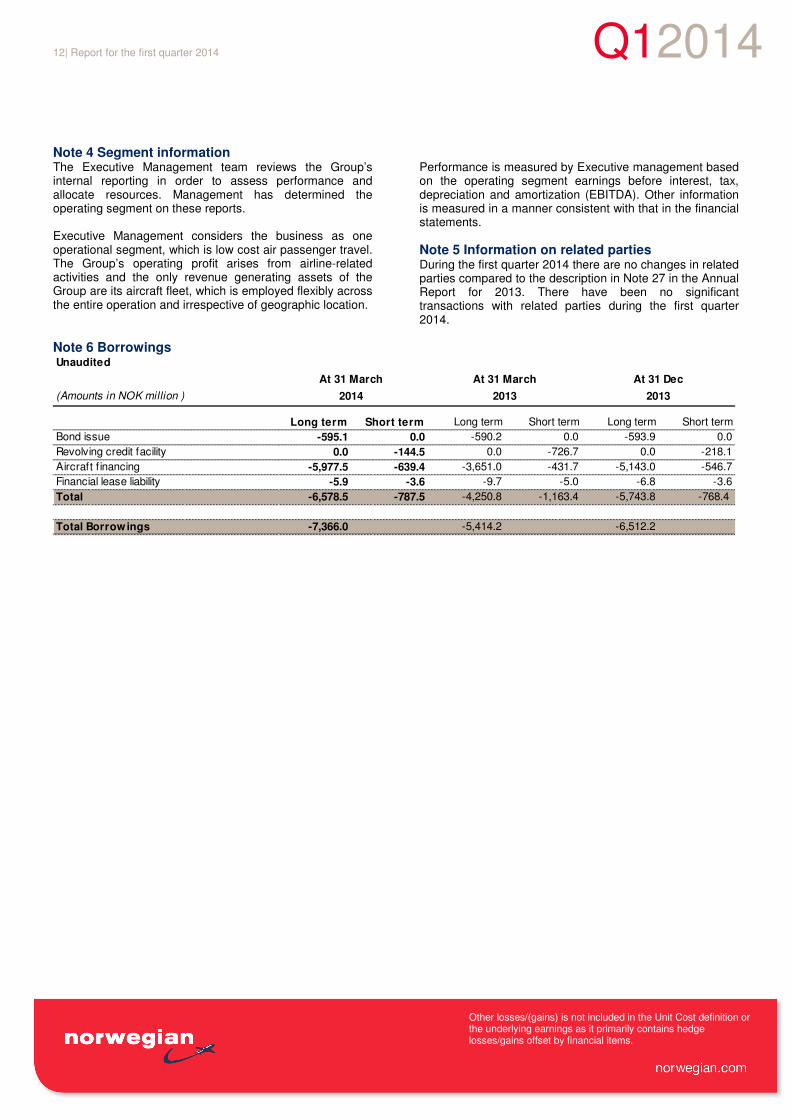
Note 4 Segment information The Executive Management team reviews the Group’s internal reporting in order to assess performance and allocate resources. Management has determined the operating segment on these reports. Executive Management considers the business as one operational segment, which is low cost air passenger travel. The Group’s operating profit arises from airline-related activities and the only revenue generating assets of the Group are its aircraft fleet, which is employed flexibly across the entire operation and irrespective of geographic location.
Performance is measured by Executive management based on the operating segment earnings before interest, tax, depreciation and amortization (EBITDA). Other information is measured in a manner consistent with that in the financial statements.
Note 5 Information on related parties
During the first quarter 2014 there are no changes in related parties compared to the description in Note 27 in the Annual Report for 2013. There have been no significant transactions with related parties during the first quarter 2014.
Note 6 BorrowingsUnaudited
(Amounts in NOK million )
Long term Short term Long term Short term Long term Short term
Bond issue -595.1 0.0 -590.2 0.0 -593.9 0.0
Revolving credit facility 0.0 -144.5 0.0 -726.7 0.0 -218.1
Aircraft f inancing -5,977.5 -639.4 -3,651.0 -431.7 -5,143.0 -546.7
Financial lease liability -5.9 -3.6 -9.7 -5.0 -6.8 -3.6
Total -6,578.5 -787.5 -4,250.8 -1,163.4 -5,743.8 -768.4
Total Borrowings -7,366.0 -5,414.2 -6,512.2
At 31 March At 31 March At 31 Dec
2014 2013 2013
Q12014
13| Report for the first quarter 2014
Other losses/(gains) is not included in the Unit Cost concept or the underlying earnings as it primarily contains hedge losses/gains offset under financial items.
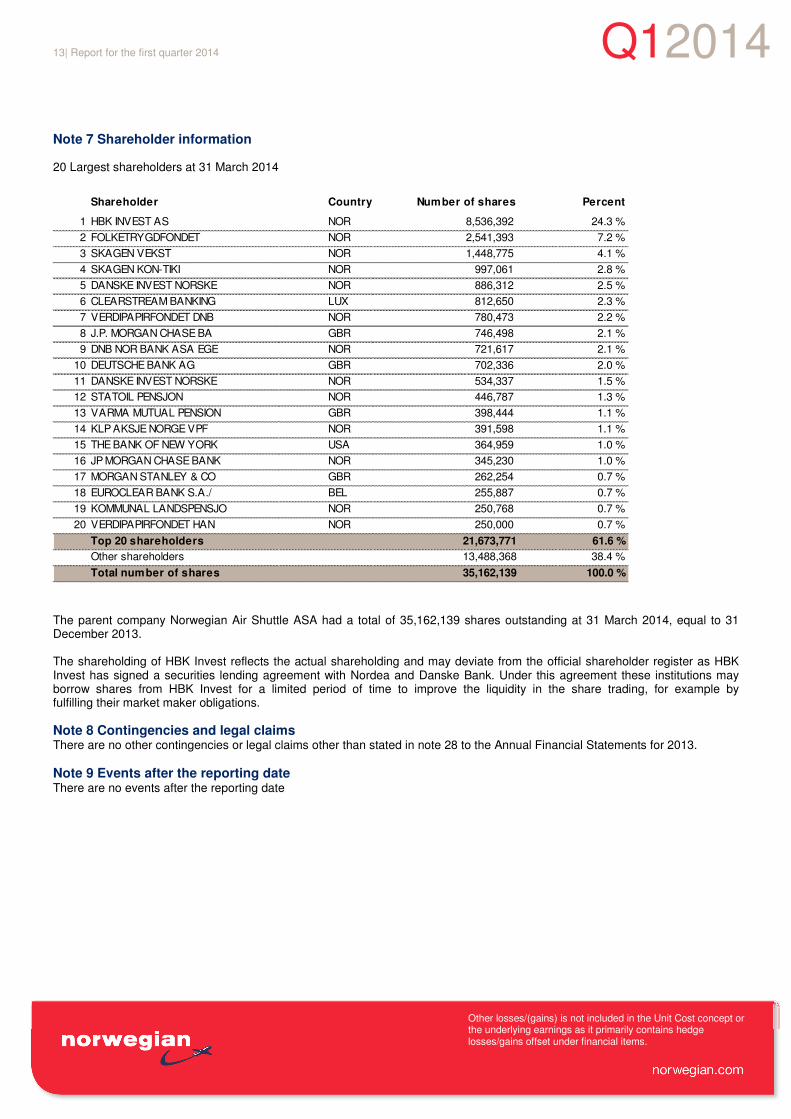
Note 7 Shareholder information
20 Largest shareholders at 31 March 2014
Shareholder Country Number of shares Percent
1 HBK INVEST AS NOR 8,536,392 24.3 %
2 FOLKETRYGDFONDET NOR 2,541,393 7.2 %
3 SKAGEN VEKST NOR 1,448,775 4.1 %
4 SKAGEN KON-TIKI NOR 997,061 2.8 %
5 DANSKE INVEST NORSKE NOR 886,312 2.5 %
6 CLEARSTREAM BANKING LUX 812,650 2.3 %
7 VERDIPAPIRFONDET DNB NOR 780,473 2.2 %
8 J.P. MORGAN CHASE BA GBR 746,498 2.1 %
9 DNB NOR BANK ASA EGE NOR 721,617 2.1 %
10 DEUTSCHE BANK AG GBR 702,336 2.0 %
11 DANSKE INVEST NORSKE NOR 534,337 1.5 %
12 STATOIL PENSJON NOR 446,787 1.3 %
13 VARMA MUTUAL PENSION GBR 398,444 1.1 %
14 KLP AKSJE NORGE VPF NOR 391,598 1.1 %
15 THE BANK OF NEW YORK USA 364,959 1.0 %
16 JP MORGAN CHASE BANK NOR 345,230 1.0 %
17 MORGAN STANLEY & CO GBR 262,254 0.7 %
18 EUROCLEAR BANK S.A./ BEL 255,887 0.7 %
19 KOMMUNAL LANDSPENSJO NOR 250,768 0.7 %
20 VERDIPAPIRFONDET HAN NOR 250,000 0.7 %
Top 20 shareholders 21,673,771 61.6 %
Other shareholders 13,488,368 38.4 %
Total number of shares 35,162,139 100.0 %
The parent company Norwegian Air Shuttle ASA had a total of 35,162,139 shares outstanding at 31 March 2014, equal to 31 December 2013. The shareholding of HBK Invest reflects the actual shareholding and may deviate from the official shareholder register as HBK Invest has signed a securities lending agreement with Nordea and Danske Bank. Under this agreement these institutions may borrow shares from HBK Invest for a limited period of time to improve the liquidity in the share trading, for example by fulfilling their market maker obligations.
Note 8 Contingencies and legal claims There are no other contingencies or legal claims other than stated in note 28 to the Annual Financial Statements for 2013.
Note 9 Events after the reporting date
There are no events after the reporting date
Q1201414| Report for the first quarter 2014
Other losses/(gains) is not included in the Unit Cost definition or the underlying earnings as it primarily contains hedge losses/gains offset by financial items.
Definitions
ASK: Available Seat Kilometers. Number of available passenger seats multiplied by flight distance. RPK: Revenue Passenger Kilometers. Number of sold seats multiplied by flight distance. Unit revenue: Passenger Revenue divided by Available Seat Kilometers. Unit cost: Total operating expenses plus leasing, excluding other losses/(gains)-net, divided by Available Seat Kilometers. Load factor: Relationship between RPK and ASK (percentage). Describes the rate of utilization of available seats. EBITDAR: Earnings before interest, tax, depreciation, amortization and restructuring or rent. EBITDA: Earnings before interest, tax, depreciation and amortization. EBIT: Earnings before interest and tax. EBT: Earnings before tax.
Q12014
15| Report for the first quarter 2014
Other losses/(gains) is not included in the Unit Cost concept or the underlying earnings as it primarily contains hedge losses/gains offset under financial items.
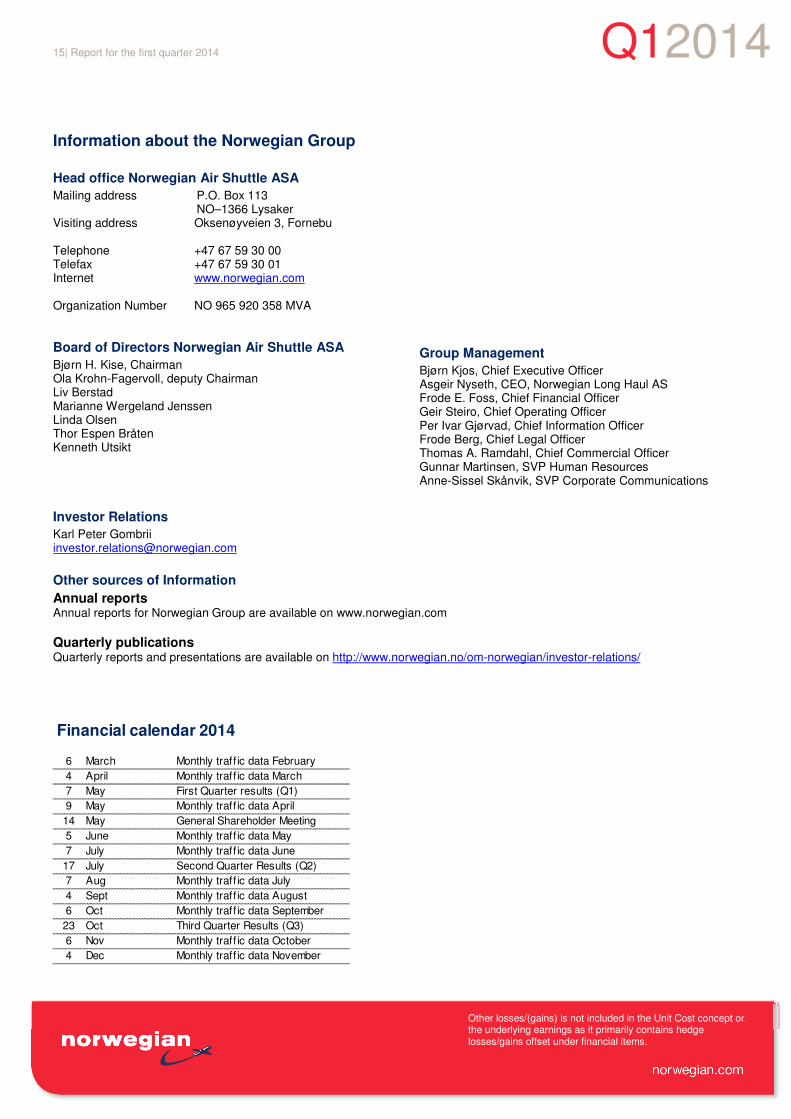
Information about the Norwegian Group
Head office Norwegian Air Shuttle ASA
Mailing address P.O. Box 113 NO–1366 Lysaker
Visiting address Oksenøyveien 3, Fornebu Telephone +47 67 59 30 00 Telefax +47 67 59 30 01 Internet www.norwegian.com Organization Number NO 965 920 358 MVA
Board of Directors Norwegian Air Shuttle ASA
Bjørn H. Kise, Chairman Ola Krohn-Fagervoll, deputy Chairman Liv Berstad Marianne Wergeland Jenssen Linda Olsen Thor Espen Bråten Kenneth Utsikt
Group Management
Bjørn Kjos, Chief Executive Officer Asgeir Nyseth, CEO, Norwegian Long Haul AS Frode E. Foss, Chief Financial Officer Geir Steiro, Chief Operating Officer Per Ivar Gjørvad, Chief Information Officer Frode Berg, Chief Legal Officer Thomas A. Ramdahl, Chief Commercial Officer Gunnar Martinsen, SVP Human Resources Anne-Sissel Skånvik, SVP Corporate Communications
Investor Relations
Karl Peter Gombrii [email protected]
Other sources of Information
Annual reports Annual reports for Norwegian Group are available on www.norwegian.com Quarterly publications Quarterly reports and presentations are available on http://www.norwegian.no/om-norwegian/investor-relations/
Financial calendar 2014
6 March Monthly traff ic data February
4 April Monthly traff ic data March
7 May First Quarter results (Q1)
9 May Monthly traff ic data April
14 May General Shareholder Meeting
5 June Monthly traff ic data May
7 July Monthly traff ic data June
17 July Second Quarter Results (Q2)
7 Aug Monthly traff ic data July
4 Sept Monthly traff ic data August
6 Oct Monthly traff ic data September
23 Oct Third Quarter Results (Q3)
6 Nov Monthly traff ic data October
4 Dec Monthly traff ic data November
Q12014
16| Report for the first quarter 2014
Other losses/(gains) is not included in the Unit Cost concept or the underlying earnings as it primarily contains hedge losses/gains offset under financial items.