Embed Size (px)
Citation preview

Nordic Iron Ore Interim Report January – June 2015 Corporate Identity Number 556756-0940
Q2 Interim Report January – June 2015
1
Significant events during the second quarter 2015
A declaration of intent was signed with a large international trading house
A technical report on the feasibility study for Blötberget was completed
An updated estimate of the mineral resources in Blötberget was announced
An application for a mining concession for the southern Väsman field was submitted to the Swedish
Mining Inspectorate
In order to reduce fixed costs, all permanent-employee contracts were terminated
Second quarter, 1 April – 30 June 2015
Income amounted to SEK 0 million (0)
Earnings after tax amounted to SEK –4.4 million (–5.3)
Investments in the period April–June totalled SEK 3.5 million (2.7)
Basic earnings per share were SEK –0.31 (–0.46)
Interim period, 1 January – 30 June 2015
Income amounted to SEK 0 million (0)
Earnings after tax amounted to SEK –8.2 million (–11.1)
Investments in the period October–December totalled SEK 8.8 million (5.9)
Basic earnings per share were SEK –0.56 (–0.96)
Cash and cash equivalents on 30 June 2015 amounted to SEK 3.9 million (2.4)
Significant events after the end of the period
The Country Administrative Board approved the Company’s proposed plan to compensate for nature
conservation values.
Key ratios (Group)
Amounts in SEK 2015
Apr–Jun
2014
Apr–Jun
2014
Jan–Dec
The Group
Equity/assets ratio (%) 80.7% 53.8% 81.6%
Earnings per share (weighted average) –0.31 –0.46 –1.88
Equity per share 6.26 3.83 6.82
Quick ratio (%) 52.4% 14.0% 208.1%
Number of shares 14,510,712 11,492,738 14,510,712
Nordic Iron Ore AB is a mining development company that aims to resume and develop iron ore production at
Ludvika Mines in Blötberget and Håksberg. The Company has all the essential permits in place, which will enable it
to produce iron ore of extremely high quality from significant mineral resources.
Nordic Iron Ore Year-end Report January – December 2014
Comments from the CEO
2
Making progress in an insecure environment
The market remains volatile and times are generally difficult
for iron ore projects. Developments in China continue to
affect the spot market price for iron ore, with substantial
fluctuations, not least as a result of dramatic events in the
Chinese equity market and reports of cutbacks in Chinese
steel production due, among other things, to increased
environmental requirements and falling demand.
Views regarding the long-term price trend are divided,
however, although fresh analyses from the two investments
banks JP Morgan and Morgan Stanley conclude that the
long-term spot price for 62% Fe iron ore will be about 75
dollars per tonne.
What is overlooked in the general debate about the price of
iron ore is the interaction – important for producers –
between the iron-ore price, quality, the dollar exchange rate
and the cost of ocean freight. For our part, I can say that the
fall in the dollar price for iron ore, which began one year
ago, has been largely offset by a weaker Swedish krona,
lower energy prices and falling ocean freight. The long-term
spot price for 62 per cent iron ore previously assumed by us
in our calculations was 110 dollars per tonne, based on an
exchange rate of 7 kronor, whereas today we base our
calculations on a long-term price of 75 dollars per tonne and
an exchange rate of 8.6 kronor. Compared with the
assumptions we previously made regarding quality
premiums and ocean freight, our calculations now indicate
under the new circumstances that the expected contribution
margin will largely be the same.
According to Metal Bulletin, a price premium is paid for
high-grade concentrate in relation to the more generally
known spot price for 62 per cent iron ore. The difference
between this and Metal Bulletin’s published market price
index for 66% iron concentrate, which is the relevant index
for high-grade concentrate, has for several years been
reflected in an upward trend. This indicates that the demand
for high-grade iron ore continues to outstrip supply, and our
contacts with customers anticipate that the shortage of
quality ore will increase.
In June we attended Metal Bulletin’s large annual iron ore
conference in Vienna, at which we, as the only mining
development company, were invited to give a presentation
on our ongoing feasibility study. The results of the study,
and, in particular, the quality of our product attracted
considerable attention.
In connection with the conference we also signed an
important declaration of intent with a large international
trading house. This agreement, which was negotiated
during the spring, is expected by us to result in binding
delivery contracts for most of the planned production from
Blötberget. It is also confirmation of the great interest in the
market place for our high-grade iron-ore product.
During the period we also continued to work on securing the
financing for the final part of the project study. As this had
taken a fairly long time and in view of the decreasing
liquidity, the Board decided to implement a programme
aimed at substantially reducing fixed expenses. This work is
continuing and the aim is to make a rights issue in the
autumn.
In conclusion, it is gratifying to be able to report that we
reached another important milestone for Ludvika Mines
during the period, when we submitted an application for a
mining concession for the southern part of the Väsman
field.
Christer Lindqvist
VD Nordic Iron Ore

Nordic Iron Ore Interim Report January – June 2015
Operations
3
Important events during the period
The feasibility study for Blötberget
In April the DMT Group, the Company’s independent mining
consultant for the feasibility study, completed an interim
technical report (ITR), which covered, among other things,
mineral resources, planning of the mine and the enrichment
process.
Based on the detailed analyses carried out in connection
with the production of this report, it was possible to
announce a new estimate of the Company’s mineral
resources in Blötberg. Measured and indicated mineral
resources in Blötberget, given a cut-off level of 25% iron,
now amount to 42.5 million tonnes at 41.9% iron and 5.3
million tonnes at 38.2% iron, while inferred resources
amount to 5.4 million tonnes at 33.5% iron (estimated
according to JORC 2012).
The report shows that over the lifetime of the mine the
average estimated production cost, including logistical
costs, is approximately SEK 349 per tonne of dry product
(USD 40.5). Investment costs are estimated to be about
SEK 1,560 million (USD 181 million) for the restart of the
mine, and in total about SEK 2,175 million (USD 252
million) over the lifetime of the mine, which is put at about
15 years. These costs are below the earlier estimates
reported in the preliminary economic assessment (PEA)
in 2012, which also included the Håksberg mine.
The lower production costs are due to greater knowledge
of the mineralisation and the processability, improved
mine design and optimisation of the process flow sheet
and layouts, as well as lower energy costs and an
updated USD exchange rate. The calculations in the
report are based on an exchange rate of SEK 8.62 to the
dollar.
Väsman
During the period a concession application was submitted to the
Mining Inspectorate for the southern part of the Väsman field. In
the application the measured and indicated mineral resources,
given a cut-off level of 25% iron, amount to 5.1 million tonnes at
36.7% iron and 42.9 million tonnes at 34.8% iron, while inferred
resources amount to 37.8 million tonnes at 33.9% iron within
the concession area applied for. The estimates follow the FRB
standard issued in 2012 by SweMin, among others, which is
essentially identical to the JORC code in relation, for example,
to the categorisation of mineral resources.
Permits
During the period an important condition laid down in the
judgment of the Land & Environmental Court was met, when
the County Administrative Board in Dalarna approved the
Company’s compensation plan for lost natural values in
connection with the resumption of mine production in Blötberget
and Håksberg.
The detailed development plans approved by Ludvika
Municipality for the industrial sites in Blötberget and Håksberg
acquired legal force during the period.
The exploration licence for Skeppmora 1 was relinquished
during the period.
Customers
During the period a declaration of intent was signed with a large
international trading house for future product deliveries. This
agreement means that the Company has a professional partner
judged to be capable of offering the best prospects of reaching
the most qualified end customers. It covers all markets outside
Europe.
Organisation
In order to prepare the Company for a temporary lower level of
activity due to the delays in raising capital and the Company’s
decreasing liquidity and also to create conditions for lower fixed
current costs, all contracts for permanent employees were
terminated.
Financing
During the period the work of raising capital continued and a
financing committee was formed within the Board.
The share and share structure
At the end of the period the share capital amounted to
SEK 2,516,497, divided between 14,510,712 shares, with a
quota value of SEK 0.17 per share. The number of
shareholders totalled 3,488. The large increase in the number
of shareholders is explained by the fact that Copperstone
Resources AB (the former Kopparberg Mineral) distributed a
large part of its holdings to its shareholders.

Nordic Iron Ore Interim Report January – June 2015
Operations
4
Financial position
On the balance sheet date, the Group had a liquidity of
SEK 3.9 million. The equity/assets ratio was 80.7%. The
Group’s equity amounted to SEK 90.8 million, corresponding to
SEK 6.26 per share.
Investments
In the period January – June 2015, investments totalled SEK 8.8
million. The entire amount relates to prospecting costs and
investigative work relating to the planned resumption of mining
operations in Blötberget.
Employees
On average, seven people were employed by the Company during
the period.
Financial calendar
Interim Report January – September 2015: 21 November 2015
Year-end Report for the 2015 financial year: February 2016
Risks and factors of uncertainty
In addition to risks associated with future global market prices
for iron ore products that affect the profitability of the project, as
well as the technical risks, the prospects of starting up
operations depend on our ability to finance day-to-day
operations and on the extensive capital requirements for
investments being met.
There have been no significant changes to alter this description.
Events after the period end
The Company closed its office in Ludvika and
concentrated its operations in its Grängesberg premises.
Annual report and financial reports
The Company’s press releases and financial reports are
distributed via Cisionwire and are available at
www.nordicironore.se.

Nordic Iron Ore Interim Report January – June 2015
Operations
5
Stockholm, 21 August 2015
The Board of Nordic Iron Ore AB (publ) corporate registration number 556756-0940
Göran Ekdahl Jonas Bengtsson Sigrun Hjelmquist
Johnas Jansson Christer Lindqvist
This report has not been reviewed by the auditors. The technical source material has been reviewed by the Company’s independent qualified person, mining engineer Thomas Lindholm, GeoVista AB, Luleå. Lindholm is a Competent Person as defined in the internationally recognized JORC Code, based on his training and experience in prospecting, mining and assessment of mineral resources for iron, base metals and precious metals.
For further information, please contact:
Christer Lindqvist
Telephone: 070-591 0483
E-mail: [email protected]
Nordic Iron Ore Interim report January - June 2015
6
Consolidated statement of comprehensive
income - summary
2015 2014 2015 2014 2014
Amounts in SEK Note April - June April - June Jan - June Jan - June Jan - Dec
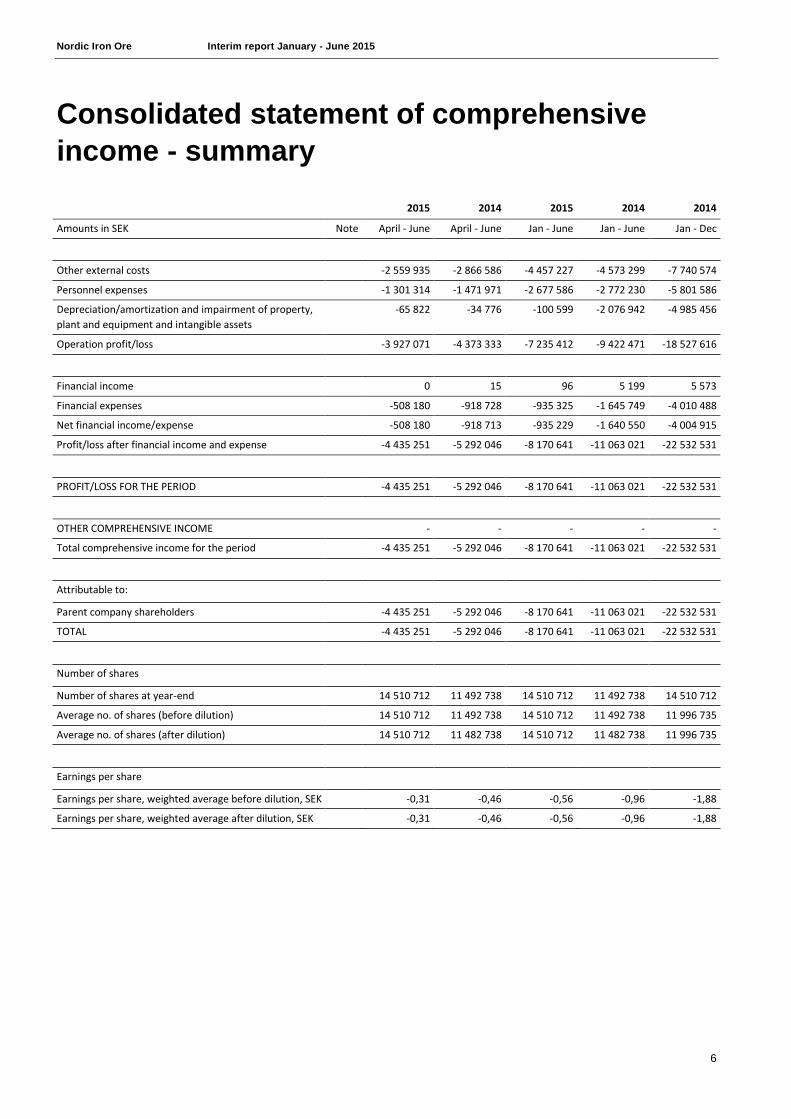
Other external costs -2 559 935 -2 866 586 -4 457 227 -4 573 299 -7 740 574
Personnel expenses -1 301 314 -1 471 971 -2 677 586 -2 772 230 -5 801 586
Depreciation/amortization and impairment of property,
plant and equipment and intangible assets
-65 822 -34 776 -100 599 -2 076 942 -4 985 456
Operation profit/loss -3 927 071 -4 373 333 -7 235 412 -9 422 471 -18 527 616
Financial income 0 15 96 5 199 5 573
Financial expenses -508 180 -918 728 -935 325 -1 645 749 -4 010 488
Net financial income/expense -508 180 -918 713 -935 229 -1 640 550 -4 004 915
Profit/loss after financial income and expense -4 435 251 -5 292 046 -8 170 641 -11 063 021 -22 532 531
PROFIT/LOSS FOR THE PERIOD -4 435 251 -5 292 046 -8 170 641 -11 063 021 -22 532 531
OTHER COMPREHENSIVE INCOME - - - - -
Total comprehensive income for the period -4 435 251 -5 292 046 -8 170 641 -11 063 021 -22 532 531
Attributable to:
Parent company shareholders -4 435 251 -5 292 046 -8 170 641 -11 063 021 -22 532 531
TOTAL -4 435 251 -5 292 046 -8 170 641 -11 063 021 -22 532 531
Number of shares
Number of shares at year-end 14 510 712 11 492 738 14 510 712 11 492 738 14 510 712
Average no. of shares (before dilution) 14 510 712 11 492 738 14 510 712 11 492 738 11 996 735
Average no. of shares (after dilution) 14 510 712 11 482 738 14 510 712 11 482 738 11 996 735
Earnings per share
Earnings per share, weighted average before dilution, SEK -0,31 -0,46 -0,56 -0,96 -1,88
Earnings per share, weighted average after dilution, SEK -0,31 -0,46 -0,56 -0,96 -1,88

Nordic Iron Ore Interim report January - June 2015
7
Consolidated statement of financial position - summary
Amounts in SEK Note 30/06/2015 30/06/2014 31/12/2014
Assets
Non-current assets
Intangible assets 107 229 351 77 554 976 98 506 839
Property, plant and equipment 290 409 429 523 359 964
Financial assets 31 618 78 403 31 642
Current assets
Other current assets 1 065 488 1 352 672 2 645 685
Cash and cash equivalents 3 898 402 2 403 293 19 711 267
Total assets 112 515 268 81 818 867 121 255 397
Equity and liabilities
Equity 90 769 037 44 049 491 98 939 678
Non-current liabilities 12 275 000 10 855 555 11 571 111
Current liabilities 1,2 9 471 231 26 913 821 10 744 608
Total Equity and liabilities 112 515 268 81 818 867 121 255 397
Amounts in SEK Note 30/06/2015 30/06/2014 31/12/2014
Deposit in accordance with the Swedish Mineral Act, Bergsstaten 31 492 31 447 31 642
Contingent liabilities None None None
Nordic Iron Ore Interim report January - June 2015
8
Consolidated statement of change in equity
Amounts in SEK Note Share capital Other
contributed
capital
Profit/loss
brought forward,
incl. profit/loss
for the period
Total equity
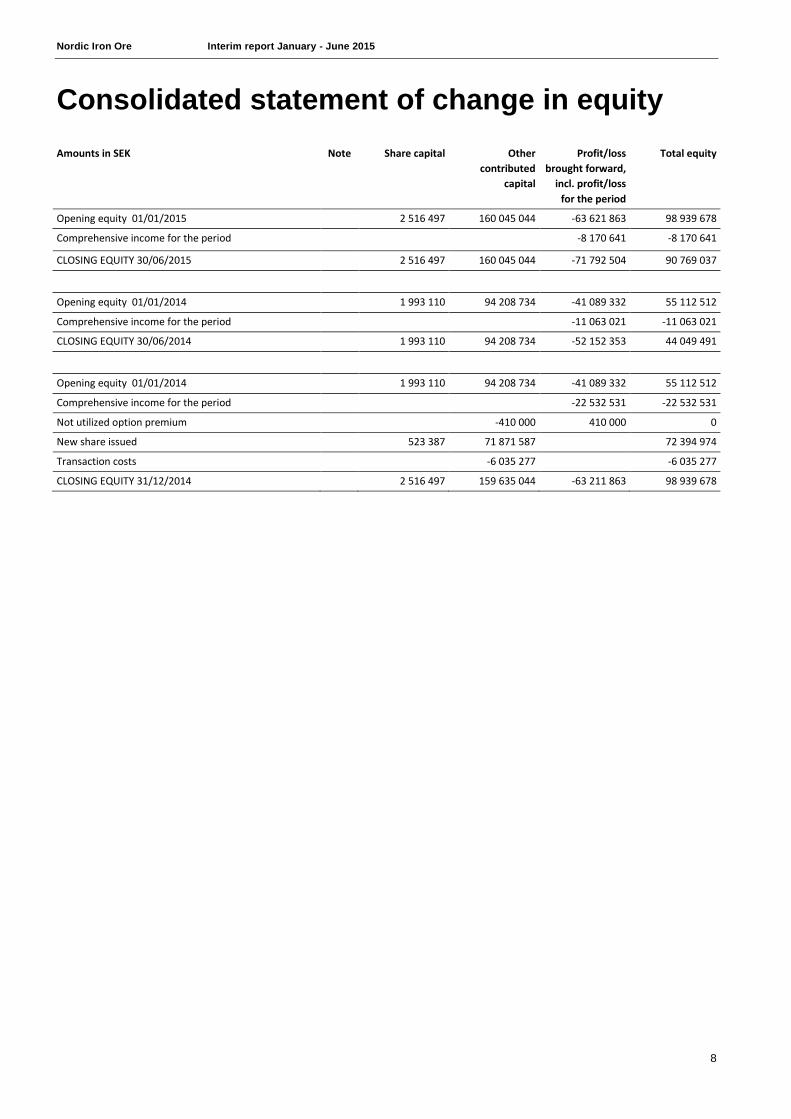
Opening equity 01/01/2015 2 516 497 160 045 044 -63 621 863 98 939 678
Comprehensive income for the period -8 170 641 -8 170 641
CLOSING EQUITY 30/06/2015 2 516 497 160 045 044 -71 792 504 90 769 037
Opening equity 01/01/2014 1 993 110 94 208 734 -41 089 332 55 112 512
Comprehensive income for the period -11 063 021 -11 063 021
CLOSING EQUITY 30/06/2014 1 993 110 94 208 734 -52 152 353 44 049 491
Opening equity 01/01/2014 1 993 110 94 208 734 -41 089 332 55 112 512
Comprehensive income for the period -22 532 531 -22 532 531
Not utilized option premium -410 000 410 000 0
New share issued 523 387 71 871 587 72 394 974
Transaction costs -6 035 277 -6 035 277
CLOSING EQUITY 31/12/2014 2 516 497 159 635 044 -63 211 863 98 939 678
Nordic Iron Ore Interim report January - June 2015
9
Consolidated cash flow statement - summary
2015 2014 2015 2014 2014
Amounts in SEK Note April - June April - June Jan - June Jan - June Jan - Dec
Operating activities
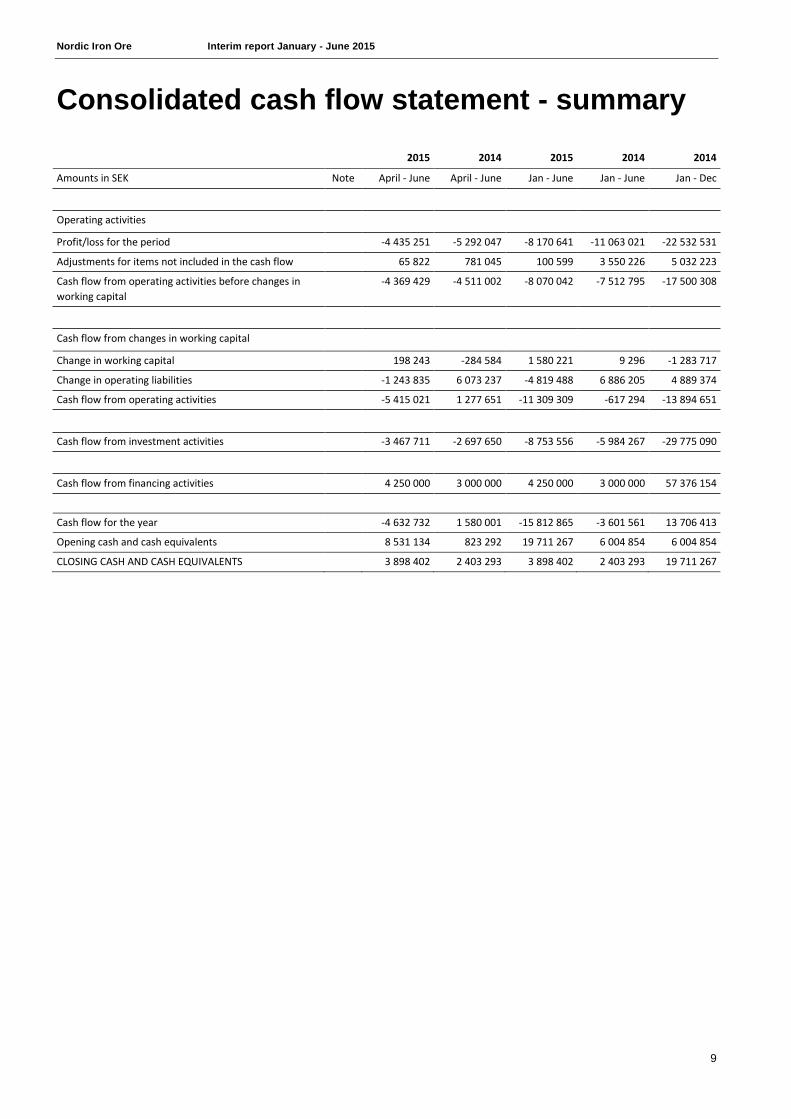
Profit/loss for the period -4 435 251 -5 292 047 -8 170 641 -11 063 021 -22 532 531
Adjustments for items not included in the cash flow 65 822 781 045 100 599 3 550 226 5 032 223
Cash flow from operating activities before changes in
working capital
-4 369 429 -4 511 002 -8 070 042 -7 512 795 -17 500 308
Cash flow from changes in working capital
Change in working capital 198 243 -284 584 1 580 221 9 296 -1 283 717
Change in operating liabilities -1 243 835 6 073 237 -4 819 488 6 886 205 4 889 374
Cash flow from operating activities -5 415 021 1 277 651 -11 309 309 -617 294 -13 894 651
Cash flow from investment activities -3 467 711 -2 697 650 -8 753 556 -5 984 267 -29 775 090
Cash flow from financing activities 4 250 000 3 000 000 4 250 000 3 000 000 57 376 154
Cash flow for the year -4 632 732 1 580 001 -15 812 865 -3 601 561 13 706 413
Opening cash and cash equivalents 8 531 134 823 292 19 711 267 6 004 854 6 004 854
CLOSING CASH AND CASH EQUIVALENTS 3 898 402 2 403 293 3 898 402 2 403 293 19 711 267

Nordic Iron Ore Interim report January - June 2015
10
Parent Company Income statement - summary
2015 2014 2015 2014 2014
Amounts in SEK Note April - June April - June Jan - June Jan - June Jan - Dec
Other external costs 2 -2 559 935 -2 866 586 -4 457 227 -4 573 299 -7 740 574
Personnel expenses -1 301 314 -1 471 971 -2 677 586 -2 772 230 -5 801 586
Depreciation of property, plant and equipment and
intangible fixed assets
-65 822 -34 776 -100 599 -2 076 942 -4 985 456
Operating profit/loss -3 927 071 -4 373 333 -7 235 412 -9 422 471 -18 527 616
Other interest income and similar profit/loss items 0 15 96 5 199 5 573
Interest expense and similar profit/loss items -508 180 -918 728 -935 325 -1 645 749 -4 010 488
PROFIT/LOSS FOR THE PERIOD -4 435 251 -5 292 046 -8 170 641 -11 063 021 -22 532 531
PARENT COMPANY STATEMENT OF COMPREHENSIVE
INCOME
Other comprehensive income - - - - -
Total comprehensive income for the period -4 435 251 -5 292 046 -8 170 641 -11 063 021 -22 532 531
Attributable to:
Parent Company shareholders -4 435 251 -5 292 046 -8 170 641 -11 063 021 -22 532 531

Nordic Iron Ore Interim report January - June 2015
11
Parent Company Balance sheet - summary
Amounts in SEK Note 30/06/2015 30/06/2014 31/12/2014
Assets
Non-current assets
Intangible assets 107 229 351 77 554 976 98 506 839
Property, plant and equipment 290 409 429 523 359 964
Financial assets 31 618 78 403 31 642
Shares in subsidiaries 50 000 50 000 50 000
Current assets
Other current assets 1 065 488 1 352 672 2 645 685
Cash and cash equivalents 3 855 165 2 360 055 19 668 029
Total assets 112 522 031 81 825 629 121 262 159
Equity and liabilities
Equity 90 775 799 44 056 252 98 946 440
Non-current liabilities 12 275 000 10 855 555 11 571 111
Current liabilities 9 471 232 26 913 822 10 744 608
Total Equity and liabilities 112 522 031 81 825 629 121 262 159
Amounts in SEK Not 30/06/2015 30/06/2014 31/12/2014
Deposit in accordance with the Swedish Mineral Act, Bergsstaten 31 492 31 447 31 642
Contingent liabilities None None None

Nordic Iron Ore Interim report January - June 2015
12
Accounting policies The Group
This interim report was prepared in accordance with IAS 34 Interim Financial Statements and in accordance with RFR 1 or the Swedish Financial
Reporting Board and, for the Parent Company, RFR 2. The same accounting policies and calculation methods are applied as in the last interim
report. For a detailed description of the accounting policies applied for the Group and the Parent Company in this interim, see the annual
report of 2014.
Notes to the Financial Statements Note 1 Related parties
The following are considered to be related parties: Subsidiaries included in the Group; members of the Company´s board; senior executives in
the Group and close family members of such persons.
During the reporting period, Copperstone Resources AB invoiced SEK 12 500 in fees and expenditures. Nordic Iron Ore´s liability amounted to
SEK 0 to Copperstone Resources AB as of 30 June 2015.
Note 2 Key ratios (Group)
Amounts in SEK 2015
April - June
2015
April - June
2015
Jan - June
2014
Jan - June
2014
Jan - Dec
The Group
Equity ratio (%) 80,7% 53,8% 80,7% 53,8% 81,6%
Earnings per share -0,31 -0,46 -0,56 -0,96 -1,88
Equity per share 6,26 3,83 6,26 3,83 6,82
Quick ratio (%) 52,4% 14,0% 52,4% 14,0% 208,1%
No. of shares 14 510 712 11 492 738 14 510 712 11 492 738 14 510 712
Weighted average no. Of shares before dilution 14 510 712 11 492 738 14 510 712 11 492 738 11 996 735
Weighted average no. Of shares after dilution 14 510 712 11 492 738 14 510 712 11 492 738 11 996 735
Key ratio definitions
Equity/assets ratio: Equity as a per cent of the balance total.
Earnings per share: profit/loss after tax in relation to the weighted average number of shares.
Equity per share: Equity in relation to the number of shares on the balance sheet date.
Quick ratio: Current assets excluding stock in relation to current liabilities.