Embed Size (px)
Citation preview

International Institute for Applied Systems Analysis Schlossplatz 1 A-2361 Laxenburg, Austria
Tel: +43 2236 807 342 Fax: +43 2236 71313
E-mail: [email protected] Web: www.iiasa.ac.at
Interim Reports on work of the International Institute for Applied Systems Analysis receive only limited review. Views or opinions expressed herein do not necessarily represent those of the Institute, its National Member Organizations, or other organizations supporting the work.
Interim Report IR-02-036/May
Dynamic Microsimulation of Health Care Demand, Health Care Finance and the Economic Impact of Health Behavior Part II: Survey and Review
Martin Spielauer ([email protected])
Approved by
Landis MacKellar ([email protected]) Project Leader, Social Security Reform
May 2002
ii
Contents
1. Introduction .................................................................................................................1
2. Review ..........................................................................................................................2
2.1 DYNASIM: The first dynamic microsimulation model ....................................2
2.2. CORSIM ...............................................................................................................5
2.3. DYNACAN: A Canadian Pension Microsimulation Model .............................7
2.4. DYNAMOD...........................................................................................................9
2.5. LifePaths and POHEM ......................................................................................10
2.6. MOSART ............................................................................................................12
2.7. NCCSO Long-Term Care Model......................................................................12
2.8. DESTINIE...........................................................................................................13
3. A comparison of approaches: options for health care models ..............................14
4. Conclusions: The 12 “SAGE lessons” .....................................................................19
5. Summary ....................................................................................................................22
Appendix: Summary of Dynamic Microsimulation models ......................................24
References ......................................................................................................................31

iii
Abstract
This report is the second part of an investigation of the potential of dynamic microsimulation for modeling and projection of health care demand, health care finance and the economic impact of health behavior. While the first part (Spielauer, 2002) provided a theoretical and methodological background of dynamic microsimulation in this research area and compared the microsimulation approach with the cell-based macro-approach, this paper contains a survey of existing microsimulation projects and draws some conclusions with regard to health care modeling.
The purpose of this survey is to capitalize on the expertise acquired by what is now more than 40 years of dynamic microsimulation model development with regard to modeling health care demand, health care finance and the economic impact of health behavior. Based on literature research, 33 dynamic microsimulation projects were identified for which documentation is available. While a short description and classification of these projects is given in the appendix of this report, 9 projects are reviewed in more detail. All of these 9 models include health-related variables, however, the range of health-related issues that can be studied using these models varies widely, as health is not the central focus of the majority of the models. Consequently, this review does not exclusively concentrate on the treatment of health issues in microsimulation models, but the selection of models was also made with the intention to cover most approaches towards dynamic data-based microsimulation with regard to the general structure and modeling options. The review focuses on the modeling of demographic and health behaviors and on the way these models are integrated into the whole model structure, including policy and accounting issues. After giving a brief description of each of the selected models, the modeling approaches are summarized and commented by means of five distinguished criteria. These are the use of alignment techniques, the model's complexity and range of variables used, the theoretical foundation of the model, the type of starting population used, and the extent and detail of financial issues covered. The conclusions are then summarized in a series of “lessons” that can be learned from existing projects.

iv
About the Author
Martin Spielauer is a Research Scholar with the Social Security Project at IIASA and Leader of the Department for Socioeconomic Analysis, Simulation and Surveys at the Austrian Institute for Family Studies (ÖIF) in Vienna.

Dynamic Microsimulation of Health Care Demand, Health Care Finance and the Economic Impact of Health Behavior
Part II: Survey and Review
Martin Spielauer
1. Introduction
This report is the second part of an investigation of the potential of dynamic microsimulation for modeling and projection of health care demand, health care finance and the economic impact of health behavior. While the first part (Spielauer, 2002) provided a theoretical and methodological background of dynamic microsimulation in this research area and compared the microsimulation approach with the cell-based macro-approach, this paper contains a survey of existing microsimulation projects and draws some conclusions with regard to health care modeling.
There has been a number of surveys and reviews of microsimulation models (Merz, 1991; Mot, 1992; Klevmarken, 1997; O’Donoghue, 2001; Zaidi, 2001; Anderson, 2001) with different scopes and different purposes. The purpose of this survey is to capitalize on the expertise acquired by what is now more than 40 years of dynamic microsimulation model development with regard to modeling health care demand, health care finance and the economic impact of health behavior. Based on literature research, 33 dynamic microsimulation projects were identified for which documentation is available. While a short description and classification of these projects is given in the appendix of this report, 9 projects are reviewed in more detail. All of these 9 models include health-related variables, however, the range of health-related issues that can be studied using these models varies widely, as health is not the central focus of the majority of the models. Consequently, this review does not exclusively concentrate on the treatment of health issues in microsimulation models, but the selection of models was also made with the intention to cover most approaches towards dynamic data-based microsimulation with regard to the general structure and modeling options.
The review focuses on the modeling of demographic and health behaviors and on the way these models are integrated into the whole model structure, including policy and accounting issues. After giving a brief description of each of the selected models, the modeling approaches are summarized and commented by means of five distinguished criteria. These are the use of alignment techniques, the model's complexity and range of variables used, the theoretical foundation of the model, the type of starting population used, and the extent and detail of financial issues covered.
2
The conclusions are then summarized in a series of “lessons” that can be learned from existing projects. A similar approach can be found in Zaidi (2001), who focuses on the simulation of social policies in an aging society and presents 12 lessons based on a review of seven dynamic microsimulation projects. These lessons were used as template for the organization of the conclusions reached regarding microsimulation modeling of health care finance and health behavior.
2. Review
2.1 DYNASIM: The first dynamic microsimulation model
Overview
The DYNASIM "Dynamic Simulation of Income Model" was the first large-scale dynamic microsimulation model in social sciences. It was developed between 1969 and 1976 under the direction of Guy Orcutt at the Urban Institute (Orcutt, 1957). It was Orcutt who first proposed the concept of developing dynamic microsimulation in social sciences in 1957. It was intended to serve as a social science research tool capable of mimicking natural experiments in economics and as a framework for integrating economic and sociological research. The early model was used to analyze Aid to Families with Dependent Children (AFDC) and Unemployment Insurance issues and to develop long-range projections of earning histories for the analysis of social security issues (Anderson, 2001).
A second version - DYNASIM2 – was developed between 1979 and 1983. The base year database was generated by matching the March 1973 Current Population Survey (CPS, n=60.000 persons) with the Social Security earning records for 1951-1972. Selected later data were incorporated until 1993. The simulation horizon is from 1973 to 2030. DYNASIM has various successors using more up to date data and methods (or being applied in other countries than the US); however, being the first model of this type that served as "template" for various models, its structure is explored in more detail below.
DYNASIM is organized in three sub-models that follow different approaches and simulate events of different domains. These are:
- The Family and Earnings History (FEH) model;
- The Jobs and Benefits History (JBH) Model; and
- The Cross-Sectional Imputation Model (CSIM).
The Family and Earnings History (FEH) model is a dynamic microsimulation model of demographic and labor market behavior consisting of 14 modules corresponding to the events or characteristics simulated. It is a discrete time model with annual updates. Table 1 summarizes the events and variables that determine the modules. Note that the probabilities for events might be estimated separately for specific population groups not using all variables for each group.

3
age
race
mar
ital s
tatu
s
educ
atio
n
parit
y
sex
prev
ious
mar
ital s
tatu
s
inco
me
regi
on
wee
ks w
orke
d
hour
ly w
age
asse
t inc
ome
rece
ipt o
f wel
fare
unem
ploy
men
t com
pens
atio
n
age
at m
arria
ge
pres
ence
of y
oung
chi
ldre
n
mar
riage
coh
ort
year
s at
cur
rent
sch
ool l
evel
pare
nts
educ
atio
n
year
s m
arrie
d
fam
ily s
ize
age
of h
ead
sex
of h
ead
educ
atio
n of
hea
d
size
of m
etro
polit
an s
tatis
tical
are
a
disa
bilit
y
stud
ent
spou
se e
arni
ngs
tran
sfer
inco
me
expe
cted
wag
e
child
ren
in h
ouse
hold
Death X X X X X XBirth X X X X XMarriage X X X X X X X X X X X XMate matching X XDivorce X X X X X X XLeaving home (beside marriage, giving birth, divorce and death)
X X X
Education X X X X X
Mobility/Location X X X X X X X X
Disability Onset X X X XDisability Recovery X X X X X
Labor Force Participation X X X X X X X X X XHours in the Labor Force X X X X X XWage Rate X X X X X X X XUnemployment X X X X X X X X
Table 1. The Family and Earnings History Model; Source: Anderson (2001).
The output of the FEH model consists of a file that contains the demographic and labor force histories for each person and cross-sectional files for every (selected) year of the simulation. The FEH output serves as input for the Jobs and Benefits History model (JBH).
With regard to the simulation approach, the Jobs and Benefits History model (JBH) (see Table 2) follows a different order: for each individual it simulates the whole life careers at once. It contains six sub-models for (1) job characteristics and pension plans, (2) pension eligibility and benefits, (3) social security eligibility and benefits, (4) individual retirement accounts and (5) retirement, and (6) Supplemental Security Income.
The JBH model produces both, events, such as job changes, and detailed histories of retirement, disability, spouse and child benefits. The tax-benefit models used are highly parameterized in order to allow for the simulation of various alternative policy scenarios. Taxes and social security contributions as calculated in the last module are only determined for the last simulated year.

4
age
sex
tenu
re o
n cu
rren
t job
indu
stry
educ
atio
n
prev
ious
indu
stry
prog
ram
adm
inis
trat
ive
data
earn
ings
leve
l
fullt
ime/
part
time
stat
us
year
s of
ser
vice
type
of p
ensi
on c
over
age
bene
fit fo
rmul
a ty
pe
cove
red
earn
ings
cale
ndar
yea
r
earn
ings
his
tory
prog
ram
rul
es
earn
ings
test
rul
es
curr
ent e
arni
ngs
disa
bilit
y st
atus
bene
fit h
isto
ry h
ead
pare
nt's
elig
ibili
ty
scho
ol s
tatu
s
priv
ate
pens
ion
mod
el
Prim
ary
Insu
ranc
e A
mou
nt
acco
unt b
alan
ce
mar
ital s
tatu
s
pens
ion
elig
ibili
ty &
am
ount
soci
al s
ecur
ity e
ligib
ility
& a
mou
nt
wag
e
soci
al s
ecur
ity w
ealth
pens
ion
wea
lth
impu
ted
wag
e
Job change X X X XIndustry of first job X XIndustry off job changers X XSocial security coverage X XPension coverage on new job X X XPension plan participation X X X XType of pension coverage X
Retirement eligibility X X XVesting XBenefit formula type X XBenefit plan parameters X X X
Reirement benefit eligibility X XPrimary Insurance Amount (PIA) X X X XBenefit X X XDisability benefit X X X XSpouse benefit X X X XChildren's benefits X X X
Retirement plan participation X XRetirement contribution X XRetirement benefit distribution X X
Probability of retiring from job X X X X X X X X X XProbability of taking new job X X X X X X X X
Table 2. The Jobs and Benefits History Model; Source: Anderson 2001.
The CSIM Cross-Section Imputation model is a static model used to impute additional information into a single cross-sectional file for a given year generated by the other two models. Imputed variables include
- health status,
- institutionalization for persons 60+,
- financial assets including home ownership, and
- Supplemental Security Income.
Health status is measured by ADLs, the number of limitations on activities of daily life, and IADLs, limitations on instrumental activities of daily living.
Demographic and health behavior
Demographic behaviors are modeled in the "model of family and earnings histories" (FEH); apart from the three key demographic events - births, death and migration (mobility), it also includes mate matching, marriage, divorce and leaving home. While the model is thus able to produce demographic projections based on these demographic modules, it also incorporates a large array of time-series adjustment factors that allow the user to align the model's aggregate projections to external forecasts – usually by age, race and sex. In the context of aligned outputs, the "internal" behavioral equations are thus used to depict the social-structural effects and distributions of events across demographic groups, while the aggregate results are aligned to external forecasts. Given the heavy use of alignment techniques usually applied in simulation studies, demographic projections per se are not a central model application.

5
The model includes institutionalization as well as disability onset and recovery as events, as well as disability benefits; however, a detailed health and disability status can only be imputed for a given year and is not dynamically modeled. The model does not include health care finance issues, neither for public nor private sector health care finance plans.
Main applications
With regard to social security modeling, the main focus lies in pension modeling including both public and (seven representative) private pension plans. In 1979 the private pension model PENSIM developed by Prof. James Schulz at Brandeis University was completed, but due to its complexity it was never fully integrated into DYNASIM as initially intended.
Applications include (Anderson, 2001):
- Effects of mandatory retirement through 2000; US Dept. of Labor, 1981;
- Effects of teenage childbearing on welfare costs; NICHD, 1982;
- Forecasts of private pension systems through 2020 under different scenarios, US Dept. of HHS, Brookings Institution;
- Long range effects of 1983 Social Security Amendments; 1983, consortium of foundations;
- Earning sharing alternatives in the Social Security System; 1984, women's advocacy group, private foundations;
- Long-range effects of private pension rule changes in the Tax Acts of 1986; 1988, Rockefeller Foundation and National Senior Citizens Law Center;
- Need for elderly in the 21st century; 1989, Administration of Aging.
2.2. CORSIM
Overview
CORSIM, (Corsim, 2002) based at Cornell University and developed under the direction of Steven Caldwell, was begun in 1987, building on the first dynamic microsimulation model DYNASIM (Caldwell was part of the team that developed DYNASIM at the Urban Institute). The project is now in its fourth generation (Corsim 4.0) and probably also the most heavily "researched" model, since this university-based model has not only been built (1) to simultaneously support basic research into fundamental socioeconomic processes, and (2) as a platform for a broad range of policy analysis, but it has also been built (3) as a study object itself serving as platform and framework for research in microsimulation modeling. The core CORSIM modules were also widely adapted by other models, namely the Canadian DYNACAN and the Swedish SVERIGE model.
The base year database is the 1960 US Census Public Use Microdata Sample (PUMS) containing 180,000 person records. With regard to the behavioral modules, CORSIM aims at synthesizing the empirical strengths of numerous, diverse data files of

6
various types, including longitudinal microdata – i.e., the Longitudinal Mortality Survey – aggregate totals, cross-section microdata, vital statistics, as well as administrative statistics. CORSIM makes extensive use of grouping of the population into subgroups for which the behavioral equations are separately estimated. With regard to data sources and number of equations CORSIM is among the largest microsimulation models. Individual and family behavior is represented by approximately 1100 equations and 7000 parameters as well as dozens of algorithms. Individual behaviors include schooling, labor supply, demographic characteristics, and risk factors, such as smoking, alcohol or diabetes. Family behaviors and attributes include wealth represented by 11 asset types and 3 debt types, different taxes and benefits, demographic attributes such as family links, and economic behavior such as consumption and savings.
Differently to DYNASIM, CORSIM is a fully dynamic, single integrated simulation model. It is organized in approximately 26 behavioral modules and several rule-based accounting routines. Three modules are separable from the main model as their results do not feed back into the model: a voting module, the consumption expenditure module, and the dental module (the second "generation" version of the model developed in 1990-1993 was funded by the National Institute of Dental Research).
One of the characteristics of the model is the use of a more than 40 year old starting population that contributes to its usability as a study tool, both with regard to the study of underlying socioeconomic processes as well as with regard to the model accuracy itself. CORSIM makes heavy use of alignment techniques to align its projections to data that become available over the decades. For future projections, time series data of historic alignment factors are used in order to develop alignment factors for future years. This approach makes projections into the future difficult to interpret, or, as Anderson (1997) states, "without realigning or debasing the data for a recent historic year, projections of future years may begin from a base that already is subject to errors accumulated over a 35 year simulation period". Even if many group and aggregate outcomes can be exactly aligned to recent data, there is no way of assuring that the joint distributions based on the 1960 data remain accurate after 35 years.
Demographic and health behavior
Compared to DYNASIM, demographic behavior is modeled in far more detail both with regard to the variables used – i.e., the inclusion of income and wealth in the modeling of fertility and mortality – and the number of population groups built. First marriage is distinguished from remarriage, mate matching is based on a series of additional characteristics compared to the age/education framework in DYNASIM and the custody of children at death or divorce of parents are modeled in detail. CORSIM keeps track of kinship networks among parents and children, among spouses and ex-spouses as well as among siblings, including half and step siblings. CORSIM includes both modules of geographic mobility (migration out and into a new state of residence) and immigration. Schooling is modeled in detail following the main school transition paths which characterize the US education system.
Regarding health, CORSIM includes the modeling of four main risk factors for health, namely smoking, alcohol consumption, sugar consumption and diabetes. It keeps track of the disability status, and models institutionalization. With regard to health care finance, private systems are only covered with regard to dental care including modules for dental insurance coverage, dental condition/health and dental services and expenditures.

7
While private pension plans are currently implemented, the public Old Age, Survivors and Disability Insurance (OASDI) system is modeled in detail, including cumulative (i.e., life-course) outcomes, such as internal rates of return, lifetime transfers and taxes, ratio of benefits to contributions, replacement rates and the rate of adults and retired persons in post-OASDI poverty. With regard to health care finance, the model thus covers disability insurance.
Main applications
The life-course projection of contributions paid by each person during their working years and the benefits received from the US Old Age Security and Disability Insurance System is one of the main applications of the model. Contributions and benefits are calculated in close approximation to actual rules, fully taking into account all family links to determine survivors’ benefits. Typical applications include the estimation of welfare costs and the distribution of benefits of welfare reform proposals by Nixon, Carter, Reagan and Clinton, as well as a detailed assessment of Reagan’s tax and federal benefit policies over the 1981-1983 period.
Another core application is the study of asset accumulation with regard to a variety of types of asset distinguished. This also involves the transfer of assets due to inheritance, asset transfers at divorce, as well as the tax treatment of assets.
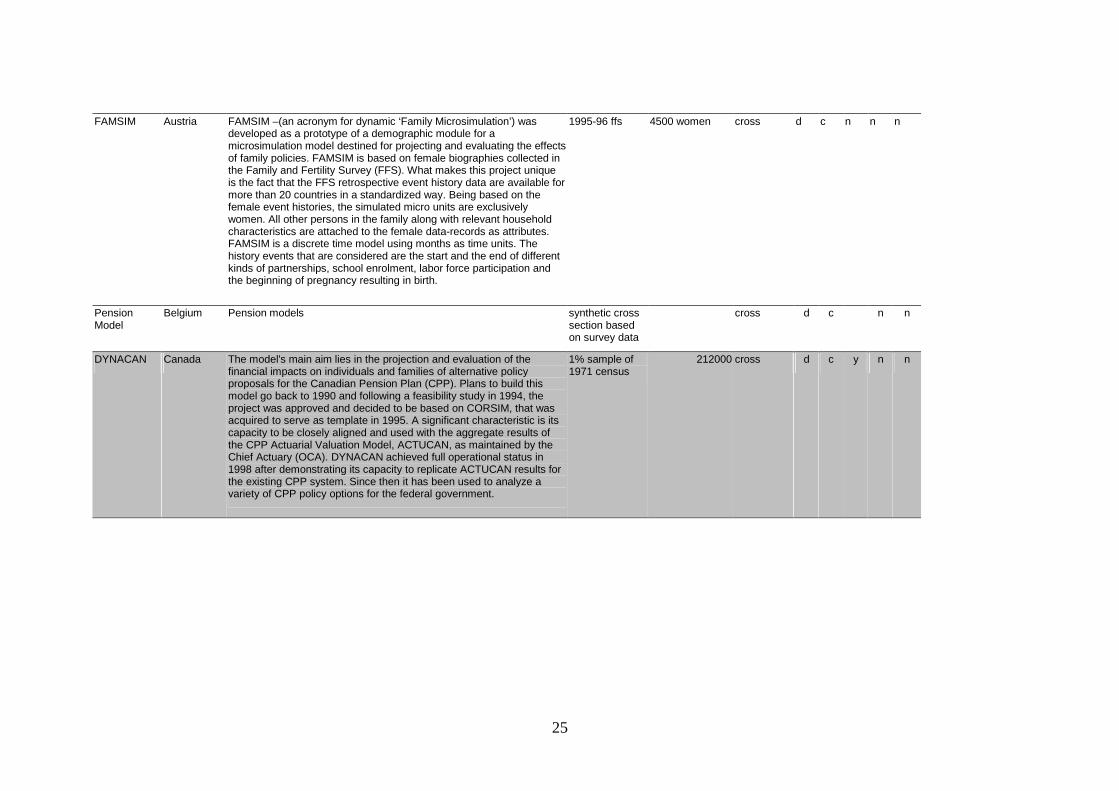
2.3. DYNACAN: A Canadian Pension Microsimulation Model
Overview
DYNACAN (Morrison, 1998/Dussault, 2000) was developed in the Office of the Chief Actuary (OCA) of the Canadian Pension Plan. Accordingly, the model's main aim lies in the projection and evaluation of the financial impacts on individuals and families of alternative policy proposals for the Canadian Pension Plan (CPP). As of January 1999, the team moved to the Strategic Policy Branch of HRDC (Human Resources Development Canada).
Plans of HRDC to build this model go back to 1990 and, following a feasibility study in 1994, the project was approved and decided to be based on CORSIM, which was acquired to serve as a template in 1995. One if its significant characteristics is its capacity to be closely aligned and to be used with the aggregate results of the CPP Actuarial Valuation Model, ACTUCAN, as maintained by the Chief Actuary (OCA). DYNACAN achieved full operational status in 1998 after demonstrating its capacity to replicate ACTUCAN results for the existing CPP system. Since then it has been used to analyze a variety of CPP policy options for the federal government (Anderson, 1998).
Other recent and ongoing applications have included mortality impact analyses for Health Canada and analyses of non-CPP portions of Canada’s retirement income system. Now that the model has achieved operational status in simulating the CPP in isolation, further development is scheduled to enable it to analyze the impacts of CPP changes in the context of the broader retirement income system, including taxes, employer pensions, private savings and income-tested benefit programs.

8
The starting population is the one-percent (213,000 person) public-use sample of the population from the 1971 Canadian Census. These data have been considerably augmented with survey and administrative data. The database is aged annually through 2100.
The model can produce both simulated cross-section data for every simulated year and individual event and income/employment/contribution histories.
DYNACAN is organized in three components corresponding to data preparation, simulation of events and accounting:
- DYNACAN-A: prepares the initial input database for the simulation, i.e., by imputing earning histories and disability status to the 1971 cross-section data.
- DYNACAN-B: simulates the longitudinal histories of demographic and labor market events and earnings (that feed into DYNACAN-C in order to calculate contributions and benefits). DYNACAN-B is organized in some 17 behavioral and rule-based or bookkeeping modules with most equations adapted from CORSIM. Most events are simulated stochastically in a two-step process, with probabilities being aligned to exogenous alignment values in the second step. As DYNACAN was developed to mirror the aggregated outputs from the CPP Actuarial Valuation Model (extended by extensive distributional detail), alignment is a central feature of its operation.
- DYNACAN-C: calculates pension contributions and benefits and produces aggregated data output.
DYNASIM reached complete "independence" from the CORSIM microsimulation project, and with the release of CORSIM v4.0 in 2000, DYNACAN and CORSIM no longer share a common source tree as the changes to CORSIM were too large to be incorporated into DYNACAN.
Demographic behavior and health
The modules for demographic behavior are mostly adaptations of the CORSIM equations to Canadian data. Given the heavy use of alignment techniques, the "internal" behavioral equations are therefore used to depict the social-structural effects and distributions of events across demographic groups, while the aggregate results are aligned to external forecasts. Therefore, demographic projections per se are not a central model application.
DYNACAN models disability histories. Disability status, including rehabilitation and increased mortality associated with the disabled population, is simulated using probabilities drawn from CPP administrative data. DYNACAN does not model health conditions or any health insurance or finance issues, which is partly due to Canada's universal (tax-financed) health care coverage. Future applications might include more detailed health care finance models; recent applications like the mortality impact analyses for Health Canada point in this direction.

9
Main applications
The model's main aim lies in the projection and evaluation of the financial impacts on individuals and families of alternative policy proposals for the Canadian Pension Plan (CPP). Having achieved "operational status" in simulating the CPP, further development and applications in broader and/or additional fields can be expected.
2.4. DYNAMOD
Overview
The DYNAMOD-2 (King et al., 1999) model, a dynamic microsimulation model of the Australian population, is designed to project characteristics of the population over a period of up to 50 years. Major elements of the model include demographics, international migration, education, the labor market and earnings.
The DYNAMOD-2 model can be seen as the population simulation module of what was initially conceived as a two-part model, with a separate analysis module being the second part – a design following the DYNASIM2 approach to reduce computing demands. The first analysis tool corresponds to the model's first specialized application as a model for the analysis of student loans.
DYNAMOD-2 uses a "pseudocontinuous" time framework operating in monthly steps for most demographic and labor market processes and in annual steps for education and earnings. With regard to the statistical modeling approaches used, it makes maximum use of survival functions. This design was sought to brake the trade-off between time interval and computing demands: while it is one of the first comparable models using months as time units, the survival functions only have to be re-evaluated if changes occurred in the characteristics incorporated in these functions. For example, the month of death is determined at birth and stored in what was called the ‘crystal ball’ (King et al., 1999). This month is only re-evaluated if a change in the health status occurs, as, apart from year of birth, age, sex and disability status, no other variable enters the survival function used.
DYNAMOD-2 concentrates on four broad groups of processes, namely demographics, education, labor markets and earnings.
Demography and health
Fertility is modeled using survival functions derived from a 1986 national survey (n=2547 women aged 20-59) undertaken by the Australian Family Project at the National University and containing detailed biographic information. The fertility processes are aligned by scaling the outcomes of the survival functions so that simulated fertility matches exogenously specified age-specific fertility rates.
Mortality is modeled by applying rates by single-year age, sex and disability status being based on observed mortality rates and on assumptions on future changes. Disability is an important variable that, in addition to the mortality function, also enters educational functions. According to its importance in the Australian context, migration is modeled in

10
detail, distinguishing five categories of movement and also taking into account the migrant eligibility category. The modeling of immigration involves the simulation of five ‘pools of potential immigrants’ created from LSIA (Longitudinal Study of Immigrants) data. The actual numbers of immigrants from each ‘pool’ is exogenously set for every year. As LSIA data do not cover immigrants from New Zealand, these are produced by cloning of matching individuals already existing in the dataset. To change the characteristics of the ‘pools’, reweighing procedures are used.
Couple formation and dissolution are also modeled female dominant, using survival functions estimated from the same data as for fertility. Matching is based on age, education and employment status.
Education is modeled in annual time steps for the whole following year using observed transition probabilities between school types and levels.
DYNAMOD-2 models the monthly transitions between labor force states, fulltime versus part time, as well as sector of industry and wages. Employment of fulltime students is treated separately. Details are given in King et al. (1999).
2.5. LifePaths and POHEM
Overview
LifePaths (LifePaths Overview 1.0) is a dynamic microsimulation model developed at the Canadian Statistical Office that differs considerably from other existing models for four reasons:
- It operates in continuous time which (amongst other things) allows for a more accurate representation of causation and behavior.
- It is an open model in which new individuals are created for the case of partnership formation, using a concept of "dominant individuals".
- It uses a synthetic initial database: LifePaths uses a variety of historical micro-data sources in order to create representative synthetic life histories from birth to death for all birth cohorts since 1872.
- It runs on a generic simulation language (ModGen), also developed at Statistics Canada (Statistics Canada, 2002), which is freely available and can be used to produce new "variants" and applications of the model.
LifePaths is structured with an explicit event orientation. Behavioral equations together with their stochastic components determine the distribution of waiting times to events. A LifePaths simulation consists of a set of mutually independent cases. Each case contains exactly one dominant individual in the first generation. The spouse and children of the dominant individual are simulated as part of the case and are created to satisfy the marriage and fertility equations (LifePaths Overview 1.0). This approach also determines the order of the simulation: LifePaths simulates the completion of one case before going on to the next.

11
The sister model POHEM (Population Health Model) is a comprehensive microsimulation model designed to simulate the health status of the Canadian population. It incorporates and reconciles data on risk factors, disease onset and progression, health care resource utilization, direct medical care costs and health outcomes (Houle et. al., 1997).
Demographic behavior and health
The simulation of demographic behavior is the central focus of LifePaths, and the continuous time framework allows for a variety of behavioral models that might be used. In order to reproduce the current Canadian population, modeling of immigration is of comparatively high importance, and "it is a special challenge to model the Canadian population without at the same time modeling the rest of the world" (LifePaths Overview 1.0). Independently of place of birth, all individuals are simulated from birth, and entering/leaving Canada as well as moves between provinces are treated as events. Mortality (remaining life time) is re-assessed at each birthday; recently mortality has been modeled in much more detail as the sister model POHEM (see below) was developed.
Education is modeled in detail including 30 possible post-secondary education fates as well as 100 possible fields of study. Employment status is modeled by distinguishing three phases or circumstances: employment of fulltime students, which is partly determined by the academic year, career employment, and maternity leave. Possible employment states are paid employee, self-employed and not employed.
Births are simulated as a sequence of fertility decisions. Each decision is modeled in two parts: first a decision of whether to have a child is taken, and in the positive case a waiting time is generated. Partnerships are modeled in a series of possible marriage and common-law transitions. Partners are either created "when needed" by generating individuals of appropriate age and sex until a match with regard to education is found, or they are taken from a "spouse market" created prior to the simulation of the cases. Two further ways of modeling a changing household composition are children leaving home and the institutionalization of the elderly.
Statistics Canada used the ModGen modeling environment to generate several daughter models of LifePaths, most prominently POHEM, a Population Health and Disease Model, which uses the demographic module of LifePaths but replaces the mortality equations with a highly detailed model of morbidity and mortality. POHEM is used to empirically evaluate competing heath care scenarios (Zaidi and Rake, 2001). POHEM simulates representative populations and allows the rational comparison of competing health intervention alternatives in a framework that captures the effects of disease interactions. POHEM currently models lung and breast cancer, coronary disease, arthritis and dementia. The POHEM framework can be used to evaluate the impact of risk factors, to assess diagnostic and therapeutic options for lung cancer, and to evaluate the costs of care for these diseases. Cost effectiveness, cost per year of life gained, cost per health-adjusted year of life gained and the impact on incidence and survival can also be determined within this framework. In addition, disease-specific survival curves and costs of care for co-morbidities can be established (Houle et. al., 1997).
12
2.6. MOSART
Overview
MOSART (Andreassen et.al., 1994) is a dynamic microsimulation model for Norway developed by Statistics Norway to investigate policy options with regard to financing public expenditure. In its first version developed between 1988 and 1990 it focused on demographic behavior, education and labor force participation in order to study the impact of demographic change on labor force and education attainment. The second version extends the model, allowing for pension modeling. Currently MOSART exists is in its third version that includes more detailed behavioral modules with regard to household formation and disability. MOSART is mostly based on administrative data and records representing 12% of the Norwegian population.
This database is in fact equivalent to a longitudinal database that contains rich retrospective information on many variables dating back to 1985, and to 1967 for labor income and pension entitlement.
Most events are represented by time-invariant transition matrices and logit relationships assuming constant behavior over time. The only exception are currently the mortality rates, which are assumed to further decrease over time.
Demographic behavior and health
Time-invariant transition tables are used for leaving home, institutionalization, marriage and cohabitation, matching couples and couple dissolution. Fertility is modeled by applying a TFR of 1.86, using a model based on age of mother, age of youngest child and parity. Net immigration is exogenously imposed, education activities are based on observed rates for 1987. Disability and rehabilitation as well as labor market participation are modeled using multinomial logit functions. In the 1990s, the MOSART model was extended to simulate public disability and old-age pensions in Norway (Andreassen et al., 1994).
2.7. NCCSO Long-Term Care Model
Overview
The NCCSU microsimulation model of long-term care charging has been developed at the Nuffield Community Care Studies Unit at the University of Leicester. It is based on data on older participants in the Family Resources Survey 1997 (FRS), a representative sample of British households (n=6,400 individuals 65+). It contains detailed information on incomes, wealth and housing, but as it excludes people living in old-age care homes. It only includes the population representing the future entrants to care homes. As a model of long-time care charging, it simulates alternative policies including means tests and policies taking into account housing wealth. The model simulates the incomes and assets of future cohorts of older people and their ability to contribute towards care home fees, should they need to be cared for in such settings. Being a dynamic model, it includes the "running down" of assets associated with care needs.

13
In order to project future health care costs, transitions with regard to health care needs have to be modeled. Currently the model concentrates on the cost incidence – the simulation of means tests, etc. – and uses exogenous scenarios from macro-projections in modeling future demands. This is done by linking the microsimulation model with the PSSRU (Personal Social Services Research Unit, University of Kent) cell-based macro-model. In this approach, the means test of long-term care policies is simulated in the microsimulation model and results are fed into the macro-model of future care demands and costs, thus including the issue of cost incidence in the analysis (Hancock et al., 2002).
2.8. DESTINIE
Overview
The first version of DESTINIE developed by INSEE calculates social security contributions, benefits and taxes since 1945, and simulates the socioeconomic evolution of a micro-population till 2040 on the basis of existing demographic and economic projections. For this interval, DESTINIE allows to compute the rate of return of public pensions for different age cohorts born between 1920 and 1974. DESTINIE simulates the evolution of pensions in the long run allowing for heterogeneous careers and changes in the demographic structure. The current second version of the model is based on individual data derived from the 1998 Financial Assets Survey (about 50,000 individuals). The population is monitored year by year from 1998 to 2040. DESTINIE models 3 kinds of stochastic events: demographic events, labor market transitions and income. It simulates the effect of alternative pension designs on participation rates and the amount of pensions of successive cohorts.
Demographic behavior
The modeling of demographic behavior is based on logistic regression models including variables of duration since the previous event, which is seen as a significant source of demographic heterogeneity (Robert-Bobee, 2001). The school leaving age, which is a major covariate in DESTINIE, is the only economic covariate taken into account to model demographic transition probabilities. The school leaving age is modeled as a deviation from the birth cohort mean and is dependent on the parents' education. For birth cohorts born 1975+ the mean age is assumed to remain fixed at 21 years. DESTINIE models first partnership, union disruption and start of other partnerships, and births. The modeling of death accounts for social inequalities summed up at school leaving age. Leaving home is modeled as an irreversible event, again dependent on school leaving age, and is, in addition, generally assumed when starting a partnership. DESTINIE is a closed model with regard to partner matching, but allows for immigration, with numbers and age distributions of immigrants exogenously assumed.
The behavioral models underlying the demographic events and their underlying assumptions are kept reasonably simple, taking only a very small list of covariates into account, which makes the results interpretable. DESTINIE closely reproduces "official" population projections done by other methods without additional alignment. As a result, DESTINIE may become a useful tool to study not only retirement issues, but also demographic topics. A recent example of such a study using DESTINIE is the analysis of future change in completed fertility (Robert-Bobee, 2001).

14
3. A comparison of approaches: options for health care models
As described in the first Part of this report series (Spielauer, 2002), health care models produce or incorporate external projections of various types, including
- demographic projections in order to account for demographic changes regarding population size and age distribution;
- earning projections in order to be able to calculate health care contributions;
- care need projections for different age and risk groups split up for different types of health care needs ranging from medication to personal care;
- projections of unit costs of health care per type of health care;
- projections on the availability of informal care. Estimations will typically account for changing kinship patterns resulting from demographic change and changing (female) labor market participation.
In addition, health care models usually include policy simulations with regard to benefit contribution rates and means-tested deductibles, as well as a wide range of accounting routines. The microsimulation projects surveyed above differ considerably with regard to the extent to which they produce these forecasts themselves or incorporate external information and forecasts. Another distinction can be made with regard to the degree to which interactions between demographic, health and economic processes are considered. Further distinctions include the extent and detail of policy simulations and accounting detail.
As dynamic microsimulation models simulate the socio-economic development of a sample of individuals through time, they also create, as part of that exercise, their own demographic projections. By doing so, the models differ considerably in five aspects that can be distinguished as follows:
- The first point considers the extent to which the model is used to produce demographic projections and/or the degree of alignment to other (macro) projections.
- Models differ in the degree to which socioeconomic variables are included in the modeling of demographic behavior. Health status and other health-related variables are typical examples of important variables included to a different extent in most models.
- Models differ in the degree of (explicit) behavioral modeling, i.e., to which extent the models are based on theory versus statistical "black-box" models. Behavioral modeling in the context of health will typically include the exposure to different risk factors (such as smoking and alcohol ) and take into account the whole individual health history when determining specific health risks.
- Models differ in the way the base population is created. It can be derived from a cross-sectional sample or by creating a synthetic population from other sources of information.
15
- Models differ in the extent to which they include health care finance issues, including social security policies and accounting detail.
The following paragraphs explore these five points with strong emphasis on demographic projections that can serve as a good example of the various distinctions made above and – when extended by health and other socioeconomic and financial dimensions - are central to all healthcare models.
Alignment to other models
The first point concerns the extent to which internally produced projections are used (and trusted) with regard to the projected aggregates. Many models, like DYNASIM, CORSIM and its various successors, make heavy use of alignment methods in order to align the models' aggregate projections to external forecasts or to historic numbers if simulation starts in the past. The latter is the case, for example in COSRSIM, that still uses a 40-year old population sample as its starting population. Over the years, time series of adjustment factors were added and, in order to use the model for forecasts, research has concentrated rather on the prediction of alignment factors from this time series data than on changing the model. In the context of aligned outputs, the "internal" behavioral equations are therefore used to illustrate the socio-structural effects and distributions of events across socio-demographic groups, while the aggregate results are aligned to external forecasts. There are various reasons for pursuing this approach. The first is randomness. As all (surveyed) microsimulation models are of a stochastic nature, their outcome is subject to random variation that increases with the number of the variables included (specification randomness). Additionally, the Monte-Carlo method used in order to determine if an event happens for a given probability creates its own "Monte-Carlo" variation, i.e., every simulation experiment produces a different outcome. This would imply that simulation runs have to be repeated several times in order to investigate the distribution of outcomes, a procedure which is, in reality, frequently not carried out. While specification randomness reduces the prediction power of a model (in a trade-off against misspecification errors due to the omission of important variables), a way out of this dilemma is frequently seen in the alignment of detailed micro-models to macro-models, which are believed to have a higher predictive power.
The reason for aligning outputs does not always lie in the lack of trust in the model predictions, but also results from the demands of policy makers who are interested in "what if studies", the "if" being the aggregate output the model is expected to reproduce. A typical example are "official central scenario" population forecasts. In this respect, the alignment of fertility outcomes is also needed and used to make model results comparable to other modeling approaches by using the same population scenario. To meet this need, alignment methods were also incorporated into microsimulation models, which had initially not been planned to follow this road – the Australian DYNAMOD being a good example.
Other models like DESTINIE and MOSART are also able to reproduce given population scenarios, however, by using less complex models of demographic behavior, i.e., methods and variables that come close to conventional cohort-component models, and can thus "internally" reproduce given scenarios by corresponding parameterization. MOSART mostly uses time-invariant transition matrices, producing pre-set total fertility rates in a model that is based on age of mother, age of youngest child and parity. Relying
16
on a large administrative database, this approach can be seen as an alternative to the cohort component methods being able to produce the same projections, but adding additional flexibility. DESTINIE clearly crosses the line of what could be done with the cohort-component method by introducing duration dependency in its models of demographic behavior. But, as this is done by keeping the number of variables small and by being based on a comparably large population sample, randomness is reduced to the extent that makes the model a useful tool, also for the study of demographic topics.
LifePaths and POHEM are the only models surveyed in which the simulation of demographic behavior and health constitute the central focus of the model. Accordingly, alignment is not a topic in the sense that model outputs are aligned to fit another model, but an attempt is made to find and fit models which reproduce the observed patterns in the past and learn from this experience when projecting into the future. As LifePaths restores the demographic experience for every simulated person from birth, it creates a synthetic cross-section rather than working with a single sample cross-section as starting population. Being very flexible with regard to modeling approaches on the one side – LifePaths is based on a continuous time frame – the modeling of demographic behavior is restricted with regard to the modeling of interactions between individuals: LifePaths simulates individuals case-wise in an open population.
Complexity of the models and number of variables used
One of the features that makes microsimulation especially attractive, namely the large number of variables models can include, comes at the price of specification randomness and the resulting weak prediction power, which is decreasing with the number of variables. While models that are based on rather simple behavioral models, like DESTINIE and MOSART, produce "trusted" demographic projections, the former models are not only rather weak with regard to explanation, but also limit the analysis of behavior to this reduced set of variables. These models do not allow for the inclusion of the influence of income and of many other socio-economic variables regarded as important in the modeling of demographic behavior. As many socio-economic characteristics must therefore be assumed independently of demographic behaviors, these models might produce quite biased joint distributions when these additional characteristics are included into the analyses. This is especially a problem in tax-benefit analyses for which microsimulation models have been created just as in all health models, since health is highly related with a series of other socioeconomic variables including education and income. In tax-benefit and social security models both household structure and a number of other socioeconomic characteristics are needed to simulate policies. This might not be a problem for forecasts in the short term if the base population comes from a recent representative sample, but it generates a trade-off between good demographic predictions and a good prediction with regard to distributional issues in the long run. This leads back to the heavy reliance on alignment techniques as used in the models mainly built for policy analysis like CORSIM, DYNACAN or DYNAMOD. In this respect, the NCCSO model reaches the "extreme case of specialization", as it entirely concentrates on the projection of income and wealth distribution of pensioners (used for the means test of care policies), but leaves the modeling of population numbers by age and care need to a cell-based macro-model which the results of the microsimulation model are fed into.
The idea to model demographic and income processes (including income distributions) in one single model by microsimulation goes back to the first dynamic

17
microsimulation model DYNASIM (‘dynamic simulation of income model’). While such models are able to account for detailed micro-characteristics like educational attainment, household composition and health in the determination of human capital and labor supply, and might therefore be suitable to model income differentials, they typically only cover the supply side of the labor market. Various approaches exist in order to link micro-models of the household sector with macro-economic models, the German DMMS Darmstadt Micro Macro Simulator (Heike et. al., 1994) being one example. A similar approach was also followed by Spielauer (2001) in the context of a stylized demonstrational model, linking a dynamic micro-population with (a simplified version of) the IIASA social security accounting model.
Theoretical foundation of behavioral models
The weak theoretical foundation of many microsimulation models is a common source of critique with regard to many microsimulation models (Klevemarken, 1996). This topic is closely related to the intended use of a model – prediction versus explanation –, as a good theoretical foundation usually does not go hand in hand with the prediction power of a model. This can also be observed in the separate traditions of how microsimulation (in its wide definition) is applied in demography, ranging from statistical "black-box" models for predictions on the one side to agent-based computational demography (ABCD) as an inductive explanatory method on the other side. Except for the LifePaths model, all surveyed models use either transition tables or (usually logistic) regression models including a different range of variables. All these models can be regarded as typical "black-box" models, as, apart from the selection of appropriate variables, little or no theoretical foundation is given. LifePaths deviates from this approach, as it introduces "more behavior" in its modeling of fertility which is modeled as a sequence of fertility decisions, as distinguished from the statistical modeling of the waiting time until birth after a decision was made. This might be a very useful departure point in order to introduce agent-based behavior, such as goal orientation, and explicit models of decision making into microsimulation (Vencataswawmy, 2002). Generally, the inclusion of explicit behavior is supported by time-frameworks that do not restrict the range of models to transition models. The Australian DYNAMOD model gives a very interesting example in this respect. With its pseudo-continuous time framework (of monthly steps) and the ability to store future events (in what is called the "crystal ball"), whose effective occurrence might be re-assessed as circumstances change, it opens various ways of modeling behavior.
The starting population
Dynamic microsimulation models usually have a starting population as a cross-sectional database representation of the population simulated. In a cohort model like HARDING and LIFEMOD (see Appendix) this population does not originate from an actual sample as simulation of the cohort members starts at birth and the population is synthetically created by simulation of all individual life courses. A synthetic generation of a full population can be found in the LifePaths model. This approach is typically chosen in demographic research, if population characteristics have to be restored which are not contained in survey information. Kinship patterns are a good example, with the work of Wachter (1995, 1998, Wachter et al.,1998), who restored the kinship patterns of the US population using the SocSim software, being the most prominent example. Other applications using this approach are the simulation of wealth accumulation and distribution including bequests, etc.

18
All other models surveyed do depart from a starting population derived from a survey or – as in the case of MOSART – from administrative data. Besides, the restoration of missing information by simulation can also be found in DESTINIE that restores income histories of the population in order to be able to calculate rates of return of pension contributions. CORSIM, on the other hand, is based on 1960 data and simulates earning and other histories from this year onward.
A special situation arises when modeling a newly introduced health care system that (initially) does not cover the whole population. As microsimulation allows for individual accounting, it might be especially useful to study sustainability issues in the presence of transition dynamics – that is, in situations in which the health risk patterns in the initial phase of the transition might differ considerably from the long-term pattern. While the starting population (or the population from which individuals enter the social security system) will typically be generated from survey data in the initial phase, individual data records might be successively replaced as hard data become available.
Policy simulation and accounting
The simulation of tax-benefit and social security policies is one of the central applications, both of static and dynamic microsimulation. While static microsimulation concentrates on cross-sectional issues of (re)distributions, i.e., by identifying the winners and losers of alternative policy reforms, dynamic microsimulation extends its scope to long-term effects of such policies: it allows to model policy responses and to investigate distributional issues over time, both individually over the life-cycle or between cohorts and generations.
For given information on the micro-level, microsimulation allows to model policies at any level of detail, which makes it the only modeling option if policies tie taxes and benefits in a non-linear way to individuals and/or when individual contribution histories are relevant, as in the calculation of pensions. This also applies to cases in which the calculation of benefits and taxes is not entirely based on individual characteristics, but also includes family characteristics and information on spouses, including their contribution histories, i.e., in the calculation of survivors' pensions.
Policy microsimulation is both a modeling and an accounting exercise. In its static dimension modeling involves the tax-benefit regime itself and some behavioral aspects like pickup rates of benefits. It concentrates on first-order effects of policies and might calculate some measures of "pressure on behavior" like marginal tax-rates, etc. (Immervoll and O'Donoghue, 2001). Dynamic microsimulation can additionally include behavioral models of policy response, ranging from changes in labor supply to decisions regarding the timing of retirement or durations of parental leave, to give some examples.
Being based on micro-units is not only the major characteristic but also the major advantage of microsimulation models for social and economic policy analysis as they produce results which can then be analyzed at the individual level. Thus, the distributional impact of a policy measure across different types of families or different geographical regions can be assessed. At the same time, estimates of the aggregate outcomes can still be derived easily, by summing the individual results (Lambert, 1994).
National tax-benefit models became standard tools for the calculation of costs and the (distributional) impact of policies in many countries; in recent years also efforts were

19
made to build models that allow comparative analysis across countries, the Euromod (Sutherland, 2001) project being a prominent example covering all current 15 EU member states. Beside the fact that Euromod is at the time being the only available tax-benefit microsimulation model in some countries of the European Union, it also allows to extend the scope of research to questions such as who would be the winners and losers of applying the tax system of country A to country B, etc. The "Multi-Purpose Framework for Tax-Benefit Microsimulation" (underlying the Euromod project) is described in Immervoll and O'Donoghue (2001).
Economic and policy applications of dynamic microsimulation models usually also include cross-sectional analysis with static microsimulation being one "dimension" of these models. This view of static microsimulation as being one dimension of dynamic models might be justified on the basis of the various attempts to extend existing static models to dynamic models, both by including feedback behavior – where the calculation of "pressure on behavior" is one initial step in this direction – and behavior over time. An example of combining a dynamic microsimulation model with an existing static tax-benefit model is the dynamic microsimulation model developed by Cathal O'Donoghue (2001) for Ireland which can "communicate" with the static Euromod model.
All surveyed microsimulation models include policy simulations to various degrees. The main distinction can be found with regard to the availability of individual information for each single period. DYNASIM is a typical example of a model in which not all information is generated and available dynamically, but some variables are imputed to a simulated cross-section of a given year. Especially pension models like DYNACAN and DESTINIE include various routines to calculate internal returns to pension contributions and can therefore serve to assess issues of intergenerational fairness.
4. Conclusions: The 12 “SAGE lessons”
The SAGE research group, located at the London School of Economics (Zaidi and Rake, 2001), have drawn up “12 lessons” for microsimulation modelers engaged in the creation of a new microsimulation model. These lessons are based on a review of seven dynamic microsimulation projects. Zaidi and Rake focus on the simulation of social policies in an aging society. In this chapter, their findings are discussed with regard to their applicability to health care modeling.
The surveyed projects differ considerably in the number of processes that have been modeled and therefore in comprehensiveness. Comprehensiveness and complexity comes at the price of making it difficult to interpret results and to separate out the impact of individual processes. Zaidi and Rake conclude in this context that the effectiveness and suitability of a dynamic microsimulation model has to be judged in relation to the purpose for which the model was built; they summarize this statement in the first of the 12 lessons:
“A successful model requires clear objectives. From these objectives, model builders can identify the processes which are essential to the model and design a developmental strategy for the model, whereby other processes are incorporated over the longer term.” (Zaidi and Rake 2001, p. 18).
Dynamic microsimulation in the field of health care studies can be seen, or should be designed, as a tool for the investigation of health related processes, supporting the

20
conceptualization of these processes and the study of their determinants and consequences. Consequently, such a model has to include the core demographic processes and – if health is seen as an important variable in demographic processes - should be able to produce its own forecasts with regard to aggregated population outputs rather than being aligned to other projections. Health care studies are concerned with and have to take into account a wide field of social and economic changes that have a strong impact on health issues. In order to design a dynamic microsimulation model as an appropriate tool in health care studies, it has to include additional relevant processes and variables in a way that makes it either a comprehensive model with regard to the objectives followed or a model that produces a detailed and adequate population input for other models. In both cases microsimulation can be the appropriate modeling approach, as it adds flexibility with regard to the modeling of dynamics and a range of variables to a modeling effort that is currently dominated by cell-based (cohort-component) models.
Comparing the surveyed projects, a clear trade-off can be observed between the socioeconomic detail included to carry out detailed tax-benefit calculations and the prediction power of the models in the long run. This can also be seen as a trade-off between detail in cross-sectional analysis and the suitability for studies of (health related) processes (and transparency) in the long term. Health care studies focus on both, especially with regard to policies, as a detailed calculation of costs and distributional impacts of health care policies in the cross section might be of equally important as the study of long-term effects. A possible way to avoid such a trade-off might be to design a microsimulation model rather as a modeling platform than as one single model, suitable to include different degrees of detail with regard to the projection horizon.
A problem of all data-based microsimulation models is the availability of data. In this respect, the “model builders have to be sensitive to the shortcomings of data [...]”, and “the model should be flexible enough to incorporate the most recent and robust data” – are essentially lessons 2 and 3 from Zaidi and Rake. With regard to data, health care models will typically make use of a wide range of different available data of various types. Social insurance carriers maintain huge databases of individual contribution and spending histories, and clinical records are the basis of detailed medical research. Population modeling in health care models should take advantage of all available information on the micro-level. In this process, available survey data may often be only a starting point, especially when modeling concrete social security funds, as hard data will become available from the insurance schemes over time. High flexibility in order to allow for the incorporation of most recent data is a key requirement in health care modeling, especially in this case, as hard data might successively replace survey data in integrated applications.
Quite intuitive is lesson 4, stating that "Innovation in model building may be desirable, although it involves taking risks, with parts of the model building process having unknown rewards and pitfalls."
A topic related to the comprehensiveness of models, as discussed above, is whether models are used and designed to produce input to other models and if so, whether this combination of models involves feedback reactions. In the wide area of health care studies, microsimulation can be useful in all three cases: (1) as “stand alone” tool to study and project population and health dynamics including disease episodes, care seeking and insurance claims; (2) as a method that can produce a more detailed population input to other models, which could be achieved by the cohort-component method; or (3) as one side of an integrated micro-macro-model where results of one side feed into the other and vice

21
versa, i.e., in population-environment studies, where combining the strengths of micro- and macro-models might be an appropriate modeling option. The design of integrated micro-macro-models has in reality turned out to be expensive, both with regard to development costs and model transparency. The experience of DYNAMOD can serve as an example of model builders ultimately preferring to allow for flexibility in specifying external aggregates. Zaidi and Rake conclude in their fifth “lesson” that “[...] Simpler solutions, in the form of taking macroeconomic indicators from external sources and performing sensitivity analysis may be preferable in the short/medium term.” This might equally apply to health care studies, at least as long as feedback reactions are not the central focus of the analysis itself.
Models that include the projection of future unit costs, etc. will typically result from a combination of micro- and macro- sub-models or modules. An appropriate model composition might consist of three such sub-models, namely
- an accounting module reproducing the balance sheet of health care providers and the insurance fund;
- a macro-economic module, i.e., macro models including general equilibrium models, “fixed-coefficient” social accounting models and hybrid approaches in which some prices adjust but others do not; and
- a household module, i.e., a microsimulation model employed to produce a population of individuals characterized by individual-level behaviors related to demography, labor supply, education, morbidity, health care seeking and making insurance claims and insurance contributions.
When designing a microsimulation model as an integral part of a health care finance model, clear interfaces to other modules or models should be defined from the very beginning, allowing to include external information in a defined way, independent of how this information was generated, i.e., by a model or by assumption. Rather than opting for “simpler solutions” with regard to the determination of macroeconomic variables, the development of the microsimulation model should be made as independent as possible of modeling choices with respect to these macroeconomic indicators by providing clear interfaces for the data exchange between the modules.
With regard to the appropriate time frame to use, Zaidi and Rake conclude in their sixth “lesson”:
“Limits of data, and the difficulties of modeling ‘continuous time’ mean that a traditional structure may be preferable. However, it may bring dividends to introduce innovations into a traditional structure. For example, the feasibility of looking at certain events on a shorter timescale (e.g. monthly) should be explored. In addition, hazard rates and survival functions should be examined” (Zaidi and Rake, 2001, p. 20).
The latter has been done by various authors including Galler (1997) and Vencatasawmy (2002). With regard to the use of microsimulation in health studies, a pseudocontinuous timeframe of monthly steps might be the most appropriate, as it allows for various modeling approaches also including hazard rates and survival functions. In this respect, the Australian DYNAMOD project can serve as an interesting example, as was
22
already stated above. It has to be noted that many design choices for a yearly timeframe have not been made with a respect to data availability or modeling considerations, but rather in order to avoid the high computational demands of shorter time intervals, though these might be limitations that have already been removed. With regard to the surveyed models, the models that focus most on demographic processes and health – LifePaths and POHEM – use a continuous timeframe.
The second time dimension refers to the period over which models operate. Zaidi and Rake conclude in their seventh “lesson”:
“Producing output that covers the short and the medium term as well as the longer term is an essential way of ensuring that the model remains credible. In setting the end date of the model attention needs to be paid to known demographic transitions and the life-span of policy reforms in order to show its full impact.” (Zaidi and Rake 2001, p. 20).
Most processes that include and result from demographic changes evolve over many decades rather than years, and projections of 50 to 100 years are quite common in social security and health care projections. As many phenomena that can be observed today are the result of past dynamics, one frequently also has to look back in time. Microsimulation in this respect can also serve as tool to “restore the past”. A historical starting date as used in CORSIM may be chosen both as a way of validating the model and as (sometimes the only) way to impute characteristics of today’s population otherwise not available, such as kinship networks or past contribution histories to social security systems, etc. In demographic research, microsimulation has also been used to restore historic populations (Wachter 1995, 1998, Wachter et al., 1998).
Lesson eight is again derived from data considerations, stating that the representativeness of the base data is of higher importance than its detail. This also applies to health care modes. The next two lessons deal with model validation, rather generally stating that “[...] sensitivity analysis as a way of estimating the impact of specific parameters on model output and is a first step in validating a model” and that “[...] operating a retrospective microsimulation model is one attractive, although not complete, way of establishing its validity.” This is definitely true also for microsimulation applied in health care studies, as are the following and last two “lessons”, the first highlighting the necessity of a thorough and clear documentation and the last specifying the need for a computing strategy “to be developed alongside the microsimulation strategy. Alternative strategies may be tested in the development of a simple prototype model”.
5. Summary
This report reviewed a selected sample of dynamic microsimulation models in order to identify different approaches and modeling options and to draw conclusions and derive lessons for the microsimulation modeling of health care demand, health care finance and the economic impact of health behavior. The surveyed models differ considerably in scope, complexity, comprehensiveness, theoretical foundation and prediction power as well as accounting detail. Regarding the modeling of health-related issues, a series of tradeoffs has to be considered, especially between the detail of the model and its overall prediction power. Especially the "big" and "general" models like DYNASIM and its successors make heavy use of alignment methods. More specialized models developed and

23
designed, e.g., for the study of demographic and health-related processes, like LIFEMOD and POHEM, differ considerably from these general models with regard to the types of behavioral models used, the treatment of time and the underlying data.
The review focuses on the modeling of demographic and health behaviors and on they way these models are integrated into the whole model structure, including policy and accounting issues. After giving a brief description of each of the selected models, the modeling approaches were summarized and commented by means of five distinguished criteria. These are the use of alignment techniques, the model's complexity and range of variables used, the theoretical foundation of the model, the type of starting population used and the extent and detail of financial issues covered.
The conclusions were then summarized in a series of “lessons” that can be learned from existing projects.

24
Appendix: Summary of Dynamic Microsimulation models
Model Inst / Country
Uses Base Data Sample Size
Bas
e P
op
Tim
e
Ope
n/cl
ose
Alig
nmen
t
Ste
ady
Sta
te
Beh
avio
r
DYNAMOD NATSEM Australia
DYNAMOD-2 model - a dynamic microsimulation model of the Australian population which is designed to project characteristics of the population over a period of up to 50 years. Major elements of the model include demographics, international migration, education, the labor market and earnings. DYNAMOD-2 uses a "pseudocontinuous" time framework operating in monthly steps for most demographic and labor market processes and in annual steps for education and earnings. Regarding the statistical modeling approaches used, it makes maximum use of survival functions.
1% sample of 1986 census
150000 ind cross c/d c y n n
Harding Australia HARDING is a dynamic cohort microsimulation model for Australia developed in parallel with the British LIFEMOD model. The model simulates complete life histories for a pseudocohort of 2000 individuals of each sex each. It assumes a steady state world: the HARDING cohort lives in a world that looks like Australia in 1986. The main use of the model is the study of inter- and intra-personal distribution effects of different policies, i.e. comparisons of poverty alleviation vs. social insurance systems
synthetic cohort age 0
4000 ind cohort d c n y n
Melbourne Cohort Model
Australia income inequality in a lifetime context synthetic sample of 20 year olds in 1970
50000 males and families
cohort d o n n
25
FAMSIM Austria FAMSIM –(an acronym for dynamic ‘Family Microsimulation’) was developed as a prototype of a demographic module for a microsimulation model destined for projecting and evaluating the effects of family policies. FAMSIM is based on female biographies collected in the Family and Fertility Survey (FFS). What makes this project unique is the fact that the FFS retrospective event history data are available for more than 20 countries in a standardized way. Being based on the female event histories, the simulated micro units are exclusively women. All other persons in the family along with relevant household characteristics are attached to the female data-records as attributes. FAMSIM is a discrete time model using months as time units. The history events that are considered are the start and the end of different kinds of partnerships, school enrolment, labor force participation and the beginning of pregnancy resulting in birth.
1995-96 ffs 4500 women cross d c n n n
Pension Model
Belgium Pension models synthetic cross section based on survey data
cross d c n n
DYNACAN Canada The model's main aim lies in the projection and evaluation of the financial impacts on individuals and families of alternative policy proposals for the Canadian Pension Plan (CPP). Plans to build this model go back to 1990 and following a feasibility study in 1994, the project was approved and decided to be based on CORSIM, that was acquired to serve as template in 1995. A significant characteristic is its capacity to be closely aligned and used with the aggregate results of the CPP Actuarial Valuation Model, ACTUCAN, as maintained by the Chief Actuary (OCA). DYNACAN achieved full operational status in 1998 after demonstrating its capacity to replicate ACTUCAN results for the existing CPP system. Since then it has been used to analyze a variety of CPP policy options for the federal government.
1% sample of 1971 census
212000 cross d c y n n
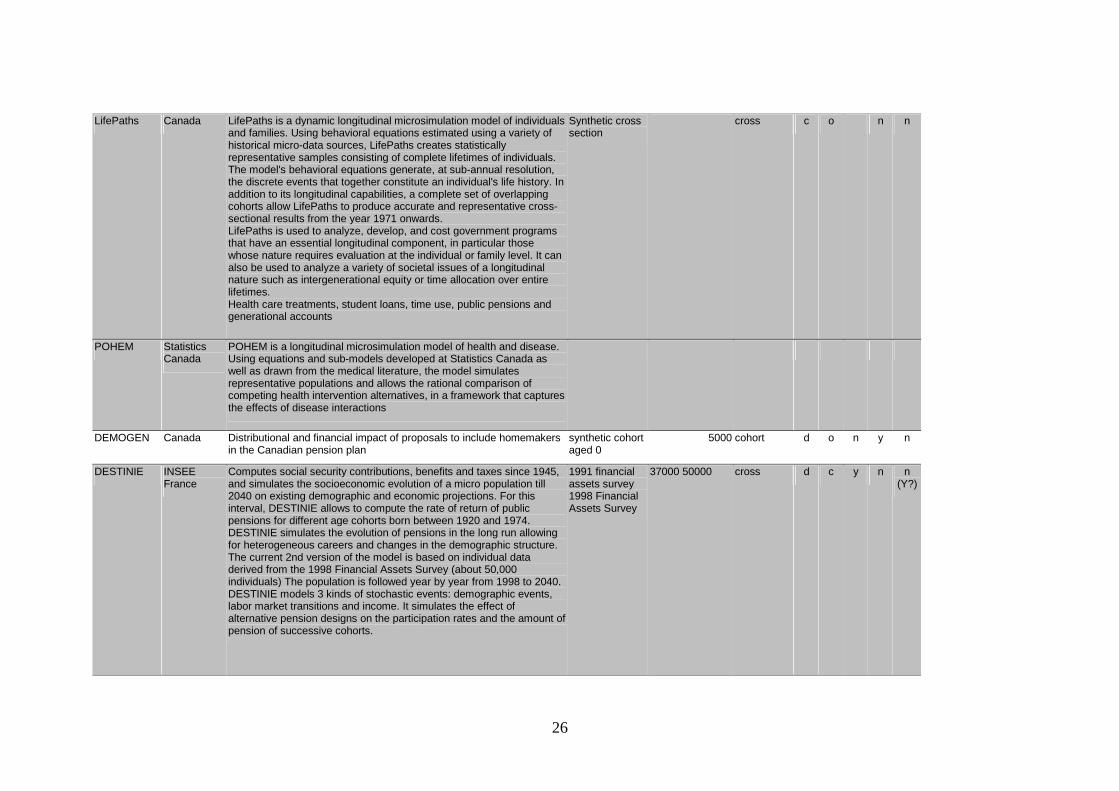
26
LifePaths Canada LifePaths is a dynamic longitudinal microsimulation model of individuals and families. Using behavioral equations estimated using a variety of historical micro-data sources, LifePaths creates statistically representative samples consisting of complete lifetimes of individuals. The model's behavioral equations generate, at sub-annual resolution, the discrete events that together constitute an individual's life history. In addition to its longitudinal capabilities, a complete set of overlapping cohorts allow LifePaths to produce accurate and representative cross-sectional results from the year 1971 onwards. LifePaths is used to analyze, develop, and cost government programs that have an essential longitudinal component, in particular those whose nature requires evaluation at the individual or family level. It can also be used to analyze a variety of societal issues of a longitudinal nature such as intergenerational equity or time allocation over entire lifetimes. Health care treatments, student loans, time use, public pensions and generational accounts
Synthetic cross section
cross c o n n
POHEM Statistics Canada
POHEM is a longitudinal microsimulation model of health and disease. Using equations and sub-models developed at Statistics Canada as well as drawn from the medical literature, the model simulates representative populations and allows the rational comparison of competing health intervention alternatives, in a framework that captures the effects of disease interactions
DEMOGEN Canada Distributional and financial impact of proposals to include homemakers in the Canadian pension plan
synthetic cohort aged 0
5000 cohort d o n y n
DESTINIE INSEE France
Computes social security contributions, benefits and taxes since 1945, and simulates the socioeconomic evolution of a micro population till 2040 on existing demographic and economic projections. For this interval, DESTINIE allows to compute the rate of return of public pensions for different age cohorts born between 1920 and 1974. DESTINIE simulates the evolution of pensions in the long run allowing for heterogeneous careers and changes in the demographic structure. The current 2nd version of the model is based on individual data derived from the 1998 Financial Assets Survey (about 50,000 individuals) The population is followed year by year from 1998 to 2040. DESTINIE models 3 kinds of stochastic events: demographic events, labor market transitions and income. It simulates the effect of alternative pension designs on the participation rates and the amount of pension of successive cohorts.
1991 financial assets survey 1998 Financial Assets Survey
37000 50000 cross d c y n n (Y?)

27
Sfb3 Germany The SF3 model consists of three versions namely a cross-sectional, a longitudinal and a static model. The cross-sectional model contains demographic events, education, labor supply, income, taxes, transfers, consumption, saving and wealth. Pension Reform, effect of shortening worker hours, distributional effects of educational transfers, distribution of pension system
1969ted micro data file (Pop.), Synthetic cohort aged 0 (Cohort)
69000hh/7300ind cohort/cross d o/c n/y n n
Darmstadt Micro Macro Simulator
TU Darmstadt Germany
The aim of the Darmstadt Mikro-Makro model is the integration of a micro-model of the household sector into a macro model.
Dynamic Model
Ireland redistribution effects of tax system 1994 living in Ireland survey (Pop), synthetic cohort aged 0
4500 hh/variable ind.
cohort/cross d c y y/n y
DYNAMITE Italy household level microeconomic questions; impact of macro changes on distribution of resources
1993 survey of Household Income and Wealth
67000 hh cross d c y n n
ANAC Italy Effect of demographic change on saving rate and pension system 1993 survey of Household Income and Wealth
67000 hh cross d c y n n
Italian Cohort Model
Italy Lifetime income distribution issues synthetic cohort aged 0
4000 ind cohort d c n y n
Japanese Cohort Model
Japan Impact of household savings of demographic change Synthetic multiple cohorts (single representative of each cohort type)
4000 ind cohort d c y n y
NEDYMAS Netherlands Pension, redistribution, social security, demographic projections, lifetime income distribution, mortality differences related to socioeconomic status
Synthetic cross-section based on 1947 census
10000 ind cross d c y n y
MIDAS New Zealand
Wealth accumulation and distribution Synthetic cross-section based on 1991 census
10000 ind cross d c n n

28
MOSART Statistics Norway
MOSART is a dynamic microsimulation for Norway developed by Statistics Norway to investigate policy options regarding the financing of public expenditure. In its first version developed between 1988 and 1990 it focused on demographic behavior, education and labor force participation in order to study the impact of demographic change on labor force and education attainment. The second version extends the model allowing for pension modeling. Currently MOSART exists is in its third version that includes more detailed behavioral modules regarding household formation and disability. MOSART is mostly based on administrative and register data representing 12% of the Norwegian population.
1989 administrative data (1% sample)
40000 cross d c y n n
MICROHUS Sweden Dynamic effects of tax-benefit systems on income distributions 1994 HUS income distribution database
cross c c n n y
SESIM Swedish Ministry of Finance
The first mission of SESIM was the evaluation of long term effects of the Swedish national system of study allowances. Beside education finance, it is planned to extend the model to be applied for inter-temporal policy issues such as labor supply, savings and pensions.
1992 HINK survey
30000 ind cross d c n n y
SVERIGE Sweden SVERIGE is a spatial microsimulation model used to evaluate human ecodynamics. It is based on a database covering the whole Swedish population.
administrative data in 1985-1995
9 mill cross d c y n n
Swedish cohort model
Sweden social insurance modeling synthetic cohort aged 20
1000 ind cohort d c n y n
LIFEMOD UK LIFEMOD is a dynamic cohort microsimulation model for Great Britain developed in parallel with the Australian HARDIG model. The model simulates complete life histories for a pseudocohort of 2000 individuals of each sex each. It assumes a steady state world: the LIFEMOD cohort lives in a world that looks like Britain in 1985. The main use of the model is the study of inter- and intra-personal distribution effects of different policies, i.e. comparisons of poverty alleviation vs. social insurance systems
synthetic cohort aged 0
4000 ind cohort d c n y n

29
NCCSU Long Term Care Model
UK The NCCSU microsimulation model of long-term care charging is developed at the Nuffield Community Care Studies Unit at the University of Leicester. It is based on data on older participants in the Family Resources Survey 1997 (FRS), a representative sample of British households. It contains detailed information on incomes, wealth and housing but as it excludes people living in care homes it only represents the population from which future entrants to care homes will come. As a model of long-time care charging, it simulates alternative policies including means-tests and policies taking into account housing wealth. The model simulates the incomes and assets of future cohorts of older people and their ability to contribute towards care home fees, should they need to be cared for in such settings. As a dynamic model, this includes the "running down" of assets associated with care needs.
1993-97 Family Expenditure Surveys
6.400 ind 65+ cross d c y y n
PENSIM UK pension 1988 retirement survey, 1986 social change and economic life initiative survey, 1988 family expenditure survey
5000 benefit units
cross c c y n n
CORSIM Strategic Forecasting USA
CORSIM, based at Cornell University, was started in 1987 building up on the first dynamic microsimulation model DYNASIM and is now in its third generation. Built both to simultaneously support basic research into fundamental socioeconomic processes and as a platform for a broad range of policy analysis, the core CORSIM modules were also widely adapted by other models, including the Canadian DYNACANB and the Swedish SVERIGE model. Individual and family behavior is represented by approximately 1100 equations and 7000 parameters as well as dozens of algorithms. Typical applications include the estimation of welfare costs and the distribution of benefits of welfare reform of various US administrations. Kinship changes, wealth accumulation, social security, wealth accumulation, socioeconomic mobility, health status, migration, tax
1960 census 0.1% sample
180000 ind cross d c y n n

30
DYNASIM The Urban Institute USA
The DYNASIM model was the first dynamic microsimulation model. It was developed by Orcutt between 1969 and 1976. Its successor DYNASIM2 includes family formation, geographic mobility, education, disability pensions, labor force participation, earnings, taxes and transfers. Population forecasts, teenage child bearing, policy scenarios, linking with macro model
1973 Current Population Survey (CPS) matched to social security administration (SSA) data
cross c/d c y n n
MINT USA distribution of income of 1931-1960 birth cohort in retirement 1990-93 survey of income and program participation, matched to SSA data
85000 ind cross c/d o y n n
PENSIM/2 USA Lifetime coverage and adequacy issues related to employer-sponsored pension plans in the USA
Synthetic cohort aged 0
cohort c o n y n
PRISM USA Public and private pensions March 1978, March and May 1979 CPS matched to SSA data
28000 adults cross d c y n y

31
References
Anderson, J.M. (2001), Models for Retirement Policy Analysis, Report to the Society of Actuaries.
Andreassen, L., D. Fredriksen and O. Ljones (1994), The Future Burden of Public Pension Benefits A Microsimulation Study, Discussion Papers 115, Statistics Norway, April.
Corsim (2002), Analyst Documantation, Strategic Forecasting, http://www.strategicforecasting.com/docs/corsim_analyst.pdf
Galler, H.P. (1997), Discrete-Time and Continuous-Time Approaches to Dynamic Microsimulation Reconsidered. Technical Paper 13. National Centre for Social and Economic Modeling (NATSEM), University of Canberra.
Hancock, R., A. Comas-Herrera, R. Wittenberg and R. Pickard (2002), Who will pay for long-term care in the UK? Projections linking macro- and micro-simulation models. Paper prepared for a meeting of the International Network of Research on Elder Care, Hannover, 8-9 February, 2002.
Heike, H.-D., K. Beckmann, A. Kaufmann and T. Sauerbier (1994), Der Darmstädter Mikro-Makro-Simulator - Modellierung, Software Architektur und Optimierung. In: Faulbaum, Frank (ed.): SoftStat'93 - Advances in Statistical Software 4, Fischer, Stuttgart, New York, pp. 161-169.
Immervoll H. and C. O’Donoghue (2001), Towards a Multi-Purpose Framework for Tax-Benefit Microsimulation, EUROMOD Working Paper No. EM2/01, December.
King A., H. Baekgaard and M. Robinson (1999), “DYNAMOD-2: An Overview”. Technical Paper No. 19, National Centre for Social and Economic Modelling (NATSEM), University of Canberra, Australia.
Klevmarken, N.A. (1997), Behavioral Modeling in Micro Simulation Models. A Survey. Working Paper 1997:31, Department of Economics, Uppsala University.
Merz, J. (1991), Microsimulation - a survey of principles, developments and applications, International Journal of Forecasting, Vol. 7, No. 1.
Morrison, R. (1998, November), slightly adapted by B. Dussault (2000, March), Overview of DYNACAN - a full-fledged Canadian actuarial stochastic model designed for the fiscal and policy analysis of social security schemes, http://www.actuaries.org/public/committees/SOCSEC/documents/dynacan.pdf
Mot E.S., (1992), Survey of Microsimulation Models, Social Security Research Committee, The Hague: VUGA.

32
O‘Donoghue, C. (2001), Redistribution in the Irish Tax-Benefit System. PhD thesis at the London School of Economics.
Orcutt, G. (1957), A new type of socio-economic system. Review of Economics and Statistics, 58:773-797.
Robert-Bobee, I. (2001), Modelling demographic behaviours in the French microsimulation model Destinie: An analysis of future change in completed fertility, INSEE N° G2001/14 - 2001.
Spielauer, M. (2001), Microsimulation Modeling of Population, Economic Growth, and Social Security Systems. IIASA Interim Report IR-01-026, International Institute for Applied Systems Analysis, Laxenburg, Austria.
Spielauer, M. (2002), Dynamic Microsimultion of Health Care Demand, Health Care Finance and the Economic Impact of Health Behavior - Part I: Background and a Comparison with Cell-Based Models. IIASA Interim Report IR-02-032, International Institute for Applied Systems Analysis, Laxenburg, Austria.
Statistics Canada (2002), The LifePaths Microsimulation Model - An Overview, www.statcan.ca/english/spsd/LifePathsOverview_E.pdf.
Sutherland, H., ed. (2001), EUROMOD: An Integrated European Benefit-Tax Model, Final Report, EUROMOD Working Paper No. EM9/01, June.
Vencatasawmy, C. (2002), Modeling fertility in a life course context: some issues. Austrian Institute for Family Studies, Working Paper 17.
Wachter, K.W. (1995), 2030's Seniors: Kin and Step-Kin. Berkeley: University of California.
Wachter, K.W (1998), Kinship Resources for the Elderly: An Update. Berkeley: University of California.
Wachter, K., D. Blackwell and E.A. Hammel (1998), Testing the Validity of Kinship Microsimulation: An Update. Berkeley: University of California, February.
Zaidi, A. and K. Rake (2001), Dynamic Microsimulation Models: A Review and Some Lessons for SAGE, SAGE Discussion Paper 02, London School of Economics.