Embed Size (px)
Citation preview
Interim Report January – June II/2017
Glossary of Selected Financial Terms
Adjusted EBIT Earnings before interest and taxes. It is our most important earnings figure for purposes of internal
management control and as an indicator of our businesses’ long-term earnings power. The EBIT used by E.ON is
derived from income/loss from continuing operations before interest income and income taxes and is adjusted to
exclude certain items, mainly non-operating income and expenses.
Adjusted EBITDA Earnings before interest, taxes, depreciation, and amortization. The EBITDA used by E.ON is
derived from income/loss from continuing operations before interest income, income taxes, depreciation, and
amortization and is adjusted to exclude certain items, mainly non-operating income and expenses.
Adjusted net income An earnings figure after interest income, income taxes, and non-controlling interests that
has been adjusted to exclude non-operating items. Along with effects from the marking to market of derivatives,
the adjustments include book gains and book losses on disposals, restructuring expenses, and other material
non-operating income and expenses (after taxes and non-controlling interests), and interest expense/income not
affecting net income, which consists of the interest expense/income resulting from non-operating effects.
Economic net debt A key figure that supplements net financial position with pension obligations and asset-retirement
obligations. In the case of material provisions affected by negative real interest rates, we use the actual amount of
the obligation instead of the balance-sheet figure to calculate our economic net debt.
Investments Cash-effective investments as shown in the Consolidated Statements of Cash Flows.
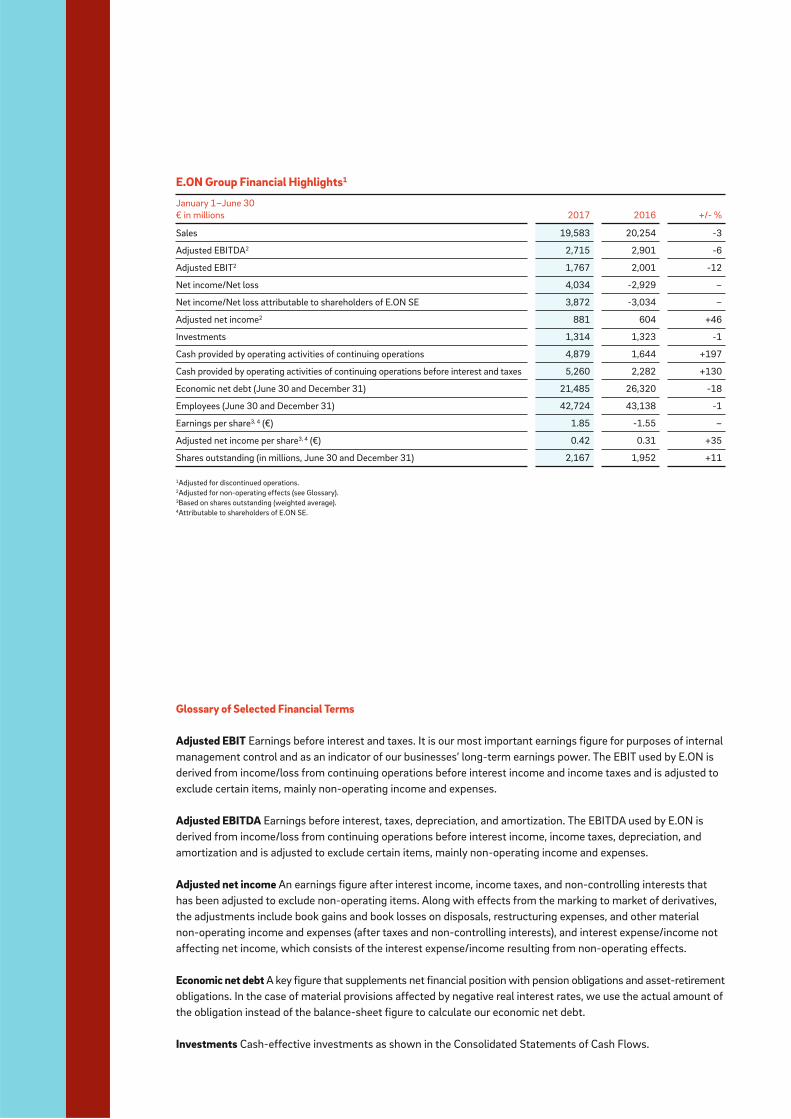
E.ON Group Financial Highlights1
January 1–June 30
€ in millions 2017 2016 +/- %
Sales 19,583 20,254 -3
Adjusted EBITDA2 2,715 2,901 -6
Adjusted EBIT2 1,767 2,001 -12
Net income/Net loss 4,034 -2,929 –
Net income/Net loss attributable to shareholders of E.ON SE 3,872 -3,034 –
Adjusted net income2 881 604 +46
Investments 1,314 1,323 -1
Cash provided by operating activities of continuing operations 4,879 1,644 +197
Cash provided by operating activities of continuing operations before interest and taxes 5,260 2,282 +130
Economic net debt (June 30 and December 31) 21,485 26,320 -18
Employees (June 30 and December 31) 42,724 43,138 -1
Earnings per share3, 4 (€) 1.85 -1.55 –
Adjusted net income per share3, 4 (€) 0.42 0.31 +35
Shares outstanding (in millions, June 30 and December 31) 2,167 1,952 +11
1Adjusted for discontinued operations.2Adjusted for non-operating effects (see Glossary).3Based on shares outstanding (weighted average).4Attributable to shareholders of E.ON SE.
4 CEO Letter5 E.ON Stock8 Interim Group Management Report8 Corporate Profile
8 Business Report
8 Industry Environment
9 Earnings Situation
13 Financial Situation
14 Asset Situation
15 Employees
16 Forecast Report
17 Risk and Chances Report
18 Business Segments
25 Review Report28 Condensed Consolidated Interim Financial Statements28 E.ON SE and Subsidiaries Consolidated Statements of Income
29 E.ON SE and Subsidiaries Consolidated Statements of Recognized Income and Expenses
30 E.ON SE and Subsidiaries Consolidated Balance Sheets
31 E.ON SE and Subsidiaries Consolidated Statements of Cash Flows
32 Statement of Changes in Equity
34 Notes to the Condensed Consolidated Interim Financial Statements
46 Responsibility Statement47 Financial Calendar
Contents
4CEO Letter
Dear Shareholders, Your E.ON’s operating business performed very well in the second quarter of 2017. Although the E.ON Group’s first-half sales of
€19.6 billion and adjusted EBIT of €1.8 billion were below the respective prior-year numbers, second-quarter adjusted EBIT in our
core business (Energy Networks, Customer Solutions, and Renewables) improved by 25 percent year on year. First-half adjusted
net income of €881 million was significantly higher, surpassing the prior-year figure by 46 percent. As promised, at the halfway mark
we already almost made up for our extraordinarily weak first quarter, which was affected by a number of seasonal factors. We can
therefore reaffirm our forecast for full-year 2017: we expect to post adjusted EBIT of €2.8 to €3.1 billion and adjusted net income of
€1.2 to €1.45 billion.
We brought the reorganization of the responsibility for nuclear-waste disposal in Germany to a successful conclusion as planned.
For this purpose, in early July we paid, as planned, roughly €10 billion into Germany’s public fund to finance nuclear-waste disposal.
In return, E.ON is no longer liable for the intermediate and final storage of nuclear waste. That’s very good news, particularly for you,
our shareholders. Because it means that E.ON is now released from these perpetual liabilities.
We’re moving toward our objective of restrengthening your company’s balance sheet faster than anticipated. We’ve already reduced
our economic net debt significantly from €26.3 billion at year-end 2016 to €21.5 billion at June 30, 2017. In March we successfully
conducted a capital increase of roughly €1.35 billion. In June the German Federal Constitutional Court ruled the nuclear-fuel tax invalid.
The lion’s share of the €2.85 billion in taxes already refunded had a positive impact on our balance sheet. We continue to systematically
implement our debt-reduction plan. It will encompass the sale of our Uniper stake and the transfer our Nord Stream stake into our
pension fund. Other items include cost savings on the dismantling of nuclear power stations and the disposal of non-core assets.
This will result in some more good news for you: the successful reduction of our debt gives us the flexibility to increase our dividend
payout. Beginning with the dividend for the 2018 financial year, we intend to raise our payout ratio from the current 50 to 60 percent
to a minimum of 65 percent. The Supervisory Board approved the Management Board’s proposal for the increase. We’ll present our
new dividend policy in greater detail at the time we release our results for 2017. We’re aiming for a dividend policy that’s on par with
our competitors and for dividend growth in absolute terms.
At the same time, we have the financial flexibility to invest in new growth. At the time we release our 2017 results, we’ll announce
how we intend to make use of this flexibility.
For your company’s continued success it’s pivotal that we satisfy our customers, capture market share, and achieve profitable growth
with our palette of solutions. We made significant progress in these areas as well. We launched new products for residential customers,
such as the Aura energy-storage system for owners of solar arrays and the SolarCloud, which enables customers to store their surplus
solar power in a virtual account and use it later at any time. It’s particularly pleasing that the demand for E.ON solar solutions has
increased sixfold in one year. We also achieved substantial growth in our B2B business, whose order volume has grown dramatically.
We expect this business to double in 2017 relative to 2016. Multinational companies from a variety of industries—Procter & Gamble,
Dow Chemical, Britvic, DS Smith, Pilkington, and Goodyear—have recently opted for solutions from E.ON. These new products and
services strengthen your new E.ON’s earnings profile.
I hope this gives you an idea of how hard we worked in the first half of 2017 to continue implementing our new strategy. We
strengthened our balance sheet and sharply reduced our debt. Our operating business is performing well. We’re moving forward
systemically and agilely in the second half of the year as well. Moreover, we have the flexibility for disciplined, sustainable growth.
Our objective for you is clear: we intend to make your E.ON an even more attractive investment.
Best wishes,
Dr. Johannes Teyssen
5Interim Report II/2017E.ON Stock
140
130
120
110
100
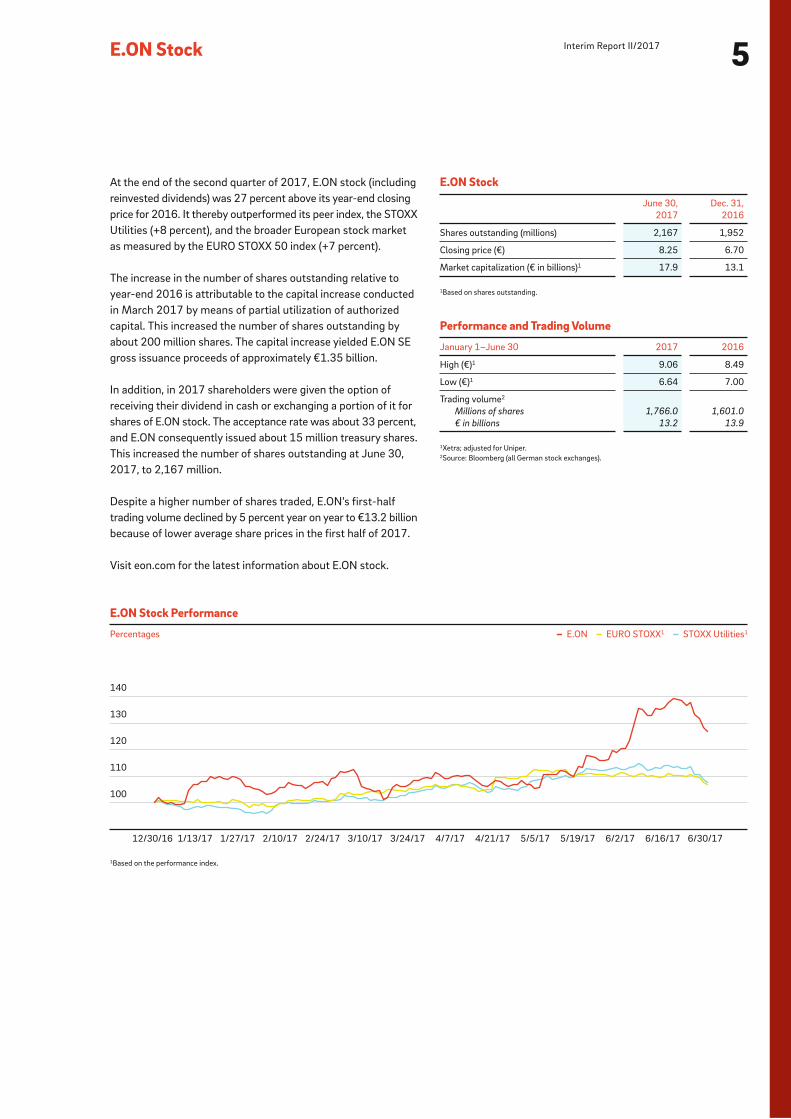
E.ON Stock Performance
Percentages – E.ON – EURO STOXX1 – STOXX Utilities1
1Based on the performance index.
12/30/16 1/13/17 1/27/17 2/10/17 2/24/17 3/10/17 3/24/17 4/7/17 4/21/17 5/5/17 5/19/17 6/2/17 6/16/17 6/30/17
At the end of the second quarter of 2017, E.ON stock (including
reinvested dividends) was 27 percent above its year-end closing
price for 2016. It thereby outperformed its peer index, the STOXX
Utilities (+8 percent), and the broader European stock market
as measured by the EURO STOXX 50 index (+7 percent).
The increase in the number of shares outstanding relative to
year-end 2016 is attributable to the capital increase conducted
in March 2017 by means of partial utilization of authorized
capital. This increased the number of shares outstanding by
about 200 million shares. The capital increase yielded E.ON SE
gross issuance proceeds of approximately €1.35 billion.
In addition, in 2017 shareholders were given the option of
receiving their dividend in cash or exchanging a portion of it for
shares of E.ON stock. The acceptance rate was about 33 percent,
and E.ON consequently issued about 15 million treasury shares.
This increased the number of shares outstanding at June 30,
2017, to 2,167 million.
Despite a higher number of shares traded, E.ON’s first-half
trading volume declined by 5 percent year on year to €13.2 billion
because of lower average share prices in the first half of 2017.
Visit eon.com for the latest information about E.ON stock.
E.ON Stock
June 30,
2017
Dec. 31,
2016
Shares outstanding (millions) 2,167 1,952
Closing price (€) 8.25 6.70
Market capitalization (€ in billions)1 17.9 13.1
1Based on shares outstanding.
Performance and Trading Volume
January 1–June 30 2017 2016
High (€)1 9.06 8.49
Low (€)1 6.64 7.00
Trading volume2
Millions of shares 1,766.0 1,601.0
€ in billions 13.2 13.9
1Xetra; adjusted for Uniper.2Source: Bloomberg (all German stock exchanges).

Interim Group Management Report
January – June 2017
• Dividend payout ratio to increase
• Forecast for full-year adjusted EBIT and adjusted
net income affirmed
• First-half adjusted EBIT down year on year; second-quarter
adjusted EBIT significantly above year-earlier quarter
• First-half adjusted net income considerably above
prior-year level
• Economic net debt debt reduced, balance sheet substantially
strengthened
• Operating cash flow considerably higher due,
among other items, to refund of nuclear-fuel tax
8Interim Group Management Report
across all segments: residential, small and medium-sized enter-
prises, large commercial and industrial, and public entities.
E.ON’s main presence in this business is in Germany, the United
Kingdom, Sweden, Italy, the Czech Republic, Hungary, and
Romania. E.ON Connecting Energies, which provides customers
with turn-key distributed-energy solutions, is also part of this
segment.
RenewablesThis segment consists of Onshore Wind/Solar and Offshore
Wind/Other. We plan, build, operate, and manage renewable
generation assets. We market their output in several ways: in
conjunction with renewable incentive programs, under long-
term electricity supply agreements with key customers, and
directly to the wholesale market.
Non-Core Business This segment consists of our non-strategic operations, the
operation of our nuclear power stations in Germany (which is
managed by our PreussenElektra unit).
Business Report
Industry Environment
Energy Policy and Regulatory Environment On June 30, 2017, the German Bundestag passed the Grid Fee
Modernization Act which lays the legal foundation for trans-
mission grid fees to be standardized nationwide and for changes
to be made in the compensation for avoided grid fees pursuant
to Section 18 of the Electricity Grid Charges Ordinance. The act,
which will be implemented gradually, will yield considerable
savings for our distribution grid customers by 2023.
The German Federal Constitutional Court ruled that the nuclear-
fuel tax was invalid. This entitled E.ON to a tax refund of approxi-
mately €2,850 million. The refund was paid in full in June 2017.
It is recorded as other operating income and as cash provided
by operating activities of continuing operations. Note 3 to the
Condensed Consolidated Interim Financial Statements contains
more information.
Corporate Profile
Business Model
E.ON is an investor-owned energy company. Led by Group
Management in Essen, our operations are segmented into three
operating units: Energy Networks, Customer Solutions, and
Renewables. Our non-strategic operations are reported under
Non-Core Business.
Group ManagementThe main task of Group Management is to lead the E.ON Group.
This involves charting E.ON’s strategic course and managing
and funding its existing business portfolio. Group Management’s
tasks include optimizing E.ON’s overall business across countries
and markets from a financial, strategic, and risk perspective and
conducting stakeholder management.
In view of our new strategy and the Annual Shareholders Meet-
ing’s vote to spin off Uniper, we applied IFRS 5 and reported the
Uniper Group as a discontinued operation in 2016. After the
Control Termination Agreement took effect, Uniper was decon-
solidated effective December 31, 2016, and is recorded in our
Consolidated Financial Statements as an associated company in
accordance with our stake and accounted for using the equity
method. Uniper’s earnings are reported under non-operating
earnings.
Energy NetworksThis segment consists of our power and gas distribution networks
and related activities. It is subdivided into three regional markets:
Germany, Sweden, and East-Central Europe/Turkey (which con-
sists of the Czech Republic, Hungary, Romania, Slovakia, and
Turkey). This segment’s main tasks include operating its power
and gas networks safely and reliably, carrying out any necessary
maintenance and repairs, and expanding its networks, which
frequently involves adding customer connections.
Customer SolutionsThis segment serves as the platform for working with our cus-
tomers to actively shape Europe’s energy transition. This includes
supplying customers in Europe (excluding Turkey) with power,
gas, and heat as well as with products and services that enhance
their energy efficiency and autonomy and provide other benefits.
Our activities are tailored to the individual needs of customers
9Interim Report II/2017
Earnings Situation
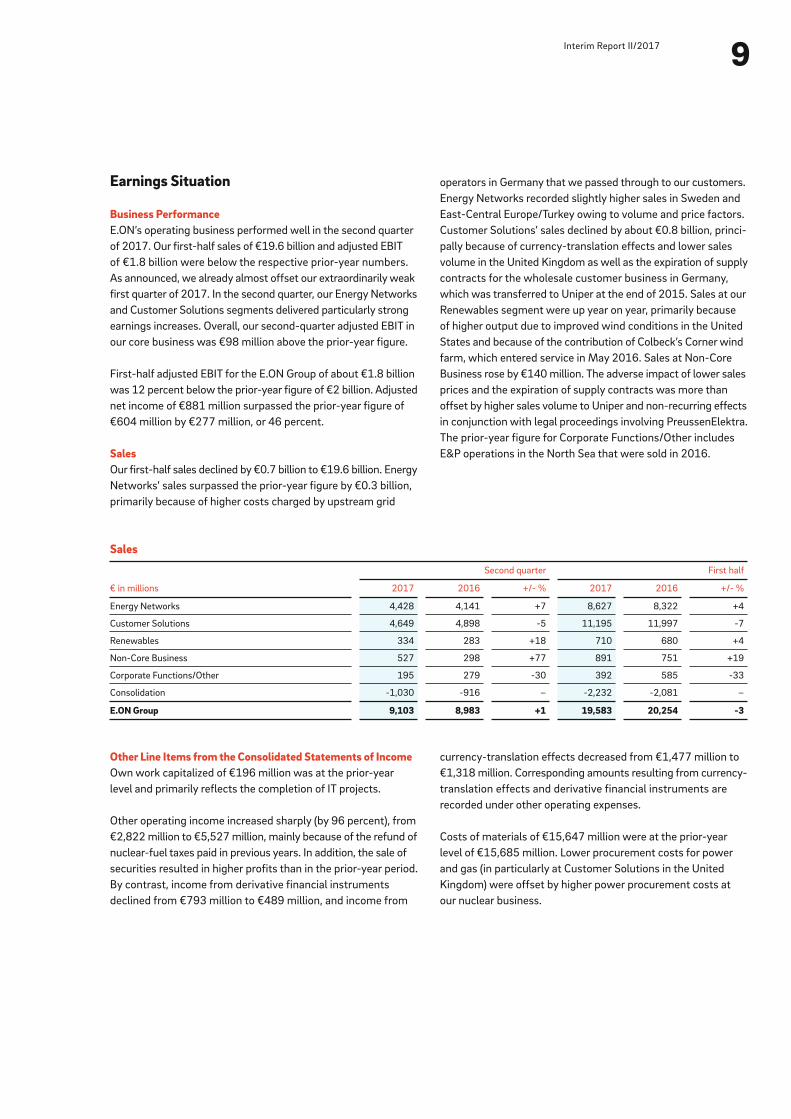
Business PerformanceE.ON’s operating business performed well in the second quarter
of 2017. Our first-half sales of €19.6 billion and adjusted EBIT
of €1.8 billion were below the respective prior-year numbers.
As announced, we already almost offset our extraordinarily weak
first quarter of 2017. In the second quarter, our Energy Networks
and Customer Solutions segments delivered particularly strong
earnings increases. Overall, our second-quarter adjusted EBIT in
our core business was €98 million above the prior-year figure.
First-half adjusted EBIT for the E.ON Group of about €1.8 billion
was 12 percent below the prior-year figure of €2 billion. Adjusted
net income of €881 million surpassed the prior-year figure of
€604 million by €277 million, or 46 percent.
SalesOur first-half sales declined by €0.7 billion to €19.6 billion. Energy
Networks’ sales surpassed the prior-year figure by €0.3 billion,
primarily because of higher costs charged by upstream grid
operators in Germany that we passed through to our customers.
Energy Networks recorded slightly higher sales in Sweden and
East-Central Europe/Turkey owing to volume and price factors.
Customer Solutions’ sales declined by about €0.8 billion, princi-
pally because of currency-translation effects and lower sales
volume in the United Kingdom as well as the expiration of supply
contracts for the wholesale customer business in Germany,
which was transferred to Uniper at the end of 2015. Sales at our
Renewables segment were up year on year, primarily because
of higher output due to improved wind conditions in the United
States and because of the contribution of Colbeck’s Corner wind
farm, which entered service in May 2016. Sales at Non-Core
Business rose by €140 million. The adverse impact of lower sales
prices and the expiration of supply contracts was more than
offset by higher sales volume to Uniper and non-recurring effects
in conjunction with legal proceedings involving PreussenElektra.
The prior-year figure for Corporate Functions/Other includes
E&P operations in the North Sea that were sold in 2016.
Sales
€ in millions
Second quarter First half
2017 2016 +/- % 2017 2016 +/- %
Energy Networks 4,428 4,141 +7 8,627 8,322 +4
Customer Solutions 4,649 4,898 -5 11,195 11,997 -7
Renewables 334 283 +18 710 680 +4
Non-Core Business 527 298 +77 891 751 +19
Corporate Functions/Other 195 279 -30 392 585 -33
Consolidation -1,030 -916 – -2,232 -2,081 –
E.ON Group 9,103 8,983 +1 19,583 20,254 -3
Other Line Items from the Consolidated Statements of IncomeOwn work capitalized of €196 million was at the prior-year
level and primarily reflects the completion of IT projects.
Other operating income increased sharply (by 96 percent), from
€2,822 million to €5,527 million, mainly because of the refund of
nuclear-fuel taxes paid in previous years. In addition, the sale of
securities resulted in higher profits than in the prior-year period.
By contrast, income from derivative financial instruments
declined from €793 million to €489 million, and income from
currency-translation effects decreased from €1,477 million to
€1,318 million. Corresponding amounts resulting from currency-
translation effects and derivative financial instruments are
recorded under other operating expenses.
Costs of materials of €15,647 million were at the prior-year
level of €15,685 million. Lower procurement costs for power
and gas (in particularly at Customer Solutions in the United
Kingdom) were offset by higher power procurement costs at
our nuclear business.
10Interim Group Management Report
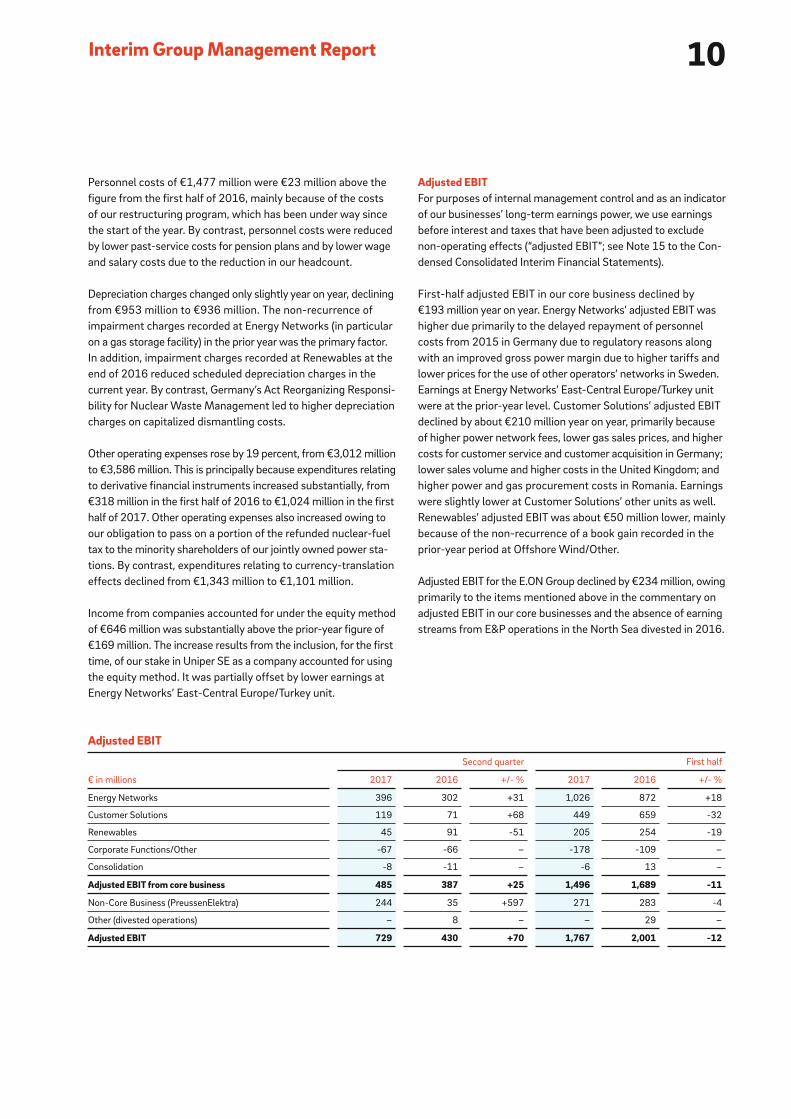
Adjusted EBITFor purposes of internal management control and as an indicator
of our businesses’ long-term earnings power, we use earnings
before interest and taxes that have been adjusted to exclude
non-operating effects (“adjusted EBIT”; see Note 15 to the Con-
densed Consolidated Interim Financial Statements).
First-half adjusted EBIT in our core business declined by
€193 million year on year. Energy Networks’ adjusted EBIT was
higher due primarily to the delayed repayment of personnel
costs from 2015 in Germany due to regulatory reasons along
with an improved gross power margin due to higher tariffs and
lower prices for the use of other operators’ networks in Sweden.
Earnings at Energy Networks’ East-Central Europe/Turkey unit
were at the prior-year level. Customer Solutions’ adjusted EBIT
declined by about €210 million year on year, primarily because
of higher power network fees, lower gas sales prices, and higher
costs for customer service and customer acquisition in Germany;
lower sales volume and higher costs in the United Kingdom; and
higher power and gas procurement costs in Romania. Earnings
were slightly lower at Customer Solutions’ other units as well.
Renewables’ adjusted EBIT was about €50 million lower, mainly
because of the non-recurrence of a book gain recorded in the
prior-year period at Offshore Wind/Other.
Adjusted EBIT for the E.ON Group declined by €234 million, owing
primarily to the items mentioned above in the commentary on
adjusted EBIT in our core businesses and the absence of earning
streams from E&P operations in the North Sea divested in 2016.
Personnel costs of €1,477 million were €23 million above the
figure from the first half of 2016, mainly because of the costs
of our restructuring program, which has been under way since
the start of the year. By contrast, personnel costs were reduced
by lower past-service costs for pension plans and by lower wage
and salary costs due to the reduction in our headcount.
Depreciation charges changed only slightly year on year, declining
from €953 million to €936 million. The non-recurrence of
impairment charges recorded at Energy Networks (in particular
on a gas storage facility) in the prior year was the primary factor.
In addition, impairment charges recorded at Renewables at the
end of 2016 reduced scheduled depreciation charges in the
current year. By contrast, Germany’s Act Reorganizing Responsi-
bility for Nuclear Waste Management led to higher depreciation
charges on capitalized dismantling costs.
Other operating expenses rose by 19 percent, from €3,012 million
to €3,586 million. This is principally because expenditures relating
to derivative financial instruments increased substantially, from
€318 million in the first half of 2016 to €1,024 million in the first
half of 2017. Other operating expenses also increased owing to
our obligation to pass on a portion of the refunded nuclear-fuel
tax to the minority shareholders of our jointly owned power sta-
tions. By contrast, expenditures relating to currency-translation
effects declined from €1,343 million to €1,101 million.
Income from companies accounted for under the equity method
of €646 million was substantially above the prior-year figure of
€169 million. The increase results from the inclusion, for the first
time, of our stake in Uniper SE as a company accounted for using
the equity method. It was partially offset by lower earnings at
Energy Networks’ East-Central Europe/Turkey unit.
Adjusted EBIT
€ in millions
Second quarter First half
2017 2016 +/- % 2017 2016 +/- %
Energy Networks 396 302 +31 1,026 872 +18
Customer Solutions 119 71 +68 449 659 -32
Renewables 45 91 -51 205 254 -19
Corporate Functions/Other -67 -66 – -178 -109 –
Consolidation -8 -11 – -6 13 –
Adjusted EBIT from core business 485 387 +25 1,496 1,689 -11
Non-Core Business (PreussenElektra) 244 35 +597 271 283 -4
Other (divested operations) – 8 – – 29 –
Adjusted EBIT 729 430 +70 1,767 2,001 -12
11Interim Report II/2017
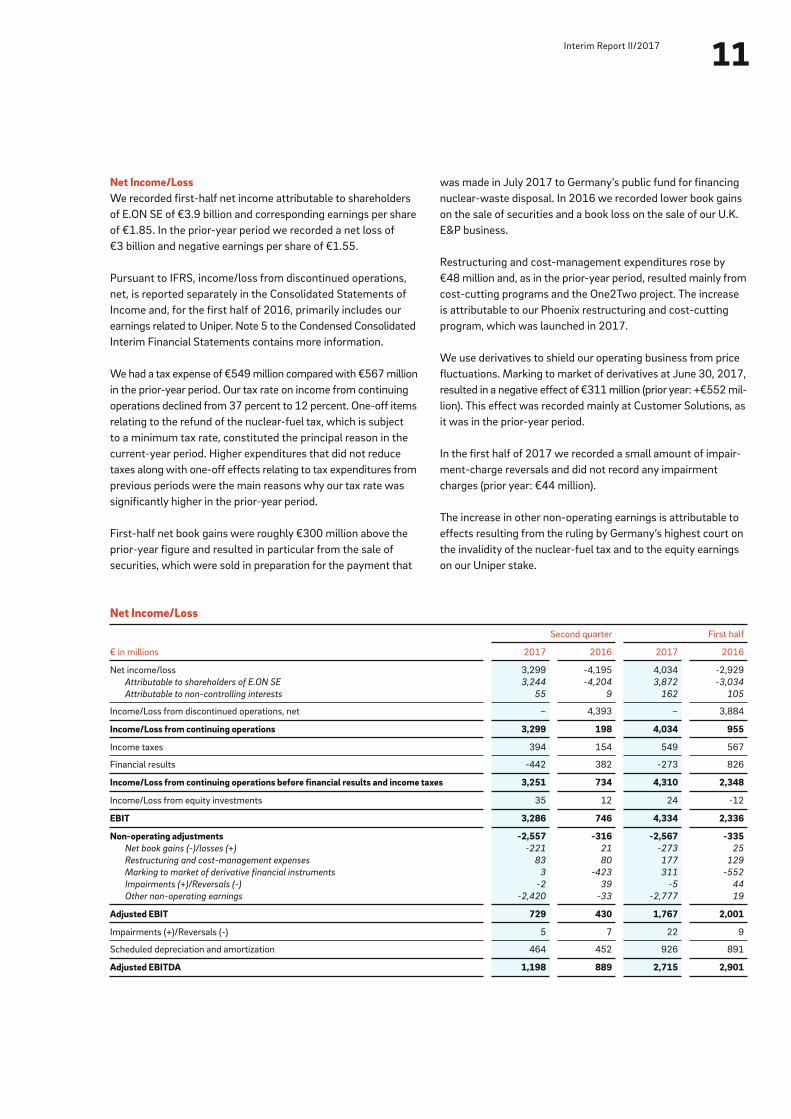
Net Income/LossWe recorded first-half net income attributable to shareholders
of E.ON SE of €3.9 billion and corresponding earnings per share
of €1.85. In the prior-year period we recorded a net loss of
€3 billion and negative earnings per share of €1.55.
Pursuant to IFRS, income/loss from discontinued operations,
net, is reported separately in the Consolidated Statements of
Income and, for the first half of 2016, primarily includes our
earnings related to Uniper. Note 5 to the Condensed Consolidated
Interim Financial Statements contains more information.
We had a tax expense of €549 million compared with €567 million
in the prior-year period. Our tax rate on income from continuing
operations declined from 37 percent to 12 percent. One-off items
relating to the refund of the nuclear-fuel tax, which is subject
to a minimum tax rate, constituted the principal reason in the
current-year period. Higher expenditures that did not reduce
taxes along with one-off effects relating to tax expenditures from
previous periods were the main reasons why our tax rate was
significantly higher in the prior-year period.
First-half net book gains were roughly €300 million above the
prior- year figure and resulted in particular from the sale of
securities, which were sold in preparation for the payment that
was made in July 2017 to Germany’s public fund for financing
nuclear-waste disposal. In 2016 we recorded lower book gains
on the sale of securities and a book loss on the sale of our U.K.
E&P business.
Restructuring and cost-management expenditures rose by
€48 million and, as in the prior-year period, resulted mainly from
cost-cutting programs and the One2Two project. The increase
is attributable to our Phoenix restructuring and cost-cutting
program, which was launched in 2017.
We use derivatives to shield our operating business from price
fluctuations. Marking to market of derivatives at June 30, 2017,
resulted in a negative effect of €311 million (prior year: +€552 mil-
lion). This effect was recorded mainly at Customer Solutions, as
it was in the prior-year period.
In the first half of 2017 we recorded a small amount of impair-
ment-charge reversals and did not record any impairment
charges (prior year: €44 million).
The increase in other non-operating earnings is attributable to
effects resulting from the ruling by Germany’s highest court on
the invalidity of the nuclear-fuel tax and to the equity earnings
on our Uniper stake.
Net Income/Loss
€ in millions
Second quarter First half
2017 2016 2017 2016
Net income/loss 3,299 -4,195 4,034 -2,929
Attributable to shareholders of E.ON SE 3,244 -4,204 3,872 -3,034
Attributable to non-controlling interests 55 9 162 105
Income/Loss from discontinued operations, net – 4,393 – 3,884
Income/Loss from continuing operations 3,299 198 4,034 955
Income taxes 394 154 549 567
Financial results -442 382 -273 826
Income/Loss from continuing operations before financial results and income taxes 3,251 734 4,310 2,348
Income/Loss from equity investments 35 12 24 -12
EBIT 3,286 746 4,334 2,336
Non-operating adjustments -2,557 -316 -2,567 -335Net book gains (-)/losses (+) -221 21 -273 25
Restructuring and cost-management expenses 83 80 177 129
Marking to market of derivative financial instruments 3 -423 311 -552
Impairments (+)/Reversals (-) -2 39 -5 44
Other non-operating earnings -2,420 -33 -2,777 19
Adjusted EBIT 729 430 1,767 2,001
Impairments (+)/Reversals (-) 5 7 22 9
Scheduled depreciation and amortization 464 452 926 891
Adjusted EBITDA 1,198 889 2,715 2,901
12Interim Group Management Report
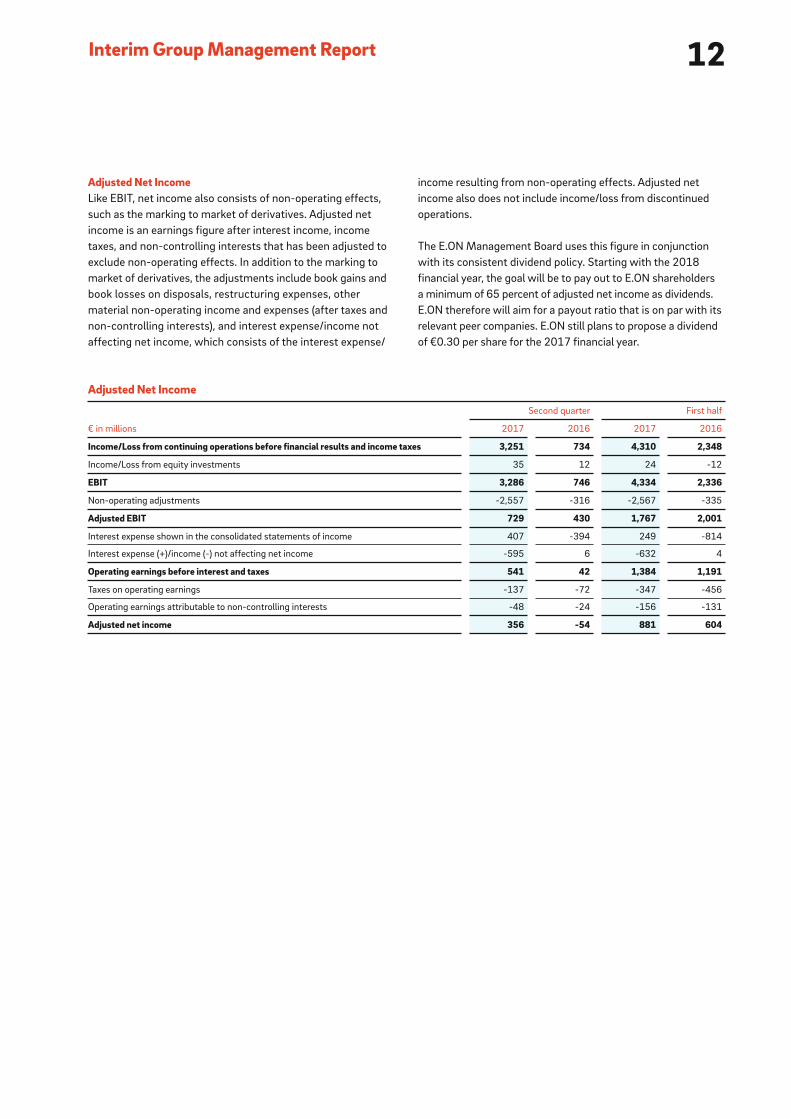
income resulting from non- operating effects. Adjusted net
income also does not include income/loss from discontinued
operations.
The E.ON Management Board uses this figure in conjunction
with its consistent dividend policy. Starting with the 2018
financial year, the goal will be to pay out to E.ON shareholders
a minimum of 65 percent of adjusted net income as dividends.
E.ON therefore will aim for a payout ratio that is on par with its
relevant peer companies. E.ON still plans to propose a dividend
of €0.30 per share for the 2017 financial year.
Adjusted Net IncomeLike EBIT, net income also consists of non-operating effects,
such as the marking to market of derivatives. Adjusted net
income is an earnings figure after interest income, income
taxes, and non- controlling interests that has been adjusted to
exclude non- operating effects. In addition to the marking to
market of derivatives, the adjustments include book gains and
book losses on disposals, restructuring expenses, other
material non-operating income and expenses (after taxes and
non-controlling interests), and interest expense/income not
affecting net income, which consists of the interest expense/
Adjusted Net Income
€ in millions
Second quarter First half
2017 2016 2017 2016
Income/Loss from continuing operations before financial results and income taxes 3,251 734 4,310 2,348
Income/Loss from equity investments 35 12 24 -12
EBIT 3,286 746 4,334 2,336
Non-operating adjustments -2,557 -316 -2,567 -335
Adjusted EBIT 729 430 1,767 2,001
Interest expense shown in the consolidated statements of income 407 -394 249 -814
Interest expense (+)/income (-) not affecting net income -595 6 -632 4
Operating earnings before interest and taxes 541 42 1,384 1,191
Taxes on operating earnings -137 -72 -347 -456
Operating earnings attributable to non-controlling interests -48 -24 -156 -131
Adjusted net income 356 -54 881 604
13Interim Report II/2017
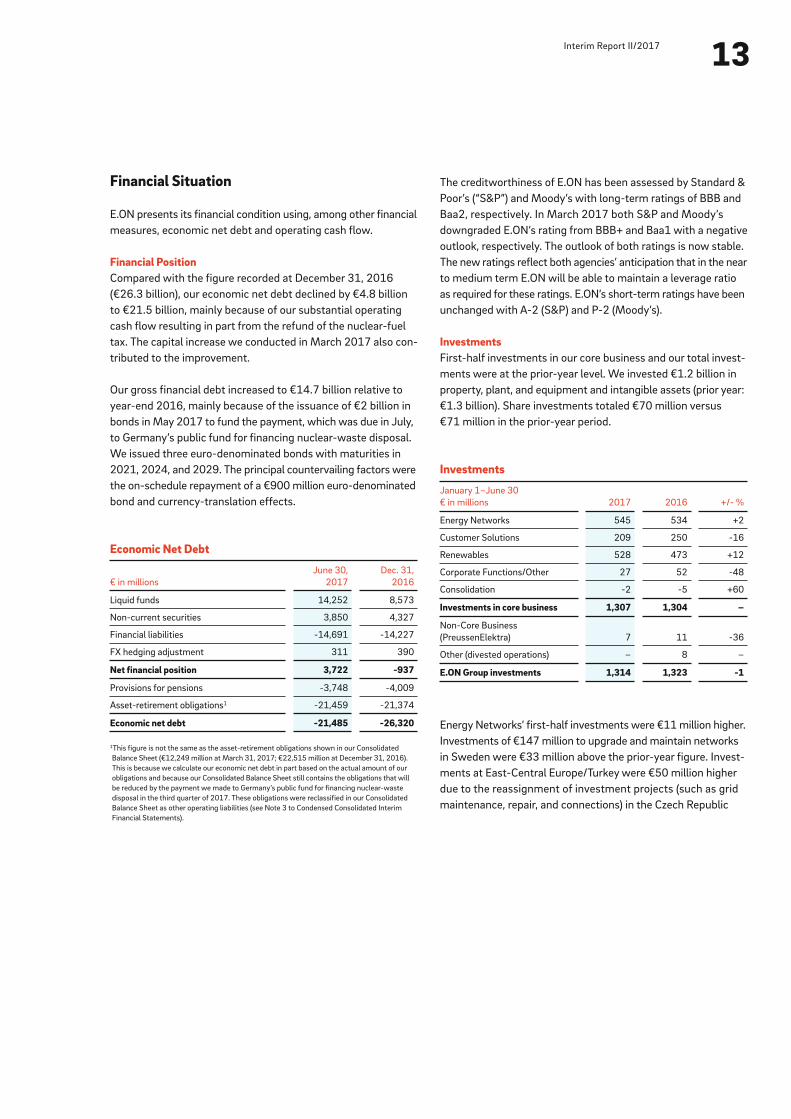
Financial Situation
E.ON presents its financial condition using, among other financial
measures, economic net debt and operating cash flow.
Financial PositionCompared with the figure recorded at December 31, 2016
(€26.3 billion), our economic net debt declined by €4.8 billion
to €21.5 billion, mainly because of our substantial operating
cash flow resulting in part from the refund of the nuclear-fuel
tax. The capital increase we conducted in March 2017 also con-
tributed to the improvement.
Our gross financial debt increased to €14.7 billion relative to
year-end 2016, mainly because of the issuance of €2 billion in
bonds in May 2017 to fund the payment, which was due in July,
to Germany’s public fund for financing nuclear-waste disposal.
We issued three euro-denominated bonds with maturities in
2021, 2024, and 2029. The principal countervailing factors were
the on-schedule repayment of a €900 million euro-denominated
bond and currency-translation effects.
Economic Net Debt
€ in millions
June 30,
2017
Dec. 31,
2016
Liquid funds 14,252 8,573
Non-current securities 3,850 4,327
Financial liabilities -14,691 -14,227
FX hedging adjustment 311 390
Net financial position 3,722 -937
Provisions for pensions -3,748 -4,009
Asset-retirement obligations1 -21,459 -21,374
Economic net debt -21,485 -26,320
1This figure is not the same as the asset-retirement obligations shown in our Consolidated
Balance Sheet (€12,249 million at March 31, 2017; €22,515 million at December 31, 2016).
This is because we calculate our economic net debt in part based on the actual amount of our
obligations and because our Consolidated Balance Sheet still contains the obligations that will
be reduced by the payment we made to Germany’s public fund for financing nuclear-waste
disposal in the third quarter of 2017. These obligations were reclassified in our Consolidated
Balance Sheet as other operating liabilities (see Note 3 to Condensed Consolidated Interim
Financial Statements).
The creditworthiness of E.ON has been assessed by Standard &
Poor’s (“S&P”) and Moody’s with long-term ratings of BBB and
Baa2, respectively. In March 2017 both S&P and Moody’s
downgraded E.ON’s rating from BBB+ and Baa1 with a negative
outlook, respectively. The outlook of both ratings is now stable.
The new ratings reflect both agencies’ anticipation that in the near
to medium term E.ON will be able to maintain a leverage ratio
as required for these ratings. E.ON’s short-term ratings have been
unchanged with A-2 (S&P) and P-2 (Moody’s).
InvestmentsFirst-half investments in our core business and our total invest-
ments were at the prior-year level. We invested €1.2 billion in
property, plant, and equipment and intangible assets (prior year:
€1.3 billion). Share investments totaled €70 million versus
€71 million in the prior-year period.
Energy Networks’ first-half investments were €11 million higher.
Investments of €147 million to upgrade and maintain networks
in Sweden were €33 million above the prior-year figure. Invest-
ments at East-Central Europe/Turkey were €50 million higher
due to the reassignment of investment projects (such as grid
maintenance, repair, and connections) in the Czech Republic
Investments
January 1–June 30
€ in millions 2017 2016 +/- %
Energy Networks 545 534 +2
Customer Solutions 209 250 -16
Renewables 528 473 +12
Corporate Functions/Other 27 52 -48
Consolidation -2 -5 +60
Investments in core business 1,307 1,304 –
Non-Core Business
(PreussenElektra) 7 11 -36
Other (divested operations) – 8 –
E.ON Group investments 1,314 1,323 -1
14Interim Group Management Report
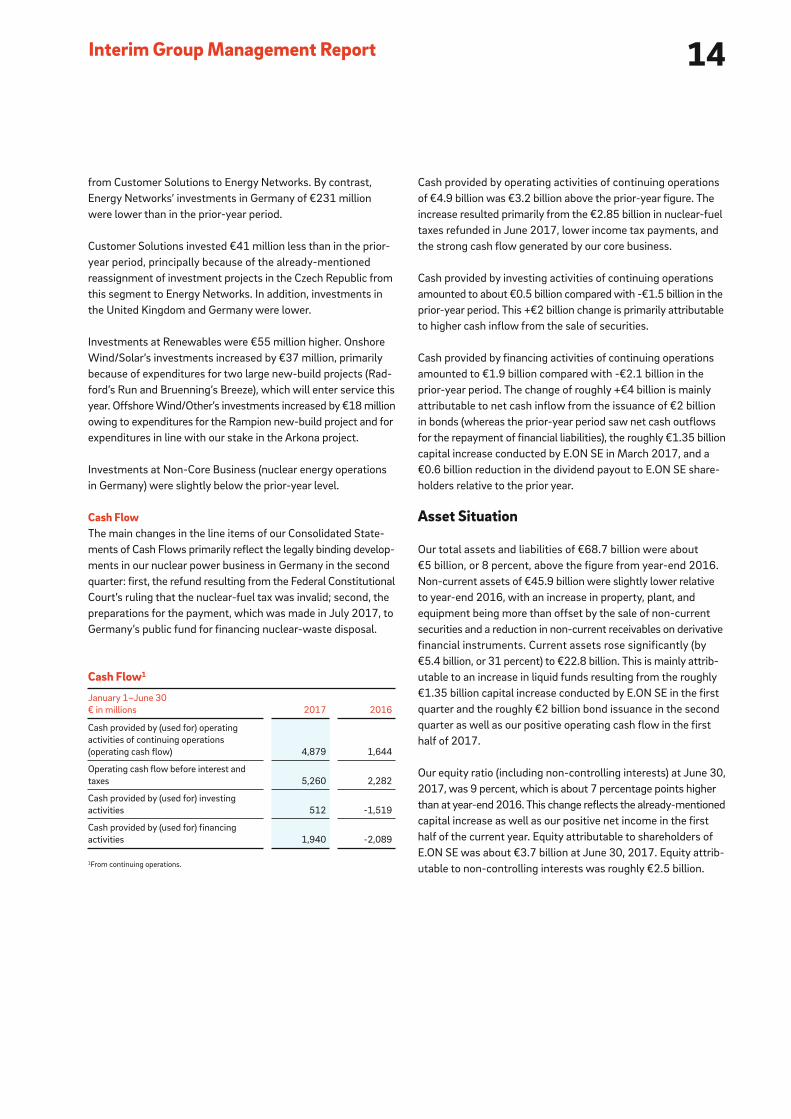
Cash provided by operating activities of continuing operations
of €4.9 billion was €3.2 billion above the prior-year figure. The
increase resulted primarily from the €2.85 billion in nuclear- fuel
taxes refunded in June 2017, lower income tax payments, and
the strong cash flow generated by our core business.
Cash provided by investing activities of continuing operations
amounted to about €0.5 billion compared with -€1.5 billion in the
prior-year period. This +€2 billion change is primarily attributable
to higher cash inflow from the sale of securities.
Cash provided by financing activities of continuing operations
amounted to €1.9 billion compared with -€2.1 billion in the
prior- year period. The change of roughly +€4 billion is mainly
attributable to net cash inflow from the issuance of €2 billion
in bonds (whereas the prior-year period saw net cash outflows
for the repayment of financial liabilities), the roughly €1.35 billion
capital increase conducted by E.ON SE in March 2017, and a
€0.6 billion reduction in the dividend payout to E.ON SE share-
holders relative to the prior year.
Asset Situation
Our total assets and liabilities of €68.7 billion were about
€5 billion, or 8 percent, above the figure from year-end 2016.
Non-current assets of €45.9 billion were slightly lower relative
to year-end 2016, with an increase in property, plant, and
equipment being more than offset by the sale of non-current
securities and a reduction in non-current receivables on derivative
financial instruments. Current assets rose significantly (by
€5.4 billion, or 31 percent) to €22.8 billion. This is mainly attrib-
utable to an increase in liquid funds resulting from the roughly
€1.35 billion capital increase conducted by E.ON SE in the first
quarter and the roughly €2 billion bond issuance in the second
quarter as well as our positive operating cash flow in the first
half of 2017.
Our equity ratio (including non-controlling interests) at June 30,
2017, was 9 percent, which is about 7 percentage points higher
than at year-end 2016. This change reflects the already-mentioned
capital increase as well as our positive net income in the first
half of the current year. Equity attributable to shareholders of
E.ON SE was about €3.7 billion at June 30, 2017. Equity attrib-
utable to non-controlling interests was roughly €2.5 billion.
from Customer Solutions to Energy Networks. By contrast,
Energy Networks’ investments in Germany of €231 million
were lower than in the prior-year period.
Customer Solutions invested €41 million less than in the prior-
year period, principally because of the already-mentioned
reassignment of investment projects in the Czech Republic from
this segment to Energy Networks. In addition, investments in
the United Kingdom and Germany were lower.
Investments at Renewables were €55 million higher. Onshore
Wind/Solar’s investments increased by €37 million, primarily
because of expenditures for two large new-build projects (Rad-
ford’s Run and Bruenning’s Breeze), which will enter service this
year. Offshore Wind/Other’s investments increased by €18 million
owing to expenditures for the Rampion new-build project and for
expenditures in line with our stake in the Arkona project.
Investments at Non-Core Business (nuclear energy operations
in Germany) were slightly below the prior-year level.
Cash FlowThe main changes in the line items of our Consolidated State-
ments of Cash Flows primarily reflect the legally binding develop-
ments in our nuclear power business in Germany in the second
quarter: first, the refund resulting from the Federal Constitutional
Court’s ruling that the nuclear-fuel tax was invalid; second, the
preparations for the payment, which was made in July 2017, to
Germany’s public fund for financing nuclear-waste disposal.
Cash Flow1
January 1–June 30
€ in millions 2017 2016
Cash provided by (used for) operating
activities of continuing operations
(operating cash flow) 4,879 1,644
Operating cash flow before interest and
taxes 5,260 2,282
Cash provided by (used for) investing
activities 512 -1,519
Cash provided by (used for) financing
activities 1,940 -2,089
1From continuing operations.
15Interim Report II/2017
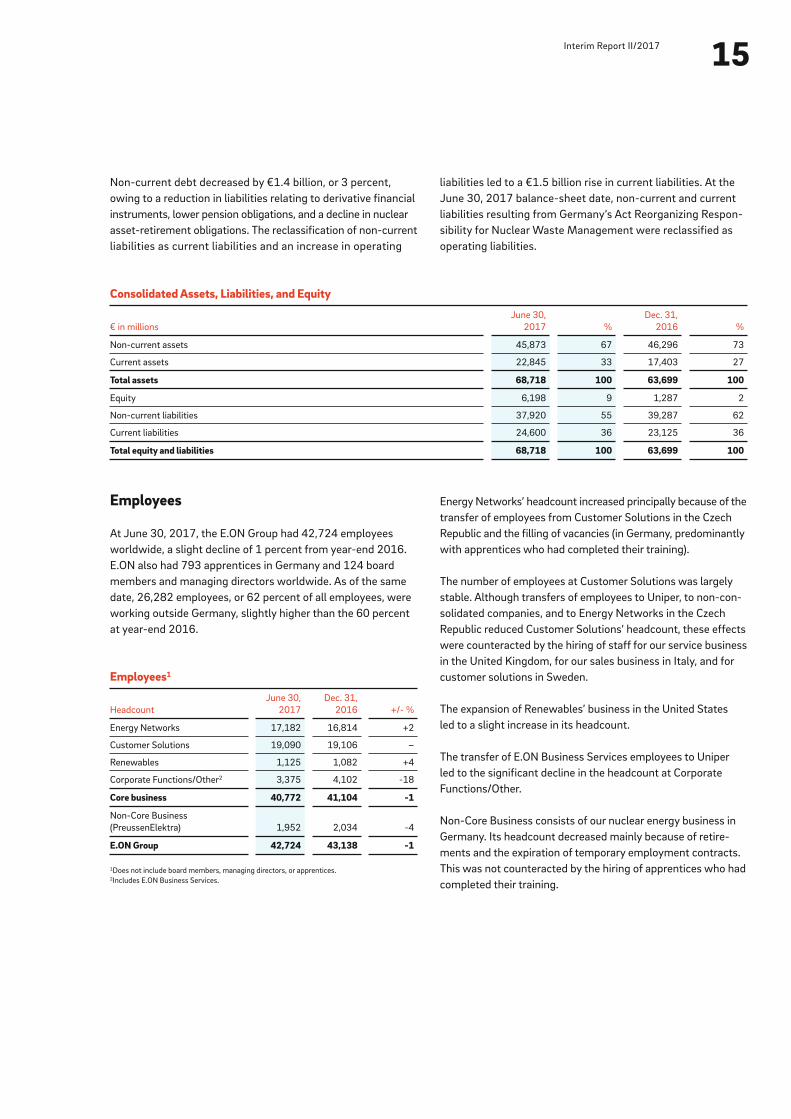
Non-current debt decreased by €1.4 billion, or 3 percent,
owing to a reduction in liabilities relating to derivative financial
instruments, lower pension obligations, and a decline in nuclear
asset-retirement obligations. The reclassification of non-current
liabilities as current liabilities and an increase in operating
liabilities led to a €1.5 billion rise in current liabilities. At the
June 30, 2017 balance-sheet date, non-current and current
liabilities resulting from Germany’s Act Reorganizing Respon-
sibility for Nuclear Waste Management were reclassified as
operating liabilities.
Consolidated Assets, Liabilities, and Equity
€ in millions
June 30,
2017 %
Dec. 31,
2016 %
Non-current assets 45,873 67 46,296 73
Current assets 22,845 33 17,403 27
Total assets 68,718 100 63,699 100
Equity 6,198 9 1,287 2
Non-current liabilities 37,920 55 39,287 62
Current liabilities 24,600 36 23,125 36
Total equity and liabilities 68,718 100 63,699 100
Employees
At June 30, 2017, the E.ON Group had 42,724 employees
worldwide, a slight decline of 1 percent from year-end 2016.
E.ON also had 793 apprentices in Germany and 124 board
members and managing directors worldwide. As of the same
date, 26,282 employees, or 62 percent of all employees, were
working outside Germany, slightly higher than the 60 percent
at year-end 2016.
Employees1
Headcount
June 30,
2017
Dec. 31,
2016 +/- %
Energy Networks 17,182 16,814 +2
Customer Solutions 19,090 19,106 –
Renewables 1,125 1,082 +4
Corporate Functions/Other2 3,375 4,102 -18
Core business 40,772 41,104 -1
Non-Core Business
(PreussenElektra) 1,952 2,034 -4
E.ON Group 42,724 43,138 -1
1Does not include board members, managing directors, or apprentices.2Includes E.ON Business Services.
Energy Networks’ headcount increased principally because of the
transfer of employees from Customer Solutions in the Czech
Republic and the filling of vacancies (in Germany, predominantly
with apprentices who had completed their training).
The number of employees at Customer Solutions was largely
stable. Although transfers of employees to Uniper, to non-con-
solidated companies, and to Energy Networks in the Czech
Republic reduced Customer Solutions’ headcount, these effects
were counteracted by the hiring of staff for our service business
in the United Kingdom, for our sales business in Italy, and for
customer solutions in Sweden.
The expansion of Renewables’ business in the United States
led to a slight increase in its headcount.
The transfer of E.ON Business Services employees to Uniper
led to the significant decline in the headcount at Corporate
Functions/Other.
Non-Core Business consists of our nuclear energy business in
Germany. Its headcount decreased mainly because of retire-
ments and the expiration of temporary employment contracts.
This was not counteracted by the hiring of apprentices who had
completed their training.
16Interim Group Management Report
Forecast Report
Business Environment
Macroeconomic Situation The OECD forecasts a gradual acceleration of global economic
growth in 2017 and 2018. It expects the global economy to
grow by 3.5 percent in 2017 and by 3.6 percent in 2018. The
corresponding figures for the United States are 2.1 percent and
2.4 percent, while weaker growth (1.8 percent and 1.8 percent)
is forecast for the euro zone. The OECD sees substantial political
uncertainty and financial risks. It believes that fiscal initiatives
and structural reforms should lead to stronger growth.
Anticipated Earnings Situation
Forecast Earnings Performance Our forecast for full-year 2017 earnings continues to be sig-
nificantly influenced by the difficult business environment.
Examples include a weaker British pound and the interventionist
remedies proposed by Britain’s Competition and Markets Author-
ity. In addition, the current low-interest-rate environment and
increasingly fierce competition in our core markets are putting
downward pressure on achievable returns.
For our 2017 earnings forecast, we adjusted our internal financial
key figures with respect to the treatment of nuclear asset-retire-
ment obligations. Effects resulting from the valuation of these
provisions at the balance-sheet date are now reported under
non- operating earnings. This change, which improves the
depiction of E.ON’s underlying earnings strength, took effect
on January 1, 2017. In view of the fundamental change in
our business and its structure in 2016, it did not make sense
to adjust the prior- year figures.
We continue to expect the E.ON Group’s 2017 adjusted EBIT
to be between €2.8 and €3.1 billion and its 2017 adjusted net
income to be between €1.2 and €1.45 billion.
Our forecast by segment:
We expect Energy Networks’ 2017 adjusted EBIT to be signifi-
cantly above the prior-year figure. The principal positive factors
in Germany are special regulatory effects such as the delayed
repayment of higher provisions for pensions from 2015 along
with non-recurring items stemming from the conversion to
Germany’s amended incentive-regulation scheme. Germany’s
Grid Fee Modernization Act took effect on July 22, 2017; how-
ever, it will not impact grid fees until 2018, and there will be no
retroactive effect. E.ON grid operators will pass the fees through
and not record them in income. There therefore will not be a one-
off earnings increase in 2017 or the repayment of this increase
in years 2019 to 2021. In addition, improved power tariffs in
Sweden and the Czech Republic will increase earnings. In Hungary
we will benefit from the new regulation period in 2017.
17Interim Report II/2017
We anticipate that Customer Solutions’ adjusted EBIT will be
significantly below the prior-year level. Earnings in Germany
will be lower due primarily to the absence of positive one-off
items recorded in the prior year, lower gas sales price, and higher
costs for customer retention and acquisition. The intervention
of the Competition and Markets Authority and rising costs for
customer acquisition as part of our new marketing strategy will
impact our earnings in the United Kingdom. Earnings there will
also be adversely affected by the planned Brexit and the forecast
development of the British pound. Earnings will be lower in
Romania primarily because of narrower margins in response to
keener competition in the wake of market liberalization.
We expect Renewables’ adjusted EBIT to be at the prior-year level.
Major new-build projects (such as Radford’s Run, Bruenning’s
Breeze, Arkona, and Rampion wind farms) will not enter service
and contribute to earnings until the end of 2017 or in subsequent
years.
We anticipate that adjusted EBIT at Corporate Functions/Other
will be significantly below the prior-year level, primarily because
of the non-recurrence of positive earnings from derivative trans-
actions recorded in 2016.
At Non-Core Business we now expect PreussenElektra’s adjusted
EBIT to be at the prior-year level.
Risk and Chances Report
The Combined Group Management Report contained in our
2016 Annual Report describes in detail our risk management
systems and the measures we take to limit risks.
Risks and Chances
In the normal course of business, we are subject to a number of
risks that are inseparably linked to the operation of our businesses.
The resulting risks and chances are described in detail in the 2016
Combined Group Management Report. These risks remained
essentially unchanged at the end of the first half of 2017.
Management’s Assessment of the Risk Situation
At the end of the first half of 2017 the risk situation of the E.ON
Group’s core operating business had not changed significantly
compared with year-end 2016. However, a number of uncertain-
ties no longer exist: those regarding Germany’s nuclear-fuel tax
and nuclear moratorium (which were eliminated by court rulings),
those regarding the funding and the transfer of the payment
into Germany’s public fund for financing nuclear-waste disposal,
and those regarding the Grid Fee Modernization Act. From today’s
perspective, we do not perceive any risks that could threaten the
existence of the E.ON Group or individual segments.
18Interim Group Management Report
Business Segments
Energy Networks
Below we report on a number of important non-financial key
figures for this segment, such as power and gas passthrough.
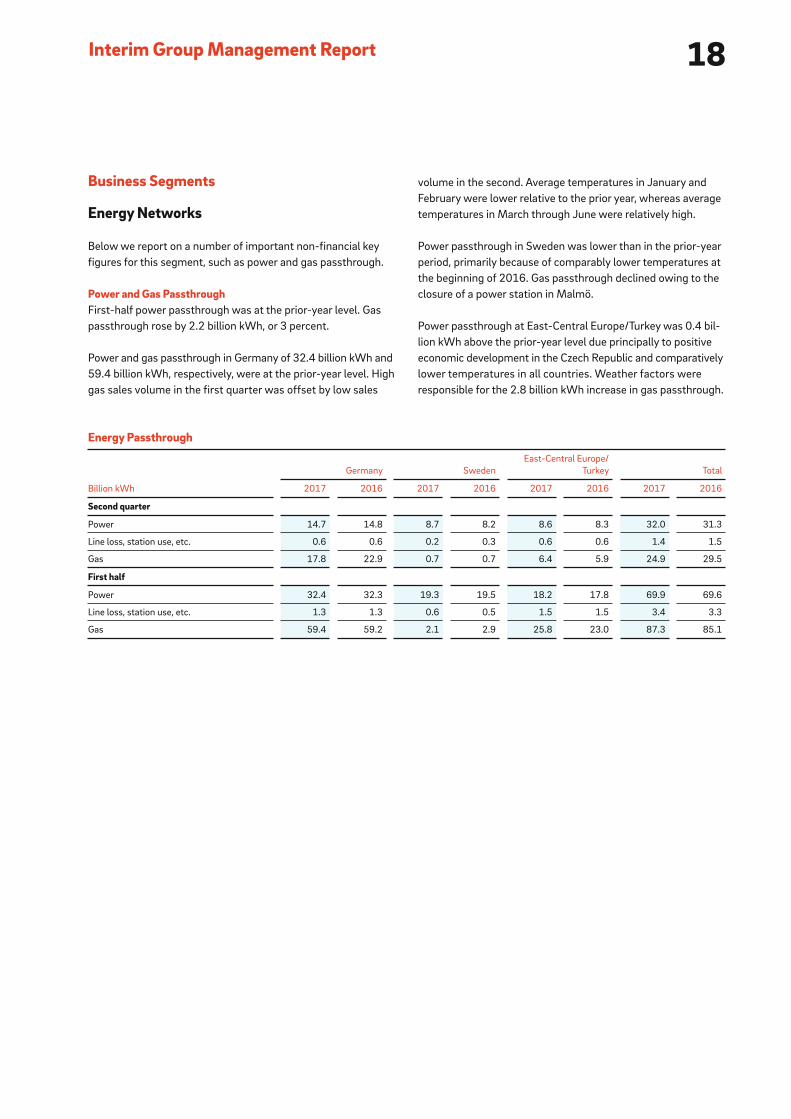
Power and Gas PassthroughFirst-half power passthrough was at the prior-year level. Gas
passthrough rose by 2.2 billion kWh, or 3 percent.
Power and gas passthrough in Germany of 32.4 billion kWh and
59.4 billion kWh, respectively, were at the prior-year level. High
gas sales volume in the first quarter was offset by low sales
volume in the second. Average temperatures in January and
February were lower relative to the prior year, whereas average
temperatures in March through June were relatively high.
Power passthrough in Sweden was lower than in the prior-year
period, primarily because of comparably lower temperatures at
the beginning of 2016. Gas passthrough declined owing to the
closure of a power station in Malmö.
Power passthrough at East-Central Europe/Turkey was 0.4 bil-
lion kWh above the prior-year level due principally to positive
economic development in the Czech Republic and comparatively
lower temperatures in all countries. Weather factors were
responsible for the 2.8 billion kWh increase in gas passthrough.
Energy Passthrough
Billion kWh
Germany Sweden
East-Central Europe/
Turkey Total
2017 2016 2017 2016 2017 2016 2017 2016
Second quarter
Power 14.7 14.8 8.7 8.2 8.6 8.3 32.0 31.3
Line loss, station use, etc. 0.6 0.6 0.2 0.3 0.6 0.6 1.4 1.5
Gas 17.8 22.9 0.7 0.7 6.4 5.9 24.9 29.5
First half
Power 32.4 32.3 19.3 19.5 18.2 17.8 69.9 69.6
Line loss, station use, etc. 1.3 1.3 0.6 0.5 1.5 1.5 3.4 3.3
Gas 59.4 59.2 2.1 2.9 25.8 23.0 87.3 85.1
19Interim Report II/2017
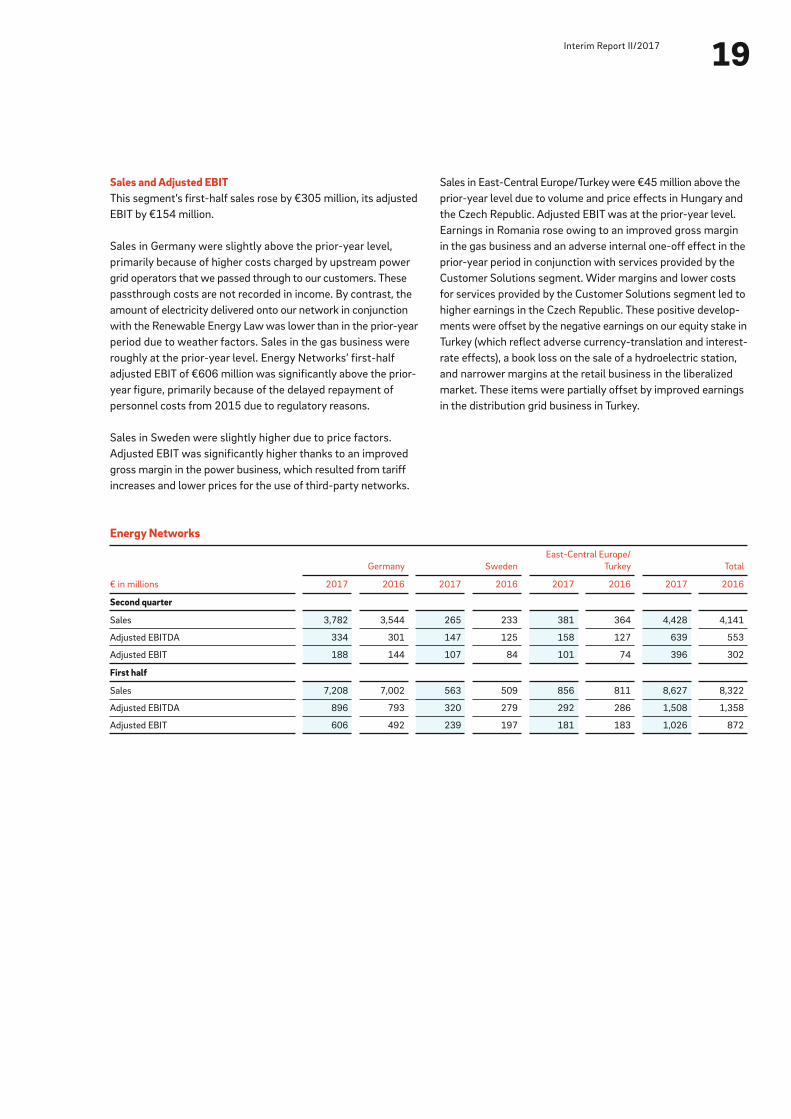
Energy Networks
€ in millions
Germany Sweden
East-Central Europe/
Turkey Total
2017 2016 2017 2016 2017 2016 2017 2016
Second quarter
Sales 3,782 3,544 265 233 381 364 4,428 4,141
Adjusted EBITDA 334 301 147 125 158 127 639 553
Adjusted EBIT 188 144 107 84 101 74 396 302
First half
Sales 7,208 7,002 563 509 856 811 8,627 8,322
Adjusted EBITDA 896 793 320 279 292 286 1,508 1,358
Adjusted EBIT 606 492 239 197 181 183 1,026 872
Sales and Adjusted EBITThis segment’s first-half sales rose by €305 million, its adjusted
EBIT by €154 million.
Sales in Germany were slightly above the prior-year level,
primarily because of higher costs charged by upstream power
grid operators that we passed through to our customers. These
passthrough costs are not recorded in income. By contrast, the
amount of electricity delivered onto our network in conjunction
with the Renewable Energy Law was lower than in the prior-year
period due to weather factors. Sales in the gas business were
roughly at the prior-year level. Energy Networks’ first-half
adjusted EBIT of €606 million was significantly above the prior-
year figure, primarily because of the delayed repayment of
personnel costs from 2015 due to regulatory reasons.
Sales in Sweden were slightly higher due to price factors.
Adjusted EBIT was significantly higher thanks to an improved
gross margin in the power business, which resulted from tariff
increases and lower prices for the use of third-party networks.
Sales in East-Central Europe/Turkey were €45 million above the
prior-year level due to volume and price effects in Hungary and
the Czech Republic. Adjusted EBIT was at the prior-year level.
Earnings in Romania rose owing to an improved gross margin
in the gas business and an adverse internal one-off effect in the
prior-year period in conjunction with services provided by the
Customer Solutions segment. Wider margins and lower costs
for services provided by the Customer Solutions segment led to
higher earnings in the Czech Republic. These positive develop-
ments were offset by the negative earnings on our equity stake in
Turkey (which reflect adverse currency-translation and interest-
rate effects), a book loss on the sale of a hydroelectric station,
and narrower margins at the retail business in the liberalized
market. These items were partially offset by improved earnings
in the distribution grid business in Turkey.
20
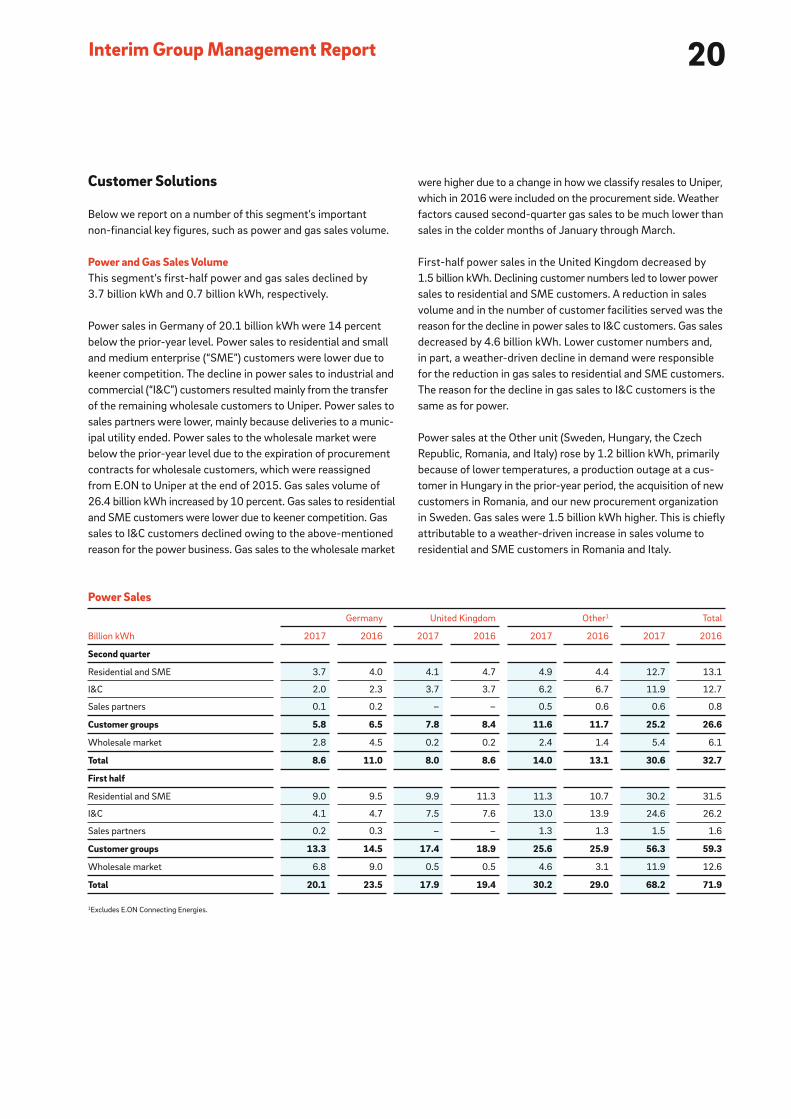
Power Sales
Billion kWh
Germany United Kingdom Other1 Total
2017 2016 2017 2016 2017 2016 2017 2016
Second quarter
Residential and SME 3.7 4.0 4.1 4.7 4.9 4.4 12.7 13.1
I&C 2.0 2.3 3.7 3.7 6.2 6.7 11.9 12.7
Sales partners 0.1 0.2 – – 0.5 0.6 0.6 0.8
Customer groups 5.8 6.5 7.8 8.4 11.6 11.7 25.2 26.6
Wholesale market 2.8 4.5 0.2 0.2 2.4 1.4 5.4 6.1
Total 8.6 11.0 8.0 8.6 14.0 13.1 30.6 32.7
First half
Residential and SME 9.0 9.5 9.9 11.3 11.3 10.7 30.2 31.5
I&C 4.1 4.7 7.5 7.6 13.0 13.9 24.6 26.2
Sales partners 0.2 0.3 – – 1.3 1.3 1.5 1.6
Customer groups 13.3 14.5 17.4 18.9 25.6 25.9 56.3 59.3
Wholesale market 6.8 9.0 0.5 0.5 4.6 3.1 11.9 12.6
Total 20.1 23.5 17.9 19.4 30.2 29.0 68.2 71.9
1Excludes E.ON Connecting Energies.
Interim Group Management Report
were higher due to a change in how we classify resales to Uniper,
which in 2016 were included on the procurement side. Weather
factors caused second-quarter gas sales to be much lower than
sales in the colder months of January through March.
First-half power sales in the United Kingdom decreased by
1.5 billion kWh. Declining customer numbers led to lower power
sales to residential and SME customers. A reduction in sales
volume and in the number of customer facilities served was the
reason for the decline in power sales to I&C customers. Gas sales
decreased by 4.6 billion kWh. Lower customer numbers and,
in part, a weather-driven decline in demand were responsible
for the reduction in gas sales to residential and SME customers.
The reason for the decline in gas sales to I&C customers is the
same as for power.
Power sales at the Other unit (Sweden, Hungary, the Czech
Republic, Romania, and Italy) rose by 1.2 billion kWh, primarily
because of lower temperatures, a production outage at a cus-
tomer in Hungary in the prior-year period, the acquisition of new
customers in Romania, and our new procurement organization
in Sweden. Gas sales were 1.5 billion kWh higher. This is chiefly
attributable to a weather-driven increase in sales volume to
residential and SME customers in Romania and Italy.
Customer Solutions
Below we report on a number of this segment’s important
non-financial key figures, such as power and gas sales volume.
Power and Gas Sales VolumeThis segment’s first-half power and gas sales declined by
3.7 billion kWh and 0.7 billion kWh, respectively.
Power sales in Germany of 20.1 billion kWh were 14 percent
below the prior-year level. Power sales to residential and small
and medium enterprise (“SME”) customers were lower due to
keener competition. The decline in power sales to industrial and
commercial (“I&C”) customers resulted mainly from the transfer
of the remaining wholesale customers to Uniper. Power sales to
sales partners were lower, mainly because deliveries to a munic-
ipal utility ended. Power sales to the wholesale market were
below the prior-year level due to the expiration of procurement
contracts for wholesale customers, which were reassigned
from E.ON to Uniper at the end of 2015. Gas sales volume of
26.4 billion kWh increased by 10 percent. Gas sales to residential
and SME customers were lower due to keener competition. Gas
sales to I&C customers declined owing to the above-mentioned
reason for the power business. Gas sales to the wholesale market
21Interim Report II/2017
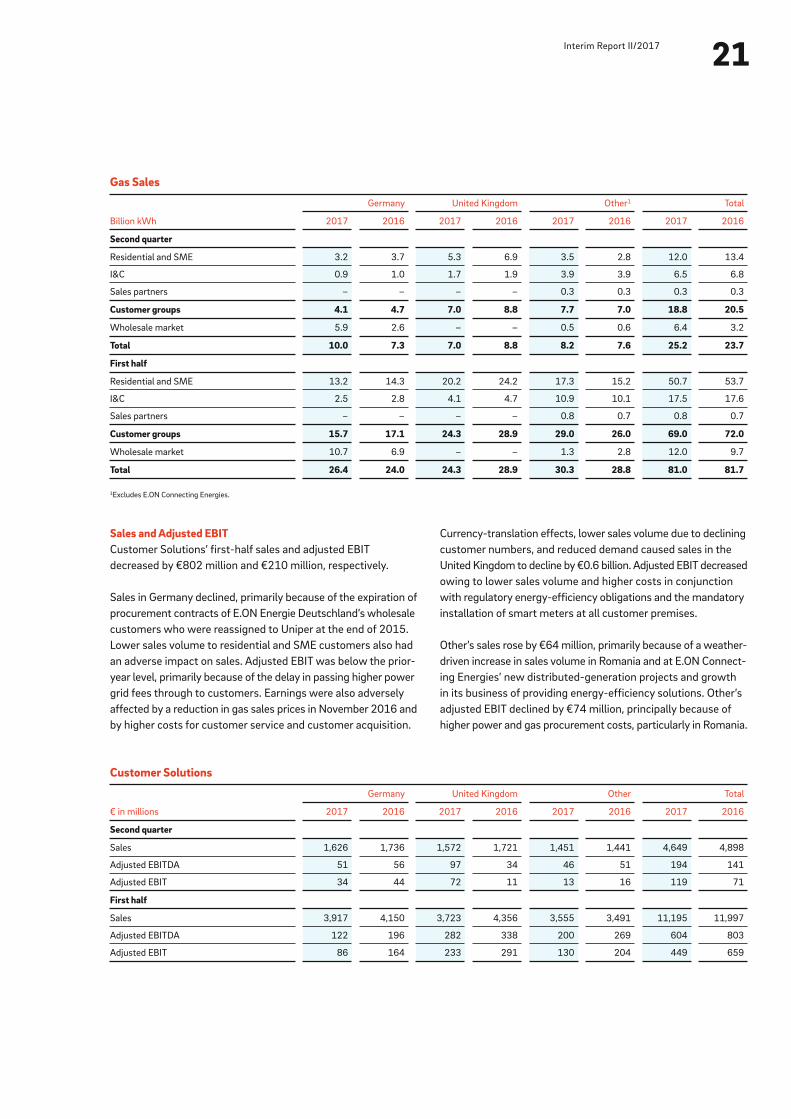
Gas Sales
Billion kWh
Germany United Kingdom Other1 Total
2017 2016 2017 2016 2017 2016 2017 2016
Second quarter
Residential and SME 3.2 3.7 5.3 6.9 3.5 2.8 12.0 13.4
I&C 0.9 1.0 1.7 1.9 3.9 3.9 6.5 6.8
Sales partners – – – – 0.3 0.3 0.3 0.3
Customer groups 4.1 4.7 7.0 8.8 7.7 7.0 18.8 20.5
Wholesale market 5.9 2.6 – – 0.5 0.6 6.4 3.2
Total 10.0 7.3 7.0 8.8 8.2 7.6 25.2 23.7
First half
Residential and SME 13.2 14.3 20.2 24.2 17.3 15.2 50.7 53.7
I&C 2.5 2.8 4.1 4.7 10.9 10.1 17.5 17.6
Sales partners – – – – 0.8 0.7 0.8 0.7
Customer groups 15.7 17.1 24.3 28.9 29.0 26.0 69.0 72.0
Wholesale market 10.7 6.9 – – 1.3 2.8 12.0 9.7
Total 26.4 24.0 24.3 28.9 30.3 28.8 81.0 81.7
1Excludes E.ON Connecting Energies.
Sales and Adjusted EBITCustomer Solutions’ first-half sales and adjusted EBIT
decreased by €802 million and €210 million, respectively.
Sales in Germany declined, primarily because of the expiration of
procurement contracts of E.ON Energie Deutschland’s wholesale
customers who were reassigned to Uniper at the end of 2015.
Lower sales volume to residential and SME customers also had
an adverse impact on sales. Adjusted EBIT was below the prior-
year level, primarily because of the delay in passing higher power
grid fees through to customers. Earnings were also adversely
affected by a reduction in gas sales prices in November 2016 and
by higher costs for customer service and customer acquisition.
Currency-translation effects, lower sales volume due to declining
customer numbers, and reduced demand caused sales in the
United Kingdom to decline by €0.6 billion. Adjusted EBIT decreased
owing to lower sales volume and higher costs in conjunction
with regulatory energy-efficiency obligations and the mandatory
installation of smart meters at all customer premises.
Other’s sales rose by €64 million, primarily because of a weather-
driven increase in sales volume in Romania and at E.ON Connect-
ing Energies’ new distributed-generation projects and growth
in its business of providing energy-efficiency solutions. Other’s
adjusted EBIT declined by €74 million, principally because of
higher power and gas procurement costs, particularly in Romania.
Customer Solutions
€ in millions
Germany United Kingdom Other Total
2017 2016 2017 2016 2017 2016 2017 2016
Second quarter
Sales 1,626 1,736 1,572 1,721 1,451 1,441 4,649 4,898
Adjusted EBITDA 51 56 97 34 46 51 194 141
Adjusted EBIT 34 44 72 11 13 16 119 71
First half
Sales 3,917 4,150 3,723 4,356 3,555 3,491 11,195 11,997
Adjusted EBITDA 122 196 282 338 200 269 604 803
Adjusted EBIT 86 164 233 291 130 204 449 659
22Interim Group Management Report
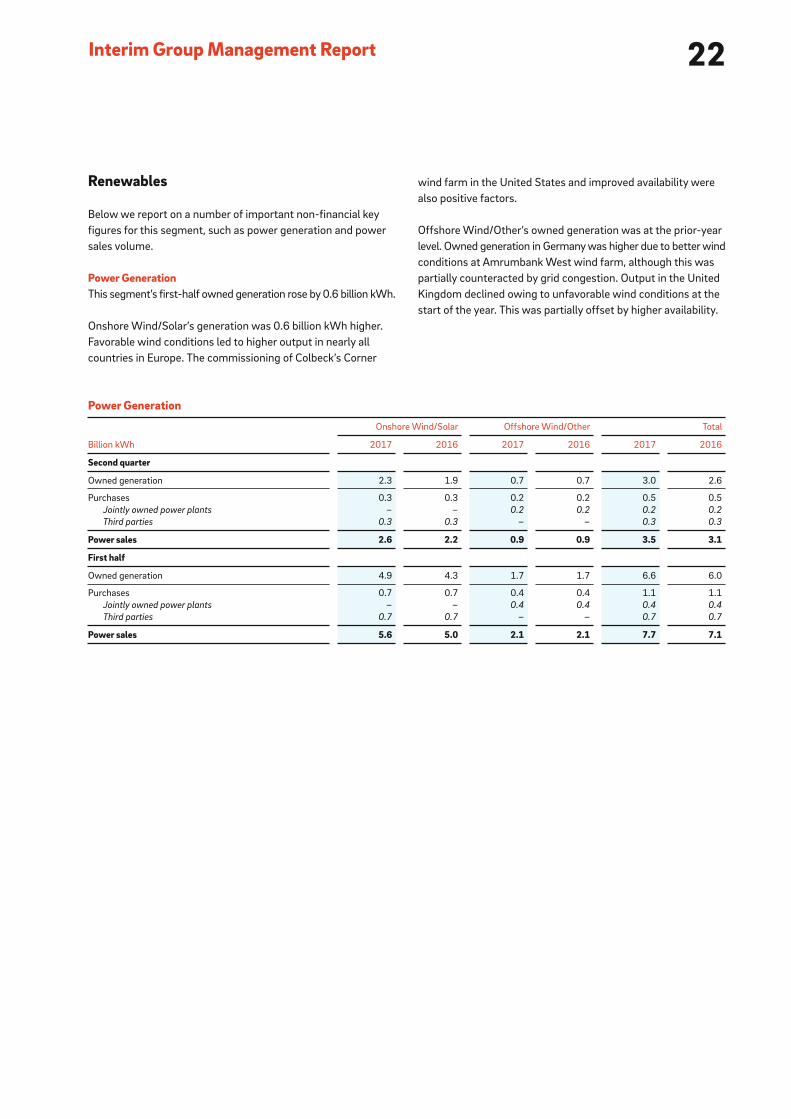
wind farm in the United States and improved availability were
also positive factors.
Offshore Wind/Other’s owned generation was at the prior-year
level. Owned generation in Germany was higher due to better wind
conditions at Amrumbank West wind farm, although this was
partially counteracted by grid congestion. Output in the United
Kingdom declined owing to unfavorable wind conditions at the
start of the year. This was partially offset by higher availability.
Renewables
Below we report on a number of important non-financial key
figures for this segment, such as power generation and power
sales volume.
Power GenerationThis segment’s first-half owned generation rose by 0.6 billion kWh.
Onshore Wind/Solar’s generation was 0.6 billion kWh higher.
Favorable wind conditions led to higher output in nearly all
countries in Europe. The commissioning of Colbeck’s Corner
Power Generation
Billion kWh
Onshore Wind/Solar Offshore Wind/Other Total
2017 2016 2017 2016 2017 2016
Second quarter
Owned generation 2.3 1.9 0.7 0.7 3.0 2.6
Purchases 0.3 0.3 0.2 0.2 0.5 0.5
Jointly owned power plants – – 0.2 0.2 0.2 0.2
Third parties 0.3 0.3 – – 0.3 0.3
Power sales 2.6 2.2 0.9 0.9 3.5 3.1
First half
Owned generation 4.9 4.3 1.7 1.7 6.6 6.0
Purchases 0.7 0.7 0.4 0.4 1.1 1.1
Jointly owned power plants – – 0.4 0.4 0.4 0.4
Third parties 0.7 0.7 – – 0.7 0.7
Power sales 5.6 5.0 2.1 2.1 7.7 7.1
23Interim Report II/2017
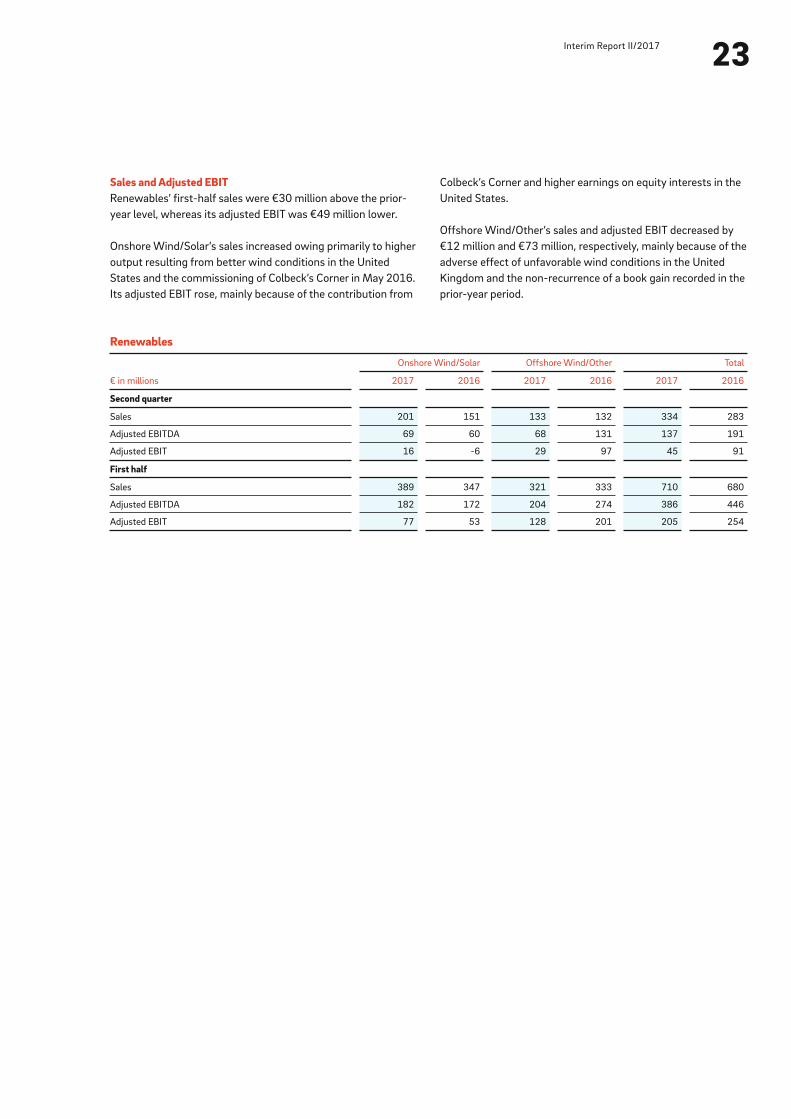
Colbeck’s Corner and higher earnings on equity interests in the
United States.
Offshore Wind/Other’s sales and adjusted EBIT decreased by
€12 million and €73 million, respectively, mainly because of the
adverse effect of unfavorable wind conditions in the United
Kingdom and the non-recurrence of a book gain recorded in the
prior-year period.
Sales and Adjusted EBITRenewables’ first-half sales were €30 million above the prior-
year level, whereas its adjusted EBIT was €49 million lower.
Onshore Wind/Solar’s sales increased owing primarily to higher
output resulting from better wind conditions in the United
States and the commissioning of Colbeck’s Corner in May 2016.
Its adjusted EBIT rose, mainly because of the contribution from
Renewables
€ in millions
Onshore Wind/Solar Offshore Wind/Other Total
2017 2016 2017 2016 2017 2016
Second quarter
Sales 201 151 133 132 334 283
Adjusted EBITDA 69 60 68 131 137 191
Adjusted EBIT 16 -6 29 97 45 91
First half
Sales 389 347 321 333 710 680
Adjusted EBITDA 182 172 204 274 386 446
Adjusted EBIT 77 53 128 201 205 254
24Interim Group Management Report
Non-Core Business
Below we report on a number of important non-financial key
figures for this segment, such as power generation and power
procurement.
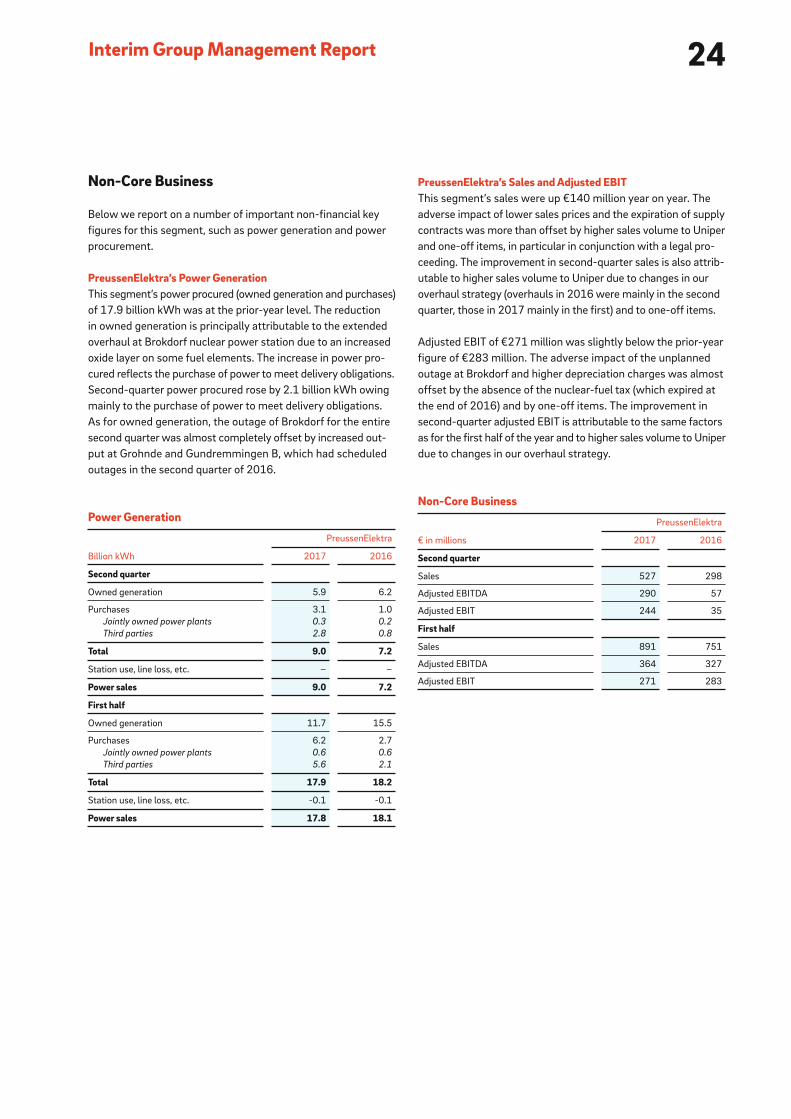
PreussenElektra’s Power Generation This segment’s power procured (owned generation and purchases)
of 17.9 billion kWh was at the prior-year level. The reduction
in owned generation is principally attributable to the extended
overhaul at Brokdorf nuclear power station due to an increased
oxide layer on some fuel elements. The increase in power pro-
cured reflects the purchase of power to meet delivery obligations.
Second-quarter power procured rose by 2.1 billion kWh owing
mainly to the purchase of power to meet delivery obligations.
As for owned generation, the outage of Brokdorf for the entire
second quarter was almost completely offset by increased out-
put at Grohnde and Gundremmingen B, which had scheduled
outages in the second quarter of 2016.
Power Generation
Billion kWh
PreussenElektra
2017 2016
Second quarter
Owned generation 5.9 6.2
Purchases 3.1 1.0
Jointly owned power plants 0.3 0.2
Third parties 2.8 0.8
Total 9.0 7.2
Station use, line loss, etc. – –
Power sales 9.0 7.2
First half
Owned generation 11.7 15.5
Purchases 6.2 2.7
Jointly owned power plants 0.6 0.6
Third parties 5.6 2.1
Total 17.9 18.2
Station use, line loss, etc. -0.1 -0.1
Power sales 17.8 18.1
PreussenElektra’s Sales and Adjusted EBITThis segment’s sales were up €140 million year on year. The
adverse impact of lower sales prices and the expiration of supply
contracts was more than offset by higher sales volume to Uniper
and one-off items, in particular in conjunction with a legal pro-
ceeding. The improvement in second-quarter sales is also attrib-
utable to higher sales volume to Uniper due to changes in our
overhaul strategy (overhauls in 2016 were mainly in the second
quarter, those in 2017 mainly in the first) and to one-off items.
Adjusted EBIT of €271 million was slightly below the prior-year
figure of €283 million. The adverse impact of the unplanned
outage at Brokdorf and higher depreciation charges was almost
offset by the absence of the nuclear-fuel tax (which expired at
the end of 2016) and by one-off items. The improvement in
second-quarter adjusted EBIT is attributable to the same factors
as for the first half of the year and to higher sales volume to Uniper
due to changes in our overhaul strategy.
Non-Core Business
€ in millions
PreussenElektra
2017 2016
Second quarter
Sales 527 298
Adjusted EBITDA 290 57
Adjusted EBIT 244 35
First half
Sales 891 751
Adjusted EBITDA 364 327
Adjusted EBIT 271 283
25Interim Report II/2017Review Report
Based on our review, no matters have come to our attention
that cause us to presume that the condensed consolidated
interim financial statements have not been prepared, in all mate-
rial respects, in accordance with the IFRS applicable to interim
financial reporting as adopted by the EU nor that the interim
group management report has not been prepared, in all material
respects, in accordance with the provisions of the German
Securities Trading Act applicable to interim group management
reports.
Düsseldorf, August 8, 2017
PricewaterhouseCoopers GmbH
Wirtschaftsprüfungsgesellschaft
Markus Dittmann Aissata Touré
Wirtschaftsprüfer Wirtschaftsprüferin
(German Public Auditor) (German Public Auditor)
To E.ON SE, Essen
We have reviewed the condensed consolidated interim financial
statements—comprising the balance sheet, income statement,
statement of recognized income and expenses, condensed cash
flows statement, statement of changes in equity and selected
explanatory notes—and the interim group management report of
E.ON SE for the period from January 1 to June 30, 2017, which
are part of the half-year financial report pursuant to § (Article)
37w WpHG (“Wertpapierhandels gesetz”: German Securities
Trading Act). The preparation of the condensed consolidated
interim financial statements in accordance with the IFRS appli-
cable to interim financial reporting as adopted by the EU and of
the interim group management report in accordance with the
provisions of the German Securities Trading Act applicable to
interim group management reports is the responsibility of the
parent Company’s Board of Managing Directors. Our responsi-
bility is to issue a review report on the condensed consolidated
interim financial statements and on the interim group manage-
ment report based on our review.
We conducted our review of the condensed consolidated interim
financial statements and the interim group management report
in accordance with German generally accepted standards for
the review of financial statements promulgated by the Institut
der Wirtschaftsprüfer (Institute of Public Auditors in Germany)
(IDW) and additionally observed the International Standard on
Review Engagements “Review of Interim Financial Information
Performed by the Independent Auditor of the Entity” (ISRE 2410).
Those standards require that we plan and perform the review so
that we can preclude through critical evaluation, with moderate
assurance, that the condensed consolidated interim financial
statements have not been prepared, in all material respects, in
accordance with the IFRS applicable to interim financial reporting
as adopted by the EU and that the interim group management
report has not been prepared, in all material respects, in accor-
dance with the provisions of the German Securities Trading Act
applicable to interim group management reports. A review is
limited primarily to inquiries of company personnel and analytical
procedures and therefore does not provide the assurance attain-
able in a financial statement audit. Since, in accordance with
our engagement, we have not performed a financial statement
audit, we cannot express an audit opinion.

Notes to the Condensed Consolidated Interim Financial Statements

Condensed Consolidated Interim Financial Statements
28Condensed Consolidated Interim Financial Statements
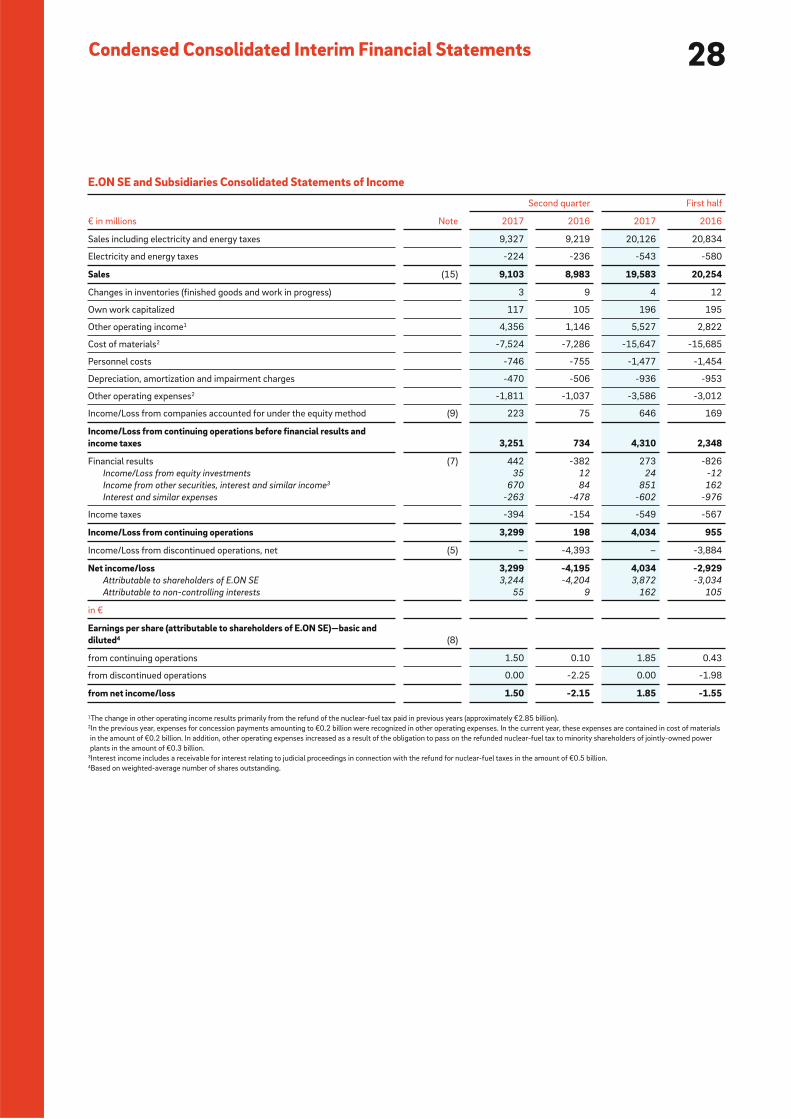
Sales including electricity and energy taxes 9,327 9,219 20,126 20,834
Electricity and energy taxes -224 -236 -543 -580
Sales (15) 9,103 8,983 19,583 20,254
Changes in inventories (finished goods and work in progress) 3 9 4 12
Own work capitalized 117 105 196 195
Other operating income 1 4,356 1,146 5,527 2,822
Cost of materials 2 -7,524 -7,286 -15,647 -15,685
Personnel costs -746 -755 -1,477 -1,454
Depreciation, amortization and impairment charges -470 -506 -936 -953
Other operating expenses 2 -1,811 -1,037 -3,586 -3,012
Income/Loss from companies accounted for under the equity method (9) 223 75 646 169
Income/Loss from continuing operations before financial results and income taxes 3,251 734 4,310 2,348
Financial results (7) 442 -382 273 -826
Income/Loss from equity investments 35 12 24 -12
Income from other securities, interest and similar income 3 670 84 851 162
Interest and similar expenses -263 -478 -602 -976
Income taxes -394 -154 -549 -567
Income/Loss from continuing operations 3,299 198 4,034 955
Income/Loss from discontinued operations, net (5) – -4,393 – -3,884
Net income/loss 3,299 -4,195 4,034 -2,929Attributable to shareholders of E.ON SE 3,244 -4,204 3,872 -3,034
Attributable to non-controlling interests 55 9 162 105
in €
Earnings per share (attributable to shareholders of E.ON SE)—basic and diluted 4 (8)
from continuing operations 1.50 0.10 1.85 0.43
from discontinued operations 0.00 -2.25 0.00 -1.98
from net income/loss 1.50 -2.15 1.85 -1.55
E.ON SE and Subsidiaries Consolidated Statements of Income
€ in millions Note
Second quarter First half
2017 2016 2017 2016
1The change in other operating income results primarily from the refund of the nuclear-fuel tax paid in previous years (approximately €2.85 billion).2In the previous year, expenses for concession payments amounting to €0.2 billion were recognized in other operating expenses. In the current year, these expenses are contained in cost of materials
in the amount of €0.2 billion. In addition, other operating expenses increased as a result of the obligation to pass on the refunded nuclear-fuel tax to minority shareholders of jointly-owned power
plants in the amount of €0.3 billion.3Interest income includes a receivable for interest relating to judicial proceedings in connection with the refund for nuclear-fuel taxes in the amount of €0.5 billion.4Based on weighted-average number of shares outstanding.
29Interim Report II/2017
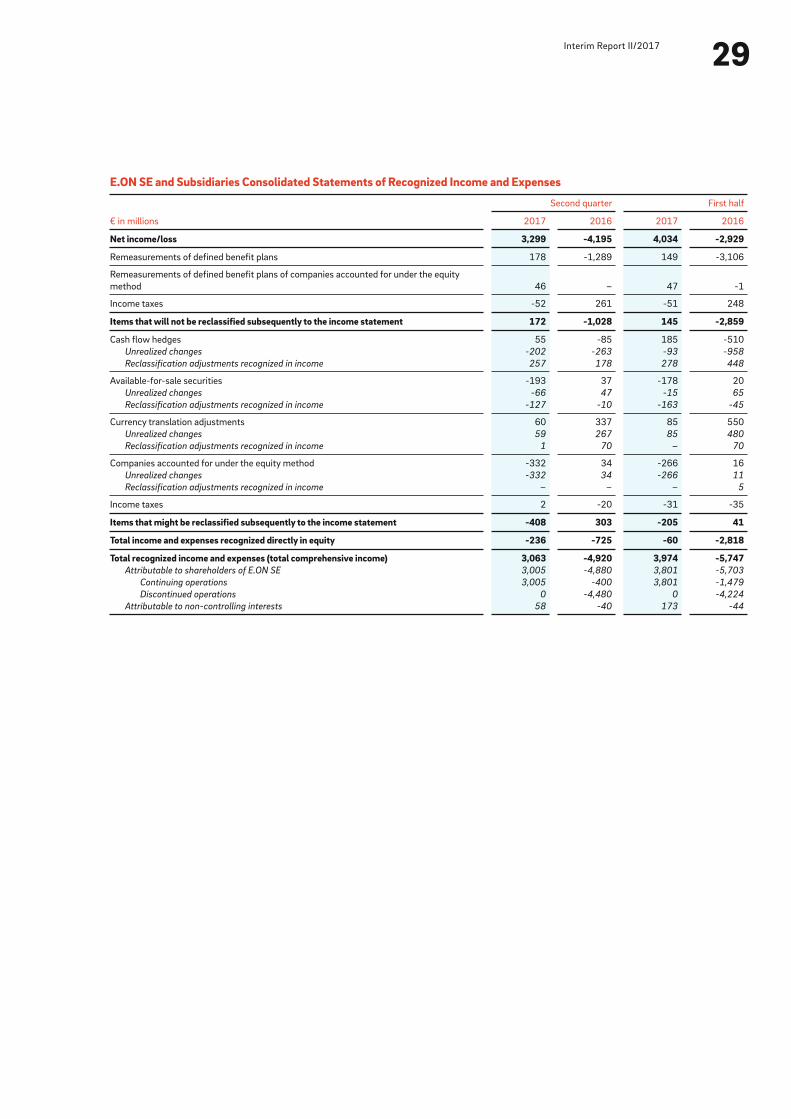
E.ON SE and Subsidiaries Consolidated Statements of Recognized Income and Expenses
Net income/loss 3,299 -4,195 4,034 -2,929
Remeasurements of defined benefit plans 178 -1,289 149 -3,106
Remeasurements of defined benefit plans of companies accounted for under the equity
method 46 – 47 -1
Income taxes -52 261 -51 248
Items that will not be reclassified subsequently to the income statement 172 -1,028 145 -2,859
Cash flow hedges 55 -85 185 -510
Unrealized changes -202 -263 -93 -958
Reclassification adjustments recognized in income 257 178 278 448
Available-for-sale securities -193 37 -178 20
Unrealized changes -66 47 -15 65
Reclassification adjustments recognized in income -127 -10 -163 -45
Currency translation adjustments 60 337 85 550
Unrealized changes 59 267 85 480
Reclassification adjustments recognized in income 1 70 – 70
Companies accounted for under the equity method -332 34 -266 16
Unrealized changes -332 34 -266 11
Reclassification adjustments recognized in income – – – 5
Income taxes 2 -20 -31 -35
Items that might be reclassified subsequently to the income statement -408 303 -205 41
Total income and expenses recognized directly in equity -236 -725 -60 -2,818
Total recognized income and expenses (total comprehensive income) 3,063 -4,920 3,974 -5,747Attributable to shareholders of E.ON SE 3,005 -4,880 3,801 -5,703
Continuing operations 3,005 -400 3,801 -1,479
Discontinued operations 0 -4,480 0 -4,224
Attributable to non-controlling interests 58 -40 173 -44
€ in millions
Second quarter First half
2017 2016 2017 2016
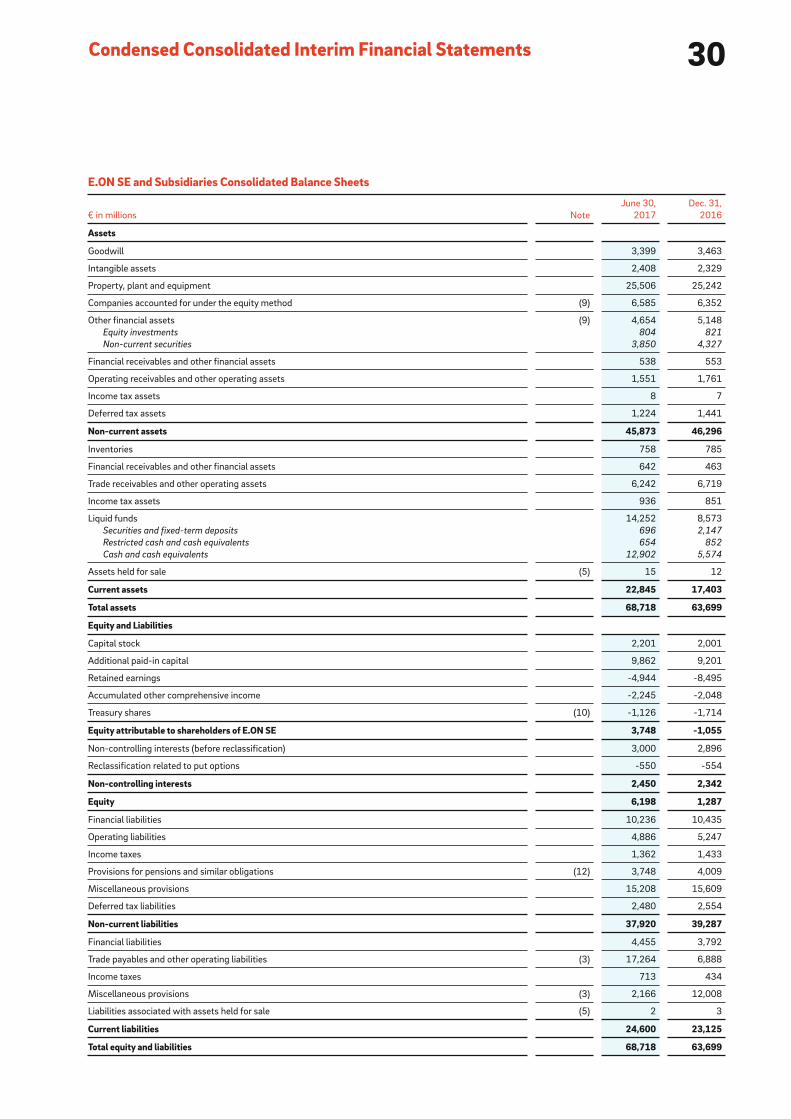
30Condensed Consolidated Interim Financial Statements
Equity and Liabilities
Goodwill 3,399 3,463
Intangible assets 2,408 2,329
Property, plant and equipment 25,506 25,242
Companies accounted for under the equity method (9) 6,585 6,352
Other financial assets (9) 4,654 5,148
Equity investments 804 821
Non-current securities 3,850 4,327
Financial receivables and other financial assets 538 553
Operating receivables and other operating assets 1,551 1,761
Income tax assets 8 7
Deferred tax assets 1,224 1,441
Non-current assets 45,873 46,296
Inventories 758 785
Financial receivables and other financial assets 642 463
Trade receivables and other operating assets 6,242 6,719
Income tax assets 936 851
Liquid funds 14,252 8,573
Securities and fixed-term deposits 696 2,147
Restricted cash and cash equivalents 654 852
Cash and cash equivalents 12,902 5,574
Assets held for sale (5) 15 12
Current assets 22,845 17,403
Total assets 68,718 63,699
Capital stock 2,201 2,001
Additional paid-in capital 9,862 9,201
Retained earnings -4,944 -8,495
Accumulated other comprehensive income -2,245 -2,048
Treasury shares (10) -1,126 -1,714
Equity attributable to shareholders of E.ON SE 3,748 -1,055
Non-controlling interests (before reclassification) 3,000 2,896
Reclassification related to put options -550 -554
Non-controlling interests 2,450 2,342
Equity 6,198 1,287
Financial liabilities 10,236 10,435
Operating liabilities 4,886 5,247
Income taxes 1,362 1,433
Provisions for pensions and similar obligations (12) 3,748 4,009
Miscellaneous provisions 15,208 15,609
Deferred tax liabilities 2,480 2,554
Non-current liabilities 37,920 39,287
Financial liabilities 4,455 3,792
Trade payables and other operating liabilities (3) 17,264 6,888
Income taxes 713 434
Miscellaneous provisions (3) 2,166 12,008
Liabilities associated with assets held for sale (5) 2 3
Current liabilities 24,600 23,125
Total equity and liabilities 68,718 63,699
E.ON SE and Subsidiaries Consolidated Balance Sheets
€ in millions Note
June 30,
2017
Dec. 31,
2016
Assets
31Interim Report II/2017
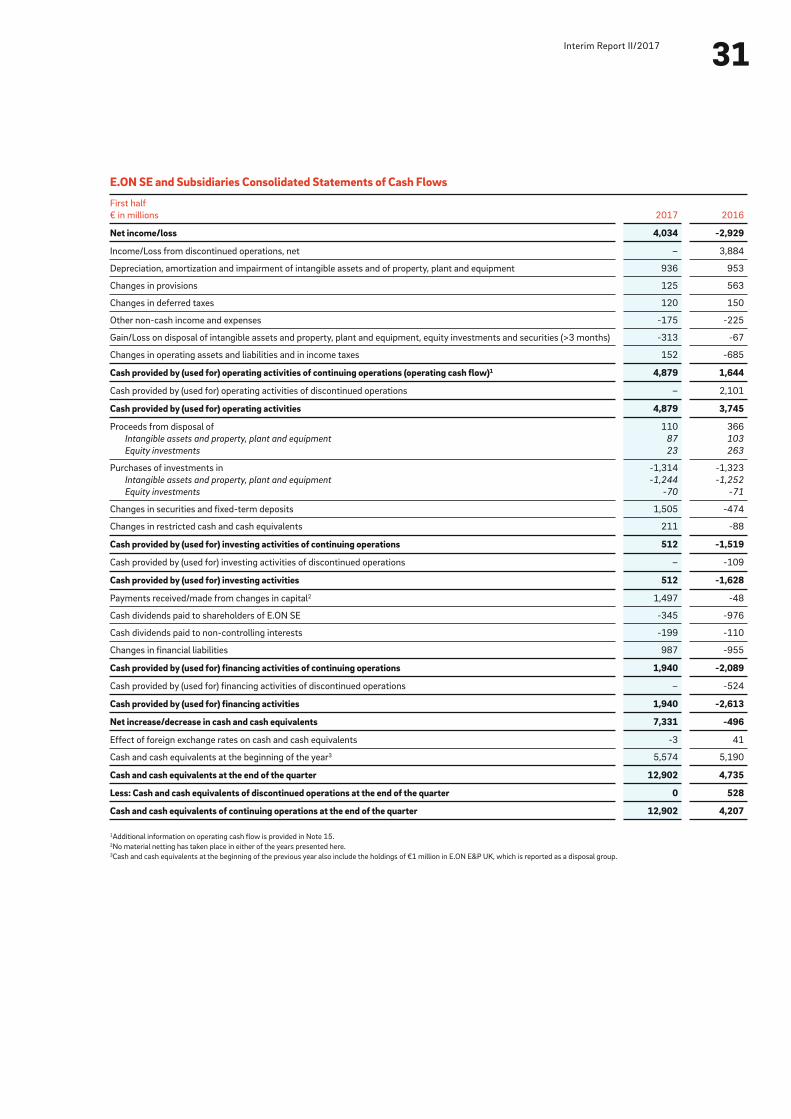
1Additional information on operating cash flow is provided in Note 15.2No material netting has taken place in either of the years presented here.3Cash and cash equivalents at the beginning of the previous year also include the holdings of €1 million in E.ON E&P UK, which is reported as a disposal group.
E.ON SE and Subsidiaries Consolidated Statements of Cash Flows
First half
€ in millions 2017 2016
Net income/loss 4,034 -2,929
Income/Loss from discontinued operations, net – 3,884
Depreciation, amortization and impairment of intangible assets and of property, plant and equipment 936 953
Changes in provisions 125 563
Changes in deferred taxes 120 150
Other non-cash income and expenses -175 -225
Gain/Loss on disposal of intangible assets and property, plant and equipment, equity investments and securities (>3 months) -313 -67
Changes in operating assets and liabilities and in income taxes 152 -685
Cash provided by (used for) operating activities of continuing operations (operating cash flow)1 4,879 1,644
Cash provided by (used for) operating activities of discontinued operations – 2,101
Cash provided by (used for) operating activities 4,879 3,745
Proceeds from disposal of 110 366
Intangible assets and property, plant and equipment 87 103
Equity investments 23 263
Purchases of investments in -1,314 -1,323
Intangible assets and property, plant and equipment -1,244 -1,252
Equity investments -70 -71
Changes in securities and fixed-term deposits 1,505 -474
Changes in restricted cash and cash equivalents 211 -88
Cash provided by (used for) investing activities of continuing operations 512 -1,519
Cash provided by (used for) investing activities of discontinued operations – -109
Cash provided by (used for) investing activities 512 -1,628
Payments received/made from changes in capital2 1,497 -48
Cash dividends paid to shareholders of E.ON SE -345 -976
Cash dividends paid to non-controlling interests -199 -110
Changes in financial liabilities 987 -955
Cash provided by (used for) financing activities of continuing operations 1,940 -2,089
Cash provided by (used for) financing activities of discontinued operations – -524
Cash provided by (used for) financing activities 1,940 -2,613
Net increase/decrease in cash and cash equivalents 7,331 -496
Effect of foreign exchange rates on cash and cash equivalents -3 41
Cash and cash equivalents at the beginning of the year3 5,574 5,190
Cash and cash equivalents at the end of the quarter 12,902 4,735
Less: Cash and cash equivalents of discontinued operations at the end of the quarter 0 528
Cash and cash equivalents of continuing operations at the end of the quarter 12,902 4,207
32Condensed Consolidated Interim Financial Statements
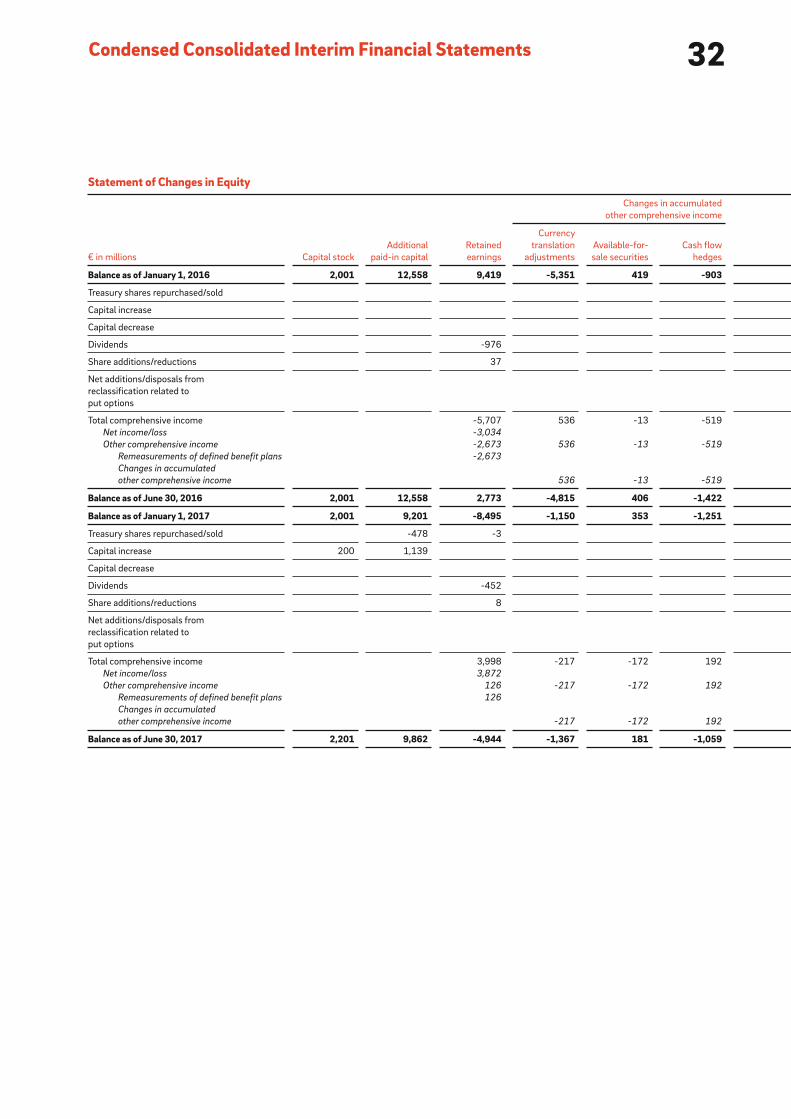
Statement of Changes in Equity
€ in millions Capital stock
Additional
paid-in capital
Retained
earnings
Changes in accumulated
other comprehensive income
Currency
translation
adjustments
Available-for-
sale securities
Cash flow
hedges
Balance as of January 1, 2016 2,001 12,558 9,419 -5,351 419 -903
Treasury shares repurchased/sold
Capital increase
Capital decrease
Dividends -976
Share additions/reductions 37
Net additions/disposals from
reclassification related to
put options
Total comprehensive income -5,707 536 -13 -519
Net income/loss -3,034
Other comprehensive income -2,673 536 -13 -519
Remeasurements of defined benefit plans -2,673
Changes in accumulated
other comprehensive income 536 -13 -519
Balance as of June 30, 2016 2,001 12,558 2,773 -4,815 406 -1,422
Balance as of January 1, 2017 2,001 9,201 -8,495 -1,150 353 -1,251
Treasury shares repurchased/sold -478 -3
Capital increase 200 1,139
Capital decrease
Dividends -452
Share additions/reductions 8
Net additions/disposals from
reclassification related to
put options
Total comprehensive income 3,998 -217 -172 192
Net income/loss 3,872
Other comprehensive income 126 -217 -172 192
Remeasurements of defined benefit plans 126
Changes in accumulated
other comprehensive income -217 -172 192
Balance as of June 30, 2017 2,201 9,862 -4,944 -1,367 181 -1,059
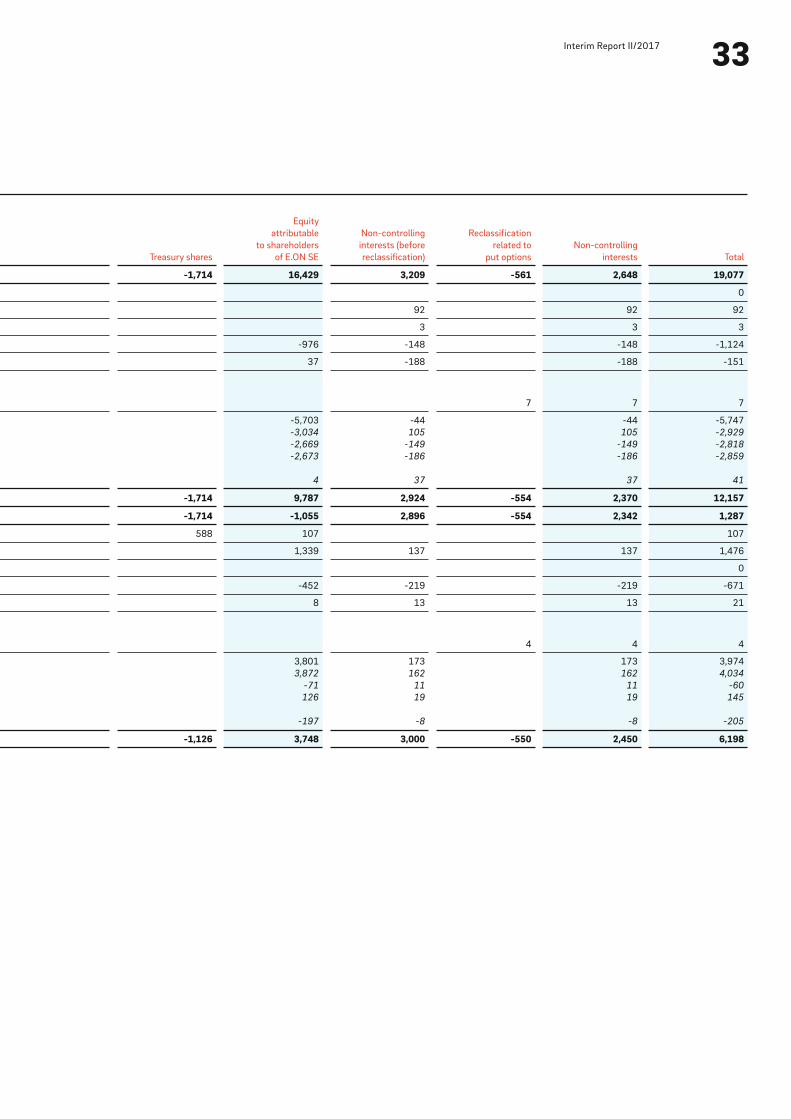
33Interim Report II/2017
Treasury shares
Equity
attributable
to shareholders
of E.ON SE
Non-controlling
interests (before
reclassification)
Reclassification
related to
put options
Non-controlling
interests Total
-1,714 16,429 3,209 -561 2,648 19,077
0
92 92 92
3 3 3
-976 -148 -148 -1,124
37 -188 -188 -151
7 7 7
-5,703 -44 -44 -5,747
-3,034 105 105 -2,929
-2,669 -149 -149 -2,818
-2,673 -186 -186 -2,859
4 37 37 41
-1,714 9,787 2,924 -554 2,370 12,157
-1,714 -1,055 2,896 -554 2,342 1,287
588 107 107
1,339 137 137 1,476
0
-452 -219 -219 -671
8 13 13 21
4 4 4
3,801 173 173 3,974
3,872 162 162 4,034
-71 11 11 -60
126 19 19 145
-197 -8 -8 -205
-1,126 3,748 3,000 -550 2,450 6,198
34Notes to the Condensed Consolidated Interim Financial Statements
(1) Summary of Significant Accounting Policies
The Interim Report for the six months ended June 30, 2017, has
been prepared in accordance with those International Financial
Reporting Standards (“IFRS”) and IFRS Interpretations Committee
interpretations (“IFRS IC”) effective and adopted for use in the
European Union (“EU”).
This Interim Report was prepared using the accounting, valuation
and consolidation policies used in the Consolidated Financial
Statements for the 2016 fiscal year.
This Interim Report prepared in accordance with IAS 34 is con-
densed compared with the scope applied to the Consolidated
Financial Statements for the full year. For further information,
including information about E.ON’s risk management system,
please refer to E.ON’s Consolidated Financial Statements for the
year ended December 31, 2016, which provide the basis for
this Interim Report.
(2) Material Standards Applicable in 2018
IFRS 9, “Financial Instruments”
In July 2014, the IASB published the new standard IFRS 9,
“Financial Instruments,” which must be applied for fiscal years
beginning on or after January 1, 2018. The changes to the
new standard can be divided into three phases. E.ON expects
higher income volatility from the future amendments in phase I
“Classification of Financial Instruments” since fewer equity
instruments than planned can be classified as fair value through
other comprehensive income. Phase II of the project addresses
impairment of financial assets. The new impairment model,
which, in contrast to the impairment model under IAS 39, takes
account not only of losses that have already been incurred but
also expected losses (expected loss model), will make more use
of forward-looking information and take losses into account
at an earlier stage. Because of the new model, in the future E.ON
expects the timing on the impairment of financial assets to be
different. E.ON expects no material impacts from the third phase
of the project “Hedge Accounting.”
IFRS 15, “Revenue from Contracts with Customers”
In May 2014, the IASB published IFRS 15, “Revenue from
Contracts with Customers,” which must be applied for fiscal years
beginning on or after January 1, 2018. Initial application is
retrospective, and the E.ON Group has opted for modified retro-
spective initial application. Within the framework of the project
for the implementation of IFRS 15, the following significant
impact was identified in comparison with the previous revenue
recognition: The revision criteria for principal/agent relationships
will at times result in a change in recognition on the balance sheet
and income statement. This means that, in particular, revenues
and cost of materials will decrease without resulting in any earn-
ings effects. The cumulative effect is considered to be material.
(3) Material transactions in the first half of 2017
Fund to finance the disposal of nuclear waste
On June 16, 2017, with the approval of the European Commis-
sion, the Omnibus Act Reorganizing Responsibility for Nuclear
Waste Management (“Gesetz zur Neuordnung der Verantwortung
in der kerntechnischen Entsorgung”) adopted by Germany’s two
houses of parliament in December 2016, entered into force.
As part of this, supplemental regulations were published for the
specification of the payment amount as well as the procedures
for payment into the fund set up by the Federal Republic of Ger-
many to finance the disposal of nuclear waste.
E.ON had committed itself to payment of a basic amount plus
carryforward of €7,640 million and a risk surcharge of
€2,649 million. Pursuant to this regulation, this amount was
payable no earlier than July 3, 2017. As a result, no significant
changes were recorded to the provision that had already been
established.
As of June 30, 2017, E.ON recognizes the amount of the payment
as an other operating liability, since the existing provision recog-
nized in the provision for nuclear waste management obligations
had to be reclassified based on the amount and the date.
On July 3, 2017, the payments for the basic amount plus carry-
forward and the risk surcharge for all nuclear power plants and
equity investments in nuclear power plants attributable to E.ON
were fully paid up. According to confirmations by the fund, E.ON
and other subsidiaries are therefore no longer liable for the dis-
posal tasks assumed by the Federal Republic of Germany.
The payments of €10,289 million are recognized in cash flow from
operations in the third quarter of 2017. Taking into account the
passing on of charges from and to co-owners, E.ON’s payment
obligation totaled €10,066 million.
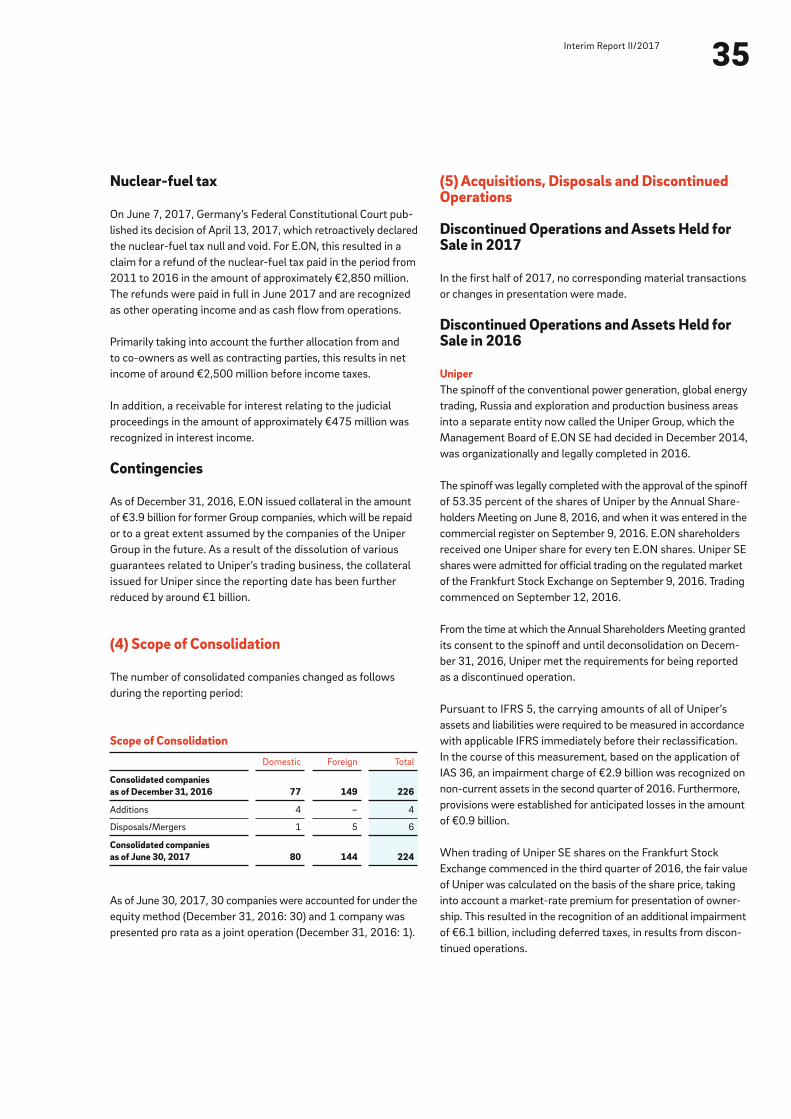
35Interim Report II/2017
(5) Acquisitions, Disposals and Discontinued Operations
Discontinued Operations and Assets Held for Sale in 2017
In the first half of 2017, no corresponding material transactions
or changes in presentation were made.
Discontinued Operations and Assets Held for Sale in 2016
UniperThe spinoff of the conventional power generation, global energy
trading, Russia and exploration and production business areas
into a separate entity now called the Uniper Group, which the
Management Board of E.ON SE had decided in December 2014,
was organizationally and legally completed in 2016.
The spinoff was legally completed with the approval of the spinoff
of 53.35 percent of the shares of Uniper by the Annual Share-
holders Meeting on June 8, 2016, and when it was entered in the
commercial register on September 9, 2016. E.ON shareholders
received one Uniper share for every ten E.ON shares. Uniper SE
shares were admitted for official trading on the regulated market
of the Frankfurt Stock Exchange on September 9, 2016. Trading
commenced on September 12, 2016.
From the time at which the Annual Shareholders Meeting granted
its consent to the spinoff and until deconsolidation on Decem-
ber 31, 2016, Uniper met the requirements for being reported
as a discontinued operation.
Pursuant to IFRS 5, the carrying amounts of all of Uniper’s
assets and liabilities were required to be measured in accordance
with applicable IFRS immediately before their reclassification.
In the course of this measurement, based on the application of
IAS 36, an impairment charge of €2.9 billion was recognized on
non-current assets in the second quarter of 2016. Furthermore,
provisions were established for anticipated losses in the amount
of €0.9 billion.
When trading of Uniper SE shares on the Frankfurt Stock
Exchange commenced in the third quarter of 2016, the fair value
of Uniper was calculated on the basis of the share price, taking
into account a market-rate premium for presentation of owner-
ship. This resulted in the recognition of an additional impairment
of €6.1 billion, including deferred taxes, in results from discon-
tinued operations.
Nuclear-fuel tax
On June 7, 2017, Germany’s Federal Constitutional Court pub-
lished its decision of April 13, 2017, which retroactively declared
the nuclear-fuel tax null and void. For E.ON, this resulted in a
claim for a refund of the nuclear-fuel tax paid in the period from
2011 to 2016 in the amount of approximately €2,850 million.
The refunds were paid in full in June 2017 and are recognized
as other operating income and as cash flow from operations.
Primarily taking into account the further allocation from and
to co-owners as well as contracting parties, this results in net
income of around €2,500 million before income taxes.
In addition, a receivable for interest relating to the judicial
proceedings in the amount of approximately €475 million was
recognized in interest income.
Contingencies
As of December 31, 2016, E.ON issued collateral in the amount
of €3.9 billion for former Group companies, which will be repaid
or to a great extent assumed by the companies of the Uniper
Group in the future. As a result of the dissolution of various
guarantees related to Uniper’s trading business, the collateral
issued for Uniper since the reporting date has been further
reduced by around €1 billion.
(4) Scope of Consolidation
The number of consolidated companies changed as follows
during the reporting period:
As of June 30, 2017, 30 companies were accounted for under the
equity method (December 31, 2016: 30) and 1 company was
presented pro rata as a joint operation (December 31, 2016: 1).
Scope of Consolidation
Domestic Foreign Total
Consolidated companies as of December 31, 2016 77 149 226
Additions 4 – 4
Disposals/Mergers 1 5 6
Consolidated companies as of June 30, 2017 80 144 224
36Notes to the Condensed Consolidated Interim Financial Statements
The deconsolidation of Uniper as of December 31, 2016 resulted
in a loss on disposal of €3.6 billion.
The disposed asset and liability items of the Uniper Group related
to intangible assets (€1.5 billion), property, plant and equipment
(€8.5 billion), other assets (€32.1 billion), provisions (€9.2 billion)
and liabilities (€26.5 billion). Taking into account other deconsoli-
dation effects (€0.5 billion), the loss on deconsolidation essen-
tially resulted from the recognition in income of the currency
translation effects previously recognized in other comprehensive
income.
E.ON Distribuţie România S.A.E.ON entered into an agreement with Allianz Capital Partners in
December 2016 to sell a 30-percent stake in E.ON Distribuţie
România S.A. E.ON Distribuţie România S.A owns and operates
a gas distribution network of over 20,000 kilometers and a power
distribution network of more than 80,000 kilometers, supplying
more than 3 million customers. After conclusion of the transaction
on December 22, 2016, E.ON retains 56.5 percent of the shares
of E.ON Distribuţie România, and another 13.5 percent of the
shares are held by the Romanian Ministry of Energy. The parties
agreed to not disclose the purchase price. Since this is a sale of
shares without loss of control, no profit or loss was realized.
E.ON in SpainIn late November 2014, E.ON entered into contracts with a con-
sortium made up of Macquarie European Infrastructure Fund 4
(MEIF4) and Wren House Infrastructure (WHI) on the sale of its
Spanish and Portuguese activities. The transaction closed on
March 25, 2015, with a minimal loss on disposal.
As part of the framework agreement and a contractual agree-
ment building on that framework concluded in October 2016,
E.ON received an additional payment of €0.2 billion. This payment
is included as a purchase price adjustment from discontinued
operations in the fourth quarter of 2016.
On December 31, 2016, the fair value–again taking into account
a market-rate premium for presentation of ownership–was once
again to be compared with the carrying amount of the Uniper
Group. Although the market price had risen compared to the price
on September 30, 2016, a further impairment of approximately
€0.9 billion resulted from the increase in net assets at Uniper.
As of December 31, 2016, E.ON and Uniper entered into the
agreement on the non-exercise of control that was included in
the spinoff agreement. Under this agreement, E.ON undertakes
to abstain over the long term from exercising voting rights relating
to the election of a certain number of supervisory board mem-
bers of Uniper. With the finalization of the agreement, E.ON lost
control over Uniper despite the 46.65-percent stake retained in
Uniper, which in principle would provide actual control at the
Annual Shareholders Meeting due to E.ON’s expected majority
presence there.
The remaining 46.65-percent interest in Uniper has been
reclassified as an associated company since control was lost,
and is accounted for in the consolidated financial statements
using the equity method.
In the first six months of 2016, E.ON generated revenues of
€1,533 million, interest income of €180 million and interest
expenses of €8 million, as well as other income of €781 million
and other expenses of €5,792 million, with companies of the
Uniper Group.
The following table shows selected financial information for the
Uniper Group, which is reported as discontinued operations for
the first half of 2016:
Selected Financial Information— Uniper (Summary)
First half
€ in millions 2016
Sales 27,550
Other income 3,579
Other expense -35,013
Income/Loss from continuing operations before income taxes -3,884
Income taxes -19
Income/Loss from discontinued operations, net -3,903
37Interim Report II/2017
Exploration and Production Business in the North SeaIn November 2014, E.ON had announced the strategic review
of its exploration and production business in the North Sea.
Because of a firming commitment to divest itself of these activ-
ities, E.ON had reported this business as a disposal group as of
September 30, 2015.
E.ON signed an agreement to sell all of its shares in E.ON Explo-
ration & Production Norge AS (“E.ON E&P Norge”), Stavanger,
Norway, to DEA Deutsche Erdoel AG (“DEA”), Hamburg,
Germany, in October 2015. The transaction was closed in
December 2015.
In January 2016, E.ON signed an agreement to sell its British
E&P subsidiary E.ON E&P UK Limited, London, United Kingdom,
to Premier Oil plc, London, United Kingdom. The base sales price
as of the January 1, 2015, effective date was approximately
€0.1 billion ($0.12 billion). In addition, E.ON retains liquid funds
that existed in the company as of the effective date, and also
receives other adjustments that will result in the transaction pro-
ducing a net cash inflow of approximately €0.3 billion. As the
purchase price for the British E&P business became more certain
in the fourth quarter of 2015, a charge was recognized on its
goodwill in the amount of approximately €0.1 billion. Held as a
disposal group in the former Exploration & Production global
unit, the major asset and liability items of the British E&P busi-
ness as of March 31, 2016, were goodwill (€0.1 billion) and
other assets (€0.7 billion), as well as liabilities (€0.6 billion). The
closing of the transaction at the end of April 2016 resulted in a
loss on disposal of about €0.1 billion, which consisted mostly
of realized foreign exchange translation differences reclassified
from other comprehensive income to the income statement.
Enovos International S.A. In December 2015, E.ON signed an agreement to sell its
10-percent shareholding in Enovos International S.A., Esch-sur-
Alzette, Luxembourg—joining with RWE AG (“RWE”), Essen,
Germany, which also sold its own stake—to a bidder consortium
led by the Grand Duchy of Luxembourg and the independent
private investment company Ardian, Paris, France. The carrying
amount of the 10-percent shareholding amounted to approxi-
mately €0.1 billion as of December 31, 2015. The transaction
closed in the first quarter of 2016. The parties agreed to not
disclose the purchase price.
AS Latvijas GāzeOn December 22, 2015, E.ON entered into an agreement to
sell 28.974 percent of the shares of its associated shareholding
AS Latvijas Gāze, Riga, Latvia, to the Luxembourg company
Marguerite Gas I S.à r.l. The carrying amount of the equity inter-
est amounted to approximately €0.1 billion as of December 31,
2015. The transaction, which closed in January 2016 at a sales
price of approximately €0.1 billion, resulted in a minimal gain
on disposal.
Grid Connection Infrastructure for the Humber Wind Farm Following the construction and entry into service of the Humber
Gateway wind farm in the U.K. North Sea, E.ON was required by
regulation to sell to an independent third party the associated
grid connection infrastructure currently held by E.ON Climate &
Renewables UK Humber Wind Ltd., Coventry, United Kingdom
(“Humber Wind”). The sale to Balfour Beatty Equitix Consortium
(BBEC) was completed in September 2016. The sales price and
carrying amount totaled approximately €0.2 billion each.
Arkona Offshore Wind Farm PartnershipE.ON has made the decision to build the Arkona offshore wind
farm project in the Baltic Sea. The Norwegian energy company
Statoil has acquired a 50-percent interest in the project and
is involved from the start. E.ON is responsible for building and
operating the wind farm. The contract on the sale of the
50-percent stake was signed in the first quarter of 2016, and
the transaction closed in April 2016. The transaction resulted
in a minimal gain on disposal.
(6) Research and Development Costs
The E.ON Group’s research and development costs under IFRS
totaled €2.9 million in the first six months of 2017 (first six
months of 2016: €6.6 million).
38Notes to the Condensed Consolidated Interim Financial Statements
(7) Financial Results
The following table provides details of financial results for the
periods indicated:
(8) Earnings per Share
The computation of earnings per share for the periods indicated
is shown below:
The computation of diluted earnings per share is identical to
that of basic earnings per share because E.ON SE has issued no
potentially dilutive ordinary shares.
The increase in the weighted-average number of shares out-
standing resulted primarily from the capital increase carried out
in March 2017. As a result, E.ON increased the share capital of
€2,001,000,000 through the partial utilization of its authorized
capital via the issue of 200,099,000 new, registered ordinary
shares with no par value by €200,099,000 to €2,201,099,000.
The new shares have dividend rights effective from January 1,
2016. As a result of the capital increase, E.ON received gross pro-
ceeds from the issue in the amount of approximately €1.35 billion.
In addition, E.ON SE shareholders were again given the option
this year of exchanging a portion of the cash dividend of €0.21
for shares of E.ON SE stock. The acceptance rate was 33 percent.
As a result, nearly 15 million treasury shares were issued to
shareholders.
Financial Results
€ in millions
Second quarter First half
2017 2016 2017 2016
Income/Loss from companies in which equity investments are held 35 42 40 45
Impairment charges/reversals on other financial assets – -30 -16 -57
Income/Loss from equity investments 35 12 24 -12
Income/Loss from securities, interest and similar income 1 670 84 851 162
Interest and similar expenses -263 -478 -602 -976
Net interest income/loss 407 -394 249 -814
Financial results 442 -382 273 -826
1See also Note 3.
Earnings per Share
€ in millions
Second quarter First half
2017 2016 2017 2016
Income/Loss from continuing operations 3,299 198 4,034 955
Less: Non-controlling interests -55 -12 -162 -115
Income/Loss from continuing operations (attributable to shareholders of E.ON SE) 3,244 186 3,872 840
Income/Loss from discontinued operations, net – -4,393 – -3,884
Less: Non-controlling interests – 3 – 10
Income/Loss from discontinued operations, net (attributable to shareholders of E.ON SE) 0 -4,390 0 -3,874
Net income/loss attributable to shareholders of E.ON SE 3,244 -4,204 3,872 -3,034
in €
Earnings per share (attributable to shareholders of E.ON SE)
from continuing operations 1.50 0.10 1.85 0.43
from discontinued operations 0.00 -2.25 0.00 -1.98
from net income/loss 1.50 -2.15 1.85 -1.55
Weighted-average number of shares outstanding (in millions) 2,162 1,952 2,091 1,952
39Interim Report II/2017
The net income of €646 million from companies accounted for
under the equity method (first six months of 2016: €169 million)
includes no impairments. The increase is primarily due to the
initial recognition of the investment in Uniper SE as a company
valued under the equity method.
As of December 31, 2016, a purchase price allocation was made
for Uniper SE, which is accounted for under the equity method.
The pro rata market capitalization as of December 31, 2016,
plus a market control premium, form the basis for the purchase
price assumption. The allocation of undisclosed accruals and
provisions has been provisionally completed. The undisclosed
accruals and provisions are subsequently measured using the
equity method.
(10) Treasury Shares
Pursuant to a resolution by the Annual Shareholders Meeting
of May 10, 2017, the Company is authorized to purchase own
shares until May 9, 2022. The shares purchased, combined
with other treasury shares in the possession of the Company,
or attributable to the Company pursuant to Sections 71a et seq.
AktG, may at no time exceed 10 percent of its capital stock. The
Management Board was authorized at the aforementioned
Annual Shareholders Meeting to cancel treasury shares without
requiring a separate shareholder resolution for the cancellation
or its implementation. The total number of outstanding shares
as of June 30, 2017, was 2,167,149,433 (December 31, 2016:
1,952,396,600).
(9) Companies Accounted for under the Equity Method and Other Financial Assets
The following table shows the structure of financial assets:
Companies Accounted for under the Equity Method and Other Financial Assets
€ in millions
June 30, 2017 December 31, 2016
E.ON Group Associates 1Joint
ventures 1 E.ON Group Associates 1Joint
ventures 1
Companies accounted for under the equity method 6,585 4,480 2,105 6,352 4,096 2,256
Equity investments 804 259 5 821 254 3
Non-current securities 3,850 – – 4,327 – –
Total 11,239 4,739 2,110 11,500 4,350 2,259
1The associates and joint ventures presented as equity investments are associated companies and joint ventures accounted for at cost on materiality grounds.
As of June 30, 2017, E.ON SE held a total of 33,949,567 treasury
shares (December 31, 2016: 48,603,400) having a consolidated
book value of €1,126 million (equivalent to 1.54 percent or
€33,949,567 of the capital stock).
As part of the scrip dividend for the 2016 fiscal year, shareholder
cash dividend entitlements totaling €107 million (2016: –) were
settled through the issue and distribution of 14,653,833
(2016: –) treasury shares. The issue of treasury shares reduced
by €588 million (2016: –) the valuation allowance for treasury
shares, which is measured at historical cost. Conversely, addi-
tional paid-in capital was reduced by €478 million. This amount
represents the difference between the historical cost and
the subscription price of the shares. The discount of €3 million
(2016: –) granted on the current share price is charged to
retained earnings.
(11) Dividends
At the Annual Shareholders Meeting on May 10, 2017, the share-
holders voted to distribute a dividend of €0.21 (2016: €0.50)
for each dividend-paying ordinary share, which corresponds to
a total dividend amount of €452 million (2016: €976 million).
This year, shareholders had the choice between having their
dividend settled entirely in cash or converting part of their divi-
dend entitlement into shares of E.ON SE stock. Accounting for
a participation rate of roughly 33 percent, 14,653,833 treasury
shares were issued for distribution. This reduced the cash dis-
tribution to €345 million.
40Notes to the Condensed Consolidated Interim Financial Statements
(12) Provisions for Pensions and Similar Obligations
The decrease in provisions for pensions and similar obligations
by €261 million relative to year-end 2016 was caused, in par-
ticular, by employer contributions to plan assets, net actuarial
gains mostly resulting from the increase in the discount rate in
Germany and the disposal of pension provisions as a result of
the transfers of employees to Uniper. These effects were partly
offset by the addition of the net periodic pension cost.
The following discount rates were applied for the computation
of provisions for pensions and similar obligations in Germany
and in the United Kingdom:
The net defined benefit liability, which is equal to the difference
between the present value of the defined benefit obligations
and the fair value of plan assets, is determined as shown in the
following table:
The net periodic pension cost for defined benefit plans included
in the provisions for pensions and similar obligations breaks
down as shown in the following table:
(13) Additional Disclosures on Financial Instruments
Measurement of Financial Instruments
The value of financial instruments is determined on the basis of
fair value measurement. The fair value of derivative financial
instruments is sensitive to movements in underlying market
rates and other relevant variables. The Company assesses and
monitors the fair value of derivative instruments on a periodic
basis. The fair value to be determined for each derivative financial
instrument is the price at which one party can sell to a third party
the rights and/or obligations embodied in that derivative. Fair
values of derivatives are determined using customary market
valuation methods, taking into account the market data available
on the measurement date and including a credit risk premium.
The counterparty credit risk is recognized in the form of a credit
value adjustment.
Net Defined Benefit Liability
€ in millions
June 30,
2017
Dec. 31,
2016
Present value of all defined benefit obligations 15,970 16,392
Fair value of plan assets 12,222 12,383
Net defined benefit liability 3,748 4,009Presented as provisions for pensions and similar obligations 3,748 4,009
Net Periodic Pension Cost for Defined Benefit Plans
€ in millions
Second quarter First half
2017 2016 2017 2016
Employer service cost 40 51 77 98
Net interest on the net defined benefit liability 21 21 41 43
Past service cost 3 8 8 14
Total 64 80 126 155
Discount Rates
Percentages
June 30,
2017
Dec. 31,
2016
Germany 2.20 2.10
United Kingdom 2.90 2.90
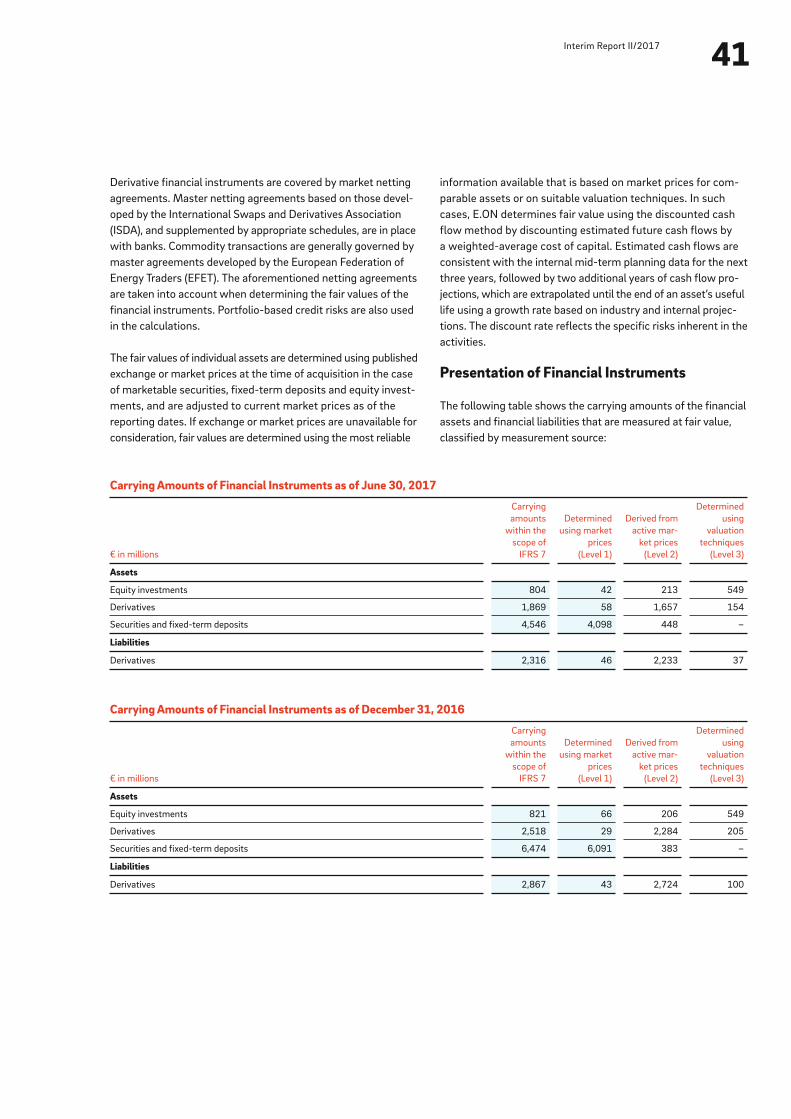
41Interim Report II/2017
information available that is based on market prices for com-
parable assets or on suitable valuation techniques. In such
cases, E.ON determines fair value using the discounted cash
flow method by discounting estimated future cash flows by
a weighted-average cost of capital. Estimated cash flows are
consistent with the internal mid-term planning data for the next
three years, followed by two additional years of cash flow pro-
jections, which are extrapolated until the end of an asset’s useful
life using a growth rate based on industry and internal projec-
tions. The discount rate reflects the specific risks inherent in the
activities.
Presentation of Financial Instruments
The following table shows the carrying amounts of the financial
assets and financial liabilities that are measured at fair value,
classified by measurement source:
Derivative financial instruments are covered by market netting
agreements. Master netting agreements based on those devel-
oped by the International Swaps and Derivatives Association
(ISDA), and supplemented by appropriate schedules, are in place
with banks. Commodity transactions are generally governed by
master agreements developed by the European Federation of
Energy Traders (EFET). The aforementioned netting agreements
are taken into account when determining the fair values of the
financial instruments. Portfolio-based credit risks are also used
in the calculations.
The fair values of individual assets are determined using published
exchange or market prices at the time of acquisition in the case
of marketable securities, fixed-term deposits and equity invest-
ments, and are adjusted to current market prices as of the
reporting dates. If exchange or market prices are unavailable for
consideration, fair values are determined using the most reliable
Carrying Amounts of Financial Instruments as of June 30, 2017
€ in millions
Carrying
amounts
within the
scope of
IFRS 7
Determined
using market
prices
(Level 1)
Derived from
active mar-
ket prices
(Level 2)
Determined
using
valuation
techniques
(Level 3)
Assets
Equity investments 804 42 213 549
Derivatives 1,869 58 1,657 154
Securities and fixed-term deposits 4,546 4,098 448 –
Liabilities
Derivatives 2,316 46 2,233 37
Carrying Amounts of Financial Instruments as of December 31, 2016
€ in millions
Carrying
amounts
within the
scope of
IFRS 7
Determined
using market
prices
(Level 1)
Derived from
active mar-
ket prices
(Level 2)
Determined
using
valuation
techniques
(Level 3)
Assets
Equity investments 821 66 206 549
Derivatives 2,518 29 2,284 205
Securities and fixed-term deposits 6,474 6,091 383 –
Liabilities
Derivatives 2,867 43 2,724 100
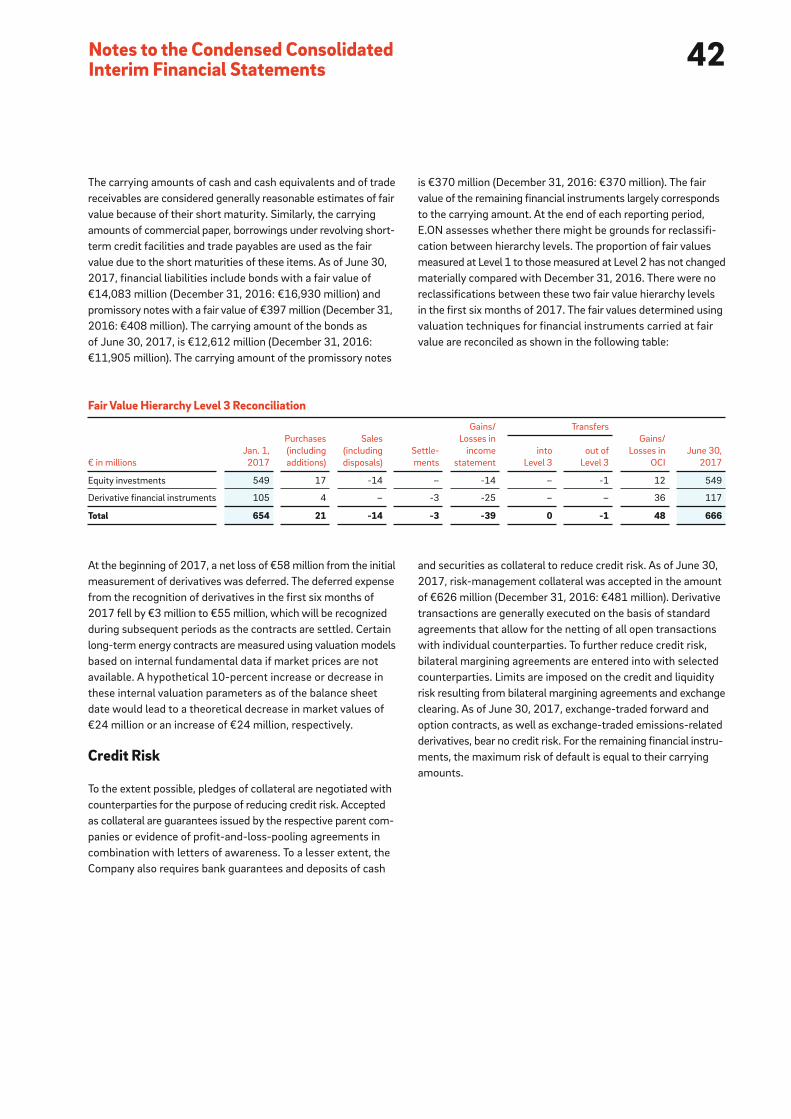
42Notes to the Condensed Consolidated Interim Financial Statements
The carrying amounts of cash and cash equivalents and of trade
receivables are considered generally reasonable estimates of fair
value because of their short maturity. Similarly, the carrying
amounts of commercial paper, borrowings under revolving short-
term credit facilities and trade payables are used as the fair
value due to the short maturities of these items. As of June 30,
2017, financial liabilities include bonds with a fair value of
€14,083 million (December 31, 2016: €16,930 million) and
promissory notes with a fair value of €397 million (December 31,
2016: €408 million). The carrying amount of the bonds as
of June 30, 2017, is €12,612 million (December 31, 2016:
€11,905 million). The carrying amount of the promissory notes
is €370 million (December 31, 2016: €370 million). The fair
value of the remaining financial instruments largely corresponds
to the carrying amount. At the end of each reporting period,
E.ON assesses whether there might be grounds for reclassifi-
cation between hierarchy levels. The proportion of fair values
measured at Level 1 to those measured at Level 2 has not changed
materially compared with December 31, 2016. There were no
reclassifications between these two fair value hierarchy levels
in the first six months of 2017. The fair values determined using
valuation techniques for financial instruments carried at fair
value are reconciled as shown in the following table:
At the beginning of 2017, a net loss of €58 million from the initial
measurement of derivatives was deferred. The deferred expense
from the recognition of derivatives in the first six months of
2017 fell by €3 million to €55 million, which will be recognized
during subsequent periods as the contracts are settled. Certain
long-term energy contracts are measured using valuation models
based on internal fundamental data if market prices are not
available. A hypothetical 10-percent increase or decrease in
these internal valuation parameters as of the balance sheet
date would lead to a theoretical decrease in market values of
€24 million or an increase of €24 million, respectively.
Credit Risk
To the extent possible, pledges of collateral are negotiated with
counterparties for the purpose of reducing credit risk. Accepted
as collateral are guarantees issued by the respective parent com-
panies or evidence of profit-and-loss-pooling agreements in
combination with letters of awareness. To a lesser extent, the
Company also requires bank guarantees and deposits of cash
Fair Value Hierarchy Level 3 Reconciliation
€ in millions
Jan. 1,
2017
Purchases
(including
additions)
Sales
(including
disposals)
Settle-
ments
Gains/
Losses in
income
statement
Transfers
Gains/
Losses in
OCI
June 30,
2017
into
Level 3
out of
Level 3
Equity investments 549 17 -14 – -14 – -1 12 549
Derivative financial instruments 105 4 – -3 -25 – – 36 117
Total 654 21 -14 -3 -39 0 -1 48 666
and securities as collateral to reduce credit risk. As of June 30,
2017, risk-management collateral was accepted in the amount
of €626 million (December 31, 2016: €481 million). Derivative
transactions are generally executed on the basis of standard
agreements that allow for the netting of all open transactions
with individual counterparties. To further reduce credit risk,
bilateral margining agreements are entered into with selected
counterparties. Limits are imposed on the credit and liquidity
risk resulting from bilateral margining agreements and exchange
clearing. As of June 30, 2017, exchange-traded forward and
option contracts, as well as exchange-traded emissions-related
derivatives, bear no credit risk. For the remaining financial instru-
ments, the maximum risk of default is equal to their carrying
amounts.
43Interim Report II/2017
(14) Related-Party Transactions
E.ON exchanges goods and services with a large number of
companies as part of its continuing operations. Related parties
include, in particular, the companies of the Uniper Group, which
are included in the consolidated financial statements using the
equity method.
As of June 30, 2017, receivables totaling €495 million (Decem-
ber 31, 2016: €1,136 million), provisions in the amount of
€258 million (December 31, 2016: €55 million) and liabilities of
€284 million (December 31, 2016: €908 million) to companies
of the Uniper Group consist primarily of electricity and gas trans-
actions and the measurement of commodity derivatives. In
the first six months of 2017, income from transactions with
Uniper companies amounted to €1,361 million and expenses of
€3,763 million. In the previous year, income and expenses from
relationships with the fully consolidated Uniper companies were
consolidated.
(15) Segment Reporting
In line with its business realignment, the E.ON Group, led by
its Group Management in Essen, Germany, now comprises the
seven new reporting segments described below, as well as a
segment for its Non-Core Business and Corporate Functions/
Other, all of which are reported here in accordance with IFRS 8.
The combined segments, which are not separately reportable,
in the Energy Networks East-Central Europe/Turkey unit and the
Customer Solutions Other unit are of subordinate importance
and have similar economic characteristics with respect to cus-
tomer structure, products and distribution channels. Information
regarding Uniper SE, which was reported as a discontinued
operation until its deconsolidation as of December 31, 2016,
is provided in Note 5.
Energy Networks
GermanyThis segment combines the electricity and gas distribution
networks and all related activities in Germany.
SwedenThe segment comprises the electricity and gas networks
businesses in Sweden.
East-Central Europe/TurkeyThis segment combines the distribution network activities in
the Czech Republic, Hungary, Romania, Slovakia and Turkey.
Customer Solutions
GermanyThis segment consists of activities that supply our customers in
Germany with electricity, gas and heating and the distribution
of specific products and services in areas for improving energy
efficiency and energy independence.
United KingdomThe segment comprises sales activities and customer solutions
in the U.K.
OtherThis segment combines the corresponding Customer Solutions
in Sweden, Italy, the Czech Republic, Hungary and Romania, as
well as E.ON Connecting Energies.
Renewables
The Renewables segment combines the Group’s activities for
the production of wind power plants (onshore and offshore) as
well as solar farms.
Non-Core Business
Held in the Non-Core Business segment are the non-strategic
activities of the E.ON Group. This includes the operation of
the German nuclear power plants, which are managed by the
PreussenElektra operating unit.
Corporate Functions/Other
The Corporate Functions/Other segment contains E.ON SE itself,
the equity investments held directly within this segment and, for
part of 2016, some remaining contributions from the E&P activi-
ties in the North Sea. Since December 31, 2016, the Uniper Group,
which is accounted for in the consolidated financial statements
using the equity method, is also allocated to this segment. The
earnings of Uniper are reported under non-operating earnings.
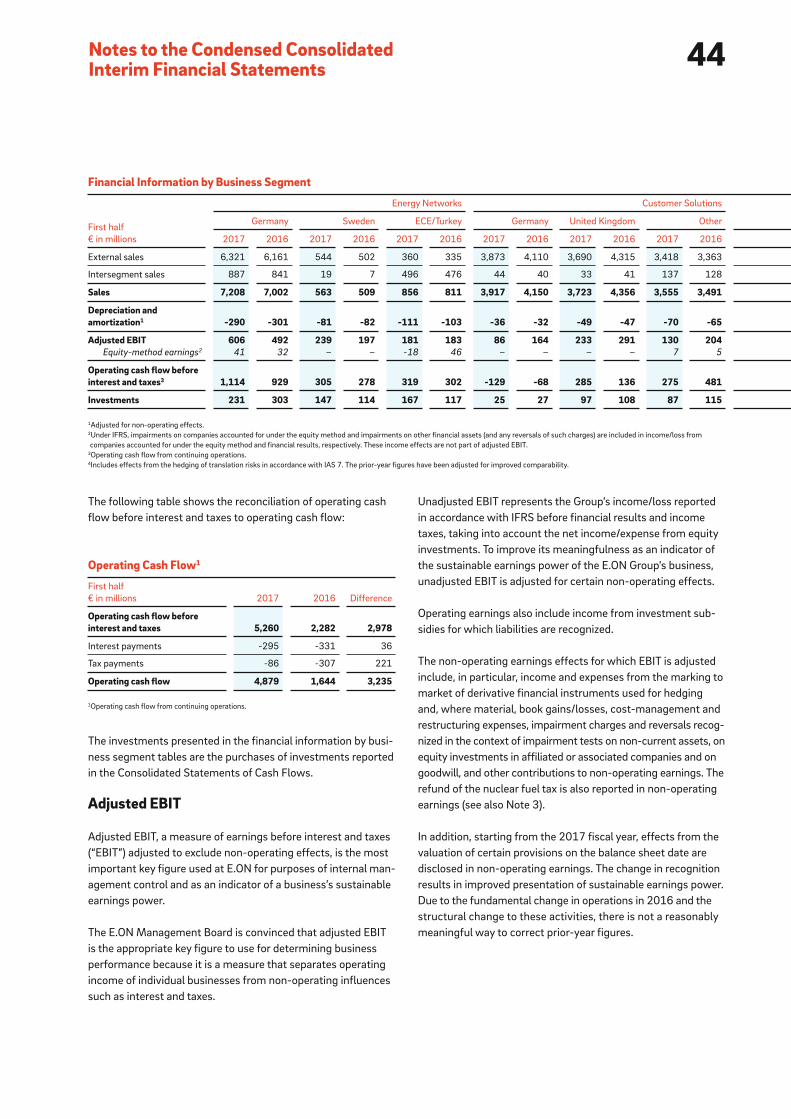
44Notes to the Condensed Consolidated Interim Financial Statements
Unadjusted EBIT represents the Group’s income/loss reported
in accordance with IFRS before financial results and income
taxes, taking into account the net income/expense from equity
investments. To improve its meaningfulness as an indicator of
the sustainable earnings power of the E.ON Group’s business,
unadjusted EBIT is adjusted for certain non-operating effects.
Operating earnings also include income from investment sub-
sidies for which liabilities are recognized.
The non-operating earnings effects for which EBIT is adjusted
include, in particular, income and expenses from the marking to
market of derivative financial instruments used for hedging
and, where material, book gains/losses, cost-management and
restructuring expenses, impairment charges and reversals recog-
nized in the context of impairment tests on non-current assets, on
equity investments in affiliated or associated companies and on
goodwill, and other contributions to non-operating earnings. The
refund of the nuclear fuel tax is also reported in non-operating
earnings (see also Note 3).
In addition, starting from the 2017 fiscal year, effects from the
valuation of certain provisions on the balance sheet date are
disclosed in non-operating earnings. The change in recognition
results in improved presentation of sustainable earnings power.
Due to the fundamental change in operations in 2016 and the
structural change to these activities, there is not a reasonably
meaningful way to correct prior-year figures.
The following table shows the reconciliation of operating cash
flow before interest and taxes to operating cash flow:
The investments presented in the financial information by busi-
ness segment tables are the purchases of investments reported
in the Consolidated Statements of Cash Flows.
Adjusted EBIT
Adjusted EBIT, a measure of earnings before interest and taxes
(“EBIT”) adjusted to exclude non-operating effects, is the most
important key figure used at E.ON for purposes of internal man-
agement control and as an indicator of a business’s sustainable
earnings power.
The E.ON Management Board is convinced that adjusted EBIT
is the appropriate key figure to use for determining business
performance because it is a measure that separates operating
income of individual businesses from non-operating influences
such as interest and taxes.
Operating Cash Flow 1
First half
€ in millions 2017 2016 Difference
Operating cash flow before interest and taxes 5,260 2,282 2,978
Interest payments -295 -331 36
Tax payments -86 -307 221
Operating cash flow 4,879 1,644 3,235
1Operating cash flow from continuing operations.
1Adjusted for non-operating effects.2Under IFRS, impairments on companies accounted for under the equity method and impairments on other financial assets (and any reversals of such charges) are included in income/loss from
companies accounted for under the equity method and financial results, respectively. These income effects are not part of adjusted EBIT.3Operating cash flow from continuing operations.4Includes effects from the hedging of translation risks in accordance with IAS 7. The prior-year figures have been adjusted for improved comparability.
Financial Information by Business Segment
First half
€ in millions
Energy Networks Customer Solutions
Germany Sweden ECE/Turkey Germany United Kingdom Other
2017 2016 2017 2016 2017 2016 2017 2016 2017 2016 2017 2016
External sales 6,321 6,161 544 502 360 335 3,873 4,110 3,690 4,315 3,418 3,363
Intersegment sales 887 841 19 7 496 476 44 40 33 41 137 128
Sales 7,208 7,002 563 509 856 811 3,917 4,150 3,723 4,356 3,555 3,491
Depreciation and amortization 1 -290 -301 -81 -82 -111 -103 -36 -32 -49 -47 -70 -65
Adjusted EBIT 606 492 239 197 181 183 86 164 233 291 130 204 Equity-method earnings 2 41 32 – – -18 46 – – – – 7 5
Operating cash flow before interest and taxes 3 1,114 929 305 278 319 302 -129 -68 285 136 275 481
Investments 231 303 147 114 167 117 25 27 97 108 87 115
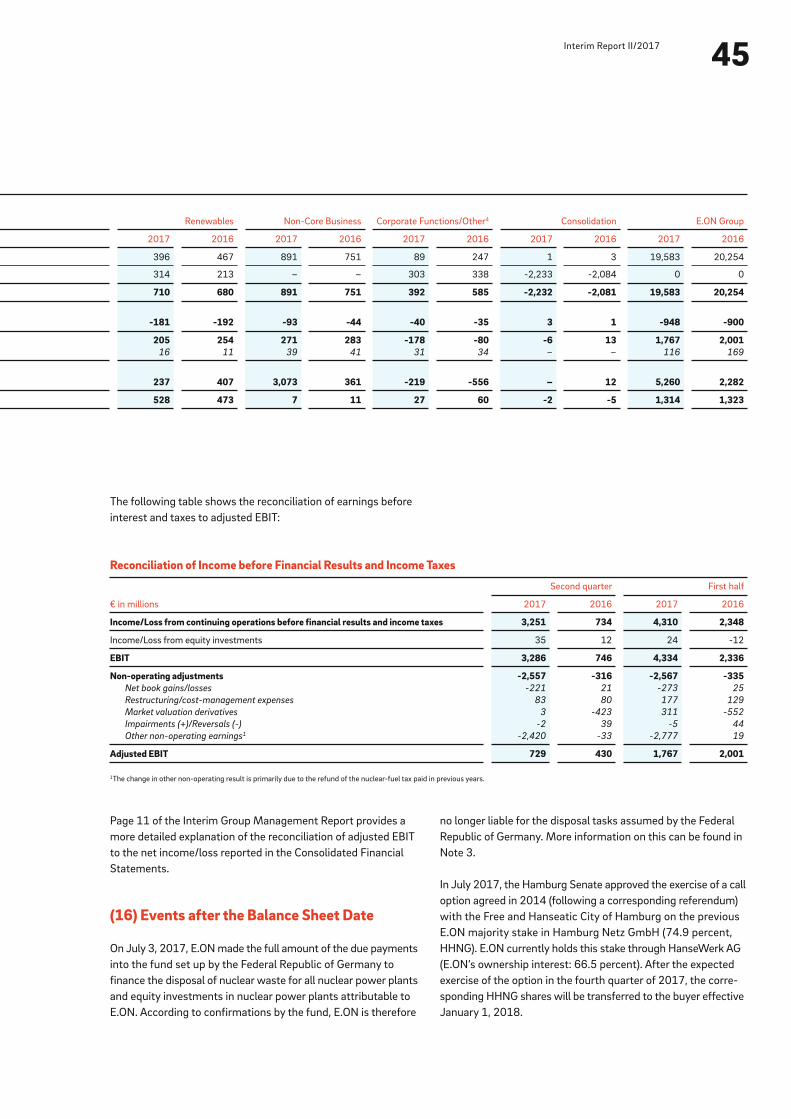
45Interim Report II/2017
Renewables Non-Core Business Corporate Functions/Other 4 Consolidation E.ON Group
2017 2016 2017 2016 2017 2016 2017 2016 2017 2016
396 467 891 751 89 247 1 3 19,583 20,254
314 213 – – 303 338 -2,233 -2,084 0 0
710 680 891 751 392 585 -2,232 -2,081 19,583 20,254
-181 -192 -93 -44 -40 -35 3 1 -948 -900
205 254 271 283 -178 -80 -6 13 1,767 2,001 16 11 39 41 31 34 – – 116 169
237 407 3,073 361 -219 -556 – 12 5,260 2,282
528 473 7 11 27 60 -2 -5 1,314 1,323
The following table shows the reconciliation of earnings before
interest and taxes to adjusted EBIT:
Page 11 of the Interim Group Management Report provides a
more detailed explanation of the reconciliation of adjusted EBIT
to the net income/loss reported in the Consolidated Financial
Statements.
(16) Events after the Balance Sheet Date
On July 3, 2017, E.ON made the full amount of the due payments
into the fund set up by the Federal Republic of Germany to
finance the disposal of nuclear waste for all nuclear power plants
and equity investments in nuclear power plants attributable to
E.ON. According to confirmations by the fund, E.ON is therefore
1The change in other non-operating result is primarily due to the refund of the nuclear-fuel tax paid in previous years.
Reconciliation of Income before Financial Results and Income Taxes
€ in millions
Second quarter First half
2017 2016 2017 2016
Income/Loss from continuing operations before financial results and income taxes 3,251 734 4,310 2,348
Income/Loss from equity investments 35 12 24 -12
EBIT 3,286 746 4,334 2,336
Non-operating adjustments -2,557 -316 -2,567 -335Net book gains/losses -221 21 -273 25
Restructuring/cost-management expenses 83 80 177 129
Market valuation derivatives 3 -423 311 -552
Impairments (+)/Reversals (-) -2 39 -5 44
Other non-operating earnings 1 -2,420 -33 -2,777 19
Adjusted EBIT 729 430 1,767 2,001
no longer liable for the disposal tasks assumed by the Federal
Republic of Germany. More information on this can be found in
Note 3.
In July 2017, the Hamburg Senate approved the exercise of a call
option agreed in 2014 (following a corresponding referendum)
with the Free and Hanseatic City of Hamburg on the previous
E.ON majority stake in Hamburg Netz GmbH (74.9 percent,
HHNG). E.ON currently holds this stake through HanseWerk AG
(E.ON’s ownership interest: 66.5 percent). After the expected
exercise of the option in the fourth quarter of 2017, the corre-
sponding HHNG shares will be transferred to the buyer effective
January 1, 2018.
46Responsibility Statement
Teyssen
Wildberger
Birnbaum
Spieker
To the best of our knowledge, and in accordance with applicable
reporting principles for interim financial reporting, the Condensed
Consolidated Interim Financial Statements give a true and fair
view of the assets, liabilities, financial position and profit or loss
of the Group, and that the Interim Group Management Report
includes a fair review of the development and performance of the
business and the position of the Group, together with a descrip-
tion of the principal opportunities and risks associated with the
expected development of the Group for the remaining months
of the financial year.
Essen, Germany, August 7, 2017
The Board of Management
47Interim Report II/2017Financial Calendar
Further information E.ON SE
Brüsseler Platz 1
45131 Essen
Germany
T +49 (0)201-184-00
eon.com
Journalists
T +49 (0)201-184-4236
Analysts and shareholders
T +49 (0)201-184-2806
Bond investors
T +49 (0)201-184-6526
Only the German version of this Interim Report is legally binding.
This Interim Report may contain forward-looking statements based on current assumptions and forecasts made by E.ON Group
Management and other information currently available to E.ON. Various known and unknown risks, uncertainties, and other factors
could lead to material differences between the actual future results, financial situation, development, or performance of the company
and the estimates given here. E.ON SE does not intend, and does not assume any liability whatsoever, to update these forward-looking
statements or to conform them to future events or developments.
November 8, 2017 Interim Report: January – September 2017
March 14, 2018 Release of the 2017 Annual Report
May 8, 2018 Interim Report: January – March 2018
May 9, 2018 2018 Annual Shareholders Meeting
August 8, 2018 Interim Report: January – June 2018
November 14, 2018 Interim Report: January – September 2018