Embed Size (px)
Citation preview

BIMB i FLEXI FUND
INTERIM REPORT FOR THE 6 MONTHS FINANCIAL PERIOD ENDED30 SEPTEMBER 2020
LAPORAN INTERIM BAGI TEMPOH KEWANGAN 6 BULAN BERAKHIR 30 SEPTEMBER 2020
MANAGER:BIMB INVESTMENT MANAGEMENT BERHAD 199301021508 (276246-X)

2
TABLE OF CONTENT
No. Particulars Page
1.0 Manager‟s Report 3
1.1 Fund Name/ Fund Type/ Fund Category/ Fund Investment Objective/
Fund Performance Benchmark/ Fund Distribution Policy 3
1.2 Performance for the 6 Months Financial Period Ended 30 September
2020 4
1.3 Economic and Market Review 7
1.4 Market Outlook and Strategy 8
1.5 Asset Allocation 9
1.6
Other Performance Data for the 6 Months Financial Period Ended 30
September 2020 and Three Financial Years Ended 31 March 2020,
2019 and 2018
10
1.7 Unit Holdings as at 30 September 2020 11
1.8 Policy on Rebate and Soft Commission 11
2.0 Trustee‟s Report 21
3.0 Shariah Committee‟s Report 22
4.0 Directors‟ Declaration 23
5.0 Unaudited Financial Statements 24
6.0 Corporate Directory 52

3
1.0 Manager’s Report
Dear Unit Holders,
We are pleased to present the Manager‟s report of BIMB i Flexi Fund for the 6 months
financial period ended 30 September 2020.
1.1 Fund Name/ Fund Type/ Fund Category/ Fund Investment Objective/ Fund
Performance Benchmark/ Fund Distribution Policy
Fund Name BIMB i Flexi Fund
Fund Type Growth
Fund Category Mixed Asset
Fund Investment
Objective
The Fund seeks to achieve long term capital growth by
investing in a diversified portfolio of Shariah-compliant
securities.
Any material change to the investment objective of the
Fund would require Unit Holders’ approval.
Fund Performance
Benchmark
The selected performance benchmark for the Fund is
based on 50:50 ratio of the FBM Emas Shariah Index and
12-month Term Deposit-i Tawarruq (TDT-i) rate of Bank
Islam Malaysia Berhad*.
*The benchmark reflects the investment and asset
allocation strategies of the Fund, where the Fund is
allowed to invest its asset in Shariah-compliant equities as
well as Sukuk and Islamic money market instruments,
depending on the outlook of the market. The risk profile of
the Fund is not the same as the risk profile of the
performance benchmark.
*Source:www.bursamalaysia.com and www.bankislam.com.my
Fund Distribution Policy
The distribution of income is incidental

4
1.2 Performance for the 6 Months Financial Period Ended 30 September 2020
1.2.1 Performance Review
For the period under review, BIMB i Flexi Fund (“the Fund”) registered a return of 79.79%
as compared to its Benchmark‟s return of 14.02%.
The selected performance benchmark for the Fund is 50:50 ratio of the FBM Emas
Shariah Index and 12-month rate of Bank Islam Malaysia Berhad Term Deposit-i
Tawarruq (TDT-i).
Our strategy has remained to focus on well-established companies with good prospects
for earnings growth and capital appreciation.
As at 30 September 2020, the Fund has 70.13% exposure to equities and 29.87% in cash
and cash equivalents. The total Net Asset Value (NAV) of the Fund is RM7.91 million
whereas the NAV per unit of the Fund is RM0.3033.
For the period under review, the Fund‟s equity exposure had ranged between 60% to
99%. The Fund will continue its diversified investment strategy across various promising
sectors to maximize trading opportunities while protecting downside risk for the fund,
taking into consideration both local and global economy outlook for the near to medium
term horizon.
On 20th May 2020, we had issued a Replacement Master Prospectus for the Fund which
among others allows investment in foreign securities. Aside from this, there was no
significant change to the state of affairs of the Fund and no circumstance that materially
affect the interest of Unit Holders that have taken place up to the date of this Manager‟s
Report.

5
1.2.2 Total Return and Average Total Return as at 30 September 2020
Period
BIMB i Flexi Fund Benchmark
Total
Return
(%)
Average
Total
Return
(%)
Total Return
(%)
Average
Total
Return
(%)
6-month
(Mar 20 - Sept 20) 79.79 159.6 14.02 28.04
1-year
(Oct 19 - Sept 20) 50.15 50.15 6.68 6.88
3-year
(Oct 17 - Sept 20) 21.81 7.27 6.16 2.05
5-year
(Oct 15 - Sept 20) 40.48 8.10 13.98 2.80
1.2.3 Total Return for the Past 5 Financial Years
Financial Year
Total Return
BIMB i Flexi Fund
(%)
Benchmark
(%)
31 March 2020 -18.70 -5.32
31 March 2019 -6.07 -4.14
31 March 2018 -2.08 3.38
31 March 2017 7.58 3.00
31 March 2016 -15.44 -0.56

6
Figure 1: Movement of the Fund versus the Benchmark
Data Source : BIMB Investment Management Berhad
Data verified by : Novagni Analytics & Advisory Sdn. Bhd.
Benchmark : 50: 50 FBM Emas Shariah Index &
12-month Term Deposit-i Tawarruq (TDT-i) rate of Bank
Islam Malaysia Berhad
Notes:
1. Total Return of the Fund has been verified by Novagni Analytics & Advisory Sdn.
Bhd. (363145-W)
2. Average Total Return is derived by this formula:
Total Return
Number of Years under Review
The calculation of average total returns is based on methods obtained from Lipper Asia Ltd.
Past performance is not necessarily indicative of future performance and unit prices and
investment returns may go down, as well as up.

7
1.3 Economic and Market Review
1.3.1 Economy
a) Global
The Gross Domestic Product (GDP) in the United States contracted 2.9% in the
third quarter of 2020 over the same quarter of last year. Comparing against the
second quarter of 2020, the US economy expanded by an annualized 33.1% in
the third quarter, as the economy rebounds from the Covid-19 pandemic.
The Eurozone’s GDP shrank by 4.4% year-on-year during the third quarter of
2020, easing from a record slump of 14.8% in the second quarter. Unemployment
numbers for September remained flat.
The Chinese economic recovery gathered pace in the third quarter of 2020, with
GDP in July-September registering 4.9% growth from a year earlier, boosted by
investment and exports following the easing of Covid-19 lockdown restrictions.
(Source: Bureau of Economic Analysis, CNBC, Trading Economics, CGTN)
b) Local
Malaysia’s gross domestic product (GDP) shrank by 2.7 percent year-on-year in
the third quarter of 2020, compared with a sharper correction of 17.1% in the
second quarter of 2020. The improved performance largely reflected the impact of
the reopening of the economy during the Recovery Movement Control Order and
better external demand conditions.
Bank Negara Malaysia’s (BNM) Monetary Policy Committee had cut Overnight
Policy Rate (OPR) by 50bps in May and 25bps in July 2020, bringing the OPR to
1.75% level. The adjustments were measures to provide support to Malaysia’s
domestic economy as global economic conditions have weakened due to the
ongoing Covid-19 outbreak.
(Source: Bloomberg, Bank Negara Malaysia and Department of Statistics
Malaysia)

8
1.3.2 Market Review
a) Equity
FTSE Bursa Malaysia EMAS Shariah Index (“FBM Shariah”) commenced the period
under review at 10,105.08 points and bottomed at the lowest level of 9,923.39 points
on 1st April 2020. Subsequently, the FBM Shariah rose to the highest level of
13,646.60 points on 6th August 2020 before closing at 12,900.94 points on 30
September 2020. For the financial period under review, the FBM Shariah was up by
2,795.86 points or 27.67%.
b) Sukuk Market and Money Market
For the period under review, MYR government bonds and sukuks continued to stay
resilient, with yields of the 3y and 10y MGS benchmark hovering around 1.99% and
2.67% level respectively after hitting a low of 1.83% and 2.40% in August. Malaysian
Government bonds and sukuks yields have since corrected a tad higher after BNM
decided to maintain overnight policy rate (OPR) rate at 1.75% at September’s
Monetary Policy Committee meeting as the current OPR level remains
accommodative and supportive of the MYR bond market.
1.4 Market Outlook and Strategy
a) Equity
For the remaining months of 2020, the Malaysian equity market is expected to be
challenging as the country still face a third wave resurgence of Covid-19 outbreak. As
of end October Malaysia’s total Covid-19 cases had exceeded 30,000 while domestic
consumer spending and corporate earnings continue to struggle due to multiple
lockdown measures in Sabah, Selangor and Federal Territory. In view of the current
situation, the fund will maintain its investments in sectors that have better earnings
visibility and sustainability in hopes of sustaining its good performance for 2020 and
2021.
b) Sukuk Market & Money Market
Moving forward, it is viewed that the MYR government bond and sukuks to remain
supported. Concerted dovish monetary stance from global central banks, will likely
increase the appeal of higher yielding MYR bonds vis –a –vis bonds from advanced
economies. Although downside risk continues to persist, the reopening of economic
activities is expected to provide catalysts for further economic recovery.

9
1.5 Asset Allocation
BIMB i Flexi Fund 30.9.2020
(%)
31.3.2020
(%)
31.3.2019
(%)
31.3.2018
(%)
Investment in Quoted
Securities:
Consumer discretionary - - 5.33
Consumer products & services 7.14 1.65 22.06 20.05
Health care 4.00 - - 12.17
Industrial products & services 34.69 28.51 25.31 12.00
Technology 24.30 14.47 36.57 20.90
Trading and services - - 7.13 -
Warrant - - 0.84 5.83
70.13 44.63 91.91 76.28
Cash and Short Term
Investments: 29.87 55.37 8.09 23.72
100.00 100.00 100.00 100.00

10
1.6 Other Performance Data for the 6 Months Financial Period Ended 30 September
2020 and Three Financial Years Ended 31 March 2020, 2019 and 2018
BIMB i Flexi Fund
6 months
ended
30.9.2020
Year
ended
31.3.2020
Year
ended
31.3.2019
Year
ended
31.3.2018
Unit Prices (RM)
Highest NAV per unit for the
period/year 0.3586 0.2194 0.2528 0.2882
Lowest NAV per unit for the
period/year 0.1678 0.1550 0.1889 0.2200
Net Asset Value (NAV)
and Units in Circulation
(UIC) as at the End of the
Period/Year
Total NAV (RM) 7,908,016 1,573,168 3,268,500 3,606,794
Units in Circulation (UIC) 26,070,356 9,327,564 15,750,493 16,327,720
NAV per unit (RM) 0.3033 0.1687 0.2075 0.2209
Return of Fund (%)
Capital Growth (%)(b)
79.79 -18.70 -6.07 -2.08
Income Return (%)(c)
- - - -
Return of Fund (%)(a)
79.79 -18.70 -6.07 -2.08
Management Expense
Ratio (MER) (%)(d) 1.85 2.83 2.49 2.22
Portfolio Turnover Ratio
(PTR) (times)(e) 3.30 3.69 2.53 4.27
Note:
a) Return of the
Fund
= NAV per unit (end of period) - 1
NAV per unit (beginning of period)
b) Capital Growth = Total Return of the Fund – Income Return
c) Income Return = (Income Distribution per Unit / NAV per Unit on
beginning of period) x 100
d) Management
Expenses Ratio
= It is the total management expenses expressed as an
annual percentage of the Fund‟s average Net Asset
Value.
e) Portfolio
Turnover Ratio
= It represents the average of the total acquisitions and
disposals of the investment in the Fund for the annual
period over the average Net Asset Value of the Fund
calculated on a daily basis.

11
1.7 Unit Holdings as at 30 September 2020
Size of Holdings
BIMB i Flexi Fund
No. of Unit Holders No. of Units Held
No. % Units %
5,000 and below 19 26.03 66,609.16 0.26
5,001 to 10,000 6 8.22 37,376.24 0.14
10,001 to 50,000 29 39.72 723,358.43 2.77
50,001 to 500,000 14 19.18 1,686,422.79 6.47
500,001 and above 5 6.85 23,556,589.15 90.36
Total 73 100.00 26,070,355.77 100.00
1.8 Policy on Rebate and Soft Commission
Any stock broking rebates received by the Manager will be directed to the account of the
Fund. Any soft commissions received from the brokers who are in the form of research
and advisory services that assist in the decision-making process relating to the Fund‟s
investment may be retained by the Manager.
For the financial period under review, the Manager had received on behalf of the Fund,
soft commissions from brokers in the form of research and advisory services which are of
demonstrable benefit to Unit Holders of the Fund.
For and on behalf of
The Manager
BIMB INVESTMENT MANAGEMENT BERHAD
Date: 27 November 2020

12
1.0 Laporan Pengurus
Para Pemegang Unit,
Kami dengan sukacitanya membentangkan Laporan Pengurus BIMB i Flexi Fund bagi
tempoh kewangan 6 bulan berakhir pada 30 September 2020.
1.1 Nama Dana/ Jenis Dana/ Kategori Dana/ Objektif Pelaburan Dana/ Penanda Aras
Dana/ Polisi Agihan Dana
Nama Dana BIMB i Flexi Fund
Jenis Dana Pertumbuhan
Kategori Dana Aset Campuran
Objektif Pelaburan Dana
Tujuan utama Dana ini adalah untuk mencapai pertumbuhan
modal dalam jangkamasa panjang dengan melabur dalam
pelbagai portfolio sekuriti patuh Shariah.
Sebarang perubahan ketara kepada objektif pelaburan Dana
memerlukan kelulusan daripada Pemegang Unit.
Penanda Aras
Dana
Penanda aras prestasi terpilih bagi Dana ini adalah
berdasarkan kepada nisbah 50:50 Indeks FBM Emas
Shariah dan pulangan 12 bulan Deposit Bertempoh-i
Tawarruq (TDT-i) Bank Islam Malaysia Berhad*.
*Penanda aras ini mencerminkan strategi pelaburan dan
peruntukan aset Dana, di mana Dana dibenarkan untuk
melaburkan asetnya ke dalam ekuiti patuh Shariah, Sukuk
dan instrumen pasaran wang Islam, bergantung kepada
prospek pasaran. Profil risiko Dana tidak sama dengan profil
risiko penanda aras prestasi.
*Sumber: www.bursamalaysia.com dan www.bankislam.com.my
Polisi Agihan
Dana
Pengagihan pendapatan adalah sampingan.

13
1.2 Pencapaian Dana bagi Tempoh Kewangan 6 Bulan Berakhir 30 September 2020
1.2.1 Kajian Pencapaian
Bagi tempoh kewangan dalam semakan, BIMB i Flexi Fund (“Dana”) mencatatkan
pulangan sebanyak 79.79% berbanding dengan pulangan penanda aras sebanyak
14.02%.
Penanda aras terpilih untuk prestasi Dana adalah berdasarkan kepada nisbah 50:50
Indeks FBM Emas Shariah dan kadar 12 bulan Deposit Bertempoh-i Tawarruq (TDT-i)
Bank Islam Malaysia Berhad.
Strategi kami adalah untuk terus memberikan tumpuan kepada syarikat-syarikat yang
kukuh yang mempunyai prospek yang baik dalam pertumbuhan pendapatan dan
peningkatan modal.
Pada 30 September 2020, Dana ini mempunyai pendedahan sebanyak 70.13% dalam
pasaran ekuiti dan 29.87% dalam tunai dan setara tunai. Jumlah Nilai Aset Bersih (NAB)
Dana adalah RM7.91 juta manakala NAB seunit Dana adalah RM0.3033.
Bagi tempoh dalam kajian, pendedahan ekuiti Dana adalah antara 60% hingga 99%.
Dana ini akan meneruskan kepelbagaian strategi pelaburan dalam pelbagai sektor untuk
memaksimumkan peluang pelaburan sambil melindungi Dana dari risiko kemerosotan
nilai, dengan mengambil kira prospek ekonomi tempatan dan global untuk jangka masa
pendek hingga sederhana.
Pada 20 Mei 2020, kami telah mengeluarkan Prospektus Induk Gantian untuk Dana yang
antara lain membolehkan pelaburan dalam sekuriti luar negara. Selain daripada itu, tiada
sebarang perubahan yang ketara dalam hal ehwal pengurusan Dana dan tidak berlaku
sebarang keadaan yang secara material memberi kesan kepada kepentingan Pemegang
Unit sehingga tarikh Laporan Pengurus ini disediakan.

14
1.2.2 Jumlah Pulangan dan Purata Jumlah Pulangan bagi Setiap Tempoh Kewangan
Berakhir 30 September
Tempoh
BIMB i Flexi Fund Penanda Aras
Jumlah
Pulangan
(%)
Purata
Jumlah
Pulangan
(%)
Jumlah
Pulangan
(%)
Purata
Jumlah
Pulangan
(%)
6 bulan
(Mac 20 - Sept 20) 79.79 159.6 14.02 28.04
1 tahun
(Okt 19 - Sept 20) 50.15 50.15 6.68 6.88
3 tahun
(Okt 17 - Sept 20) 21.81 7.27 6.16 2.05
5 tahun
(Okt 15 - Sept 20) 40.48 8.10 13.98 2.80
1.2.3 Jumlah Pulangan Tahunan bagi 5 Tahun Kewangan yang Lalu
Tahun Kewangan
Jumlah Pulangan
BIMB i Flexi Fund
(%)
Penanda Aras
(%)
31 Mac 2020 -18.70 -5.32
31 Mac 2019 -6.07 -4.14
31 Mac 2018 -2.08 3.38
31 Mac 2017 7.58 3.00
31 Mac 2016 -15.44 -0.56

15
Rajah 1: Pergerakan Dana Berbanding Penanda Aras
Sumber Data : BIMB Investment Management Berhad
Data disahkan oleh : Novagni Analytics & Advisor Sdn. Bhd.
Penanda Aras : 50:50 Indeks FBM Emas Shariah dan kadar 12 bulan
Deposit Bertempoh-i Tawarruq (TDT-i) Bank Islam
Malaysia Berhad
Nota:
1. Jumlah Pulangan Dana telah disahkan oleh Novagni Analytics & Advisor Sdn. Bhd.
(363145-W)
2. Jumlah Pulangan Purata adalah berpandukan formula berikut:
Jumlah Pulangan
Bilangan Tahun Bawah Kajian
Pengiraan jumlah pulangan purata adalah berdasarkan kaedah yang diperoleh dari Lipper
Asia Ltd.
Prestasi tahunan sebelum ini tidak semestinya menjadi petunjuk prestasi masa depan dan
harga unit serta pulangan pelaburan mungkin turun dan naik.

16
1.3 Ekonomi dan Kajian Pasaran
1.3.1 Ekonomi
a) Global
Keluaran Dalam Negara Kasar (KDNK) Amerika Syarikat (AS) mencatatkan
penurunan sebanyak 2.9% pada suku ketiga 2020 berbanding suku yang sama
tahun lalu. Dibandingkan dengan suku kedua 2020, ekonomi AS meningkat pada
kadar tahunan 33.1% semasa suku ketiga, berikutan ekonomi yang semakin pulih
daripada pandemik Covid-19.
Ekonomi zon Euro merosot sebanyak 4.4% pada suku ketiga 2020 berbanding
tahun lalu, iaitu lebih baik berbanding kemerosotan sebanyak 14.8% yang
direkodkan pada suku kedua 2020. Angka pengangguran untuk bulan September
kekal mendatar.
Ekonomi China telah meningkat pada suku ketiga 2020, dengan KDNK pada
bulan Julai-September mencatatkan peningkatan sebanyak 4.9% dari tahun
sebelumnya, berikutan pelonggaran kawalan-kawalan pergerakan berkaitan
Covid-19.
(Sumber: Bureau of Economic Analysis, CNBC, Trading Economics, CGTN)
b) Dalam Negara
Ekonomi Malaysia merosot 2.7% untuk suku ketiga 2020 berbanding tahun lalu,
berbanding kemerosotan lebih besar sebanyak 17.1% yang dialami semasa suku
kedua 2020. Peningkatan ini menunjukkan keberkesanan pembukaan semula
ekonomi semasa Perintah Kawalan Pergerakan Pemulihan dan suasana
permintaaan luaran yang lebih baik.
Jawatankuasa Dasar Monetari Bank Negara Malaysia (BNM) telah
mengurangkan Kadar Polisi Semalaman (OPR) sebanyak 50 mata asas pada
bulan Mei dan 25 mata asas pada bulan Julai 2020, membawa OPR ke paras
1.75%. Pelarasan itu adalah sebagai langkah untuk menyokong ekonomi
domestik di kala suasana ekonomi global sedang lemah disebabkan oleh
penularan wabak Covid-19.
(Sumber: Bloomberg, Bank Negara Malaysia dan Jabatan Statistik Malaysia)

17
1.3.2 Kajian Pasaran
a) Ekuiti
Indeks FTSE Bursa Malaysia Emas Shariah (FBM Shariah) telah memulakan
tempoh dalam semakan pada paras 10,105.08 mata. Selepas itu, ia jatuh ke paras
terendah iaitu 9,923.39 mata pada 1 April 2020 sebelum meningkat ke paras
tertinggi iaitu 13,646.60 mata pada 6 Ogos 2020 dan ditutup pada pada paras
12,900.94 mata pada 30 September 2020. Bagi tempoh kewangan dalam semakan,
FBM Shariah telah meningkat sebanyak 2,795.86 mata atau 27.67%.
b) Pasaran Sukuk dan Pasaran Wang
Bagi tempoh dalam semakan, bon dan sukuk kerajaan Malaysia terus bertahan
dengan hasil penanda aras MGS 3-tahun dan 10-tahun masing-masing pada paras
1.99% dan 2.67% setelah mencatatkan paras terendah iaitu 1.83% dan 2.40% pada
bulan Ogos. Kadar hasil bon dan sukuk Kerajaan Malaysia meningkat sedikit
ekoran keputusan Bank Negara Malaysia untuk mengekalkan Kadar Polisi
Semalaman (OPR) pada paras 1.75% ketika mesyuarat Jawatankuasa Dasar
Monetari bulan September berikutan tahap OPR semasa kekal akomodatif dan
menyokong pasaran bon MYR.
1.4 Tinjauan Pasaran dan Strategi
a) Ekuiti
Sehingga akhir tahun 2020, pasaran ekuiti Malaysia dijangka mencabar kerana
negara masih menghadapi gelombang ketiga penularan Covid-19. Sehingga akhir
Oktober, jumlah kes Covid-19 di Malaysia telah melampaui 30,000 kes sementara
perbelanjaan pengguna domestik dan pendapatan korporat terus menghadapi
kesukaran berikutan langkah-langkah kawalan pergerakan di serata Malaysia.
Memandangkan keadaan semasa, Dana akan mengekalkan pelaburannya di
sektor-sektor yang mempunyai prospek dan kelestarian pendapatan yang lebih baik
dengan harapan dapat mengekalkan prestasi yang baik untuk tahun 2020 dan
2021.
b) Pasaran Sukuk & Pasaran Wang
Melangkah ke hadapan, pasaran bon dan sukuk kerajaan MYR dijangkakan terus
disokong. Pendekatan dasar monetari yang longgar dari bank-bank pusat global,
dijangka meningkatkan daya tarikan bon MYR yang mempunyai kadar hasil lebih
tinggi berbanding bon dari ekonomi-ekonomi maju. Walaupun risiko kemerosotan
ekonomi masih wujud, pembukaan semula kegiatan-kegiatan ekonomi dijangka
menjadi pemangkin untuk pemulihan ekonomi lebih lanjut.

18
1.5 Peruntukan Aset
BIMB i Flexi Fund 30.9.2020
(%)
31.3.2020
(%)
31.3.2019
(%)
31.3.2018
(%)
Pelaburan Sekuriti
Tersiarharga:
Keperluan pengguna - - 5.33
Barangan & perkhidmatan
pengguna 7.14 1.65 22.06 20.05
Kesihatan 4.00 - - 12.17
Barangan & perkhidmatan
industri 34.69 28.51 25.31 12.00
Teknologi 24.30 14.47 36.57 20.90
Perdagangan dan
perkhidmatan - - 7.13 -
Waran - - 0.84 5.83
70.13 44.63 91.91 76.28
Tunai dan Pelaburan Jangka
Pendek: 29.87 55.37 8.09 23.72
100.00 100.00 100.00 100.00

19
1.6 Lain-lain Data Prestasi bagi Tempoh Kewangan 6 Bulan Berakhir 30 September
2020 dan Tiga Tahun Kewangan Berakhir 31 Mac 2020, 2019 and 2018
BIMB i Flexi Fund
6 bulan
berakhir
30.9.2020
Tahun berakhir
31.3.2020
Tahun berakhir
31.3.2019
Tahun berakhir
31.3.2018
Harga Unit (RM)
NAB tertinggi seunit dalam
tempoh/tahun 0.3586 0.2194 0.2528 0.2882
NAB terendah seunit dalam
tempoh/tahun 0.1678 0.1550 0.1889 0.2200
Nilai Asset Bersih (NAB)
dan Unit Dalam Edaran
(UDE) pada Akhir
Tempoh/Tahun
Jumlah NAB (RM) 7,908,016 1,573,168 3,268,500 3,606,794
Unit Dalam Edaran (UDE) 26,070,356 9,327,564 15,750,493 16,327,720
NAB seunit (RM) 0.3033 0.1687 0.2075 0.2209
Jumlah Pulangan Dana
(%)(a)
Pertumbuhan Modal (%)(b)
79.79 -18.70 -6.07 -2.08
Pulangan Pendapatan (%)(c)
- - - -
Jumlah Pulangan Dana (%)
79.79 -18.70 -6.07 -2.08
Nisbah Perbelanjaan
Pengurusan
(NPP) (%)(d)
1.85 2.83 2.49 2.22
Nisbah Pusing Ganti
Portfolio (kali)(e) 3.30 3.69 2.53 4.27
Nota:
a) Pulangan ke
atas Dana
= Harga seunit (pada akhir tempoh) - 1
Harga seunit (pada awal tempoh)
b) Pertumbuhan
Modal = Pulangan Ke atas Dana – Pulangan Pendapatan
c) Pulangan
Pendapatan
= (Pengagihan Pendapatan Seunit / NAB seunit pada awal
tempoh) x 100
d) Nisbah
Perbelanjaan
Pengurusan
= Ia dikira dengan mengambil jumlah perbelanjaan pengurusan
sepertimana yang dinyatakan sebagai peratusan tahunan
daripada jumlah purata Nilai Aset Bersih Dana
e) Nisbah
Perolehan
Portfolio
= Ia dikira dengan mengambil purata jumlah perolehan dan
pelupusan pelaburan dalam Dana bagi tempoh tahunan
dibahagi dengan purata Nilai Aset Bersih Dana yang dikira
pada asas harian

20
1.7 Pegangan Unit pada 30 September 2020
Saiz Dipegang
BIMB i Flexi Fund
Bilangan Pemegang
Unit Jumlah Pegangan Unit
Bilangan % Bilangan %
5,000 dan ke bawah 19 26.03 66,609.16 0.26
5,001 hingga 10,000 6 8.22 37,376.24 0.14
10,001 hingga 50,000 29 39.72 723,358.43 2.77
50,001 hingga 500,000 14 19.18 1,686,422.79 6.47
500,001 dan ke atas 5 6.85 23,556,589.15 90.36
Jumlah 73 100.00 26,070,355.77 100.00
1.8 Polisi Rebat dan Komisyen Bukan Tunai
Sebarang rebat broker saham yang diterima oleh Pengurus akan dimasukkan ke
dalam akaun Dana. Mana-mana komisen ringan (bukan tunai) yang diterima daripada
broker dalam bentuk perkhidmatan penyelidikan dan khidmat nasihat bertujuan
membantu proses membuat keputusan berkaitan dengan pelaburan Dana boleh
disimpan oleh Pengurus.
Bagi tempoh kewangan dalam semakan, Pengurus telah menerima komisen ringan
(bukan tunai) bagi pihak Dana, daripada broker dalam bentuk perkhidmatan
penyelidikan dan khidmat nasihat yang bermanfaat untuk para Pemegang Unit Dana.
Bagi dan bagi pihak
Pengurus
BIMB INVESTMENT MANAGEMENT BERHAD
Tarikh: 27 November 2020
Nota:
Laporan ini telah diterjemahkan daripada laporan asal (dalam Bahasa Inggeris). Jika
terdapat perbezaan, sila rujuk kepada laporan Bahasa Inggeris.

21
2.0 Trustee’s Report
INTERIM REPORT FOR THE 6 MONTHS FINANCIAL PERIOD ENDED
30 SEPTEMBER 2020
To the Unit Holders of
BIMB i FLEXI FUND
We, Amanahraya Trustees Berhad, have acted as Trustee of BIMB i Flexi Fund for the 6
months financial period ended 30 September 2020. In our opinion, BIMB Investment
Management Berhad, the Manager, has operated and managed BIMB i Flexi Fund in
accordance with the limitations imposed on the investment powers of the management
company under the Deed, securities laws and the applicable Guidelines on Unit Trust
Funds for the six months financial period ended 30 September 2020.
We are also of the opinion that:
(a) Valuation and pricing is carried out in accordance with the Deed and any regulatory
requirement; and
(b) Creation and cancellation of units are carried out in accordance with the Deed and
any regulatory requirement.
Yours faithfully
AMANAHRAYA TRUSTEES BERHAD
____________________
HABSAH BINTI BAKAR
Chief Executive Officer
Kuala Lumpur, Malaysia
Date: 27 November 2020
22
3.0 Shariah Committee’s Report
INTERIM REPORT FOR THE 6 MONTHS FINANCIAL PERIOD ENDED
30 SEPTEMBER 2020
To the Unit Holders of
BIMB i FLEXI FUND
We have acted as the Shariah Committee of BIMB i Flexi Fund.
Our responsibilities are to ensure that the procedures and processes employed by BIMB
Investment Management Berhad and that the provisions of the Deed dated 27 March
2013 and the Supplementary Deeds are in accordance with Shariah principles.
In our opinion, BIMB Investment Management Berhad has managed BIMB i Flexi Fund in
accordance with Shariah principles and complied with applicable guidelines, rulings or
decisions issued by the Securities Commission pertaining to Shariah matters for the 6
month financial period ended 30 September 2020.
In addition, we also confirm that the investment portfolio of BIMB i Flexi Fund comprise
instruments that have been classified as Shariah-compliant by the Shariah Advisory
Council (SAC) of the Securities Commission or the SAC of Bank Negara Malaysia.
For and on behalf of the Shariah Committee
………………………………………………..
DR. AHMAD SHAHBARI@SOBRI SALAMON
(Chairman)
Date: 27 November 2020

23
4.0 Directors’ Declaration
INTERIM REPORT FOR THE 6 MONTHS FINANCIAL PERIOD ENDED
30 SEPTEMBER 2020
To the Unit Holders of
BIMB i Flexi Fund
We, Dato‟ Ghazali Bin Awang and Najmuddin Bin Mohd Lutfi, being two of the directors of
the Manager, BIMB Investment Management Berhad, for BIMB i Flexi Fund do hereby
state that in our opinion, the accompanying Statement of Financial Position, Statement of
Profit or Loss and Other Comprehensive Income, Statement of Changes in Net Asset
Value and Statement of Cash Flows are drawn up so as to give a true and fair view of the
Statement of Financial Position of the Fund as at 30 September 2020 and Statement of
Profit or Loss and Other Comprehensive Income, Statement of Changes in Net Asset
Value and Statement of Cash Flows for the financial period ended on that date.
For and on behalf on the Board of Directors,
………………………………
Dato’ Ghazali Bin Awang
(Non-Executive Independent Director)
……………………………….
Najmuddin Bin Mohd Lutfi
(Chief Executive Officer)
Date: 27 November 2020

24
5.0 Unaudited Financial Statements
5.1 Unaudited Statement of Comprehensive Income for the 6 Months Financial Period Ended 30 September 2020
Note 1.4.2020 to
30.9.2020
1.4.2019 to
30.9.2019 RM RM
INVESTMENT INCOME/(LOSS)
Dividend income 16,736 20,989
Profit income from Shariah-compliant deposit with licensed Islamic financial institutions
2,418
6,017
Hibah 71 291
Gain/(Loss) on sale of quoted securities 794,641 (1,168,630) Net unrealised gain from financial
instruments at fair value through profit or
loss
490,846
1,126,526
1,304,712
(14,807)
EXPENSES
Management fee 4 25,460 20,231
Trustee‟s fee 5 849 674
Audit fee - 10,924 Tax agent‟s fee - 1,521
Administrative expenses 5,064 5,352
31,373
38,702
INCOME/(LOSS) BEFORE TAXATION 1,273,339 (53,509) Taxation
6
-
-
INCOME/(LOSS) AFTER TAXATION AND
TOTALCOMPREHENSIVE INCOME/(LOSS) FOR THE
PERIOD
1,273,339
(53,509)
Total comprehensive income/(loss) for the
period consist of:
Realised amount 782,493 (1,180,035)
Unrealised amount 490,846 1,126,526
1,273,339
(53,509)
The notes on pages 28 to 51 are an integral part of these financial statements.

25
5.2 Unaudited Statement of Financial Position as at 30 September 2020
Note As at 30.09.2020 (Unaudited)
As at 31.03.2020
(Audited)
RM RM
ASSETS
Cash and cash equivalents (Shariah-compliant)
8
2,611,540
910,580
Financial assets at fair value through profit
or loss (Shariah-compliant)
7
5,545,870
702,145
Amount due from Stockbroker 242,915 - Amount due from Manager 661 -
Other receivables 16,735 749
TOTAL ASSETS 8,417,721 1,613,474
LIABILITIES
Amount due to stockbrokers 379,259 -
Amount due to Managers 97,583 949
Accrued management fee 8,040 2,096
Amount due to Trustee 268 70
Other payables 24,555 37,191
TOTAL LIABILITIES 509,705 40,306
NET ASSET VALUE (“NAV”) OF THE FUND
7,908,016
1,573,168
EQUITY
Unit holders‟ capital 9 8,838,631 3,777,122
Accumulated losses (930,615) (2,203,954)
NET ASSET ATTRIBUTANLE TO UNIT HOLDERS
7,908,016 1,573,168
NUMBER OF UNITS IN CIRCULATION (UNITS)
9
26,070,356
9,327,564
NET ASSET VALUE PER UNIT (SEN)
30.33
16.87
The notes on pages 28 to 51 are an integral part of these financial statements.

26
5.3 Unaudited Statement of Changes in Equity for the 6 Months Financial Period Ended 30 September 2020
Unit holders’
capital
Accumulated
losses
Total
RM RM RM
Balance as at 1 April 2020 3,777,122 (2,203,954) 1,573,168
Movement in unit holders‟ contributions - Creation of units from applications 6,471,511 - 6,471,511
- Cancellation of units (1,410,002) - (1,410,002)
Total comprehensive income for the
financial period - 1,273,339 1,273,339
Balance as at 30 September 2020 8,838,631 (930,615) 7,908,016
Balance as at 1 April 2019 5,202,797 (1,596,003) 3,606,794 Movement in unit holders‟ contributions
- Creation of units from applications 1,160,501 - 1,160,501
- Cancellation of units (784,764) - (784,764)
Total comprehensive income for the financial period
- 445,222 445,222
Balance as at 30 September 2019 5,578,534 (1,150,781) 4,427,753
The notes on pages 28 to 51 are an integral part of these financial statements.

27
5.4 Unaudited Statement of Cash Flows for the 6 Months Financial Period Ended 30 September 2020
Note 1.4.2020 to
30.9.2020 1.4.2019 to
30.9.2019
RM RM
CASH FLOWS FROM OPERATING ACTIVITIES
Proceed from sale of quoted Shariah-compliant securities
9,560,316
4,60,878
Purchase of quoted Shariah-compliant
securities
(12,982,210)
(33,21,024)
Dividend received 750 32,484
Profit income received from Shariah-compliant deposit with licensed Islamic financial institutions
2,418
5,896
Hibah earned 71 291
Management fee paid (19,516) (21,418)
Trustee fee paid (651) (714)
Audit fee paid (12,400) -
Tax agent fee paid - -
Payment for administrative expenses (5,301) (2,652)
NET CASH (USED IN)/GENERATED FROM OPERATING ACTIVITIES
(3,456,523)
1,301,541
CASH FLOWS FROM FINANCING ACTIVITIES
Cash proceeds from creation of units 6,470,850 27,867
Payments for cancellation of units (1,313,367) (1,097,733)
NET CASH GENERATED FROM/(USED IN)
FINANCING ACTIVITIES
5,157,483 (1,069,866)
Net increase in cash and cash equivalents 1,700,960 231,675
Cash and cash equivalents at the beginning of the financial period
910,580
285,811
Cash and cash equivalents at the end of the
financial period
8
2,611,540
517,486
Cash and cash equivalents comprise of:
Commodity Murabahah 1,527,112 380,000
Wafiyah Investment Account 983,043 -
Cash at bank 101,385 137,486
2,611,540 517,486
The notes on pages 28 to 51 are an integral part of these financial statements.

28
5.5 Notes to the Financial Statements for the 6 months financial period ended 30 September 2020 (unaudited)
1. Information on the Fund
BIMB i Flexi Fund (hereinafter referred to as “the Fund”) was constituted pursuant to the
execution of a Deed dated 27 March 2013 between the Manager - BIMB Investment
Management Berhad, the Trustee - AmanahRaya Trustees Berhad and the registered unit
holders of the Fund.
The principal activity of the Fund is to invest in authorised investments as defined in the
Deed, which include investments in stocks and shares of companies quoted on Bursa
Malaysia and short term placements.
The Manager, BIMB Investment Management Berhad, a company incorporated in Malaysia,
is a subsidiary of Bank Islam Malaysia Berhad.
2. Summary of Significant Accounting Policies
The following accounting policies have been used consistently in dealing with items which
are considered material in relation to the financial statements:
(a) Basis of preparation
The financial statements of the Fund have been prepared in accordance with
Malaysian Financial Reporting Standards (“MFRS”) and International Financial
Reporting Standards (“IFRS”).
The financial statements have been prepared under the historical cost convention, as
modified by the revaluation of financial assets at fair value through profit or loss
(“FVTPL”).
The preparation of financial statements in conformity with MFRS requires the use of
certain critical accounting estimates and assumptions that affect the reported amounts
of assets and liabilities and disclosure of contingent assets and liabilities at the date of
the financial statements, and the reported amounts of revenues and expenses during
the reported period.
It also requires the Manager to exercise their judgment in the process of applying the
Fund’s accounting policies. Although these estimates and judgment are based on the
Manager’s best knowledge of current events and actions, actual results may differ.
The areas involving a higher degree of judgment or complexity, or areas where
assumptions and estimates are significant to the financial statements are disclosed in
Note 2(i).

29
2. Summary of Significant Accounting Policies (continued)
(a) Basis of preparation (continued)
(i) Standards, amendments to published standards and interpretations that are
effective
The Fund has applied the following standards and amendments for the first time
for the financial year beginning on 1 April 2019:
• IC Interpretation 23 ‘Uncertainty over Income Tax Treatments’
• Annual Improvements to MFRSs 2015 – 2017 Cycle
The adoption of amendments listed above did not have any impact on the current
period or any prior period and is not likely to affect future periods.
(b) Financial assets
(i) Recognition and initial measurement
A financial instrument is recognised in the statement of financial position when,
and only when, the Fund becomes a party to the contractual provisions of the
instrument.
A financial asset (unless it is a trade receivable without significant financing
component) or a financial liability is initially measured at fair value plus or minus,
for an item not at fair value through profit or loss, transaction costs that are directly
attributable to its acquisition or issuance. A trade receivable without a significant
financing component is initially measured at the transaction price.
Categories of financial assets are determined on initial recognition and are not
reclassified subsequent to their initial recognition unless the Fund changes its
business model for managing financial assets in which case all affected financial
assets are reclassified on the first day of the first reporting year following the
change of the business model.
The Fund categorises financial instruments as follows:
(a) Amortised cost
Amortised cost category comprises financial assets that are held within a
business model whose objective is to hold assets to collect contractual cash
flows and its contractual terms give rise on specified dates to cash flows that
are solely payments of principal and profit on the principal amount
outstanding. The financial assets are not designated as fair value through
profit or loss.

30
2. Summary of Significant Accounting Policies (continued)
(b) Financial assets (continued)
(i) Recognition and initial measurement (continued)
(a) Amortised cost (continued)
Subsequent to initial recognition, these financial assets are measured at
amortised cost using the effective profit method. The amortised cost is
reduced by impairment losses. Profit income, foreign exchange gains and
losses and impairment are recognised in profit or loss.
Profit income is recognised by applying effective profit rate to the gross
carrying amount except for credit impairment financial assets (see Note 2
(b)(iv)) where the effective profit rate is applied to the amortised cost.
(b) Fair value through profit or loss
All financial assets not measured at amortised cost or fair value through
other comprehensive income as described above are measured at fair value
through profit or loss. On initial recognition, the Fund may irrevocably
designate a financial asset that otherwise meets the requirements to be
measured at amortised cost or at fair value through other comprehensive
income as at fair value through profit or loss if doing so eliminates or
significantly reduces an accounting mismatch that would otherwise arise.
Financial assets categorised as fair value through profit or loss are
subsequently measured at their fair value. Net gains or losses, including any
profit or dividend income, are recognised in the profit or loss.
(ii) Financial instrument categories and subsequent measurement
All financial assets, except for those measured at fair value through profit or
loss, are subject to impairment assessment (see Note 2(b)(iv)).
(iii) Derecognition
A financial asset or part of it is derecognised when, and only when, the
contractual rights to the cash flows from the financial asset expire or the
financial asset is transferred to another party without retaining control or
substantially all risks and rewards of the asset.

31
2. Summary of Significant Accounting Policies (continued)
(b) Financial assets (continued)
(iii) Derecognition (continued)
On derecognition of a financial asset, the difference between the carrying
amount and the sum of the consideration received (including any new asset
obtained less any new liability assumed) and any cumulative gain or loss that
had been recognised in equity is recognised in profit or loss.
A financial liability or a part of it is derecognised when, and only when, the
obligation specified in the contract is discharged or cancelled or expires. On
derecognition of a financial liability, the difference between the carrying amount
of the financial liability extinguished or transferred to another party and the
consideration paid, including any non-cash assets transferred or liabilities
assumed, is recognised in profit or loss.
(iv) Impairment for assets carried at amortised cost
For assets carried at amortised cost, the Fund assesses at the end of the
reporting period whether there is objective evidence that a financial asset or
group of financial assets is impaired. A financial asset or a group of financial
assets is impaired and impairment losses are incurred only if there is objective
evidence of impairment as a result of one or more events that occurred after the
initial recognition of the asset (a ‘loss event’) and that loss event (or events) has
an impact on the estimated future cash flows of the financial asset or group of
financial assets that can be reliably estimated.
The amount of the loss is measured as the difference between the asset’s
carrying amount and the present value of estimated future cash flows (excluding
future credit losses that have not been incurred) discounted at the financial
asset’s original effective profit rate. The asset’s carrying amount is reduced and
the amount of the loss is recognised in profit or loss. If ‘receivables’ or a ‘held-to-
maturity Shariah-compliant investment’ has a variable profit rate, the discount
rate for measuring any impairment loss is the current effective profit rate Islamic
deposits with licensed financial institutions are stated at cost plus accrued profit
income calculated using the effective profit rate method over the financial period
from the date of placement to the date of maturity of the respective Islamic
deposits. Receivables and other financial liabilities are subsequently carried at
amortised cost using the effective profit rate method determined under the
contract. As a practical expedient, the Fund may measure impairment on the
basis of an instrument’s fair value using an observable market price.

32
2. Summary of Significant Accounting Policies (continued)
(b) Financial assets (continued)
(iv) Impairment for assets carried at amortised cost (continued)
If, in a subsequent period, the amount of the impairment loss decreases and the
decrease can be related objectively to an event occurring after the impairment
was recognised (such as an improvement in the debtor’s credit rating), the
reversal of the previously recognised impairment loss is recognised in statement
of comprehensive income.
When an asset is uncollectible, it is written off against the related allowance
account. Such assets are written off after all the necessary procedures have
been completed and the amount of the loss has been determined.
The Fund measures credit risk and expected credit losses using probability of
default, exposure at default and loss given default. Management considers both
historical analysis and forward looking information in determining any expected
credit loss. Management considers the probability of default to be close to zero
as these instruments have a low risk of default and the counterparties have a
strong capacity to meet their contractual obligations in the near term. As a
result, no loss allowance has been recognised based on 12 month expected
credit losses as any such impairment would be wholly insignificant to the Fund.
Significant increase in credit risk
A significant increase in credit risk is defined by management as any contractual
payment which is more than 90 days past due.
Definition of default and credit-impaired financial assets
Any contractual payment which is more than 90 days past due is considered
credit impaired.
Write-off
The Fund writes off financial assets, in whole or in part, when it has exhausted
all practical recovery efforts and has concluded there is no reasonable
expectation of recovery. The assessment of no reasonable expectation of
recovery is based on unavailability of debtor’s sources of income or assets to
generate sufficient future cash flows to repay the amount. The Fund may write-
off financial assets that are still subject to enforcement activity. Subsequent
recoveries of amounts previously written off will result in impairment gains.
There are no write-offs/recoveries during the financial year.

33
2. Summary of Significant Accounting Policies (continued)
(c) Financial liabilities
The categories of financial liabilities at initial recognition are as follows:
Amortised cost
Other financial liabilities not categorised as fair value through profit or loss are
subsequently measured at amortised cost using the effective profit method.
(d) Income recognition
Income from short term investments is recognised as it accrues, using the effective
profit method in profit or loss.
Dividend income is recognised on the ex-dividend date, when the right to receive the
dividend has been established.
Realised gains and losses on sale of Shariah-compliant investments are accounted for
as the difference between the net disposal proceeds and the carrying amount of
investments, determined on weighted average cost basis.
(e) Cash and cash equivalents
Cash and cash equivalents consist of cash at bank and short term placements with
licensed financial institutions which have insignificant risk of changes in fair value with
original maturities of less than 30 days, and are used by the Fund in the management
of its short term commitments.
Cash and cash equivalents are categorised and measured as amortised cost.
(f) Income tax
Income tax expense comprises current tax. Current tax is recognised in profit or loss
except to the extent that it relates to items recognised directly in equity or other
comprehensive income.
Current tax is the expected tax payable on the taxable income for the year, using tax
rates enacted or substantively enacted at the statement of financial position date.
(g) Unit holders’ capital
The Fund issues cancellable units, which are cancelled at the unitholder’s option and
are classified as equity. Cancellable units can be put back to the Fund at any time for
cash equal to a proportionate share of the Fund’s net asset value.

34
2. Summary of Significant Accounting Policies (continued)
(g) Unit holders’ capital (continued)
The outstanding units is carried at the redemption amount that is payable at the
financial position date if the unitholder exercises the right to put the unit back to the
Fund.
Units are created and cancelled at the unitholder’s option at prices based on the
Fund’s net asset value per unit at the time of creation or cancellation. The Fund’s net
asset value per unit is calculated by dividing the net asset attributable to unitholders’
with the total number of outstanding units. In accordance with the Securities
Commission’s Guidelines on Unlisted Capital Market Products under the Lodge and
Launch Framework in Malaysia, investment positions are valued based on the last
traded market price for the purpose of determining the net asset value per unit for
creations and cancellations.
The units in the Fund are puttable instruments, classified as equity, which entitle the
unit holders to a pro-rata share of the net asset of the Fund. The units are
subordinated and have identical features. There is no contractual obligation to deliver
cash or another financial asset other than the obligation on the Fund to repurchase the
units. The total expected cash flows from the units are based on the change in the net
asset of the Fund.
(h) Functional and presentation currency
Items included in the financial statements of the Fund are measured using the
currency of the primary economic environment in which the Fund operates (the
“functional currency”). The financial statements are presented in Ringgit Malaysia
("RM"), which is the Fund’s functional and presentation currency.
(i) Use of estimates and judgements
The preparation of financial statements in conformity with MFRSs requires
management to make judgements, estimates and assumptions that affect the
application of accounting policies and the reported amounts of assets, liabilities,
income and expenses. Actual results may differ from these estimates.
Estimates and underlying assumptions are reviewed on an ongoing basis. Revisions
to accounting estimates are recognised in the year in which the estimate is revised
and in any future years affected.
There are no significant areas of estimation uncertainty and critical judgements in
applying accounting policies that have significant effect on the amounts recognised in
the financial statements.

35
3. Financial Instruments and Financial Risk Management
Financial instruments of the Fund are as follows:
Financial assets at fair value through
profit or loss
Financial assets at amortised
cost
Total
RM RM RM
As at 30.9.2020
Cash and cash equivalents (Shariah-compliant)
-
2,611,540
2,611,540 Quoted Shariah-compliant
securities
5,545,870
-
5,545,870
Amount due from stockbrokers - 242,915 242,915
Amount due from Manager - 661 661
Other receivables -
16,735 16,735
5,545,870
2,871,851 8,417,721
As at 31.3.2020
Cash and cash equivalents (Shariah-compliant)
-
910,580
910,580
Quoted Shariah-compliant securities
702,145
-
702,145
Other receivables - 749
749
702,145 911,329 1,613,474
The Fund aims to provide investors with liquidity and regular income, whilst maintaining
capital stability by investing primarily in deposits that comply with Shariah principles.
The Fund is exposed to a variety of risks which include market risk (inclusive of price risk,
profit rate risk), credit risk and liquidity risk.
Financial risk management is carried out through internal control process adopted by the
Manager and adherence to the investment restrictions as stipulated in the Deeds and the
Guidelines.
(a) Market risk
(i) Price risk
The Fund is exposed to price risk because of investments held by the Fund and
classified as at fair value through profit or loss. Price risk is the risk that fair
value of investment will fluctuate because of the changes in market prices (other
than those arising from profit rate risk).

36
3. Financial Instruments and Financial Risk Management (continued)
(a) Market risk (continued)
(i) Price risk (continued)
Such fluctuation may cause the Fund’s NAV and price of units to fall as well as
rise, and income produced by the Fund may also fluctuate. The price risk is
managed through diversification and selection of securities and other financial
instruments within specified limits according to the Deed.
The table below shows the financial instruments of the Fund which is exposed to
price risk.
As at
30.9.2020 RM
As at 31.3.2020
RM Quoted Shariah-compliant securities measured at fair value through profit or loss 5,545,870 702,145
The following table summarises the sensitivity of the Fund’s investments to price
risk movements at the end of reporting period. The analysis is based on the
assumptions that the market price increased and decreased by 5% (31.3.2020:
5%) with all other variables held constant and that fair value of the Fund’s
investments move according to the historical correlation of the index.
Disclosures below are shown in absolute terms, changes and impacts could be
positive or negative.
Change in
price %
Impact on loss before tax
RM As at 30.9.2020 Quoted Shariah-compliant securities measured at fair value through profit or loss 5
277,294
As at 31.3.2020 Quoted Shariah-compliant securities measured at fair value through profit or loss 5 35,107

37
3. Financial Instruments and Financial Risk Management (continued)
(a) Market risk (continued)
(ii) Profit rate risk
Profit rate risk rate is a general economic indicator that will have an impact on
the management of the Fund.
It does not in any way suggest that this Fund will invest in conventional financial
instruments. All investment carried out for the Fund including placements and
deposits are in accordance with Shariah.
Fair value profit rate risk is the risk that the value of a financial instrument will
fluctuate due to changes in market profit rates.
The Fund’s exposure to fair value profit rate risk arises from Shariah-compliant
investment in money market instruments. The profit rate risk is expected to be
minimal as the Fund’s investments comprise mainly Shariah-compliant short
term deposits with approved licensed Islamic financial institutions.
Cash flow profit rate risk is the risk that the future cash flows of a financial
instrument will fluctuate because of changes in market profit rates. The Fund is
not exposed to cash flow profit rate risk as the Fund does not hold any financial
instruments at variable profit rate.
(b) Credit risk
Credit risk is the risk of a financial loss to the Fund if counterparty to a financial
instrument fails to meet its contractual obligations. The Fund’s exposure to credit risk
arises principally from its cash and cash equivalents and other receivables.
The Manager manages the credit risk by setting counterparty limits and undertaking
credit evaluation to minimise the risk. The exposure to credit risk is monitored on an
ongoing basis.

38
3. Financial Instruments and Financial Risk Management (continued)
(b) Credit risk (continued)
The following table sets out the credit risk concentration of the Fund:
Cash and
cash equivalents
Other receivables
Total
RM RM RM
As at 30.9.2020
Finance
- AAA 544,072 - 544,072
- AA3 1,084,428 - 1,084,428
- A2 983,040 - 983,040
- Other – non-rated - 16,735 16,735
2,611,540
16,735
2,628,275
Cash and
cash equivalents
Other receivables
Total
RM RM RM
As at 31.3.2020
Finance
- AAA 270,000 113 270,113
- AA3 370,580 - 370,580
- A2 270,000 36 270,036
Others – non-rated - 600 600
910,580
749
911,329
All the financial assets of the Fund as at end of the financial period/year are neither
past due nor impaired.

39
3. Financial Instruments and Financial Risk Management (continued)
(c) Liquidity risk
Liquidity risk is the risk that the Fund will not be able to meet its financial obligations
as they fall due. The Fund’s exposure to liquidity risk arises principally from its other
payables which are due within one year.
The Fund maintains sufficient level of liquid assets, after consultation with the Trustee,
to meet anticipated payments and cancellation of units by unit holders. Liquid assets
comprise cash at bank and other instruments, which are capable of being converted
into cash within 7 days.
The table below summarises the Fund’s financial liabilities into relevant maturity
groupings based on the remaining period as at the statement of financial position date
to the contractual maturity date. The amounts in the table are the contractual
undiscounted cash flows.
Less
than 1 month
Between 1 month to 1
year Total RM RM RM As at 30.9.2020 Amount due to Stockbroker Amount due to Manager Accrued management fee Amount due to Trustee Other payables and
accruals
379,259 97,583 8,040
268
-
- - - -
24,555
379,259 97,583 8,040
268
24,555
Contractual undiscounted cash flows 485,150
24,555 509,705
Less
than 1 month
Between 1 month to 1
year Total RM RM RM As at 31.3.2020 Amount due to Manager Accrued management fee Amount due to Trustee Other payables and
accruals
949 2,096
70
-
- - -
37,191
949 2,096
70
37,191
Contractual undiscounted cash flows 3,115
37,191 40,306

40
3. Financial Instruments and Financial Risk Management (continued)
(d) Capital risk management
The Fund’s capital is represented by the unit holders’ capital in the statement of
financial position. The Manager of the Fund monitors the adequacy of capital on an
ongoing basis. There is no external capital requirement imposed on the Fund.
(e) Fair value estimation
Fair value is defined as the price that would be received to sell an asset or paid to
transfer a liability in an orderly transaction between market participants at the
measurement date (i.e. an exit price).
The fair value of financial assets traded in active markets (such as trading securities)
are based on quoted market prices at the close of trading on the financial period/year
end date. The Fund utilises the last traded market price for financial assets where the
last traded price falls within the bid-ask spread. In circumstances where the last traded
price is not within the bid-ask spread, the Manager will determine the point within the
bid-ask spread that is most representative of the fair value.
An active market is a market in which transactions for the asset or liability take place
with sufficient frequency and volume to provide pricing information on an ongoing
basis.
The fair value of financial assets that are not traded in an active market is determined
by using valuation techniques.
(i) Fair value hierarchy
The table below analyses financial instruments carried at fair value. The
different levels have been defined as follows:
• Quoted prices (unadjusted) in active market for identical assets or
liabilities (Level 1)
• Inputs other than quoted prices included within Level 1 that are
observable for the asset or liability, either directly (that is, as prices) or
indirectly (that is, derived from prices) (Level 2)
• Inputs for the asset and liability that are not based on observable market
data (that is, unobservable inputs) (Level 3)
The table below analyses financial instruments carried at fair value. The
different levels have been defined as follows:
• Quoted prices (unadjusted) in active market for identical assets or
liabilities (Level 1)

41
3. Financial Instruments and Financial Risk Management (continued)
(e) Fair value estimation (continued)
(i) Fair value hierarchy (continued)
• Inputs other than quoted prices included within Level 1 that are
observable for the asset or liability, either directly (that is, as prices) or
indirectly (that is, derived from prices) (Level 2)
• Inputs for the asset and liability that are not based on observable market
data (that is, unobservable inputs) (Level 3)
The level in the fair value hierarchy within which the fair value measurement is
categorised in its entirety is determined on the basis of the lowest level input
that is significant to the fair value measurement in its entirety. For this purpose,
the significance of an input is assessed against the fair value measurement in its
entirety.
If a fair value measurement uses observable inputs that require significant
adjustment based on unobservable inputs, that measurement is a Level 3
measurement.
Assessing the significance of a particular input to the fair value measurement in
its entirety requires judgment, considering factors specific to the asset or liability.
The determination of what constitutes ‘observable’ requires significant judgment
by the Fund. The Fund considers observable data to be that market data that is
readily available, regularly distributed or updated, reliable and verifiable, not
proprietary, and provided by independent sources that are actively involved in
the relevant market.
Level 1 Level 2 Level 3 Total RM RM RM RM As at 30.9.2020 Financial assets
at fair value through profit or loss:
- Quoted
Shariah-compliant securities
5,545,870 - -
5,545,870

42
3. Financial Instruments and Financial Risk Management (continued)
(e) Fair value estimation (continued)
(i) Fair value hierarchy (continued)
Level 1 Level 2 Level 3 Total RM RM RM RM As at 31.3.2020 Financial assets
at fair value through profit or loss:
- Quoted
Shariah-compliant securities 702,145 - - 702,145
Quoted Shariah-compliant securities whose values are based on quoted market
prices in active markets, and are therefore classified within Level 1, include
Shariah-compliant active securities. The Fund’s policies on valuation of these
financial assets are stated in Note 2(b).
(ii) The carrying values of cash and cash equivalents, amount due from Manager,
other receivables and all current liabilities are a reasonable approximation of
their fair values due to their short term nature.
4. Management Fee
The manager’s fee payable to the Manager of the Fund is based on 1.50% (30.9.2019:
1.50%) per annum of the net asset value of the Fund calculated on a daily basis.
There will be no further liability to the Manager in respect of management fee other than
amounts recognised above.
5. Trustee Fee
The trustee’s fee payable to the trustee of the Fund is based on 0.05% (30.9.2019: 0.05%)
per annum of the net asset value of the Fund calculated on a daily basis.
6. Taxation
1.4.2020 to 30.9.2020
1.4.2019 to 30.9.2019
RM RM
Tax charged for the financial period
- Current taxation - -

43
6. Taxation (continued) A numerical reconciliation between the profit before taxation multiplied by the Malaysia Statutory income tax rate and tax expenses of the Fund is as follows: 1.4.2020 to
30.9.2020 1.4.2019 to
30.9.2019 Income/(Loss) before taxation
RM
1,273,339
RM
(53,509)
Taxation at Malaysian statutory rate of 24% (30.9.2019: 24%) 305,601 (12,842) Tax effects of:
- Investment loss not deductible for tax purposes/ (Investment income not subject to tax)
- Expenses not deductible for tax purposes (313,130)
1,419 (276,918)
280,998 - Restrictions on the tax deductible expenses for unit trust funds 6,110 8,762
- -
7. Financial Assets at Fair Value Through Profit or Loss (Shariah-
Compliant)
30.9.2020 31.3.2020
Financial assets at fair value through profit or loss
- Quoted Shariah-compliant securities
RM
5,545,870
RM
702,145
Net gain/(loss) on financial assets at fair value
through profit or loss
- Realised gain/(loss) on disposal 794,641 (1,327,625)
- - Unrealised gain on fair value movement 490,846 989,272
1,285,487
(338,353)

44
7. Financial Assets at Fair Value Through Profit or Loss (Shariah-
Compliant) (continued)
Details of quoted Shariah-compliant securities as at 30 September 2020 are set out as
follows:
Name of counter
Number of shares held
Aggregate cost RM
Fair value
RM
Percentage of value
of funds %
Consumer products Guan Chong Bhd. 76,000 216,954 250,800 3.17 QL Resources Bhd. 32,000 310,912 314,240 3.97
108,000 527,866 565,040 7.14
Health care
CCM Duopharma Biotech Bhd. 100,000 329,789 316,000 4.00
Industrial products and services
Hartalega Holdings Bhd. 8,000 123,160 129,600 1.64
Kossan Rubber Industries Bhd. 30,000 406,100 410,400 5.19
Supermax Corporation Bhd. 52,000 436,874 437,840 5.53
Top Glove Corporation Bhd. 40,000 341,626 332,000 4.20
Chin Chin Group Property Bhd 250,000 92,766 110,000 1.39
Cypark Resources Bhd. 260,000 247,506 230,100 2.91
Frontken Corporation Bhd. 72,000 211,277 260,640 3.30
Pentamaster Corporation Bhd. 101,000 456,089 484,800 6.13
Perak Transit Bhd. 1,200,000 346,308 348,000 4.40
2,013,000 2,661,706 2,743,380 34.69
Technology
D&O Green Technologies Bhd. 525,000 547,783 546,000 6.91
Inari Amerton Bhd. 230,000 516,472 524,400 6.63
JHM Consolidation Bhd. 182,000 215,953 307,580 3.89
LYC Healthcare Bhd. 98,000 37,750 35,770 0.45
Malaysian Pacific Industries 15,000 165,218 282,000 3.57
Vitrox Corporation Bhd. 18,500 188,929 225,700 2.85
1,068,500 1,672,105 1,921,450 24.30

45
7. Financial Assets at Fair Value through Profit or Loss (Shariah-
Compliant) (continued)
Details of quoted Shariah-compliant securities as at 30 September 2020 are set out as follows: (continued)
Total quoted Shariah-
compliant securities as at 30 September 2020 3,289,500 5,191,466 5,545,870 70.13
Accumulated unrealised gain on financial assets at fair value through profit or loss 354,404
Total financial assets at fair value through profit or loss 5,545,870
Details of quoted Shariah-compliant securities as at 31 March 2020 are set out as follows:
Name of counter
Number of shares held
Aggregate cost RM
Fair value
RM
Percentage of value
of funds %
Consumer products Guan Chong Bhd. 13,000 38,875 26,000 1.65
Industrial products and services
Frontken Corporation Bhd. 40,000 98,406 72,400 4.60
Hartalega Holdings Bhd. 15,500 92,258 106,640 6.78
Kossan Rubber Industries Bhd. 16,500 79,571 84,645 5.38
Muhibbah Engineering (M) Bhd. 45,000 78,493 33,750 2.15
Supermax Corporation Bhd. 55,000 93,168 92,950 5.91
Top Glove Corporation Bhd. 9,000 46,311 58,050 3.69
181,000 488,207 448,435 28.51
Technology
GHL Systems Bhd. 35,000 56,488 59,500 3.78
LYC Healthcare Bhd. 300,000 99,556 51,000 3.24
Malaysian Pacific Industries Bhd. 2,000 24,273 18,300 1.16
Revenue Group Bhd. 76,000 102,907 77,520 4.93
ViTrox Corporation Bhd. 3,000 28,283 21,390 1.36
416,000 311,507 227,710 14.47

46
7. Financial Assets at Fair Value through Profit or Loss (Shariah-
Compliant) (continued)
Details of quoted Shariah-compliant securities as at 31 March 2020 are set out as follows: (continued)
Total quoted Shariah-
compliant securities as at 31 March 2020 610,000 838,589 702,145 44.63
Accumulated unrealised loss on financial assets at fair value through profit or loss (136,444)
Total financial assets at fair value through profit or loss 702,145
8. Cash and Cash Equivalents (Shariah-Compliant)
30.9.2020 31.3.2020
RM RM
Short term placements with maturity less than 30 days:
- Commodity Murabahah 1,527,112 540,000
- Wafiyah Investment Account 983,043 -
Cash at bank* 101,385 370,580
2,611,540
910,580
* Cash at bank is placed with Bank Islam Malaysia Berhad, the holding company of the
Manager.
The weighted average effective profit rate per annum is as follows:
30.9.2020 31.3.2020
% %
Commodity Murabahah 0.97
2.49
Wafiyah Investment Account 0.61
-
Deposits with licensed Islamic financial institutions of the Fund have an average maturity of
5 days (31.3.2020: 2).
* Wafiyah Investment Account is placed with Bank Islam Malaysia berhad, holding
company of the Manager.

47
9. Unit Holders’ Capital
No. of units RM
As at 1 April 2020 9,327,564 3,777,122 Creation of units 21,347,236 6,471,511 Cancellation of units (4,604,444) (1,410,002)
As at 30 September 2020
26,070,356
8,838,631
As at 1 April 2019
15,750,493
5,109,975
Creation of units 322,910 64,139 Cancellation of units (6,745,839) (1,396,992)
As at 31 March 2020
9,327,564
3,777,122
10. Management Expense Ratio (“MER”)
30.9.2020 %
30.9.2019 %
MER
1.85
2.55
MER is derived from the following calculation:
MER = (A + B + C + D + E) x 100
F
A = Management fee
B = Trustee’s and custodian fees
C = Audit fee
D = Tax agent’s fee
E = Other expenses including Sales and Services Tax (“SST”) on transaction costs
F = Average NAV of the Fund calculated on a daily basis
The average NAV of the Fund for the financial period calculated on a daily basis is
RM2,313,034 (30.9.2019: RM3,713,782).

48
11. Portfolio Turnover Ratio (“PTR”)
30.9.2020 30.9.2019
PTR (Times)
3.30
1.78
PTR is derived from the following calculation:
(Total acquisition for the financial period/year + total disposal for the financial period/year)÷2
Average NAV of the Fund for the financial period/year calculated on a daily basis
where:
total acquisition for the financial period = RM9,008,590 (30.9.2019: RM5,777,308)
total disposal for the financial period = RM13,361,469 (30.09.2019: RM3,406,656)
12. Units Held by the Manager and Parties Related to the Manager, and
Significant Related Party Transactions and Balances
The related parties and their relationship with the Fund are as follows:
Related parties Relationship
BIMB Investment Management Berhad The Manager
Bank Islam Malaysia Berhad Immediate holding company of the Manager
BIMB Holdings Berhad Ultimate holding company of the Manager
AmanahRaya Trustees Berhad Trustee of the Fund
The Manager and related party of the Manager did not hold any unit in the Fund as at 30
September 2020 and 30 September 2019.
In addition to related party disclosures mentioned elsewhere in the financial statements, set
out below are other significant related party transactions. The Manager is of the opinion that
all transactions with the related companies have been entered into the normal course of
business at agreed terms between the related parties.

49
12. Units Held by the Manager and Parties Related to the Manager, and
Significant Related Party Transactions and Balances (continued)
Transactions during
Balance as at
30.09.2020 31.03.2020 30.09.2020 31.03.2020
RM RM RM RM
The Manager
BIMB Investment Management Berhad
- Amount due from Manager - -
661 -
- Amount due to Manager - - (97,583) (949)
- Management fee 25,460 34,993 (8,040) (2,096)
Holding company of the Manager
Bank Islam Malaysia Berhad
- Income from short term Placements (704) (1,382)
- -
- Bank balance - - 101,385 370,580
Related company of the Manager
BIMB Securities Sdn. Bhd.
- Sales (3,602,081) (3,032,672)
- -
- Purchases 4,122,623 1,964,493 - -
- Brokerage fee 19,573 14,327 - -
The Trustee
AmanahRaya Trustees Berhad
- Trustee fee 849 1,166 268 (70)

50
13. Transactions with Brokers
Value of trade
Percentage of total
trade Brokerage fee
Percentage of total
brokerage fee
RM % RM %
1.4.2020 to 30.9.2020 BIMB Securities Sdn. Bhd.* 7,724,704 33.36 19,573 33.61 Hong Leong Investment Bank Bhd. 2,212,635 9.56 5,145 8.84 MIDF Amanah Investment Bank Bhd. 2,013,392 8.70 4,621 7.94 Alliance Investment Bank 1,544,853 6.67 4,161 7.15 RHB Investment Bank Bhd. 1,527,568 6.60 3,620 6.22 TA Securities Holdings Bhd. 1,466,764 6.33 3,659 6.28 Maybank Investment Bank Bhd. 1,318,152 5.69 3,570 6.13 KAF Seagroatt & Campbell
Securities Sdn. Bhd. 1,210,369 5.23 3,116 5.35 CIMB Investment Bank Bhd. 1,067,923 4.61 2,910 5.00 Kenanga Investment Bank Bhd. 941,751 4.07 2,510 4.32 Other brokers 2,126,667 9.18 5,338 9.16
23,154,778 100.00 58,223 100.00
1.4.2018 to 30.9.2019
BIMB Securities Sdn. Bhd.* 1,922,113 23.97 6,391 24.97
MIDF Amanah Investment Bank Bhd. 1,441,920 17.98 4,414 17.25
RHB Investment Bank Bhd. 1,184,138 14.77 3,885 15.18
TA Securities Holdings Bhd. 1,081,021 13.48 3,418 13.35
Alliance Investment Bank Bhd. 728,524 9.09 2,060 8.05
Hong Leong Investment Bank Bhd. 598,761 7.47 1,697 6.63 Maybank Investment Bank Bhd. 401,983 5.01 1,401 5.47
Public Investment Bank Bhd. 291,587 3.64 995 3.89 KAF Seagroatt & Campbell Securities Sdn. Bhd. 116,355 1.45 415 1.62 Macquarie Capital Securities (Malaysia) Sdn. Bhd. 82,554 1.03 293 1.15
Others 169,298 2.11 625 2.44
8,018,254 100.00 25,594 100.00
* Transactions with the related party have been entered into in the normal course of
business at agreed terms between the related parties.

51
14. Segment Information
The internal reporting provided to the chief operating decision maker for the Fund’s assets,
liabilities and performance is prepared on a consistent basis with the measurement and
recognition principles of MFRS and IFRS. The chief operating decision-maker is responsible
for the performance of the Fund and considers the business to have a single operating
segment. Asset allocation decisions are based on a single, integrated Shariah-compliant
investment strategy and the Fund’s performance is evaluated on an overall basis.
The reportable operating segment derives its income by seeking Shariah-compliant
investments to achieve targeted returns consummate with an acceptable level of risk within
the portfolio. These returns consist of profit income, dividend income and gains on the
appreciation in the value of Shariah-compliant investments and are derived in Malaysia.
15. Significant Event During the Financial Period
The worsening macro-economic outlook as a result of Covid-19, both domestically and
globally, has resulted in the deterioration of the Fund's Net Asset Value per unit as of the
date of this report. This is mainly due to the decrease in fair value of the Fund's investments
at fair value through profit or loss.
The Manager is monitoring the situation closely and will be actively managing the portfolio to
achieve the Fund's objective.
16. Approval of Financial Statements
The financial statements have been approved by the Manager on 27 November 2020.

52
6.0 Corporate Directory
Manager
BIMB Investment Management Berhad
Registered Office
Level 32, Menara Bank Islam, No. 22, Jalan Perak
50450, Kuala Lumpur
Business Office
Level 19, Menara Bank Islam, No. 22, Jalan Perak
50450, Kuala Lumpur
Board of Directors Mohamed Ridza Mohamed Abdulla (Chairman Non-Executive
Independent Director)
Dato’ Ghazali Awang (Non-Executive Independent Director)
Dr. Mohd Hatta Dagap (Non-Executive Independent Director)
Datin Maznah Mahbob (Non-Executive Independent Director)
Azizan Abd Aziz (Non-Executive Non Independent Director)
Najmuddin Mohd Lutfi (Chief Executive Officer)
Shariah Committee
Dr. Ahmad Shahbari @ Sobri Salamon (Chairman)
Assoc. Prof. Dr. Asmak Ab. Rahman
Dr. Azrul Azlan Iskandar Mirza (Resigned w.e.f 30 April 2020)
Dr. Shamsiah Mohamad (Appointed w.e.f. 4 May 2020)
Investment Committee
Khairul Muzamel Perera Abdullah (Chairman – Non Independent
Member)
Mohd Radzuan Ahmad Tajuddin (Independent Member)
Datin Maznah Mahbob (Independent Member)
Audit Committee
Dato’ Ghazali Awang (Chairman - Independent Member)
Dr. Mohd Hatta Dagap (Independent Member)
Azizan Abd Aziz (Non Independent Member)
Company Secretaries
Norhidayati Mohamat Salim (MIA 27364)
Level 32, Menara Bank Islam, No. 22, Jalan Perak,
50450 Kuala Lumpur.
Aidil Haznul Zulkifli (MACS 01638)
Level 32, Menara Bank Islam, No. 22 Jalan Perak,
50450 Kuala Lumpur.
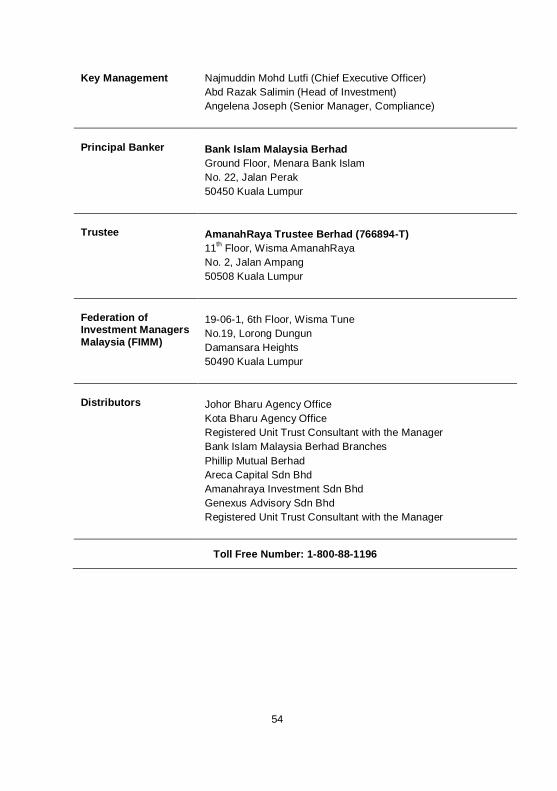
54
Key Management Najmuddin Mohd Lutfi (Chief Executive Officer)
Abd Razak Salimin (Head of Investment)
Angelena Joseph (Senior Manager, Compliance)
Principal Banker
Bank Islam Malaysia Berhad
Ground Floor, Menara Bank Islam
No. 22, Jalan Perak
50450 Kuala Lumpur
Trustee
AmanahRaya Trustee Berhad (766894-T)
11th Floor, Wisma AmanahRaya
No. 2, Jalan Ampang
50508 Kuala Lumpur
Federation of Investment Managers
Malaysia (FIMM)
19-06-1, 6th Floor, Wisma Tune
No.19, Lorong Dungun
Damansara Heights
50490 Kuala Lumpur
Distributors
Johor Bharu Agency Office
Kota Bharu Agency Office
Registered Unit Trust Consultant with the Manager
Bank Islam Malaysia Berhad Branches
Phillip Mutual Berhad
Areca Capital Sdn Bhd
Amanahraya Investment Sdn Bhd
Genexus Advisory Sdn Bhd
Registered Unit Trust Consultant with the Manager
Toll Free Number: 1-800-88-1196

THIS PAGE INTENTIONALLY LEFT BLANK

THIS PAGE INTENTIONALLY LEFT BLANK

199301021508 (276246-X)