Embed Size (px)
Citation preview
Interim report / Delårsrapport1 January—31 March 2017

Interim report January-March 2017
Nilar International AB Please note that the English version of the year-end report has not been reviewed by the Company’s auditors. It is for information purposes and in case of discrepancies compared to the Swedish version, the Swedish version shall prevail.
1
Interim report, 1 January-31 March 2017
Nilar International AB publishes its results for the first quarter 2017.
The first quarter Net sales amounted to 0.1 (0.1) MSEK.
Operating loss amounted to ‐11.1 (‐9.6) MSEK.
Loss after tax amounted to ‐11.5 (‐9.6) MSEK.
Cash flow from operating activities amounted to -15.8 (-7.8) MSEK.
During the reporting period 11 MSEK of bridge loans were raised.
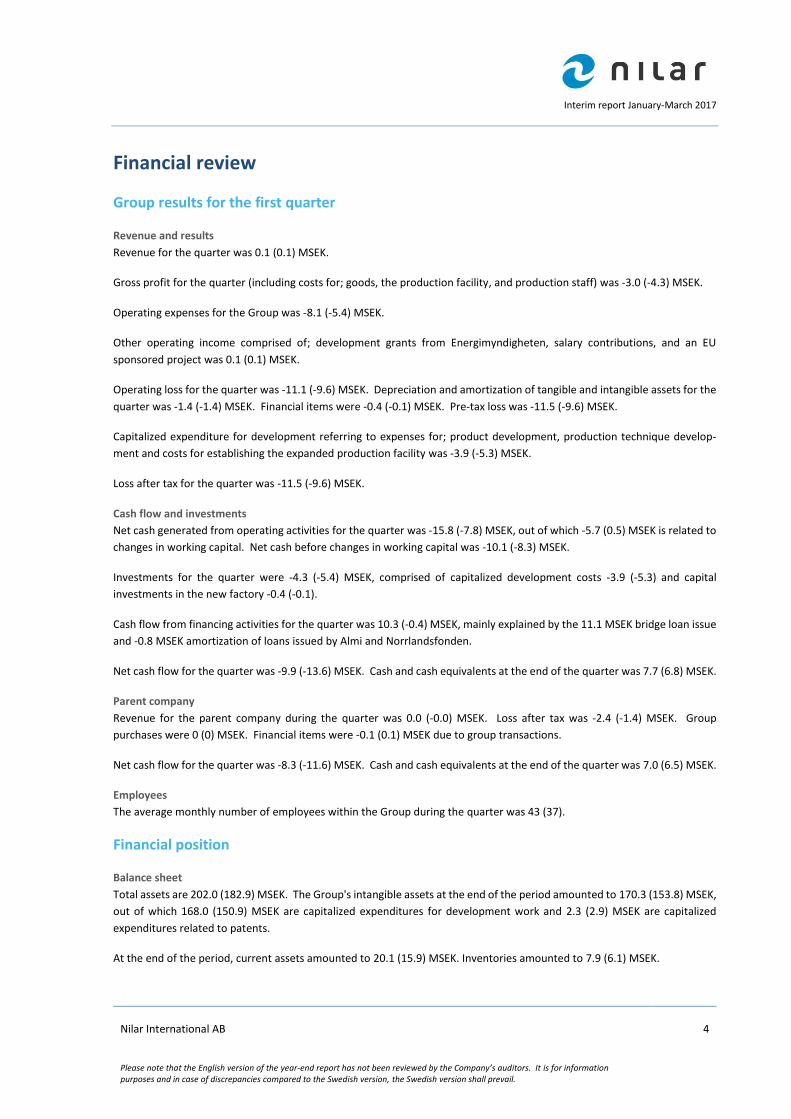
Significant events for the quarter Installation of an energy storage for a PV plant in Sweden (30 kWh) and a grid support system in Switzerland (72 kWh).
First orders received from German integrator Nife Energy.
Anders Tangen was appointed new Head of R&D.
Mikael Reichel was appointed Chief Strategy Officer.
Events following the closing of the quarter 10 million Euro equity investment (97 MSEK) by Danish MP Pension’s green investment allocation, Climate Delta. In
aggregate, 129 MSEK of cash and commitments have been received in the current 150 MSEK fundraise.
Participation in the following trade fairs; Düsseldorf Energy Storage Europe, The Battery Show, Hannover Messe, Elfack
Gothenburg, and ESS Inter Solar Messe Munich.
Joint launch of a home/residential storage product at Elfack Gothenburg together with select business partners.

Interim report January-March 2017
Nilar International AB Please note that the English version of the year-end report has not been reviewed by the Company’s auditors. It is for information purposes and in case of discrepancies compared to the Swedish version, the Swedish version shall prevail.
2
CEO review
In the first quarter of the year things really started moving on multiple fronts for Nilar.
Operations During the quarter, we have installed a grid support system in Switzerland (72 kWh) and an energy storage for a PV plant in
Sweden (30 kWh). In May, we received a follow-up order from the latter customer for an additional 124 kWh PV residential
installation later this year.
We have continued building on our European distributor network, and have received our first orders from Nife Energy (active
in Germany, Austria, and Switzerland – the “DACH” region).
The first half of the year is by tradition a very busy customer facing period for the company, with participation at all the major
European trade fairs. We have either displayed or participated at Düsseldorf Energy Storage Europe, The Battery Show,
Hannover Messe, Elfack Gothenburg, and ESS Intersolar München.
At Elfack Gothenburg, we joint launched our home/residential storage product with two of our selected business partners.
This is another important step on our journey from being a product supplier to a systems supplier.
To increase our production capacity and prepare for the migration to the new product generation called “V2.0”, we have
placed orders for a second production line. The production line will be assembled during the autumn, and we expect initial
deliveries of the new product generation to take place during the fourth quarter.
We have strengthened our management team with two seasoned professionals in the form of Anders Tangen as new Head
of R&D, and Mikael Reichel as new Chief Strategy Officer. Anders has had a long career within product development at
General Electric, and Mikael has been CEO of several entrepreneurial companies within the electronics and electrical
industries.
Financing At the end of 2016, we set out to raise an additional SEK 150 million via a private placement to bridge the capital needs of
the company up to an IPO. To date, we have received cash and commitments of SEK 129 million, and are working to close
the fundraise shortly.
I am very happy to report that as part of the fundraise, we have received a substantial investment of Euro 10 million (SEK 97
million) from the new investor MP Pension’s green investment allocation, Climate Delta, which invests in promising clean
tech companies, among other green investments. As a long-term investor that has a key focus on clean-tech companies, they
expect very high standards from their portfolio companies in terms of being environmentally friendly and responsible in all
aspects of the product life-cycle. Climate Delta is the ideal partner for us as we move towards an IPO.
Michael Obermayer
CEO, Nilar International AB

Interim report January-March 2017
Nilar International AB Please note that the English version of the year-end report has not been reviewed by the Company’s auditors. It is for information purposes and in case of discrepancies compared to the Swedish version, the Swedish version shall prevail.
3
Operation
About Nilar
With the bi-polar NiMH battery, Nilar brings you the next generation in modular power technology. The unique construction
of the battery delivers incredible power and reliability from a lighter, smaller and greener unit. Furthermore, the modular
design allows batteries to be coupled in parallel and series to deliver the power and capacity required to meet virtually any
need. Put simply, Nilar batteries deliver more from less.
Since its founding in 2000 as a highly aspirational battery development project by two battery industry insiders, Nilar has
always sought to challenge the norms of the battery industry. From its two R&D departments in the USA and Sweden the
company has revolutionized the way industrial batteries are constructed, developing a unique energy storage system that
can be easily scaled to fit different applications. Today, the batteries are produced at the company’s state-of-the-art factory
in Sweden.
Strategy
At Nilar we have identified four key applications where our batteries can make a difference:
Smart grid
Telecom/Back-up
Hybrid
Electric mobile equipment
The Group
The Group’s business consists of development, production, marketing and sales of energy storage products. The parent
company Nilar International AB is located in Täby, just outside of Stockholm, Sweden. The development, manufacturing and
production is mainly performed by the Swedish subsidiary Nilar AB in Gävle. Development and sales is partly carried out by
the US subsidiary Nilar Inc., located in Colorado, USA.
History
2001-2013: Product development
2014: Implementation of scalable and fully automated production line
2015-today:
Increasing sales efforts
Deliver to the customer
Expansion of product capacity and performance
The continued development of the next generation of solutions (power, micro hybrid etc.) based on demand from
key customers
Interim report January-March 2017
Nilar International AB Please note that the English version of the year-end report has not been reviewed by the Company’s auditors. It is for information purposes and in case of discrepancies compared to the Swedish version, the Swedish version shall prevail.
4
Financial review
Group results for the first quarter
Revenue and results
Revenue for the quarter was 0.1 (0.1) MSEK.
Gross profit for the quarter (including costs for; goods, the production facility, and production staff) was -3.0 (-4.3) MSEK.
Operating expenses for the Group was ‐8.1 (‐5.4) MSEK.
Other operating income comprised of; development grants from Energimyndigheten, salary contributions, and an EU
sponsored project was 0.1 (0.1) MSEK.
Operating loss for the quarter was -11.1 (-9.6) MSEK. Depreciation and amortization of tangible and intangible assets for the
quarter was -1.4 (-1.4) MSEK. Financial items were -0.4 (-0.1) MSEK. Pre-tax loss was -11.5 (-9.6) MSEK.
Capitalized expenditure for development referring to expenses for; product development, production technique develop-
ment and costs for establishing the expanded production facility was -3.9 (-5.3) MSEK.
Loss after tax for the quarter was -11.5 (-9.6) MSEK.
Cash flow and investments
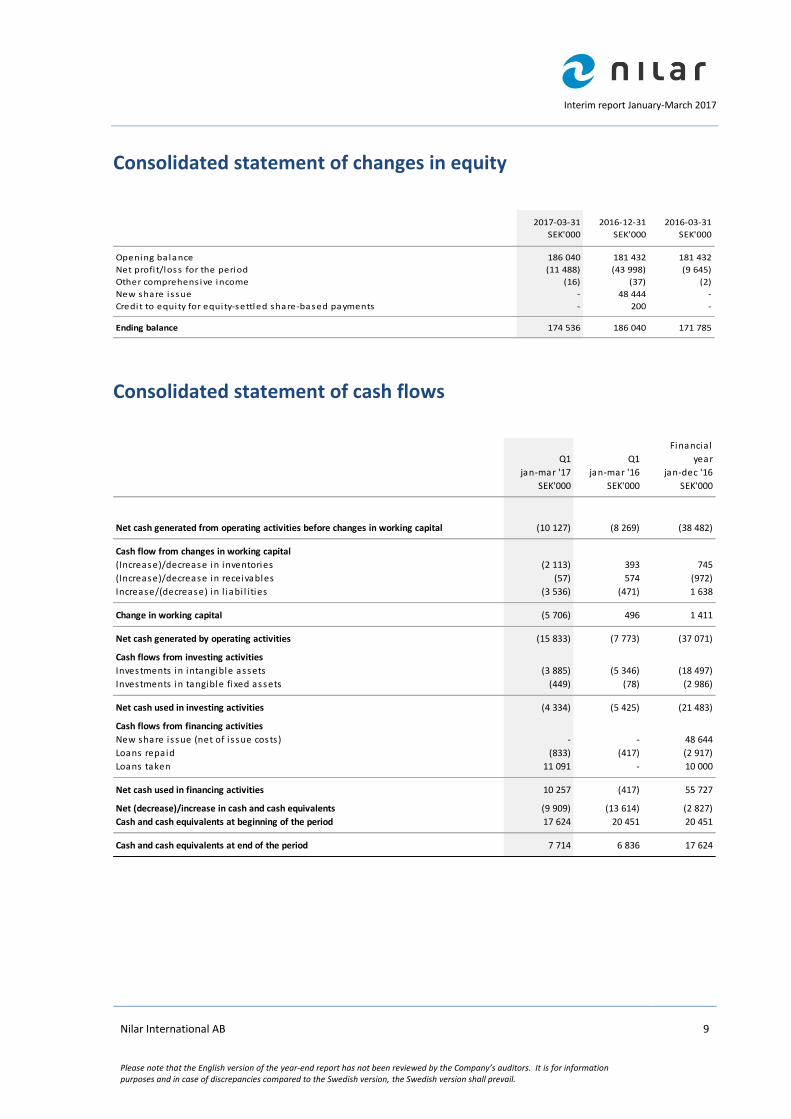
Net cash generated from operating activities for the quarter was -15.8 (-7.8) MSEK, out of which -5.7 (0.5) MSEK is related to
changes in working capital. Net cash before changes in working capital was -10.1 (-8.3) MSEK.
Investments for the quarter were -4.3 (-5.4) MSEK, comprised of capitalized development costs -3.9 (-5.3) and capital
investments in the new factory -0.4 (-0.1).
Cash flow from financing activities for the quarter was 10.3 (-0.4) MSEK, mainly explained by the 11.1 MSEK bridge loan issue
and -0.8 MSEK amortization of loans issued by Almi and Norrlandsfonden.
Net cash flow for the quarter was -9.9 (-13.6) MSEK. Cash and cash equivalents at the end of the quarter was 7.7 (6.8) MSEK.
Parent company
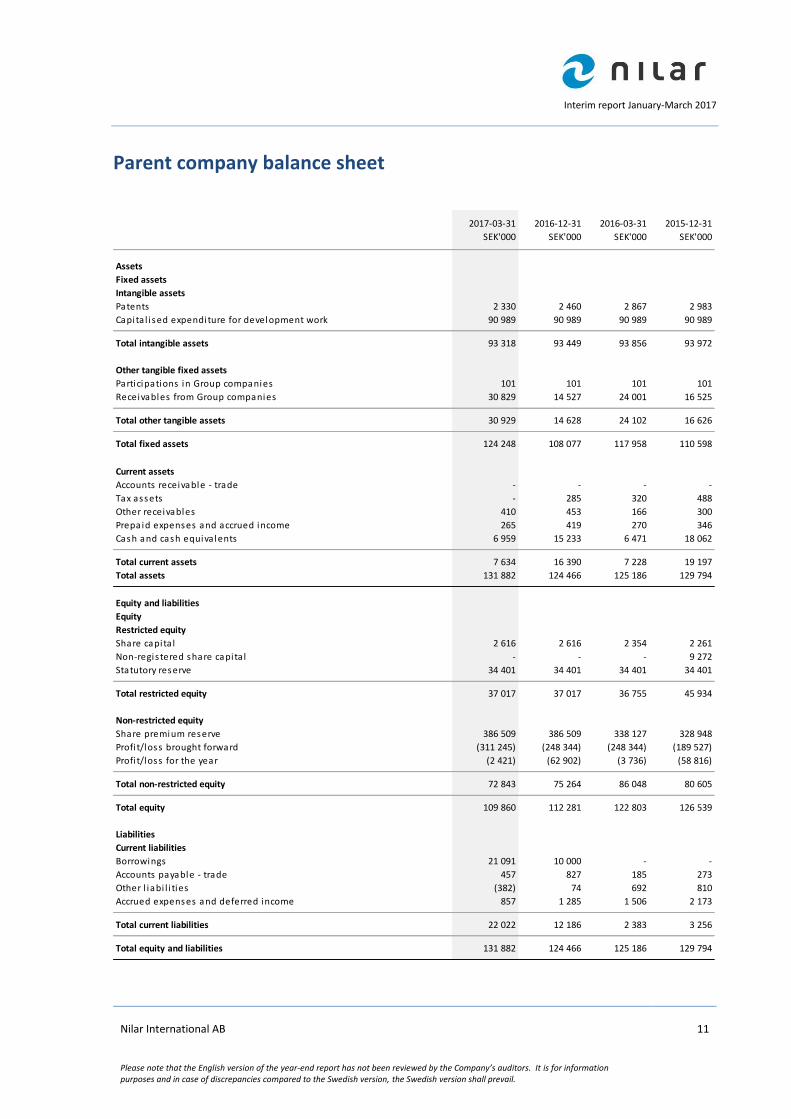
Revenue for the parent company during the quarter was 0.0 (-0.0) MSEK. Loss after tax was -2.4 (-1.4) MSEK. Group
purchases were 0 (0) MSEK. Financial items were -0.1 (0.1) MSEK due to group transactions.
Net cash flow for the quarter was -8.3 (-11.6) MSEK. Cash and cash equivalents at the end of the quarter was 7.0 (6.5) MSEK.
Employees
The average monthly number of employees within the Group during the quarter was 43 (37).
Financial position
Balance sheet
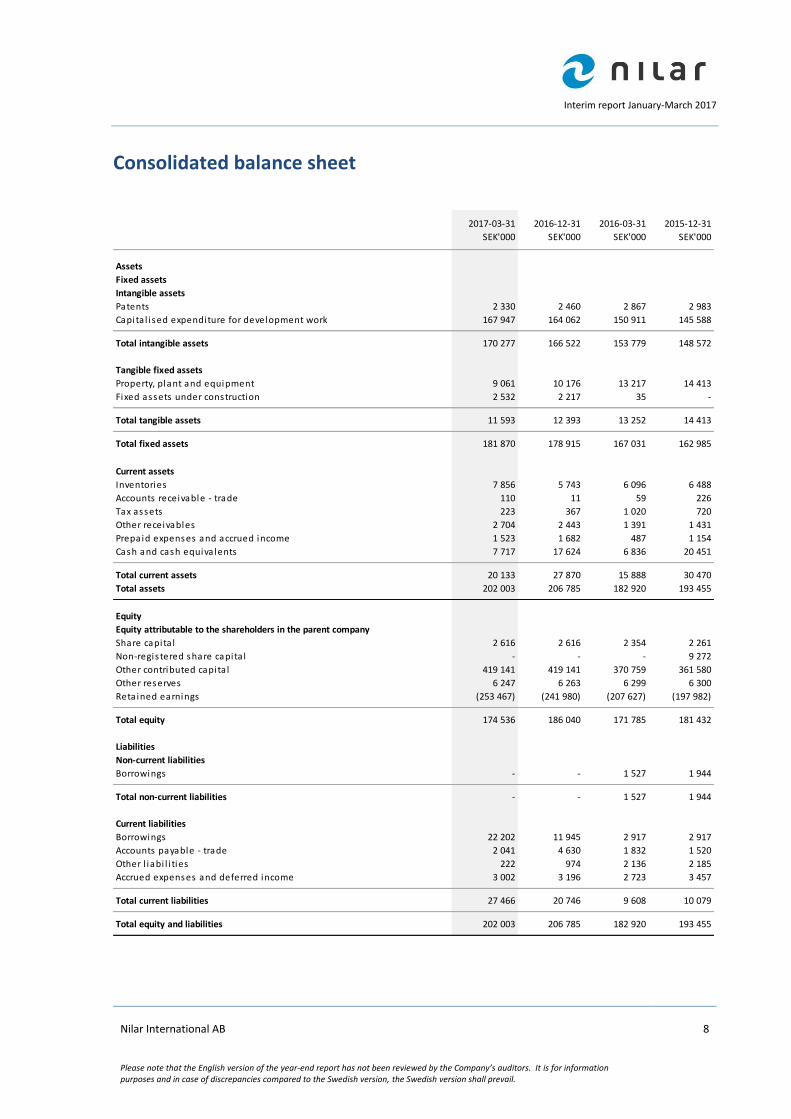
Total assets are 202.0 (182.9) MSEK. The Group's intangible assets at the end of the period amounted to 170.3 (153.8) MSEK,
out of which 168.0 (150.9) MSEK are capitalized expenditures for development work and 2.3 (2.9) MSEK are capitalized
expenditures related to patents.
At the end of the period, current assets amounted to 20.1 (15.9) MSEK. Inventories amounted to 7.9 (6.1) MSEK.
Interim report January-March 2017
Nilar International AB Please note that the English version of the year-end report has not been reviewed by the Company’s auditors. It is for information purposes and in case of discrepancies compared to the Swedish version, the Swedish version shall prevail.
5
At the end of the period, equity in the Group amounted to 174.5 (171.8) MSEK. The equity/asset ratio was 86 (94) %.
Financial position
Nilar is expected to grow significantly and the funding of the investments and the working capital required in the future have
been forecasted based on historical KPIs and other known factors. The Company's current growth plan requires that Nilar
raises new capital. Conditions of such a transaction is affected by the current situation on the financial market and cannot be
guaranteed to be favorable. Nilar’s sources of capital to secure going concern includes e.g.; bank loans, shareholder loans
and capital contributions by shareholders. Given these sources of capital, the Board believes that necessary capital will be
available.
Other
Significant risks and uncertainties Nilar is affected by several external and internal factors, which may result in an outcome different from forecasts, previous
development and expectations. The following list includes a selection of the risks which the Company considers significant;
however, it is not an exhaustive description of all risks that may arise.
Industry and market risks (customers, increased competition, business cycles)
Operational risks (production, development resources, forecasting ability, raw materials – access to raw materials)
Financial risks (currency risks, continued financing)
Legal risks (legislation – regulations and compliance, intellectual property rights, fiscal risks)
Risk mitigation, and primarily financial risks, are more exhaustively described in the Annual Report 2015 (Swedish), note 28
”Financial risk management” and note 30 ”Important estimates and assessments”.
All forward looking statements in this report are based on the Company’s best judgments at the time of the report. Such statements include, as all predictions of the future, risks and uncertainties that can result in other outcomes than predicted.
Accounting policies The Group applies International Financial Reporting Standards (IFRS) as adopted by the EU. The Group and parent company
apply the same accounting policies and calculation methods as applied in the Annual Report 2015. This interim report was
prepared in accordance with IAS 34 Interim Financial Reporting and the Swedish Annual Accounts Act.
Post balance sheet events The company initiated a private placement of up to 150 MSEK in Q4 2016. The private placement is expected to be closed
during Q2 2017. Per 31 May, the company had received cash and commitments of in aggregate 129 MSEK – of which 21
MSEK had been received prior to the balance sheet date.
Other Nothing to report.
Interim report January-March 2017
Nilar International AB Please note that the English version of the year-end report has not been reviewed by the Company’s auditors. It is for information purposes and in case of discrepancies compared to the Swedish version, the Swedish version shall prevail.
6
Täby 31 May 2017
The Board of Directors
Nilar International AB
Stockholmsvägen 116B
187 30 Täby
Sweden
Corporate registration number 556600-2977
Financial calendar
Annual General Meeting 2016 will be held on 19 June 2017
Interim report for quarter 2 2017 will be published in August 2017
Interim report for quarter 3 2017 will be published in October 2017
This interim report has not been reviewed by the Company's auditors.
For further information:
Magnus Nordgren, CFO
Telephone: +46 (0)702 14 17 49
E-mail: [email protected]
Please visit www.nilar.com

Interim report January-March 2017
Nilar International AB Please note that the English version of the year-end report has not been reviewed by the Company’s auditors. It is for information purposes and in case of discrepancies compared to the Swedish version, the Swedish version shall prevail.
7
Consolidated statement of comprehensive income
Financia l
Q1 Q1 year
jan-mar '17 jan-mar '16 jan-dec '16
SEK'000 SEK'000 SEK'000
Revenue 88 89 271
Cost of sa les (3 125) (4 369) (19 508)
Gross profit (3 037) (4 281) (19 237)
Research and development expenses (2 318) (541) (6 589)
Distribution and sel l ing costs (3 964) (2 766) (11 630)
Adminis trative expenses (1 867) (2 111) (7 736)
Other operating income 54 115 1 474
Operating profit / EBIT (11 133) (9 584) (43 718)
Finance income 1 0 6
Finance costs (356) (62) (286)
Finance costs - net (355) (62) (280)
Profit before income tax (11 488) (9 645) (43 998)
Income tax expense - - -
Profit after tax (11 488) (9 645) (43 998)
Other comprehensive income
Currency trans lation di fferences (16) (2) (37)
Other comprehensive income for the period, net of tax (16) (2) (37)
Total comprehensive income for the period (11 504) (9 647) (44 035)
Interim report January-March 2017
Nilar International AB Please note that the English version of the year-end report has not been reviewed by the Company’s auditors. It is for information purposes and in case of discrepancies compared to the Swedish version, the Swedish version shall prevail.
8
Consolidated balance sheet
2017-03-31 2016-12-31 2016-03-31 2015-12-31
SEK'000 SEK'000 SEK'000 SEK'000
Assets
Fixed assets
Intangible assets
Patents 2 330 2 460 2 867 2 983
Capita l i sed expenditure for development work 167 947 164 062 150 911 145 588
Total intangible assets 170 277 166 522 153 779 148 572
Tangible fixed assets
Property, plant and equipment 9 061 10 176 13 217 14 413
Fixed assets under construction 2 532 2 217 35 -
Total tangible assets 11 593 12 393 13 252 14 413
Total fixed assets 181 870 178 915 167 031 162 985
Current assets
Inventories 7 856 5 743 6 096 6 488
Accounts receivable - trade 110 11 59 226
Tax assets 223 367 1 020 720
Other receivables 2 704 2 443 1 391 1 431
Prepaid expenses and accrued income 1 523 1 682 487 1 154
Cash and cash equiva lents 7 717 17 624 6 836 20 451
Total current assets 20 133 27 870 15 888 30 470
Total assets 202 003 206 785 182 920 193 455
Equity
Equity attributable to the shareholders in the parent company
Share capita l 2 616 2 616 2 354 2 261
Non-regis tered share capita l - - - 9 272
Other contributed capita l 419 141 419 141 370 759 361 580
Other reserves 6 247 6 263 6 299 6 300
Reta ined earnings (253 467) (241 980) (207 627) (197 982)
Total equity 174 536 186 040 171 785 181 432
Liabilities
Non-current liabilities
Borrowings - - 1 527 1 944
Total non-current liabilities - - 1 527 1 944
Current liabilities
Borrowings 22 202 11 945 2 917 2 917
Accounts payable - trade 2 041 4 630 1 832 1 520
Other l iabi l i ties 222 974 2 136 2 185
Accrued expenses and deferred income 3 002 3 196 2 723 3 457
Total current liabilities 27 466 20 746 9 608 10 079
Total equity and liabilities 202 003 206 785 182 920 193 455
Interim report January-March 2017
Nilar International AB Please note that the English version of the year-end report has not been reviewed by the Company’s auditors. It is for information purposes and in case of discrepancies compared to the Swedish version, the Swedish version shall prevail.
9
Consolidated statement of changes in equity
2017-03-31 2016-12-31 2016-03-31
SEK'000 SEK'000 SEK'000
Opening ba lance 186 040 181 432 181 432
Net profi t/loss for the period (11 488) (43 998) (9 645)
Other comprehens ive income (16) (37) (2)
New share i ssue - 48 444 -
Credit to equity for equity-settled share-based payments - 200 -
Ending balance 174 536 186 040 171 785
Consolidated statement of cash flows
Financia l
Q1 Q1 year
jan-mar '17 jan-mar '16 jan-dec '16
SEK'000 SEK'000 SEK'000
Net cash generated from operating activities before changes in working capital (10 127) (8 269) (38 482)
Cash flow from changes in working capital
(Increase)/decrease in inventories (2 113) 393 745
(Increase)/decrease in receivables (57) 574 (972)
Increase/(decrease) in l iabi l i ties (3 536) (471) 1 638
Change in working capital (5 706) 496 1 411
Net cash generated by operating activities (15 833) (7 773) (37 071)
Cash flows from investing activities
Investments in intangible assets (3 885) (5 346) (18 497)
Investments in tangible fixed assets (449) (78) (2 986)
Net cash used in investing activities (4 334) (5 425) (21 483)
Cash flows from financing activities
New share issue (net of i ssue costs ) - - 48 644
Loans repaid (833) (417) (2 917)
Loans taken 11 091 - 10 000
Net cash used in financing activities 10 257 (417) 55 727
Net (decrease)/increase in cash and cash equivalents (9 909) (13 614) (2 827)
Cash and cash equivalents at beginning of the period 17 624 20 451 20 451
Cash and cash equivalents at end of the period 7 714 6 836 17 624

Interim report January-March 2017
Nilar International AB Please note that the English version of the year-end report has not been reviewed by the Company’s auditors. It is for information purposes and in case of discrepancies compared to the Swedish version, the Swedish version shall prevail.
10
Parent company income statement and statement of
comprehensive income
Financial
Q1 Q1 year
jan-mar '17 jan-mar '16 jan-dec '16
SEK'000 SEK'000 SEK'000
Revenue - (0) -
Cost of sales (19) (53) (256)
Gross profit (19) (53) (256)
Research and development expenses (329) (197) (2 671)
Distribution and selling costs (708) (430) (3 818)
Administrative expenses (1 262) (782) (5 340)
Other operating income - - 4
Operating profit / EBIT (2 318) (1 462) (12 081)
Finance income 231 61 1 761
Finance costs (333) - (94)
Write-down of shares in subsidiaries - - (52 487)
Finance costs - net (102) 61 (50 820)
Profit after finance costs (2 421) (1 401) (62 902)
Group contribution - - -
Profit before tax (2 421) (1 401) (62 902)
Income tax expense - - -
Profit after tax (2 421) (1 401) (62 902)
Parent company statement of other comprehensive income
Currency translation differences - - -
Total comprehensive income for the period (2 421) (1 401) (62 902)
Interim report January-March 2017
Nilar International AB Please note that the English version of the year-end report has not been reviewed by the Company’s auditors. It is for information purposes and in case of discrepancies compared to the Swedish version, the Swedish version shall prevail.
11
Parent company balance sheet
2017-03-31 2016-12-31 2016-03-31 2015-12-31
SEK'000 SEK'000 SEK'000 SEK'000
Assets
Fixed assets
Intangible assets
Patents 2 330 2 460 2 867 2 983
Capita l i sed expenditure for development work 90 989 90 989 90 989 90 989
Total intangible assets 93 318 93 449 93 856 93 972
Other tangible fixed assets
Participations in Group companies 101 101 101 101
Receivables from Group companies 30 829 14 527 24 001 16 525
Total other tangible assets 30 929 14 628 24 102 16 626
Total fixed assets 124 248 108 077 117 958 110 598
Current assets
Accounts receivable - trade - - - -
Tax assets - 285 320 488
Other receivables 410 453 166 300
Prepaid expenses and accrued income 265 419 270 346
Cash and cash equiva lents 6 959 15 233 6 471 18 062
Total current assets 7 634 16 390 7 228 19 197
Total assets 131 882 124 466 125 186 129 794
Equity and liabilities
Equity
Restricted equity
Share capita l 2 616 2 616 2 354 2 261
Non-regis tered share capita l - - - 9 272
Statutory reserve 34 401 34 401 34 401 34 401
Total restricted equity 37 017 37 017 36 755 45 934
Non-restricted equity
Share premium reserve 386 509 386 509 338 127 328 948
Profi t/loss brought forward (311 245) (248 344) (248 344) (189 527)
Profi t/loss for the year (2 421) (62 902) (3 736) (58 816)
Total non-restricted equity 72 843 75 264 86 048 80 605
Total equity 109 860 112 281 122 803 126 539
Liabilities
Current liabilities
Borrowings 21 091 10 000 - -
Accounts payable - trade 457 827 185 273
Other l iabi l i ties (382) 74 692 810
Accrued expenses and deferred income 857 1 285 1 506 2 173
Total current liabilities 22 022 12 186 2 383 3 256
Total equity and liabilities 131 882 124 466 125 186 129 794

Interim report January-March 2017
Nilar International AB Please note that the English version of the year-end report has not been reviewed by the Company’s auditors. It is for information purposes and in case of discrepancies compared to the Swedish version, the Swedish version shall prevail.
12
Parent company cash flows
Financial
Q1 Q1 year
jan-mar '17 jan-mar '16 jan-dec '16
SEK'000 SEK'000 SEK'000
Net cash generated from operating activities before changes in working capital (2 291) (3 597) (9 868)
Cash flow from changes in working capital
(Increase)/decrease in inventories - - -
(Increase)/decrease in receivables 481 378 (22)
Increase/(decrease) in liabilities (1 254) (873) (1 072)
Change in working capital (773) (495) (1 094)
Net cash generated by operating activities (3 064) (4 091) (10 960)
Cash flows from investing activities - - -
Investments in intangible assets - (23) (23)
Loans repaid - - (52 487)
Loans taken (16 301) (7 476) 1 998
Cash flows from investing activities (16 301) (7 499) (50 513)
Cash flows from financing activities
New share issue (net of issue costs) - - 48 645
Loans repaid - - -
Loans taken 11 091 - 10 000
Net cash used in financing activities 11 091 - 58 645
Net (decrease)/increase in cash and cash equivalents (8 275) (11 591) (2 830)
Cash and cash equivalents at beginning of the period 15 233 18 062 18 063
Cash and cash equivalents at end of the period 6 959 6 471 15 233

Interim report January-March 2017
Nilar International AB Please note that the English version of the year-end report has not been reviewed by the Company’s auditors. It is for information purposes and in case of discrepancies compared to the Swedish version, the Swedish version shall prevail.
13
Key performance indicators
Q1 FY Q1
2016 2016 2017
jan-mar jan-dec jan-mar
SEK'000 SEK'000 SEK'000
Income statement
Revenue 89 271 88
Gross profi t (4 281) (19 237) (3 037)
EBITDA (8 219) (38 202) (9 752)
Operating profi t / EBIT (9 584) (43 718) (11 133)
Profi t/(loss ) before tax (9 645) (43 998) (11 488)
Profi t/(loss ) after tax (9 645) (43 998) (11 488)
Balance sheet
Non-current assets 167 031 178 915 181 870
Current assets 15 888 27 870 20 133
Total assets 182 920 206 785 202 003
Equity 171 785 186 040 174 536
Non-current l iabi l i ties 1 527 - -
Current l iabi l i ties 9 608 20 745 27 466
Total equity and l iabi l i ties 182 920 206 785 202 003
Ratios
Depreciation (1 365) (5 516) (1 381)
Shareholder equity ratio, % 94% 90% 86%
Debt ratio, times 0,1 0,1 0,2
Inventory 6 096 5 743 7 856
Ful l -time equiva lents (employees) 36 38 43
Capita l i sed expenses for development work 5 323 18 474 3 885
Intangible assets 153 779 166 522 170 277
Shares in i ssue at end of period 2 354 138 2 615 541 2 615 541
Weighted average number of ordinary shares in i ssue 2 340 181 2 484 840 2 615 541
Share options in i ssue at end of period 181 088 320 588 320 588

Interim report January-March 2017
Nilar International AB Please note that the English version of the year-end report has not been reviewed by the Company’s auditors. It is for information purposes and in case of discrepancies compared to the Swedish version, the Swedish version shall prevail.
14
Substantial shareholdings per 31 March 2017
Name Shares/votes
% of share
capital/votes
Fjord Capita l Partners related enti ties 686 341 26,2%
Lecors ier investments 379 002 14,5%
Fredriksson & Forssel l AB 259 942 9,9%
Sagax Limited/Anders Barsk 212 025 8,1%
Chris tmas Common Ltd/Per Krafft 189 826 7,3%
Brohuvudet AB 163 495 6,3%
Waterman 40 Holding B.V. 120 791 4,6%
Hans Franzén 110 378 4,2%
Firs t Energy Resources Inc. 82 866 3,2%
Stamfar Peter AB/XAOC AB 78 244 3,0%
Nei l Puester/Tri logy Equities Partnership LLC 60 186 2,3%
Segulah Venture AB 52 500 2,0%
Other 219 945 8,4%
Total 2 615 541 100,0%
Definitions
Gross profit margin
Revenue less direct costs for; goods, the production facility, and production staff as a percentage of revenue
EBITDA
Earnings before Interest Taxes and Amortization
Operating profit / EBIT
Earnings before Interest and Taxes
Profit margin
Profit/(loss) after tax as a percentage of revenue
Shareholder equity ratio
Equity in relation to total assets
Debt ratio
Interest bearing debt and other liabilities divided by equity
Capitalized expenses for development work
Development expenditures activities are recognized as an intangible asset when they qualify for recognition per IAS 38 and
are estimated to amount a significant proportion of the product’s development. Other development expenditures are
recognized as an expense. The most important criteria for capitalization of development expenditures are that the asset will
generate probable future economic benefits or cost savings, and there are technical and commercial conditions to complete
the development. The development expenditure capitalized are generated externally as well as internally and includes direct
costs for services used. Directly attributable costs that are capitalized as part of the product development, production
processes, production facility project and implementation of software systems include expenditures to third parties and
employees.

Interim report January-March 2017
Nilar International AB Please note that the English version of the year-end report has not been reviewed by the Company’s auditors. It is for information purposes and in case of discrepancies compared to the Swedish version, the Swedish version shall prevail.
15
Shareholder information
Board of Directors
Lars Fredriksson, Chairman Michael Obermayer, CEO Anders Barsk Anders Gudmarsson Alexander Izosimov Peter Tell
Investor relations Magnus Nordgren, Chief Financial Officer E-mail: [email protected]
Euroclear
ISIN code SE0009888407
Address Nilar International AB Stockholmsvägen 116B 187 30 Täby Sweden
Website www.nilar.com
Corporate registration number 556600-2977
Auditors Deloitte AB 113 79 Stockholm Sweden

Delårsrapport januari-mars 2017
Nilar International AB
1
Delårsrapport, 1 januari-31 mars 2017
Nilar International AB offentliggör resultatet för det första kvartalet 2017.
Första kvartalet Nettoomsättningen uppgick till 0,1 (0,1) MSEK.
Rörelseresultatet uppgick till ‐11,1 (‐9,6) MSEK.
Resultat efter skatt uppgick till ‐11,5 (‐9,6) MSEK.
Kassaflödet för den löpande verksamheten uppgick till ‐15,8 (-7,8) MSEK.
Under perioden upptogs 11 MSEK i brygglån.
Väsentliga händelser under kvartalet Installation av ett energilager till en solenergipark (PV) i Sverige (30 kWh) och ett stödsystem för elnät i i Schweiz
(72 kWh).
Erhållit de första ordrarna från den tyska integratören Nife Energy.
Anders Tangen utsågs till ny R&D chef.
Mikael Reichel utsågs till ny Chief Strategi Officer.
Väsentliga händelser efter kvartalet 10 MEUR (97 MSEK) investering av danska MP Investment Management:s Climate Delta fond. Totalt har bolaget erhållit
129 MSEK av betalningar i den pågående kapitalanskaffningsrundan på upp till 150 MSEK.
Deltagande vid internationella mässor för batterilagring; Düsseldorf Energy Storage Europe, The Battery Show, Hannover
Messe, Elfack Göteborg, ESS Inter Solar Messe München.
Samlansering av en produkt för lagring i hem och bostäder vid Elfack Göteborg tillsammans med utvalda affärspartners.
Delårsrapport januari-mars 2017
Nilar International AB
2
Verksamheten
Om Nilar
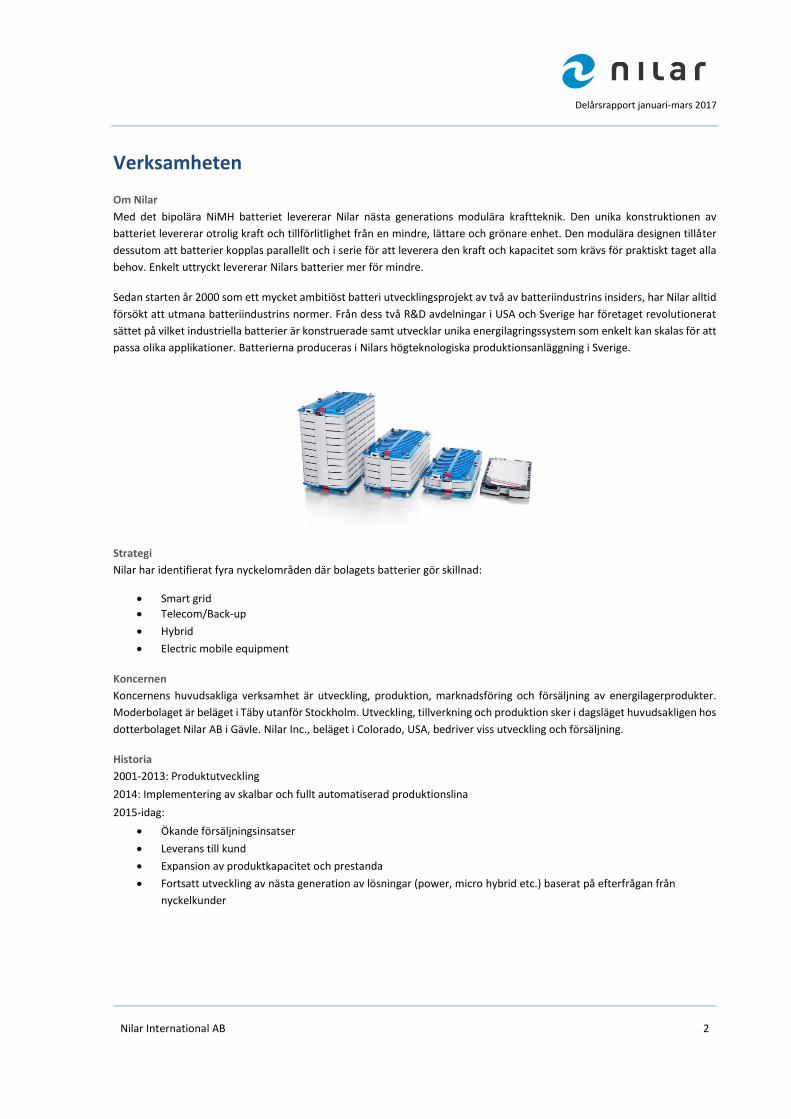
Med det bipolära NiMH batteriet levererar Nilar nästa generations modulära kraftteknik. Den unika konstruktionen av
batteriet levererar otrolig kraft och tillförlitlighet från en mindre, lättare och grönare enhet. Den modulära designen tillåter
dessutom att batterier kopplas parallellt och i serie för att leverera den kraft och kapacitet som krävs för praktiskt taget alla
behov. Enkelt uttryckt levererar Nilars batterier mer för mindre.
Sedan starten år 2000 som ett mycket ambitiöst batteri utvecklingsprojekt av två av batteriindustrins insiders, har Nilar alltid
försökt att utmana batteriindustrins normer. Från dess två R&D avdelningar i USA och Sverige har företaget revolutionerat
sättet på vilket industriella batterier är konstruerade samt utvecklar unika energilagringssystem som enkelt kan skalas för att
passa olika applikationer. Batterierna produceras i Nilars högteknologiska produktionsanläggning i Sverige.
Strategi
Nilar har identifierat fyra nyckelområden där bolagets batterier gör skillnad:
Smart grid
Telecom/Back-up
Hybrid
Electric mobile equipment
Koncernen
Koncernens huvudsakliga verksamhet är utveckling, produktion, marknadsföring och försäljning av energilagerprodukter.
Moderbolaget är beläget i Täby utanför Stockholm. Utveckling, tillverkning och produktion sker i dagsläget huvudsakligen hos
dotterbolaget Nilar AB i Gävle. Nilar Inc., beläget i Colorado, USA, bedriver viss utveckling och försäljning.
Historia
2001-2013: Produktutveckling
2014: Implementering av skalbar och fullt automatiserad produktionslina
2015-idag:
Ökande försäljningsinsatser
Leverans till kund
Expansion av produktkapacitet och prestanda
Fortsatt utveckling av nästa generation av lösningar (power, micro hybrid etc.) baserat på efterfrågan från
nyckelkunder
Delårsrapport januari-mars 2017
Nilar International AB
3
Finansiell översikt
Koncernens resultat för det första kvartalet
Omsättning och resultat
Koncernens nettoomsättning för kvartalet uppgick till 0,1 (0,1) MSEK.
Koncernens bruttoresultat för kvartalet uppgick till ‐3,0 (‐4,3) MSEK. I posten kostnad såld vara ingår kostnader för;
materialkostnader, kostnader för produktionsanläggningen samt personal.
Koncernens rörelsekostnader för kvartalet uppgick till ‐8,1 (-5,4) MSEK.
Övriga rörelseintäkter bestående av; utvecklingsbidrag från Energimyndigheten, lönebidrag samt intäkter från ett EU-
finansierat projekt uppgick till 0,1 (0,1) MSEK.
Koncernens rörelseresultat för kvartalet uppgick till ‐11,1 (‐9,6) MSEK. Av‐ och nedskrivningar för materiella‐ och immateriella
anläggningstillgångar uppgick till ‐1,4 (‐1,4) MSEK. Finansiella poster uppgick till ‐0,4 (‐0,1) MSEK. Resultat före skatt uppgick
till ‐11,5 (‐9,6) MSEK.
Kvartalets aktiverade utvecklingsutgifter – hänförande till kostnader för; produktutveckling, produktionsteknikutveckling
samt etableringskostnader för en utökad produktionsanläggning – uppgick till -3,9 (-5,3) MSEK.
Resultat efter skatt för kvartalet uppgick till ‐11,5 (‐9,6) MSEK.
Kassaflöde och investeringar
Den löpande verksamheten gav ett negativt kassaflöde för perioden om ‐15,8 (-7,8) MSEK, av vilket -5,7 (0,5) MSEK utgörs av
förändringar inom rörelsekapitalet. ‐10,1 (-8,3) MSEK härrör till kassaflöde före förändring i rörelsekapitalet.
Investeringar för kvartalet uppgick till ‐4,3 (‐5,4) MSEK och utgjordes av aktiverade utvecklingsutgifter -3,9 (-5,3) och
maskininköp till den nya fabriken -0,4 (-0,1).
Kassaflödet från finansieringsverksamheten under kvartalet uppgick till 10,3 (-0,4) MSEK, vilket främst förklaras av upptagna
brygglån på 11,1 MSEK samt -0,8 MSEK amortering av lån till Almi och Norrlandsfonden.
Kvartalets kassaflöde var -9,9 (-13,6) MSEK. Likvida medel vid bokföringsårets utgång uppgick till 7,7 (6,8) MSEK.
Moderbolaget
Moderbolagets nettoomsättning för kvartalet uppgick till 0,0 (-0,0) MSEK. Resultat efter skatt uppgick till -2,4 (‐1,4) MSEK.
Koncerninterna inköp uppgick till 0 (0) MSEK. Finansnettot uppgick till -0,1 (0,1) MSEK vilket förklaras av koncerninterna
transaktioner.
Kvartalets kassaflöde var -8,3 (-11,6) MSEK. Likvida medel vid rapportperiodens utgång uppgick till 7,0 (6,5) MSEK.
Personal
Medelantalet anställda i koncernen var under kvartalet 43 (37).
Finansiell ställning
Balansräkning
Balansomslutningen är 202,0 (182,9) MSEK. Koncernens immateriella tillgångar uppgick vid periodens slut till 170,3 (153,8)
MSEK. Tillgångarna utgörs av aktiverade utvecklingskostnader för 168,0 (150,9) MSEK och patent 2,3 (2,9) MSEK.

Delårsrapport januari-mars 2017
Nilar International AB
4
Omsättningstillgångarna uppgick vid periodens slut till 20,1 (15,9) MSEK. Varulagret uppgick till 7,9 (6,1) MSEK.
Eget kapital i koncernen vid periodens slut uppgick till 174,5 (171,8) MSEK. Soliditeten uppgick till 86 (94) %.
Finansiell ställning
Nilar förväntas växa kraftigt och finansieringen av det rörelsekapital som krävs i framtiden har prognosticerats utifrån
historiska nyckeltal och övriga kända faktorer. Det kan inte uteslutas att det i framtiden uppstår en situation där Nilar behöver
anskaffa nytt kapital. Villkoren för en sådan eventuell transaktion påverkas av det rådande läget på finansmarknaden och kan
inte garanterat vara gynnsamma. Nilars källor till kapital för att säkra fortlevnad är bl.a.; banklån, aktieägarlån samt
kapitaltillskott via aktieägarna. Givet dessa kapitalkällor bedömer styrelsen att erforderligt kapital kommer finnas.
Övrigt
Väsentliga risker och osäkerhetsfaktorer Nilar påverkas av en mängd faktorer från omvärlden och internt som kan resultera i ett utfall som avviker från prognoser,
tidigare utveckling och förväntningar. Följande lista utgör ett urval av de risker som bolaget ser som väsentliga, men är ingen
komplett förteckning över möjliga risker.
Bransch och marknadsrisker (kunder, ökad konkurrens, konjunkturcykler)
Verksamhetsrelaterade risker (produktion, utvecklingsresurser, prognosförmåga, råvarupriser - tillgång till råvaror)
Finansiella risker (valutarisker, fortsatt finansiering)
Legala risker (lagstiftning – reglering och regelefterlevnad, immateriella rättigheter, skatterelaterade risker)
Riskhanteringen, och då primärt de finansiella riskerna, finns mer utförligt beskrivna i årsredovisningen för 2015, not 28
”Finansiell riskhantering” och not 30 ”Viktiga uppskattningar och bedömningar”.
Alla framåtriktade uttalanden i denna rapport baseras på bolagets bästa bedömningar vid tidpunkten för rapporten. Sådana uttalanden innehåller som alla framtidsbedömningar risker och osäkerheter som kan innebära att verkligt utfall blir annorlunda.
Redovisningsprinciper Koncernen och moderbolaget tillämpar samma redovisningsprinciper och beräkningsmetoder som i årsredovisningen för
2015. Denna delårsrapport är för koncernen upprättad i enlighet med IAS 34 Delårsrapportering. Delårsrapporten för
moderbolaget har upprättats i enlighet med årsredovisningslagens 9:e kapitel.
Händelser efter rapportdagen Bolaget initierade under fjärde kvartalet 2016 en kapitalanskaffning på upp till 150 MSEK. Kapitalanskaffningen väntas vara
slutförd under andra kvartalet 2017. Per 31 maj hade bolaget erhållit 129 MSEK av inbetalningar i nämnda
kapitalanskaffningsrunda. 21 MSEK av de 129 MSEK hade betalats in till bolaget innan balansdagen i form av brygglån.
Övrigt Ingenting att rapportera.
Delårsrapport januari-mars 2017
Nilar International AB
5
Stockholm den 31 maj 2017
Styrelsen
Nilar International AB
Stockholmsvägen 116B
187 30 Täby
Organisationsnummer 556600-2977
Finansiell kalender
Årsstämma 2016 hålls 19 juni 2017
Delårsrapport för kvartal 2 publiceras i augusti 2017
Delårsrapport för kvartal 3 publiceras i oktober 2017
Denna delårsrapport är inte granskad av bolagets revisorer.
För ytterligare information:
Magnus Nordgren, CFO
Telefon: +46 (0)702 14 17 49
E-mail: [email protected]
Besök även www.nilar.com
Delårsrapport januari-mars 2017
Nilar International AB
6
Koncernens rapport över totalresultat
Räkenskaps-
Q1 Q1 året
jan-mar '17 jan-mar '16 jan-dec '16
SEK'000 SEK'000 SEK'000
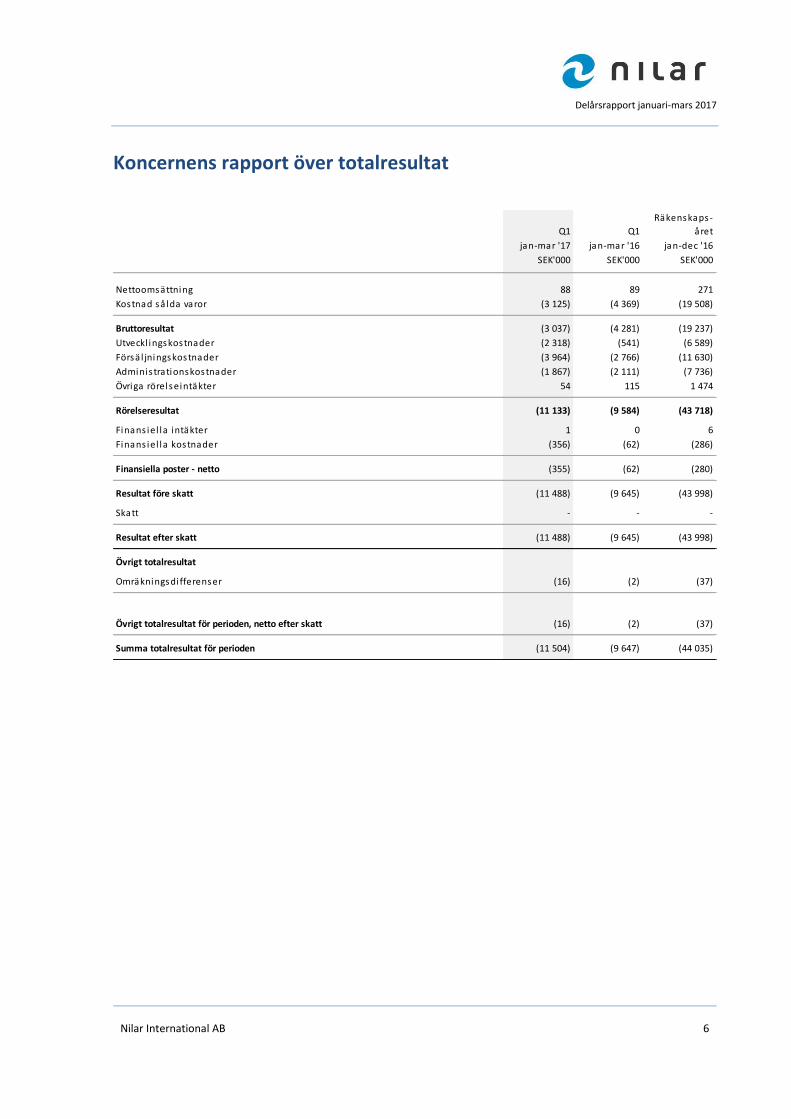
Nettoomsättning 88 89 271
Kostnad så lda varor (3 125) (4 369) (19 508)
Bruttoresultat (3 037) (4 281) (19 237)
Utveckl ingskostnader (2 318) (541) (6 589)
Försä l jningskostnader (3 964) (2 766) (11 630)
Adminis trationskostnader (1 867) (2 111) (7 736)
Övriga rörelseintäkter 54 115 1 474
Rörelseresultat (11 133) (9 584) (43 718)
Finans iel la intäkter 1 0 6
Finans iel la kostnader (356) (62) (286)
Finansiella poster - netto (355) (62) (280)
Resultat före skatt (11 488) (9 645) (43 998)
Skatt - - -
Resultat efter skatt (11 488) (9 645) (43 998)
Övrigt totalresultat
Omräkningsdi fferenser (16) (2) (37)
Övrigt totalresultat för perioden, netto efter skatt (16) (2) (37)
Summa totalresultat för perioden (11 504) (9 647) (44 035)

Delårsrapport januari-mars 2017
Nilar International AB
7
Koncernens balansräkning
2017-03-31 2016-12-31 2016-03-31 2015-12-31
SEK'000 SEK'000 SEK'000 SEK'000
Tillgångar
Anläggningstillgångar
Immateriella tillgångar
Patent 2 330 2 460 2 867 2 983
Aktiverade utveckl ingskostnader 167 947 164 062 150 911 145 588
Summa immateriella tillgångar 170 277 166 522 153 779 148 572
Materiella anläggningstillgångar
Maskiner och inventarier 9 061 10 176 13 217 14 413
Pågående nyanläggningar 2 532 2 217 35 -
Summa materiella tillgångar 11 593 12 393 13 252 14 413
Summa anläggningstillgångar 181 870 178 915 167 031 162 985
Omsättningstillgångar
Varulager 7 856 5 743 6 096 6 488
Kundfordringar 110 11 59 226
Skattefordringar 223 367 1 020 720
Övriga fordringar 2 704 2 443 1 391 1 431
Förutbeta lda kostnader och upplupna intäkter 1 523 1 682 487 1 154
Likvida medel 7 717 17 624 6 836 20 451
Summa omsättningstillgångar 20 133 27 870 15 888 30 470
Summa tillgångar 202 003 206 785 182 920 193 455
Eget kapital
Eget kapital som kan hänföras till moderföretagets aktieägare
Aktiekapita l 2 616 2 616 2 354 2 261
Ej regis trerat aktiekapita l - - - 9 272
Övrigt ti l l skjutet kapita l 419 141 419 141 370 759 361 580
Reserver 6 247 6 263 6 299 6 300
Balanserat resultat inklus ive årets resultat (253 467) (241 980) (207 627) (197 982)
Summa eget kapital 174 536 186 040 171 785 181 432
Skulder
Långfristiga skulder
Upplåning - - 1 527 1 944
Summa långfristiga skulder - - 1 527 1 944
Kortfristiga skulder
Upplåning 22 202 11 945 2 917 2 917
Leverantörsskulder 2 041 4 630 1 832 1 520
Övriga skulder 222 974 2 136 2 185
Upplupna kostnader och förutbeta lda intäkter 3 002 3 196 2 723 3 457
Summa kortfristiga skulder 27 466 20 746 9 608 10 079
Summa eget kapital och skulder 202 003 206 785 182 920 193 455

Delårsrapport januari-mars 2017
Nilar International AB
8
Koncernens rapport över förändringar i eget kapital
2017-03-31 2016-12-31 2016-03-31
SEK'000 SEK'000 SEK'000
Ingående balans 186 040 181 432 181 432
Periodens resultat (11 488) (43 998) (9 645)
Övrigt tota lresultat (16) (37) (2)
Nyemiss ion - 48 444 -
Inbetald premie för teckningsoptioner - 200 -
Utgående balans 174 536 186 040 171 785
Koncernens kassaflödesanalys
Räkenskaps-
Q1 Q1 året
jan-mar '17 jan-mar '16 jan-dec '16
SEK'000 SEK'000 SEK'000
Kassaflöde från den löpande verksamheten före förändring i rörelsekapitalet (10 127) (8 269) (38 482)
Förändring av rörelsekapital
(Ökning)/minskning varulager (2 113) 393 745
(Ökning)/minskning av rörelsefordringar 492 574 (1 522)
Ökning/(minskning) av rörelseskulder (4 086) (471) 2 188
Summa förändring av rörelsekapital (5 706) 496 1 411
Kassaflöde från den löpande verksamheten (15 833) (7 773) (37 071)
Kassaflöde från investeringsverksamheten
Investeringar i immateriel la ti l lgångar (3 885) (5 346) (18 497)
Investeringar i materiel la anläggningsti l lgångar (449) (78) (2 986)
Kassaflöde från investeringsverksamheten (4 334) (5 425) (21 483)
Kassaflöde från finansieringsverksamheten
Nyemiss ion och optionsprogram - - 48 644
Amortering av skuld (833) (417) (2 917)
Upptagna lån 11 091 - 10 000
Kassaflöde från finansieringsverksamheten 10 257 (417) 55 727
Minskning/ökning av likvida medel (9 909) (13 614) (2 827)
Likvida medel vid periodens början 17 624 20 451 20 451
Likvida medel vid periodens slut 7 714 6 836 17 624

Delårsrapport januari-mars 2017
Nilar International AB
9
Moderföretagets resultaträkning och rapport över totalresultat
Räkenskaps-
Q1 Q1 året
jan-mar '17 jan-mar '16 jan-dec '16
SEK'000 SEK'000 SEK'000
Nettoomsättning - (0) -
Kostnad så lda varor (19) (53) (256)
Bruttoresultat (19) (53) (256)
Utveckl ingskostnader (329) (197) (2 671)
Försä l jningskostnader (708) (430) (3 818)
Adminis trationskostnader (1 262) (782) (5 340)
Övriga rörelseintäkter - - 4
Rörelseresultat (2 318) (1 462) (12 081)
Finans iel la intäkter 231 61 1 761
Finans iel la kostnader (333) - (94)
Nedskrivning av aktier i dotterbolag - - (52 487)
Finansiella poster - netto (102) 61 (50 820)
Resultat efter finansnetto (2 421) (1 401) (62 902)
Lämnat koncernbidrag - - -
Resultat före skatt (2 421) (1 401) (62 902)
Inkomstskatt - - -
Resultat efter skatt (2 421) (1 401) (62 902)
Moderföretagets rapport över totalresultat
Övrigt tota lresultat, efter skatt - - -
Summa totalresultat (2 421) (1 401) (62 902)

Delårsrapport januari-mars 2017
Nilar International AB
10
Moderföretagets balansräkning
2017-03-31 2016-12-31 2016-03-31 2015-12-31
SEK'000 SEK'000 SEK'000 SEK'000
Tillgångar
Anläggningstillgångar
Immateriella tillgångar
Patent 2 330 2 460 2 867 2 983
Aktiverade utveckl ingskostnader 90 989 90 989 90 989 90 989
Summa immateriella tillgångar 93 318 93 449 93 856 93 972
Övriga anläggningstillgångar
Andelar i koncernföretag 101 101 101 101
Fordran på koncernbolag 30 829 14 527 24 001 16 525
Summa övriga anläggningstillgångar 30 929 14 628 24 102 16 626
Summa anläggningstillgångar 124 248 108 077 117 958 110 598
Omsättningstillgångar
Kundfordringar - - - -
Skattefordringar - 255 320 488
Övriga fordringar 410 811 166 300
Förutbeta lda kostnader och upplupna intäkter 265 419 270 346
Likvida medel 6 959 15 233 6 471 18 062
Summa omsättningstillgångar 7 634 16 718 7 228 19 197
Summa tillgångar 131 882 124 795 125 186 129 794
Eget kapital och skulder
Eget kapital
Bundet eget kapital
Aktiekapita l 2 616 2 616 2 354 2 261
Ej regis trerat aktiekapita l - - - 9 272
Reservfond 34 401 34 401 34 401 34 401
Summa bundet eget kapital 37 017 37 017 36 755 45 934
Fritt eget kapital
Överkurs fond 386 509 386 509 338 127 328 948
Balanserat resultat (311 245) (248 344) (248 344) (189 527)
Årets resultat (2 421) (62 902) (3 736) (58 816)
Summa fritt eget kapital 72 843 75 264 86 048 80 605
Summa eget kapital 109 860 112 281 122 803 126 539
Skulder
Kortfristiga skulder
Upplåning 21 091 10 000 - -
Leverantörsskulder 457 827 185 273
Övriga skulder (382) 403 692 810
Upplupna kostnader och förutbeta lda intäkter 857 1 285 1 506 2 173
Summa kortfristiga skulder 22 022 12 514 2 383 3 256
Summa eget kapital och skulder 131 882 124 795 125 186 129 794
Delårsrapport januari-mars 2017
Nilar International AB
11
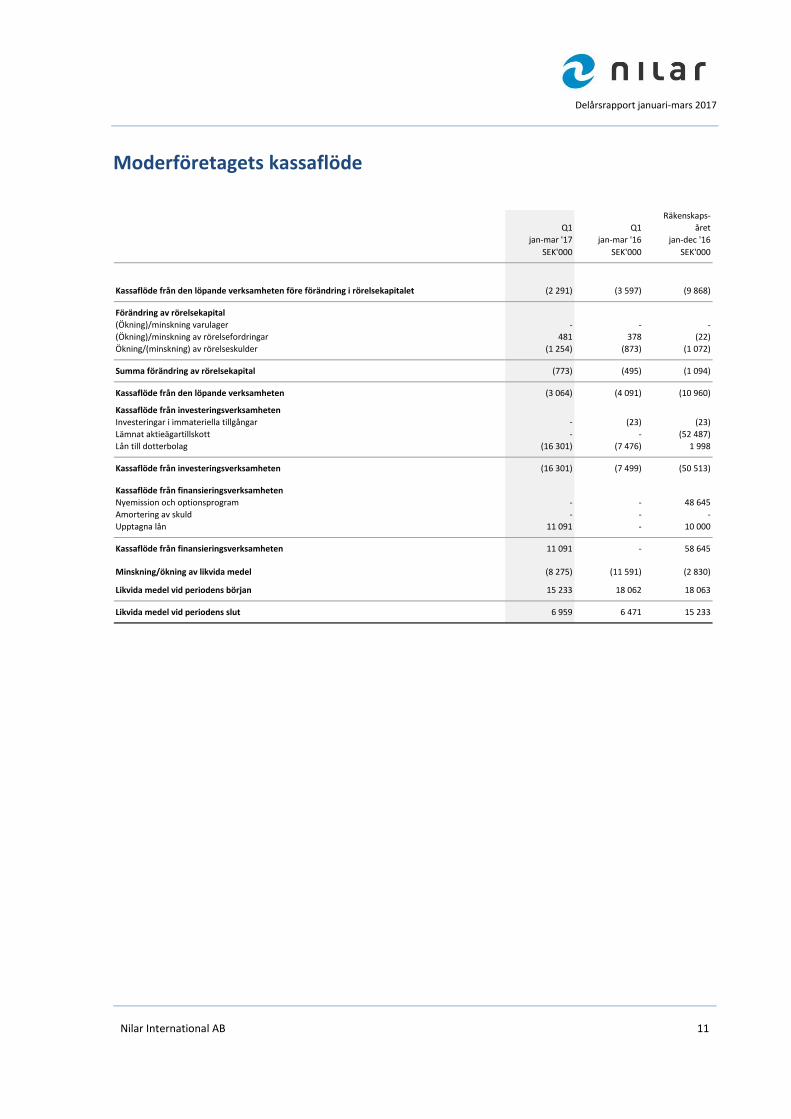
Moderföretagets kassaflöde
Räkenskaps-
Q1 Q1 året
jan-mar '17 jan-mar '16 jan-dec '16
SEK'000 SEK'000 SEK'000
Kassaflöde från den löpande verksamheten före förändring i rörelsekapitalet (2 291) (3 597) (9 868)
Förändring av rörelsekapital
(Ökning)/minskning varulager - - -
(Ökning)/minskning av rörelsefordringar 481 378 (22)
Ökning/(minskning) av rörelseskulder (1 254) (873) (1 072)
Summa förändring av rörelsekapital (773) (495) (1 094)
Kassaflöde från den löpande verksamheten (3 064) (4 091) (10 960)
Kassaflöde från investeringsverksamheten
Investeringar i immateriella tillgångar - (23) (23)
Lämnat aktieägartillskott - - (52 487)
Lån till dotterbolag (16 301) (7 476) 1 998
Kassaflöde från investeringsverksamheten (16 301) (7 499) (50 513)
Kassaflöde från finansieringsverksamheten
Nyemission och optionsprogram - - 48 645
Amortering av skuld - - -
Upptagna lån 11 091 - 10 000
Kassaflöde från finansieringsverksamheten 11 091 - 58 645
Minskning/ökning av likvida medel (8 275) (11 591) (2 830)
Likvida medel vid periodens början 15 233 18 062 18 063
Likvida medel vid periodens slut 6 959 6 471 15 233

Delårsrapport januari-mars 2017
Nilar International AB
12
Nyckeltal
Q1 Helår Q1
2016 2016 2017
jan-mar jan-dec jan-mar
SEK'000 SEK'000 SEK'000
Rapport över totalresultat
Nettoomsättning 89 271 88
Bruttoresultat (4 281) (19 237) (3 037)
EBITDA (8 219) (38 202) (9 752)
Rörelseresultat / EBIT (9 584) (43 718) (11 133)
Resultat före skatt (9 645) (43 998) (11 488)
Periodresultat (9 645) (43 998) (11 488)
Balansräkning
Anläggningstillgångar 167 031 178 915 181 870
Omsättningstillgångar 15 888 27 870 20 133
Summa tillgångar 182 920 206 785 202 003
Eget kapital 171 785 186 040 174 536
Långfristiga skulder 1 527 - -
Kortfristiga skulder 9 608 20 745 27 466
Summa eget kapital och skulder 182 920 206 785 202 003
Nyckeltal
Avskrivningar (1 365) (5 516) (1 381)
Soliditet, % 94% 90% 86%
Skuldsättningsgrad, ggr 0,1 0,1 0,2
Varulager 6 096 5 743 7 856
Medelantal anställda, antal 36 38 43
Inköp/upparbetning utgifter för utveckling 5 323 18 474 3 885
Aktiverade utvecklingskostnader 153 779 166 522 170 277
Antal emitterade aktier vid periodens slut 2 354 138 2 615 541 2 615 541
Genomsnittligt antal emitterade aktier 2 340 181 2 484 840 2 615 541
Antal utestående teckningsoptioner vid periodens slut 181 088 320 588 320 588

Delårsrapport januari-mars 2017
Nilar International AB
13
Aktieägarstruktur per 31 mars 2017
Namn Aktier/röster
Andel %
kapital/röster
Fjord Capita l Partners associerade enheter 686 341 26,2%
Lecors ier investments 379 002 14,5%
Fredriksson & Forssel l AB 259 942 9,9%
Sagax Limited/Anders Barsk 212 025 8,1%
Chris tmas Common Ltd/Per Krafft 189 826 7,3%
Brohuvudet AB 163 495 6,3%
Waterman 40 Holding B.V. 120 791 4,6%
Hans Franzén 110 378 4,2%
Firs t Energy Resources Inc. 82 866 3,2%
Stamfar Peter AB/XAOC AB 78 244 3,0%
Nei l Puester/Tri logy Equities Partnership LLC 60 186 2,3%
Segulah Venture AB 52 500 2,0%
Övriga 219 945 8,4%
Summa 2 615 541 100,0%
Definitioner
Bruttomarginal
Försäljning med avdrag för direkta kostnader för; varor, produktionsanläggningen samt -personal som andel av försäljningen
EBITDA
Earnings before Interest Taxes and Amortization = Resultat före avskrivningar
Rörelseresultat / EBIT
Earnings before Interest and Taxes = Resultat före finansiella poster
Vinstmarginal
Resultat efter skatt som andel av försäljningen
Soliditet
Eget kapital som andel av balansomslutningen
Skuldsättningsgrad
Skulder dividerat med eget kapital
Aktiverade utvecklingskostnader
Utvecklingsutgifter aktiveras när de uppfyller kriterierna enligt IAS 38 och beräknas uppgå till väsentliga belopp för
utvecklingssatsningen som helhet. I övrigt kostnadsförs utvecklingsutgifter som normala rörelsekostnader. De viktigaste
kriterierna för aktivering är att utvecklingsarbetets slutprodukt har en påvisbar framtida intjäning eller kostnadsbesparing
och kassaflöde och att det finns tekniska och finansiella förutsättningar för att fullfölja utvecklingsarbetet när det startas. De
aktiverade kostnaderna genereras såväl externt som internt och inkluderar direkta kostnader för nedlagt arbete. Direkta
hänförbara utgifter som balanseras som en del av produktutvecklingen, produktionsprocesserna samt implementering av
affärssystem innefattar utgifter för tredje part och anställda.
Delårsrapport januari-mars 2017
Nilar International AB
14
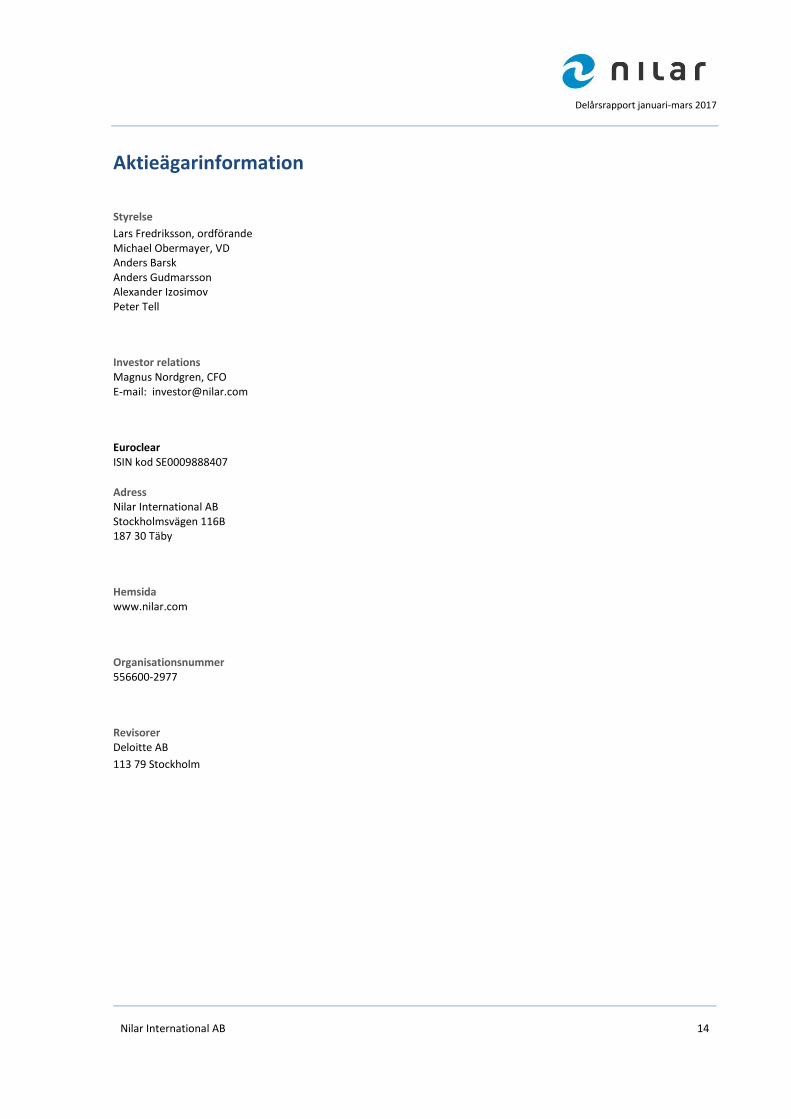
Aktieägarinformation
Styrelse
Lars Fredriksson, ordförande Michael Obermayer, VD Anders Barsk Anders Gudmarsson Alexander Izosimov Peter Tell
Investor relations Magnus Nordgren, CFO E-mail: [email protected]
Euroclear ISIN kod SE0009888407
Adress Nilar International AB Stockholmsvägen 116B 187 30 Täby
Hemsida www.nilar.com
Organisationsnummer 556600-2977
Revisorer Deloitte AB
113 79 Stockholm


www.nilar.com


![Health Systems in Myanmar new.ppt [Read-Only]yangon.sites.unicnetwork.org/files/2013/05/Health...Health Systems in Myanmar Dr. Nilar Tin Director Planning Department of Health Ministry](https://img.pdfslide.us/doc/110x75/5ab044837f8b9adb688eb63a/health-systems-in-myanmar-newppt-read-only-systems-in-myanmar-dr-nilar-tin-director.jpg)