Embed Size (px)
Citation preview
InterIm report9M 2013
Highlights | Key figures and financial ratios | Developments in 9M 2013 | Outlook | Risk factors | Management statement
Statement of comprehensive income | Statement of cash flows | Balance sheet | Statement of changes in equity | Notes | Hartmann at a glance
management report
3 Highlights
4 Key figures and financial ratios
5 Developments in 9M 2013
7 Outlook
8 Risk factors
9 Management statement
20 Hartmann at a glance
Interim financial statements
11 Statement of comprehensive income
12 Statement of cash flows
13 Balance sheet, assets
14 Balance sheet, equity and liabilities
15 Statement of changes in equity
16 Notes
CONteNtS
Hartmann Interim report 9M 2013
2
Highlights | Key figures and financial ratios | Developments in 9M 2013 | Outlook | Risk factors | Management statement
Statement of comprehensive income | Statement of cash flows | Balance sheet | Statement of changes in equity | Notes | Hartmann at a glance
HigHligHtSthe stable trend witnessed in Hartmann's european markets continued in the third quarter of the year, and both europe and North America reported revenue and operating growth for 9M 2013. the activities to enhance efficiency in europe and to expand production capacity in North America are progressing according to plan and will contribute to the achievement of Hartmann's long-term goals. Hartmann retains its full-year revenue forecast of DKK 1.5-1.6 billion and revises its profit margin forecast to 8.5-9.5% against previously 7.5-9.5%.
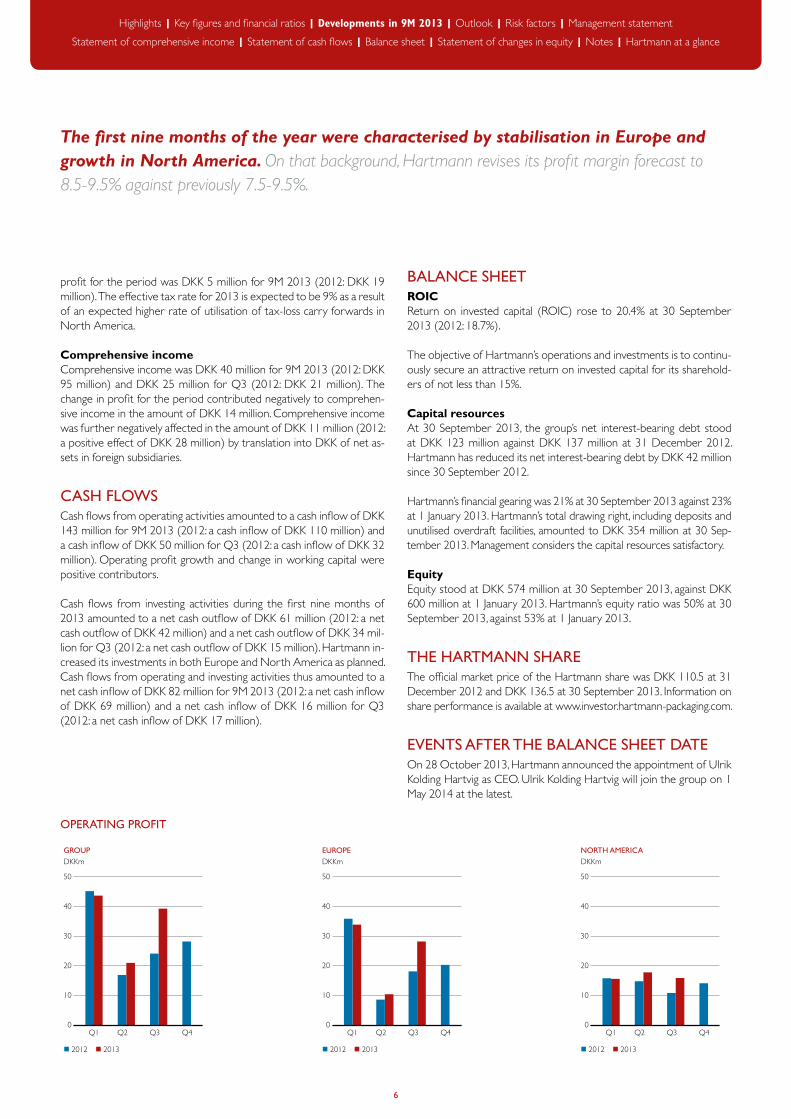
• Hartmann's revenue for 9M 2013wasDKK 1,169million (2012:DKK 1,142 million), and operating profit* was DKK 104 million (2012:DKK 86million), equal to a profitmargin* of 8.9% (2012:7.5%).ForQ3,revenuewasDKK376million(2012:DKK373mil-lion),andoperatingprofitwasDKK39million(2012:DKK24mil-lion),equaltoaprofitmarginof10.5%(2012:6.5%).
• CashflowsfromoperatingandinvestingactivitiesgrewtoanetcashinflowofDKK82millionfor9M2013(2012:anetcashinflowofDKK 69 million) and amounted to a net cash inflow of DKK 16 mil-lionforQ3(2012:anetcashinflowofDKK17million).Returnoninvestedcapital(ROIC)roseto20.4%(2012:18.7%).
• TheEuropeanrevenue for9M2013wasDKK950million (2012:DKK 946 million), and operating profit increased to DKK 73 mil-lion(2012:DKK63million),equaltoaprofitmarginof7.6%(2012:6.6%).ForQ3,revenuewasDKK303million(2012:DKK306mil-lion),andoperatingprofitgrewtoDKK28million(2012:DKK18million),equaltoaprofitmarginof9.3%(2012:5.9%).Theefficiencyenhancements in the european business continue and are aimed at maintaining the positive trend and further improving the financial performance.
• RevenuefortheNorthAmericanbusinessrosetoDKK219millionfor9M2013(2012:DKK197million),andoperatingprofitrosetoDKK49million(2012:DKK41million),equaltoaprofitmarginof22.5%(2012:21.0%).ForQ3,revenuewasDKK73million(2012:DKK66million),andoperatingprofitgrewtoDKK16million(2012:DKK11million),equaltoaprofitmarginof21.8%(2012:16.3%).
• Special itemsamounted toanexpenseofDKK39million for9M2013(2012:DKK0million),coveringtheclosureofthemanufactur-ing facility in Finland and a severance payment to the former CeO of Hartmann.
• HartmannhasappointedUlrikKoldingHartvigasCEO.UlrikKoldingHartvig will join Hartmann on 1 May 2014 at the latest, taking over from Marianne Rørslev Bock, who has acted as interim CeO since June 2013.
• Hartmannretainsitsfull-yearrevenueforecastofDKK1.5-1.6bil-lion and revises its profit margin forecast to 8.5-9.5% against previ-ously 7.5-9.5%.
* References to operating profit in this report are to operating profit before special items, and references to profit margin are to profit margin before special items, unless otherwise stated.
Hartmann Interim report 9M 2013
3
Highlights | Key figures and financial ratios | Developments in 9M 2013 | Outlook | Risk factors | Management statement
Statement of comprehensive income | Statement of cash flows | Balance sheet | Statement of changes in equity | Notes | Hartmann at a glance
Highlights
DKKmKEyFIgURESANDFiNANCiAl RAtiOS Q3 Q3 9M 9M Group 2013 2012 2013 2012
Statement of comprehensive income Revenue 376 373 1,169 1,142Operatingprofit/(loss)beforedepreciation,amortisationandimpairment(EBITDA) 59 45 136 146Operatingprofit/(loss)beforespecialitems 39 24 104 86Specialitems 0 0 (39) 0Operatingprofit/(loss)(EBIT) 39 24 65 86Financialincomeandexpenses,net (4) (1) (12) (5)Profit/(loss)beforetax(EBT) 35 23 53 82Profit/(loss)fortheperiod(EAT) 32 18 48 63Comprehensive income 25 21 40 95
Cash flows Cash flows from operating activities 50 32 143 110Cashflowsfrominvestingactivities (34) (15) (61) (42)Cashflowsfromfinancingactivities (5) 0 (43) (59)total cash flows 11 17 39 10
Balance sheet Assets 1,154 1,154Investedcapital(IC) 633 693Networkingcapital(NWC) 128 151Net interest-bearing debt 123 165equity 574 591
Financial ratios, % Profitmargin(EBITDA) 15.7 12.1 11.7 12.7Profit margin before special items 10.5 6.5 8.9 7.5Profitmargin(EBIT) 10.5 6.5 5.6 7.5Returnonaverageinvestedcapital(ROIC,rolling12months) 20.4 18.7Returnonequity(rolling12months) 13.5 14.9equity ratio 49.7 51.3gearing 21.4 27.9
Share-based financial ratios No.ofshares(atperiodend,excludingtreasuryshares) 6,915,090 6,915,090No.ofshares(average,excludingtreasuryshares) 6,915,090 6,915,090Earningspershare,DKK(EPS) 4.6 2.6 7.0 9.1Cash flows from operating activities per share, DKK 7.2 4.6 20.7 16.0Book value per share, DKK 83.0 85.5Market price per share, DKK 136.5 115.0Market price/book value per share 1.6 1.3Price/earnings 19.5 12.7
the financial ratios are calculated in accordance with ‘Recommendations & Ratios 2010’, issued by the Danish Society of Financial Analysts. See note 37 to the financial statements in the annual report for 2012.
Hartmann Interim report 9M 2013
4
Highlights | Key figures and financial ratios | Developments in 9M 2013 | Outlook | Risk factors | Management statement
Statement of comprehensive income | Statement of cash flows | Balance sheet | Statement of changes in equity | Notes | Hartmann at a glance
Key figures and financial ratios
DevelOPMeNtS iN 9M 2013
the positive trend witnessed in 9M 2013 was driven by stabilisation in a number of Hartmann's european markets and growth in North America. Based on the increased operating profit, Hartmann revises its profit margin forecast to 8.5-9.5% against previously 7.5-9.5%.
the activities to improve the performance of the european business were intensified in the first six months of the year, and the initiatives targeting sales and production are progressing according to plan. in Q3, Hartmann achieved significant operating profit growth in europe and will continue its efficiency enhancement efforts with the aim of main-taining the positive trend and further boosting the performance.
North America continued to see both revenue growth and operating profit growth. the improvement and the positive feedback received from existing and new customers provide a solid platform for the ex-pansion of production capacity, which is still expected to be fully im-plemented in 2014.
HartmannhasappointedUlrikKoldingHartvigasCEOasof1May2014atthelatest.UlrikKoldingHartvigcomesfromapositionasSen-ior vice President with FlSmidth and has previously held management positions with Danish industrial companies operating internationally, in-cludingthepositionofCEOofCembritHolding.UlrikKoldingHartvigwill be taking over from Marianne Rørslev Bock, who has acted as in-terim CeO since June 2013.
StateMent oF coMpreHenSIve IncoMerevenueHartmann'stotalrevenuewasDKK1,169millionfor9M2013(2012:DKK1,142million)andDKK376millionforQ3(2012:DKK373mil-lion). Both europe and North America reported revenue growth.
Europethe european business reported revenue of DKK 950 million for 9M 2013(2012:DKK946million)andDKK303millionforQ3(2012:DKK306 million).
Sales in Hartmann's mature markets continued to stabilise, and the ef-forts to increase the proportion of premium products in a number of markets continue to produce good results.
North Americain North America, Hartmann generated revenue of DKK 219 mil-lionfor9M2013(2012:DKK197million)andDKK73millionforQ3(2012:DKK66million).
the positive trend witnessed in the first three quarters of the year was driven by increased sales, with revenue positively influenced by additional sales to existing customers, in particular, based on increased capacity utilisation. the North American growth continued in Q3, and the proportion of premium products increased.
operating profitOperatingprofit grew toDKK104million in 9M2013 (2012:DKK86million),equaltoaprofitmarginof8.9%(2012:7.5%),andforQ3operatingprofitwasDKK39million(2012:DKK24million),equaltoaprofitmarginof10.5%(2012:6.5%).
EuropeOperating profit for the european business was DKK 73 million for 9M 2013(2012:DKK63million),equaltoaprofitmarginof7.6%(2012:6.6%).ForQ3,operatingprofitgrewtoDKK28million(2012:DKK18million),equaltoaprofitmarginof9.3%(2012:5.9%).
the higher proportion of premium products and sales growth contrib-utedpositively tothehigheroperatingprofit for9M(positiveeffectof DKK 18 million), while increased energy and paper prices had a negativeimpactonthefinancialperformance(negativeeffectofDKK9 million). the increase in energy prices was partially offset by energy efficiency enhancements, and capacity utilisation in the european man-ufacturing facilities continued to improve in Q3.
North AmericaNorth America generated an operating profit of DKK 49 million for 9M2013 (2012:DKK41million),equal toaprofitmarginof22.5%(2012:21.0%).OperatingprofitgrewtoDKK16millionforQ3(2012:DKK11million),equaltoaprofitmarginof21.8%(2012:16.3%).
the continued sales growth in the North American business positively affectedtheoperatingprofitfor9M2013(positiveeffectofDKK14million), while a minor increase in fixed costs and higher transport costswerenegativecontributors(negativeeffectofDKK8million).
Corporate functionsCosts related to corporate functions came to DKK 18 million for 9M 2013(2012:DKK18million)andDKK5millionforQ3(2012:DKK5million).
Special itemsSpecial items for 9M 2013 amounted to a net expense of DKK 39 million(2012:DKK0million).Seenote4tothefinancialstatements.Of this amount, the closure of the manufacturing facility in Finland led to an expense of DKK 33 million, and the severance payment to Hart-mann's CeO was an expense of DKK 6 million.
Financial income and expensesHartmann reported a net financial expense of DKK 12 million for 9M 2013(2012:anetexpenseofDKK5million)andanetexpenseofDKK4million forQ3 (2012: anetexpenseofDKK1million).Thechange was attributable to adverse effects of foreign exchange adjust-ments on translation into DKK.
profit for the periodProfit for theperiodwasDKK48million for9M2013 (2012:DKK63million)andDKK32millionforQ3(2012:DKK18million).Taxon
Hartmann Interim report 9M 2013
5
Highlights | Key figures and financial ratios | Developments in 9M 2013 | Outlook | Risk factors | Management statement
Statement of comprehensive income | Statement of cash flows | Balance sheet | Statement of changes in equity | Notes | Hartmann at a glance
Developments
profitfortheperiodwasDKK5millionfor9M2013(2012:DKK19million). the effective tax rate for 2013 is expected to be 9% as a result of an expected higher rate of utilisation of tax-loss carry forwards in North America.
Comprehensive incomeComprehensiveincomewasDKK40millionfor9M2013(2012:DKK95million)andDKK25million forQ3(2012:DKK21million).Thechange in profit for the period contributed negatively to comprehen-sive income in the amount of DKK 14 million. Comprehensive income wasfurthernegativelyaffectedintheamountofDKK11million(2012:a positive effect of DKK 28 million) by translation into DKK of net as-sets in foreign subsidiaries.
caSH FlowSCash flows from operating activities amounted to a cash inflow of DKK 143millionfor9M2013(2012:acashinflowofDKK110million)andacashinflowofDKK50millionforQ3(2012:acashinflowofDKK32million). Operating profit growth and change in working capital were positive contributors.
Cash flows from investing activities during the first nine months of 2013amountedtoanetcashoutflowofDKK61million(2012:anetcash outflow of DKK 42 million) and a net cash outflow of DKK 34 mil-lionforQ3(2012:anetcashoutflowofDKK15million).Hartmannin-creased its investments in both europe and North America as planned. Cash flows from operating and investing activities thus amounted to a netcashinflowofDKK82millionfor9M2013(2012:anetcashinflowof DKK 69 million) and a net cash inflow of DKK 16 million for Q3 (2012:anetcashinflowofDKK17million).
Balance SHeetroICReturn on invested capital (ROIC) rose to 20.4% at 30 September2013(2012:18.7%).
the objective of Hartmann’s operations and investments is to continu-ously secure an attractive return on invested capital for its sharehold-ers of not less than 15%.
Capital resourcesAt 30 September 2013, the group’s net interest-bearing debt stood at DKK 123 million against DKK 137 million at 31 December 2012. Hartmann has reduced its net interest-bearing debt by DKK 42 million since 30 September 2012.
Hartmann’s financial gearing was 21% at 30 September 2013 against 23% at 1 January 2013. Hartmann’s total drawing right, including deposits and unutilised overdraft facilities, amounted to DKK 354 million at 30 Sep-tember 2013. Management considers the capital resources satisfactory.
equityequity stood at DKK 574 million at 30 September 2013, against DKK 600 million at 1 January 2013. Hartmann’s equity ratio was 50% at 30 September 2013, against 53% at 1 January 2013.
tHe HartMann SHarethe official market price of the Hartmann share was DKK 110.5 at 31 December 2012 and DKK 136.5 at 30 September 2013. information on share performance is available at www.investor.hartmann-packaging.com.
eventS aFter tHe Balance SHeet dateOn28October2013,HartmannannouncedtheappointmentofUlrikKoldingHartvigasCEO.UlrikKoldingHartvigwilljointhegroupon1May 2014 at the latest.
The first nine months of the year were characterised by stabilisation in Europe and growth in North America. On that background, Hartmann revises its profit margin forecast to 8.5-9.5% against previously 7.5-9.5%.
Q1
DKKmGROUP
2012 2013
Q2 Q3 Q40
10
20
30
40
50
Q1
DKKmEUROPE
2012 2013
Q2 Q3 Q40
10
20
30
40
50
Q1
DKKmNORTH AMERICA
2012 2013
Q2 Q3 Q40
10
20
30
40
50
operatInG proFIt
Hartmann Interim report 9M 2013
6
Highlights | Key figures and financial ratios | Developments in 9M 2013 | Outlook | Risk factors | Management statement
Statement of comprehensive income | Statement of cash flows | Balance sheet | Statement of changes in equity | Notes | Hartmann at a glance
OUTLOOK
Based on the stable trend witnessed in Hartmann's european mar-kets and the performance for 9M 2013, Hartmann retains its full-year revenue forecast of DKK 1.5-1.6 billion and revises its profit margin forecast to 8.5-9.5% against previously 7.5-9.5%.
Special items are expected to be an expense of DKK 36-46 million, which amount is not included in the guidance for 2013.
Due to seasonal fluctuations, Hartmann’s revenue for the first and fourth quarters is generally higher than for the second and third quar-ters. Hartmann’s sales of machinery are not affected by seasonal fluctu-ations, but revenue may be subject to quarterly fluctuations depending on the timing of order execution at Hartmann technology.
Hartmann's total capital expenditure for 2013 is expected to amount to approximately DKK 120 million, down from the previous forecast of DKK 120-140 million. the total capital expenditure comprises this year's investments in expansion of existing production capacity in North America, expected to be fully implemented in 2014, and the group’s increased focus on automating and enhancing production ef-ficiency in both europe and North America.
aSSuMptIonSHartmann’s revenue and profit margin forecast for 2013 is based on the present composition of the group’s business operations. in addition, total costs of raw materials and selling prices are assumed to remain relatively stable at the level prevailing at the time of presentation of this interim report. Any deviations from these assumptions may affect the 2013 performance.
Hartmann’s operating profit and profit margin are mainly exposed to developments in raw material prices and exchange rates. Hartmann has hedged its primary currency exposure until 30 June 2014.
Forward-lookInG StateMentSthe forward-looking statements in this interim report reflect Hart-mann’s current expectations for future events and financial results. the statements are inherently subject to uncertainty, and actual results may therefore differ from expectations. Factors that may cause the actual results to differ from expectations include, but are not limited to, general economic developments and developments in the finan-cial markets, changes and amendments to legislation and regulation in Hartmann’s markets, changes in demand for products, competition and the prices of raw materials.
ForecaSt and FInancIal tarGetS
2013 2013 previous revised 2015
Revenue DKK 1.5-1.6bn DKK 1.5-1.6bn DKK 1.7-1.8bnProfit margin 7.5-9.5% 8.5-9.5% 8-11%
Hartmann Interim report 9M 2013
7
Highlights | Key figures and financial ratios | Developments in 9M 2013 | Outlook | Risk factors | Management statement
Statement of comprehensive income | Statement of cash flows | Balance sheet | Statement of changes in equity | Notes | Hartmann at a glance
Outlook
RiSK FACtORS
See the section on risk factors and note 33 to the financial statements in the annual report for 2012 for a full description of Hartmann’s risk factors.
raw MaterIalSHartmann is dependent on the purchase prices of the raw materials used in production. Hartmann is particularly exposed to fluctuations in thepurchasepricesofrecycledpaperandenergy(electricityandgas),which are the most important raw materials used in production.
there is limited scope for reducing Hartmann’s sensitivity to devel-opments in the price of recycled paper if supplies of the required volumes are to be secured and maintained. Hartmann substitutes to some extent certain types of paper for other types if prices are more favourable.
Hartmann regularly signs fixed-price agreements with energy suppli-ers, typically for periods of 6 or 12 months, covering a substantial part of the group’s energy consumption. However, it is not possible to sign fixed-price agreements with energy suppliers in all of the countries in which Hartmann operates.
Hartmann is committed to reducing its sensitivity to fluctuations in the prices of raw materials through continual implementation of techno-logical improvements and optimisation of work processes.
currencyHartmann’s currency risks consist of transaction risks and translation risks, respectively.
Hartmann is exposed to transaction risk due to cross-border transac-tions leading to contractual cash flows in foreign currency. Most sales generatedintheNorthAmericanbusinessareinvoicedinUSD,whilemost costs are incurred in CAD. therefore, the currency exposure in relationtotheUSD/CADexchangerateconstitutesoneofthegroup’ssingle largest transaction risks. Other significant transaction risks relate tothecurrenciesCHF,EUR,gBP,HRK,HUF,PLNandSEK.
Due to its foreign subsidiaries, Hartmann is exposed to translation risks since a major part of the group’s earnings and net assets derive from these foreign subsidiaries and is therefore translated and included in the consolidated financial statements, which are presented in DKK. in terms of net position, foreign subsidiaries’ reporting in the currencies CAD,EUR,HRK,HUFandILSrepresentsHartmann’sgreatesttransla-tion exposure.
Hartmann hedges its transaction risk to the effect that primary cur-rencies are continuously hedged for a period of not less than 6 and not more than 12 months. translation risk is not hedged, as it does not have any direct impact on Hartmann’s cash resources or underlying cash flows.
Hartmann Interim report 9M 2013
8
Highlights | Key figures and financial ratios | Developments in 9M 2013 | Outlook | Risk factors | Management statement
Statement of comprehensive income | Statement of cash flows | Balance sheet | Statement of changes in equity | Notes | Hartmann at a glance
Risk factors
MANAgeMeNt StAteMeNt
the Board of Directors and the executive Board have today consid-ered and approved the interim report of Brødrene Hartmann A/S for the nine months ended 30 September 2013.
the interim report, which has been neither audited nor reviewed by the company’s auditors, was prepared in accordance with iAS 34 ‘in-terimFinancialReporting’asadoptedbytheEUandDanishdisclosurerequirements for listed companies.
in our opinion, the interim financial statements give a true and fair view of the group’s assets and liabilities and financial position at 30 Septem-ber 2013 and of the results of the group’s operations and cash flows for the nine months ended 30 September 2013.
Furthermore, in our opinion, the management report includes a fair re-view of the development and performance of the group’s activities, the financial results for the period and the financial position of the group in general and describes the principal risks and uncertainties that it faces.
gentofte, 12 November 2013
Executive Board: Marianne Rørslev Bock CFO and interim CEO
Board of Directors: AgneteRaaschou-Nielsen WaltherV.Paulsen JanPeterAntonisen Chairman Vice Chairman
Niels Hermansen Jørn Mørkeberg Nielsen Steen Parsholt
Niels Christian Petersen
Hartmann Interim report 9M 2013
9
Highlights | Key figures and financial ratios | Developments in 9M 2013 | Outlook | Risk factors | Management statement
Statement of comprehensive income | Statement of cash flows | Balance sheet | Statement of changes in equity | Notes | Hartmann at a glance
Management statement
DKKm
Interim financial statements
11 Statement of comprehensive income
12 Statement of cash flows
13 Balance sheet, assets
14 Balance sheet, equity and liabilities
15 Statement of changes in equity
16 Notes
InterIm FInAnCIAL StAtementS
Hartmann Interim report 9M 2013
10
Highlights | Key figures and financial ratios | Developments in 9M 2013 | Outlook | Risk factors | Management statement
Statement of comprehensive income | Statement of cash flows | Balance sheet | Statement of changes in equity | Notes | Hartmann at a glance
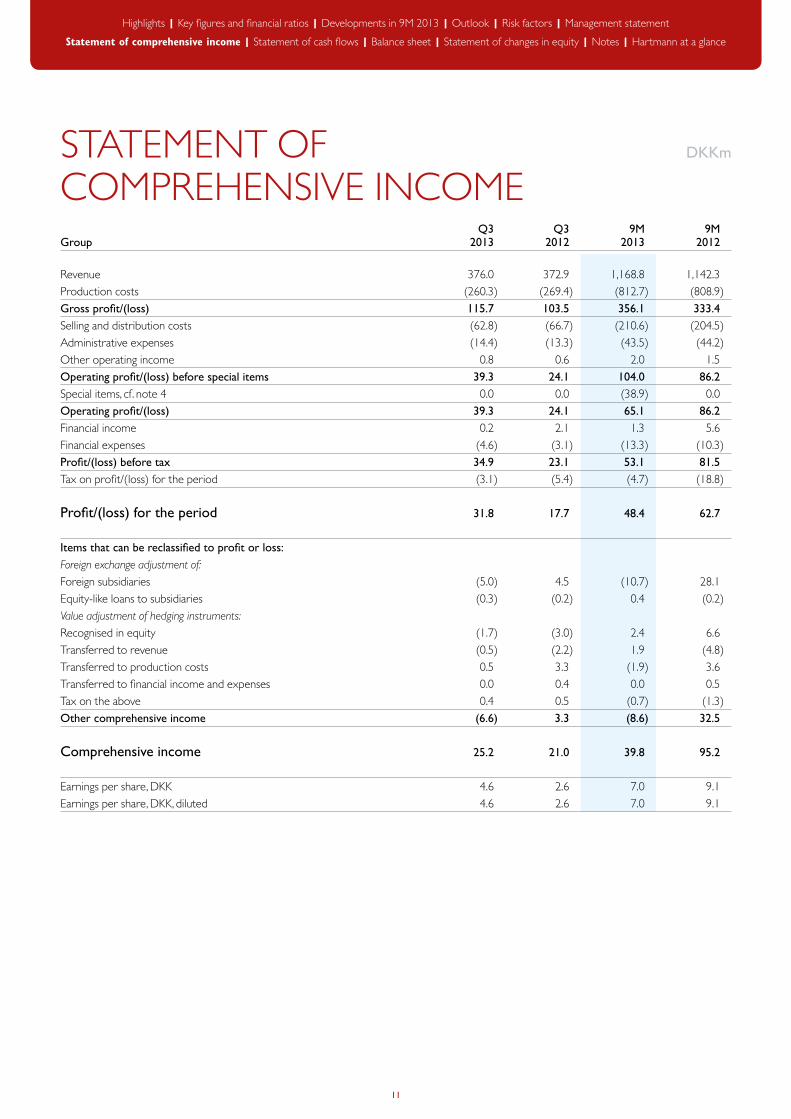
DKKmStAteMeNt OF COMPReHeNSive iNCOMe Q3 Q3 9M 9M Group 2013 2012 2013 2012
Revenue 376.0 372.9 1,168.8 1,142.3Productioncosts (260.3) (269.4) (812.7) (808.9)Gross profit/(loss) 115.7 103.5 356.1 333.4Sellinganddistributioncosts (62.8) (66.7) (210.6) (204.5)Administrativeexpenses (14.4) (13.3) (43.5) (44.2)Other operating income 0.8 0.6 2.0 1.5Operating profit/(loss) before special items 39.3 24.1 104.0 86.2Specialitems,cf.note4 0.0 0.0 (38.9) 0.0Operating profit/(loss) 39.3 24.1 65.1 86.2Financial income 0.2 2.1 1.3 5.6Financialexpenses (4.6) (3.1) (13.3) (10.3)Profit/(loss) before tax 34.9 23.1 53.1 81.5Taxonprofit/(loss)fortheperiod (3.1) (5.4) (4.7) (18.8) Profit/(loss) for the period 31.8 17.7 48.4 62.7 Items that can be reclassified to profit or loss:Foreign exchange adjustment of: Foreignsubsidiaries (5.0) 4.5 (10.7) 28.1Equity-likeloanstosubsidiaries (0.3) (0.2) 0.4 (0.2)Value adjustment of hedging instruments: Recognisedinequity (1.7) (3.0) 2.4 6.6Transferredtorevenue (0.5) (2.2) 1.9 (4.8)Transferredtoproductioncosts 0.5 3.3 (1.9) 3.6transferred to financial income and expenses 0.0 0.4 0.0 0.5Taxontheabove 0.4 0.5 (0.7) (1.3)Other comprehensive income (6.6) 3.3 (8.6) 32.5 comprehensive income 25.2 21.0 39.8 95.2 earnings per share, DKK 4.6 2.6 7.0 9.1earnings per share, DKK, diluted 4.6 2.6 7.0 9.1
Hartmann Interim report 9M 2013
11
Highlights | Key figures and financial ratios | Developments in 9M 2013 | Outlook | Risk factors | Management statement
Statement of comprehensive income | Statement of cash flows | Balance sheet | Statement of changes in equity | Notes | Hartmann at a glance
Statement of comprehensive income
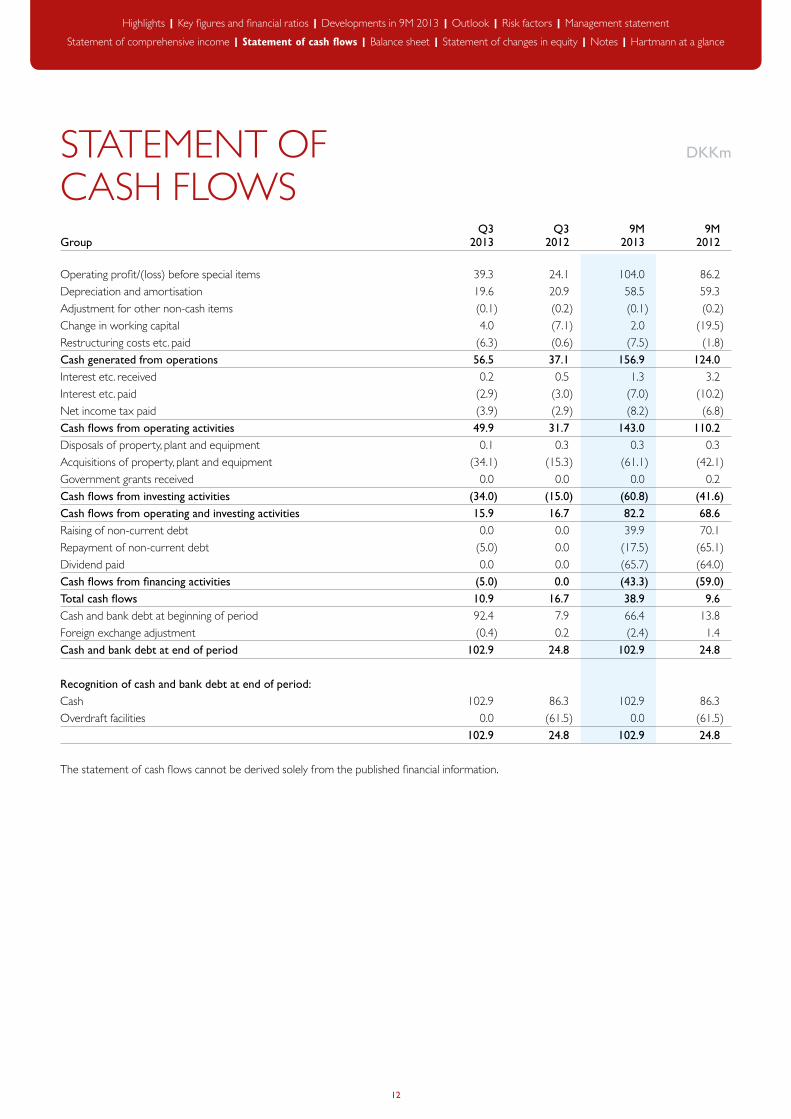
DKKmStAteMeNt OF CASHFLOWS Q3 Q3 9M 9M Group 2013 2012 2013 2012
Operatingprofit/(loss)beforespecialitems 39.3 24.1 104.0 86.2Depreciation and amortisation 19.6 20.9 58.5 59.3Adjustmentforothernon-cashitems (0.1) (0.2) (0.1) (0.2)Changeinworkingcapital 4.0 (7.1) 2.0 (19.5)Restructuringcostsetc.paid (6.3) (0.6) (7.5) (1.8)Cash generated from operations 56.5 37.1 156.9 124.0interest etc. received 0.2 0.5 1.3 3.2Interestetc.paid (2.9) (3.0) (7.0) (10.2)Netincometaxpaid (3.9) (2.9) (8.2) (6.8)Cash flows from operating activities 49.9 31.7 143.0 110.2Disposals of property, plant and equipment 0.1 0.3 0.3 0.3Acquisitionsofproperty,plantandequipment (34.1) (15.3) (61.1) (42.1)government grants received 0.0 0.0 0.0 0.2Cash flows from investing activities (34.0) (15.0) (60.8) (41.6)Cash flows from operating and investing activities 15.9 16.7 82.2 68.6Raising of non-current debt 0.0 0.0 39.9 70.1Repaymentofnon-currentdebt (5.0) 0.0 (17.5) (65.1)Dividendpaid 0.0 0.0 (65.7) (64.0)Cash flows from financing activities (5.0) 0.0 (43.3) (59.0)Total cash flows 10.9 16.7 38.9 9.6Cash and bank debt at beginning of period 92.4 7.9 66.4 13.8Foreignexchangeadjustment (0.4) 0.2 (2.4) 1.4Cash and bank debt at end of period 102.9 24.8 102.9 24.8 recognition of cash and bank debt at end of period: Cash 102.9 86.3 102.9 86.3Overdraftfacilities 0.0 (61.5) 0.0 (61.5) 102.9 24.8 102.9 24.8 the statement of cash flows cannot be derived solely from the published financial information.
Hartmann Interim report 9M 2013
12
Highlights | Key figures and financial ratios | Developments in 9M 2013 | Outlook | Risk factors | Management statement
Statement of comprehensive income | Statement of cash flows | Balance sheet | Statement of changes in equity | Notes | Hartmann at a glance
Statement of cash flows
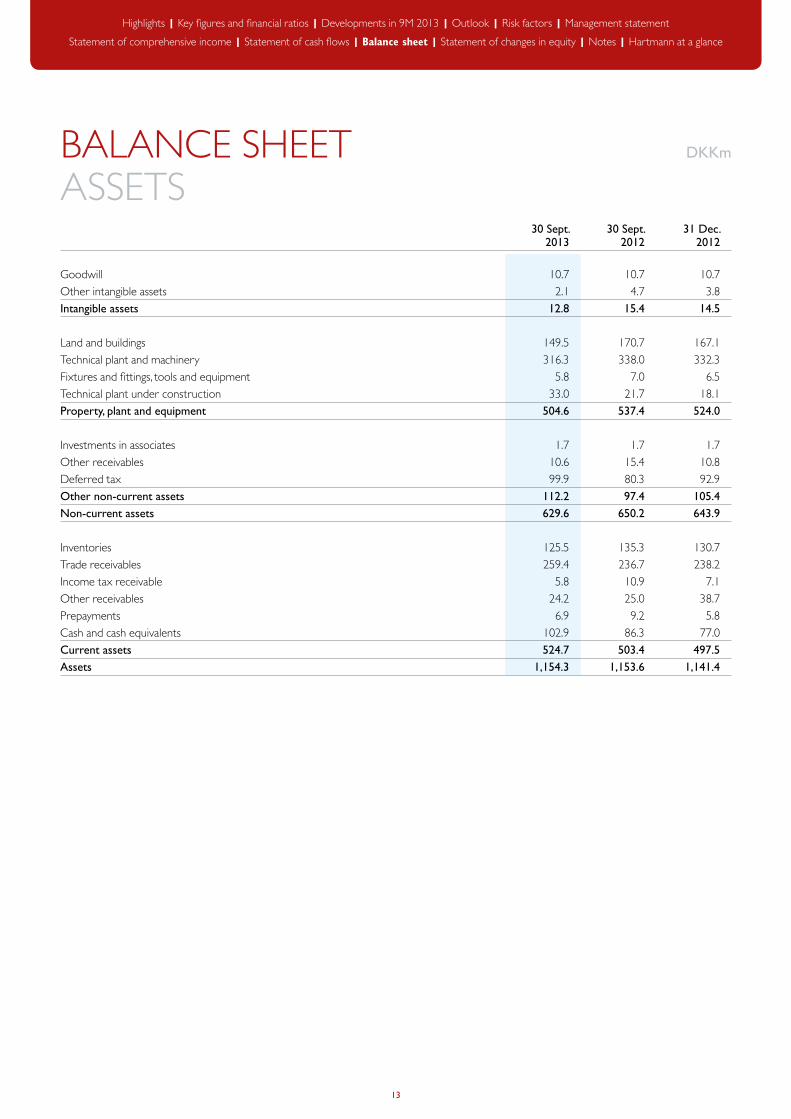
DKKmBAlANCe SHeet ASSetS 30 Sept. 30 Sept. 31 Dec. 2013 2012 2012
goodwill 10.7 10.7 10.7Other intangible assets 2.1 4.7 3.8Intangible assets 12.8 15.4 14.5 land and buildings 149.5 170.7 167.1technical plant and machinery 316.3 338.0 332.3Fixtures and fittings, tools and equipment 5.8 7.0 6.5technical plant under construction 33.0 21.7 18.1Property, plant and equipment 504.6 537.4 524.0 investments in associates 1.7 1.7 1.7Other receivables 10.6 15.4 10.8Deferred tax 99.9 80.3 92.9Other non-current assets 112.2 97.4 105.4Non-current assets 629.6 650.2 643.9 inventories 125.5 135.3 130.7trade receivables 259.4 236.7 238.2income tax receivable 5.8 10.9 7.1Other receivables 24.2 25.0 38.7Prepayments 6.9 9.2 5.8Cash and cash equivalents 102.9 86.3 77.0Current assets 524.7 503.4 497.5Assets 1,154.3 1,153.6 1,141.4
Hartmann Interim report 9M 2013
13
Highlights | Key figures and financial ratios | Developments in 9M 2013 | Outlook | Risk factors | Management statement
Statement of comprehensive income | Statement of cash flows | Balance sheet | Statement of changes in equity | Notes | Hartmann at a glance
Balance sheet
DKKmBAlANCe SHeet EQUITyANDLIABILITIES 30 Sept. 30 Sept. 31 Dec. 2013 2012 2012
Share capital 140.3 140.3 140.3 Hedgingreserve (3.0) (3.6) (4.8)Translationreserve (47.5) (26.6) (37.1)Proposed dividend 0.0 0.0 65.7 Retained earnings 484.5 481.3 436.1 Equity 574.3 591.4 600.2 Deferred tax 14.9 18.7 15.2 Pension obligations 43.6 32.9 46.8 Credit institutions 225.6 189.9 203.1 government grants 20.1 23.6 22.2 Other payables 0.0 2.3 1.5 Non-current liabilities 304.2 267.4 288.8 government grants 2.8 3.2 3.1 Overdraft facilities 0.0 61.5 10.6 Prepayments from customers 9.7 12.2 12.1 trade payables 119.3 88.8 120.0 Payables to associates 2.9 2.2 2.0 income tax 7.1 5.2 0.3 Provisions 21.9 2.9 2.2 Other payables 112.1 118.8 102.1 Current liabilities 275.8 294.8 252.4 Liabilities 580.0 562.2 541.2 Equity and liabilities 1,154.3 1,153.6 1,141.4
Hartmann Interim report 9M 2013
14
Highlights | Key figures and financial ratios | Developments in 9M 2013 | Outlook | Risk factors | Management statement
Statement of comprehensive income | Statement of cash flows | Balance sheet | Statement of changes in equity | Notes | Hartmann at a glance
DKKmStAteMeNt OF CHANgESINEQUITy Hedging translation proposed retained total Group Share capital reserve reserve dividend earnings equity
Equity at 1 January 2013 140.3 (4.8) (37.1) 65.7 436.1 600.2
Profit/(loss)fortheperiod - - - 0.0 48.4 48.4
Other comprehensive incomeItems that can be reclassified to profit or lossForeignexchangeadjustmentof:Foreignsubsidiaries - - (10.7) - - (10.7)equity-like loans to subsidiaries - - 0.4 - - 0.4Valueadjustmentofhedginginstruments:Recognised in equity - 2.4 - - - 2.4transferred to revenue - 1.9 - - - 1.9Transferredtoproductioncosts - (1.9) - - - (1.9)Taxontheabove - (0.6) (0.1) - - (0.7) 0.0 1.8 (10.4) 0.0 0.0 (8.6)Total comprehensive income 0.0 1.8 (10.4) 0.0 48.4 39.8
Transactions with ownersDividendpaid - - - (65.7) - (65.7)Total changes in equity 0.0 1.8 (10.4) (65.7) 48.4 (25.9) Equity at 30 September 2013 140.3 (3.0) (47.5) 0.0 484.5 574.3
Equity at 1 January 2012 140.3 (8.1) (54.6) 64.0 418.6 560.2
Profit/(loss)fortheperiod - - - 0.0 62.7 62.7
Other comprehensive incomeItems that can be reclassified to profit or lossForeignexchangeadjustmentof:Foreign subsidiaries - - 28.1 - - 28.1Equity-likeloanstosubsidiaries - - (0.2) - - (0.2)Valueadjustmentofhedginginstruments:Recognised in equity - 6.6 - - - 6.6Transferredtorevenue - (4.8) - - - (4.8)transferred to production costs - 3.6 - - - 3.6transferred to financial income and expenses - 0.5 - - - 0.5Taxontheabove - (1.4) 0.1 - - (1.3) 0.0 4.5 28.0 0.0 0.0 32.5Total comprehensive income 0.0 4.5 28.0 0.0 62.7 95.2
Transactions with ownersDividendpaid - - - (64.0) - (64.0)Total changes in equity 0.0 4.5 28.0 (64.0) 62.7 31.2 Equity at 30 September 2012 140.3 (3.6) (26.6) 0.0 481.3 591.4
Hartmann Interim report 9M 2013
15
Highlights | Key figures and financial ratios | Developments in 9M 2013 | Outlook | Risk factors | Management statement
Statement of comprehensive income | Statement of cash flows | Balance sheet | Statement of changes in equity | Notes | Hartmann at a glance
Statement of changes in equity
NOteS
01 accountInG polIcIeS
the interim financial statements are presented in accordance with IAS34‘InterimFinancialReporting’asadoptedby theEUandDan-ish disclosure requirements for listed companies. No interim financial statements have been prepared for the parent company. the interim financial statementsarepresented inDanishkroner (DKK),which isthe presentation currency used for the group’s operations and the functional currency of the parent company.
the accounting policies applied in the interim financial statements are consistent with the accounting policies applied in the consolidated fi-nancial statements for 2012. the accounting policies are described in note 37 to the financial statements in the annual report for 2012, to which reference is made.
New financial reporting standards and interpretations in 2013Hartmann has implemented all new and revised financial reporting standardsandinterpretationsadoptedbytheEUthatareeffectiveforfinancial years beginning on or after 1 January 2013. in this connection, Hartmann has implemented iAS 1 concerning presentation of other comprehensive income. the comparative figures have been restated accordingly. Furthermore, Hartmann has assessed that the new and revised standards and interpretations that are effective for financial years beginning on or after 1 January 2013 are either not relevant or not of significant importance.
02 SIGnIFIcant accountInG eStIMateS and judGMentS
Significant accounting estimates and judgmentsin applying the group’s accounting policies, management is required to make judgments, estimates and assumptions concerning the carrying amount of assets and liabilities which cannot be immediately inferred from other sources.
the judgments, estimates and assumptions made are based on histori-cal experience and other relevant factors which management consid-ers reasonable under the circumstances, but which are inherently un-certain and unpredictable.
the estimates and underlying assumptions are regularly assessed. Changes to accounting estimates are recognised in the reference pe-riod in which the change occurs and in future reference periods if the change affects the period in which it is made as well as subsequent reference periods.
Recoverable amount of the combined heat and power plant in Tønderin 2008, the district heating company tønder Fjernvarme filed a com-plaint with the Danish energy Regulatory Authority concerning the pricing of surplus heat from Hartmann's combined heat and power plant in tønder, Denmark. in a preliminary advisory opinion issued on 8 May 2013, the Danish energy Regulatory Authority ordered Hartmann to repay an excess payment of DKK 21 million. Hartmann disagrees with the preliminary opinion and has filed an additional submission with the energy Regulatory Authority. the energy Regulatory Authority has not yet made a decision in the matter. Once the energy Regulatory
Authority has made a decision, management will assess whether the matter should be brought before the Danish energy Board of Appeal. Not later than when a final decision has been made will Hartmann's management reassess the basis of operation and the valuation of the plant. the valuation and the profitability of the continued operation of the combined heat and power plant depend on the price level de-termined in the final decision. the carrying amount of property, plant and equipment at 30 September 2013 relating to the plant was DKK 25.8 million.
Other factorsthe group’s revenue and results of operations are subject to seasonal fluctuations.
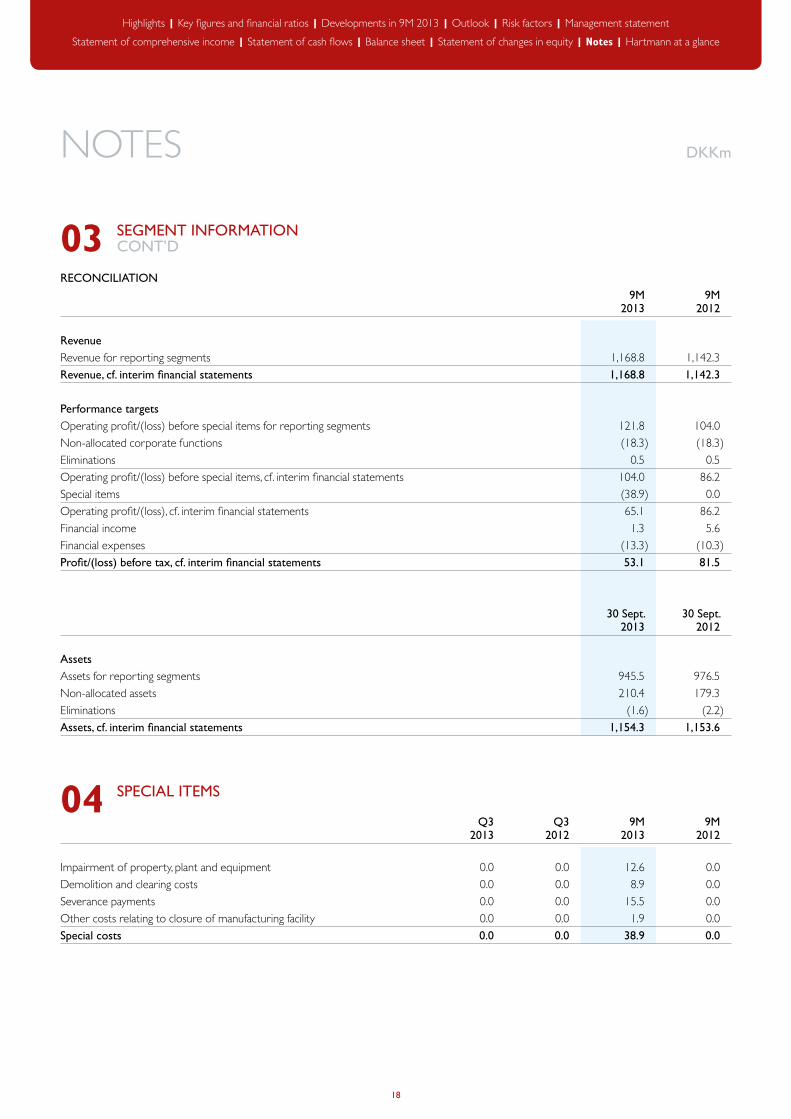
03 SeGMent InForMatIon
the reporting of business segments is in accordance with the internal reporting to the executive Board and the Board of Directors. the ex-ecutive Board and the Board of Directors constitute the chief operat-ing decision maker of Hartmann.
Hartmann’s activities are segmented on the basis of the geographical location of the reporting units.
No operating segments have been aggregated to represent the re-porting segments.
the internal management reporting complies with the group’s ac-counting policies. Business-related decisions on resource allocation and performance evaluation for each of the segments are made on the basis of the operating profits of the individual segments before special items. Decisions relating to financing and taxation are made on the basis of information on Hartmann as a whole and are not allocated to the reporting segments. the pricing of inter-segment transactions is made on an arm’s length basis.
Segment income and expenses as well as segment assets and liabilities comprise those items that in the internal management reporting are directly attributed to each individual segment and those items that are indirectly allocated to the individual segments on a reliable basis. Profits in associates, financial income and expenses, income taxes, investments in associates, tax assets and tax liabilities, and cash and cash equivalents and bank debt are not allocated to reporting segments.
Thereportingsegmentsare:
• europe comprises production and sales of moulded-fibre pack-aging. Products are produced at manufacturing facilities in europe (includingIsrael)andareprimarilysoldtoeggproducers,eggpackingbusinesses, retail chains and buyers of industrial packaging. the seg-ment also comprises sales of machinery for production of moulded-fibre packaging and the combined heat and power plant in tønder, Denmark.
• north America comprises production and sales of moulded- fibre packaging. Products are primarily produced at the North American manufacturing facility and sold to egg producers, egg packing busi-nesses and retail chains.
Hartmann Interim report 9M 2013
16
Highlights | Key figures and financial ratios | Developments in 9M 2013 | Outlook | Risk factors | Management statement
Statement of comprehensive income | Statement of cash flows | Balance sheet | Statement of changes in equity | Notes | Hartmann at a glance
Notes
DKKmNOteS
03 SeGMent InForMatIon cont’d
operatIonS 9M 2013 total north reporting europe america segments
Moulded fibre 862.9 219.1 1,082.0 Other revenue 86.8 0.0 86.8Revenue 949.7 219.1 1,168.8
Operating profit/(loss) before special items 72.5 49.3 121.8
other segment informationDepreciation, amortisation and impairment 48.9 10.1investments in intangible assets and property, plant and equipment 37.7 23.4Networkingcapital(NWC) 113.5 14.9invested capital 502.3 132.7Segment assets 776.0 169.5 945.5
operatIonS 9M 2012 total north reporting europe america segments
Moulded fibre 848.7 196.7 1,045.4Other revenue 96.9 0.0 96.9Revenue 945.6 196.7 1,142.3
Operating profit/(loss) before special items 62.6 41.4 104.0
other segment informationDepreciation, amortisation and impairment 50.6 9.2investments in intangible assets and property, plant and equipment 30.5 11.6Networkingcapital(NWC) 132.3 17.3invested capital 559.0 134.1Segment assets 805.0 171.5 976.5
Hartmann Interim report 9M 2013
17
Highlights | Key figures and financial ratios | Developments in 9M 2013 | Outlook | Risk factors | Management statement
Statement of comprehensive income | Statement of cash flows | Balance sheet | Statement of changes in equity | Notes | Hartmann at a glance
DKKmNOteS
03 SeGMent InForMatIon cont’d
reconcIlIatIon 9M 9M 2013 2012
revenue Revenue for reporting segments 1,168.8 1,142.3Revenue, cf. interim financial statements 1,168.8 1,142.3
performance targets Operatingprofit/(loss)beforespecialitemsforreportingsegments 121.8 104.0Non-allocatedcorporatefunctions (18.3) (18.3)eliminations 0.5 0.5Operatingprofit/(loss)beforespecialitems,cf.interimfinancialstatements 104.0 86.2Specialitems (38.9) 0.0Operatingprofit/(loss),cf.interimfinancialstatements 65.1 86.2Financial income 1.3 5.6Financialexpenses (13.3) (10.3)Profit/(loss) before tax, cf. interim financial statements 53.1 81.5
30 Sept. 30 Sept. 2013 2012
assets Assets for reporting segments 945.5 976.5Non-allocated assets 210.4 179.3Eliminations (1.6) (2.2)Assets, cf. interim financial statements 1,154.3 1,153.6
04 SpecIal IteMS
Q3 Q3 9M 9M 2013 2012 2013 2012
impairment of property, plant and equipment 0.0 0.0 12.6 0.0Demolition and clearing costs 0.0 0.0 8.9 0.0Severance payments 0.0 0.0 15.5 0.0Other costs relating to closure of manufacturing facility 0.0 0.0 1.9 0.0Special costs 0.0 0.0 38.9 0.0
Hartmann Interim report 9M 2013
18
Highlights | Key figures and financial ratios | Developments in 9M 2013 | Outlook | Risk factors | Management statement
Statement of comprehensive income | Statement of cash flows | Balance sheet | Statement of changes in equity | Notes | Hartmann at a glance
DKKm
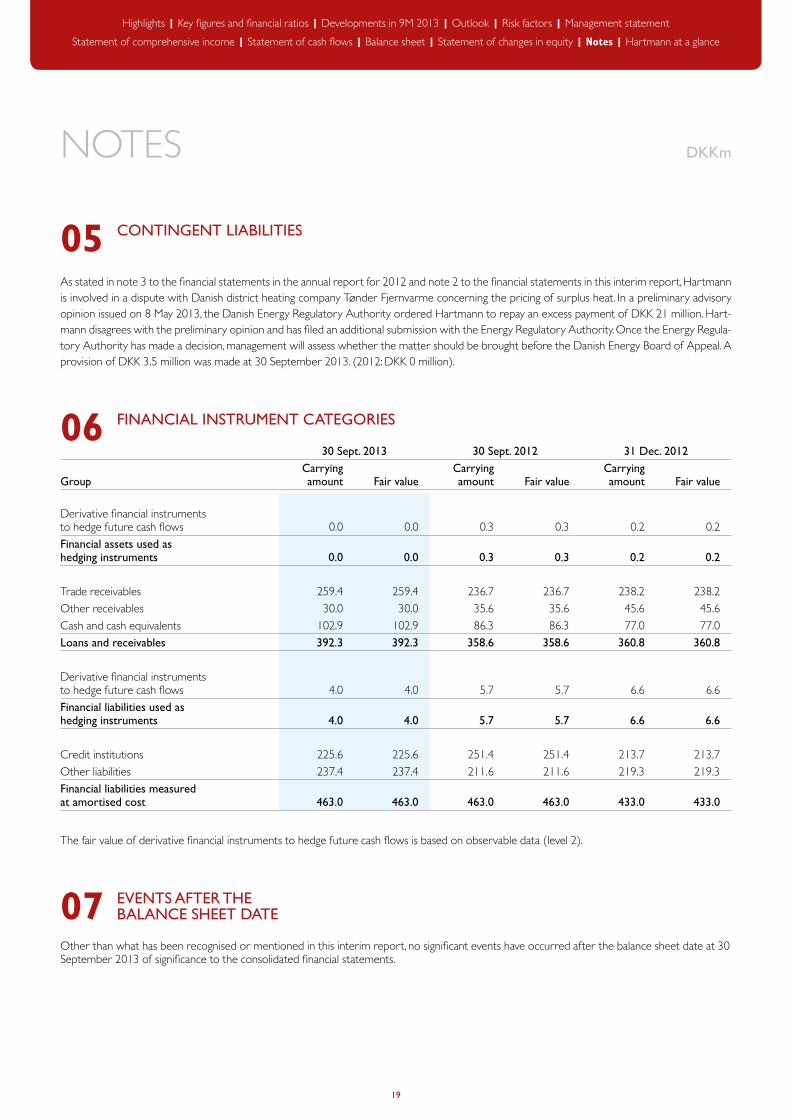
05 contInGent lIaBIlItIeS
As stated in note 3 to the financial statements in the annual report for 2012 and note 2 to the financial statements in this interim report, Hartmann is involved in a dispute with Danish district heating company tønder Fjernvarme concerning the pricing of surplus heat. in a preliminary advisory opinion issued on 8 May 2013, the Danish energy Regulatory Authority ordered Hartmann to repay an excess payment of DKK 21 million. Hart-mann disagrees with the preliminary opinion and has filed an additional submission with the energy Regulatory Authority. Once the energy Regula-tory Authority has made a decision, management will assess whether the matter should be brought before the Danish energy Board of Appeal. A provisionofDKK3.5millionwasmadeat30September2013.(2012:DKK0million).
06 FInancIal InStruMent cateGorIeS
30 Sept. 2013 30 Sept. 2012 31 Dec. 2012 carrying carrying carrying Group amount Fair value amount Fair value amount Fair value
Derivative financial instruments to hedge future cash flows 0.0 0.0 0.3 0.3 0.2 0.2Financial assets used as hedging instruments 0.0 0.0 0.3 0.3 0.2 0.2 trade receivables 259.4 259.4 236.7 236.7 238.2 238.2Other receivables 30.0 30.0 35.6 35.6 45.6 45.6Cash and cash equivalents 102.9 102.9 86.3 86.3 77.0 77.0Loans and receivables 392.3 392.3 358.6 358.6 360.8 360.8 Derivative financial instruments to hedge future cash flows 4.0 4.0 5.7 5.7 6.6 6.6Financial liabilities used as hedging instruments 4.0 4.0 5.7 5.7 6.6 6.6 Credit institutions 225.6 225.6 251.4 251.4 213.7 213.7Other liabilities 237.4 237.4 211.6 211.6 219.3 219.3Financial liabilities measured at amortised cost 463.0 463.0 463.0 463.0 433.0 433.0
Thefairvalueofderivativefinancialinstrumentstohedgefuturecashflowsisbasedonobservabledata(level2).
07 eventS aFter tHe Balance SHeet date
Other than what has been recognised or mentioned in this interim report, no significant events have occurred after the balance sheet date at 30 September 2013 of significance to the consolidated financial statements.
NOteS
Hartmann Interim report 9M 2013
19
Highlights | Key figures and financial ratios | Developments in 9M 2013 | Outlook | Risk factors | Management statement
Statement of comprehensive income | Statement of cash flows | Balance sheet | Statement of changes in equity | Notes | Hartmann at a glance
Brødrene Hartmann A/SØrnegårdsvej 18DK-2820 gentofte
Tel.: (+45)45970000Fax: (+45)45970001E-mail: [email protected]: hartmann-packaging.com
Companyreg.(CVR)no.63049611
this interim report has been prepared in accordance with the interna-tionalFinancialReportingStandardsasadoptedbytheEUandDanishdisclosure requirements for listed companies.
this interim report was released as company announcement no. 17/2013 through NASDAQ OMX Copenhagen A/S in Danish and english. in case of discrepancies between the two versions or in case of doubt, the Danish version will prevail.
All trademarks such as trade names and other names and designa-tions highlighted in this report are trademarks protected and owned by Brødrene Hartmann A/S.
© 2013 Brødrene Hartmann A/S
HARtMANN At A glANCe
Hartmann is one of the three largest producers of moulded-fibre egg packaging and one of the world’s largest producers of machinery for producing moulded-fibre packaging. Hartmann’s market position can be ascribed to its strong technology know-how and extensive experi-ence of production of moulded fibre since 1936.
SustainabilitySustainability and environmental considerations are integral elements of Hartmann’s business model and strategy. All of Hartmann’s products are based on recycled paper; a renewable, CO2-neutral and biodegrad-able resource. Hartmann works closely with its customers to support the need for sustainable products in the retail trade, and the company is the first to offer FSC-certified and CO2-neutral retail packaging.
marketsHartmann’s egg packaging is sold globally. the group’s principal markets consist of europe and North America, where Hartmann has strong market positions. Hartmann is the market leader in europe and has a small share of the North American market. Hartmann’s technology, including machinery and services, is also sold globally outside its key markets.
CustomersHartmann sells egg packaging to producers, distributors and to retail chains, which are increasingly seeking Hartmann’s expertise in the mar-keting of eggs. Hartmann’s technology and related services are sold to producers of moulded-fibre packaging. Hartman has more than 1,500 customers in 50 countries, and most of these customers have long-
standing relations with Hartmann. in 2012, Hartmann generated total revenue of DKK 1.5 billion.
organisationHartmann has about 1,500 employees, and its head office is situated in gentofte, Denmark. Production takes place at Hartmann’s own man-ufacturing facilities. Five of these facilities are located in europe, one is located in israel and one in Canada. the group has sales offices in twelve countries.
the Hartmann shareHartmann’s shares have been listed on NASDAQ OMX Copenhagen A/S since 1982. the company has one share class, and each share carries one vote. interested parties can receive financial reports and company announcements by subscribing to Hartmann’s news service at www.investor.hartmann-packaging.com.
FInancIal calendar 2014
24 February 2014 Deadline for submission of business to be transacted at the annual general meeting
6 March 2014 Annual report 2013
8 April 2014 Annual general meeting 2013
19 May 2014 interim report Q1 2014
21 August 2014 interim report Q2 2014
13 November 2014 interim report Q3 2014
Highlights | Key figures and financial ratios | Developments in 9M 2013 | Outlook | Risk factors | Management statement
Statement of comprehensive income | Statement of cash flows | Balance sheet | Statement of changes in equity | Notes | Hartmann at a glance
Hartmann at a glance