Embed Size (px)
Citation preview

INTERIM REPORT
2017

Contents
About this reportThis Interim Report of The New Zealand Refining Company Limited and its subsidiary, Independent Petroleum Laboratory Limited, is for the first six months ended 30 June 2017 and was approved for issue by the Board of Directors on 23 August 2017.
The Company trades as Refining NZ and so references to this name relate to the Company as a legal entity.
For and on behalf of the Board:
S C ALLEN DIRECTOR
M TUME DIRECTOR
1 Group Performance Summary
2 Chairman’s Report
4 2017 Revised Profit Matrix
5 Condensed Consolidated Interim Financial Statements
24 Corporate Directory
Group Performance SummaryFOR THE SIX MONTHS ENDED 30 JUNE 2017 (UNAUDITED)
30 JUNE 2017 30 JUNE 2016
OPERATING RESULTS
Operating revenue ($000) 190,567 155,261
Net profit before income tax ($000) 49,086 14,372
Net profit after income tax ($000) 35,193 11,610
SHARE INDICATORS
Net tangible assets per security* $2.47 $2.33
Earnings per share (annualised) 22 cents 7 cents
NUMBERS
Shareholders 5,195 4,944
Employees 377 381
* Net tangible assets per security is a non-GAAP performance measure. It is calculated as ‘net assets’ disclosed in the balance sheet, minus intangible assets, and plus or minus the value of derivative instruments, divided by the number of shares on issue at the end of the reporting period.
Processing Fee Revenue• Revenue earned from processing fees is the main component of Operating Revenue as disclosed in note 1 of the Condensed
Consolidated Interim Financial Statements.
• Processing Fees earned for the six months ended 30 June 2017 were 31% higher than the previous corresponding financial period.
• The Company’s processing fee revenue is impacted by the refiners’ margin (difference between product and feedstock prices in the international markets), volume of feedstock processed and the exchange rate.
The key variables for the six months ended 30 June can be summarised as follows:
30 JUNE 2017 30 JUNE 2016
KEY VARIABLES:
Intake (‘000 Barrels) 20,055 21,134
Gross Refining Margin (USD/Barrel) 7.70 5.25
Average USD Exchange rate 0.71 0.67
GROU
P PERFORMAN
CE SUM
MARY
REFININ
G N
Z INTERIM
REPORT 2017
1

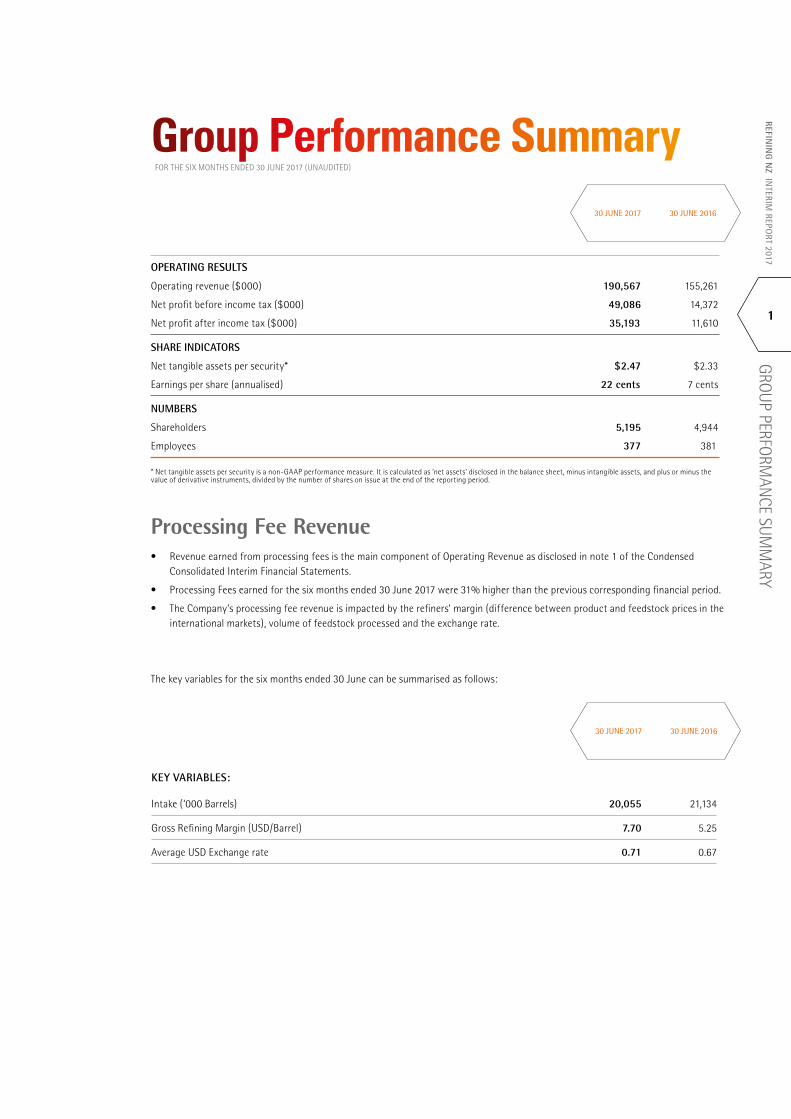
Refining NZ has reported an interim Net Profit after Tax (NPAT) of $35.2 million for the six months ending 30 June 2017 (1H 2016: $11.6 million), a robust start to the year underpinned by healthy refining margins and a strong operational performance.
The Gross Refinery Margin remained healthy across the first half of the year and at USD 7.70 per barrel (1H 2016: USD 5.25 per barrel), was well ahead of the Company’s historical average margin of USD 4-6 per barrel. Our average uplift over the Singapore Complex Margin was also improved at USD 4.59 per barrel (1H 2016: USD 1.83 per barrel, which reflected the hydrocracker shutdown).
Margins have seen ongoing support from buoyant international and domestic demand for oil products. The Company took full advantage of this margin environment through the safe and reliable running of the refinery, pursuing attractive margin growth projects, and excellent cost control - all of which generated a strong first half net profit.
Chairman’s Report Interim Report 2017
2
RE
FIN
ING
NZ
INTE
RIM
REP
ORT
201
7CH
AIRM
AN’S
REP
ORT
*Tier 1 Process Safety Event. An unplanned or uncontrolled release of any material from a process resulting in a lost time incident or fatality, fire, or explosion causing $25,000 (or greater) cost to the Company; a release of material greater than the threshold quantities given in Table 1 of API 754 in any one hour period; an officially declared community evacuation or community shelter-in-place.
It is worth noting that the oil companies combined shareholding in the Company now amounts to 43%, with the majority of Company shares on issue now held by many smaller shareholders and institutional investors.
BOARD CHANGES In March, Director Andrew Warrell resigned and was replaced by Riccardo Cavallo. In June Matthew Elliott resigned as a Director. His role was recently replaced by Deborah Boffa who brings extensive experience from a 20 year career with BP spanning engineering, fuels supply, strategy and retail management roles. Thank you to Andrew and Matthew for their respective contributions and we welcome Riccardo and Deborah to the Refining NZ Board.
DIVIDEND The Company’s Directors have resolved to pay a fully imputed interim dividend of six cents per share to be paid on 28 September 2017 with a record date of 14 September 2017 (please refer note 4 of the Condensed Consolidated Interim Financial Statements).
The 2017 profit matrix has been re-issued to reflect the Company’s end-of-year profit and borrowing expectations for a number of unit margin and exchange rate scenarios.
FUTURE OUTLOOKThe hard work our team has put into this result ensures the Company is well placed to deliver on its business strategy. Over the remainder of the year we will continue to operate safely and reliably, meet our customers’ need for quality product and pursue margin improvement via key projects with attractive payback periods.
OPERATIONAL PERFORMANCE AND SAFETYThe Company remains focused on lifting its Health and Safety performance through the execution of the 2017 Health and Safety Action plan. Our process safety performance was notably improved by having achieved twelve months without a Tier I process safety event*.
A strong and reliable operational performance was further evidenced by the improved availability of our processing units, which is critical to the refinery continuing to meet customer demand for quality fuel products. The Refinery to Auckland Pipeline contributed a standout performance on the back of continued Auckland growth with first half throughput volumes increasing to 10.5 million barrels (1H 2016: 9.8 million barrels), the highest on record for any half year period.
STRATEGIC GROWTHThe Company’s strategic initiatives that will grow revenue and contribute to the ongoing competitiveness of the refining business, are progressing to plan.
Jet fuel demand growth at Auckland airport is a key driver for the Company’s investment in a three phase project to upgrade capacity on our multi-product pipeline. Phase one of that investment is complete with the second due by the end of the year. Each phase will lift pipeline capacity by around 5%.
First Gas has boosted capacity on the gas pipeline to the refinery with the completion of a new compressor station at Henderson. This has significantly improved access to natural gas and allows for more product to be produced for customers.
The Company is pressing on with its proposal to bring bigger crude shipments to Marsden Point. A resource consent has recently been lodged with the Northland Regional Council and consultation with tangata whenua and key stakeholders is continuing.
BP SHAREHOLDING In March, as part of a global portfolio review, BP sold shares in the Company amounting to 11.09% of Refining NZ’s issued share capital. BP remains a significant shareholder with an equity stake of 10.1%, while the processing arrangements with BP remain in place.
SIMON ALLEN CHAIRMAN
REFININ
G N
Z INTERIM
REPORT 2017
3
CHAIRM
AN’S REPORT
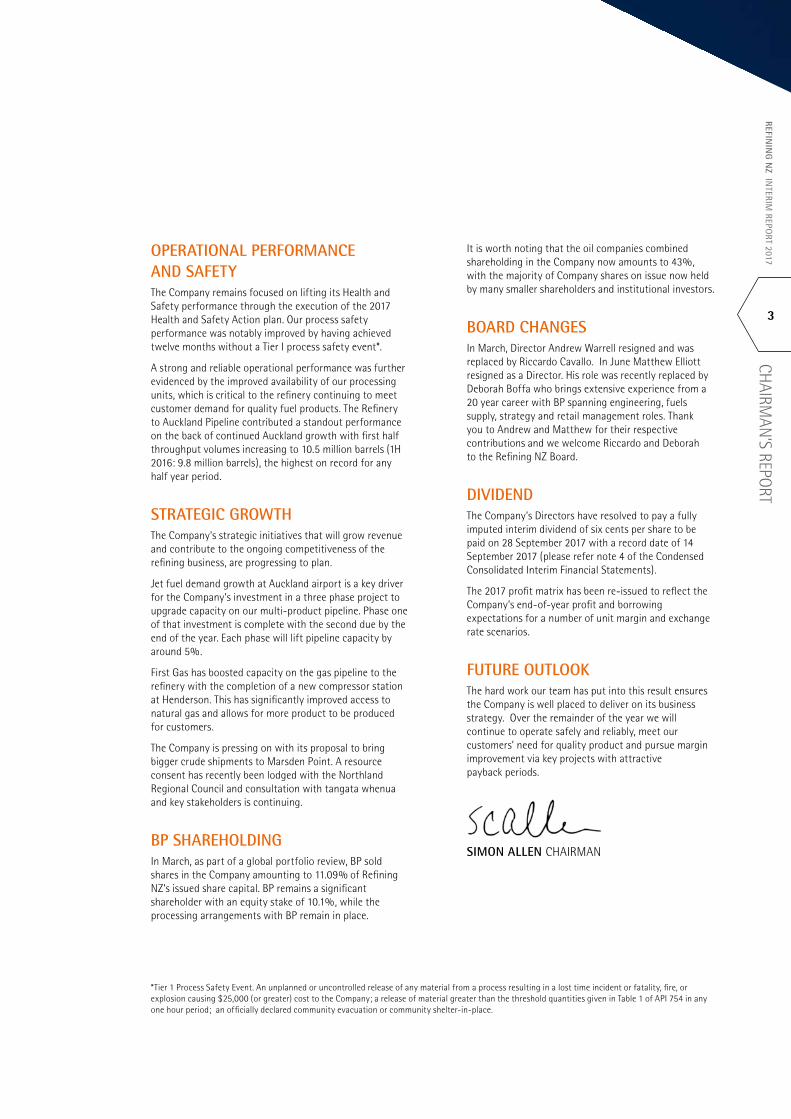
2017 Revised Profit Matrix
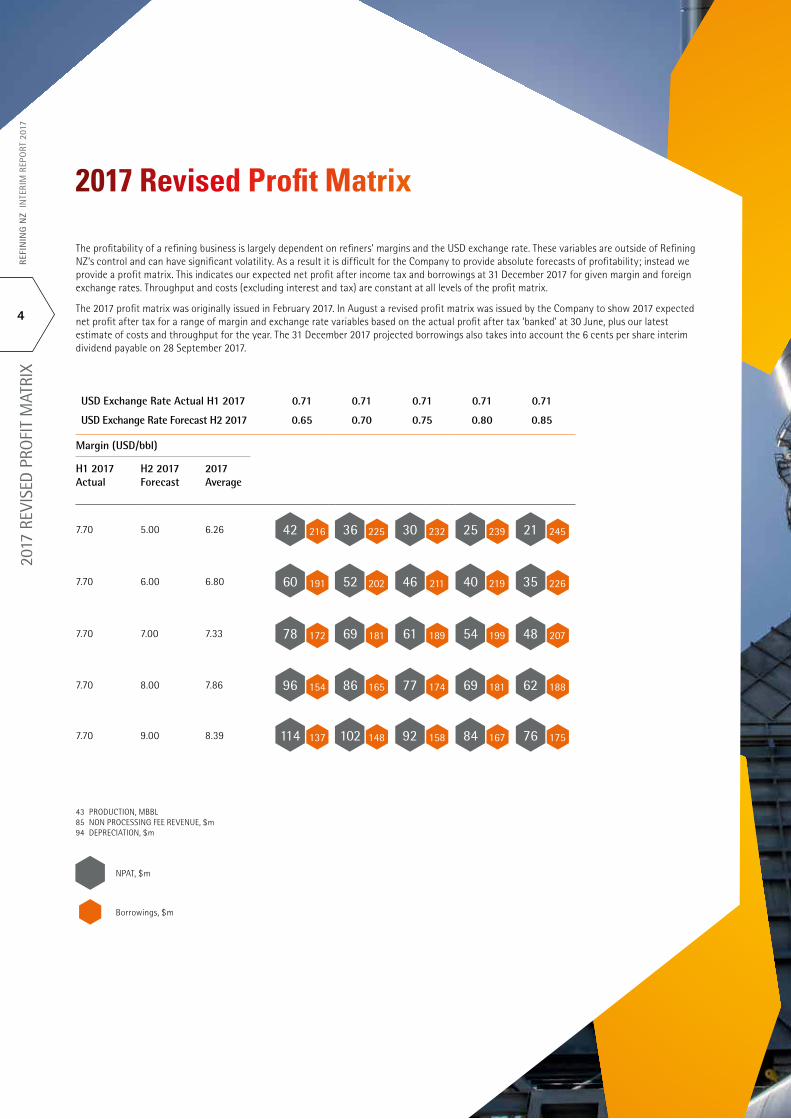
NPAT, $m
Borrowings, $m
The profitability of a refining business is largely dependent on refiners’ margins and the USD exchange rate. These variables are outside of Refining NZ’s control and can have significant volatility. As a result it is difficult for the Company to provide absolute forecasts of profitability; instead we provide a profit matrix. This indicates our expected net profit after income tax and borrowings at 31 December 2017 for given margin and foreign exchange rates. Throughput and costs (excluding interest and tax) are constant at all levels of the profit matrix.
The 2017 profit matrix was originally issued in February 2017. In August a revised profit matrix was issued by the Company to show 2017 expected net profit after tax for a range of margin and exchange rate variables based on the actual profit after tax ‘banked’ at 30 June, plus our latest estimate of costs and throughput for the year. The 31 December 2017 projected borrowings also takes into account the 6 cents per share interim dividend payable on 28 September 2017.
USD Exchange Rate Actual H1 2017 0.71 0.71 0.71 0.71 0.71
USD Exchange Rate Forecast H2 2017 0.65 0.70 0.75 0.80 0.85
Margin (USD/bbl)
H1 2017 Actual
H2 2017 Forecast
2017 Average
7.70 5.00 6.26 42 216 36 225 30 232 25 239 21 245
7.70 6.00 6.80 60 191 52 202 46 211 40 219 35 226
7.70 7.00 7.33 78 172 69 181 61 189 54 199 48 207
7.70 8.00 7.86 96 154 86 165 77 174 69 181 62 188
7.70 9.00 8.39 114 137 102 148 92 158 84 167 76 175
43 PRODUCTION, MBBL85 NON PROCESSING FEE REVENUE, $m94 DEPRECIATION, $m
4
RE
FIN
ING
NZ
INTE
RIM
REP
ORT
201
720
17 R
EVIS
ED P
ROFI
T M
ATRI
X
Condensed Consolidated Interim Financial Statements Contents 6 Condensed Consolidated
Interim Income Statement The income earned and operating
expenditure incurred by the Refining NZ Group during the six month period
7 Condensed Consolidated Interim Statement of Comprehensive Income
Items of income and operating expense not recognised in the income statement and hence taken to reserves in equity
8 Condensed Consolidated Interim Balance Sheet
A summary of the Refining NZ Group assets and liabilities at the end of the six month period
10 Condensed Consolidated Interim Statement of Changes in Equity
Components that make up the capital and reserves of the Refining NZ Group and the changes in each component during the six month period
12 Condensed Consolidated Interim Statement of Cash Flows
Cash generated and used by the Refining NZ Group
13 Basis of Preparation
14 Performance 14 Operating revenue
14 Segment information
16 Related parties
17 Debt and Equity 17 Dividends
18 Loans and borrowings
19 Operating Assets and Liabilities 19 Property, plant and equipment, and intangibles
19 Capital commitments
20 Restoration provision
20 Cash and cash equivalents
21 Trade and other payables
21 Employee benefits
22 Financial Risk Management 22 Financial instruments
23 Other 23 Employee share-based payments
23 Contingent liabilities
23 Events after balance date
24 Corporate Directory
REFININ
G N
Z INTERIM
REPORT 2017
5
CON
DEN
SED CO
NSO
LIDATED IN
TERIM FIN
ANCIAL STATEM
ENTS CO
NTEN
TS
6
REFI
NIN
G N
Z IN
TERI
M R
EPO
RT 2
017
CON
DEN
SED
CO
NSO
LIDA
TED
INTE
RIM
INCO
ME
STAT
EMEN
T
GROUP GROUP 30 JUNE 30 JUNE NOTE 2017 2016 $000 $000
INCOME
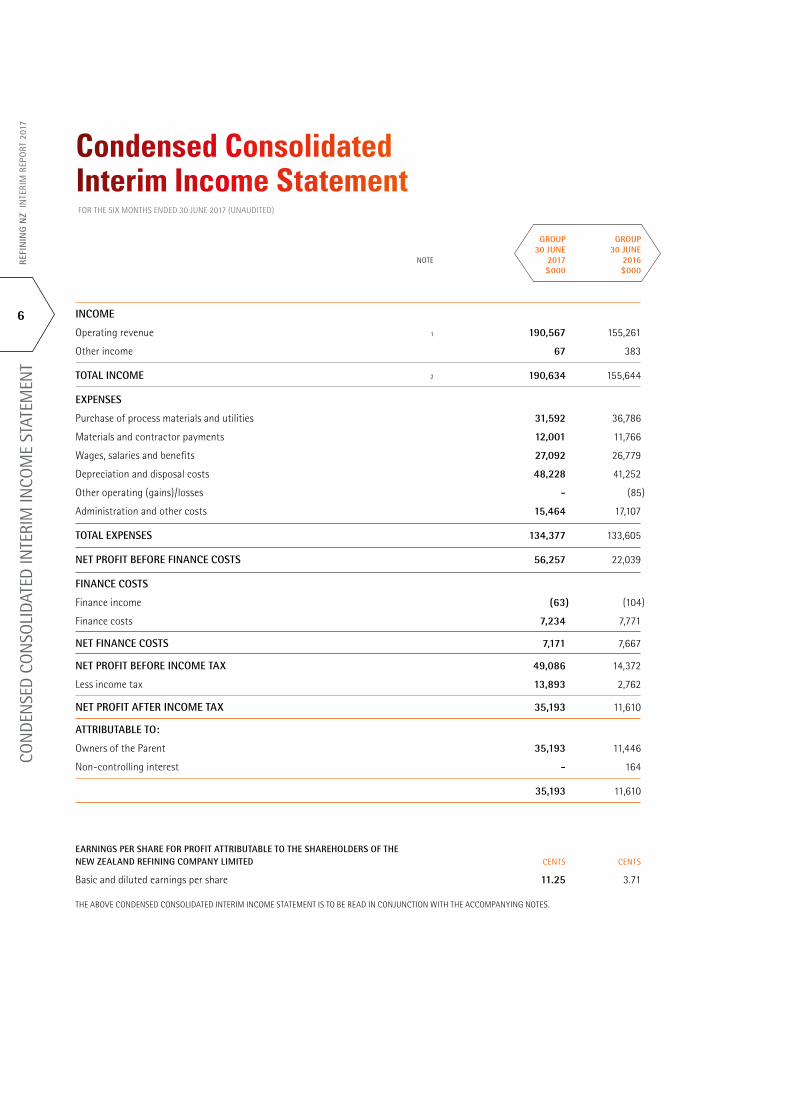
Operating revenue 1 190,567 155,261
Other income 67 383
TOTAL INCOME 2 190,634 155,644
EXPENSES
Purchase of process materials and utilities 31,592 36,786
Materials and contractor payments 12,001 11,766
Wages, salaries and benefits 27,092 26,779
Depreciation and disposal costs 48,228 41,252
Other operating (gains)/losses - (85)
Administration and other costs 15,464 17,107
TOTAL EXPENSES 134,377 133,605
NET PROFIT BEFORE FINANCE COSTS 56,257 22,039
FINANCE COSTS
Finance income (63) (104)
Finance costs 7,234 7,771
NET FINANCE COSTS 7,171 7,667
NET PROFIT BEFORE INCOME TAX 49,086 14,372
Less income tax 13,893 2,762
NET PROFIT AFTER INCOME TAX 35,193 11,610
ATTRIBUTABLE TO:
Owners of the Parent 35,193 11,446
Non-controlling interest - 164
35,193 11,610
EARNINGS PER SHARE FOR PROFIT ATTRIBUTABLE TO THE SHAREHOLDERS OF THE NEW ZEALAND REFINING COMPANY LIMITED CENTS CENTS
Basic and diluted earnings per share 11.25 3.71
THE ABOVE CONDENSED CONSOLIDATED INTERIM INCOME STATEMENT IS TO BE READ IN CONJUNCTION WITH THE ACCOMPANYING NOTES.
Condensed Consolidated Interim Income StatementFOR THE SIX MONTHS ENDED 30 JUNE 2017 (UNAUDITED)
GROUP GROUP 30 JUNE 30 JUNE NOTE 2017 2016 $000 $000
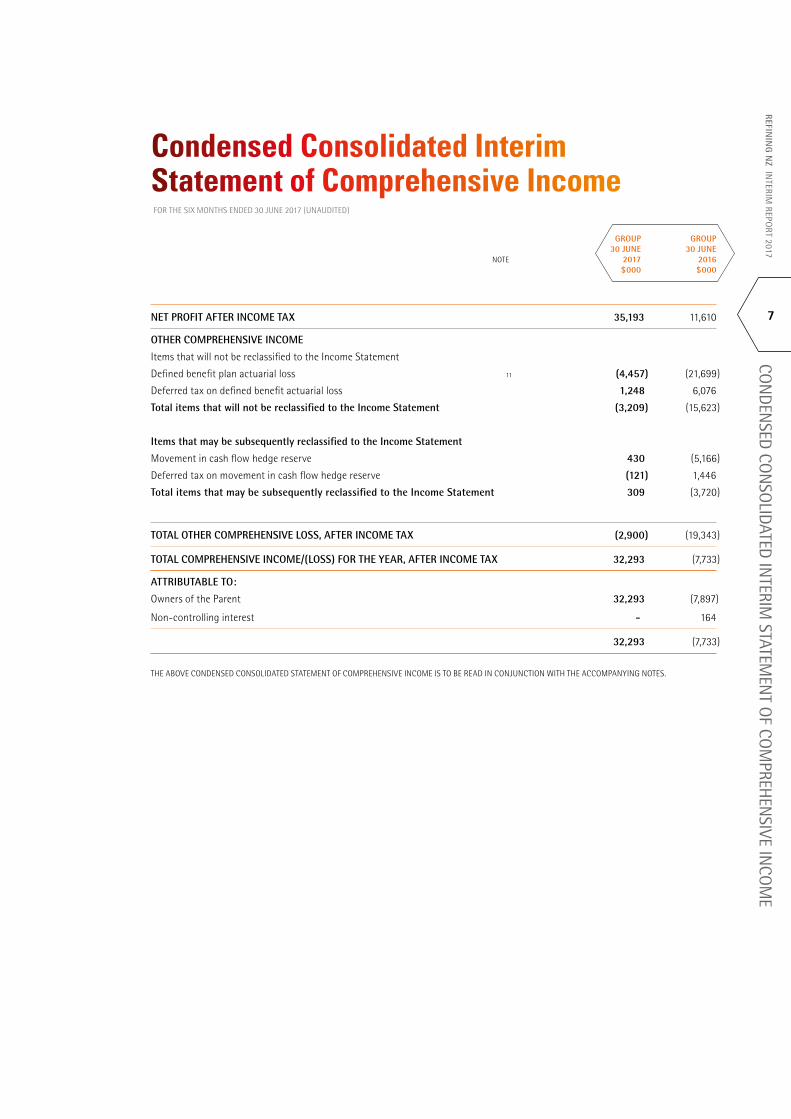
NET PROFIT AFTER INCOME TAX 35,193 11,610
OTHER COMPREHENSIVE INCOME
Items that will not be reclassified to the Income Statement
Defined benefit plan actuarial loss 11 (4,457) (21,699)
Deferred tax on defined benefit actuarial loss 1,248 6,076
Total items that will not be reclassified to the Income Statement (3,209) (15,623)
Items that may be subsequently reclassified to the Income Statement
Movement in cash flow hedge reserve 430 (5,166)
Deferred tax on movement in cash flow hedge reserve (121) 1,446
Total items that may be subsequently reclassified to the Income Statement 309 (3,720)
TOTAL OTHER COMPREHENSIVE LOSS, AFTER INCOME TAX (2,900) (19,343)
TOTAL COMPREHENSIVE INCOME/(LOSS) FOR THE YEAR, AFTER INCOME TAX 32,293 (7,733)
ATTRIBUTABLE TO:
Owners of the Parent 32,293 (7,897)
Non-controlling interest - 164
32,293 (7,733)
THE ABOVE CONDENSED CONSOLIDATED STATEMENT OF COMPREHENSIVE INCOME IS TO BE READ IN CONJUNCTION WITH THE ACCOMPANYING NOTES.
Condensed Consolidated Interim Statement of Comprehensive IncomeFOR THE SIX MONTHS ENDED 30 JUNE 2017 (UNAUDITED)
7
CON
DEN
SED CO
NSO
LIDATED IN
TERIM STATEM
ENT O
F COM
PREHEN
SIVE INCO
ME
REFININ
G N
Z INTERIM
REPORT 2017
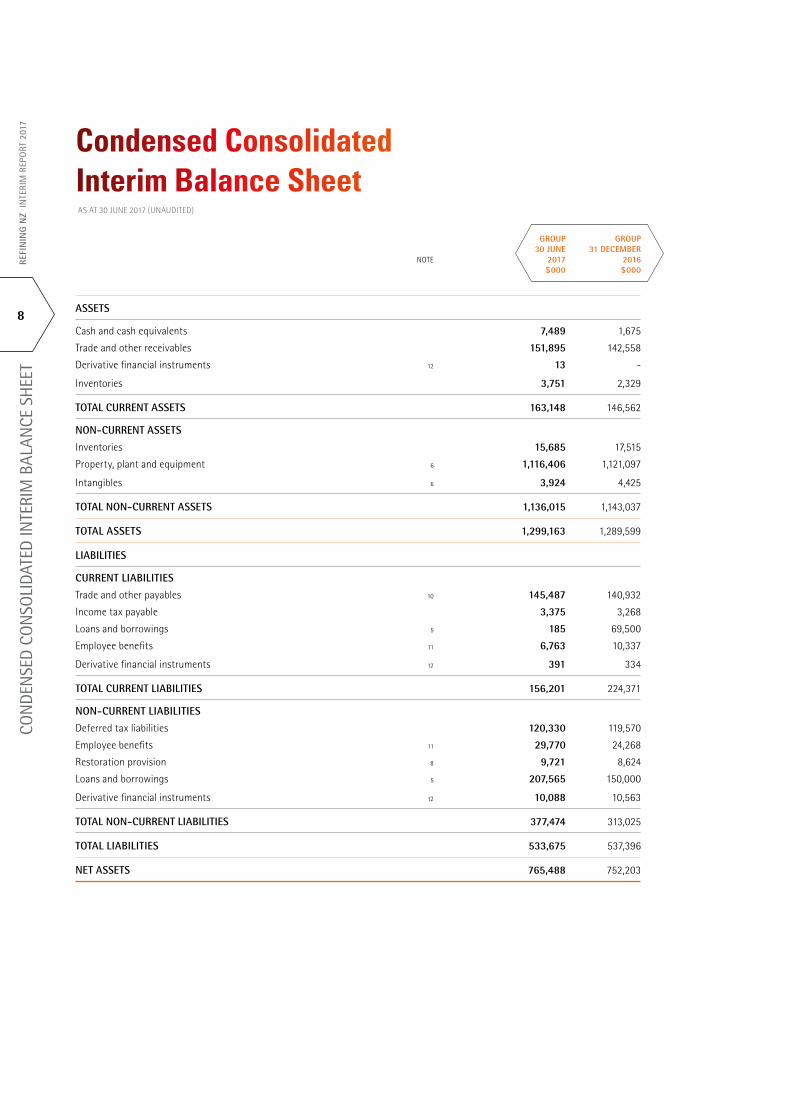
Condensed Consolidated Interim Balance SheetAS AT 30 JUNE 2017 (UNAUDITED)
GROUP GROUP 30 JUNE 31 DECEMBER NOTE 2017 2016 $000 $000
ASSETS
Cash and cash equivalents 7,489 1,675
Trade and other receivables 151,895 142,558
Derivative financial instruments 12 13 -
Inventories 3,751 2,329
TOTAL CURRENT ASSETS 163,148 146,562
NON-CURRENT ASSETS
Inventories 15,685 17,515
Property, plant and equipment 6 1,116,406 1,121,097
Intangibles 6 3,924 4,425
TOTAL NON-CURRENT ASSETS 1,136,015 1,143,037
TOTAL ASSETS 1,299,163 1,289,599
LIABILITIES
CURRENT LIABILITIES
Trade and other payables 10 145,487 140,932
Income tax payable 3,375 3,268
Loans and borrowings 5 185 69,500
Employee benefits 11 6,763 10,337
Derivative financial instruments 12 391 334
TOTAL CURRENT LIABILITIES 156,201 224,371
NON-CURRENT LIABILITIES
Deferred tax liabilities 120,330 119,570
Employee benefits 11 29,770 24,268
Restoration provision 8 9,721 8,624
Loans and borrowings 5 207,565 150,000
Derivative financial instruments 12 10,088 10,563
TOTAL NON-CURRENT LIABILITIES 377,474 313,025
TOTAL LIABILITIES 533,675 537,396
NET ASSETS 765,488 752,203
REFI
NIN
G N
Z IN
TERI
M R
EPO
RT 2
017
8
CON
DEN
SED
CO
NSO
LIDA
TED
INTE
RIM
BAL
ANCE
SH
EET
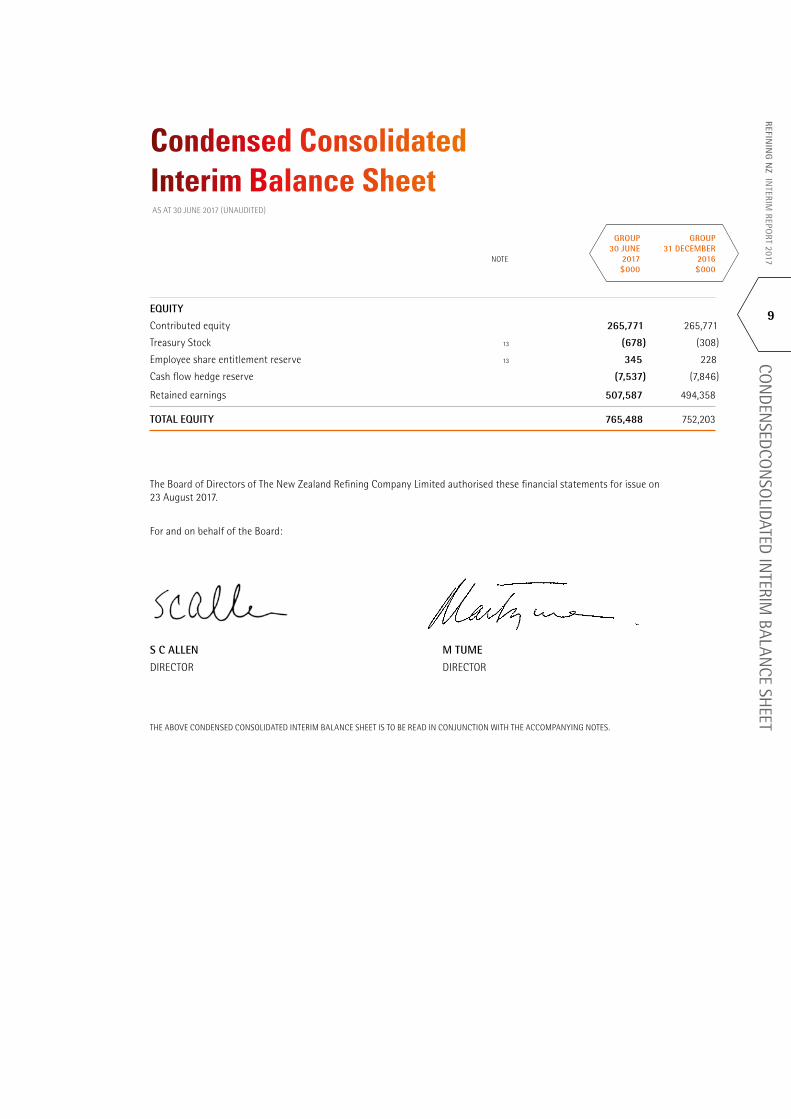
Condensed Consolidated Interim Balance SheetAS AT 30 JUNE 2017 (UNAUDITED)
The Board of Directors of The New Zealand Refining Company Limited authorised these financial statements for issue on 23 August 2017.
For and on behalf of the Board:
S C ALLEN M TUME
DIRECTOR DIRECTOR
THE ABOVE CONDENSED CONSOLIDATED INTERIM BALANCE SHEET IS TO BE READ IN CONJUNCTION WITH THE ACCOMPANYING NOTES.
GROUP GROUP 30 JUNE 31 DECEMBER NOTE 2017 2016 $000 $000
EQUITY
Contributed equity 265,771 265,771
Treasury Stock 13 (678) (308)
Employee share entitlement reserve 13 345 228
Cash flow hedge reserve (7,537) (7,846)
Retained earnings 507,587 494,358
TOTAL EQUITY 765,488 752,203
REFININ
G N
Z INTERIM
REPORT 2017
9
CON
DEN
SEDCO
NSO
LIDATED IN
TERIM BALAN
CE SHEET
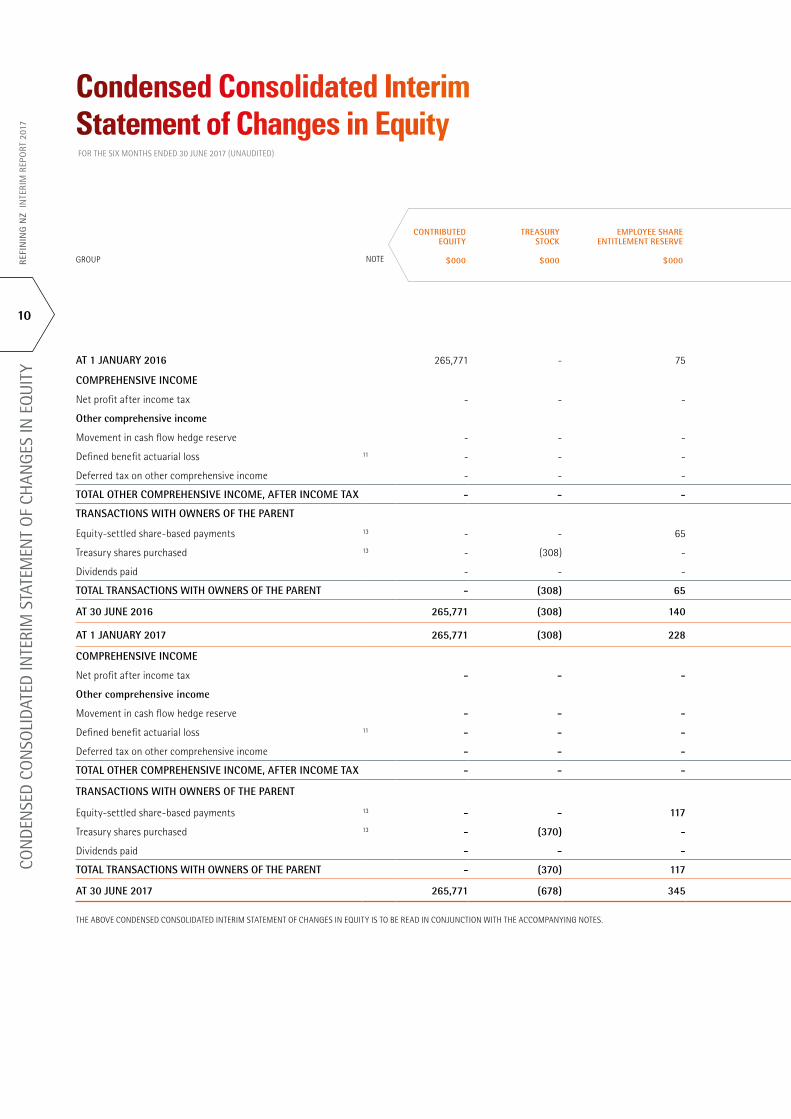
GROUP
NOTE
CONTRIBUTED EQUITY
$000
TREASURY STOCK
$000
EMPLOYEE SHARE ENTITLEMENT RESERVE
$000
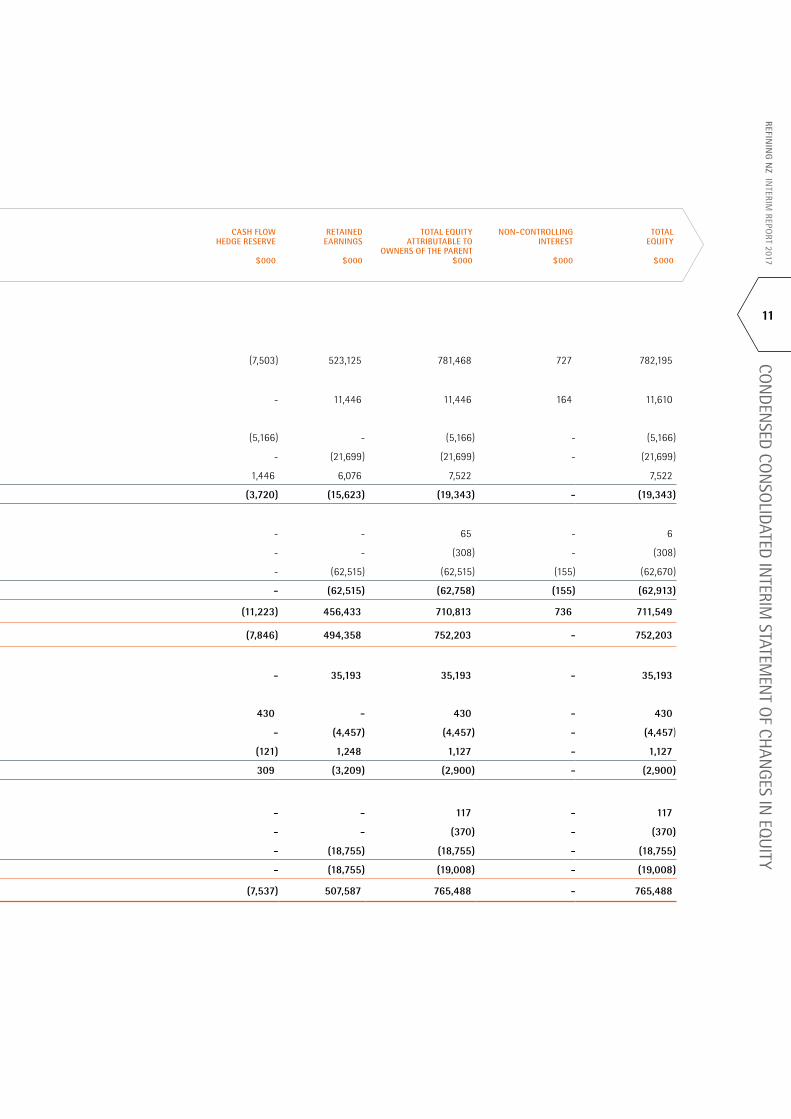
CASH FLOW HEDGE RESERVE
$000
RETAINED EARNINGS
$000
TOTAL EQUITY ATTRIBUTABLE TO
OWNERS OF THE PARENT $000
NON-CONTROLLING INTEREST
$000
TOTAL EQUITY
$000
AT 1 JANUARY 2016 265,771 - 75 (7,503) 523,125 781,468 727 782,195
COMPREHENSIVE INCOME
Net profit after income tax - - - - 11,446 11,446 164 11,610
Other comprehensive income
Movement in cash flow hedge reserve - - - (5,166) - (5,166) - (5,166)
Defined benefit actuarial loss 11 - - - - (21,699) (21,699) - (21,699)
Deferred tax on other comprehensive income - - - 1,446 6,076 7,522 7,522
TOTAL OTHER COMPREHENSIVE INCOME, AFTER INCOME TAX - - - (3,720) (15,623) (19,343) - (19,343)
TRANSACTIONS WITH OWNERS OF THE PARENT
Equity-settled share-based payments 13 - - 65 - - 65 - 6
Treasury shares purchased 13 - (308) - - - (308) - (308)
Dividends paid - - - - (62,515) (62,515) (155) (62,670)
TOTAL TRANSACTIONS WITH OWNERS OF THE PARENT - (308) 65 - (62,515) (62,758) (155) (62,913)
AT 30 JUNE 2016 265,771 (308) 140 (11,223) 456,433 710,813 736 711,549
AT 1 JANUARY 2017 265,771 (308) 228 (7,846) 494,358 752,203 - 752,203
COMPREHENSIVE INCOME
Net profit after income tax - - - - 35,193 35,193 - 35,193
Other comprehensive income
Movement in cash flow hedge reserve - - - 430 - 430 - 430
Defined benefit actuarial loss 11 - - - - (4,457) (4,457) - (4,457)
Deferred tax on other comprehensive income - - - (121) 1,248 1,127 - 1,127
TOTAL OTHER COMPREHENSIVE INCOME, AFTER INCOME TAX - - - 309 (3,209) (2,900) - (2,900)
TRANSACTIONS WITH OWNERS OF THE PARENT
Equity-settled share-based payments 13 - - 117 - - 117 - 117
Treasury shares purchased 13 - (370) - - - (370) - (370)
Dividends paid - - - - (18,755) (18,755) - (18,755)
TOTAL TRANSACTIONS WITH OWNERS OF THE PARENT - (370) 117 - (18,755) (19,008) - (19,008)
AT 30 JUNE 2017 265,771 (678) 345 (7,537) 507,587 765,488 - 765,488
THE ABOVE CONDENSED CONSOLIDATED INTERIM STATEMENT OF CHANGES IN EQUITY IS TO BE READ IN CONJUNCTION WITH THE ACCOMPANYING NOTES.
Condensed Consolidated Interim Statement of Changes in EquityFOR THE SIX MONTHS ENDED 30 JUNE 2017 (UNAUDITED)
REFI
NIN
G N
Z IN
TERI
M R
EPO
RT 2
017
10
CO
ND
ENSE
D C
ON
SOLI
DATE
D IN
TERI
M S
TATE
MEN
T O
F CH
ANG
ES IN
EQ
UIT
Y
NOTE
CONTRIBUTED EQUITY
$000
TREASURY STOCK
$000
EMPLOYEE SHARE ENTITLEMENT RESERVE
$000
CASH FLOW HEDGE RESERVE
$000
RETAINED EARNINGS
$000
TOTAL EQUITY ATTRIBUTABLE TO
OWNERS OF THE PARENT $000
NON-CONTROLLING INTEREST
$000
TOTAL EQUITY
$000
AT 1 JANUARY 2016 265,771 - 75 (7,503) 523,125 781,468 727 782,195
COMPREHENSIVE INCOME
Net profit after income tax - - - - 11,446 11,446 164 11,610
Other comprehensive income
Movement in cash flow hedge reserve - - - (5,166) - (5,166) - (5,166)
Defined benefit actuarial loss 11 - - - - (21,699) (21,699) - (21,699)
Deferred tax on other comprehensive income - - - 1,446 6,076 7,522 7,522
TOTAL OTHER COMPREHENSIVE INCOME, AFTER INCOME TAX - - - (3,720) (15,623) (19,343) - (19,343)
TRANSACTIONS WITH OWNERS OF THE PARENT
Equity-settled share-based payments 13 - - 65 - - 65 - 6
Treasury shares purchased 13 - (308) - - - (308) - (308)
Dividends paid - - - - (62,515) (62,515) (155) (62,670)
TOTAL TRANSACTIONS WITH OWNERS OF THE PARENT - (308) 65 - (62,515) (62,758) (155) (62,913)
AT 30 JUNE 2016 265,771 (308) 140 (11,223) 456,433 710,813 736 711,549
AT 1 JANUARY 2017 265,771 (308) 228 (7,846) 494,358 752,203 - 752,203
COMPREHENSIVE INCOME
Net profit after income tax - - - - 35,193 35,193 - 35,193
Other comprehensive income
Movement in cash flow hedge reserve - - - 430 - 430 - 430
Defined benefit actuarial loss 11 - - - - (4,457) (4,457) - (4,457)
Deferred tax on other comprehensive income - - - (121) 1,248 1,127 - 1,127
TOTAL OTHER COMPREHENSIVE INCOME, AFTER INCOME TAX - - - 309 (3,209) (2,900) - (2,900)
TRANSACTIONS WITH OWNERS OF THE PARENT
Equity-settled share-based payments 13 - - 117 - - 117 - 117
Treasury shares purchased 13 - (370) - - - (370) - (370)
Dividends paid - - - - (18,755) (18,755) - (18,755)
TOTAL TRANSACTIONS WITH OWNERS OF THE PARENT - (370) 117 - (18,755) (19,008) - (19,008)
AT 30 JUNE 2017 265,771 (678) 345 (7,537) 507,587 765,488 - 765,488
THE ABOVE CONDENSED CONSOLIDATED INTERIM STATEMENT OF CHANGES IN EQUITY IS TO BE READ IN CONJUNCTION WITH THE ACCOMPANYING NOTES.
REFININ
G N
Z INTERIM
REPORT 2017
11
CON
DEN
SED CO
NSO
LIDATED IN
TERIM STATEM
ENT O
F CHAN
GES IN
EQU
ITY
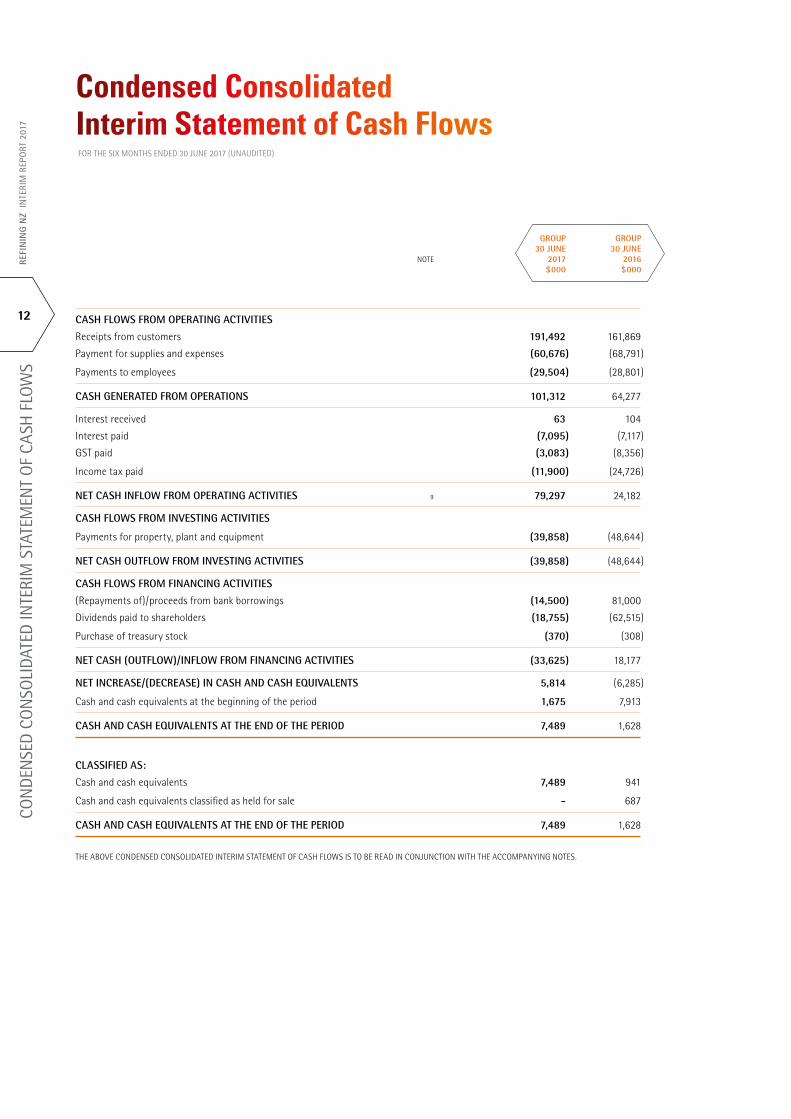
CASH FLOWS FROM OPERATING ACTIVITIES
Receipts from customers 191,492 161,869
Payment for supplies and expenses (60,676) (68,791)
Payments to employees (29,504) (28,801)
CASH GENERATED FROM OPERATIONS 101,312 64,277
Interest received 63 104
Interest paid (7,095) (7,117)
GST paid (3,083) (8,356)
Income tax paid (11,900) (24,726)
NET CASH INFLOW FROM OPERATING ACTIVITIES 9 79,297 24,182
CASH FLOWS FROM INVESTING ACTIVITIES
Payments for property, plant and equipment (39,858) (48,644)
NET CASH OUTFLOW FROM INVESTING ACTIVITIES (39,858) (48,644)
CASH FLOWS FROM FINANCING ACTIVITIES
(Repayments of)/proceeds from bank borrowings (14,500) 81,000
Dividends paid to shareholders (18,755) (62,515)
Purchase of treasury stock (370) (308)
NET CASH (OUTFLOW)/INFLOW FROM FINANCING ACTIVITIES (33,625) 18,177
NET INCREASE/(DECREASE) IN CASH AND CASH EQUIVALENTS 5,814 (6,285)
Cash and cash equivalents at the beginning of the period 1,675 7,913
CASH AND CASH EQUIVALENTS AT THE END OF THE PERIOD 7,489 1,628
CLASSIFIED AS:
Cash and cash equivalents 7,489 941
Cash and cash equivalents classified as held for sale - 687
CASH AND CASH EQUIVALENTS AT THE END OF THE PERIOD 7,489 1,628
THE ABOVE CONDENSED CONSOLIDATED INTERIM STATEMENT OF CASH FLOWS IS TO BE READ IN CONJUNCTION WITH THE ACCOMPANYING NOTES.
Condensed Consolidated Interim Statement of Cash FlowsFOR THE SIX MONTHS ENDED 30 JUNE 2017 (UNAUDITED)
GROUP GROUP 30 JUNE 30 JUNE NOTE 2017 2016 $000 $000
REFI
NIN
G N
Z IN
TERI
M R
EPO
RT 2
017
12
CON
DEN
SED
CO
NSO
LIDA
TED
INTE
RIM
STA
TEM
ENT
OF
CASH
FLO
WS
Basis of preparation
These condensed consolidated interim financial statements as at and for the six months ended 30 June 2017 comply with New Zealand Generally Accepted Accounting Practice (‘NZ GAAP’) and have been prepared in accordance with New Zealand Equivalents to International Accounting Standard (‘NZ IAS‘) 34: Interim Financial Reporting and International Accounting Standard (‘IAS‘) 34: Interim Financial Reporting and, consequently, do not include all the information required for full financial statements. The condensed consolidated interim financial statements should be read in conjunction with the annual consolidated financial statements for the year ended 31 December 2016.
Entities reporting
The condensed consolidated interim financial statements for the ‘Group‘ are for the economic entity comprising The New Zealand Refining Company Limited (‘Parent’, ‘Company’ or ‘Refining NZ’) and its subsidiary, Independent Petroleum Laboratory Limited. No separate Parent results are disclosed in these condensed consolidated interim financial statements.
The Parent and the Group are designated as for profit entities for financial reporting purposes.
Statutory base
The condensed consolidated interim financial statements of the Group have been prepared in accordance with the requirements of the NZX Main Board Listing Rules. Refining NZ is registered under the Companies Act 1993 and is a FMC Reporting Entity under Part 7 of the Financial Markets Conduct Act 2013.
Accounting policies
The accounting policies used in the preparation of these condensed consolidated interim financial statements are consistent with those used in the previously published condensed consolidated interim financial statements as at and for the six months ended 30 June 2016 and the audited consolidated financial statements as at and for the year ended 31 December 2016.
Use of judgements and estimates
The preparation of the condensed consolidated interim financial statements requires the use of certain critical accounting estimates. It also requires the directors to exercise their judgement in the process of applying the Group’s accounting policies. Estimates and judgements are continually evaluated and are based on historical experience and other factors, including expectations of future events that are believed to be reasonable under the circumstances.
In the process of applying the Group’s accounting policies, the following areas involve judgements and assumptions that can significantly affect the amounts recognised in the condensed consolidated interim financial statements:
• Recoverability of the capital work in progress, and useful lives of property, plant and equipment – refer to note 6;
• Restoration provision – refer to note 8;
• Employee benefits (including defined benefit pension plan obligation) – refer to note 11;
• Inventory obsolescence provision - no significant changes to these estimates have been made in relation to inventory obsolescence provision in these condensed consolidated interim financial statements.
Basis of preparationFOR THE SIX MONTHS ENDED 30 JUNE 2017 (UNAUDITED)
REFININ
G N
Z INTERIM
REPORT 2017
13
BASIS O
F PREPARATION
Notes to the Condensed Consolidated Interim Financial StatementsFOR THE SIX MONTHS ENDED 30 JUNE 2017 (UNAUDITED)
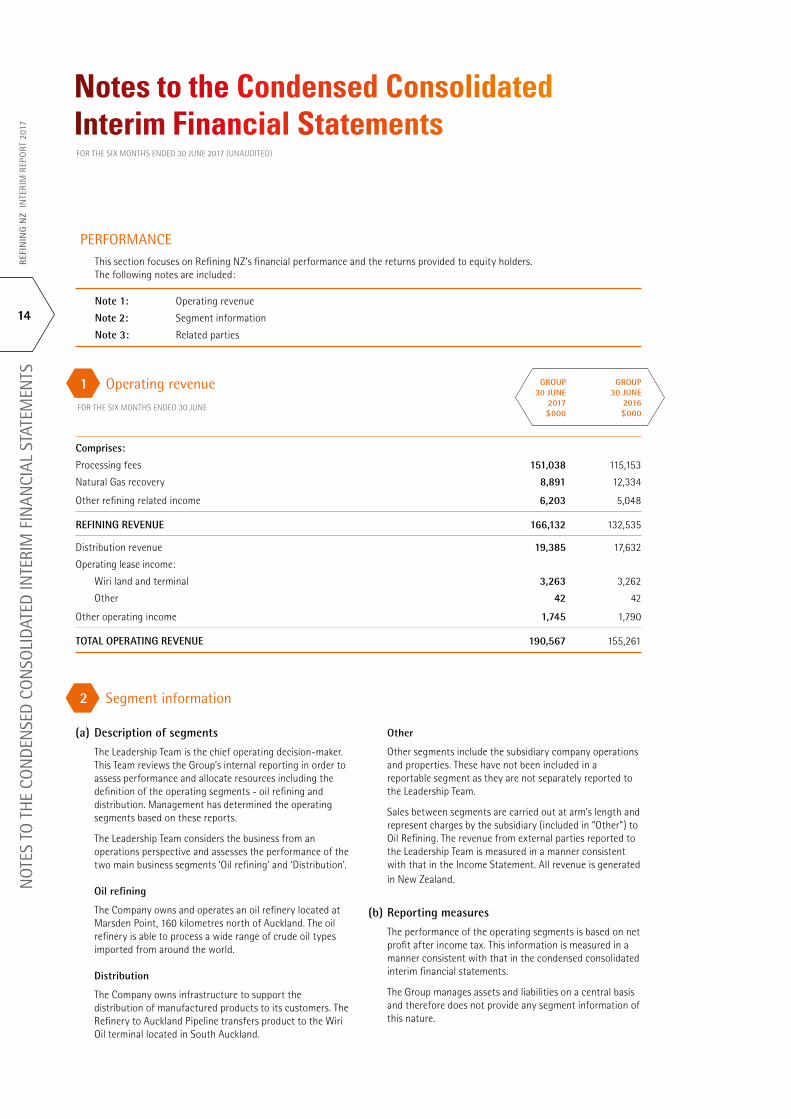
2 Segment information
(a) Description of segments
The Leadership Team is the chief operating decision-maker. This Team reviews the Group’s internal reporting in order to assess performance and allocate resources including the definition of the operating segments - oil refining and distribution. Management has determined the operating segments based on these reports.
The Leadership Team considers the business from an operations perspective and assesses the performance of the two main business segments ‘Oil refining’ and ‘Distribution’.
Oil refining
The Company owns and operates an oil refinery located at Marsden Point, 160 kilometres north of Auckland. The oil refinery is able to process a wide range of crude oil types imported from around the world.
Distribution
The Company owns infrastructure to support the distribution of manufactured products to its customers. The Refinery to Auckland Pipeline transfers product to the Wiri Oil terminal located in South Auckland.
Other
Other segments include the subsidiary company operations and properties. These have not been included in a reportable segment as they are not separately reported to the Leadership Team.
Sales between segments are carried out at arm’s length and represent charges by the subsidiary (included in “Other”) to Oil Refining. The revenue from external parties reported to the Leadership Team is measured in a manner consistent with that in the Income Statement. All revenue is generated in New Zealand.
(b) Reporting measures
The performance of the operating segments is based on net profit after income tax. This information is measured in a manner consistent with that in the condensed consolidated interim financial statements.
The Group manages assets and liabilities on a central basis and therefore does not provide any segment information of this nature.
PERFORMANCEThis section focuses on Refining NZ’s financial performance and the returns provided to equity holders. The following notes are included:
Note 1: Operating revenue
Note 2: Segment information
Note 3: Related parties
GROUP GROUP 30 JUNE 30 JUNE 2017 2016 $000 $000
1 Operating revenue FOR THE SIX MONTHS ENDED 30 JUNE
Comprises:
Processing fees 151,038 115,153
Natural Gas recovery 8,891 12,334
Other refining related income 6,203 5,048
REFINING REVENUE 166,132 132,535
Distribution revenue 19,385 17,632
Operating lease income:
Wiri land and terminal 3,263 3,262
Other 42 42
Other operating income 1,745 1,790
TOTAL OPERATING REVENUE 190,567 155,261
REFI
NIN
G N
Z IN
TERI
M R
EPO
RT 2
017
14
N
OTE
S TO
TH
E CO
ND
ENSE
D C
ON
SOLI
DATE
D IN
TERI
M F
INAN
CIAL
STA
TEM
ENTS
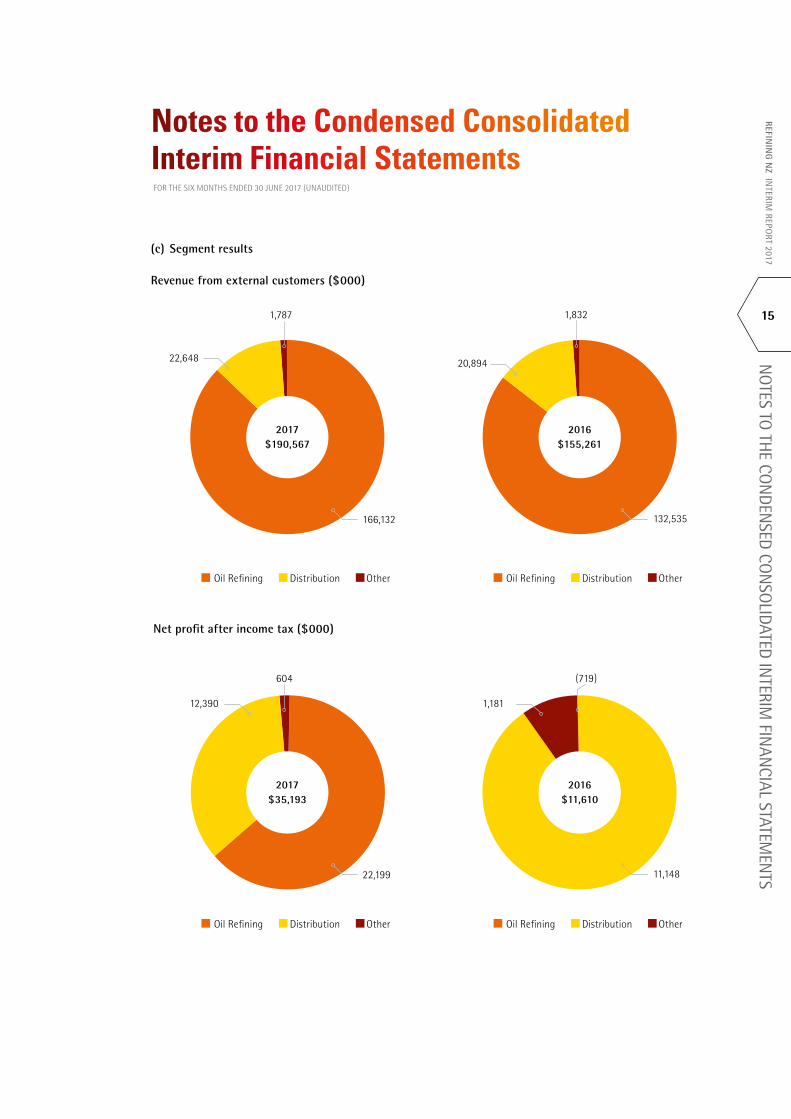
166,132 132,535
1,787 1,832
22,648 20,894
2017 $190,567
2016 $155,261
22,199 11,148
12,390 1,181
604 (719)
2017 $35,193
2016 $11,610
Notes to the Condensed Consolidated Interim Financial StatementsFOR THE SIX MONTHS ENDED 30 JUNE 2017 (UNAUDITED)
(c) Segment results
Revenue from external customers ($000)
Net profit after income tax ($000)
Oil Refining Distribution Other Oil Refining Distribution Other
Oil Refining Distribution Other Oil Refining Distribution Other
REFININ
G N
Z INTERIM
REPORT 2017
15
NO
TES TO TH
E CON
DEN
SED CO
NSO
LIDATED IN
TERIM FIN
ANCIAL STATEM
ENTS
Notes to the Condensed Consolidated Interim Financial StatementsFOR THE SIX MONTHS ENDED 30 JUNE 2017 (UNAUDITED)
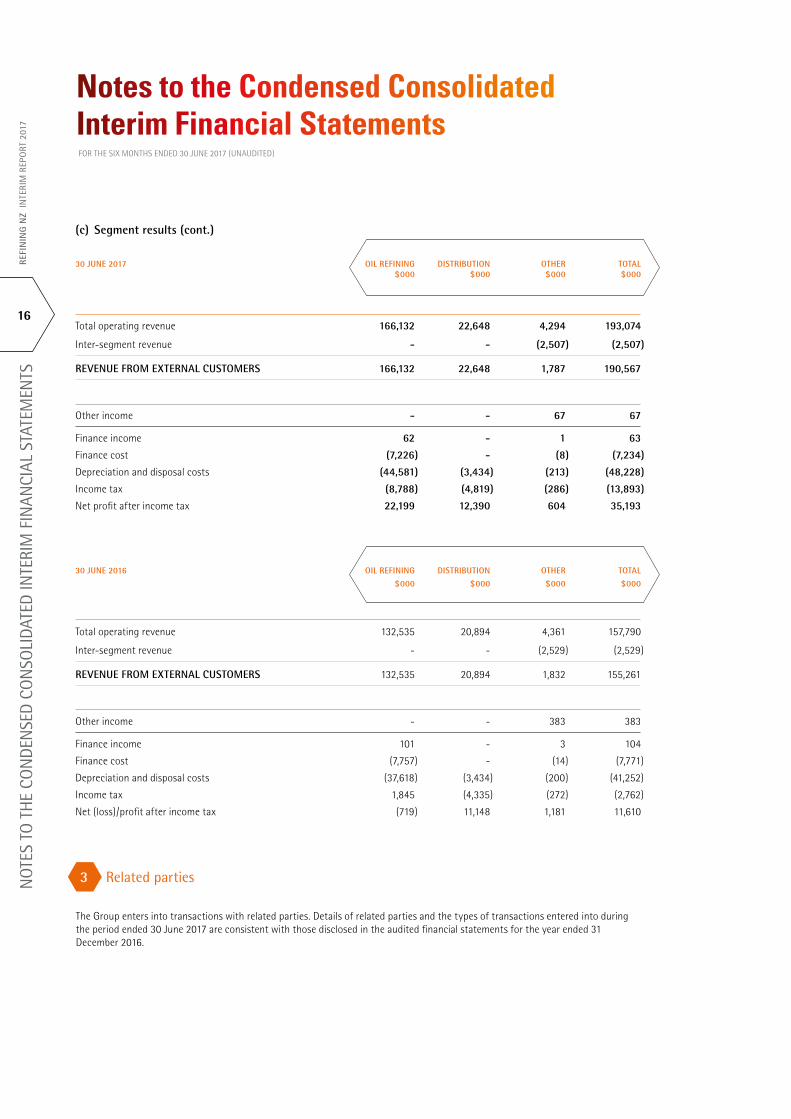
(c) Segment results (cont.)
30 JUNE 2017 OIL REFINING DISTRIBUTION OTHER TOTAL $000 $000 $000 $000
Total operating revenue 166,132 22,648 4,294 193,074
Inter-segment revenue - - (2,507) (2,507)
REVENUE FROM EXTERNAL CUSTOMERS 166,132 22,648 1,787 190,567
Other income - - 67 67
Finance income 62 - 1 63
Finance cost (7,226) - (8) (7,234)
Depreciation and disposal costs (44,581) (3,434) (213) (48,228)
Income tax (8,788) (4,819) (286) (13,893)
Net profit after income tax 22,199 12,390 604 35,193
30 JUNE 2016 OIL REFINING DISTRIBUTION OTHER TOTAL
$000 $000 $000 $000
Total operating revenue 132,535 20,894 4,361 157,790
Inter-segment revenue - - (2,529) (2,529)
REVENUE FROM EXTERNAL CUSTOMERS 132,535 20,894 1,832 155,261
Other income - - 383 383
Finance income 101 - 3 104
Finance cost (7,757) - (14) (7,771)
Depreciation and disposal costs (37,618) (3,434) (200) (41,252)
Income tax 1,845 (4,335) (272) (2,762)
Net (loss)/profit after income tax (719) 11,148 1,181 11,610
3 Related parties
The Group enters into transactions with related parties. Details of related parties and the types of transactions entered into during the period ended 30 June 2017 are consistent with those disclosed in the audited financial statements for the year ended 31 December 2016.
REFI
NIN
G N
Z IN
TERI
M R
EPO
RT 2
017
16
NO
TES
TO T
HE
CON
DEN
SED
CO
NSO
LIDA
TED
INTE
RIM
FIN
ANCI
AL S
TATE
MEN
TS
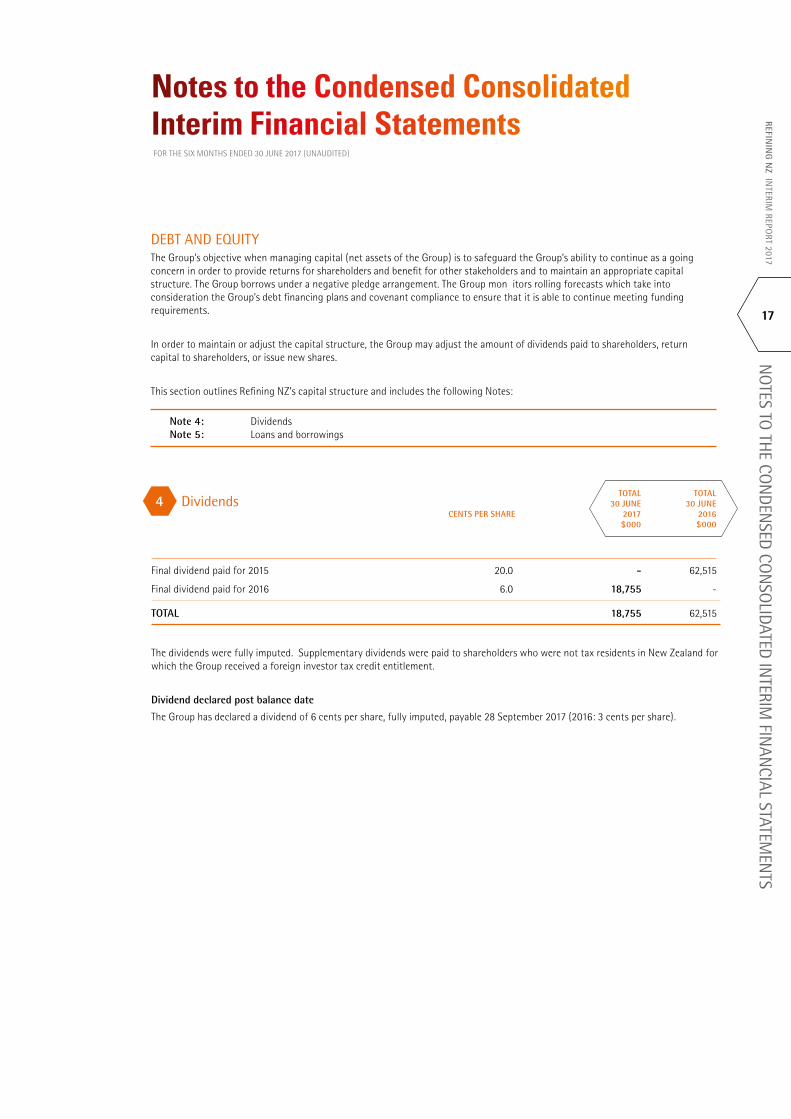
DEBT AND EQUITYThe Group’s objective when managing capital (net assets of the Group) is to safeguard the Group’s ability to continue as a going concern in order to provide returns for shareholders and benefit for other stakeholders and to maintain an appropriate capital structure. The Group borrows under a negative pledge arrangement. The Group mon itors rolling forecasts which take into consideration the Group’s debt financing plans and covenant compliance to ensure that it is able to continue meeting funding requirements.
In order to maintain or adjust the capital structure, the Group may adjust the amount of dividends paid to shareholders, return capital to shareholders, or issue new shares.
This section outlines Refining NZ’s capital structure and includes the following Notes:
Note 4: DividendsNote 5: Loans and borrowings
Notes to the Condensed Consolidated Interim Financial StatementsFOR THE SIX MONTHS ENDED 30 JUNE 2017 (UNAUDITED)
4 Dividends
Final dividend paid for 2015 20.0 - 62,515
Final dividend paid for 2016 6.0 18,755 -
TOTAL 18,755 62,515
The dividends were fully imputed. Supplementary dividends were paid to shareholders who were not tax residents in New Zealand for which the Group received a foreign investor tax credit entitlement.
Dividend declared post balance date
The Group has declared a dividend of 6 cents per share, fully imputed, payable 28 September 2017 (2016: 3 cents per share).
TOTAL TOTAL 30 JUNE 30 JUNE CENTS PER SHARE 2017 2016 $000 $000
REFININ
G N
Z INTERIM
REPORT 2017
17
NO
TES TO TH
E CON
DEN
SED CO
NSO
LIDATED IN
TERIM FIN
ANCIAL STATEM
ENTS
Notes to the Condensed Consolidated Interim Financial StatementsFOR THE SIX MONTHS ENDED 30 JUNE 2017 (UNAUDITED)
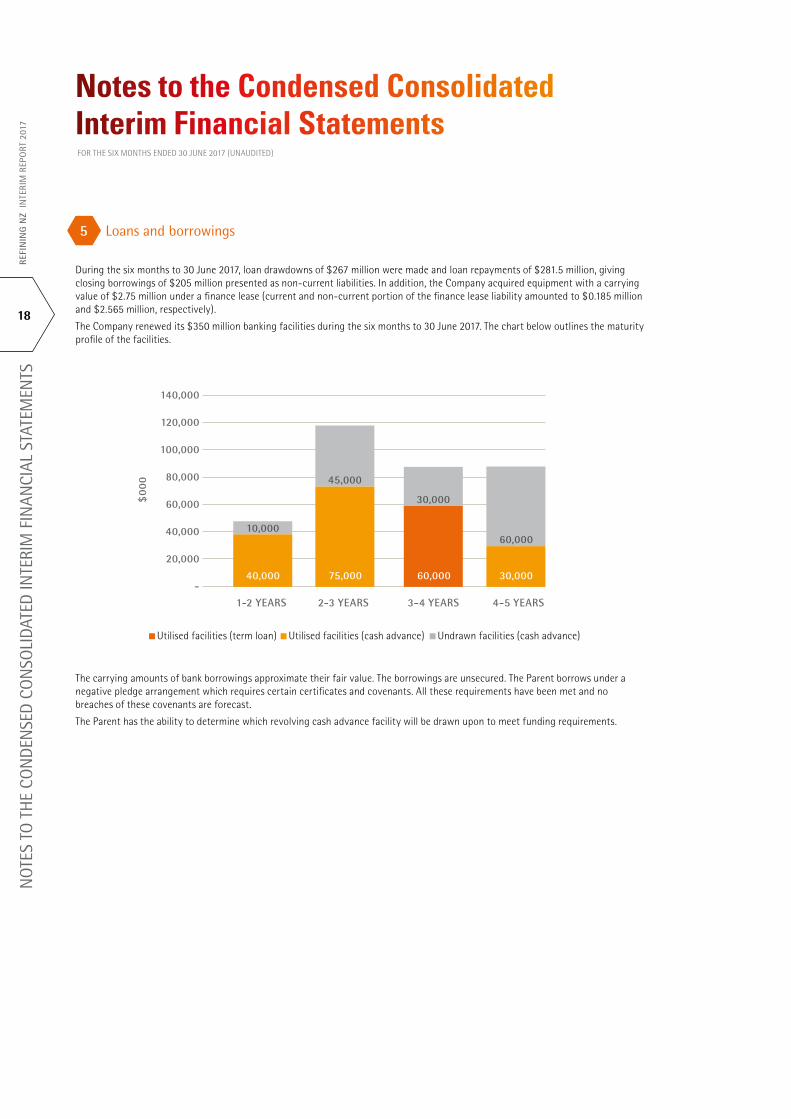
5 Loans and borrowings
During the six months to 30 June 2017, loan drawdowns of $267 million were made and loan repayments of $281.5 million, giving closing borrowings of $205 million presented as non-current liabilities. In addition, the Company acquired equipment with a carrying value of $2.75 million under a finance lease (current and non-current portion of the finance lease liability amounted to $0.185 million and $2.565 million, respectively).
The Company renewed its $350 million banking facilities during the six months to 30 June 2017. The chart below outlines the maturity profile of the facilities.
The carrying amounts of bank borrowings approximate their fair value. The borrowings are unsecured. The Parent borrows under a negative pledge arrangement which requires certain certificates and covenants. All these requirements have been met and no breaches of these covenants are forecast.
The Parent has the ability to determine which revolving cash advance facility will be drawn upon to meet funding requirements.
Utilised facilities (term loan) Utilised facilities (cash advance) Undrawn facilities (cash advance)
140,000
120,000
100,000
80,000
60,000
40,000
20,000
-
$00
0
1-2 YEARS 2-3 YEARS 3-4 YEARS 4-5 YEARS
40,000
10,000
60,000
30,000
75,000
45,000
30,000
60,000
REFI
NIN
G N
Z IN
TERI
M R
EPO
RT 2
017
18
NO
TES
TO T
HE
CON
DEN
SED
CO
NSO
LIDA
TED
INTE
RIM
FIN
ANCI
AL S
TATE
MEN
TS
7 Capital commitments
GROUP GROUP 30 JUNE 30 JUNE 2017 2016 $000 $000
GROUP GROUP 30 JUNE 30 JUNE 2017 2016 $000 $000
Notes to the Condensed Consolidated Interim Financial StatementsFOR THE SIX MONTHS ENDED 30 JUNE 2017 (UNAUDITED)
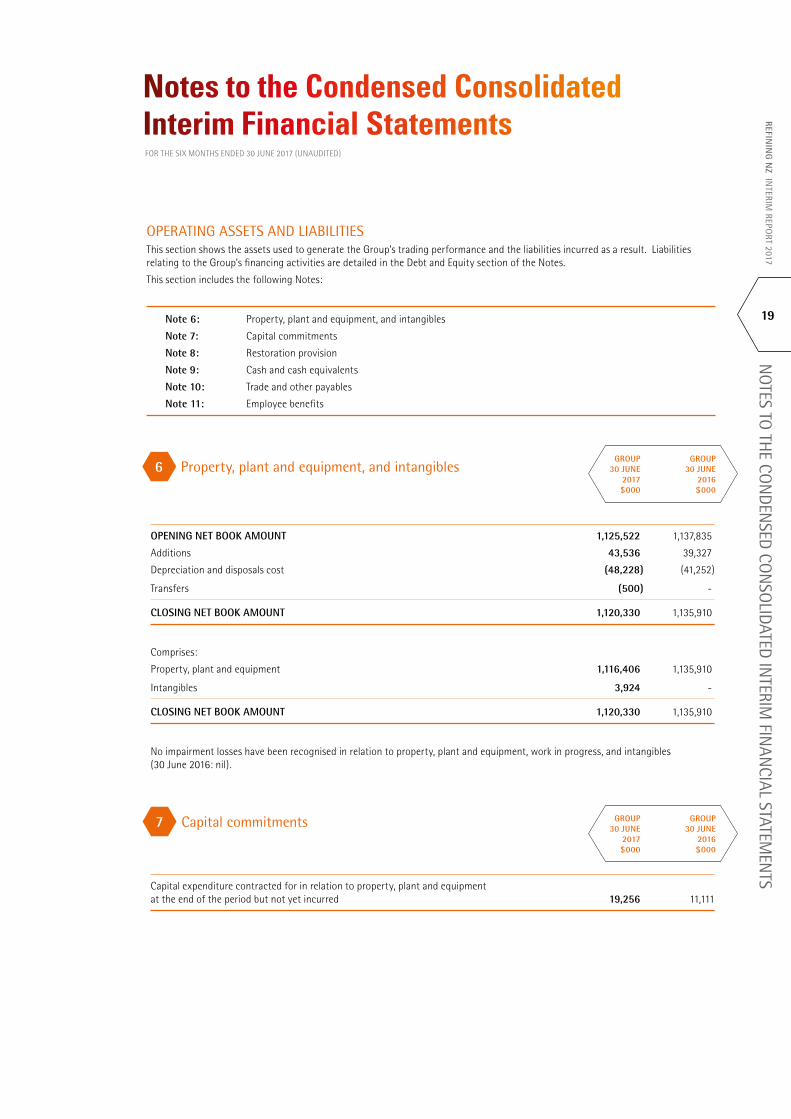
6 Property, plant and equipment, and intangibles
OPENING NET BOOK AMOUNT 1,125,522 1,137,835
Additions 43,536 39,327
Depreciation and disposals cost (48,228) (41,252)
Transfers (500) -
CLOSING NET BOOK AMOUNT 1,120,330 1,135,910
Comprises:
Property, plant and equipment 1,116,406 1,135,910
Intangibles 3,924 -
CLOSING NET BOOK AMOUNT 1,120,330 1,135,910
No impairment losses have been recognised in relation to property, plant and equipment, work in progress, and intangibles (30 June 2016: nil).
Capital expenditure contracted for in relation to property, plant and equipment at the end of the period but not yet incurred 19,256 11,111
OPERATING ASSETS AND LIABILITIESThis section shows the assets used to generate the Group’s trading performance and the liabilities incurred as a result. Liabilities relating to the Group’s financing activities are detailed in the Debt and Equity section of the Notes.
This section includes the following Notes:
Note 6: Property, plant and equipment, and intangibles
Note 7: Capital commitments
Note 8: Restoration provision
Note 9: Cash and cash equivalents
Note 10: Trade and other payables
Note 11: Employee benefits
REFININ
G N
Z INTERIM
REPORT 2017
19
NO
TES TO TH
E CON
DEN
SED CO
NSO
LIDATED IN
TERIM FIN
ANCIAL STATEM
ENTS
Notes to the Condensed Consolidated Interim Financial StatementsFOR THE SIX MONTHS ENDED 30 JUNE 2017 (UNAUDITED)
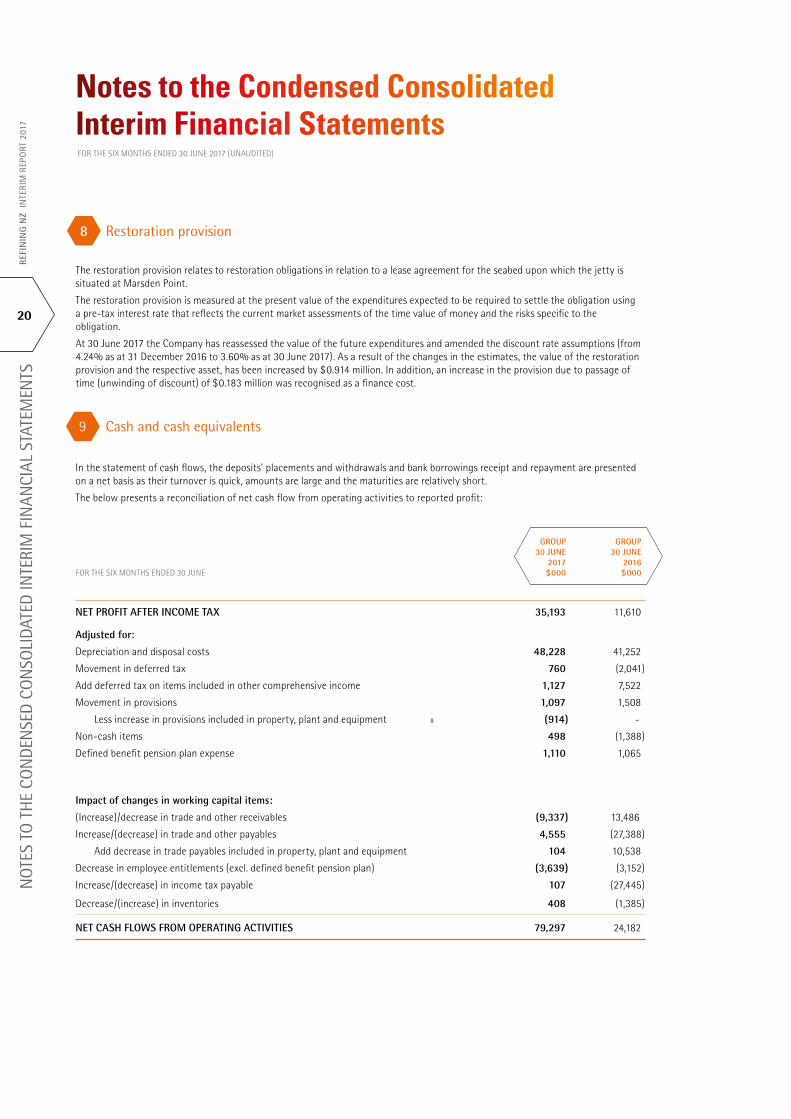
9 Cash and cash equivalents
In the statement of cash flows, the deposits’ placements and withdrawals and bank borrowings receipt and repayment are presented on a net basis as their turnover is quick, amounts are large and the maturities are relatively short.
The below presents a reconciliation of net cash flow from operating activities to reported profit:
NET PROFIT AFTER INCOME TAX 35,193 11,610
Adjusted for:
Depreciation and disposal costs 48,228 41,252
Movement in deferred tax 760 (2,041)
Add deferred tax on items included in other comprehensive income 1,127 7,522
Movement in provisions 1,097 1,508
Less increase in provisions included in property, plant and equipment 8 (914) -
Non-cash items 498 (1,388)
Defined benefit pension plan expense 1,110 1,065
Impact of changes in working capital items:
(Increase)/decrease in trade and other receivables (9,337) 13,486
Increase/(decrease) in trade and other payables 4,555 (27,388)
Add decrease in trade payables included in property, plant and equipment 104 10,538
Decrease in employee entitlements (excl. defined benefit pension plan) (3,639) (3,152)
Increase/(decrease) in income tax payable 107 (27,445)
Decrease/(increase) in inventories 408 (1,385)
NET CASH FLOWS FROM OPERATING ACTIVITIES 79,297 24,182
8 Restoration provision
The restoration provision relates to restoration obligations in relation to a lease agreement for the seabed upon which the jetty is situated at Marsden Point.
The restoration provision is measured at the present value of the expenditures expected to be required to settle the obligation using a pre-tax interest rate that reflects the current market assessments of the time value of money and the risks specific to the obligation.
At 30 June 2017 the Company has reassessed the value of the future expenditures and amended the discount rate assumptions (from 4.24% as at 31 December 2016 to 3.60% as at 30 June 2017). As a result of the changes in the estimates, the value of the restoration provision and the respective asset, has been increased by $0.914 million. In addition, an increase in the provision due to passage of time (unwinding of discount) of $0.183 million was recognised as a finance cost.
GROUP GROUP 30 JUNE 30 JUNE 2017 2016FOR THE SIX MONTHS ENDED 30 JUNE $000 $000
REFI
NIN
G N
Z IN
TERI
M R
EPO
RT 2
017
20
NO
TES
TO T
HE
CON
DEN
SED
CO
NSO
LIDA
TED
INTE
RIM
FIN
ANCI
AL S
TATE
MEN
TS
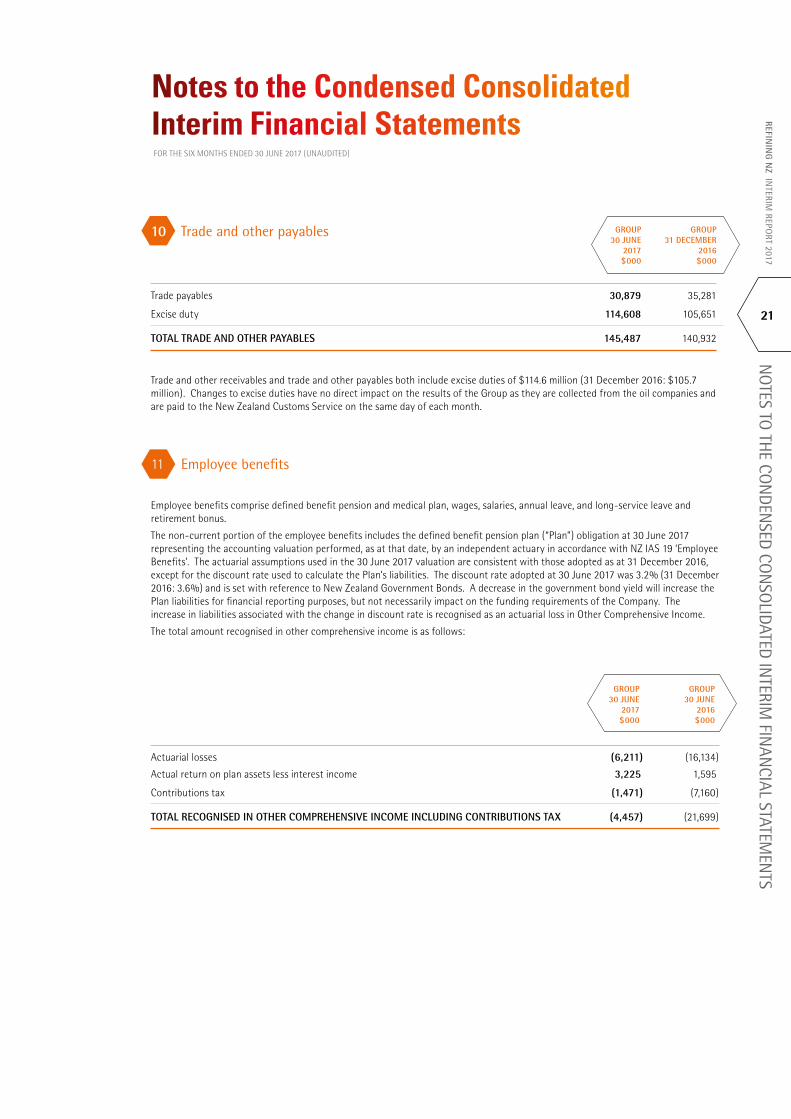
10 Trade and other payables
Trade payables 30,879 35,281
Excise duty 114,608 105,651
TOTAL TRADE AND OTHER PAYABLES 145,487 140,932
Trade and other receivables and trade and other payables both include excise duties of $114.6 million (31 December 2016: $105.7 million). Changes to excise duties have no direct impact on the results of the Group as they are collected from the oil companies and are paid to the New Zealand Customs Service on the same day of each month.
11 Employee benefits
Employee benefits comprise defined benefit pension and medical plan, wages, salaries, annual leave, and long-service leave and retirement bonus.
The non-current portion of the employee benefits includes the defined benefit pension plan (“Plan”) obligation at 30 June 2017 representing the accounting valuation performed, as at that date, by an independent actuary in accordance with NZ IAS 19 ‘Employee Benefits’. The actuarial assumptions used in the 30 June 2017 valuation are consistent with those adopted as at 31 December 2016, except for the discount rate used to calculate the Plan’s liabilities. The discount rate adopted at 30 June 2017 was 3.2% (31 December 2016: 3.6%) and is set with reference to New Zealand Government Bonds. A decrease in the government bond yield will increase the Plan liabilities for financial reporting purposes, but not necessarily impact on the funding requirements of the Company. The increase in liabilities associated with the change in discount rate is recognised as an actuarial loss in Other Comprehensive Income.
The total amount recognised in other comprehensive income is as follows:
Actuarial losses (6,211) (16,134)
Actual return on plan assets less interest income 3,225 1,595
Contributions tax (1,471) (7,160)
TOTAL RECOGNISED IN OTHER COMPREHENSIVE INCOME INCLUDING CONTRIBUTIONS TAX (4,457) (21,699)
GROUP GROUP 30 JUNE 30 JUNE 2017 2016 $000 $000
Notes to the Condensed Consolidated Interim Financial StatementsFOR THE SIX MONTHS ENDED 30 JUNE 2017 (UNAUDITED)
GROUP GROUP 30 JUNE 31 DECEMBER 2017 2016 $000 $000
REFININ
G N
Z INTERIM
REPORT 2017
21
NO
TES TO TH
E CON
DEN
SED CO
NSO
LIDATED IN
TERIM FIN
ANCIAL STATEM
ENTS
Notes to the Condensed Consolidated Interim Financial StatementsFOR THE SIX MONTHS ENDED 30 JUNE 2017 (UNAUDITED)
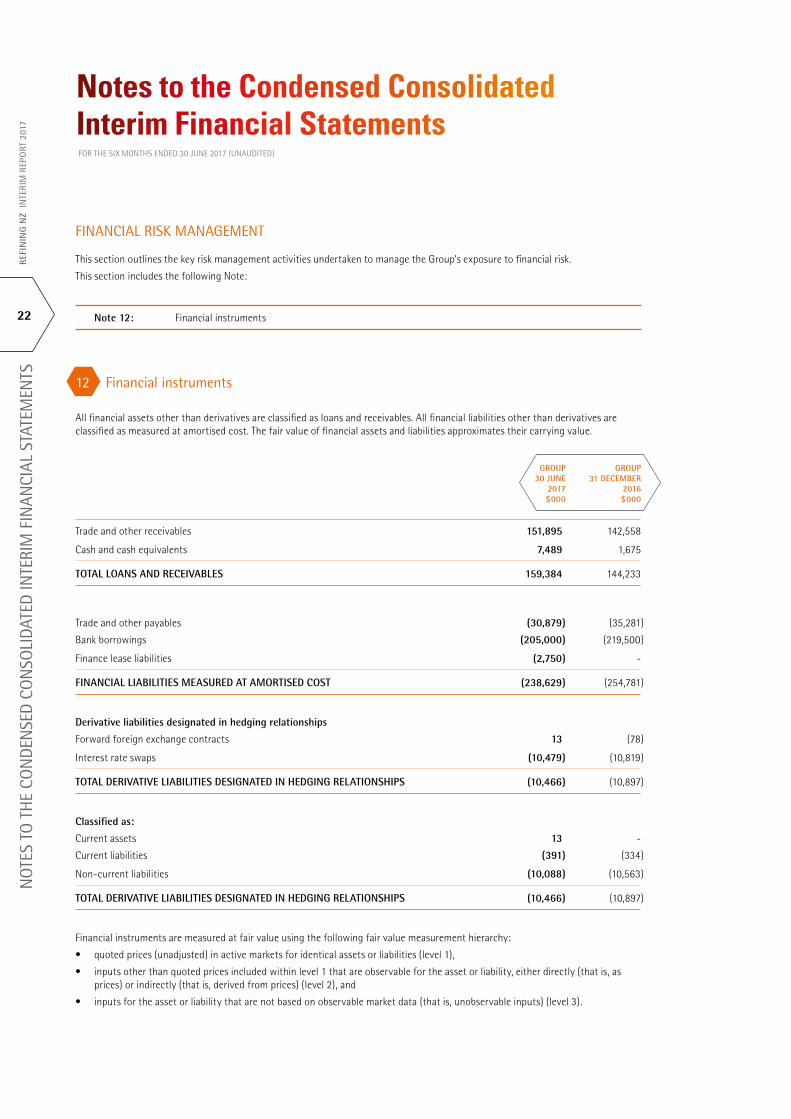
12 Financial instruments All financial assets other than derivatives are classified as loans and receivables. All financial liabilities other than derivatives are classified as measured at amortised cost. The fair value of financial assets and liabilities approximates their carrying value.
GROUP GROUP 30 JUNE 31 DECEMBER 2017 2016 $000 $000
Trade and other receivables 151,895 142,558
Cash and cash equivalents 7,489 1,675
TOTAL LOANS AND RECEIVABLES 159,384 144,233
Trade and other payables (30,879) (35,281)
Bank borrowings (205,000) (219,500)
Finance lease liabilities (2,750) -
FINANCIAL LIABILITIES MEASURED AT AMORTISED COST (238,629) (254,781)
Derivative liabilities designated in hedging relationships
Forward foreign exchange contracts 13 (78)
Interest rate swaps (10,479) (10,819)
TOTAL DERIVATIVE LIABILITIES DESIGNATED IN HEDGING RELATIONSHIPS (10,466) (10,897)
Classified as:
Current assets 13 -
Current liabilities (391) (334)
Non-current liabilities (10,088) (10,563)
TOTAL DERIVATIVE LIABILITIES DESIGNATED IN HEDGING RELATIONSHIPS (10,466) (10,897)
Financial instruments are measured at fair value using the following fair value measurement hierarchy:
• quoted prices (unadjusted) in active markets for identical assets or liabilities (level 1),
• inputs other than quoted prices included within level 1 that are observable for the asset or liability, either directly (that is, as prices) or indirectly (that is, derived from prices) (level 2), and
• inputs for the asset or liability that are not based on observable market data (that is, unobservable inputs) (level 3).
FINANCIAL RISK MANAGEMENT
This section outlines the key risk management activities undertaken to manage the Group’s exposure to financial risk.
This section includes the following Note:
Note 12: Financial instruments
REFI
NIN
G N
Z IN
TERI
M R
EPO
RT 2
017
22
NO
TES
TO T
HE
CON
DEN
SED
CO
NSO
LIDA
TED
INTE
RIM
FIN
ANCI
AL S
TATE
MEN
TS
Notes to the Condensed Interim Financial StatementsFOR THE SIX MONTHS ENDED 30 JUNE 2017 (UNAUDITED)
OTHERThis section contains additional notes and disclosures that aid in understanding Refining NZ’s performance and financial position.
This section includes the following Notes:
Note 13: Employee share-based payments
Note 14: Contingent liabilities
Note 15: Events after balance date
13 Employee share-based payments
The Company operates an Employee Share Purchase Scheme (“scheme”) approved by the Inland Revenue Department as a Section DC 12 share scheme under the Income Tax Act 2007.
Eligible employees are offered $1,000 worth of shares, multiplied by the Business Performance Factor (BPF) during the year of award and increased by an employee contribution of $1. The shares are purchased on-market and held by CRS Nominees Limited during a three year vesting period.
On 29 March 2017, 298 eligible employees were offered $1,251 worth of shares (represented by a Company contribution of $1,250 and increased by an employee contribution of $1) in respect of the 2016 financial year’s performance. With regards to the 2016 share offering, on 4 May 2017 the Parent acquired 154,808 shares on-market at an average price of $2.39 per share ($0.37 million). The shares will vest over a 3 year period ending on 4 May 2020.
As at 30 June 2017 a total of $0.345 million (30 June 2016: $0.14 million) had been recognised as an expense relating to the share-based payments.
14 Contingent liabilities
The Group has no contingent liabilities at 30 June 2017 (30 June 2016: nil).
15 Events after balance date
No events after balance date occurred, except for the declared interim dividend as per note 4.
The Group’s financial instruments have been measured at the fair value measurement hierarchy of level 2 (2016: level 2).
Interest rate swaps and forward foreign exchange contracts are not traded in an active market and their fair value is determined by using valuation techniques. Specific valuation techniques used by the Group refer to observable market data and include:
• The fair value of interest rate swaps is calculated as the present value of the estimated future cash flows based on observable yield curves, and
• The fair value of forward foreign exchange contracts is determined using forward exchange rates at the balance sheet date, with the resulting value discounted back to present value.
REFININ
G N
Z INTERIM
REPORT 2017
23
NO
TES TO TH
E CON
DEN
SED CO
NSO
LIDATED IN
TERIM FIN
ANCIAL STATEM
ENTS

Corporate DirectoryREGISTERED OFFICEMarsden PointRuakaka
MAILING ADDRESSPrivate Bag 9024Whangarei 0148Telephone: +64 9 432 5100
WEBSITEwww.refiningnz.com
SHARE REGISTERComputershare Investor Services LimitedPrivate Bag 92119Auckland 1142Telephone: +64 9 488 [email protected]
BANKERSANZ Bank New Zealand LimitedBank of New ZealandThe Bank of Tokyo-Mitsubishi UFJ, LimitedBank of China (New Zealand) Limited
LEGAL ADVISERSMinter Ellison Rudd WattsChancery Green
AUDITORPricewaterhouseCoopers
CHAIRMANS C Allen (independent director)
INDEPENDENT DIRECTORS V C M StoddartM TumeP A Zealand
NON-INDEPENDENT DIRECTORS M J BennettsD C Boffa (appointed 23 August 2017)R Cavallo (appointed 11 April 2017)M H Elliott (resigned 29 June 2017)A T Warrell (resigned 13 March 2017)
CHIEF EXECUTIVE OFFICERS Post
COMPANY SECRETARYD M Jensen
Managing your shareholding online
To change your address, update your payment instructions and to view your registered details including transactions, please visit: www.computershare.co.nz/investorcentre Please assist our registrar by quoting your CSN or shareholder number.
24
REFI
NIN
G N
Z IN
TERI
M R
EPO
RT 2
017
CORP
ORA
TE D
IREC
TORY


Private Bag 9024 Whangarei 0148, NZT: +64 9 432 5100 E: [email protected] www.refiningnz.com
REFINING NZ