Embed Size (px)
Citation preview
our peopleour environment
Annual Report 2006

C o m p a n y P r o f i l e
T h e N e w Z e a l a n d R e f i n i n g C o m p a n y L i m i t e d
The New Zealand Refining Companyoperates New Zealand’s only oil refinery, atMarsden Point near Whangarei. We are thenation’s leading supplier of refinedpetroleum products. Four oil companies –BP, Chevron, Mobil and Shell are significantshareholders and customers.
The refining process
Crude oils and feedstocks that are refinedinto transport fuels at Marsden Point areowned by the customers; with the refinerycharging the oil companies a processing fee.The processing fee is based on 70% of theGross Refining Margin (GRM) achieved andis subject to a cap of USD6.30 per barrel(70% of USD9.00). The processingarrangements include a “floor” that may beactivated when refining margins are low.
The refinery is able to process a wide rangeof crude oil types imported from aroundthe world and produce world class, cleanfuels.
Continual plant improvement
Although originally built in the early sixties,a major expansion and upgrade of theoriginal refining plant in the mid eightiesresulted in a relatively modern refinery. The continual upgrading of plant andpreventative maintenance, ensures worldclass reliability and efficiency.
The Future Fuels Project was completed inAugust 2005, providing the Refinery withthe latest plant and equipment available forremoving sulphur from diesel and benzenefrom petrol. This plant will allow theRefinery to produce cleaner fuels forgenerations to come.
The Company continually monitorstechnological developments and growthopportunities and has been considering aproposal to increase refining capacity byaround 20 percent. The project is for majormodifications to the Crude DistillationUnit number one, increasing the capacity ofthe unit from around 60,000 barrels per dayto approximately 95,000 barrels per day.The project is designed to both increaseoutput of high value distillate products andto eliminate the Refinery’s dependence onthe importation of residue (a by-productfrom other refineries). Imported residue iscurrently required to keep the hydrocrackerrunning at full capacity.
Management will prepare a final ten percentcost estimate and complete projectexecution plans in time for the Board togive final consideration for the project atthe April 2007 Board meeting.
The Refinery to Auckland Pipeline
The Refinery to Auckland Pipeline, built and commissioned during the refineryexpansion, has been upgraded by installingadditional pumping stations to meet thegrowing needs of Auckland. It is a key assetnot only for the Company but the countryas a whole. The single pipe carries diesel,petrol and jet fuel in controlled batchesunder farmland, towns and part of theManukau harbour, to the Wiri Terminal inSouth Auckland. About half of theRefinery’s production is distributed in thismanner, the balance being transported bycoastal tanker and road to the rest of NewZealand.
Independent Petroleum Laboratory Ltd
Independent Petroleum Laboratory Ltd, 75 percent owned by NZRC, is NewZealand’s largest fuel testing laboratory,catering not only for the Refinery’sincreasing needs, but for a wide range oflocal and international customers andgovernment agencies.
Our commitment to the environment
The Refinery’s commitment toenvironmental protection is evident.Beautiful sandy beaches surround the northand east of the Refinery. Together with itsneighbours and other stakeholders, theRefinery and its employees continue tofocus on protecting this uniqueenvironment.
The New Zealand Refining Company is acompany with high standards, reflected inour ISO 9001 and ISO 14001 third partycertification and our commitment toprotecting the Refinery’s uniqueenvironment at the mouth of theWhangarei Harbour.
The Refinery Auckland Pipeline (RAP)received certification to ISO 14001 during2006, for its Environmental ManagementSystem. The management system has beenset in place to ensure that all aspects ofwork performed by staff, contractors andservice providers will have minimal impacton the environment inclusive oflandowners, public, flora, fauna and existinghistorical sites and infrastructure.
This document is printed on 100% recycled paper using vegetable oil based printing inks and coatings.
Rob Smith, Refinery operator.
Reg Nordstrand, Warehouse Supervisor.

1
C o n t e n t s
Company Profile IFC
An introduction to the Company.
Performance Summary for the Year Ended 31 December 2006 2
A snapshot of all of the key results and data for the year.
Chairman’s Review 3
Ian Farrant reviews the group’s overallperformance for the year.
Chief Executive Officer’s Report 5Jerome Kerrigan reviews the year’s operations and discusses the plans and priorities for the future.
Directors’ Reporting 9
Report of the Directors 10
Directors’ Profiles 11
Directors’ Interests 12
Corporate Governance 13
The policies and procedures applied by the Directors and Management to provide for ethical and prudent management of the Company.
Environmental Performance 17
Social Performance 23
Human Resources 24
Safety and Security 28
Occupational Health Management 30
Quality and Compliance 31
Economic Performance 33
Auditors’ Report 34
Income Statements 35
Consolidated Balance Sheet 36
Statements of Recognised Incomeand Expenses 38
Statements of Cash Flows 39
Notes to the Financial Statements 40
Trend Statement 73
Shareholder Information 74
Information relevant to Shareholders’administration of their shares.
Share Price Performance 75
Suppliers 76
Corporate Directory and Financial Calendar IBC
Details of key reporting and dividend dates for 2007/08.
M i s s i o n S t a t e m e n t
To be the Leading Supplier of Oil Productsfor New Zealand.
The Di rectors are
p leased to present
the Annual Repor t o f
The New Zealand
Ref in ing Company
Limitedfor the Year Ended
31 December 2006
Ian Farrant
Chairman of Directors
2 March 2007
Sir Colin Maiden
Chairman of the Audit Committee
2 March 2007

2
Pe r f o r m a n c e S u m m a r y f o r t h e G r o u pFor the Year Ended 31 December 2006
T h e N e w Z e a l a n d R e f i n i n g C o m p a n y L i m i t e d
2006 2005 Change$000 $000 %
Operating results
Operating revenue 403,694 396,179 1.9
Surplus before income tax 202,252 241,306 (16.2)
Surplus after income tax 135,473 161,720 (16.2)
Share indicators
Net asset backing per share $2.55 $2.32 9.9
Earnings per share 56.4 cents * 67.4 cents (16.3)
Numbers
Shareholders 2,946 2,755 6.9
Employees 346 317 9.1
Manufacturing
Pipeline throughput (000’s barrels) 4,207 4,139 1.6
Barrels processed – intake (000’s barrels) 38,766 39,285 (1.3)
Gross refining margin (USD/barrel) 8.37 8.10 3.3
* On 7 October 2005, the Parent Company made a 10 for 1 share split, which resulted in 216,000,000 shares being issued for nil consideration. The comparative earnings per share have been restated based on the total number of shares on issue as at 31 December (2005: 240,000,000 shares).
Operating Revenue
Processing fees
Natural gas
Distribution revenue
Wiri rental
Gain on investment property
Loan settlement payment
Other
2006Total Revenue $403.694 million
2005Total Revenue $396.179 million

3
Overview
I am pleased to report another year ofstrong performance for the New ZealandRefining Company (NZRC) for the yearended 31 December 2006.
As Chairman, I am more aware than mostthat meeting all shareholder expectations isa difficult, if not impossible, task. Someshareholders have shares for strategicreasons, others for dividend yield, andothers for capital appreciation. This year Iam confident we have satisfied a lot ofshareholders, but it would be dangerousand presumptuous to use the word “all”.
Like most companies our success isdependent on numerous factors. Some wecan control, manage, or even lead, but weare also, to a large extent, at the mercy ofthe market and unforeseen events. 2006 hascertainly been a year where events such asthe Otahuhu substation failure andresulting shutdowns at the Refinery havehad an impact on our activities – whichmakes our strong results even moreimpressive.
The key to our success sounds simple, butin practise is much harder. In my opinion,having the Refinery in good operatingcondition, managed, operated andmaintained by excellent people, is the key.
You, as shareholders, and we, as Directors,are fortunate that we have such a team atthe Refinery. Our people cover a wide rangeof professions, trades and other skills thatensure the smooth running and maximumutilisation of our assets to generate verygood returns.
For us, “operational availability” is thesingle biggest controlled factor thatinfluences our profitability. Over 2006 theteam at NZRC have continued to provide anexcellent refining service that our customersand the motoring public and industry ofNew Zealand can rely on. That is not to saythat it was all smooth sailing or easy work.
As I noted, the Auckland power outage inJune had a significant impact on ouroperations this year and a number of otherunplanned plant shutdowns have tested theteam’s skills. But at the same time, these“tests” created learning and developmentopportunities which our team are alreadyusing to implement new procedures andplans which we are confident will reducefurther unplanned shutdowns in the future.
New Zealand International FinancialReporting Standards
Before discussing the financial results, it isimportant to remind readers that this is theCompany’s first year of reporting underNew Zealand International FinancialReporting Standards (NZ IFRS). Transitionto the new standards has taken a lot of hardwork by our finance team and I thank themfor deciding to move to this Standardearlier than necessary.
The standards introduce more transparencyand greater disclosure into the financialstatements. This has created morecomplexity and, dare I say it, cost. In somecases for NZRC the new Standards addedcomplexity in areas that add little or novalue to readers of the accounts. It will takesome time to fully appreciate the benefitsthe new regime brings.
Financial Results
Under the NZIFRS, NZRC is required to re-account for the debt assumption by theGovernment in 1989. We have had toretrospectively account for this item in thisreport. Fortunately it only affects thetranslation of the 2005 comparative figures,which were disclosed under GAAP in the2005 financial statements, to 2005comparatives in this report under NZIFRS.
The impact of this requirement is to add$31.47 million to last year’s revenue. Thismeans that this year, while net profit aftertax in real terms is actually higher than2005, I cannot report a record companyprofit. I can, however, state that operatingprofit from refining was a record.
For 2006 the Company has generated a netprofit after tax of $135.5 million comparedto 2005’s NZIFRS profit of $161.7 million($139.8 million in last years publishedaccounts). This result is due largely to theRefinery being able to capitalise on the gapbetween crude prices and product prices,and generate high NZRC marginsthroughout most of the year.
Over the year, the Refinery processed 38.8million barrels of feed stock (1.3% lowerthan in 2005) .
The Refinery to Auckland Pipeline (RAP)throughput levels were very similar to lastyear, signalling a slow down in demand byAuckland.
C h a i r m a n ’ s R e p o r t
T h e N e w Z e a l a n d R e f i n i n g C o m p a n y L i m i t e d

4
Cashflow Position
Because of the different accountingtreatment required by the NZIFRS forshutdowns and other costs, it is importantto look at the cashflows generated by thebusiness this year. Our net cash inflow fromoperations was $180.2 million compared to$175.7 in 2005.
This year we have invested heavily inproperty, plant and equipment at theRefinery, spending $70.7 million, mainly oncatalysts, tank and jetty refurbishment andthe Point Forward project. The balance ofour funds were used to fully repay loansraised to pay for the Future Fuels projectand to pay dividends. At balance date theCompany was debt free and in a position totake advantage of the growing transportfuels market in New Zealand.
Looking ahead
Biofuels
The Refinery is actively participating indiscussions concerning the Government’sannouncement that it will be moving tomandated sales targets for biofuels nextyear. NZRC supports the concept ofsustainability but recognises that the newpolicy development will bring with it somechallenges.
NZRC will be entering a market where thefinished product may cost significantlymore than hydrocarbon based products. Aswell, our relatively small market, butgeographically large area, makes thelogistical hurdles of providing a larger rangeof products difficult. NZRC will continue towork with our customers and theGovernment.
Point Forward Project
Over the last eighteen months, NZRC hasbeen looking at the feasibility of a refineryexpansion aimed at increasing our oil-refining capacity by up to 20 per cent.
The key to most successful refineryexpansions is to de-bottleneck existingequipment by using new technology andbetter catalysts. With this in mind, over 70different configurations of the MarsdenPoint Refinery were modelled during thedevelopment stage of the project. Fouroptions were selected for more detailedmodelling and costing. In October 2005 theDirectors approved one project for furtherevaluation. Because of the complexity ofrefineries, this work involved considerableengineering, process checking, safety andoperability review so that the Companycould develop an accurate construction costestimate.
More recently, market dynamics,announcements of additional refinerycapacity in the region, a large backlog in theinternational construction industry andother cost pressures, has required NZRC toreassess the first option selected. As a resultwe have opted for a smaller project thanoriginally envisaged. The project nowfocuses on the de-bottlenecking of one ofour crude distillation towers which willbuild on our strength of being a middledistillate producer, instead of investing alarge amount increasing our ability toproduce high octane petrol. Currentestimates are for the work to cost aroundNZD170 million.
Our original concept was to include aContinuous Catalyst RegenerationPlatformer (replacing the existing semi-regeneration Platformer in the project). Wehave decided that the environment is notright to risk such a large expenditure forNZRC. The board have requestedmanagement to prepare cost estimates andexecution plans for final consideration bydirectors at our April meeting.
Dividends
The prospects of a smaller Point ForwardProject and the excellent financial results,have allowed us to significantly increase thefinal dividend from 22.5 cents in 2005 to 35 cents this year. We are mindful thatmany market participants like steadydividends. However, we are also acutelyaware that profits belong to you, asshareholders. Many of you are aware of thevolatility in the market we operate in andare prepared to accept that volatility interms of dividend flows.
This dividend will be paid on March 29 andis fully imputed.
Conclusion
I would like to take this opportunity tothank all of our NZRC staff and contractorsfor another impressive year. As I notedearlier we, as Directors, and you, asshareholders, are fortunate to have such anexcellent team at NZRC committed tokeeping the Refinery in top operatingcondition and to the Company’s ongoingsuccess.
Ian Farrant Chairman
Segment ResultContribution to net profit
before finance costs.
Oil Refining
Distribution
Other
Loan settlement payment
2006
2005

5
C h i e f E x e c u t i v e O f f i c e r ’ s R e v i e w
T h e N e w Z e a l a n d R e f i n i n g C o m p a n y L i m i t e d
Overview
2006 was a year of consolidation for theNew Zealand Refining Company (NZRC).We achieved a pleasing 10% of growth inrevenue despite a year which included theAuckland power outage. However, ouralignment with the new New ZealandInternational Financial ReportingStandards means our results are presentedas being less than our 2005 results.
In 2005 our efforts were concentrated onthe start up of the Future Fuels units – thesingle biggest upgrade to the Refinery innearly 25 years, which enabled the Refineryto supply products meeting the new fuelspecifications. Following on from thatdevelopment, in the last twelve months wehave focused on building for the futurewith the development of the Point ForwardProject – an expansion aimed at increasingour oil-refining capacity by 20 per cent.Both projects reaffirm NZRC’s position asthe leading supplier of oil products for NewZealand.
Economic Performance
2006 has been a strong financial year forNZRC. The Refinery delivered an after taxprofit of $135.5 million for the year ended31 December 2006. This outstanding resultwas due largely to the Refinery capitalisingon the gap between crude prices andproduct prices.
Capacity
As a result of the fluctuating gap betweencrude prices and product prices, marginswere high for most of the year andexpectations were, that we would be able totake advantage of them by maintaininghigh availability of the refinery.
A decision was made early in 2006 toreplace some of the catalyst in the firsthydrocracker reactor. This was required toremove a constraint that prevented usoperating until the planned Novembershutdown. An advantage of doing thiscatalyst skim in May was that the plannedNovember shutdown could be deferred into2007. This resulted in increased capacity forthe year.
Unfortunately, the events in the second halfof 2006 negated most of these capacitygains. A series of process unit issues inSeptember and October resulted in losthydrocracker capacity. The failure of theOtahuhu substation in June also resulted inserious consequences for the Refinery –with the severe loss of voltage in the
incoming electricity resulting in majorshutdowns.
These events resulted in our unplanneddowntime of the processing units beingmore than twice that of previous years, at1.6%. Reviews into the individual eventshave identified changes to procedures,systems and equipment that are beingimplemented. We are confident that thesereviews will mitigate future unplanneddowntime.
Future Fuels
With the Future Fuels units fully functionalby the end of 2005, NZRC was able toensure that our customers met their newsulphur and benzene specification deadlinesby January 1st 2006. As well, the marketpremium for producers of low sulphurdiesel and refiners of heavy crudes providedNZRC with considerable additional incomeover refineries who didn’t have their cleanfuel projects available, or who don’t have asuitable configuration to process cheaper,heavy crudes. This additional income hasensured that the borrowings for the FutureFuels project were fully repaid by August2006.
The Refinery to Auckland Pipeline
The Refinery to Auckland Pipeline (RAP)was operated at consistently high levelsduring the peak summer periods at thestart and end of the year, making maximumuse of the new pipeline pump configurationinstalled in 2005. Although there was aslight downturn in diesel and petrol salesvolumes in Auckland, pumping rates downthe pipeline were higher than 2005. Thiswould indicate that the customers weremaking good use of the available increasedcapacity, by distributing more productssouth of Auckland.
Operational Costs
I am pleased to report that our costs werecarefully managed throughout the year andcame in at budgeted levels. Severalinitiatives to reduce costs wereimplemented. Among these were changesmade following our external maintenancereview of late 2005. As a result theTransfield Worley service contract has beenchanged from an alliance basis to one thateffectively now provides subcontractormanagement and design services for fixedfees and rates.

6
Environmental Performance
NZRC remains committed to its highenvironmental standards and continues tomake a significant contribution to positiveenvironmental initiatives.
Our effluent water quality continues toimprove following the concerted technicaland physical changes to the Refinery site in2005. Last year saw the lowest number ofquality excursions this century, with anumber of these being related to the qualityof the water following periods of torrentialrain.
Our sulphur dioxide (SO2) emissionscontinue to remain under our resourceconsents. In 2006 we used just over half ofthe emissions allowed during plant outages– which is an excellent result given thenumber of outages we dealt with.
We have also continued to make progress toimprove waste management. We haveincreased our paper recycling volumes andat the end of the year, all site personnelparticipated in a site wide clean up prior tothe contracting staff’s Christmas break.
NZRC also remains on track to achieveworld best practice in our energy efficiency,as we have committed to in our NGA signedwith the Government in 2003. Theimplementation of major energy savingprojects on our Hydrocracker and FutureFuels compressors helped reduce totalpower consumption by 5%.
Other environmental achievementsincluded the initial certification of theRefinery to Auckland Pipeline (RAP) to ISO14001 Environmental Management Systemsstandards, the recertification of the Refinerysite to the same ISO 14001 standard andthe Hazardous Substances and NewOrganisms (HSNO) Location TestCertificate recertification.
In November, up to 80 whales beachedthemselves near to Mair Bank, close to theRefinery site. NZRC staff respondedimmediately and pulled together a fullenvironmental emergency response team todeal with the situation until Department ofConservation staff arrived. With thesupport of available workers and othervolunteers, more than half of the whaleswere refloated and saved. This type ofresponse highlights both the Company’scommitment to environmental issues andits ongoing involvement in the Northlandcommunity that we are part of.
Social Performance
Safety remains the number one priority ofNZRC and its team.
Unfortunately in 2006 we had two lost timeinjuries (LTI) during the year. These havenow been extensively reviewed and newprocesses and procedures have beenimplemented to ensure the same situationsdo not happen again. It is significant tonote that, by the time of the first incident,the site had achieved 2.96 million workhours since the previous LTI.
There has also been a reduction in thenumber of lower level incidents (such asminor burns and eye injuries) at theRefinery in 2006. Process safety, theprevention of leaks, spills, equipmentmalfunctions, excessive temperatures andpressures, corrosion, metal-fatigue andother similar conditions are areas wecontinue to focus on. Specific plans arealready being developed to further mitigatepossible incidents.
Good progress was also made on theNorthland Training Alliance (NTA). By theend of 2006 a building for the HSE Centrehad been leased and refurbished ready toaccommodate classes for 2007. Thisregional initiative, initially started in 2005,is a partnership between local industry,contractors and process facilities like NZRC,and NorthTec who provide the training andadministration support.
Staff turnover has increased to 12.5% from11% in 2005 as the labour market hastightened further. We are still attractingquality people for our key positions, butlike many businesses we are experiencingincreasing recruitment lead times andassociated costs. We have increased thenumber of apprentices employed at theRefinery to seven. Our target is eight.
Our leadership development programme,implemented in 2004, has been continuedwith a variety of workshops, discussiongroups, lectures and away days. Ourinvestment in this area will continue.
The Refinery continues to enjoy a warm andsupportive relationship with itsneighbouring communities. All of oursponsorship activities are aimed atreciprocating that support and we arepleased to report in 2006 the Refinerysupported a range of communityorganisations such as Coastguard and theNorthland Central Science Fair.
A highlight of the year was the NZRC staffalso raising more than $1,000 for theCancer Society Daffodil Day in 2006 – manyby shaving their heads.
A more detailed list of all sponsorshipactivities can be found on page 27.
C h i e f E x e c u t i v e O f f i c e r ’ s R e v i e w

Jerome Kerrigan BSc (Chem Eng)
General Manager and Chief Executive Officer
Jerome has been involved in the Oil Industry for over30 years, and more specifically at NZRC for the past22 years in a variety of Operational and Commercialroles. Seconded to Shell for four years in Thailand forthe RRC start-up in 1995. Previously worked forShell in the UK and BORCO in the Bahamas.
Dennis Martin BCA CA
Company Secretary and Finance Manager
Dennis joined NZRC in January 2001 from Billitonand BHP, where he held several roles in the FinancialManagement and Treasury functions.
Andrew Tripe B.A. (Economics); Dip. Business Studies
Human Resources Manager
Andrew joined NZRC in March 2003 from a multi-industry change management background includingassignments with IBM in London and DeloitteConsulting in NZ.
David Keat BSc, BE (Chemical and Materials)
Refining Manager
David rejoined NZRC in February 2005 after sixyears in Gas to Liquids (Sarawak) and GasLiquifaction (Abu Dhabi). Prior to that held a widevariety of Technical, Operational and Managerialroles at NZRC between 1985 and 1999.
Jack Ariel BSc (Mechanical Engineer)
PFP Project Director and Engineering Manager
Jack joined Shell in 1979 and covered since then avariety of jobs in Manufacturing (variousmaintenance jobs, Engineering Manager andProduction Manager Buenos Aires Refinery), ProjectManagement (The Netherlands, Saudi Arabia andBuenos Aires), Lubricants Supply Chain (LatinAmerica) and Fuels Distribution (Southern LatinAmerica). Prior to joining NZRC in April 2006, hewas General Manager for the Lubricants SupplyChain in Latin America.
Pictured below (left to right):David Keat, Jack Ariel, Jerome Kerrigan, Andrew Tripe, Dennis Martin.
E x e c u t i v e Te a m

8
The year ahead
Development and design work on the PointForward Project is a priority focus for theRefinery. The introduction of biofuels andthe Government’s Energy Strategy will alsorequire increased consideration andresourcing.
Point Forward Project
As we detailed last year, the Front EndEngineering Design for a project todebottleneck the Crude Distillation Unit 1,and the construction of a new ContinuousPlatformer was approved by the Board in2005.
However the scope of the proposed projectwas challenged and reviewed extensivelyduring the year, before finally settling on aconfiguration that sees us onlydebottlenecking the Crude Distillation Unit1 at this time. The new continuousPlatformer may be reconsidered at a laterdate.
We are now working on the final costestimates and execution plans for thisdebottlenecking proposal and will presentthis to the board in the coming months.This decision should be the final hurdle fordeveloping the Point Forward Project into afully designed, engineered and executableproject.
Biofuels
For some time the Government hasindicated that it is considering theintroduction of a mandatory sales target forbiofuels. Discussion documents werereleased late in 2005 which NZRC made asubmission on. Mandated sales targets havenow been outlined by the Governmentwhich are due to be implemented in 2008.We will work with our customers to identifyhow, and where, we can best fit into theproduct supply/ distribution chain andwhat we can do to support them with thesenew targets.
New Zealand Energy Strategy
Towards the end of 2006, the Governmentreleased its Energy Strategy (NZES), and anumber of accompanying policy documentsdealing with climate change andgreenhouse gas emissions. These dealt withproposals for the period leading up to, andbeyond, 2012. We are reviewing these policydocuments and will be making submissionswhere we think we can add value to thepolicy development.
Conclusion
2006 was a good year for the Refinery. TheCompany delivered record results in severalareas. Our continued development of thePoint Forward Project will build on ourposition as the leading supplier of oilproducts for New Zealand. Our continuedfocus on helping customers manage theirobligations regarding biofuels and theGovernment’s Energy Strategy, has thepotential to create new opportunities forthe Refinery.
Most importantly, NZRC is a company oftalented and committed people who haveall contributed to the impressive financialresults we have achieved this year. Weremain committed to our high business andenvironmental standards. I want to thankall staff and contractors for their supportand compliment them for an excellentperformance in what was a mostdemanding year.
Jerome KerriganGeneral Manager and Chief Executive Officer
C h i e f E x e c u t i v e O f f i c e r ’ s R e v i e w
Singapore and NZRC Refining Margins(US Dollars per Barrel)
10.00
8.00
6.00
4.00
2.00
0.002002 2003 2004 2005 2006
NZRC
Exchange Rate(NZ Dollar vs US Dollar)
75
65
55
45
352002 2003 2004 2005 2006

D i r e c t o r s ’R e p o r t i n g
T h e N e w Z e a l a n d R e f i n i n g C o m p a n y L i m i t e d

10
Shares
The Company has 240,000,000 shares onissue as at 31 December 2006 (2005:240,000,000).
Dividends
A fully imputed interim dividend of 10 cents per share amounting to$24,000,000 was paid on 28 September2006. The Directors’ resolved to pay a finaldividend of 35 cents per share amountingto $84,000,000 on 29 March 2007. Thefinal dividend will also be fully imputed.
Directors
There have been no changes in Directors ofthe Company since the last Annual GeneralMeeting held on 27 April 2006.
P.C.A. Colman, G.W. Henson, K.A. Hirschfeld and C.M. Midgley are notresident in New Zealand.
Profit before income tax 202,252 241,306 202,518 240,728
Income tax 66,779 79,586 66,779 79,383
Minority interest 69 (170) – –
Profit attributable to shareholders 135,542 161,550 135,739 161,345
G R O U P PA R E N T
2006 2005 2006 2005$000 $000 $000 $000
Income
R e p o r t o f t h e D i r e c t o r s
T h e N e w Z e a l a n d R e f i n i n g C o m p a n y L i m i t e d
The Di rectors ’ present the i r For ty - f i f th Annual Repor t
together wi th the Audi ted F inanc ia l Statements o f the
Company for the year ended 31 December 2006.
Operating Activities
The Company owns and operates an oil refinery located at Marsden Point – 160 kilometresnorth of Auckland. The Company also operates a product pipeline from the Refinery to theWiri Fuels terminal located in South Auckland. The Wiri Terminal, owned by NZRC, isleased to a company owned by NZRC’s customers. Independent Petroleum Laboratory,Limited which is 75% owned by NZRC, carries out laboratory testing of fuels and relatedproducts for both local and international customers.
Directors’ Shareholdings
The particulars of Directors’ interests inshares are as at the balance date. No changehas occurred since balance date.
The details of the number of shares held byDirectors are set out below.
Director 2006 2005
I.F. Farrant 50,000 100,000
Sir Colin Maiden 5,000 5,000
D.A. Jackson 10,000 10,000
Auditors
PricewaterhouseCoopers, whoseremuneration is detailed in Note 4 to thefinancial statements, have indicated theirwillingness to continue in office.
Events Subsequent to Balance Date
The Directors are not aware of any matteror circumstance since the end of thefinancial year not otherwise dealt with inthis report or the financial statements thathas or may significantly affect the operationof The New Zealand Refining CompanyLimited, the results of these operations orthe state of affairs of the Company.
Directors’ Remuneration
The remuneration and other benefitsreceived by Directors during the year wereas follows:
2006 2005
C. Bower 40,000 –
W.R. Bussing – 25,000
A.P. Borgesen 40,000 –
P.C.A. Colman 50,000 40,000
G.A. Cumming 40,000 30,000
I.F. Farrant 80,000 60,000
P.W. Griffiths 40,000 30,000
G.W. Henson 40,000 30,000
K.A. Hirschfeld 40,000 5,000
D.A. Jackson 50,000 40,000
P. Logan – 30,000
Sir Colin Maiden 50,000 40,000
M.R. Malpass – 30,000
C.M. Midgley 40,000 30,000
510,000 390,000
Directors’ Interest in Contracts
Since the date of the last report, theDirectors have declared, pursuant to section140(2) of the Companies Act 1993, that theyare to be regarded as having an interest inany contract that may be made with theentities listed by virtue of their directorshipor membership of those entities.
A detailed list of these declarations isincluded in this Report.
Directors’ Benefits
No Director of the Company has, since theend of the previous financial year, receivedor become entitled to receive, a benefit(other than a benefit included in the totalemoluments received or due and receivableby Directors shown in this Report). Noloans have been made to Directors.
Directors’ Insurance
The Company has arranged Directors’Liability Insurance which, together with aDeed of Indemnity, ensures that generallydirectors will incur no monetary loss as aresult of actions undertaken by them asdirectors. Certain actions are specificallyexcluded, such as the incurring of penaltiesand fines which may be imposed in respectof breaches of the law.

11
D i r e c t o r s ’ P r o f i l e s
T h e N e w Z e a l a n d R e f i n i n g C o m p a n y L i m i t e d
Ian Farrant CNZM B.Com FCA
Chairman
Chartered Accountant. A Director of a number of listed and unlisted public companies.
Arita Borgesen BS (Economics), MBA.
Supply Optimisation Manager Chevron NewZealand. Joined Chevron in 2000. Held variouspositions in logistics and supply in the US. Previouslyworked ten years with Statoil in supply and tradingin Norway.
Cameron K. Bower Bsc (Mechanical Engineering)
Lead Country Manager and Retail Sales ManagerMobil Oil New Zealand. Joined Mobil in 1993. Heldpositions in fuels marketing, refining and supplywith ExxonMobil in Asia Pacific and the USA.
Peter Colman LL.B, FCA
Shell Downstream East Regional Controller. JoinedShell in London in 1980. Held positions in finance,resources and manufacturing in Australia, Norway and UK. Director of Shell Australia Limited.
Geoffrey Cumming BA (Hons), MSc (LSE)
Deputy Chairman of Emerald Capital Limited (NZ)and Vice Chairman of its Canadian parent,Gardiner Group Capital Limited. Holds a variety ofpublic and private directorships in New Zealand andNorth America, including Lead Director of WesternOil Sands Inc, and Director of Opti Canada Inc, inCanada. Previously, President and CEO of GardinerOil and Gas Limited, a publicly-listed Canadianpetroleum company, and a Governor of theCanadian Association of Petroleum Producers.
Peter Griffiths Bsc Honours
Managing Director BP Oil NZ Ltd. Joined BP 1988.Held various management positions in New Zealandand overseas.
Glenn Henson BE (Chemical), M. Eng Sci.
Manager Refining Australia and NZ for Mobil andDirector Refining Mobil Oil Australia Pty Ltd.Joined Mobil at Altona Refinery (Melbourne) in1977. Held positions in refining, planning andsupply with ExxonMobil in USA and Australia.
Kathy Hirschfeld BE (Chem), CEng, MIChemE, GAICD
Managing Director and Refinery Manager, BPRefinery Bulwer Island Pty Ltd. Joined BP in 1990 and held positions in refining, logistics andexploration/production including maintenance,operations and commercial in Australia, UK and Turkey.
David Jackson M.Com (Hons), FCA,
Independent Director
Chartered Accountant. Director of a number ofpublic companies and a member of the SecuritiesCommission.
Sir Colin Maiden M.E.(NZ) D.Phil. (Oxon), Hon LLD (Auck)
Director of a number of public companies, includingFisher & Paykel Healthcare Corporation. Chairmanof DB Breweries Ltd.
Chris Midgley CEng IChemE
General Manager, Supply and Marine, ShellOceania. Joined Shell 1997. Held variousmanagement positions in supply and refineryoperations in Europe and spent four years asTrading Manager for Shell Trading and ShippingCompany. Previously worked seven years withExxon in various engineering roles. Director ofTrident Shipping, Silverfern Shipping and AustralianMarine Oil Spill Centre.
IPL Directors
David Keat BSc, BE (Chemical and Materials)
Refining Manager. Rejoined NZRC in February2005 after six years in Gas to Liquids (Sarawak)and Gas Liquifaction (Abu Dhabi). Prior to thatheld a wide variety of technical, operational andmanagerial roles at NZRC between 1985 and 1999.
Dennis Martin BCA
Company Secretary and Finance Manager. JoinedNZRC in January 2001 from Billiton and BHP,where he held several roles in the financialmanagement and treasury functions.
Dr Barry Blackett BSc and PhD Chem (Cantby. Uni)
Eight years university teaching in UK and Africa. 20 years with BP Chemicals and BP Oil in atechnical role including 13 years in current role asBP New Zealand’s Technical Manager.
Standing: Arita Borgesen, Peter Colman, Glenn Henson, Geoffrey Cumming, Chris Midgley. Sitting: Peter Griffiths, Cameron Bower, Ian Farrant, Kathy Hirschfeld, Sir Colin Maiden. Inset: David Jackson.

12
D i r e c t o r s ’ I n t e r e s t s
T h e N e w Z e a l a n d R e f i n i n g C o m p a n y L i m i t e d
BP Oil New Zealand Limited
Mr P.W.Griffiths
BP New Zealand Holdings Limited
BP New Zealand Share Scheme Limited
BP Oil New Zealand Limited
BP Pacific Investments Limited
Coro Trading NZ Limited
Europa Oil NZ Limited
McFall Fuel Limited
New Zealand Diving and Salvage Limited
NZDS Properties Limited
RD Petroleum Limited
Rural Fuel Limited
Shoman Limited
Direct Fuels Limited
Ms K.A. Hirschfeld
BP Refinery (Bulwer Island) Pty Limited
BP LNG Shipping Limited
Chevron New Zealand
Ms A.P. Borgesen
Chevron New Zealand
Chevron Global Downstream
Penagree Limited
Penagree No.2 Limited
Silver Fern Shipping Limited
Mobil Oil New Zealand Limited
Mr C.K. Bower
ExxonMobil New Zealand (Exploration) Limited
Mobil Oil New Zealand Limited
ExxonMobil Chemical New ZealandLimited
ExxonMobil New Zealand Holdings
Pegasus Stations Limited
America Chamber of Commerce Inc.
Mr G.W. Henson
Mobil Refining Australia Pty Limited
Mobil Oil Australia Pty Limited
Vacuum Oil Company Proprietary Limited
W.A.G. Pipeline Proprietary Limited
ExxonMobil Australia Pty Limited
Crib Point Terminal Pty Limited
Australian Institute of PetroleumPty Limited
Shell Australia Limited
Mr C.M. Midgley
W.A.G. Pipeline Proprietary Limited
Crib Point Terminal Pty Limited
Trident Shipping
AMOSC - Australian Marine Oil Spill Centre
Silver Fern Shipping Limited
Penagree Limited
Penagree No.2 Limited
Mr P.C.A. Colman
Pioneer Road Services Pty Limited
Provident & Pensions Holding Pty Limited
SASF Pty Limited
Shell Australia Limited
Shell Energy Holdings Australia Limited
The Shell Company of Australia Limited
Independent Directors
Mr I.F. Farrant
Broadway Industries Limited
Sir Colin Maiden
DB Breweries Ltd and Subsidiaries Limited
Marsh (NZ) Ltd Advisory Group Limited
Fisher & Paykel Healthcare CorporationLimited
Mr G.A. Cumming
Emerald Capital Limited
Zeus Capital Limited
Zeus Management Limited
Gardiner Group Capital Limited
Garbell Holdings Limited
Western Oil Sands Limited
OPTI Canada Inc
Cyries Energy Limited
Mr D.A. Jackson
Pumpkin Patch Limited
CanWest MediaWorks (NZ) Limited
Nuplex Industries Limited
Alternate Directors
BP Oil New Zealand Limited
Mr J.H. Wake
BP Oil New Zealand Limited
Penagree Limited
Penagree No. 2 Limited
Silver Fern Shipping Limited
Chevron New Zealand
Mr B.E. Waywell
Alliance Refining Company Limited
Chevron Trading Pte Limited
Kenya Petroleum Refineries Limited
Pakistan Refinery Limited
Singapore Refining Company Private Limited
Star Petroleum Refining Company Limited
Independent Directors
Mr A.J. Clements
Emerald Capital Limited
New Zealand Experience Limited
Ryman Healthcare Limited
Goldpine Group Limited
Goldpine Properties Limited
Orion Corporation Limited
Fusion Electronics Limited
TVD Holdings Limited
Open Holdings Limited
UNZIP Properties (No.1) Limited
Zeus Capital Limited
Zeus Management Limited
Jacon Investments Limited
Revera Limited

G o v e r n a n c e
T h e N e w Z e a l a n d R e f i n i n g C o m p a n y L i m i t e d

14
G o v e r n a n c e
T h e N e w Z e a l a n d R e f i n i n g C o m p a n y L i m i t e d
The Directors of the New Zealand RefiningCompany see governance as a core businessactivity similar to safety and quality.Governance is a part of the foundations ofthe Company, essential for the maintenanceof corporate health and growth. Like safetyand quality, governance includes a set ofsystems and processes; supported by peoplewith the appropriate competencies,principles, and behaviours to ensure theprocess is effective and working to the long-term benefit of the organisation.
Directors and management are committedto the continued achievement of effectivegovernance within the Company. Thisprovides shareholders, customers, suppliersand stakeholders with the assurance thatthe Company delivers on its promises in away that reflects its business principles.
As the Company operates in New Zealandand is listed on the New Zealand StockExchange (NZX), it is subject to regulatorycontrol and monitoring by both the NZXand the Securities Commission. Appendix16 of the NZX Listing Rules sets out some“Minimum Requirements” for governanceand the Securities Commission has alsopublished “Principles and Guidelines – ahandbook for directors, executives andadvisors”. The Company is of the view thatif it makes sufficient disclosureincorporating the recommendations ofboth publications, the reader of the AnnualReport will be able to assess theeffectiveness of the Company’s corporategovernance.
Governance, by its very nature, is nevercomplete. It is not a project that has a finiteend. There is always more to do, newtechniques, learnings from past experiencesand other organisations that need to beconsidered, and if deemed necessary,incorporated into our systems. Moreimportantly the “Culture” has to beobserved on a continual basis as to itshealth and appropriateness and actionstaken accordingly.
NZX Best Practise Guidelines
Appendix 16 covers:• Code of ethics• Directors• Committees• Relationship with Independent Auditor.
The New Zealand Refining Company meetsthe requirements of Appendix 16 apart fromSection 2.7, which encourages Directors totake a portion of their remuneration undera “Performance Based Equity SecurityCompensation plan”.
NZRC Directors do not receive any form ofperformance-based remuneration.
Board Structure
The Board is responsible to shareholdersand other stakeholders for charting thedirection of the Company by participatingin the formulation of objectives, strategyand key policies. The Board then delegatesthe conduct of the day-to-day affairs of theCompany to the Chief Executive Officerwithin this framework and is thenresponsible for monitoring management’srunning of the business to ensure that therunning of the business is within the agreedframework.
The roles and responsibilities of the Boardand management are clearly understoodand documented by way of “DelegatedAuthorities” from the Board to the ChiefExecutive Officer.
The Board consists of eleven Directors; arelatively large Board compared to othercompanies listed on the NZX. However, theBoard, through the nominationscommittee, ensure that the Directors have abroad mix of skills and experiences. Thecurrent structure works well, draws off thespecific experience from those Directorsthat have refinery or related oil industryexperience and from those that have specificexpertise and exposure to New Zealand’smarkets.
The Nominations Committee regularlyassesses current and future needs(succession planning) of the Company interms of Directors and the Chief ExecutiveOfficer.
Major shareholders do not have aconstitutional right to appoint directors,although it is accepted that they are entitledto representation. The NominationsCommittee, using the same criteria as forall directors, considers nominations forthese representatives as if they were nonrepresentative directors.
The Company does not have:• A majority of independent directors
(three independent), or • Any executive directors.
Profiles of the current directors appear onpage 11 of this Report.
Ethical and Responsible Decision Making
The Board considers that good riskmanagement is supported by the higheststandards of corporate behaviour towardsour employees, customers and otherstakeholders.
NZRC has one “Code of Ethics” for alldirectors, employees and contractorsproviding services to the Company,contained in a company publication calledthe “Blue Book”.
The Blue Book is a guide to help NZRC’sdirectors, employees and contractors live upto its high ethical standards and defines thecode of ethics and business principles. Thepublication also provides examples ofdilemma’s that may be faced by employeesand defines the Company’s expectations inresponse to these dilemmas.
In general, all directors and employees areexpected to act honestly in all of theirbusiness dealings and to act in the bestinterests of the Company at all times.
The Blue Book has been distributed to alldirectors, employees and contractors and isprovided and discussed with new employeesas part of the induction process.
Operation of the Board
The Board meets six times per year, at twomonthly intervals.
The table below sets out the Board and sub-committee meetings attended by theDirectors during the course of the year:
Board of Directors Meetings Audit Committee Meetings Annual General MeetingHeld Attended Held Attended Held Attended
I.F. Farrant 6 6 1 1
A.P. Borgesen 6 6 1 1
C.K. Bower 6 5 1 1
A.J. Clements * 6 3 1 1
P.C. Colman 6 5 3 3 1 1
G.A. Cumming 6 3 1
P.W. Griffiths 6 5 1 1
G.W. Henson 6 5 1 1
K.A. Hirschfeld 6 5 1 1
D.A. Jackson 6 6 3 3 1 1
Sir Colin Maiden 6 5 3 3 1 1
C.M. Midgley 6 6 1 1
J.H. Wake * 6 1 1* attended as alternate

15
The Chairman, CEO and CompanySecretary prepare the agenda for eachmeeting. Board papers are provided to theDirectors approximately 10 days prior tothe meeting.
In addition to Board Papers, the Directorsreceive a full copy of managements’monthly operations report. The operationsreport, although consisting mainly ofoperational matters, provides the Directorswith a detailed insight of operations,challenges, issues and accomplishments andis considered a key component of thegovernance process.
Integrity in Financial Reporting
A comprehensive process to ensure theintegrity of the financial reports is in place.This process includes:
• Full reconciliation and explanation ofdifferences between management andexternal financial reports.
• Financial systems are a key focus forInternal Audit.
• Detailed review of the FinancialAccounts by the Audit Committee.
• An annual review of the performanceand independence of the externalauditor by the Audit Committee.
Timely and Balanced Disclosure
With the introduction of the NZXcontinuous disclosure rules from December2002, the Board has introduced thefollowing mechanisms to ensure timelydisclosure of material matters to thefinancial markets:
• Management will bring to the attentionto the Directors any information thatthey believe should be disclosed to themarket for their consideration.
• The Company provides bi-monthly dataon throughput, margins and processingfees, which enables stakeholders to assessthe financial performance of theCompany.
• The Company does not provide regularforecasts of profitability because of thevolatile nature of earnings and theinability of the company to predictprices and resulting financial resultswith any degree of accuracy.
• The Company monitors broker reviews.
Respect the Rights of Shareholders
The Company is very cognisant ofshareholder rights and the fact that theCompany’s main purpose is to create long-term sustainable wealth for all shareholders.
The Company is conscious of the fact thatfour of the five major shareholders arecustomers. Directors are disciplined,focusing on NZRC, carrying out their legalresponsibilities which includes acting in theinterests of all shareholders and whereappropriate declaring an “interest”. This
not only means not voting on an issue, butalso refraining from discussing an issue.
In most situations the customers’ goals areclosely aligned to those of NZRC.
There are separate processing agreementsindependently negotiated with eachcustomer on an annual basis. This aspect ofthe business operation indicates healthycompetition and relationships.
Recognise and Manage Risk
The recognition and management of riskhas been long established both in theRefinery and for the Refinery to AucklandPipeline. More recently, this systematicapproach has been applied in acomprehensive manner to the entireorganisation.
The Directors are responsible for ensuringcomprehensive and effective riskmanagement is in place for NZRC. TheAudit Committee has a role to ensure thatadequate systems have been put in placeand are working effectively.
The Company is audited by a significantnumber of “interested parties”. Examplesinclude the aviation industry, legislativebodies, quality organisations andcustomers. Management are of the firmbelief that these audits, along withnumerous internal audits, are a criticalaspect of ensuring that managementsystems are functioning and effectivelycontrolling the aspects (including risks) ofthe business they have been designed to.
The Directors have charged the AuditCommittee to ensure that systems are inplace and working effectively.
A comprehensive register of allincidents/non compliances is kept. RootCause Analysis is carried out so thateffective measures can be initiated toprevent the event (or similar events)occurring in the future.
Internal Audit is carried out at three levels:
• Comprehensive Corporate Audit Plan,approved by the Audit Committee, andcarried out by Ernst Young.
• Comprehensive Management SystemsAudit programme lead by the QualityManager.
• Specific, one-off audits by technicalexperts, as part of a programme or forspecific reasons.
The role of the Internal Audit function is todevelop a comprehensive continuous auditprogram, which supports the Company’srisk management process. The internalauditors have a direct communication lineto the Audit Committee. The Audit Partnerand Internal Audit Manager from ErnstYoung attend the Audit Committee meetingand present their report.
Remunerate Fairly and Responsibly
The policy relating to Directors’remuneration is straightforward. The levelof remuneration for Directors is marketbased – with the key determinant being ableto attract high calibre independentdirectors. Directors are paid annual fees,approved by the Shareholders.
• There is no director or employee share ordirect profit based bonus systems inplace.
• The Company has a well-developedemployee remuneration policy andprocess based on the “Hay System”.
• The Company rewards employees forhigh performance through salaryincreases and/or annual bonuses.
• A site wide bonus scheme, based oncompany performance in a number ofkey areas, is paid. Areas covered by thebonus may include profitability, plantreliability, safety and environment. Thebonus is the same for everyone. Eachyear the bonus may range from zero to$4,000, depending on the Company’sperformance against those keyperformance indicators referred toabove.
Recognise the Legitimate Interests of Stakeholders
The Company has a clear set of businessprinciples that are mandatory for all staff.
These principles are demonstrated throughour behaviours in every aspect of ourbusiness, our business relationships,community relationships and relationshipwith government and regional agencies.
NZRC’s goal is to have long-term relationsthat benefit both the Stakeholder and theCompany.
The Company is also very aware that it hasan environmental footprint – the goal is tominimise the impact that the Company has.ISO14001 certification for both the Refineryand the Refinery to Auckland pipeline is aclear demonstration of ensuring that theCompany has effective systems in place toboth manage and improve environmentalperformance.
NZRC also recognises that the service itperforms is essential for New Zealanders asa whole. For this reason, reliability andproduct quality are key drivers in carryingout its business every day.

“This re f inery may wel l deserve thepr i ze for the greates t beauty of aheavy indust ry s i te in the wor ld .”Wade Doak, Conservat ionist - October 2006.

E n v i r o n m e n t a l Pe r f o r m a n c e
T h e N e w Z e a l a n d R e f i n i n g C o m p a n y L i m i t e d

18
In 2006 NZRC cont inued to bu i ld on the foundat ion
of prev ious env i ronmenta l improvements . Both the
degree and number of env i ronmenta l non-compl iances
were wel l down on prev ious years , as we cont inuous ly
improve how we manage env i ronmenta l aspects .
T h e E n v i r o n m e n t
E N V I R O N M E N TA L R E P O R T I N G
Environmental Systems and Standards
The Company operates an EnvironmentalManagement System (EMS) to the ISO 14001 standard. This certification isconsidered a core component of ourbusiness management strategy and animportant part of the way we avoid, remedy,or mitigate environmental effects from ouroperations.
NZRC has been certified to this standardfor refinery site operations since April 2002.In 2006, NZRC was successfully certified tothe updated ISO 14001:2004 standard.
In 2006, the Refinery to Auckland Pipeline(RAP) was certified to the same ISO 14001standard. Sophisticated GeographicalInformation Systems were used to captureand assist in managing the manyenvironmental aspects that are part ofoperating the RAP. Managing these aspectsis a fundamental daily feature of ourpipeline operation.
As part of the EMS improvement plan, theCompany has continued to implement theHazardous Substances and New OrganismsAct (HSNO).
Continued compliance with the Act wasevidenced by recertification with a“Location Test Certificate” in December2006. The certificate covered areas ofhazardous substance management such as:approved handlers, emergency management,hazardous atmosphere zone controls,incompatible substance segregation,protective equipment and clothing, signage,and secondary containment.
The Company will continue to worktowards, and gain compliance, as furtherHSNO controls take effect during the Actsimplementation phase.
In 2003, NZRC entered into the firstNegotiated Greenhouse Agreement (NGA)with the New Zealand Government.Negotiated Greenhouse Agreements are oneof the methods the Government intends touse to meet its obligations under the KyotoProtocol.
As part of the NGA, we have an obligationto achieve and maintain “best practice” inenergy efficiency. By achieving “bestpractice”, we will reduce the amount ofgreenhouse gas emissions per unit ofproduct produced. In 2006, the Companycontinued to meet its obligations under theNGA.
Oil Spill Exercises
NZRC has always recognised and iscommitted to the prevention of, andassistance in the cleanup, of oil spills inareas under its responsibility.
While the Company is keen to work inwhatever way it can to prevent oil spillsfrom occurring, and will assist in the cleanup of any incidents as quickly and asefficiently as possible, it has no legalresponsibility or liability for vessels untilthey are actually berthed at the NZRCfacilities.
As part of NZRC’s continuing oil spillreadiness response, the Taranui, a purposebuilt oil skimmer vessel, is deployed everymonth for oil spill response team training.
NZRC marine staff participated in the Tier2 desktop exercise “Takahi” at theNorthland Regional Council on 1 June2006. In August, the NZRC MarineController attended National Oil SpillResponse Team training.
All exercises were a success in terms oftraining staff, and retaining familiarisationwith equipment under different weatherand sea conditions. The exercises provide animportant practical element in supportingand implementing the joint oil spillresponse plan.
Environmental Performance
The following sections include a selection ofthe environmental indicators used by theglobal reporting initiative. The indicatorsinclude the use of natural resource inputs,outputs such as discharges and wastes, anda discussion of our effects on theenvironment.
The Company is a major sponsor of the “PohutukawaCoast - Colour the District Crimson” planting project. In excess of 25,000 trees have been planted throughoutNorthland over 15 years.

19
Inputs (Materials, Energy, Water)
Crude and Residue Feedstock(Megatonnes)
5.00
4.95
4.90
4.85
4.80
4.75
4.702002 2003 2004 2005 2006
Total Electricity Usage(including Refinery to Auckland Pipeline)
1.00
Petajoules Gigajoules/Tonne Feedstock
0.95
0.90
0.85
0.80
0.75
0.70
0.20
0.19
0.18
0.172002 2003 2004 2005 2006
Hydrocarbon Fuel Usage
16.0
Petajoules Gigajoules/Tonne Feedstock
15.7
15.4
15.1
14.8
14.5
14.2
3.40
3.20
3.00
2.802002 2003 2004 2005 2006
Water Usage(Megatonnes)
1.70
1.65
1.60
1.55
1.50
1.45
1.402002 2003 2004 2005 2006
Groundwater Extracted for Water Table Depression
(Kilotonnes)
500
475
450
425
400
375
3502002 2003 2004 2005 2006
Groundwater is extracted as part of thewater table depression system to preventany hydrocarbon in groundwater fromleaving the site. All extracted groundwater is treated and then discharged.Hydrocarbons removed during thetreatment process are recycled for use in the refining process. Water is currently notrecycled for use on site.
Outputs (Discharges, Emissions, Waste)
Discharges to Air
There are three main discharge points foremissions to air from our site. These are the“A” Block stack, the multi flue stack, andthe flare system. The discharges aremonitored for a wide range ofcontaminants. Two of special interest aresulphur and carbon dioxide, due to theirimpact on the environment.
Sulphur dioxide is formed from thecombustion of hydrocarbon fuels thatcontain sulphur, and from processes in theRefinery that remove sulphur fromintermediate products.
To substantially reduce potential sulphurdioxide emissions from non combustionsources, sulphur is recovered from theprocess using the Sulphur Recovery Unit(SRU) and Shell Claus Offgas Treatment(SCOT) units, which together wereestimated to be 99.58 percent efficient inremoving sulphur from our discharges in2006. Recovered sulphur is used in thefertiliser industry.
Sulphur Dioxide Emissions
4500
S02 Tonnes % Mass S02 to Feedstock
4250
4000
3750
3500
3250
3000
0.10
0.08
0.06
0.042002 2003 2004 2005 2006
Our resource consent has several conditionsthat limit the emission of sulphur dioxide.One of these conditions limits our yearlyaverage emission of sulphur dioxide to 12tonnes per day. However, the otherconditions allow for variations in ourprocesses such as plant upsets, start-upsand trips, by allowing us to discharge athigher rates for limited periods of time.
The following table shows the rate and thecorresponding amount of time availableunder the consent, and our end of yearposition. The remaining time available atthe end of this year reconfirms ourcommitment to compliance.
Discharge rate as a one hour rolling
average (tonnes/day)
Consent limitallowable time
per year (hours)
2006 end of year position
(hours available)
Monitored ambient sulphur dioxide levelsover the year, at all three sites in theWhangarei Heads area, remained below theMinistry for the Environment’s NationalEnvironmental Standards.
Increases in fuel and electricityconsumption and CO2 emissions, reflectthe increased energy demands of operatingthe Future Fuels plant that came on-streamnear the end of 2005.
Carbon Dioxide Emissions(Megatonnes)
1.20
1.16
1.12
1.08
1.04
1.00
0.962002 2003 2004 2005 2006
Amount of Flare(% Mass of Feedstock)
0.05
0.04
0.03
0.02
0.01
0.002002 2003 2004 2005 2006
> 40.8 8.76 3.77
> 30.0 87.60 40.92
> 24.0 876.00 767.4

20
E n v i r o n m e n t a l R e p o r t i n g
Discharges to Water
All of the wastewater from process units, storm water, the effluentwater treatment plant, and the groundwater recovery system iscollected in the storm water basin prior to discharge. The wastewateris monitored on a daily basis for a range of contaminants such asthose indicated in the following table. Conditions of our resourceconsent to discharge wastewater into the Whangarei harbourcontain strict limits on the quality of the discharge.
Resource Consent Limits on Discharges to Water Daily Max. 30 Day Average
pH range 6-9 n/a
Temperature Max. 37°C n/a
Biochemical Oxygen Demand (BOD5) 70 mg/l 40 mg/l
Total Suspended Solids (TSS) 50 mg/l 30 mg/l
Chemical Oxygen Demand (COD) 540 mg/l 280 mg/l
Total Petroleum Hydrocarbons (TPH) 12 mg/l 6 mg/l
Phenols 0.5 mg/l 0.15 mg/l
Ammonia 85 mg/l 40 mg/l
Sulphides 0.5 mg/l 0.15 mg/l
Discharges to Water Kg/Year
Total Suspended Solids (TSS) 57,720
Oil 1,225
Sulphide 141
Phenol 433
Ammonia (NH3/NH4 as N) 18,706
BOD5 47,816
Chemical Oxygen Demand (COD) 197,685
Total Organic Carbon (TOC) 36,309
Total Water discharged (m3) 4,326,301
Percent sent to Municipal Treatment Facility 0.274%
Over the last few years theCompany has taken severalactions to ensure compliancewith resource consentconditions. While we havenot yet reached our goal ofhaving nil non-compliances,we are continuouslyimproving.
The graph (right) indicatesprogress to date.
Excursions above MonitoredConsent Conditions (Water) TSS Phenols Sulphides Total
Daily limit non-compliance 3 1 1 5
Monthly average limit non-compliance 0 0 0 0
Total 3 1 1 5
Non-Compliances (Water)
50
40
30
20
10
02003 2004 2005 2006
NZRC has a policy of proactive co-operation with the NorthlandRegional Council on all environmental issues. No formalenforcement action was taken against the Company in 2006.
The total mass of selected contaminants discharged during the yearis as follows:
Above and below: Staff participating in a site-wide clean up prior to Christmas.

21
E n v i r o n m e n t a l E f f e c t s
With the exclusion of occasional odour and visual smokecomplaints, ongoing Northland Regional Council and NZRC selfmonitoring did not identify any significant adverse effects on theenvironment from our operations. A comprehensive and ongoingsuite of testing and monitoring covering shellfish, soils, marinesediments, water quality, air quality, and vegetation is in place.
Waste Management Summary
Landfill Disposal Tonnes
Sludge 414.34
Carbon 1,270.72
Carbon Bags 0
Refractory 0
Domestic Waste 182.29
Wood 113.29
Concrete 0
Site Clean-up 51.72
Bitumen Drums 14.02
Garnet 0
Alumina Catalyst 18.46
Total Landfill Disposal 2064.84
Recycle Disposal Tonnes
Paper 7.4
Wood Pallets 0
Steel 178.67
Aluminium 3.98
Total Recyle Disposal 190.05
Total Waste Disposal 2002 2003 2004 2005 2006
Landfill (tonnes) 1,994 2,643 2,317 2,736 2,065
Recycle (tonnes) 163 246 413 232 190
Complaints Received 2002 2003 2004 2005 2006
Complaints 8 17 24 11 10
The Refinery has a large physical operational footprint of 1.195square kilometres and actively manages the site and its surrounds.NZRC also operates the Refinery to Auckland pipeline (RAP) thatconveys products produced by the Company to Wiri in SouthAuckland. The length of this pipeline is almost 170 km and itprovides both an energy efficient and safe way of transportinghydrocarbons.
Environmental Improvement
The Company continued its sponsorship for restoration of nativeplants such as the Pohutukawa, under Project Crimson.
Once more, the New Zealand dotterel, which co-exists with refineryoperations, has had a successful breeding season with numerousnesting pairs and chicks being observed on site. NZRC is proactivein taking steps to avoid the disturbance of this endangered speciesthat is listed on the International Union for Conservation of Natureand Natural Resources (IUCN) Red List.
On 10 November, in an event unrelated to NZRC operations, thefirst of two mass whale strandings occurred near the Refinery. Thesecond stranding , occurred at Uretiti beach, which is located furtherSouth in Bream Bay.
A co-ordinated rapid response to the first stranding was organisedby NZRC staff and contractors. 40 pilot whales were refloated by ateam that consisted of Department of Conservation, NZRC andNZRC contractors, Iwi and other volunteers. Tragically 37 whaleswere found to be deceased and were buried nearby, in accordancewith local Iwi custom. Efforts were also made to keep whales thathad not yet stranded, as well as those that had been refloated, fromstranding once more.
NZRC staff and contractors gave a very good account of themselvesduring the entire operation.
Environmental Expenditure
The expenditure on the operation of the Environmental Departmentfor 2006 was $388,254 ($448,537 in 2005). In addition, there issignificant expenditure on operating and maintainingenvironmental protection systems as part of normal refineryoperations.
“As an ardent conservat ion is t , I f ind i t odd to be
pra is ing heavy indust ry in th is way. I sense a
s t rong measure of k iwi pr ide goes in to mainta in ing
the sp ic and span s tandard out there .” Wade Doak - October 2006
The endangered New Zealand Dotterel co-exists with refinery operations.

“ We earn our l i cence to operate bybalanc ing the in teres ts o f a l ls takeholders and mainta in ingpract ices that meet h igh eth ica land soc ia l s tandards .”

S o c i a l Pe r f o r m a n c e
T h e N e w Z e a l a n d R e f i n i n g C o m p a n y L i m i t e d

24
H u m a n R e s o u r c e s
Employees of the New Zea land Ref in ing Company
enjoy exce l lent work ing condi t ions . The Ref inery s i te
i s located on the edge of a beaut i fu l harbour wi th
the impos ing Whangare i Heads in the background.
As New Zealand’s only oil refinery, NZRC isin the unique position of offeringtechnically challenging employment in theoil industry to local and internationalapplicants in a variety of trades andprofessions.
The Company rewards its employees withcompetitive benefits and remunerationpackages and ensures that relevant trainingand support programs are in place.Management and leadership skills aredeveloped within the organisation on ateam basis. This, together with the existenceof a planned succession program, ensuresthat employees have the opportunity toadvance along their chosen career paths.
Collective Agreement and Employee Relations
NZRC has a positive and constructiveworking relationship with the unions whorepresent employees (the Engineering,Printing and Manufacturing Union and theNational Distribution Union). Employeescovered by collective agreements on the siteinclude Operators, Electricians, EmergencyServices Personnel , Fitters and InstrumentTechnicians. The Instrument Technicians sitoutside the site Co-Joint Agreement andhave their own collective agreement. TheCo-joint employer and employeerepresentatives and union officials meetmonthly to discuss, understand andprogress issues and initiatives arising fromthe employment relationship.
In December the Co-Joint collectiveagreement was signed for a two-year term.The negotiation process was carried out inaccordance with the provisions of goodfaith as contained in the EmploymentRelations Act. Members of the Co-jointreceived a five percent pay increase for the2006/2007 year and will receive a furtherfive percent increase for the 2007/2008 year.The Instrument Technician group collectiveagreement expires in April 2007.
The Company complies with theInternational Labour Organisation (ILO)principles to ensure that fair and equitablepractices are in place for all employeematters. In 2006 no personal grievance
claims, as provided for under theEmployment Relations Act 2000, were filedagainst the Company.
NZRC gives no specific training on humanrights; however this subject is covered in the“first line management” trainingundertaken by managers and supervisors.
The Company acknowledges theindividual’s right to freedom of associationand, in accordance with the EmploymentRelations Act, all employees have thefreedom to choose whether or not to join,or form, a union. No preferential treatmentis applied whether an employee is, or is not,a member of a union.
Other activities involving personnelundertaken during 2006 include:
• A drug and alcohol policy wasintroduced and procedures to supportthis policy were implemented.
• The investigation of an alternative work-hours structure was progressed in 2006.This included consultation with all staffand will be completed in 2007.
Employee Numbers
As at 31 December 2006, the Groupemployed 346 people (December 2005 317),of which 165 (48%) were covered by acollective agreement. 181 (52%) were onindividual employment agreementsincluding five seconded from Shell to fillspecialist positions. The Company has sevenpeople on overseas assignments for careerdevelopment. Five tertiary students workedwith various teams on site during theirsummer break from studies.
Contractor Numbers
Transfield Worley NZ (TWNZ) manages asignificant portion of on-site engineeringand maintenance activities. The number ofcontractors needed to carry out theseactivities varies from time to timedepending on workloads. Measurement ofthe contractor numbers in terms of “fulltime equivalents” (FTEs) are: 2006, 230FTE’s at the Refinery (285 in 2005).
S o c i a l P e r f o r m a n c e
Owen Gatman, Refinery Operator and Grant Powell, Off-plots Engineering Controller.

$000s 2006 2005
100-109 39 41
110-119 34 29
120-129 23 20
130-139 8 9
140-149 2 8
150-159 4 3
160-169 – –
170-179 – –
180-189 1 –
190-199 – –
200-209 – 1
25
Recruitment, Retention and Selection
The Company is committed to the principles of equal employment opportunity. Reviews arecarried out to ensure that all of our employment related decisions are made on the basis ofsuitability for the job function, not on the basis of personal characteristics unrelated toability.
There were 55 new starters in 2006 (2005: 37) 2006 2005
Permanent positions 36 20
Fixed term appointments 13 11
Apprentices 2 2
Project staff 4 4
37 employees left the Company in 2006 (2005: 31) 2006 2005
Resignations 19 13
End of fixed term appointments 11 13
Overseas assignment 1 1
Retirement 4 1
Disability 1 1
Death in service 1 1
On maternity leave - did not return – 1
Employee turnover (number of leavers for the year / average number of staff for the year) in2006 was 12.5% (10.8% in 2005). The Company’s expectation is for employee turnover to bearound 10 percent.
Absenteeism
Absenteeism, which includes time off for sickness, special discretionary leave and ACCrecovery is not a significant issue for the Company with the same number as the previousyear of 3.6% being recorded (3.6% in 2005).
Remuneration and Recognition of Employees
The number of employees in the Group (not including Directors) whose remunerationexceeded $100,000 is as follows:
$000s 2006 2005
210-219 – 1
220-229 2 –
240-249 – 1
300-309 1 1
310-319 1 –
340-349 – 1
380-389 – 1
410-419 1 –
430-439 1 –
750-759 1 –
840-849 – 1
2002 2003 2004 2005 2006$000 $000 $000 $000 $000
Payroll and employee benefits 26,554 29,041 32,206 34,734 36,861
Current payroll and benefits paid to employees (excluding provisions for future benefits):
The annual salary review process for all staff is carried out in December.
Samantha Samuel, Refinery Scheduler.

26
S o c i a l P e r f o r m a n c e
Personal Development and Technical Training
The Company has a comprehensiveperformance, development and appraisalsystem in place. The process, which alignsaspects of personal development andbusiness goals, is undertaken formally withmanagers three times a year, which includesfirstly setting objectives and then tworeviews.
The greater focus on leadership,management and supervisory development,which began in 2003, has continued in 2006in the following areas:
Leadership Development
The leadership theme for 2006 was peopledevelopment. The extended leadershipgroup progressed this theme throughoutthe year with monthly meetings as well as anumber of initiatives to support awarenessand understanding including:
• The Leadership Away Days at Waitangi(and a follow up session in Tutukaka)which was facilitated by HumanSynergistics International, who providedall extended leadership group memberswith behavioural profiles resulting from360° review questionnaires.
• A presentation by All Blacks assistantcoach, Steve Hansen, on his perspectiveof the dysfunctions and potentialstrengths of team work as well asfielding some questions on the AllBlacks.
• Provision of the autobiography of LanceArmstrong called “It’s Not About theBike”, which provides detail about hispersonal challenges in becoming acycling champion and his battle withcancer.
Training and Competency Management
Staff competencies and training records aremaintained on a central application whichis used as a management tool to ensure thatall employee skills are monitored on aregular basis and any needs are addressed.
Apprentices
Two new apprentices started as part ofNZRC’s formalised commitment to recruitat least two apprentices every year. Thisbrought the total number of apprentices toseven.
Induction Program
A comprehensive, formalised program is in place.
Graduate Development
A roadshow, promoting the NZRCemployment brand to chemical andmechanical students at Massey, Aucklandand Canterbury Universities was made inAugust. Two chemical and two mechanicalgraduates were recruited as a result. Aprogramme is in place to ensure that thefull potential of graduates is realised.
Other Development and Training
• All staff and contractors receivedtraining and awareness of the dangers ofmethamphetamine.
• A standardised succession and careerplanning / high potentials identificationsession was carried out in August.
Conflicts of Interest
An extract from NZRC’s business principlesclearly sets out the Company’s position:
“The Company insists on honesty, integrity andfairness in all aspects of our business and expectthe same in our relationships with all those withwhom we do business. The direct or indirect offer,payment, soliciting and acceptance of bribes inany form are unacceptable practices. Employeesand directors must avoid conflicts of interestbetween their private financial activities and theirpart in the conduct of Company business.”
Other Employees Benefits/Practices • Additional leave is available at
management discretion over and aboveany contractual or statutoryrequirements.
• Disability and retirement funding isavailable for those in the pension fundor the staff superannuation plan.
• Some existing employees are entitled tofour weeks annual leave, contributionsto healthcare, long service leave andretirement bonuses.
• The Company supports study towardsformal qualifications.
• State of the Company meetingscommunicate to staff and contractorssafety and operational issues.
• Recognition of long service.Long service milestones included:
– 0 staff celebrating 30 years of service(2 in 2005)
– 15 staff celebrating 25 years of service(3 in 2005)
– 30 staff celebrating 20 years of service(29 in 2005)
– 1 staff celebrating 15 years of service(1 in 2005).
“Our people cover a wide
range of professions,
trades and other ski l ls
that ensure the smooth
running and maximum
uti l isat ion of our assets
to generate very good
returns.” Ian Farrant, Chairman.

27
Community Support
NZRC is strongly committed to the well being of the local community and contributes to anumber of initiatives and activities including:
Science Fair $7,500
Project Crimson $5,000
Northland Road Safety $5,000
Whangarei Heads Citizen for publication of newsletter $500
Coastguard $15,000
In maintaining its longstanding relationship with Patuharakeke Iwi, the Company awardedits 2006 tertiary study grant of $3000 to Adam Donaldson, the son of an employee. Adamwill use the funds progressing his studies towards his Bachelor of Science degree, majoring inprocess engineering and materials. Scholarships were also provided to Smitha Nathen who isattending Auckland University and Sandi Galpin who is attending Massey University.
A staff initiative realised $1200 for Daffodil Day. This was realised from a combination ofgate collections ($760) and head shaving ($440).
A number of computers that were surplus to the Company’s requirements were given to localschools.
Staff Support and Leisure
A total of $12,000 was provided for employee sponsorship and various other activities suchas the Kerikeri Half Marathon, the Company Golf Tournament, twilight hockey, soccer andrugby, Kensington Fitness Centre and the “Beach to Basin Fun Run”. Included in this totalwas sponsorship for Mike Gowing, a long-serving employee, who represented New Zealand atthe World Age Group Triathlon in Lucerne, Switzerland. Mike finished 9th in his age groupevent, which is an outstanding achievement.
In addition, the Company subsidises member subscriptions to the NZRC sports and socialclub. This year the club had a very active year and offered discounted or free entry to itsmembers (including retirees) and their partners to such activities as:
• Entertainment including night trots at Alexander Park; Rainbows End; Cirque Rocks.
• Events including Girls Day Out; Big Boys Toys; Ellerslie Flower Show.
• Shows including Dirty Dancing; Stomp; Burn the Floor.
• Concerts including Bic Runga; Cliff Richards; Tom Jones.
• Sporting events including rugby match attendance – Blues vs Chiefs; V8 Supercars.
• Other activities such as movies; Hospice Ball; Ascension Vineyards trip; Spring Fever Disco.
The Company also provides an independent professional counseling service and an on-siteindustrial chaplain for employees.
Political Activities
An extract from NZRC’s business principles clearly sets out the Company’s position:
“We do not make payments to political parties, organisations or their representatives or take any part inparty politics. However, when dealing with governments, NZRC has the right and the responsibility tomake its position known on matters which affect the Company, its employees, customers or shareholders.NZRC also has the right to make its position known on matters affecting the community, where it has acontribution to make. Of employees: Where individuals wish to engage in activities in the community,including standing for election to public office, they will be given the opportunity to do so where this ispractical in relation to their job.”
Each year NZRC receives visits by representatives of government, various political parties andother interested individuals to discuss issues relevant to the Company.
Peter McCartain, Laboratory Technician.

28
S a f e t y a n d S e c u r i t y
S o c i a l P e r f o r m a n c e
Per forming wel l in the areas of sa fety and secur i ty i s
o f the utmost importance to NZRC. We are commit ted
to c reat ing an env i ronment where everyone work ing
on our s i te goes home at the end of each workday,
safe and secure .
The NZRC staff and contractor workforce at all levels are displaying a real desire to drive oursafety and security performance forward and are supported by a dedicated safety, emergencyservices and security team.
Achievements and Results
During 2006 the Company demonstrated that its historically cyclic safety performance trendcould be arrested and that the improved performance since 2002 can be sustained. 2006 alsosaw the achievement of a record number of hours worked on site since incurring a lost timeinjury (in excess of 2.9 million).
The graph below indicates the number of total recordable cases (TRC’s) including lost timeinjuries (LTI’s), restricted work cases (RWC’s) and medical treatment cases (MTC’s) permillion hours worked since 1988.
Health Safety Emergency Steering Committee
The HSE Steering Committee continued to be active in many areas of HSE managementduring 2006. The committee consists of a combination of elected employee representativesand nominated management representatives who work together to promote HSE and HSEinitiatives across the site. They work both within their representative groups and across thesite to address areas of concern or areas identified for improvement. The HSE SteeringCommittee includes contractor representatives. A significant achievement of the committeein 2006 was the development of a site policy and supporting process for drug and alcoholtesting for the NZRC site. This process complimented the existing pre-employment drugscreening. The committee had active involvement in reducing vehicle access to the sitehelping to create a safer work environment.
5
10
15
20
25
30
35
40
45
TRCF
01988 1990 1991 1992 1993 1994 1995 1996 1997 1998 1999 2000 2001 2002 2003 2004 2005 20061989
TRCF NZRC TRCF NZRC Trend TRCF CONTRACTORS TRCF CONTRACTORS Trend
Safety Performance 1988 - 2006

29
Health and Safety Checks
During 2006, 148 formal health and safetychecks were conducted by a cross section ofstaff and contractors. The checks aredesigned to reinforce positive behavioursand conditions, as well as to provide anopportunity to identify and correct “at risk”elements of jobs. They also provide a goodopportunity for positive interactionamongst a wide cross section of trades androles.
A summary of the 2006 checks is as follows:
• 285 positive areas were identified andreinforced with the workgroups involved.
• 107 items for improvement, where apotential “at risk” condition existed werenoted.
• 106 actions were established to addressimprovement areas.
A breakdown of “At Risk” categoriesidentified is tabulated below:
Personal Protective Equipment 19
Positions of People 8
Ergonomics 5
Tools and Equipment 20
Procedures 30
Orderliness 25
QHSE Days
In alignment with the Company’s vision ofgoing “from good to great” a series of“QHSE days” were held over a period ofeight days. All site staff and contractorsparticipated. Topics covered during the dayswere presented by internal staff membersand by external speakers. The topicsincluded:
• Safety planning and assessment.
• Permit to work improvement update.
• Site radiation.
• The professional approach-getting itright the first time.
• Talking rubbish (waste management).
• Protecting people and businesses frommethamphetamine.
• Overcoming adversity.
• The triathlete approach.
Emergency Services
The Company recognises the importance ofhaving a well trained specialist emergencyresponse team on site. This was clearlydemonstrated in 2006 where several keyachievements and investments allowed theemergency services team to grow anddevelop in their capability as a department.
Highlights for the year included:
• Introducing a full time dedicatedemergency services trainer and shiftemergency serviceman.
• Establishing an emergency servicessecond-in-charge position. This is a keyposition that will assist in thedevelopment of the department.
• Successfully completing the first stage ofa three stage project to upgrade theexisting firemain system on site.
• Providing specialist petrochemical firefighting training.
• A number of the team successfullycompleted their Level Two NationalCertificates in fire and rescue services.Eight members of the team are nowqualified in Urban Search and Rescue.The NZRC emergency services team iscurrently the only team north ofAuckland to hold this qualification.
• Installation of a “hose layer” on one ofthe Company fire appliances has allowedthe capability for 1.5km of 5” hose to berapidly deployed and retrieved.
• Purchase of a new “Heartstart” machine.
• One of the Company Incident ControlPoints was upgraded to enhance inter-agency communications and incidentcontrol.
• Completing a number of plannedemergency exercises which included theinvolvement of external agencies.
Security
On site security remains a high priority forthe Company. This was demonstrated by anincrease in the levels of personnel providedby a specialist security provider and tightercontrols for vehicle access to the site. Portsecurity was also improved with accesscontrol into the marine area enhanced.
Learning and Development
2006 saw significant involvement of NZRCin the establishment of a health and safetytraining organisation to support theNorthland region. The Northland TrainingAlliance (NTA) is an industry basedorganisation owned, operated, and managedby a number of companies within theNorthland region in conjunction withNorth Tec. The NZRC’s Chief ExecutiveOfficer chairs the board of the NTA whoserole is to provide direction and governanceto the venture. An NZRC Safety Advisor hasbeen dedicated to the development of NTAfor 50% of his time.
The objective of NTA is to lift employeeslevel of health and safety skills andcompetence across the Northland region.This will benefit all core industries whendrawing on labour pools for project work,routine maintenance, shut-downs and day-to-day operations.
A building in Whangarei was leased byNorth Tec in November 2006. It is beingdeveloped as a learning, assessment anddisplay centre with completion scheduledfor early March 2007. Formal training hasalready commenced. It is envisaged that by2009 the majority of personnel who workon the NZRC site, that are drawn from thelocal labour pool, will have completed twodays training resulting in an NZQACertificate in Applied Work Practices.
Peter Owbridge, Refinery to Auckland Pipeline Controller.

30
The Company has a comprehens ive occupat ional
hea l th management sys tem that inc ludes at tendance
on s i te by an occupat ional hea l th spec ia l i s t on a par t
t ime bas is and the prov is ion of fu l l t ime nurs ing s ta f f.
Company emergency services personnel are trained to pre-hospital care standard and providean on-site, fast response capability on a 24-7 basis. All injuries and occupational illnesses arerecorded, classified and reviewed.
The Company continued at tertiary level in the ACC Partnership Programme in 2006. Nooccupational illnesses were recorded in 2006.
The following figures provide an overview of the occupational health team activities during 2006:
Activity 2006 2005
Health monitoring/medicals 408 399
Ergonomic assessments 98 20
Consultations (Dr/Nurse) 3,215 1695
Vaccinations 125 38
Hearing loss assessment claims 4 3
Rehabilitation, monthly 6 18
Massage therapy 530 Not recorded
Specific health focus areas targeted during the year included:
• Noise / Hearing Loss CampaignPosters, handouts and training continue to be provided to specific work groups on theimpact of noise and hearing loss and the effective prevention methods.
• Drugs / Alcohol TestingPre-employment drugs and alcohol medical screening continued in 2006.
• Mole ChecksMole checks were carried out for personnel on site as requested and at specific intervalsduring the year.
• Flu VaccinationsVaccinations were offered to staff as part of an ongoing wellness and preventionprogramme.
• Massage TherapistEach month the massage therapist has attended site and treated staff. This has beeneffective in reducing the likelihood of escalation of both work and non-work relatedconditions.
• Stress AwarenessThe occupational health team staff assisted in delivering stress awareness training duringthe “QHSE Days” to over 700 site personnel.
HIV/Aids/Hepatitis
The Company does not have a specific policy to cover this health aspect. Legislation in NewZealand prohibits discrimination and the Company respects the rights of the individuals inthis regard and therefore does not treat these diseases any differently from that of any otherhealth issue. All first aid personnel are trained in how to take precautionary measures againstexposure.
O c c u p a t i o n a l H e a l t h M a n a g e m e n t
S o c i a l P e r f o r m a n c e

31
Q u a l i t y a n d C o m p l i a n c e
S o c i a l P e r f o r m a n c e
Extrinsic Audits
The following extrinsic audits of theCompany’s quality management systemswere completed by third party bodiesduring 2006:
• Jet A1 Manufacture.
• Operation and maintenance of theRefinery to Auckland pipeline.
• ISO 9001 Quality Systems surveillanceaudit covering various areas.
• ISO 14001 Environmental Systems re-certification audit.
• ISO 9001 Environmental Systems re-certification audit.
• ISO 14001 Environmental Systemscertification audit for the Refinery toAuckland pipeline.
• HSNO compliance.
• Metrology and calibration for hydrotestgauges and relief valves.
• Inspection body.
• ACC Partnership Programme.
All issues arising from the audits haveeither been addressed or are planned to beaddressed according to priority andresources.
The highlights for the year in relation toextrinsic audits were:
• Re-certification to ISO 9001: 2000 forthe Refinery, valid for next three years.
• Re-certification to ISO 14001: 2004 forthe Refinery, valid for next three years;
• New first time certification to ISO 14001for the Refinery to Auckland Pipeline,valid for next three years.
Internal
The 2006 corporate internal audit schedulewas developed around a risk basedapproach and focused on key departments,functions and processes. With the ongoingdevelopment of the Company InternalAudit Unit (IAU) and the enthusiasm of theIAU team members, the standard of auditshas improved significantly. When viewed inconjunction with the scope of the extrinsicaudits previously listed above, goodcoverage of the total quality system hasbeen achieved.
An improved, centralised managementreview process was implemented in 2006.This approach superseded the old QualityManagement Steering Committee (QMSC)review. Several areas for improvement havebeen identified and corrective andpreventive action is planned for 2007,including a major quality improvementproject (QIP).
External
The Company completed two externalaudits during 2006, focused on areas inwhich NZRC has direct interests. The twoaudits were on Wiri Oil Services Limitedand Independent Petroleum LaboratoriesLtd (a subsidiary of NZRC), both partiesprovided full and open co-operation.
“NZRC is a company of talented and committed people
who have al l contr ibuted to the impressive f inancial
results we have achieved this year.” Jerome Kerr igan, CEO.
The Company i s commit ted to mainta in ing
management sys tems to the requi rements o f
Occupat ional , Hea l th and Safety (NZS 4801) ,
Env i ronment ( ISO 14001) and Qual i t y ( ISO 9001) ,
embedding cont inuous improvement processes .

“ 2006 has been a st rongf inancia l year for NZRC, due largely to the Ref inerycapita l i s ing on the gapbetween crude pr ices andproduct pr ices .”

E c o n o m i c Pe r f o r m a n c e
T h e N e w Z e a l a n d R e f i n i n g C o m p a n y L i m i t e d

34
A u d i t o r s ’ R e p o r tFor the Year Ended 31 December 2006
T h e N e w Z e a l a n d R e f i n i n g C o m p a n y L i m i t e d
Auditors’ Report
To the shareholders of The New Zealand Refining Company Limited
We have audited the financial statements on pages 35 to 72. The financial statements provide informationabout the past financial performance and cash flows of the Company and Group for the year ended 31 December 2006 and their financial position as at that date. This information is stated in accordance withthe accounting policies set out on pages 40 to 44.
Directors’ Responsibilities
The Company’s Directors are responsible for the preparation and presentation of the financial statementswhich give a true and fair view of the financial position of the Company and Group as at 31 December 2006and their financial performance and cash flows for the year ended on that date.
Auditors’ Responsibilities
We are responsible for expressing an independent opinion on the financial statements presented by theDirectors and reporting our opinion to you.
Basis of Opinion
An audit includes examining, on a test basis, evidence relevant to the amounts and disclosures in the financialstatements. It also includes assessing:
(a) the significant estimates and judgements made by the Directors in the preparation of the financialstatements; and
(b) whether the accounting policies are appropriate to the circumstances of the Company and Group,consistently applied and adequately disclosed.
We conducted our audit in accordance with generally accepted auditing standards in New Zealand. Weplanned and performed our audit so as to obtain all the information and explanations which we considerednecessary to provide us with sufficient evidence to give reasonable assurance that the financial statementsare free from material misstatements, whether caused by fraud or error. In forming our opinion we alsoevaluated the overall adequacy of the presentation of information in the financial statements.
We have no relationship with or interests in the Company or any of its subsidiaries other than in our capacityas auditors.
Unqualified Opinion
We have obtained all the information and explanations we have required.
In our opinion:
(a) proper accounting records have been kept by the Company as far as appears from our examination ofthose records; and
(b) the financial statements on pages 35 to 72:
(i) comply with generally accepted accounting practice in New Zealand;
(ii) comply with International Financial Reporting Standards; and
(iii) give a true and fair view of the financial position of the Company and Group as at 31 December 2006and their financial performance and cash flows for the year ended on that date.
Our audit was completed on 2 March 2007 and our unqualified opinion is expressed as at that date.
Chartered Accountants Auckland
PricewaterhouseCoopers188 Quay StreetPrivate Bag 92162Auckland 1142New ZealandTelephone +64 9 355 8000Facsimile +64 9 355 8001www.pwc.com/nz

35
I n c o m e S t a t e m e n t sFor the Year Ended 31 December 2006
T h e N e w Z e a l a n d R e f i n i n g C o m p a n y L i m i t e d
Income
Operating revenue 403,694 396,179 402,549 394,874
Total income 3,4 403,694 396,179 402,549 394,874
Expenses
Purchase of process materials and utilities 44,488 37,512 44,753 37,265
Materials and contractor payments 26,237 20,583 25,318 20,192
Wages and salaries 33,924 31,434 31,455 29,367
Depreciation, amortisation and disposal costs 56,474 39,948 56,130 39,635
Administration and other expenses 40,560 20,840 42,646 23,150
Profit before finance costs 202,011 245,862 202,247 245,265
Finance (income)/costs (241) 4,556 (271) 4,537
Profit before income tax 4 202,252 241,306 202,518 240,728
Less income tax 5 66,779 79,586 66,779 79,383
Profit after tax 135,473 161,720 135,739 161,345
Loss/(Profit) attributable to minority interest 69 (170) – –
Profit attributable to shareholders of The New Zealand Refining Company Limited 135,542 161,550 135,739 161,345
Earnings per share for profit attributable to the shareholders of the Company: Cents Cents Cents Cents
Basic and diluted earnings per share 6 56.4 67.4 56.6 67.2
G R O U P PA R E N T
2006 2005 2006 2005Note $000 $000 $000 $000
The above Income Statements are to be read in conjunction with the notes on pages 40 to 72.

36
C o n s o l i d a t e d B a l a n c e S h e e t sAs at 31 December 2006
T h e N e w Z e a l a n d R e f i n i n g C o m p a n y L i m i t e d
G R O U P PA R E N T
2006 2005 2006 2005Note $000 $000 $000 $000
ASSETS
Current assets
Cash and cash equivalents 7 12,020 4,642 11,988 4,490
Derivative financial instruments 8 – 2,222 – 2,222
Trade and other receivables 9 105,867 119,268 105,519 119,032
Consumable stores and spares 10 35,711 12,302 35,619 12,209
Loan to subsidiary 25 – – 500 167
Total current assets 153,598 138,434 153,626 138,120
Non-current assets
Property, plant and equipment 11 670,298 693,123 669,197 691,983
Investment property 12 4,250 2,450 4,250 2,450
Intangible assets 13 1,846 2,758 1,846 2,758
Pension assets 14 9,081 1,990 9,081 1,990
Derivative financial instruments 8 – 1,749 – 1,749
Shares in subsidiary 25 – – 809 809
Total non-current assets 685,475 702,070 685,183 701,739
TOTAL ASSETS 839,073 840,504 838,809 839,859
LIABILITIES
Current liabilities
Bank overdraft 7 22 31 22 31
Trade and other payables 15 86,170 105,900 86,054 105,874
Income taxation 17 93 765 231 709
Employee entitlements 3,759 4,299 3,759 4,299
Derivative financial instruments 8 513 – 513 –
Total current liabilities 90,557 110,995 90,579 110,913
Non-current liabilities
Bank borrowings 16 – 40,040 – 40,040
Deferred taxation 18 124,640 126,423 124,640 126,423
Employee entitlements 5,137 4,336 5,137 4,336
Provision for restoration costs 19 3,129 3,070 3,129 3,070
Derivative financial instruments 8 3,102 – 3,102 –
Total non-current liabilities 136,008 173,869 136,008 173,869
Total liabilities 226,565 284,864 226,587 284,782
NET ASSETS 612,508 555,640 612,222 555,077
The above Balance Sheets are to be read in conjunction with the notes on pages 40 to 72.

37
C o n s o l i d a t e d B a l a n c e S h e e t sAs at 31 December 2006
T h e N e w Z e a l a n d R e f i n i n g C o m p a n y L i m i t e d
G R O U P PA R E N T
2006 2005 2006 2005Note $000 $000 $000 $000
EQUITY
Contributed equity 20 24,000 24,000 24,000 24,000
Hedge reserve 20 (2,421) 2,604 (2,421) 2,604
Retained profits 20 590,484 528,522 590,643 528,473
Minority interests 20 445 514 – –
TOTAL EQUITY 612,508 555,640 612,222 555,077
Approved by the Board of Directors of The New Zealand Refining Company Limited on 2 March 2007.
For and on Behalf of the Board:
........................................................... ...........................................................Sir Colin Maiden I.F. FarrantDirector Director
The above Balance Sheets are to be read in conjunction with the notes on pages 40 to 72.

38
S t a t e m e n t s o f R e c o g n i s e d I n c o m e a n d E x p e n s e sFor the Year Ended 31 December 2006
T h e N e w Z e a l a n d R e f i n i n g C o m p a n y L i m i t e d
G R O U P PA R E N T
2006 2005 2006 2005Note $000 $000 $000 $000
The above Statements of Recognised Income and Expenses are to be read in conjunction with the notes on pages 40 to 72.
Profit after tax 135,473 161,720 135,739 161,345
Movement in cash flow hedge reserve 20 (7,500) 4,956 (7,500) 4,956
Actuarial gain/(loss) recognised in the pension scheme 14(f) 6,613 (5,557) 6,613 (5,557)
Deferred tax on items recognised directly in equity 5(c) 293 199 293 199
Net gains and (losses) not recognised in Income Statement (594) (402) (594) (402)
Total recognised income for the year 134,879 161,318 135,145 160,943
Attributable to:
Minority interest (69) 170 – –
Equity shareholders of the parent 134,948 161,148 135,145 160,943
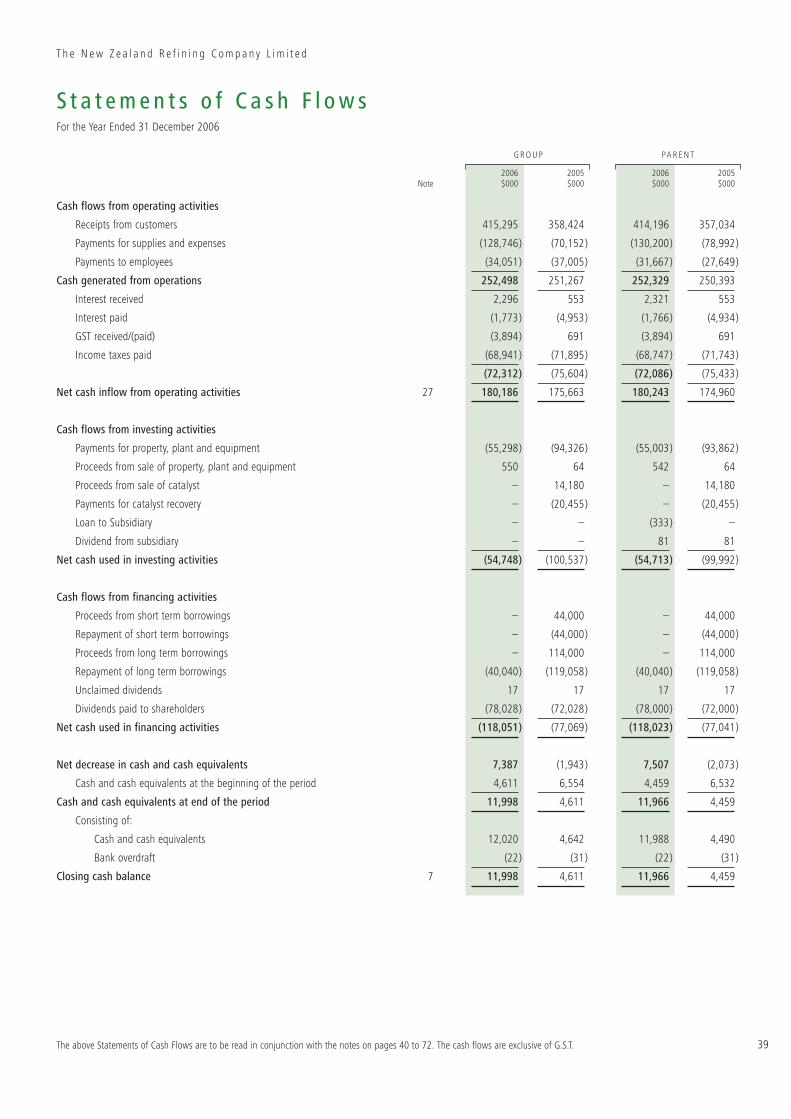
39
S t a t e m e n t s o f C a s h F l o w sFor the Year Ended 31 December 2006
T h e N e w Z e a l a n d R e f i n i n g C o m p a n y L i m i t e d
G R O U P PA R E N T
2006 2005 2006 2005Note $000 $000 $000 $000
Cash flows from operating activities
Receipts from customers 415,295 358,424 414,196 357,034
Payments for supplies and expenses (128,746) (70,152) (130,200) (78,992)
Payments to employees (34,051) (37,005) (31,667) (27,649)
Cash generated from operations 252,498 251,267 252,329 250,393
Interest received 2,296 553 2,321 553
Interest paid (1,773) (4,953) (1,766) (4,934)
GST received/(paid) (3,894) 691 (3,894) 691
Income taxes paid (68,941) (71,895) (68,747) (71,743)
(72,312) (75,604) (72,086) (75,433)
Net cash inflow from operating activities 27 180,186 175,663 180,243 174,960
Cash flows from investing activities
Payments for property, plant and equipment (55,298) (94,326) (55,003) (93,862)
Proceeds from sale of property, plant and equipment 550 64 542 64
Proceeds from sale of catalyst – 14,180 – 14,180
Payments for catalyst recovery – (20,455) – (20,455)
Loan to Subsidiary – – (333) –
Dividend from subsidiary – – 81 81
Net cash used in investing activities (54,748) (100,537) (54,713) (99,992)
Cash flows from financing activities
Proceeds from short term borrowings – 44,000 – 44,000
Repayment of short term borrowings – (44,000) – (44,000)
Proceeds from long term borrowings – 114,000 – 114,000
Repayment of long term borrowings (40,040) (119,058) (40,040) (119,058)
Unclaimed dividends 17 17 17 17
Dividends paid to shareholders (78,028) (72,028) (78,000) (72,000)
Net cash used in financing activities (118,051) (77,069) (118,023) (77,041)
Net decrease in cash and cash equivalents 7,387 (1,943) 7,507 (2,073)
Cash and cash equivalents at the beginning of the period 4,611 6,554 4,459 6,532
Cash and cash equivalents at end of the period 11,998 4,611 11,966 4,459
Consisting of:
Cash and cash equivalents 12,020 4,642 11,988 4,490
Bank overdraft (22) (31) (22) (31)
Closing cash balance 7 11,998 4,611 11,966 4,459
The above Statements of Cash Flows are to be read in conjunction with the notes on pages 40 to 72. The cash flows are exclusive of G.S.T.

40
N o t e s t o t h e F i n a n c i a l S t a t e m e n t sFor the Year Ended 31 December 2006
T h e N e w Z e a l a n d R e f i n i n g C o m p a n y L i m i t e d
Note 1 Summary of Significant Accounting Policies
These financial statements have been prepared in accordance with the New Zealand equivalents to the International Reporting Standards (“NZ IFRS”) andcomply with International Financial Reporting Standards. These Financial Statements were approved by the Directors on 2 March 2007.
(a) Basis of preparation of financial statements
The principal accounting policies adopted in the preparation of these financial statements are set out below. These policies have been consistentlyapplied to all the periods presented.
Entities reporting
The consolidated financial statements for the “Group” are for the economic entity comprising the New Zealand Refining Company Limited (“Parent”) andits subsidiary, Independent Petroleum Laboratories Limited.
The New Zealand Refining Company Limited is incorporated in New Zealand and the registered office is Marsden Point, Whangarei, New Zealand.
The Parent company and the consolidated Group are designated as profit orientated entities for financial reporting purposes.
Statutory base
The New Zealand Refining Company Limited is a company registered under the Companies Act 1993 and is an issuer pursuant to the Securities Act 1978.
The financial statements have been prepared in accordance with the requirements of the Financial Reporting Act 1993 and the Companies Act 1993.
Application of NZ IFRS 1 First-time adoption of New Zealand equivalents to International Financial Reporting Standards (NZ IFRS)
Financial statements of The New Zealand Refining Company Limited until 31 December 2005 had been prepared in accordance with previous NewZealand Financial Reporting Standards (“NZ FRS”). NZ FRS differs in certain respects from NZ IFRS. When preparing The New Zealand RefiningCompany Limited financial statements for the year ended 31 December 2006, management has amended certain accounting and valuation methodsapplied in the previous NZ FRS financial statements to comply with NZ IFRS. The comparative figures were restated to reflect these adjustments.
Reconciliations and descriptions of the effect of transition from NZ FRS to NZ IFRS on equity and its net income are given in note 28.
Historical cost convention
These financial statements have been prepared under the historical cost convention, as modified by the revaluation of certain assets and liabilities asindicated in the specific accounting policies below.
Critical accounting estimates
The preparation of financial statements in conformity with NZ IFRS requires the use of certain critical accounting estimates. It also requiresmanagement to exercise its judgement in the process of applying the Group’s accounting policies.
(b) Basis of consolidation
Group financial statements consolidate the financial statements of the parent and the subsidiary it controls, using the purchase method. All transactionsbetween the parent and the subsidiary are eliminated on consolidation.
(c) Segment reporting
A business segment is a group of assets and operations engaged in providing products or services that are subject to risks and returns that are differentto those of other business segments. A geographical segment is a group of assets and operations engaged in providing products or services within aparticular economic environment and is subject to risks and returns that are different from those of segments operating in other economic environments.
(d) Foreign currency translation
(i) Functional and presentation currency
The financial statements are presented in New Zealand dollars, which is the Group’s functional and presentation currency.
(ii) Transactions and balances
Foreign currency transactions are translated into the functional currency using the exchange rates prevailing at the dates of the transactions.Foreign exchange gains and losses resulting from the settlement of such transactions and from the translation at year-end exchange rates ofmonetary assets and liabilities denominated in foreign currencies are recognised in the income statement, except when deferred in equity asqualifying cash flow hedges.
(e) Revenue recognition
Revenue comprises the fair value for the sale of goods and services, excluding Goods and Services Tax after eliminating sales within the Group. Revenueis recognised as follows:
(i) Processing fee (oil refining)
The processing fee is recognised when the Group has processed products for the customer and collectability of the related receivables is reasonablyassured.

41
N o t e s t o t h e F i n a n c i a l S t a t e m e n t sFor the Year Ended 31 December 2006
T h e N e w Z e a l a n d R e f i n i n g C o m p a n y L i m i t e d
Note 1 Summary of Significant Accounting Policies continued
(ii) Pipeline fee (distribution)
The pipeline fee is recognised when the products have been transferred to the Wiri Oil Services Terminal in South Auckland, in accordance with theterms of the Processing Fee Agreement.
(iii) Wiri Terminal rental
Rental income is recognised on an accruals basis in accordance with the substance of the relevant agreements and in accordance with Note (g)below.
(iv) Interest income
Interest income is recognised on a time proportion basis using the effective interest method.
(f) Income tax
The income tax expense or revenue for the period is the tax payable on the current period’s taxable income based on the New Zealand income tax rateadjusted by changes in deferred tax assets and liabilities attributable to temporary differences between the tax bases of assets and liabilities and theircarrying amounts in the financial statements, and to unused tax losses.
Deferred tax assets and liabilities are recognised for temporary differences at the tax rates expected to apply when the assets are recovered or liabilitiesare settled, based on those tax rates which are enacted or substantively enacted. The relevant tax rates are applied to the cumulative amounts ofdeductible and taxable temporary differences to measure the deferred tax asset or liability. An exception is made for certain temporary differencesarising from the initial recognition of an asset or liability. No deferred tax asset or liability is recognised in relation to these temporary differences if theyarose in a transaction, other than a business combination, that at the time of the transaction did not affect either accounting profit or taxable profit orloss.
Deferred tax assets are recognised for deductible temporary differences and unused tax losses only if it is probable that future taxable amounts will beavailable to utilise those temporary differences and losses.
Current and deferred tax balances attributable to amounts recognised directly in equity are also recognised directly in equity.
(g) Leases
Finance leases, under which the Group assumes substantially all of the risks and benefits incident to ownership of the leased item, are capitalised at thepresent value of the minimum lease payments. Lease payments are apportioned between finance charges and lease principal.
Leases in which a significant portion of risks and rewards of ownership are retained by the lessor are classified as operating leases. Payments madeunder operating leases (net of any incentives received from the lessor) are charged to the Income Statement on a straight line basis over the period ofthe lease.
When assets are leased out under an operating lease, the asset is included in the balance sheet as property, plant and equipment. Lease income isrecognised over the term of the lease on a straight line basis.
(h) Impairment of non-financial assets
Assets are reviewed for impairment whenever events or changes in circumstances indicate that the carrying amount may not be recoverable. Animpairment loss is recognised for the amount by which the asset’s carrying amount exceeds its recoverable amount. The recoverable amount is thehigher of an asset’s fair value less costs to sell and its value in use. For the purposes of assessing impairment, assets are grouped at the lowest levelsfor which there are separately identifiable cash flows (cash generating units).
(i) Cash and cash equivalents
Cash and cash equivalents includes cash on hand, deposits held at call with financial institutions, other short-term, highly liquid investments withoriginal maturities of three months or less that are readily convertible to known amounts of cash and which are subject to an insignificant risk ofchanges in value, and bank overdrafts. Bank overdrafts are shown within borrowings in current liabilities on the Balance Sheet.
(j) Trade receivables
Trade receivables are recognised initially at fair value and subsequently measured at amortised cost using the effective interest method, less provision fordoubtful debts.
Collectability of trade receivables is reviewed on an ongoing basis. Debts which are known to be uncollectible are written off. A provision for doubtfulreceivables is established when there is objective evidence that the Group will not be able to collect amounts due according to the original terms ofreceivables. The amount of the provision is the difference between the asset’s carrying amount and the present value of estimated future cash flows,discounted at the average cost of capital. The amount of the provision is recognised in the Income Statement.
(k) Consumable stores and spares
Inventories of materials and supplies are stated at the lower of cost or net realisable value. Cost comprises the cost of the materials and supplies usingweighted average cost.

42
N o t e s t o t h e F i n a n c i a l S t a t e m e n t sFor the Year Ended 31 December 2006
T h e N e w Z e a l a n d R e f i n i n g C o m p a n y L i m i t e d
Note 1 Summary of Significant Accounting Policies continued
(l) Loans and receivables
Loans and receivables are non derivative financial assets with fixed or determinable payments that are not quoted in an active market. They arise whenthe Group provides money, goods or services directly to a debtor with no intention of selling the receivable. They are included in current assets, exceptfor those with maturities greater than 12 months after the balance date which are classified as non-current assets.
(m) Derivatives
The Group uses Forward Exchange Contracts to hedge some capital purchases, Interest Rate Swaps, and Electricity Contracts for Differences.
These derivatives are initially recognised at fair value on the date a derivative contract is entered into and are subsequently re-measured to their fairvalue. The method of recognising the resulting gain or loss depends on whether the derivative is designated as a hedging instrument, and if so, thenature of the item being hedged. The Group designates certain derivatives as either; (1) hedges of the fair value of recognised assets or liabilities or afirm commitment (fair value hedge); or (2) hedges of highly probable forecast transactions (cash flow hedges).
The Group documents at the inception of the transaction the relationship between hedging instruments and hedged items, as well as its riskmanagement objective and strategy for undertaking various hedge transactions. The Group also documents their assessment, both at hedge inceptionand on an ongoing basis, of whether the derivatives that are used in hedging transactions have been and will continue to be highly effective inoffsetting changes in fair values or cash flows of hedged items.
(i) Fair value hedge
Changes in the fair value of derivatives that are designated and qualify as fair value hedges are recorded in the Income Statement, together withany changes in the fair value of the hedged asset or liability that are attributable to the hedged risk.
(ii) Cash flow hedge
The effective portion of changes in the fair value of derivatives that are designated and qualify as cash flow hedges is recognised in equity in thehedging reserve. The gain or loss relating to the ineffective portion is recognised immediately in the Income Statement.
Amounts accumulated in equity are recycled in the Income Statement in the periods when the hedged item will affect the Income Statement (forinstance when the forecast cost that is hedged takes place). However, when the forecast transaction that is hedged results in the recognition of anon-financial asset (for example, plant and equipment) or a non-financial liability, the gains and losses previously deferred in equity are transferredfrom equity and included in the measurement of the initial cost or carrying amount of the asset or liability.
When a hedging instrument expires or is sold, terminated or exercised, or the entity revokes designation of the hedge relationship but the hedgedforecast transaction still is expected to occur, the cumulative gain or loss at that point remains in equity and is recognised in accordance with theabove policy when the transaction occurs. If the hedged transaction is no longer expected to take place, then the cumulative unrealised gain or lossrecognised in equity is recognised immediately in the Income Statement.
(iii) Derivatives not qualifying for hedge accounting
Certain derivative instruments do not qualify for hedge accounting and in some instances hedge accounting has not been adopted. Changes in thefair value of these derivative instruments are recognised immediately in the Income Statement.
(n) Fair value estimation
The fair value of financial assets and financial liabilities must be estimated for recognition and measurement or for disclosure purposes.
The fair value of financial instruments that are not traded in an active market (for example, over the counter derivatives) is determined using valuationtechniques. The fair value of forward exchange contracts is determined using forward exchange market rates at the balance date.
(o) Property, plant and equipment
The group has nine classes of property, plant and equipment:
– Freehold land and improvements
– Buildings and jetties
– Refining plant
– Catalysts
– Refinery to Auckland Pipeline
– Wiri Terminal
– Equipment and vehicles
– Shutdown and tank maintenance
– Capital work in progress.
All classes of property, plant and equipment are initially recorded at cost.
Actual costs of a complete process unit shutdown for the purpose of significant inspection, cleaning and repair are capitalised as property, plant andequipment.
Major inspections associated with tank maintenance are capitalised provided the property, plant and equipment recognition criteria is met.

43
N o t e s t o t h e F i n a n c i a l S t a t e m e n t sFor the Year Ended 31 December 2006
T h e N e w Z e a l a n d R e f i n i n g C o m p a n y L i m i t e d
Note 1 Summary of Significant Accounting Policies continued
On transition to NZ IFRS, the Refinery to Auckland pipeline was revalued to fair value as at 31 December 2004. The fair value of the pipeline, togetherwith the existing carrying values of property, plant and equipment has been used as deemed cost on transition to NZ IFRS. See Note 28(9) for furtherdetails.
When an asset is disposed of, any gain or loss on disposal is calculated as the difference between the disposal proceeds and the carrying value of theasset, and is recognised in the Income Statement.
Depreciation is provided on a straight line basis on all property, plant and equipment other than freehold land, capital work in progress and preciousmetals (platinum and rhenium) contained in some catalysts. The depreciation rates applied to allocate the assets’ cost less estimated residual value(which is zero in all cases except for catalyst containing precious metals), over the estimated useful lives, are as follows:
Land improvements 20 years
Buildings and jetties 20 years
Motor vehicles 4-7 years
Equipment (including computers) 3-7 years
Catalysts 3-10 years
Refining – Tankage 30 years
– Rotating equipment 20 years
– Piping 20 years
– Vessels 20 years
– Instruments 10 years
Shutdown and maintenance costs 2-20 years
When the economic worth of the property, plant and equipment was evaluated at 31 December 2000, the remaining useful life of the refinery plant andbuildings was assessed at 20 years. In April 2003, the Board approved the building of two new pieces of plant, a new Hydrodesulphurising Unit andBenzene Reduction Unit. This “Future Fuels Project” ensures that the Parent Company will continue its life as a refiner of oil products for the foreseeablefuture. Therefore the lives of any new components are in accordance with estimates listed above.
Shutdown costs and major inspections associated with tank maintenance are depreciated over the period to the next planned shutdown or inspection.
If the recoverable amount of an item of property, plant and equipment is less than its carrying amount, the item is written down to the recoverableamount. Because the assets are recorded at deemed cost, any write down is recognised as an expense in the Income Statement. An impairment writedown is reversed (wholly or partially as appropriate) if there is change in the estimates or circumstances used to determine the amount of the writedown. The reversal is recognised in the Income Statement.
(p) Investment property
Investment property comprises land held for long-term rental yields that is not occupied by the Group. Investment property is carried at fair value,representing market value determined annually by external valuers. Changes in fair values are recorded in the Income Statement.
(q) Intangible assets – software costs
Software costs have a finite useful life. Software costs are capitalised and written off over the useful economic life of 2 to 5 years.
(r) Trade and other payables
These amounts represent liabilities for goods and services provided to the Group prior to the end of the financial year which are unpaid. The amountsare unsecured and are usually paid within 30 days of recognition.
(s) Borrowings
Borrowings are initially recognised at fair value, net of transaction costs incurred. Borrowings are subsequently measured at amortised cost. Anydifference between the proceeds (net of transaction costs) and the redemption amount is recognised in the income statement over the period of theborrowings using the effective interest method.
Borrowings are classified as current liabilities unless the company has an unconditional right to defer settlement of the liability for at least 12 monthsafter the balance date.
(t) Provisions
Provisions for legal claims and restoration costs are recognised when: the company has a legal or constructive obligation as a result of past events; it ismore likely than not that an outflow of resources will be required to settle the obligation; and the amount has been reliably estimated. Provisions arenot recognised for future operating losses.
Where there are a number of similar obligations, the likelihood that an outflow will be required in settlement is determined by considering the class ofobligations as a whole. A provision is recognised even if the likelihood of an outflow with respect to any one item included in the same class ofobligations may be small.

44
N o t e s t o t h e F i n a n c i a l S t a t e m e n t sFor the Year Ended 31 December 2006
T h e N e w Z e a l a n d R e f i n i n g C o m p a n y L i m i t e d
Note 1 Summary of Significant Accounting Policies continued
(u) Employee benefits
(i) Wages and salaries, annual leave and sick leave
Liabilities for wages and salaries, including nonmonetary benefits, annual leave, retirement bonuses and accumulating sick leave expected to besettled within 12 months of the reporting date are recognised in respect of employees’ services up to the reporting date and are measured at theamounts expected to be paid when the liabilities are settled. Liabilities for non-accumulating sick leave are recognised when the leave is taken andmeasured at the rates paid or payable.
(ii) Employee entitlements
Liabilities for long service leave and retirement bonus is based on an actuarial assessment and represents the present value of the estimated futurecash outflows, which are expected as a result of employee services provided up to balance date.
(iii) Pension obligations
The Group has both a defined benefit plan and defined contribution plan. The defined benefit plan was closed to new members at 31 December2002. The defined contribution plan commenced on 1 January 2003. A defined contribution plan is a pension plan under which the Group paysfixed contributions into a separate entity. The Group has no legal or constructive obligations to pay further contributions if the fund does not holdsufficient assets to pay all employees the benefits relating to employee service in the current and prior periods.
The defined benefit plans defines an amount of pension benefit that an employee will receive on retirement, usually dependent on a combination offactors, such as age, years of service and compensation. Under the defined benefit plan the Group has a legal obligation to pay furthercontributions if the fund does not hold sufficient assets to pay all employees the benefits relating to employee service in the current and priorperiods.
The liability recognised in the Balance Sheet in respect of defined benefit pension plans is the present value of the defined benefit obligation at thebalance sheet date less the fair value of plan assets, together with adjustments for unrecognised actuarial gains or losses and past service costs.The defined benefit obligation is calculated annually by independent actuaries using the projected unit credit method. The present value of thedefined benefit obligation is determined by discounting the estimated future cash outflows using interest rates of high-quality corporate bonds thatare denominated in the currency in which the benefits will be paid and that have terms to maturity approximating the terms of the related pensionliability.
Actuarial gains and losses arising from experience adjustments and changes in actuarial assumptions are charged or credited to equity over theemployees’ expected average remaining working lives.
Past-service costs are recognised immediately in equity unless the changes to the pension plan are conditional on the employees remaining inservice for a specified period of time (the vesting period). In this case, the past-service costs are amortised on a straight-line basis over the vestingperiod.
For defined contribution plans, the Group pays contributions to a superannuation fund. The Group has no further payment obligations once thecontributions have been paid. The contributions are recognised as an employee benefit expense when they are due. Prepaid contributions arerecognised as an asset to the extent that a cash refund or a reduction in the future payments is available.
(iv) Other post-employment obligations
The Group provides post-retirement healthcare benefits to certain retirees until death. The expected costs of these benefits have been calculated byan independent actuary using the Projected Unit Credit Method in order to determine the present value of the defined benefit obligation andcurrent service cost. Changes in the obligation are recognised in the Income Statement. Other post-employment obligations are recognised at thepresent value of the future cash flows required to meet the obligations.
(v) Dividends
Provision is made for the amount of any dividend declared on or before the balance date but not distributed at balance date.
(w) Contributed equity
Ordinary shares are classified as equity.
Incremental costs directly attributable to the issue of new shares are shown in equity as a deduction, net of tax, from the proceeds.
(x) Earnings per share
Basic and diluted earnings per share
Basic and diluted earnings per share is calculated by dividing the profit attributable to equity holders of the company, excluding any costs of servicingequity other than ordinary shares, by the weighted average number of ordinary shares outstanding during the year, adjusted for bonus elements inordinary shares issued during the year.

45
N o t e s t o t h e F i n a n c i a l S t a t e m e n t sFor the Year Ended 31 December 2006
T h e N e w Z e a l a n d R e f i n i n g C o m p a n y L i m i t e d
Note 2 Transition to IFRS
(a) Application of NZ IFRS 1
The Group’s financial statements for the year ended 31 December 2006 are the first annual financial statements that comply with NZ IFRS. Thesefinancial statements have been prepared as described in note 1. The Group has applied NZ IFRS 1 in preparing these consolidated financial statements.
The New Zealand Refining Company Limited transition date is 1 January 2005. The Group prepared its opening NZ IFRS Balance Sheet at that date.The reporting date of these financial statements is 31 December 2006. The Group’s NZ IFRS adoption date is 1 January 2006.
In preparing these financial statements in accordance with NZ IFRS 1, the Group has applied the mandatory exceptions, where applicable and certain ofthe optional exemptions from full retrospective application of NZ IFRS.
(b) Mandatory exceptions
The following mandatory exceptions from retrospective application have been applied:
(i) De-recognition of financial assets and liabilities
Financial assets and liabilities derecognised before 31 December 2004 are not re-recognised under NZ IFRS.
(ii) Hedge accounting
The Directors have adopted hedge accounting from 1 January 2005 only if the hedge relationship meets all the hedge accounting criteria under NZ IAS 39.
(iii) Estimates
Estimates under NZ IFRS at 31 December 2004 are required to be consistent with estimates made for the same date under previous GAAP, unlessthere is evidence that those estimates were in error. No adjustments to previous estimates have been made by the Directors.
(iv) Assets held for sale and discontinued operations
The Group did not have any assets that met the held for sale criteria during the period presented and therefore no adjustment was required.
(c) Optional exemptions
The following optional exemptions from full retrospective application have been applied:
(i) Fair value as deemed cost
The Group has applied this exemption under NZ IFRS 1 to set the fair value for certain classes of assets as the deemed cost of property, plant andequipment.
(ii) Decommissioning liabilities
The Group has applied this exemption and recognised a provision for restoration costs in accordance with the exemption provided in NZ IFRS 1.
(d) Significant judgements
In the process of applying the Group’s accounting policies, the following areas involve judgement that can significantly affect the amounts recognised inthe financial statements:
(i) Property, plant and equipment and investment properties
Judgements have been made in relation to the carrying value of the refinery to Auckland pipeline and the investment property including theassumptions made by the independent valuers. Judgements are also made in relation to the Group’s depreciation rates.
(ii) Employee benefits
Judgements have been made in relation to the carrying value of employee benefits, including retirement benefit obligations and the assumptionsmade by independent actuaries.
The Directors continually review all accounting policies including judgement in presenting the financial statements.
The reconciliations in Note 28 provide quantification of the effect of the transition to NZ IFRS on:
– group and parent profit for the 12 months ended 31 December 2005
– group and parent equity at 1 January 2005
– group and parent equity at 31 December 2005.

46
N o t e s t o t h e F i n a n c i a l S t a t e m e n t sFor the Year Ended 31 December 2006
T h e N e w Z e a l a n d R e f i n i n g C o m p a n y L i m i t e d
Note 3 Segment Information
(a) Description of segments
(i) Business segments
The Group is organised into two main business segments.
Oil refining
The Group owns and operates an oil refinery located at Marsden Point – 160 kilometres north of Auckland. The refinery is able to process a widerange of crude oil types imported from around the world and produce world class clean fuels.
Distribution
The Group owns infrastructure to support the distribution of manufactured products to its customers. The Refinery to Auckland pipeline transfersproduct to the Wiri Oil Terminal located in South Auckland. The Wiri Terminal is owned by the Group and leased to its customers.
(b) Primary reporting format - business segments
The segment results for the year ended 31 December 2006 and 31 December 2005 are as follows:
Oil Refining Distribution Other Elimination Total$000 $000 $000 $000 $00031 December 2006
Total operating revenue 366,313 27,829 5,843 (2,816) 397,169
Rental income – 6,525 – – 6,525
Total income 366,313 34,354 5,843 (2,816) 403,694
Depreciation and amortisation 44,074 12,062 338 – 56,474
Expenses 140,215 3,634 4,200 (2,840) 145,209
Net profit before finance costs 182,024 18,658 1,305 24 202,011
Oil Refining Distribution Other Elimination Total$000 $000 $000 $000 $00031 December 2005
Total operating revenue 329,844 26,809 4,301 (2,766) 358,188
Rental income – 6,525 – – 6,525
Amortisation of loan settlement payment 28,162 3,304 – – 31,466
Total income 358,006 36,638 4,301 (2,766) 396,179
Depreciation and amortisation 27,936 11,699 313 – 39,948
Expenses 106,104 3,508 3,542 (2,785) 110,369
Net profit before finance costs 223,966 21,431 446 19 245,862
Transactions between segments are entered into on an arms length basis.

47
N o t e s t o t h e F i n a n c i a l S t a t e m e n t sFor the Year Ended 31 December 2006
T h e N e w Z e a l a n d R e f i n i n g C o m p a n y L i m i t e d
Oil Refining Distribution Other Elimination Total$000 $000 $000 $000 $00031 December 2006
Segment assets 612,156 209,106 6,028 (237) 827,053
Unallocated – – – – 12,020
Total assets 612,156 209,106 6,028 (237) 839,073
Segment liabilities 163,532 62,802 353 (237) 226,450
Unallocated – – – – 115
Total liabilities 163,532 62,802 353 (237) 226,565
Capital expenditure 47,782 18 328 – 48,128
Note 3 Segment Information continued
The segment assets and liabilities at 31 December 2006 and 31 December 2005 and capital expenditure for the years then ended are as follows:
Oil Refining Distribution Other Elimination Total$000 $000 $000 $000 $00031 December 2005
Segment assets 611,232 220,826 4,133 (329) 835,862
Unallocated – – – – 4,642
Total assets 611,232 220,826 4,133 (329) 840,504
Segment liabilities 177,605 66,398 354 (329) 244,028
Unallocated – – – – 40,836
Total liabilities 177,605 66,398 354 (329) 284,864
Capital expenditure 102,218 7,765 422 – 110,405
Segment assets consist primarily of property, plant and equipment, intangible assets, consumable spares and stores, derivatives designated as hedges offuture commercial transactions, receivables and operating cash. Unallocated assets include the assets operated by the subsidiary, IndependentPetroleum Laboratories Limited, and the investment property.
Segment liabilities comprise operating liabilities (including derivatives designated as hedges of future commercial transactions). Unallocated liabilitiesinclude bank borrowings, income taxation and overdraft.
The “other and elimination” segments includes the trading results of the Company’s subsidiary, Independent Petroleum Limited, and the elimination ofinter-company transactions (Note 25(g)). The gain on the Company’s investment property is also included in the “other” segment.
Capital expenditure comprises additions to property, plant and equipment (Note 11) and intangible assets (Note 13).
(b) Secondary reporting format - geographical segments
The Group operates in only one geographical segment, that of New Zealand. All operations are conducted from Marsden Point.

48
N o t e s t o t h e F i n a n c i a l S t a t e m e n t sFor the Year Ended 31 December 2006
T h e N e w Z e a l a n d R e f i n i n g C o m p a n y L i m i t e d
Note 4 Income and Expenses
Profit before income tax includes the following specific income and expenses:
G R O U P PA R E N T
2006 2005 2006 2005Note $000 $000 $000 $000
Income
Processing fees 352,588 319,163 352,636 319,163
Natural Gas recovery 11,199 8,894 11,199 8,894
Other refining related income 2,526 1,872 2,479 1,786
Refining revenue 366,313 329,929 366,314 329,843
Distribution revenue 27,829 26,809 27,829 26,809
Wiri rental income 6,525 6,525 6,525 6,525
Loan settlement payment – 31,466 – 31,466
Gain on investment property 12 1,800 150 1,800 150
Dividend from subsidiary – – 81 81
Other income 1,227 1,300 – –
Total income 403,694 396,179 402,549 394,874
And charging:
Purchase of process materials and utilities 44,488 37,512 44,753 37,265
Materials and contractor payments 25,687 21,380 24,768 20,989
Inventory write down 550 (797) 550 (797)
Total materials and contractor payments 26,237 20,583 25,318 20,192
Wages and salaries 32,273 31,371 29,804 29,304
Defined contribution pension plan contributions 263 248 263 248
Pension plan expense 14(e) 1,388 (185) 1,388 (185)
Total wages and salaries 33,924 31,434 31,455 29,367
Depreciation 11
Land improvements 1,282 956 1,282 956
Buildings and jetties 1,064 1,482 1,064 1,482
Refining plant 21,848 15,240 21,848 15,240
Shutdown and tank maintenance 8,334 7,440 8,334 7,440
Refinery to Auckland Pipeline 11,412 11,054 11,412 11,054
Wiri terminal (leased) 644 645 644 645
Equipment and vehicles 3,468 2,387 3,130 2,074
Catalysts 6,826 2,614 6,826 2,614
Total depreciation 54,878 41,818 54,540 41,505
Amortisation – software costs 13 1,257 617 1,257 617
Disposal of property, plant and equipment 159 (2) 153 (2)
Disposal of catalysts 180 (2,485) 180 (2,485)
Total depreciation, amortisation and disposal costs 56,474 39,948 56,130 39,635

49
Note 4 Income and Expenses continued
N o t e s t o t h e F i n a n c i a l S t a t e m e n t sFor the Year Ended 31 December 2006
T h e N e w Z e a l a n d R e f i n i n g C o m p a n y L i m i t e d
G R O U P PA R E N T
2006 2005 2006 2005$000 $000 $000 $000
Administration and other expenses 15,958 17,088 18,054 19,412
Project development costs – Point Forward Project 21,189 – 21,189 –
Technical service fee (Shell) 2,168 2,060 2,168 2,060
Auditors remuneration:
Statutory audit fee 141 114 131 107
Other assurance related fees – – – –
Foreign exchange losses unhedged (108) (2) (108) (2)
Investment property expenses – 3 – 3
Directors fees 510 390 510 390
Operating lease expenses 169 160 169 154
Wiri land rental 500 500 500 500
Donations 33 527 33 526
Total administration and other costs 40,560 20,840 42,646 23,150
Finance costs
Interest received (2,296) (553) (2,319) (572)
Interest paid 2,055 5,109 2,048 5,109
Total net finance (income)/costs (241) 4,556 (271) 4,537
Total costs 201,442 154,873 200,031 154,146
Profit before income tax 202,252 241,306 202,518 240,728
The Group has 346 employees (2005: 317 employees).
The fee payable by customers for processing crude at the Marsden Point Refinery is subject to a cap of USD6.30 per barrel (70% of USD9.00). The cap iscalculated on a year to date basis, but for invoicing and revenue recognition purposes, is calculated monthly. As at 31 December 2006 and 31 December2005 all revenue had been invoiced as all customers fell below the level of the cap.

50
N o t e s t o t h e F i n a n c i a l S t a t e m e n t sFor the Year Ended 31 December 2006
T h e N e w Z e a l a n d R e f i n i n g C o m p a n y L i m i t e d
Note 5 Income Tax Expense G R O U P PA R E N T
2006 2005 2006 2005$000 $000 $000 $000
(a) Reconciliation of income tax expense to tax rate applicable to profits
Profit from continuing operations before income tax expense 202,252 241,306 202,518 240,728
Tax at the New Zealand tax rate of 33% (2005 – 33%) 66,743 79,631 66,831 79,440
Tax effect of amounts which are either non-deductible or
taxable in calculating taxable income:
Expenses not deductible for tax (6) (45) (12) (57)
Imputation credits on dividends received (40) – (40) –
Losses utilised 82 – – –
Income tax expense 66,779 79,586 66,779 79,383
(b) Income tax expense
Tax payable in respect of the current year (Note 17) 68,108 69,457 68,108 69,254
Tax payable in respect of previous years (Note 17) 162 119 162 119
Deferred tax in respect of current year (Note 18) (1,342) 10,129 (1,342) 10,129
Deferred tax in respect of previous years (Note 18) (149) (119) (149) (119)
Income tax expense 66,779 79,586 66,779 79,383
(c) Amounts recognised directly in equity
Aggregate deferred tax arising in the period and not recognised in the
income statement but directly debited or credited to equity (Note 20) 293 199 293 199
The Group and Parent have no tax losses (2005: Nil) and
no unrecognised temporary differences (2005: Nil).
(d) Imputation credits
Balance 1 January 84,547 48,149 84,368 48,066
Taxation paid 66,636 69,969 66,431 69,819
Less attributed dividends (37,273) (33,571) (37,220) (33,517)
Balance 31 December 113,910 84,547 113,579 84,368

51
N o t e s t o t h e F i n a n c i a l S t a t e m e n t sFor the Year Ended 31 December 2006
T h e N e w Z e a l a n d R e f i n i n g C o m p a n y L i m i t e d
Note 6 Earnings per share
Basic and diluted
Basic and diluted earnings per share are calculated by dividing the profit by the weighted average number of ordinary shares on issue during the period.
Note 7 Cash and Cash Equivalents
G R O U P PA R E N T
2006 2005 2006 2005$000 $000 $000 $000
G R O U P PA R E N T
2006 2005 2006 2005$000 $000 $000 $000
Profit after tax 135,473 161,720 135,739 161,345
Weighted average number of ordinary shares on issue (thousands) 240,000 240,000 240,000 240,000
Basic and diluted earnings (per share) 56.4 cents 67.4 cents 56.6 cents 67.2 cents
On 7 October 2005 the Parent Company made a 10 for 1 share split which resulted in 216,000,000 shares being issued for nil consideration. Thecomparative earnings per share have been restated based on the total number of shares on issue as at 31 December 2005.
Cash at bank and in hand 12,020 4,642 11,988 4,490
12,020 4,642 11,988 4,490
The above amounts are reconciled to cash at the end of the year
as shown in the statements of cash flows as follows:
Balances as above 12,020 4,642 11,988 4,490
Bank overdrafts (22) (31) (22) (31)
Balances per statements of cash flows 11,998 4,611 11,966 4,459
(a) Liquidity risk
The group maintains sufficient cash and funding facilities to meet liquidity requirements.
(b) Fair value
The carrying amount for cash and cash equivalents equals the fair value.

52
N o t e s t o t h e F i n a n c i a l S t a t e m e n t sFor the Year Ended 31 December 2006
T h e N e w Z e a l a n d R e f i n i n g C o m p a n y L i m i t e d
G R O U P PA R E N T
2006 2005 2006 2005$000 $000 $000 $000
Note 8 Derivative Financial Instruments
Current assets
Forward foreign exchange contracts – 790 – 790
Electricity contracts for differences – 1,347 – 1,347
Interest rate swaps – 85 – 85
Total current derivative financial instrument assets – 2,222 – 2,222
Current liabilities
Forward foreign exchange contracts 513 – 513 –
Total current derivative financial instrument liabilities 513 – 513 –
Non-current assets
Electricity contracts for differences – 1,749 – 1,749
Total non-current derivative financial instrument assets – 1,749 – 1,749
Non-current liabilities
Electricity contracts for differences 3,102 – 3,102 –
Total non-current derivative financial instrument liabilities 3,102 – 3,102 –
Market risk
Risk management is performed by Group management who evaluate and hedge financial risks including currency risk and interest rate risk.
Currency risk
The Group only enters into foreign currency exchange contracts to manage payments of capital expenditure.
At 31 December 2006 the Group had entered into forward exchange contracts to sell the equivalent of NZ$8.3 million (2005: NZ$39.3 million). The currencies in which the Group primarily deals are US Dollar, Pounds Sterling, Euro and Australian Dollar.
Forward exchange contracts - cash flow hedges
These contracts are hedging committed or highly probable forecast purchases of property, plant and equipment for the ensuing financial year. The contractsare timed to mature when major shipments are scheduled to be despatched and the liability settled.
The cash flows are expected to occur at various dates within one year from the balance date.
Where forward exchange contracts have been designated and tested as an effective hedge the portion of the gain or loss on the hedging instrument that isdetermined to be an effective hedge is recognised directly in equity. When the contracts are settled, these gains or losses are recorded against theunderlying property, plant and equipment or consumable spares and stores being hedged.
Where forward exchange contracts are not designated and therefore not tested as an effective hedge, the gain or loss on the forward contract is recognisedin the income statement as other expenses. At balance date there were no contracts that had not been designated (2005: nil).
At balance date these contracts were liabilities of $0.5 million (2005 – assets $0.8 million).
Electricity contracts for differences – cash flow hedges
These contracts are hedging committed or highly probable electricity costs for the ensuing 3 years. The cash flows are expected to occur at various dates to31 December 2009.
Where electricity contracts for differences have been designated and tested as an effective hedge the portion of the gain or loss on the hedging instrumentthat is determined to be an effective hedge is recognised directly in equity. These gains or losses will be released to the income statement when thecontracts are settled.
Where electricity contracts for differences are not designated and therefore not tested as an effective hedge, the gain or loss on the contract is recognised inthe income statement as other expenses. At balance date there no contracts that had not been designated (2005: nil).
Interest rate risk
The Groups interest rate risk arises from short and long term borrowings typically used to finance major capital projects. Borrowings are at variable rates,exposing the Group to interest rate risk.

53
N o t e s t o t h e F i n a n c i a l S t a t e m e n t sFor the Year Ended 31 December 2006
T h e N e w Z e a l a n d R e f i n i n g C o m p a n y L i m i t e d
G R O U P PA R E N T
2006 2005 2006 2005$000 $000 $000 $000
Note 9 Receivables and Prepayments
G R O U P PA R E N T
2006 2005 2006 2005$000 $000 $000 $000
Note 10 Consumable Stores and Spares
Current
Processing fees 28,167 29,691 28,167 29,691
Product distribution 2,690 2,550 2,690 2,550
Excise duty (Note 15) 72,842 84,734 72,842 84,734
Other 2,168 2,293 1,820 2,057
Total receivables and prepayments 105,867 119,268 105,519 119,032
(a) Credit risk
No collateral is held over receivables which are mainly due from the Oil Marketing Companies as detailed in note 25(d).
(b) Fair value
The fair value of trade and other receivables approximates their carrying value.
Spares 44,116 20,117 44,116 19,939
Consumables 962 1,017 870 1,102
Provision for impairment (9,367) (8,832) (9,367) (8,832)
35,711 12,302 35,619 12,209
Catalysts, totalling $21.784 million were held in store at 31 December 2006, (2005: Nil), and which will be loaded into the Hydro-cracker and other refiningprocess units during the 2007 planned shutdown.
A proportion of consumable stores and spares will be utilised after more than twelve months. Utilisation is dependent on refining operations and cannot bereliably measured.
Spares and consumables are included in the negative pledge arrangement, as detailed in note 16.

54
(a) Group Year Ended 31 December 2006
Note 11 Property, Plant and Equipment
N o t e s t o t h e F i n a n c i a l S t a t e m e n t sFor the Year Ended 31 December 2006
T h e N e w Z e a l a n d R e f i n i n g C o m p a n y L i m i t e d
Opening ClosingNet Book Additions/ Depreciation Net Book Net Book
Amount Transfers Disposals Charge Amount Cost Depreciation Value$000 $000 $000 $000 $000 $000 $000 $000
Freehold land and improvements 26,101 – – (1,282) 24,819 62,267 (37,448) 24,819
Buildings and jetties 11,515 2,297 – (1,064) 12,748 88,079 (75,331) 12,748
Refining plant 353,922 2,912 – (21,848) 334,986 2,036,056 (1,701,070) 334,986
Capital work in progress 13,355 14,300 – – 27,655 27,655 – 27,655
Catalysts 31,449 1,280 (273) (6,826) 25,630 55,092 (29,462) 25,630
Refinery to Auckland Pipeline 208,984 9 – (11,412) 197,581 220,066 (22,485) 197,581
Wiri Terminal (leased) 9,577 9 – (644) 8,942 44,160 (35,218) 8,942
Equipment and vehicles 7,929 3,937 (23) (3,468) 8,375 43,588 (35,213) 8,375
Shutdown and tank maintenance 30,291 7,605 – (8,334) 29,562 50,662 (21,100) 29,562
Total 693,123 32,349 (296) (54,878) 670,298 2,627,625 (1,957,327) 670,298
(b) Group Year Ended 31 December 2005
Opening ClosingNet Book Additions/ Depreciation Net Book Net Book
Amount Transfers Disposals Charge Amount Cost Depreciation Value$000 $000 $000 $000 $000 $000 $000 $000
Freehold land and improvements 16,417 10,640 – (956) 26,101 62,267 (36,166) 26,101
Buildings and jetties 11,571 1,426 – (1,482) 11,515 85,781 (74,266) 11,515
Refining plant 184,565 184,636 (39) (15,240) 353,922 2,033,665 (1,679,743) 353,922
Capital work in progress 139,960 (126,605) – – 13,355 13,355 – 13,355
Catalysts 23,387 17,565 (6,889) (2,614) 31,449 54,892 (23,443) 31,449
Refinery to Auckland Pipeline 212,273 7,765 – (11,054) 208,984 220,057 (11,073) 208,984
Wiri Terminal (leased) 10,232 – (10) (645) 9,577 44,141 (34,564) 9,577
Equipment and vehicles 8,333 2,011 (28) (2,387) 7,929 40,401 (32,472) 7,929
Shutdown and tank maintenance 27,102 10,629 – (7,440) 30,291 45,220 (14,929) 30,291
Total 633,840 108,067 (6,966) (41,818) 693,123 2,599,779 (1,906,656) 693,123
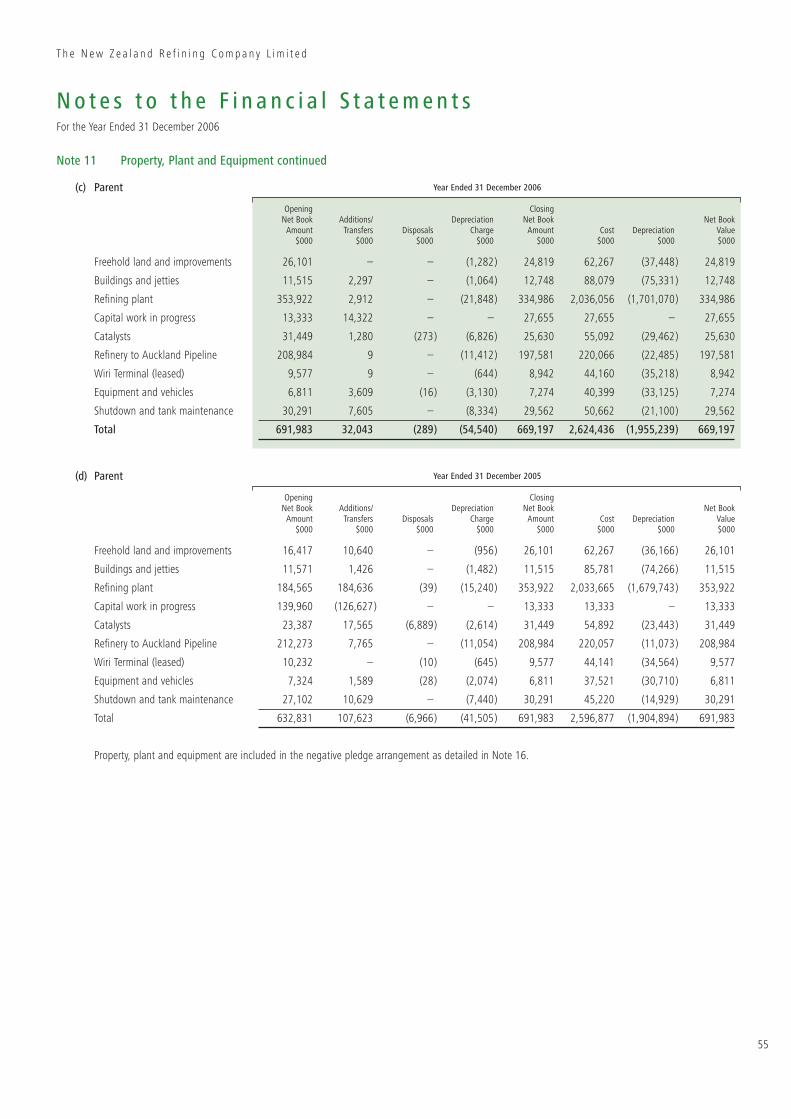
55
(c) Parent Year Ended 31 December 2006
Note 11 Property, Plant and Equipment continued
N o t e s t o t h e F i n a n c i a l S t a t e m e n t sFor the Year Ended 31 December 2006
T h e N e w Z e a l a n d R e f i n i n g C o m p a n y L i m i t e d
Opening ClosingNet Book Additions/ Depreciation Net Book Net Book
Amount Transfers Disposals Charge Amount Cost Depreciation Value$000 $000 $000 $000 $000 $000 $000 $000
Freehold land and improvements 26,101 – – (1,282) 24,819 62,267 (37,448) 24,819
Buildings and jetties 11,515 2,297 – (1,064) 12,748 88,079 (75,331) 12,748
Refining plant 353,922 2,912 – (21,848) 334,986 2,036,056 (1,701,070) 334,986
Capital work in progress 13,333 14,322 – – 27,655 27,655 – 27,655
Catalysts 31,449 1,280 (273) (6,826) 25,630 55,092 (29,462) 25,630
Refinery to Auckland Pipeline 208,984 9 – (11,412) 197,581 220,066 (22,485) 197,581
Wiri Terminal (leased) 9,577 9 – (644) 8,942 44,160 (35,218) 8,942
Equipment and vehicles 6,811 3,609 (16) (3,130) 7,274 40,399 (33,125) 7,274
Shutdown and tank maintenance 30,291 7,605 – (8,334) 29,562 50,662 (21,100) 29,562
Total 691,983 32,043 (289) (54,540) 669,197 2,624,436 (1,955,239) 669,197
(d) Parent Year Ended 31 December 2005
Opening ClosingNet Book Additions/ Depreciation Net Book Net Book
Amount Transfers Disposals Charge Amount Cost Depreciation Value$000 $000 $000 $000 $000 $000 $000 $000
Freehold land and improvements 16,417 10,640 – (956) 26,101 62,267 (36,166) 26,101
Buildings and jetties 11,571 1,426 – (1,482) 11,515 85,781 (74,266) 11,515
Refining plant 184,565 184,636 (39) (15,240) 353,922 2,033,665 (1,679,743) 353,922
Capital work in progress 139,960 (126,627) – – 13,333 13,333 – 13,333
Catalysts 23,387 17,565 (6,889) (2,614) 31,449 54,892 (23,443) 31,449
Refinery to Auckland Pipeline 212,273 7,765 – (11,054) 208,984 220,057 (11,073) 208,984
Wiri Terminal (leased) 10,232 – (10) (645) 9,577 44,141 (34,564) 9,577
Equipment and vehicles 7,324 1,589 (28) (2,074) 6,811 37,521 (30,710) 6,811
Shutdown and tank maintenance 27,102 10,629 – (7,440) 30,291 45,220 (14,929) 30,291
Total 632,831 107,623 (6,966) (41,505) 691,983 2,596,877 (1,904,894) 691,983
Property, plant and equipment are included in the negative pledge arrangement as detailed in Note 16.

56
N o t e s t o t h e F i n a n c i a l S t a t e m e n t sFor the Year Ended 31 December 2006
T h e N e w Z e a l a n d R e f i n i n g C o m p a n y L i m i t e d
G R O U P PA R E N T
2006 2005 2006 2005$000 $000 $000 $000
Note 12 Investment Property
Balance at 1 January 2,450 2,300 2,450 2,300
Acquisitions – – – –
Disposals – – – –
Fair value adjustments 1,800 150 1,800 150
Balance at 31 December 4,250 2,450 4,250 2,450
G R O U P PA R E N T
2006 2005 2006 2005$000 $000 $000 $000
Note 13 Intangible Assets – Computer Software
At beginning of year
Cost 20,844 18,506 20,844 18,506
Accumulated amortisation (18,086) (17,469) (18,086) (17,469)
Net book amount 2,758 1,037 2,758 1,037
At 31 December
Opening net book amount 2,758 1,037 2,758 1,037
Additions 345 2,338 345 2,338
Amortisation charge (1,257) (617) (1,257) (617)
Closing net book amount 1,846 2,758 1,846 2,758
At 31 December
Cost 21,189 20,844 21,189 20,844
Accumulated amortisation and impairment (19,343) (18,086) (19,343) (18,086)
Net book amount 1,846 2,758 1,846 2,758
The carrying amount of Investment Property is the fair value of the property as determined by a registered independent appraiser having an appropriaterecognised professional qualification and recent experience in the location and category of the property being valued. The Registered Valuer’s, Telfer Young(Northland) Limited, are Associates of the New Zealand Institute of Valuers. Fair values were determined on a basis of a willing buyer and willing seller, withregard to comparable regional sales, rentals and estimated replacement costs. Telfer Young (Northland) Limited’s valuation report is dated 6 December 2006.

57
G R O U P A N D PA R E N T
2006 2005$000 $000
N o t e s t o t h e F i n a n c i a l S t a t e m e n t sFor the Year Ended 31 December 2006
T h e N e w Z e a l a n d R e f i n i n g C o m p a n y L i m i t e d
Note 14 Pension Assets
The Company contributes to a defined benefit pension scheme for eligible employees. This scheme closed to new members on 31 December 2002 due tothe Company’s decision to move from providing a defined benefit scheme to a defined contribution scheme from 1 January 2003. The last full actuarialreview was dated 31 March 2004.
(a) Plan information
All active members have Defined Benefits with a pension commencing on retirement.
(b) Reconciliation of the present value of the defined benefit obligation
Present value of defined benefit obligations at beginning of the year 66,220 59,236
Plus Current service cost 1,796 669
Plus Interest cost 2,503 2,336
Plus Contributions by Scheme participants 766 769
Plus Actuarial losses 512 5,835
Less Benefits paid (2,696) (2,625)
Present value of defined benefit obligations at end of the year 69,101 66,220
(c) Reconciliation of the fair value of plan assets
Fair value of scheme assets at beginning of the year 67,553 62,687
Plus Expected return on assets 3,369 3,129
Plus Actuarial gains 4,947 2,112
Plus Employer contributions 1,246 1,481
Plus Contributions by Scheme participants 766 769
Less Benefits paid (2,696) (2,625)
Fair value of scheme assets at end of the year 75,185 67,553
(d) Reconciliation of the asset recognised in the Balance Sheet
Defined benefit obligation (69,101) (66,220)
Less fair value of scheme assets 75,185 67,553
Surplus 6,084 1,333
Pension asset 6,084 1,333
Contributions tax 2,997 657
Pension asset with contributions tax 9,081 1,990
(e) Expense recognised in Income Statement
Service cost 1,796 669
Interest cost 2,503 2,336
Expected return on assets (3,369) (3,129)
Superannuation expense/(income) 930 (124)
Contributions tax 458 (61)
Superannuation expense/(income) plus contributions tax 1,388 (185)

58
N o t e s t o t h e F i n a n c i a l S t a t e m e n t sFor the Year Ended 31 December 2006
T h e N e w Z e a l a n d R e f i n i n g C o m p a n y L i m i t e d
Note 14 Pension Assets continued G R O U P A N D PA R E N T
2006 2005$000 $000
G R O U P A N D PA R E N T
2006 2005$000 $000
G R O U P A N D PA R E N T
2006 2005
G R O U P A N D PA R E N T
2006 2005
(f) Amounts recognised in the Statement of Recognised Income and Expense
Actuarial (gains)/losses (6,613) 5,557
(g) Cumulative amount recognised in the Statement of Recognised Income and Expense
Cumulative amount of actuarial (gains)/losses (1,056) 5,557
(h) Movements in the net asset recognised in the Balance Sheet
Opening net asset including contributions tax 1,990 5,151
Superannuation expense/(income) including Contributions Tax (1,388) 185
Amounts recognised in the Statement of Recognised Income and Expense grossed up for Contributions Tax 6,613 (5,557)
Employer contributions including Contributions Tax 1,866 2,211
Closing net asset including contributions tax 9,081 1,990
(i) Plan assets
The percentage invested in each asset class at the balance sheet date:
Equity 56% 56%
Fixed Income 31% 33%
Property 13% 11%
Cash 0% 0%
(j) Fair value of plan assets
The fair value of Plan assets includes no amounts relating to:
• any of the Employer’s own financial instruments
• any property occupied by, or other assets used by, the Employer.
The expected return on assets assumption is determined by weighting the expected long-term return for each asset class by the target allocation ofassets to each asset class. The returns used for each asset class are net of investment tax and investment fees.
(k) Actual return on plan assets
Actual return on plan assets 8,316 5,241
(l) Principal actuarial assumptions
Discount rate 4.00% pa 3.85% pa
Expected rate of return on plan assets 5.00% pa 5.00% pa
Expected rate of salary increases 4.00% pa 4.00% pa

59
Note 14 Pension Assets continued
N o t e s t o t h e F i n a n c i a l S t a t e m e n t sFor the Year Ended 31 December 2006
T h e N e w Z e a l a n d R e f i n i n g C o m p a n y L i m i t e d
G R O U P A N D PA R E N T
2006 2005$000 $000(m) Historical information
Present value of defined benefit obligation (69,101) (66,220)
Fair value of scheme assets 75,185 67,553
Surplus in scheme 6,084 1,333
Experience adjustments gain - scheme assets 4,947 2,112
Experience adjustments loss - scheme liabilities (512) (5,835)
(n) Expected contributions
Expected employer contributions amount to $1.4 million for the year ending 31 December 2007.
G R O U P PA R E N T
2006 2005 2006 2005$000 $000 $000 $000
G R O U P PA R E N T
2006 2005 2006 2005$000 $000 $000 $000
E f f e c t i v e I n t e r e s t R a t e
2006 2005 2006 2005% % $000 $000
Note 15 Trade and Other Payables
Trade payables 13,328 21,166 13,212 21,140
Excise duty 72,842 84,734 72,842 84,734
86,170 105,900 86,054 105,874
The fair value of trade and other payables approximates their carrying value.
Changes to excise duties have no direct impact on the results of the Group or Parent Company as they are collected from the Oil Companies (Note 9) and paidto the NZ Customs Department on the same day each month.
Note 16 Bank Borrowings
Group secured
Bank loans – 7.51% – 40,040
Total non-current interest bearing borrowings – 7.51% – 40,040
Parent secured
Bank loans – 7.51% – 40,040
Total non-current interest bearing borrowings – 7.51% – 40,040
The exposure of the Group’s borrowings to interest rate changes and thecontractual repricing date at the balance sheet date are as follows:
The carrying amount of the current and non-current borrowings approximates their fair value.
The current and non-current borrowings are unsecured. The Parent Company borrows under a negative pledge arrangement which requires certain certificates and covenants. All these requirements have been met.
The carrying amounts of the Group’s borrowings are denominated in New Zealand Dollars.
The Group has the following un-drawn borrowing facilities:
Within 6 months – 40,040 – 40,040
The maturity of non-current borrowings is as follows:
Between 1 and 2 years – 40,040 – 40,040
Working capital facility 25,000 25,000 25,000 25,000
Cash advance facility 25,000 85,000 25,000 85,000
Total un-drawn borrowing facility 50,000 110,000 50,000 110,000

60
Note 17 Current Taxation Payable
N o t e s t o t h e F i n a n c i a l S t a t e m e n t sFor the Year Ended 31 December 2006
T h e N e w Z e a l a n d R e f i n i n g C o m p a n y L i m i t e d
G R O U P PA R E N T
2006 2005 2006 2005$000 $000 $000 $000
Note 19 Provisions for Restoration Costs G R O U P PA R E N T
2006 2005 2006 2005$000 $000 $000 $000
Note 18 Deferred Taxation G R O U P A N D PA R E N T
Depreciation Provisions Other Total$000 $000 $000 $000
Movements
Balance at beginning of period 765 3,084 709 3,082
Tax payable in respect of current year (Note 5) 68,108 69,457 68,108 69,254
Tax payable in respect of previous years (Note 5) 162 119 162 119
Tax paid during year (66,625) (69,969) (66,431) (69,820)
Supplementary dividends (2,197) (1,946) (2,197) (1,946)
Use of money interest (120) 20 (120) 20
93 765 231 709
At 1 January 2005 118,910 (5,877) 3,579 116,612
Deferred tax charged to income statement (Note 5) 10,814 (8) (796) 10,010
Deferred tax on items charged directly to equity (Note 20) – – (199) (199)
At 31 December 2005 129,724 (5,885) 2,584 126,423
Deferred tax charged to income statement (Note 5) (1,771) (585) 866 (1,490)
Deferred tax on items charged directly to equity (Note 20) – – (293) (293)
At 31 December 2006 127,953 (6,470) 3,157 124,640
The amount of the deferred tax balance expected to be utilised within one year is $4,353,000 (2005: $5,478,000).
Movements
At 1 January 2006 3,070 2,412 3,070 2,412
Charged to income statement 282 241 282 241
Change in discount rate (223) 417 (223) 417
At 31 December 2006 3,129 3,070 3,129 3,070
The provision relates to restoration obligations in relation to a lease agreement for the jetty at Marsden Point.

61
Note 20 Equity
N o t e s t o t h e F i n a n c i a l S t a t e m e n t sFor the Year Ended 31 December 2006
T h e N e w Z e a l a n d R e f i n i n g C o m p a n y L i m i t e d
Contributed Hedge Retained Minority TotalEquity Reserve Profits Total Interests Equity$000 $000 $000 $000 $000 $000Group
Balance at 31 December 2004 24,000 (717) 442,706 465,989 344 466,333
Profit after tax – – 161,550 161,550 – 161,550
Foreign exchange hedges transferred to property, plant and equipment – 1,050 – 1,050 – 1,050
Foreign exchange contracts entered into during the year – 790 – 790 – 790
Electricity contracts transferred to income statement – (155) – (155) – (155)
Electricity contracts entered into during the year – 1,749 – 1,749 – 1,749
Movement in value of electricity contracts held throughout the year – 1,522 – 1,522 – 1,522
Actuarial gain/(loss) recognised in the pension scheme – – (5,557) (5,557) – (5,557)
Deferred tax on items recognised directly in equity – (1,635) 1,834 199 – 199
Total recognised income and expenses for the year – 3,321 157,827 161,148 – 161,148
Dividends provided for or paid – – (72,028) (72,028) – (72,028)
Unclaimed dividends written back – – 17 17 – 17
Movement in minority interest – – – – 170 170
Balance at 31 December 2005 24,000 2,604 528,522 555,126 514 555,640
Profit after tax – – 135,542 135,542 – 135,542
Foreign exchange hedges transferred to property, plant and equipment – (790) – (790) – (790)
Foreign exchange contracts entered into during the year – (513) – (513) – (513)
Electricity contracts transferred to income statement – (1,347) – (1,347) – (1,347)
Electricity contracts entered into during the year – (2,473) – (2,473) – (2,473)
Movement in value of electricity contracts held throughout the year – (2,377) – (2,377) – (2,377)
Actuarial gain/(loss) recognised in the pension scheme – – 6,613 6,613 – 6,613
Deferred tax on items recognised directly in equity – 2,475 (2,182) 293 – 293
Total recognised income and expenses for the year – (5,025) 139,973 134,948 – 134,948
Dividends provided for or paid – – (78,011) (78,011) – (78,011)
Movement in minority interest – – – – (69) (69)
Balance at 31 December 2006 24,000 (2,421) 590,484 612,063 445 612,508
Hedge reserve – for a description of the Hedge Reserve see note 8.
Share capital – At 31 December 2006 there were 240,000,000 shares issued and fully paid (2005: 240,000,000). All ordinary shares rank equally with onevote attached to each fully paid ordinary share.

62
Note 20 Equity continued
N o t e s t o t h e F i n a n c i a l S t a t e m e n t sFor the Year Ended 31 December 2006
Contributed Hedge RetainedEquity Reserve Profits Total$000 $000 $000 $000Parent
Balance at 31 December 2004 24,000 (717) 442,834 466,117
Profit after tax – – 161,345 161,345
Foreign exchange hedges transferred to property, plant and equipment – 1,050 – 1,050
Foreign exchange contracts entered into during the year – 790 – 790
Electricity contracts transferred to income statement – (155) – (155)
Electricity contracts entered into during the year – 1,749 – 1,749
Movement in value of electricity contracts held throughout the year – 1,522 – 1,522
Actuarial gain/(loss) recognised in the pension scheme – – (5,557) (5,557)
Deferred tax on items recognised directly in equity – (1,635) 1,834 199
Total recognised income and expenses for the year – 3,321 157,622 160,943
Dividends provided for or paid – – (72,000) (72,000)
Unclaimed dividends written back – – 17 17
Balance at 31 December 2005 24,000 2,604 528,473 555,077
Profit after tax – – 135,739 135,739
Foreign exchange hedges transferred to property, plant and equipment – (790) – (790)
Foreign exchange contracts entered into during the year – (513) – (513)
Electricity contracts transferred to income statement – (1,347) – (1,347)
Electricity contracts entered into during the year – (2,473) – (2,473)
Movement in value of electricity contracts held throughout the year – (2,377) – (2,377)
Actuarial gain/(loss) recognised in the pension scheme – – 6,613 6,613
Deferred tax on items recognised directly in equity – 2,475 (2,182) 293
Total recognised income and expenses for the year – (5,025) 140,170 135,145
Dividends provided for or paid – – (78,000) (78,000)
Balance at 31 December 2006 24,000 (2,421) 590,643 612,222
T h e N e w Z e a l a n d R e f i n i n g C o m p a n y L i m i t e d

63
Note 21 Dividends C e n t s p e r S h a r e TOTA L
2006 2005 2006 2005Cents Cents $000 $000
Interim dividends for the year ended 31 December 2006 10.0 24,000
Final dividend for the year ending 31 December 2005 22.5 54,000
Interim dividend for the year ended 31 December 2005 10.0 24,000
Final dividend for the year ended 31 December 2004 20.0 48,000
32.5 30.0 78,000 72,000
The dividends are fully imputed. Supplementary dividends of $2,197,828 (2005: $1,945,878) were paid to shareholders not tax resident in New Zealand forwhich the Group received a foreign investor tax credit entitlement.
N o t e s t o t h e F i n a n c i a l S t a t e m e n t sFor the Year Ended 31 December 2006
T h e N e w Z e a l a n d R e f i n i n g C o m p a n y L i m i t e d
Note 22 Capital Commitments
Note 23 Operating Lease Commitments
G R O U P A N D PA R E N T
2006 2005$000 $000
Commitments at the end of the year not provided for in the financial statements 2,720 6,727
As lessee
There is a liability for property rental of $500,000 per annum (2005: $500,000), expiring in 2024.
Other commitments for operating leases which are unable to be cancelled fall due as follows:
– no later than one year 96 88
– one to five years 27 43
– beyond five years 17 7
140 138
As lessor
Commitments for operating leases where the Group is lessor which are unable to be cancelled fall due as follows:
– no later than one year 6,609 6,609
– one to five years 25,934 25,934
– beyond five years 80,558 87,166
113,101 119,709
Note 24 Contingent Liabilities
Contingent liabilities under contracts, guarantees and other agreements arising in the ordinary course of business on which no loss is anticipated are as follows:
Guarantee to the New Zealand Stock Exchange 75 75
Total contingent liabilities 75 75

64
Note 25 Related Parties G R O U P PA R E N T
2006 2005 2006 2005
N o t e s t o t h e F i n a n c i a l S t a t e m e n t sFor the Year Ended 31 December 2006
T h e N e w Z e a l a n d R e f i n i n g C o m p a n y L i m i t e d
(a) Income from related parties
Income from processing, pipeline and Wiri Terminal is all derived from the oilmarketing companies, whose shareholdings in the Parent Company are disclosed in the shareholders information.
The proportion of income from each company was:
(b) Operating costs
The Parent Company has an operating service agreement with ShellInternational group of companies and a number of ‘arms length’ transactionsare conducted with Shell and associates.
The proportion of costs in this category are:
(c) Project expenditure
The Parent Company uses the Shell International group of companies fortechnical and engineering expertise on various capital projects.
Costs incurred in this category are:
(d) Accounts receivable
Amounts owing at 31 December are:
(e) Accounts payable
Amounts payable at 31 December are:
BP 26% 23% 26% 23%
Chevron 22% 21% 22% 21%
Mobil 20% 22% 20% 22%
Shell 32% 34% 32% 34%
100% 100% 100% 100%
Process materials and utilities 1% 1% 1% 1%
Administration and other expenses 4% 7% 6% 7%
G R O U P PA R E N T
2006 2005 2006 2005$000 $000 $000 $000
Future Fuels project 103 82 103 82
Other capital projects 882 24 882 24
Point Forward project 374 – 374 –
1,359 106 1,359 106
BP 34,444 26,328 34,430 26,311
Chevron 18,514 33,129 18,514 33,129
Mobil 16,311 20,165 16,311 20,165
Shell 34,443 37,303 34,430 37,303
103,712 116,925 103,685 116,908
BP 58 33 45 33
Chevron – 17 – 17
Mobil – 33 – 33
Shell 649 961 649 961
707 1,044 694 1,044

65
Note 25 Related Parties continued
Note 26 Events after Balance Date
N o t e s t o t h e F i n a n c i a l S t a t e m e n t sFor the Year Ended 31 December 2006
T h e N e w Z e a l a n d R e f i n i n g C o m p a n y L i m i t e d
G R O U P PA R E N T
2006 2005 2006 2005$000 $000 $000 $000
(f) Wiri Terminal
Wiri Terminal is leased to the oil marketing companies. The rental is disclosed in note 4.
An option exists for the oil marketing companies to purchase the Wiri Terminal at an agreed independent valuation of the market value of thecompanies’ interest.
h) Insurance
47.5% (2005: 25%) of the Group’s Material Damage and Business InterruptionInsurance is held by companies related to Shareholders. These companies received 47.5% (2005: 25%) of the insurance premium paid by the Parent company.
The insurance companies and their percentage of the insurance are:
(i) Key management personnel
Payments made to key management personnel within the Group are as follows:
PA R E N T
2006 2005$000 $000
(g) Independent Petroleum Laboratories Limited (IPL)
The parent owns 74.2% of Independent Petroleum Laboratories Limited (2005: 74.2%) with the cost of theinvestment amounting to $809,000 (2005: $809,000). The principal activity of IPL is laboratory fuel testing.
Services sold to Parent 2,816 2,766
Goods and services sold to IPL 2,840 2,785
Interest paid by IPL to Parent on this facility 24 19
Balance owing by IPL to Parent on the facility at 31 December 500 167
Since November 2001 a revolving credit facility was set up by the Parent to assist withits cash flow.
G R O U P PA R E N T
2006 2005 2006 2005
Jupiter Insurance Ltd (BP) 18.02% – 18.02% –
Solen Versichenungen AG (Shell) 17.14% 13.00% 17.14% 13.00%
Iron Horse (Chevron/Texaco) 12.34% 12.00% 12.34% 12.00%
47.50% 25.00% 47.50% 25.00%
On the insurance placement for General Liability, Ancon, (Exxon Mobil) participate for 19.20% (2005: Nil).
Salaries and other short-term employee benefits 2,433 1,865 2,433 1,865
Number of personnel 7 6 7 6
(j) Defined Benefit Pension Plan
For a description of this plan see note 14.
The Parent Company charges an administration fee to the Pension Fund of $40,320 (2005: $41,586).
The Group has declared a final dividend of 35 cents, fully imputed, payable 29 March 2007 (2005: 22.5 cents).

66
Note 27 Reconciliation of Net Cash Flow from Operating Activities to Reported Profit
N o t e s t o t h e F i n a n c i a l S t a t e m e n t sFor the Year Ended 31 December 2006
T h e N e w Z e a l a n d R e f i n i n g C o m p a n y L i m i t e d
G R O U P PA R E N T
2006 2005 2006 2005$000 $000 $000 $000
Operating profit after taxation 135,473 161,720 135,739 161,345
Adjusted for:
Depreciation and amortisation 56,474 39,948 56,130 39,635
Loan settlement payment – (31,466) – (31,466)
Movement in deferred tax (1,783) 9,811 (1,783) 9,811
Less deferred tax movement direct to reserves 293 199 293 199
Provision for restoration costs 282 241 282 241
Revaluation of investment property (1,800) (150) (1,800) (150)
Impact of changes in working capital items
Decrease/(increase) in debtors and prepayments 13,401 (6,141) 13,513 (6,143)
(Decrease)/increase in creditors and provisions (19,730) 10,698 (19,820) 7,575
Increase in employee entitlements 261 (3,176) 261 52
Increase/(decrease) in taxation payable (672) (2,317) (478) (2,370)
Increase in inventories (23,409) (1,224) (23,409) (1,208)
Less catalyst stocks related to investing activities 21,784 – 21,784 –
Settlement of interest rate swap 85 (85) 85 (85)
Dividend from Subsidiary – – (81) (81)
Contributions to defined benefit scheme (473) (2,395) (473) (2,395)
Cash generated from operations 180,186 175,663 180,243 174,960

67
Note 28 Explanation of transition to New Zealand equivalents to IFRS
N o t e s t o t h e F i n a n c i a l S t a t e m e n t sFor the Year Ended 31 December 2006
T h e N e w Z e a l a n d R e f i n i n g C o m p a n y L i m i t e d
Effect ofPrevious transition to
NZ GAAP NZ IFRS NZ IFRSNote $000 $000 $000
(a) Reconciliation of profit for the 12 months ended 31 December 2005 – Group
Income 28(1)
Operating revenue 364,563 – 364,563
Loan settlement amortisation 28(8) – 31,466 31,466
Change in value of investment property 28(7) – 150 150
364,563 31,616 396,179
Expenses
Purchase of process materials and utilities 37,512 – 37,512
Materials and contractor payments 32,721 (12,138) 20,583
Wages and salaries 31,601 (167) 31,434
Depreciation and amortisation 21,842 18,106 39,948
Administration and other expenses 23,235 (2,395) 20,840
146,911 3,406 150,317
Profit before finance costs 217,652 28,210 245,862
Less net finance costs 4,400 156 4,556
Profit before income tax 213,252 28,054 241,306
Less Income tax 73,295 6,291 79,586
Profit after tax 139,957 21,763 161,720
Less Profit attributable to minority interest 2 170 – 170
Profit attributable to shareholders of The New Zealand Refining Company Limited 139,787 21,763 161,550

68
Note 28 Explanation of transition to New Zealand equivalents to IFRS continued
N o t e s t o t h e F i n a n c i a l S t a t e m e n t sFor the Year Ended 31 December 2006
T h e N e w Z e a l a n d R e f i n i n g C o m p a n y L i m i t e d
Effect ofPrevious transition to
NZ GAAP NZ IFRS NZ IFRSNote $000 $000 $000
(b) Reconciliation of equity at 1 January 2005 – opening position – Group
ASSETS
Current assets
Cash and cash equivalents 6,594 – 6,594
Trade and other receivables 113,127 – 113,127
Consumables, stores and spares 11,078 – 11,078
Total current assets 130,799 – 130,799
Non-current assets
Property, plant and equipment 28 (4,5,9) 411,451 222,389 633,840
Investment property 28(7) – 2,300 2,300
Pension assets 28(6) – 5,151 5,151
Intangible assets 28(5) – 1,037 1,037
Total non-current assets 411,451 230,877 642,328
TOTAL ASSETS 542,250 230,877 773,127
LIABILITIES
Current liabilities
Bank overdraft 40 – 40
Derivative financial instruments 28(3) – 1,071 1,071
Trade and other payables 99,263 – 99,263
Income taxation 3,082 – 3,082
Employee entitlements 28(6) 3,228 201 3,429
Total current liabilities 105,613 1,272 106,885
Non-current liabilities
Bank borrowings 45,098 – 45,098
Deferred tax 28(2-9) 10,050 106,562 116,612
Employee entitlements 28(6) 3,375 946 4,321
Provision for restoration costs 28(4) – 2,412 2,412
Loan settlement 28(8) – 31,466 31,466
Total non-current liabilities 58,523 141,386 199,909
TOTAL LIABILITIES 164,136 142,658 306,794
NET ASSETS 378,114 88,219 466,333
EQUITY
Contributed equity 24,000 – 24,000
Hedge reserve 28(3) – (717) (717)
Retained profits 28(2-9) 353,770 88,936 442,706
Minority interests 344 – 344
TOTAL EQUITY 378,114 88,219 466,333

69
Note 28 Explanation of transition to New Zealand equivalents to IFRS continued
N o t e s t o t h e F i n a n c i a l S t a t e m e n t sFor the Year Ended 31 December 2006
T h e N e w Z e a l a n d R e f i n i n g C o m p a n y L i m i t e d
Effect ofPrevious transition to
NZ GAAP NZ IFRS NZ IFRSNote $000 $000 $000
(c) Reconciliation of equity at 31 December 2005 – Group
ASSETS
Current assets
Cash and cash equivalents 4,642 – 4,642
Derivative financial instruments 28(3) – 2,222 2,222
Trade and other receivables 119,268 – 119,268
Consumables stores and spares 12,302 – 12,302
Total current assets 136,212 2,222 138,434
Non-current assets
Property, plant and equipment 28(4,5,9) 478,006 215,117 693,123
Investment property 28(7) – 2,450 2,450
Intangible assets 28(5) – 2,758 2,758
Pension asset 28(6) – 1,990 1,990
Derivative financial instruments 28(3) – 1,749 1,749
Total non-current assets 478,006 224,064 702,070
TOTAL ASSETS 614,218 226,286 840,504
LIABILITIES
Current liabilities
Bank overdraft 31 – 31
Trade and other payables 105,900 – 105,900
Income taxation 765 – 765
Employee entitlements 28(6) 4,061 238 4,299
Total current liabilities 110,757 238 110,995
Non-current liabilities
Bank borrowings 40,040 – 40,040
Deferred tax 28(2-9) 13,767 112,656 126,423
Provision for restoration costs 28(4) – 3,070 3,070
Employee entitlements 28(6) 3,594 742 4,336
Total non-current liabilities 57,401 116,468 173,869
TOTAL LIABILITIES 168,158 116,706 284,864
NET ASSETS 446,060 109,580 555,640
EQUITY
Contributed equity 24,000 – 24,000
Hedge reserve 28(3) – 2,604 2,604
Retained profits 28(2-9) 421,546 106,976 528,522
Minority interests 514 – 514
TOTAL EQUITY 446,060 109,580 555,640
(d) Parent Company
The above adjustments are also applicable to the Parent.

70
Note 28(1) Format of Profit and Loss
In accordance with NZ IAS 1 the profit and loss has been presented by nature of expense.
Note 28(2) Income Taxes
Deferred taxation has been recognised using the comprehensive basis applied to temporary differences together with a different test associated withrecognition of losses. This has resulted in the Group recognising deferred tax balances in accordance with NZ IAS 12. This includes a deferred taxationliability in respect of Refining Assets that were revalued in 1977.
On transition to IFRS, the following adjustments have been effected to account for the temporary difference generated from the 1977 revaluation as follows:
Note 28(3) Financial Instruments
The Group maintains an off balance sheet portfolio of hedging instruments (derivatives) as follows:
• Forward foreign currency contracts (FEC’s) – to hedge the currency risks resulting from the purchase of capital equipment.
• Electricity contracts for differences (CFD’s) – to hedge the price risk resulting from the purchase of electricity.
• Interest rate swap – to hedge the interest rate risks resulting from term borrowings.
In accordance with NZ IAS 39, the fair value of derivatives entered into by the Group has been recognised in the Balance Sheet.Changes in the value of these derivatives have been recorded either through the Income Statement or Equity depending onhedging documentation and effectiveness.
On transition to IFRS, the following adjustments have been effected to account for financial instruments:
Note 28(4) Provisions
In accordance with NZ IAS 37 the Group has recognised a provision for restoration costs for certain leasehold property.
On transition to IFRS, the following adjustments have been effected to account for rehabilitation costs:
N o t e s t o t h e F i n a n c i a l S t a t e m e n t sFor the Year Ended 31 December 2006
T h e N e w Z e a l a n d R e f i n i n g C o m p a n y L i m i t e d
1 January 31 December2005 2005$000 $000
(Increase) in deferred taxation liability (2,175) (1,967)
Decrease in equity 2,175 1,967
(Increase)/decrease in liabilities (1,071) 3,971
Decrease/(increase) in equity 1,071 (3,971)
(Hedge reserve)
Deferred tax effect
Decrease/(increase) in liabilities 353 (1,310)
(Increase)/decrease in equity (353) 1,310
(Increase) in liabilities (2,412) (3,070)
Increase in assets 247 654
Decrease in equity 2,165 2,416
Deferred tax effect
Decrease in liability 715 798
(Increase) in equity (715) (798)

71
Note 28(5) Property, Plant and Equipment
In accordance with NZ IAS 16, certain maintenance and shutdown costs are capitalised and depreciated over the period to the next planned regular majorinspection or shutdown.
On transition to IFRS, the following adjustments have been effected:
N o t e s t o t h e F i n a n c i a l S t a t e m e n t sFor the Year Ended 31 December 2006
T h e N e w Z e a l a n d R e f i n i n g C o m p a n y L i m i t e d
1 January 31 December2005 2005$000 $000
Increase in assets 26,855 30,553
(Increase) in equity (26,855) (30,553)
Deferred tax effect
(Increase) in liability (8,861) (10,082)
Decrease in equity 8,861 10,082
In accordance with IAS 38, software costs have been reclassified from property, plant and equipment to intangible assets. The total software costs at 1 January 2005 and 31 December 2005 were $1,037,000 and $2,758,000 respectively.
Note 28(6) Employee Benefits
The company has a “defined benefit” post employment plan and offers other retirement benefits to certain retirees. An independent actuarial valuation has been performed by Mercer Investment Consulting to determine the funding position of the plan together with the Company’s obligation for other retirement benefits. The company has recognised all of thecumulative actuarial gain on transition in accordance with NZ IFRS 1.
On transition to IFRS, the following adjustments have been effected to account for the defined benefit plan:
Increase/(decrease) in assets 5,151 1,990
(Increase)/decrease in equity (5,151) (1,990)
Deferred tax effect
(Increase)/decrease in liability (1,700) (656)
Decrease/(increase) in equity 1,700 656
On transition to IFRS, the following adjustments have been effected to account for other post employment benefits:
(Increase) in liabilities (1,147) (980)
Decrease in equity 1,147 980
Deferred tax effect
Decrease in liability 378 323
(Increase) in equity (378) (323)
Note 28(7) Investment Property
The Group leases land to an independent third party which meets the definition of an investment property under NZ IAS 40.Telfer Young (Northland) Limited undertook a valuation of the Group’s investment property effective as at 31 December 2004.
The valuation was carried out in accordance with NZ IAS 40 and the valuation report, dated 13 December 2005, states that the fair value of the property was $2.3 million as at 31 December 2004.
On transition to IFRS, the following adjustments have been effected to account for investment properties:
Increase in assets 2,112 2,262
(Increase) in equity (2,112) (2,262)
Deferred tax effect
(Increase) in liability (697) (746)
Decrease in equity 697 746

72
Note 28(8) Government Grants
NZ IAS 20, Accounting for Government Grants and Disclosure of Government Grants, requires government grants to be recognised as income over theperiods necessary to match them to the related costs which they are intended to compensate, on a systematic basis.
The grant related to the Refinery’s “Expansion Assets” and equated to the original cost of those assets. The Company has recognised the grant as incomeover a 20 year period which reflects the original life assigned to the expansion assets when they came “on-stream” on 1 January 1986.
Depreciation on the expansion assets was originally deductible for tax purposes but these deductions were subsequently reversed when the expansion loanswere assumed by the Government.
This means that the Company has recognised a deferred taxation liability in respect of the expansion assets recorded as at 31 December 2004 and also adeferred taxation benefit in respect of the unamortised balance of the “Loan Settlement Payment”.
On a transition to IFRS, the following adjustments have been effected to account for the loan settlement payment:
Note 28(9) NZ IFRS 1 – Application of optional exemptions
• “Deemed cost” – Refinery to Auckland Pipeline
This exemption allows a company, on adoption, to measure an item of property, plant and equipment at the date of transition to NZ IFRS at its fair value,and use that fair value as “deemed cost”. The Group has taken advantage of this exemption, and has applied a “deemed cost” valuation to the Refinery toAuckland Pipeline (RAP).
Beca Valuations Limited have undertaken a valuation of the cash flow streams attributable to the oil products pipeline that starts at the Marsden PointRefinery and ends at the Wiri Oil Services Limited Terminal in Auckland. The valuation was carried out in accordance with NZ IAS 16, Property, Plant andEquipment. The valuation report dated 9 January 2006, states the fair value of the RAP is $220 million as at 31 December 2004.
On transition to IFRS, the following adjustments have been effected to account for the RAP at “deemed cost”.
N o t e s t o t h e F i n a n c i a l S t a t e m e n t sFor the Year Ended 31 December 2006
T h e N e w Z e a l a n d R e f i n i n g C o m p a n y L i m i t e d
1 January 31 December2005 2005$000 $000
1 January 31 December2005 2005$000 $000
(Increase) in liabilities (31,466) –
Decrease in equity 31,466 –
Deferred tax effect
Net (increase) in liability (29,726) (37,353)
Decrease in equity 29,726 37,353
The loan settlement payment was fully amortised at 31 December 2005.
Increase in assets 196,512 186,856
(Increase) in equity (196,512) (186,856)
Deferred tax effect
(Increase) in liability (64,849) (61,663)
Decrease in equity 64,849 61,663
• Deemed cost – Expansion assets
In December 2000, the Company impaired the Refinery’s expansion assets recorded in the financial statements by $339 million. The written down valuewas comparable to “fair value”.
The Company has adopted the carrying value of the expansion assets at 31 December 2004 of $121.55 million as “deemed cost” in accordance with NZ IFRS 1.
The Company simultaneously reassessed the estimated remaining lives of the expansion assets which were extended for a further 20 years through to 2020.
• Employee benefits
As stated above, the Group has recognised all cumulative actuarial gains at the date of transition to IFRS as an adjustment to opening retained earnings.

73
Tr e n d S t a t e m e n tFor the Years Ended 31 December
T h e N e w Z e a l a n d R e f i n i n g C o m p a n y L i m i t e d
NZ IFRS NZ IFRS Restated
2006 2005 2004 2003 2002 2001$000’s $000’s $000’s $000’s $000’s $000’s
Financial Performance
Group Revenue 403,694 396,179 281,374 189,618 161,733 178,569
Profit before depreciation, amortisation and interest (EBITDA) 258,485 285,810 174,361 88,132 76,683 90,374
Other items – – – 5,522 (3,943) 6,557
Depreciation and amortisation 56,474 39,948 24,125 24,247 23,324 25,268
Profit before interest and tax 202,011 245,862 150,236 58,363 57,302 58,549
Net interest revenue/(cost) 241 (4,556) 940 1,218 798 1,850
Profit before taxation 202,252 241,306 151,176 59,581 58,100 60,399
Income tax expense 66,779 79,586 53,563 22,579 22,599 23,942
Operating profit before tax attributable to members 135,473 161,720 97,613 37,002 35,501 36,457
Financial Position
Funds employed
Share capital 24,000 24,000 24,000 24,000 24,000 24,000
Retained earnings 588,508 531,640 354,114 294,879 284,257 302,795
612,508 555,640 378,114 318,879 308,257 326,795
Loan funds – 40,040 45,098 – – –
Deferred tax/provisions 136,008 133,829 13,425 11,710 11,138 8,537
748,516 729,509 436,637 330,589 319,395 335,332
Funds utilised
Non-current assets 685,475 702,070 411,451 295,329 295,849 310,260
Working capital 63,041 27,439 25,186 35,260 23,546 25,072
748,516 729,509 436,637 330,589 319,395 335,332
Analytical Information
Return on average shareholder funds (%) 23 27 26 12 12 11
Earnings per share ($) * 0.564 0.674 0.406 0.154 0.148 0.152
Effective tax rate 33% 32% 35% 38% 39% 40%
Asset backing per share ($) * 2.55 2.32 1.575 1.329 1.284 1.362
Dividend per share (cents) 308 300 160 110 225 50
Dividend paid ($) 78,000 72,000 38,400 26,400 54,000 12,000
Dividends declared per share – interim * 10cps 10cps 100cps 60cps 100cps 50cps
Dividends declared per share – final * 22.5cps 20cps 200cps 60cps 50cps 125cps
Dividend cover 1.74 2.24 2.5 1.4 0.66 3.04
Working capital ratio 1.7 1.3 1.2 1.4 1.3 1.3
* In October 2005 there was a 10 for 1 share split. For purposes of comparison, the statistics for all years prior to 2005 have been adjusted as if the splitapplied in those years also. The assumption for each year is 240,000,000 shares of $0.10 value.

74
S h a r e h o l d e r I n f o r m a t i o nAs at 31 January 2007
T h e N e w Z e a l a n d R e f i n i n g C o m p a n y L i m i t e d
Twenty Largest Shareholders Total Shares Held % of Total
1 BP New Zealand Holdings Limited 56,777,160 23.66
2 Mobil Oil NZ Limited 46,080,000 19.20
3 Shell New Zealand Holding Company Limited 41,142,840 17.14
4 Emerald Capital Holdings Limited 32,000,000 13.33
5 Caltex New Zealand Limited 30,458,490 12.69
6 Westpac Nominees (NZ) Limited - A/C NZCSD 2,012,374 0.84
7 National Nominees New Zealand Limited - A/C NZCSD 890,244 0.37
8 Citibank Nominees (New Zealand) Limited - A/C NZCSD 702,877 0.29
9 ANZ Nominees Limited - A/C NZCSD 669,011 0.28
10 ASB Nominees Limited 668,369 0.28
11 David Mitchell Odlin 571,400 0.24
12 Rees Hollier John Jones & Moira Marguerite Jones & Walter Mick George Yovich 360,312 0.15
13 Walter Mick George Yovich & Jeanette Julia Yovich 343,742 0.14
14 Peter Hanbury Masfen & Joanna Alison Masfen 300,000 0.13
15 Westpac Banking Corporation - Client Assets No 2 - A/C NZCSD 294,116 0.12
16 Custodial Services Limited 274,516 0.11
17 Edgar Albert Johnson & Cherry Johnson & Walter Mick George Yovich 244,000 0.10
18 James Walter Kent 200,000 0.08
19 PHP Bayly Limited 200,000 0.08
20 Patrick Emmett Murphy 166,000 0.07
214,355,451 89.31
Shareholder Spread
No. of Shares Shareholders % Holder Shares % of Shares
1 - 499 103 4 27,602 0
500 - 999 175 6 111,258 0
1,000 - 1,999 479 16 575,092 0
2,000 - 4,999 859 29 2,562,572 1
5,000 - 9,999 569 19 3,622,822 2
10,000 - 49,999 691 23 12,014,181 5
50,000 - 99,999 55 2 3,474,991 1
100,000 - 499,999 30 1 4,787,934 2
500,000 - 999,999 2 0 1,239,769 1
1,000,000 upwards 7 0 211,583,779 88
2,970 100 240,000,000 100
Geographical Spread
No. of Shares Shareholders % Holder Shares % of Shares
Auckland (Greater) 899 30 40,451,899 17
Wellington 401 14 182,948,075 76
Whangarei 282 9 3,725,570 2
Other North Island 570 19 5,159,609 1
South Island 729 25 6,919,132 3
Australia 49 2 519,512 1
Overseas 40 1 276,203 0
2,970 100 240,000,000 100

75
S h a r e P r i c e Pe r f o r m a n c e
T h e N e w Z e a l a n d R e f i n i n g C o m p a n y L i m i t e d
NZRC Share Price vs NZX 50 Gross Index – One Year
NZRC Share Price vs NZX 40 & 50 Gross Index – Five Years
1,500
2,000
2,500
3,000
3,500
4,000
NZX
50
Gro
ss In
dex
3.00
9.00
Jan 06 Mar 06 May 06 Sep 06 Nov 06 Jan 07
NZR
C Sh
are
Pric
e N
Z$
4.00
5.00
6.00
7.00
8.00
4,500
Jun 06
1,500
2,000
2,500
3,000
3,500
NZX
40
& 50
Gro
ss In
dex
0.00
9.00
Jan 02 Jan 03 Jan 04 Jan 05 Jan 06 Jan 07
NZR
C Sh
are
Pric
e N
Z$
2.00
3.00
4.00
5.00
6.00
4,000
1.00
7.00
8.00

76
S u p p l i e r sFor the Year Ending 31 December
T h e N e w Z e a l a n d R e f i n i n g C o m p a n y L i m i t e d
The Group deals with many local, national and international suppliers to provide the materials and services required to carry on the business. A very goodrelationship exists between the suppliers and the Group. This is attributable in the main, to the Parent Company's excellent record over the years of ensuring thatpayment for services, supplies and contracts are made within the agreed contractual payment terms.
The costs of all goods, materials and services purchased by the Group for the past five years are:
NZ IFRSNZ IFRS Restated
2006 2005 2004 2003 2002$000 $000 $000 $000 $000
184,044 184,933 215,211 99,788 67,663
These costs include materials and contractor labour for capital projects.
Suppliers representing 10% or more of total purchases in the period are:
Transfield Worley 15% (This includes all onsite contractors who are managed by TWNZ on the Refinery's behalf)
UOP LLC 13%
Mercury Energy 12%
Worley Parsons Services Pty Ltd 10%
The top ten suppliers by spend in 2006 were:
Transfield Worley Ltd Engineering and maintenance services
UOP LLC Purchase of catalyst and consultantancy services
Mercury Energy Electricity supply
Worley Parsons Services Pty Ltd Engineering services for Point Forward Project
NGC Energy Natural gas supply
Shell Global Solutions International BV Various engineering and technical assistance
Marsh Limited Insurance arranger
Whangarei District Council Water and rates
Northpower Line charges
Independent Petroleum Laboratories Ltd Laboratory testing services
Cald
ers
Desig
n an
d Pr
int C
o.

C o r p o r a t e D i r e c t o r y
T h e N e w Z e a l a n d R e f i n i n g C o m p a n y L i m i t e d
Registered Office
Marsden PointRuakaka
Mailing Address
Private Bag 9024WhangareiTelephone +64 9 432 8311Facsimile: +64 9 432 8035
Website
www.nzrc.co.nz
Share Registrar
Computershare Investor Services LimitedPrivate Bag 92119Auckland 1020
Bankers
The National Bank of New Zealand
Bank of New Zealand
Legal Advisers
MinterEllisonRuddWatts
Auditor
PricewaterhouseCoopers
Chairman
I.F. Farrant
Directors
A.P. Borgesen
C.K. Bower
P.C.A. Colman
G.A. Cumming
P.W. Griffiths
G.W. Hensen
K.A. Hirschfeld
D.A. Jackson
Sir C.J. Maiden
C.M. Midgley
Chief Executive Officer
J.A. Kerrigan
Company Secretary
D.B. Martin
F i n a n c i a l C a l e n d a r
Annual General Meeting
Thursday 26 April 2007 at 2.00pmCrowne Plaza HotelAlbert StreetAuckland
Proxies Lodged
By 2.00pm 24 April 2007
Dividend Payable
2006 Final – 29 March 2007
2007 Interim – September 2007
Share Transfer Register
Closes 5.00pm 22 March 2007 and reopens 23 March 2007
2007 Results Announced
Half Year – 23 August 2007
Annual – Late February 2008