Embed Size (px)
Citation preview
Forthcoming 11
InterCon Travel Health Case Study
Gregory E. Truman, Dessislava Pachamanova and Michael GoldsteinBabson College
InterCon provides services to health insurers of foreign tourists who travel to the United States andCanada. After experiencing high growth, the company confronts several operational challenges.As a responsive measure, management considers developing an IT system. The system must gothrough the formal capital investment evaluation process, which requires estimation of costs andbenefits and uses the NPV method. Subject to uncertainty, "soft" benefits are computed fromprobability distributions. All costs and benefits are treated as discounted cash flows. Employing aMonte Carlo simulation modeled in a common spreadsheet program, management must decide
whether to fund the IT system.
Keywords: IT system development, soft benefits, Monte Carlo simulation, NPV analysisDisciplines of Interest: Information Technology, Decision Support Systems, Finance
INTRODUCTION1,2,3
This case study involves students in an ITplanning exercise. Broadly defined here, IT planninginvolves activities related to the evaluation of a capitalinvestment in a new computer-based application. Thegeneral objective is to decide whether the newapplication provides sufficient benefits to justify thecosts. More specifically, the case study has theseobjectives.
• Identify typical costs and benefits that are associatedwith a new computer-based application.
• Apply discounted cash flows to cost and benefitestimates in order to account for realistic timeconsiderations that occur in applicationdevelopment and use.
• Base benefit estimates on probability distributions todeal with the uncertainty that commonly ariseswhen measuring them.
• Model the capital investment evaluation problemusing a Monte Carlo simulation in a commonspreadsheet program.
• Integrate terminology and concepts from information
systems, finance and statistics into one practical managerial decision-making context.
MOTIVATION
There is need for general analytic methods thatfacilitate reasonably complete and accurate evaluationof capital investments in computer-based applicationsfor at least two reasons. First, there is someskepticism of and critical disposition towardsinvesting in application development projects, becauseprojects fall short of expectations by coming in over-budget or by lacking planned features. In the worst4
case, entire systems are scrapped causing largeinvestments to be written off. Second, proposedapplications compete for limited resources with capitalinvestments in buildings, equipment and otherassorted long-term assets.
THE AUDIENCE
Central features of our general analytic methodare taken from finance and statistics principles.Finance principles include discounted cash flows (or
12 Journal of the Academy of Business Education
the time-value of money) and capital investmentevaluation methods (e.g., net present value). Statisticsconcepts include probability distributions as a meansto deal with decision uncertainty. These concepts aregenerally taught in introductory (or core) finance andstatistics courses. Thus, any course that generallyoccurs after introductory-level courses would offersuitable contexts, such as finance, statistics, datamodeling and information systems electives. This casestudy may also be used in a “capstone” course, sinceit integrates concepts from three disciplines into onepractical decision-making context.
INTERCON TRAVEL HEALTH: CASE 5
Toronto-based InterCon Travel Health providesservices to health insurers of foreign tourists whotravel to the United States and Canada and experienceinjury or sickness while there. As an example,consider a Spanish tourist who falls on the steps of theMuseum of Modern Art in New York City and breakshis hip. This tourist will obviously require surgerybefore returning to Spain. After the tourist contactshis health care insurer, the foreign entity may workwith InterCon to facilitate the insurer’s obligations tothe patient and provider. In short, InterCon will finda local health provider, and will handle alladministrative and payment needs related to thesurgery and hospitalization. InterCon is effectively a“middleman” between an American and Canadianhealth care provider network and foreign healthinsurance entities.6
Like any HMO, InterCon has a network ofdoctors who give discounted rates in return for aguaranteed customer base. The providers discounttheir rates in exchange for a commitment of relativelyprompt payment from InterCon as well. Moreover, thecustomer base consists of sick or injured foreigntourists, a potentially profitable customer segmentbecause most tourists require only minor treatment andrarely come back for follow-up visits. Consequently,InterCon can pass significant savings along to theforeign insurer, which may otherwise be forced to paya higher claim to a provider not in InterCon’s network.In exchange for the lower claim fee, the foreigninsurers pay a processing fee to InterCon. Anotheradvantage from the insurers’ perspective is dealingwith a single point-of-contact while administering
claim payment. InterCon’s processing fee is currentlyset at 9.5% of the claim amount, which is dividedevenly between the providers and insurers. InterConwill hold back 4.25% of the claim amount from thepayment to the provider, and will add 4.25% above theclaim amount to the foreign insurer’s charge.
The travel health care market has grownsignificantly during the past few years, and InterConhas grown with it. In 2001, InterCon had begunexperiencing increasing difficulty with a claimsprocessing procedure that was largely manual. Withthe annual number of claims having reached 20,000,the company realized that it must begin automatingmore of the business processes involving claims. Thiswas particularly true provided the expected growthrate in the short term. Management was currentlyplanning for an expected 3% annual growth rate inclaim volume, and they were fairly certain that growthwould hold in the 2-4% range in the short term.
In addition, the claims volume was highlycyclical, lagging about four to six weeks behind peaktravel times. Thus, the bulk of claims came in fromaround mid-July to late-September, and the companyroutinely experienced a spike in late-January throughearly-February. Because substantial time andinvestment were needed to train claim administratorsin this specialized area of medical claimsadministration, use of temporary workers wasimpractical. Therefore claims administration stafflevels were held constant during peak processingtimes.
This resulted in an expanding claim backlog asthe claims administration staff fell increasingly behindduring the peak times. Eventually the staff couldcatch up as the peak travel times passed and claimvolume fell. However, this situation potentiallyresulted in significant delay between the time that aclaim came into InterCon from a provider and the timethat the claim amount was collected from the foreigninsurer—particularly for those claims that came induring the latter half of summer’s peak travel time.While the staff tried to identify and prioritize thelarger claims, they were not always successful inaccomplishing this. In general, those claims receivedfrom mid-August through mid-September usually didnot get processed until after October 1.
Because of this delay, InterCon often missed thedeadline for filing claims with the foreign insurers,
Forthcoming 13
resulting in a significant number of non-collectibleclaims. The filing deadline was typically six weeks,although there was some variation across countries.Despite the fact that InterCon could not obtainpayment from the foreign insurers, the company wasstill responsible to reimburse the provider. These non-collectibles resulted in dollar for dollar lost claimincome, and many claim administrators believed thatthe problem was getting worse.
Finally, while the company’s managementbelieved that they had been effective at keepingprocessing costs to a minimum, they did realize thatprocedures wholly reliant on manual effort left roomfor improvement. The procedures could never beentirely automated due to the complex nature of theclaim administration task in this highly specializedarea of medical claim administration. Nevertheless,management was interested in assessing what impacta new system might have on claim administrationcosts.
IT application project evaluation and prioritization
“With the company growing so quickly, eachbusiness project has to be successful in raisingrevenue, cutting costs, or providing a strategicadvantage with customers,” says CEO CarmenRodriquez. Recently the company developed arelatively straightforward process that is used toevaluate every project. The process is performed bysix senior executives, who make up the projectevaluation committee.
The committee splits into two groups. One groupincludes the CIO Richard Nettleson and the heads ofoperations and research and development, and itanalyzes the costs of every project. The other groupconsists of the two chief marketing officers and thehead of business development, and it analyzes theexpected benefits. With regard to benefits, the grouptypically focuses on expected impacts related torevenues and client retention. Each group has severalstaff members who assist with some of the morecomplex problems related to estimating a project’scosts and benefits. In general, the groups do notdiscuss a project until both sides have evaluated it inorder to stay objective. Each group’s analysis isrecorded in a spreadsheet, and these are merged tofacilitate subsequent conversations and meetings. For
any project, the decision outcomes are approve, passover, or table for future consideration.
Rodriguez says the process works reasonablywell. The two groups focus on their immediate task,and they stay honest with respect to not leakinginformation to the other group. This avoids thepotential problem of an evaluation process that maynot fully look at benefits after realizing that costs willbe quite high for instance. This might cause theevaluation team to prematurely decide to pass over theproject, thereby overlooking some potentially high-payoff projects. So there is always a full vetting ofcosts and benefits for each project. Rodriquez says,"We see all the options, get a thorough assessment ofcosts and benefits, and then find the winners."
The claim automation project proposal
In early 2001, one of the marketing teamsproposed a project to begin automation of the claimsprocessing system. The proposal came out of animportant observation—most of the company'srevenue comes from claims for in-patient hospitalstays, which average around $10,000, and thecompany was not collecting on these in someinstances. Referred to as Class A, these claimsrepresent 20 percent of InterCon's claims and over 80percent of its claim income. The remaining 80 percentof claims consists mostly of clinic and hospitalemergency room visits. These claims are divided intotwo classes referred to as Class B (30% of claims) andC (50% of claims). Class B claims involve a minorailment that requires modest medical intervention.Class B claims averaged about $1,000. Class C claimsinvolve someone who believed he was sick or hadbeen hurt, and sought medical attention only to learnthat no medical treatment was necessary. Class Cclaims averaged about $100, which was the typicalaverage minimum fee for a visit.
The cost associated with processing thesemedical claims was generally high. The staff had tofrequently follow up with the foreign insurers in orderto pursue payment. The foreign insurers frequentlycontacted InterCon with questions concerning theclaim. These questions typically focused on one oftwo points of clarification: (i) explanation ofprocedure codes and (ii) explanation of the meaning ofEnglish, and to a lesser extent French, medical terms.
14 Journal of the Academy of Business Education
In addition, the medical providers were frequentlycontacting InterCon seeking explanation for why theyhad not been paid. The volume of contacts wasincreasing along with the volume of claims. Ingeneral, the staff tried to spend the most time on ClassA claims, since there was more claim incomeinvolved, and the least time on Class C claims. Arecent study estimated that the cost of processingClass A, B and C claims at $300, $125 and $50 perclaim, respectively. Both management and staff weresurprised that the study showed the cost of processingClass B and C claims to be higher than theircontribution to revenue in terms of the processing feesgenerated.
The project’s benefits
Anticipating features of the new automatedsystem, the benefits group identified at least two clearbenefits. First, they believed that a claim processingcost savings should occur. For example, one newfeature included an online form that providers coulduse to submit claims. A second form would be used toallow providers to track the status of a claim, and athird form provided similar capability for insurers.These features would offload some of the data entrywork and reduce the number of provider and insurercontacts, thereby decreasing the demand on claimadministrators’ time. Unfortunately, despite thegeneral agreement that a claims processing costsavings would occur, the members disagreed on theamount of savings.
In order to solve the problem, they decided toconduct a survey that would ask respondents toestimate the average decrease in claims processingcosts due to the new features. The committee includedthemselves as individual respondents, in addition toothers whose informed opinion might yield reasonablyreliable estimates, such as some mid-level managerswho had substantial experience with the company andall current claim administrators. Considering thatcurrent claims processing costs were $2,450,000, eachrespondent estimated the annual savings. While mostrespondents contemplated the reduction in terms ofpercentage figure, they were asked to respond with anominal dollar figure. These estimates averaged outat an annual savings of $400,000, and they had astandard deviation of $30,000. These figures related
to all claim classes.A second benefit related to the potential impact
on lost claim income. It was believed that the system’snew features would free up enough time such that theclaim administration staff could be more effective inpursuing payment by the foreign insurers. Moreover,since the data were being submitted online, the systemcould reliably identify all Class A claims based onclaim amount. In the past, some Class A claimseluded detection and sat unprocessed, thereby missingthe deadline. This had substantial adverse financialimpact that was simply unnecessary and could easilybe avoided. In addition, it was considered that claimscould be prioritized by country, with claims to foreigninsurers of countries with shorter filing deadlinesprioritized over those with longer filing deadlines.
Currently, 4% of Class A claims are non-collectible. 12% and 25% of Class B and C claimsend up being non-collectible, respectively. Thebenefits group decided to focus on Class A claims,because these were obviously more important due totheir higher average value. If necessary, the groupcould come back and consider the other classes. As itturned out, the benefits group also had difficultyagreeing on the amount of potential impact on lostclaim income, so they also included this on the surveyas well.
Considering that current annual lost claimincome for class A claims was four percent or 1.6million, each respondent estimated the annual savings.Most respondents believed that the new system couldbring the non-collectible rate down from four to onepercent, however others had slightly higher and lowerestimates. In terms of dollar amounts, these estimatesaveraged out at an annual benefit of $1,200,000reduction in lost claim income. The standard deviationwas $40,000. These figures related to class A claimsonly.
The discussion on non-collectibles createdawareness among the benefit group members that, tothe extent the data are in electronic form, the overallpotential for improving managerial decision-makingand customer service quality should be significantlyenhanced. With regards to customer service qualityfor example, information would be more accessiblethereby reducing the time needed to respond toinsurers’ and providers’ standard questions andrequests. This would increase general responsiveness,
Forthcoming 15
which should translate into improvement in perceivedcustomer service quality. In the long run, highercustomer service quality would likely attract moreinsurers and providers, thereby generating moreprocessing fees. The committee believed that they hadidentified only a few of the potential improvements incustomer service quality.
In any event, the benefits group found thatagreeing on the degree of potential impact oncustomer service quality—particularly how thisimpact might translate into dollar figures, wasparticularly contentious. There was wide disagree-ment among the benefit group members on this.Having included this on the survey as well, thebenefits group found that respondents’ independentestimates also varied widely. The respondents’estimates yielded an average annual increase inprocessing fees of $1 million with a $750,000 standarddeviation.
The project’s costs
The costs group determined that the projectconsisted of two modules—an online claims entrymodule and an automated claims processing module.Each one would have to be built, and then the twowould have to be integrated. The group knew that anyintegration project would likely be complex andlengthy, however they were at a complete loss as tohow to estimate the costs associated with integratingtwo modules that did not yet exist. In the end, thecosts group decided that the modules would be built,and then integrated at a later time. They reasoned thatcollecting the data online and semi-automating claimsprocessing—i.e., automating some steps of claimprocessing after the claim data are checked out by theclaims staff, was a substantial improvement over thecurrent system. “It's not real-time, but it's still fast,”commented one member of the costs group.
As a next step, the costs group determined thatbuilding the modules would require about two years ofdevelopment effort. While the company had littleexperience in developing web-based applications,some members of the costs group consulted withdevelopment managers of other insurance companies.Although many advised using an application serviceprovider (ASP), InterCon’s management knew that noASP existed that would provide the needed modules
due to the relatively unusual nature of the businesscontext. They realized early on that they would haveto custom build the modules.
The effort would require a variety of skill setsfrom IS personnel. After preliminary discussions,they planned for five systems analysts, elevenprogrammers, two security and networking specialistsand one project manager. The salaries for thesepositions varied widely, but the group wasknowledgeable about average salary levels for theToronto area. A systems analyst earned $70,000 peryear on average, a programmer $55,000, a security andnetwork specialist $85,000 and a project manager$125,000. They estimated that two years ofdevelopment effort would be required to design,program, test and implement the customized modules.Based on past experience, they also knew that thedevelopment costs would be greater in the secondyear, so they planned for a 40% increase in thedevelopment staff during the second year. Finally, asone last precautionary measure, the costs group set upa contingency fund for hiring consultants in the eventthat the firm could not complete the project using in-house expertise. They set aside a $500,000contingency fund for consultants for each year.
Having invested in technology during theprevious five years, the firm currently had excesscomputing capacity. Thus, the costs group estimatedthat no additional hardware or software would beneeded. Nonetheless, ongoing operations andmaintenance costs to support the modules would beincurred. Operational costs included overhead chargesstemming from operation of the data center where thecomputers are housed. Other operational costs resultedfrom various tasks like generating and distributingroutine and ad hoc reports, backing up the system,monitoring system performance, and guarding againstpotential virus and hacker attacks and the like. Maintenance costs covered efforts to keep theoperating system, networking and security programscurrent with patches and upgrades. Maintenance costsalso included efforts to modify the applicationsoftware to deal with changes in the businessenvironment that invariably occur.
The costs group estimated the modules’operational costs to be $110,000 during the secondyear of development. Starting the operational costs atthis point was prudent, because it was expected that
16 Journal of the Academy of Business Education
the development group would have a workingprototype on which they would iterate a program-test-program-test procedure in order to refine the modules’features, and until they had adequate operatingreliability. A test environment that would mimic theoperational environment was essential to enhancetesting validity. The costs group planned for a 5%increase in operating costs per year.
After two years of development effort, themodules would be implemented and maintenancecosts would begin to incur. The group estimated themaintenance costs to begin at $150,000 and toincrease at 10% per year. Normally they planned for5% per year increase, however the nature of web-based technology and on-going security developmentssuggested that the pace of patches and upgrades wouldbe relatively rapid. Other maintenance tasks wereexpected to occur with greater frequency as well.
The project's lag
With regards to IT development projects, themanagement team knew that benefits always lagbehind much of the costs. There are usuallyunanticipated problems that come up during andshortly after implementation. Additionally there isusually a learning curve for affected groups, so it takestime for groups to use the system in an optimal way. Based on past experience and the nature of theconsidered system, management estimated a lag inbenefit realization of about six months afterimplementation. Thus, only about one-half of theestimated benefits would be realized in the first yearafter implementation.
A green light?
Being very rational in its approach, InterConconsiders one factor when determining whether toundertake a project—how much money will a projectreturn? InterCon has traditionally used the 5-year NPVto assess return. The company currently assumes a10% cost of capital in arriving at a NPV figure. Theproject planning process concludes with thecalculation of a 5-year net present value (NPV) figurebased on the costs and benefits previously identified.
While the company's management teamrecognized that any capital investment yielding a
positive NPV made sense to fund from a rationalperspective, the fact that many projects competed forfunding significantly limited the number of projectsthat could be funded in any given year. Afterprioritizing projects based on 5-year NPV andallocating the investment capital accordingly, thecompany had been able to fund projects that had abouta $3,000,000 5-year NPV or greater from year to year.Therefore from a practical perspective, the companygenerally used a $3,000,000 5-year NPV as the cut-offon which to base funding decisions. Thus, projectsthat yield $3 million or higher are approved. Forprojects that come in just under this cut-off, they maybe tabled for future consideration. Projects that arewell under the cut-off are passed over. Both groupswere anxious to know what decision outcome wouldresult from their analyses.
Discussion questions
1. Comment on the way InterCon has structuredits project evaluation committee. Do you think it iswise to have a benefits and a costs group that focusonly on the respective area? What might be theadvantages and disadvantages of structuring thedecision-making group in this way?
2. What are the specific costs and benefits thatare associated with these modules?
3. Should the company fund the project based onthe funding criteria and information presented in thecase?
4. Are there other costs or benefits that are notconsidered in the case, but may in fact come into play?In considering these costs and benefits, should thecompany fund the project?
5. Finance theory suggests that any project witha positive NPV should be funded. The proposedproject may have a positive NPV, but managementwill not fund it unless it meets the approximate 3million 5-year NPV criterion. How would youreconcile the company's policy and practice withtheory?
6. Consider the assumption of 10% cost ofcapital. Is this an appropriate rate for a capital invest-ment of this nature? If not, would you argue for ahigher or lower rate? Why? What rate would youchoose? May we generalize about any factors thatmay systematically influence the assumed rate?
Forthcoming 17
7. What cost of capital rate would you assumefor an investment in an Internet start-up firm versus arestaurant franchise outlet? Is the rate that you chosefor the project in question 6 closer to the Internet orrestaurant option? Explain this.
8. What are the risks of not funding the project,especially in light of the expected growth rate? Arethere adverse consequences for claims processingcosts, lost claim income, processing fees or for someother cost or revenue figure that could be anticipatedand measured?
SESSION PLAN
Setting the stageBegin by explaining that anyapplication development project will generate someset of costs and benefits. In considering illustrativeexamples, the instructor may usefully select one thatmost students can relate to.
1. A bank’s network of ATM systems: A bank investsin a network of ATM machines (costs) in order toprovide more convenience to customers and toreduce the average time to conduct a demandaccount transaction (benefits).
2. A company’s Internet site: A company designs anddeploys an Internet site (costs) in order to reducethe number of customer inquiries about productsand follow on support and to establish a globalpresence (benefits).
3. A university’s classroom management system: Auniversity invests in a classroom managementsystem (costs) in order to improve the variety andspeed of information accessibility and to providealternative ways to communicate and to conductcollaborative assignments (benefits).
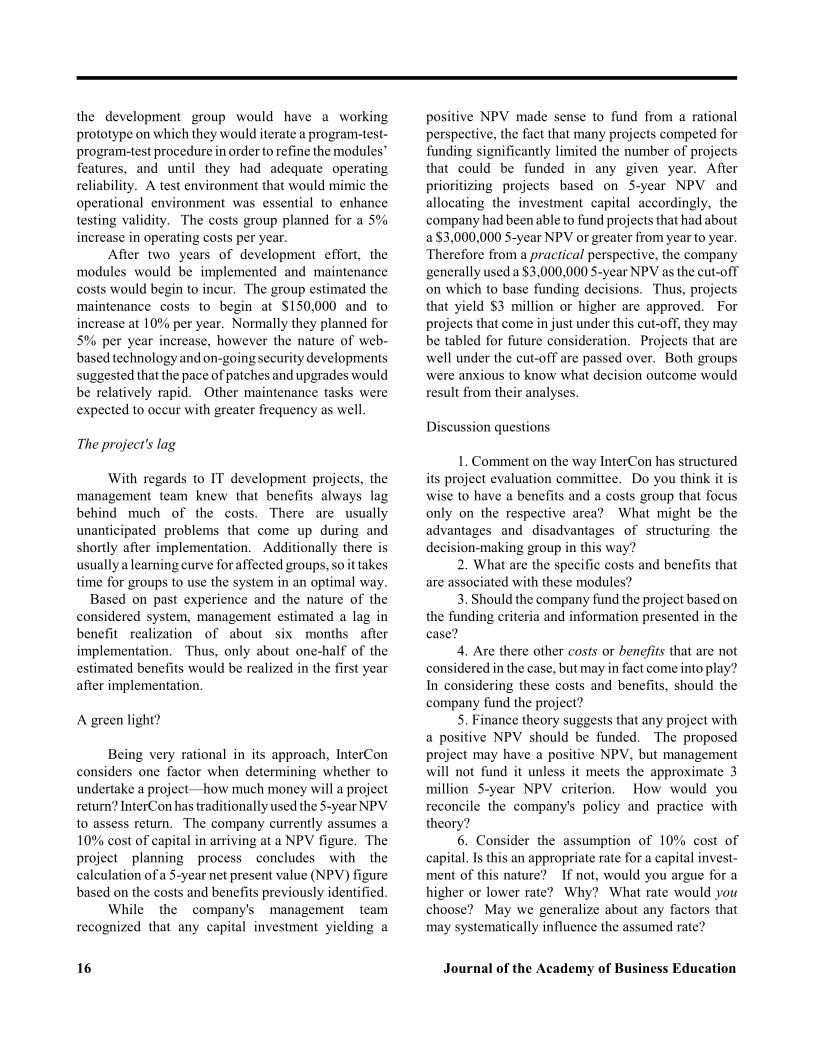
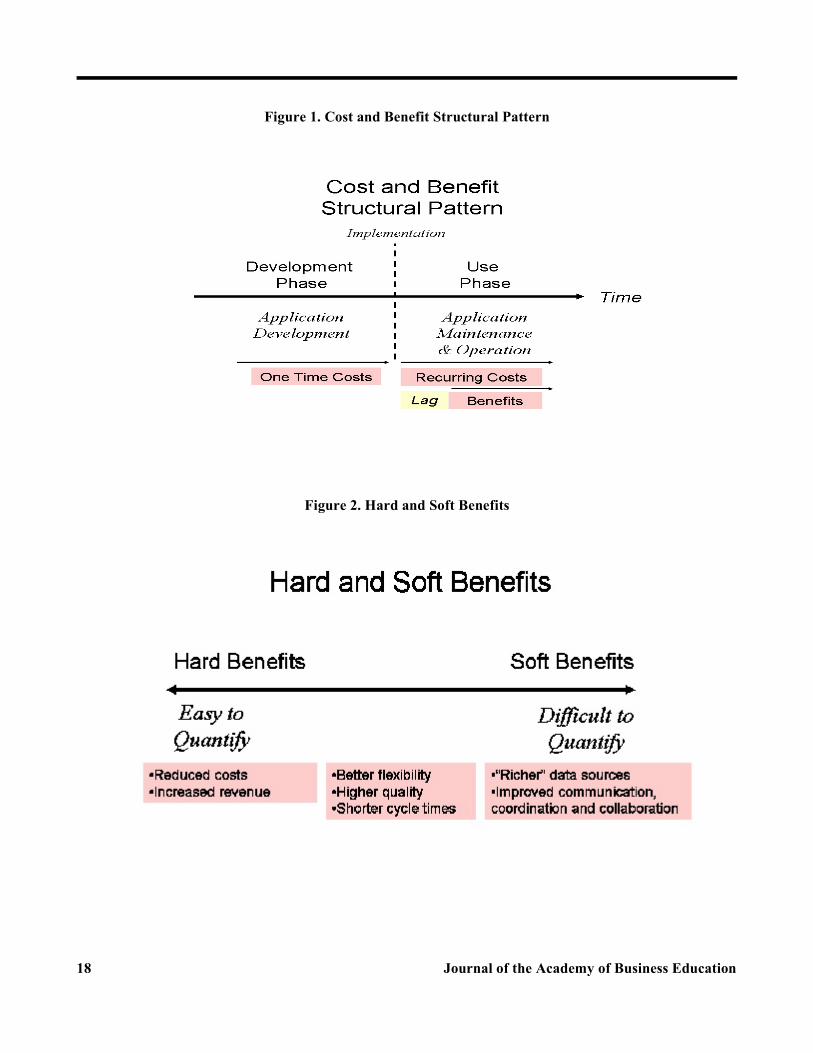
Identifying common costs and benefits Whiledelaying focus on the InterCon facts for the timebeing, ask the students to identify some specific costsand benefits that are typical of most applications. Thepresentation file shows some examples. We find thatstarting with costs works best because they tend to bemore obvious than benefits. It may be useful to layout the benefits in a pattern similar to that shown inFigure 2. This will set the stage for later discussion onhard and soft benefits. (re: IT-Planning.ppt; slides 4-9).Understanding the typical pattern of costs and
benefits.An application development project will incur
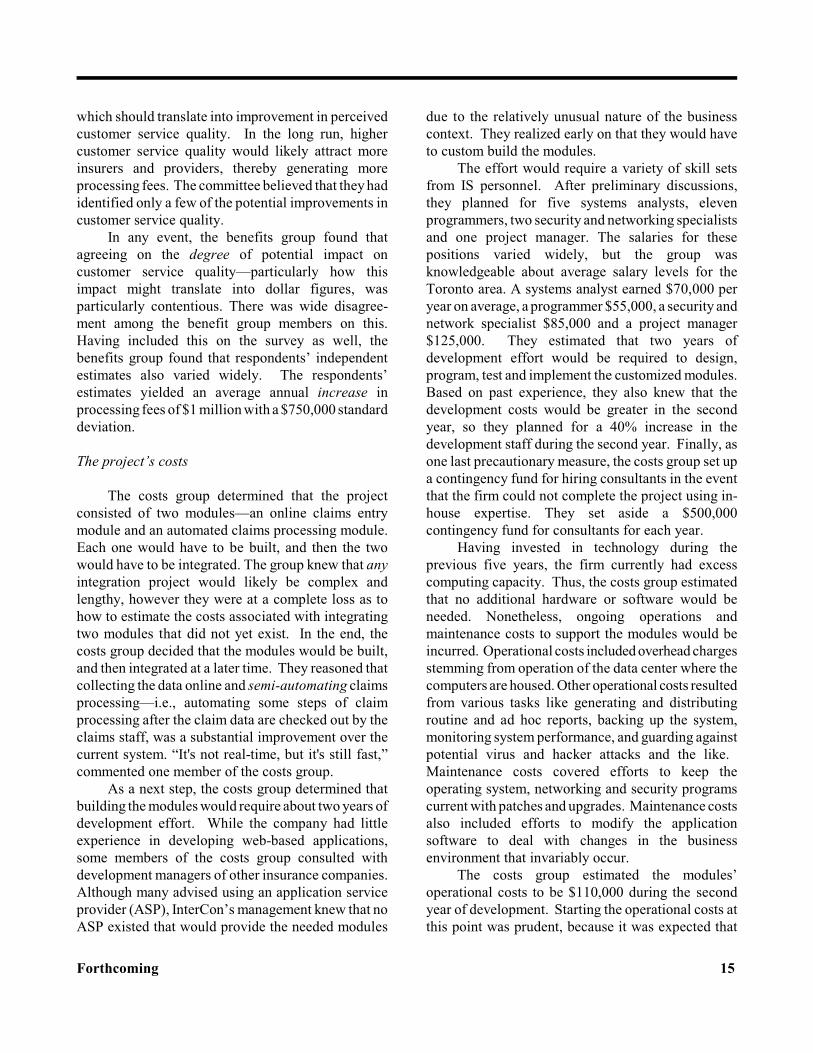
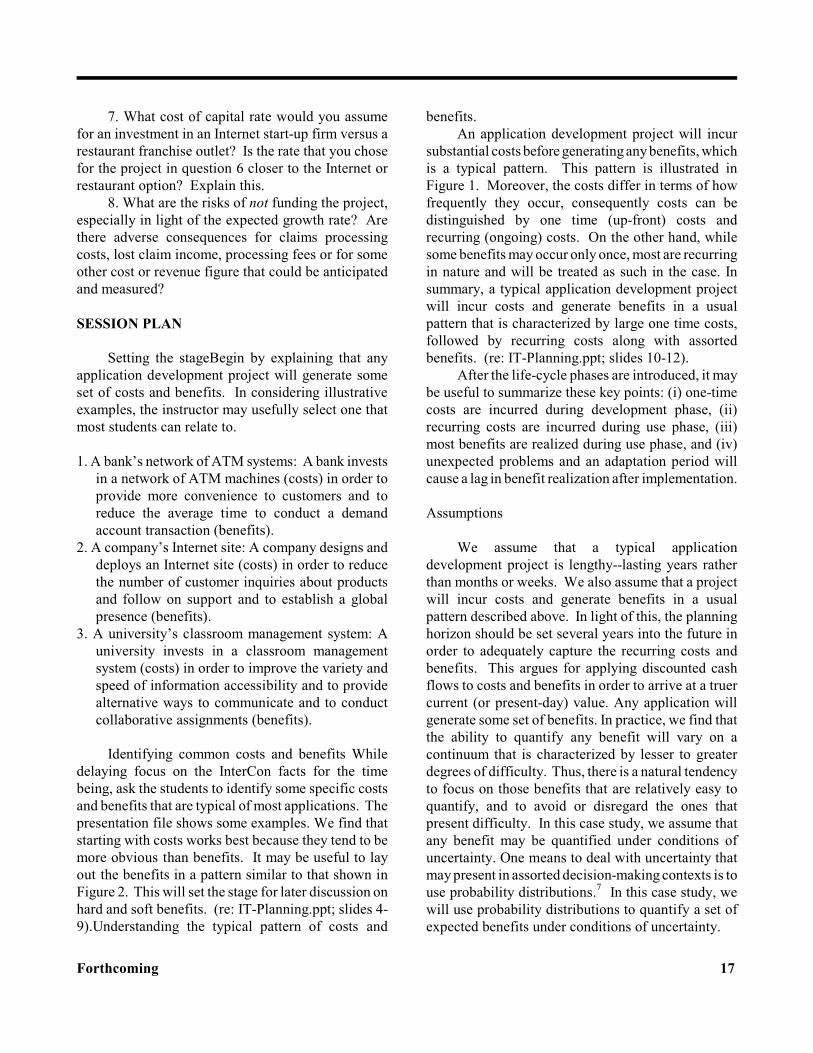
substantial costs before generating any benefits, whichis a typical pattern. This pattern is illustrated inFigure 1. Moreover, the costs differ in terms of howfrequently they occur, consequently costs can bedistinguished by one time (up-front) costs andrecurring (ongoing) costs. On the other hand, whilesome benefits may occur only once, most are recurringin nature and will be treated as such in the case. Insummary, a typical application development projectwill incur costs and generate benefits in a usualpattern that is characterized by large one time costs,followed by recurring costs along with assortedbenefits. (re: IT-Planning.ppt; slides 10-12).
After the life-cycle phases are introduced, it maybe useful to summarize these key points: (i) one-timecosts are incurred during development phase, (ii)recurring costs are incurred during use phase, (iii)most benefits are realized during use phase, and (iv)unexpected problems and an adaptation period willcause a lag in benefit realization after implementation.
Assumptions
We assume that a typical applicationdevelopment project is lengthy--lasting years ratherthan months or weeks. We also assume that a projectwill incur costs and generate benefits in a usualpattern described above. In light of this, the planninghorizon should be set several years into the future inorder to adequately capture the recurring costs andbenefits. This argues for applying discounted cashflows to costs and benefits in order to arrive at a truercurrent (or present-day) value. Any application willgenerate some set of benefits. In practice, we find thatthe ability to quantify any benefit will vary on acontinuum that is characterized by lesser to greaterdegrees of difficulty. Thus, there is a natural tendencyto focus on those benefits that are relatively easy toquantify, and to avoid or disregard the ones thatpresent difficulty. In this case study, we assume thatany benefit may be quantified under conditions ofuncertainty. One means to deal with uncertainty thatmay present in assorted decision-making contexts is touse probability distributions. In this case study, we7
will use probability distributions to quantify a set ofexpected benefits under conditions of uncertainty.
18 Journal of the Academy of Business Education
Figure 1. Cost and Benefit Structural Pattern
Figure 2. Hard and Soft Benefits
Forthcoming 19
Discounted cash flows and capital investmentevaluation methods
As indicated earlier, application developmentprojects incur one time costs in addition to recurringcosts and benefits. In order to evaluate investmentsin new applications, any associated costs and benefitsmust be quantified. One may define quantification asestimating the value of any cost or benefit in somenominal currency. Any simple example may make thepoint that spending resources as an investment (costs)may be done for the purposes of reducing annualexpenses (benefits) or generating additional revenues(benefits). This will facilitate thinking about costsand benefits in terms of cash flows. Also, becausewe assume that applications are used for long periods,the cash flows must be forecast several years into thefuture. Under these conditions, discounting expectedcash flows accounts for the time-value of money,which derives a more accurate measure of theapplication’s current or present-day value. 8
There are several methods that may be used toevaluate capital investments. These include payback(PBK), net present value (NPV) and internal rate ofreturn (IRR). While each method has its strengthsand weaknesses, NPV is the preferred method for usein long-term capital budgeting analyses such as thosepresented in this case study. NPV has a number ofadvantages over the other two methods as it bothconsiders the time value of money and provides thevalue of the project in today’s dollars.9
Cost estimation
On a practical level, costs may be classified asdevelopment, maintenance and operations costs.Development costs consist mostly of the one timecosts, and maintenance and operations costs aregenerally the recurring costs. Maintenance andoperation costs are often a considerable portion oftotal costs incurred during an application’s life. Inestimating costs, managers confront severalchallenges.
First, there is temptation to set the planninghorizon too short. This may occur because theestimates become less accurate as they are projectedfarther into the future, which argues for shorteningthe planning horizon. On the other hand many
applications’ life expectancy is 15-25 or more years,which argues for extending the planning horizon. Inshort, there are several forces at work to createtension in setting an appropriate planning horizon.To the extent that managers are aware of this tension,they will be more effective in balancing it andnegotiating toward a satisfactory planning horizon.
Second, there is temptation to short-cut planningefforts. This may occur because some costs may bedifficult to quantify, thereby requiring considerabletime commitment to come up with reliable estimates.Additionally, time pressures may create an imperativeto move the capital investment decision towardresolution. The combined quantification difficultyand time pressure may cause managers to short-cuttheir planning efforts by ignoring some costs or byproviding biased estimates. In response to the timepressure issue, one may legitimately argue that capitalinvestments have long-term implications thereforethorough evaluation and attendant time is critical.There are various techniques for mitigating thequantification difficulty, and the case study offers onethat deals with uncertainty reduction throughprobabilities.
For these and other reasons, there is a commontendency for a significant share of actual costs toremain unaccounted for during capital investmentassessment. On a conceptual level, these costs maybe called hidden costs. Hidden costs contrast toapparent costs, which are accounted for. One broadmanagement objective is to effectively deal with thecost planning challenges such that a greater share ofactual costs end up being apparent rather than hidden.(re: IT-Planning.ppt; slides 19-21).
Benefit estimation
One management challenge relates to thepotentially significant delay between when costs areincurred and benefits are realized. This occurs partlybecause the development phase is often lengthy,perhaps lasting 1-2 years or more. Thus, there issignificant expenditure outlay as the majority of onetime costs are incurred before any benefits arerealized. Additionally, there is a lag in benefitrealization as unforeseen problems arise and affectedgroups learn and adapt to the new system afterimplementation. Thus, many IT managers find
20 Journal of the Academy of Business Education
themselves in a position of defending the worthinessor value of a new application as the developmentphase draws on and perhaps into the use phase aswell if the lag is severe. In some cases, applicationshave been abandoned during this period.
In response, one may take advantage ofapplications’ modular nature and follow anincremental implementation strategy. Under anincremental implementation strategy, managementmay introduce parts of the application’s capabilities(or modules) in successive stages. This will allow forshorter and staggered development phases fordifferent parts of the application, thereby reducing thetime until some benefits are realized. While thesebenefits are only partial ones, it provides projectadvocates with some short-term “wins” to fend offpotential criticisms concerning the project’s value.With regards to the learning curve effect on benefitdelay, one solution is for management to assureample planning and adequate funding for trainingprograms and support staff in order to minimize thelearning curve’s duration. (re: IT-Planning.ppt; slide23).
A second management challenge relates toquantifying some benefits. Where benefit quantifi-cation is more or less difficult, we may call these hardor soft benefits, respectively. (Refer to Figure 2.)For example, hard benefits may include reduced costsin the form of labor cost savings where theapplication automates a manual task. Alternatively,an application may be introduced into facilities inorder to provide monitoring and control capabilitiesthat reduce fire and theft risk. This may reduce coststhrough lower insurance premiums. In these cases,there is a relatively obvious cost savings that can beestimated through reduced wages or insurancepremiums.
Soft benefits present a more challenging effortbecause they are, by definition, comparativelydifficult to quantify. Soft benefits may occur whereapplications provide for “richer” data sources, such asmore expansive electronic databases that offer data ofhigher granularity, of current and historical nature, orof internal and external sources. In general, richerdata sources are argued to lead to more effectivemanagerial decision-making, which should logicallylead to improved firm performance. Alternatively,applications that support workers’ communication,
coordination and collaboration efforts throughelectronic mediated means allow these efforts toproceed at a faster pace and expand the range ofcommunication modalities that may be used.Therefore employees should be able to work moreefficiently, which should logically lead to improvedfirm performance. However, there is significantchallenge in quantifying the value of “…moreeffective managerial decision making” or“…improved communication, coordination andcollaboration efforts.” Quantification difficultiespresent in other ways. Most applicationssimultaneously produce hard and soft benefits. Whilemanagers may have an intuition or gut-feel that anapplication will lead to certain soft benefits, theyoften fail to include them in any formal analysisbecause of the quantification difficulty. But this doesnot provide for a complete assessment of all benefits.
We argue that the conceptual distinctionpresented in Figure 2 identifies a continuum thatreflects varying degrees of quantifiability. In thissense, the hard versus soft benefit distinction isrelative in nature, and is intended to highlight that thebenefits that present in practice will likely vary thefull range of quantifiability. Moreover, there may bedisagreement on whether a benefit is appropriatelyclassified as hard or soft.
In summary, there is a common tendency for thesoft benefits to be ignored, because managementassumes they cannot be quantified at all or only afterconsiderable time. Thus, one broad managementobjective is to counteract this tendency by keepingsoft benefits in the capital investment evaluation.Our general analytic technique can be applied to bothsoft and hard benefits (and costs) if desired.Therefore we derive a more complete evaluation ofthe application, and thereby yield a less biasedcomparison in relation to other capital investmentoptions. (re: IT-Planning.ppt; slides 24-28).
The Monte Carlo Simulation Model
The specific benefits from the case includeclaims processing cost reduction, lost claim incomereduction and service quality enhancement. Theestimates of these benefits are subject to uncertainty.Uncertain outcomes are often modeled usingprobability distributions that incorporate a manager’s
Forthcoming 21
view of possible scenarios. The most widely used10
probability distribution is the normal distribution. Itis shaped like a bell, which means that numbers in themiddle are more likely to happen than numbers awayfrom the middle. It is also entirely characterized by itsmean (also called expected value, or average) andstandard deviation. If they are known, thedistribution is uniquely defined and all probabilitiescan be computed. This makes the normal distributionparticularly useful in practice. For example, if thegoal of a manager is to incorporate risk in theestimate of future benefits, she can model futurebenefits as a normal distribution. The mean of thisdistribution will be a value representative of thebenefits the manager expects on average, and thestandard deviation will be an estimate of the volatilityin these benefits. The actual numbers for the meanand the standard deviation can be obtained fromexpert opinions, or from data on the distribution ofbenefits of similar projects in the company or theindustry.
In spreadsheet Intercon.xls, we use the normaldistribution to model the uncertainty in benefits, andrun a Monte Carlo simulation in a commonspreadsheet program (Excel) to study the effect of theassumed uncertainty on the NPV of the project.Excel’s random number generating capabilities arelimited – it can only generate a number between 0and 1 using the command ‘=RAND()’. However, ifone can generate a random number between 0 and 1,one can generate a random number from anyprobability distribution. This is because of the factthat the total area under a probability distributioncurve is always 1. Suppose that the number generatedby RAND() is 0.975. The number 0.975 can bethought of as the cumulative area under the bell-shaped curve up to some number on the x-axis.Therefore, to generate a random number from thenormal distribution, one can simply calculate thevalue on the x-axis of a normal distribution so thatthe area under the curve to the left of that number is0.975. The Excel function NORMINV(probability,mean, standard deviation) helps “invert” the area(probability) under the normal curve to obtain theactual random number on the x-axis. Thus, theformula ‘=NORMINV(RAND(), mean, standarddeviation)’ can be used to generate random numbersfrom a normal distribution with the specified mean
and standard deviation. (re: IT-Planning.ppt; slides29-31)
Pressing the CALC/F9 key makes Excelrecalculate all random numbers. Pressing F9 severaltimes can help illustrate to students the volatility inthe possible values for the benefits and, respectively,the volatility in the NPV. However, it cannot givethem a clear idea of the actual range of possiblevalues for the benefits, because Excel does not keeptrack of random values that have occurred previously.To build a distribution for the possible values for thebenefits and the NPV, we create a spreadsheet with100 columns, each corresponding to a differentrealization of a random number. (Refer to theAppendix; ProbOut worksheet). Each of these 100columns can be thought of as a trial, or a scenario.There is no need to use the F9 key, unless we want toillustrate that every time we press the CALC/F9, wegenerate a different set of 100 scenarios. The valuesof the NPV for the 100 possible scenarios can be usedto create summary data, such as the NPV’s expected(average) value, standard deviation, probability thatit is less than zero, probability that it is over 3 millionand so on. Some of these summary data examples areshown. (Refer to the Appendix; ProbOut worksheet).For example, the probability that the NPV will endup negative can be estimated by counting thenumber of scenarios out of the 100 that end upnegative in the simulation, and dividing by the totalnumber of simulated scenarios. The exact Excelformula in our model is in ProbOut!B52:=COUNTIF($B$48:$CW$48,"<0")/COUNT($B$48:$CW$48).
Remark. 100 scenarios is a relatively small number.The higher the number of scenarios, the moreaccurate the estimates of the costs and the NPV willbe. However, if there are more scenarios, Excel slowsdown significantly, because it recalculates thespreadsheet after every entry. This is a limitation ofExcel as a simulation tool. In order to avoid thislimitation altogether, consider using Excel simulationadd-ins such as Crystal Ball and @RISK. These add-ins handle hundreds of thousands of scenarios, keeptrack of the descriptive statistics of the simulations,and enable the user to simulate a number of differentdistributions in addition to the normal distribution. Alternatively, one may disable Excel's automatic
22 Journal of the Academy of Business Education
recalculation, and press F9 when recalculations arenecessary. To disable automatic recalculation, go toTOOLS | OPTIONS | Calculation Tab and setcalculation to manual.
Remark. More advanced students may notice that theaverage value for the NPV they obtain from thesimulation is (approximately) the same as the valuethey obtain if they plug in the average estimates forbenefits in the formula for the NPV. This is theexception rather than the rule. The NPV is a simplelinear combination of costs and benefits, and its exactmean value can be computed from the mean valuesfor the uncertain benefits. However, in many real-lifesituations the quantity a manager wants to estimate isa more complicated expression of uncertain inputs.Simulation is particularly helpful in such cases. In thecase of InterCon, simulation can still help a managergain important insights not only about the averageand the standard deviation of the NPV, but also aboutthe distribution of the NPV as a whole, and theimpact of different factors on the variability in thisdistribution.
Remark. The case states that the management teamexpects about a six-month lag in benefit realizationafter implementation. This would affect benefitlevels the first year after implementation or year 2 inthe model. The lag duration may be entered inProbOut!B2 as number of months. The model is builton the assumption that the lag will range between 0 -12 months, therefore any potential lag will affectbenefit levels in year 2 only.
Remark. The case suggests that the company willcontinue to experience growth. We assume thatoverall growth in claims will result in correspondinggrowth in benefits, because claim volume directlyimpacts the cited benefits. However, while ourcurrent assumption models a linear relationship, thefunctional form is probably more complex in reality.In an effort to hold the complexity of the model to amanageable level, we model a linear relationshipbetween claim volume and impact on cited benefits.More specifically, the monetary value of each benefitwill increase at 3% per annum (cells B3, B4 and B5in worksheet ProbOut). The values in B3, B4 and B5can be changed to model different growth rate
assumptions, and will have an effect on the NPVresults from the simulation, e.g., on the probabilitythat the NPV will be negative. The instructor maywant to discuss why one would make differentassumptions on the growth rates, and how thedifferent results from the simulation will affect thedecision a manager would make. The growth rates arecurrently modeled as constant; however, it is easy tomake them random variables. For example, if onebelieves that the growth rate for the benefits of claimsprocessing cost reduction could be anywhere in therange 2% - 4%, one can enter the formula=0.02+RAND()*(0.04-0.02) in cell ProbOut!B3. Thisformula will generate a random number between 2%and 4%.
The In-class Exercise
The exercise’s objective is to answer thequestion—should the company fund the project?Useful figures to examine at this point would be theaverage 5-year NPV, its volatility, the probability thatthe NPV is less than zero, and the probability that theNPV is over 3 million. If the students have modeledthe problem correctly, the 5-year NPV will be in thegeneral range of $2.1 to 2.5 million under theassumption of 10% cost of capital. Moreover, theprobability that the 5-year NPV is over 3 million isusually between 20-27%, or about one-in-fourchance. Thus, the decision outcome should be to“…pass over the project,” since the average 5-yearNPV figure is more likely than not to be below the 3million criterion. (Refer to the Appendix;ProbOut!B50:B53.)
Some may argue that a 5-year planning horizonis not long enough, and in fact runs counter to anearlier view that "… many applications’ lifeexpectancy is 15-25 or more years, which argues forextending the planning horizon." (p.14) Theinstructor may advise that five years is used forpedagogical reasons. In practice, a longer planninghorizon is advisable and the students may pursue thisoutside of class by modeling a 10, 15, 20 and 25-yearhorizon.
Some may respond that not all costs andbenefits identified in discussion question 2 areaccounted for however, such as the benefit associatedwith reducing the non-collectible rates on Class B
Forthcoming 23
and C claims. Additionally, discussion question 4may identify other costs and benefits that could beincluded in the analyses. The instructor may makereasonable assumptions and incorporate these orother benefits into the model in order to show itsrobustness. In so doing, one may simulate thesampling method that is used to derive the averageand standard deviation figures that are presented inthe case. A three-step sampling method procedure isoutlined here.
A. Pick one benefit and ask each class member toquantify that benefit by recording an estimate on apiece of paper. While they can estimate in terms ofpercentage figures if that is conceptually simpler,they must provide their response using a monetaryvalue.
B. Sample the class for their answers and computethe average and standard deviation. Make a judgmentcall as to how many students to query. About 10-15responses are sufficient for this exercise.
C. Incorporate the new variable into the model. Mostchanges will occur on the NPV and ProbOutworksheets.
The Larger IT Planning Context
As capital investment decisions relate toapplication development projects and at a broad level,the general steps involve (i) identifying, (ii)evaluating, (iii) prioritizing and (iv) selecting severalprojects. The NPV method can be used to not onlyevaluate but to prioritize and select projects as well.In general, projects yielding higher NPVs have higherpriority, and projects yielding a positive NPV areselected. However, most firms operate with limitedresources so selection criteria may be modifiedaccordingly. For example there may not be enoughresources to fund all projects with a positive NPV, soanother (higher) threshold or criterion value must beused instead in order to bring the number of selectedprojects in line with available resources. Finally,while NPV and other capital investment evaluationmethods provide for an objective or rational approachto project evaluation, prioritization and selection,capital investment decisions may be subjugated to
competitive and political influences.
ENDNOTES
Portions of this case are adapted from "Two1
Teams are Better than One," CIO Magazine, 15 July2001, 74-77. Reprinted through the courtesy of CIO.2002, CXO Media Inc. All rights reserved.
case is intended as the basis for class2 This
discussion rather than to illustrate either effective orineffective handling of an administrative situation.
Any teaching material may be obtained from3
the authors upon request. These include a spreadsheetfile (intercom.xls) and a presentation file (IT-planning.ppt).
See for example Information Technology for4
Management, 7 Edition, by Henry C. Lucas, Jr.,th
chapter 3, or Foundations of Information Systems, byVladimir Zwass, chapter 13. Other referencesinclude Enterprise Resource Planning, 2005, byMary Summer, chapter 8, and When Too Much ITKnowledge is a Dangerous Thing, by AndrewMcAfee, Sloan Management Review, Vol. 44:2,Winter 2003: p.83-89.
Most data that are referenced in the case may5
be found in intercon.xls. Most home country health insurers are6
government agencies that administer national healthcare programs. A few countries have health paymentsystems similar to the American one, wherecompanies run private health care plans that operatealongside the national Medicare and Medicaidpayment systems.
There are numerous circumstances where7
managers make decisions under conditions ofuncertainty. Some examples include estimatingexpected market demand at various price points, orestimating defect rates associated with discreteproduct production processes.
The presentation file shows two examples of8
a hypothetical decision where spending $1,000 (cost)will reduce operating expenses by $300 per year(benefit). The first example uses a 5-year planninghorizon and yields a positive NPV, which we assumeresults in a favorable decision outcome. The secondexample uses a 4-year planning horizon and yields anegative NPV, which we assume results in anunfavorable decision outcome. Thus, the two
24 Journal of the Academy of Business Education
examples illustrate different outcomes for the samedecision by modifying the planning horizon. Thiswill emphasize the critical role that the planninghorizon plays in these decisions. (re: IT-Planning.ppt;slides 16-18).
Most major undergraduate and graduate9
corporate finance textbooks will have a goodoverview of the time value of money concept and thePBK, NPV, and IRR methods. See CorporateFinance by Ross, Westerfield, and Jaffe, McGraw-Hill/Irwin publisher, or Principles of CorporateFinance, by Brealey, Myers, and Allen, McGraw-Hill/Irwin publisher, for good expositions of theseconcepts, the methods, and the differences among themethods.
There is a number of different probability10
distributions. See D. Bertsimas and R. Freund,“Data, Models, and Decisions,” Dynamic Ideas,2005, or http:/ /www.itl .nist .gov/div898/handbook/eda/section3/eda36.htm for a description ofthe most commonly used types.
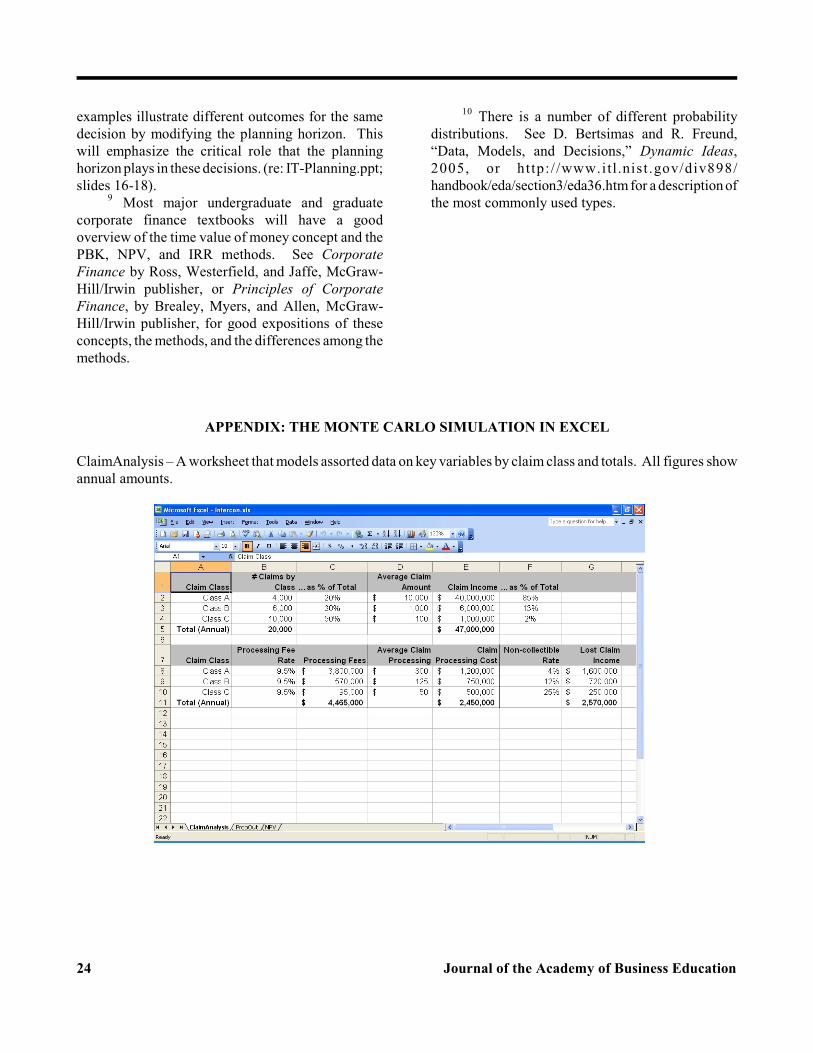
APPENDIX: THE MONTE CARLO SIMULATION IN EXCEL
ClaimAnalysis – A worksheet that models assorted data on key variables by claim class and totals. All figures showannual amounts.
Forthcoming 25
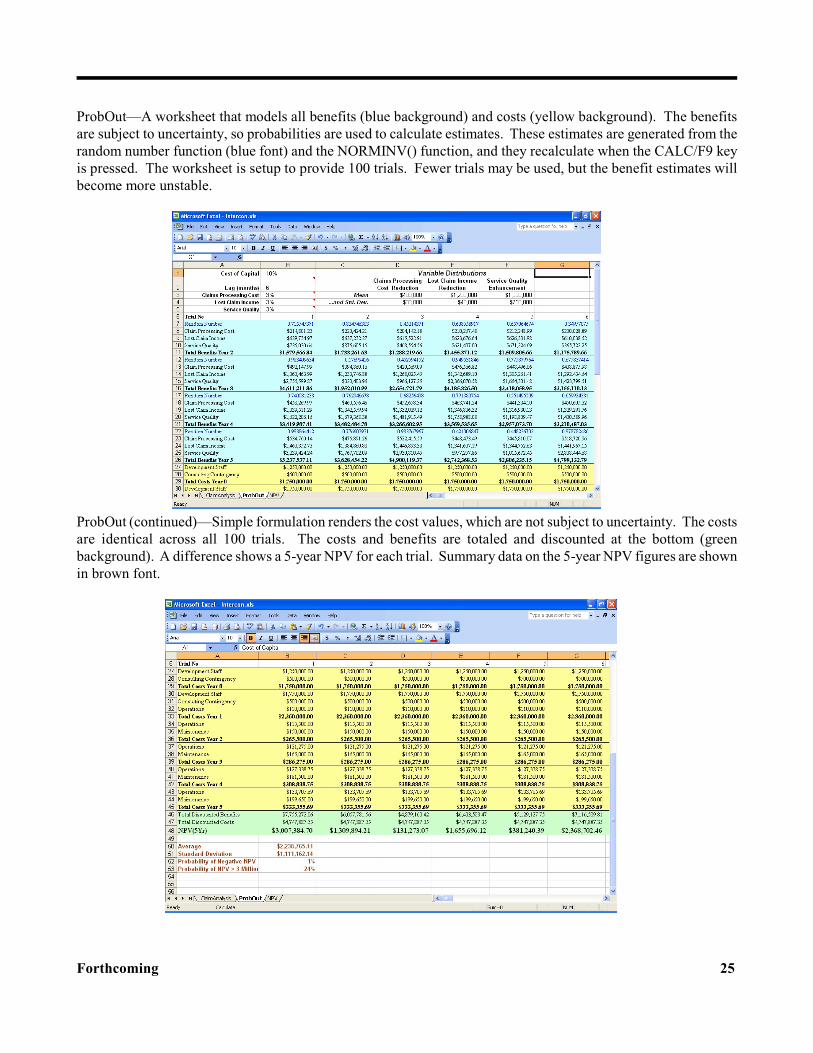
ProbOut—A worksheet that models all benefits (blue background) and costs (yellow background). The benefitsare subject to uncertainty, so probabilities are used to calculate estimates. These estimates are generated from therandom number function (blue font) and the NORMINV() function, and they recalculate when the CALC/F9 keyis pressed. The worksheet is setup to provide 100 trials. Fewer trials may be used, but the benefit estimates willbecome more unstable.
ProbOut (continued)—Simple formulation renders the cost values, which are not subject to uncertainty. The costsare identical across all 100 trials. The costs and benefits are totaled and discounted at the bottom (greenbackground). A difference shows a 5-year NPV for each trial. Summary data on the 5-year NPV figures are shownin brown font.
26 Journal of the Academy of Business Education
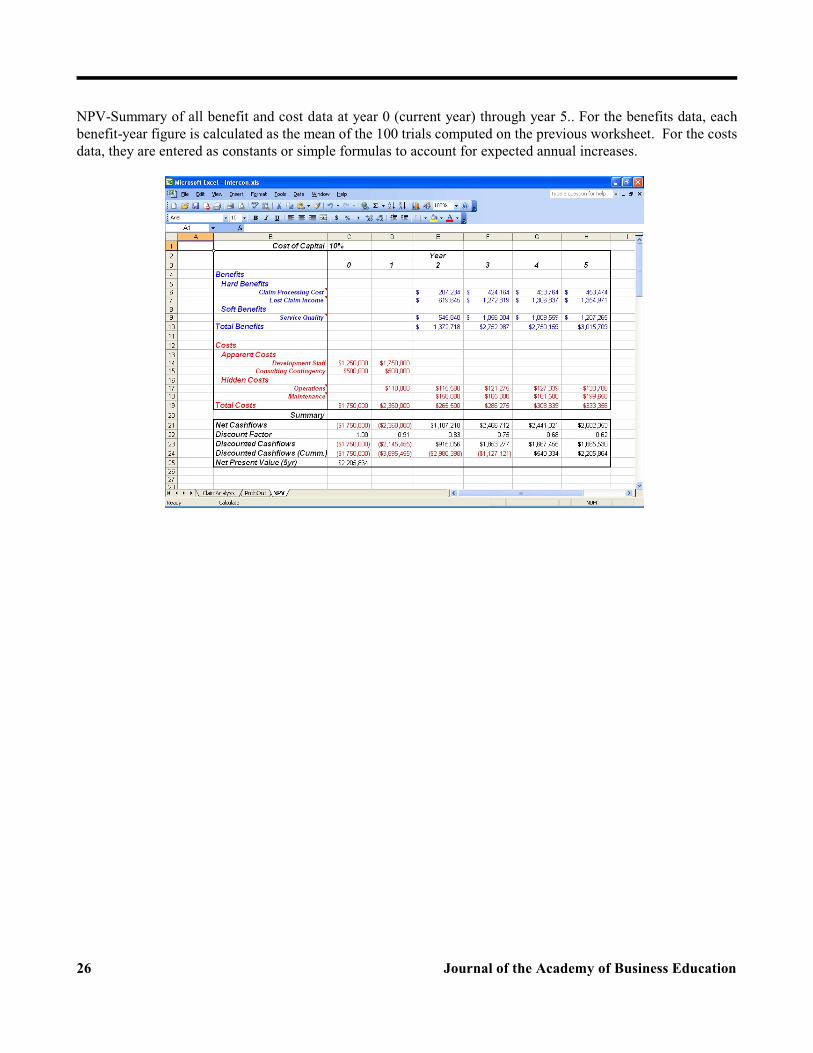
NPV-Summary of all benefit and cost data at year 0 (current year) through year 5.. For the benefits data, eachbenefit-year figure is calculated as the mean of the 100 trials computed on the previous worksheet. For the costsdata, they are entered as constants or simple formulas to account for expected annual increases.