Embed Size (px)
Citation preview

Interactive visualization using VTK by Examples
Jian Chenhttp://www.cs.usm.edu/~jchen
office: TEC 230email: [email protected]

What is visualization?
The action or fact of visualizing; the power or process of forming a mental picture or vision something not actually present to the sight; a picture thus formed (http://www.oed.com)
The process or action of rending visible.

Why do we create visualization?
Easier interpretability
Emotional impact
Simplify data
Communication, e.g, articulate relationships
Reveal / conceal trends, focus on relevant data
Visual bandwidth, use human perception / cognition
Crystallization of abstract ideas

What is VTK?
An enormous library of C++ classes for interactive visualization of data

VTK Resources
main website: http://www.kitware.com/vtk.html
Only two books: VTI user’s guide and the visualization toolkit
Numerous examples from kitware in C++, python, java, or TCL.

What does VTK do well?Creation and manipulation of geometrical data
Efficient image processing (parallel implementation)
Interactivity
Caveat: a steep learning curve
@NASA
Why we have this course to help you out!
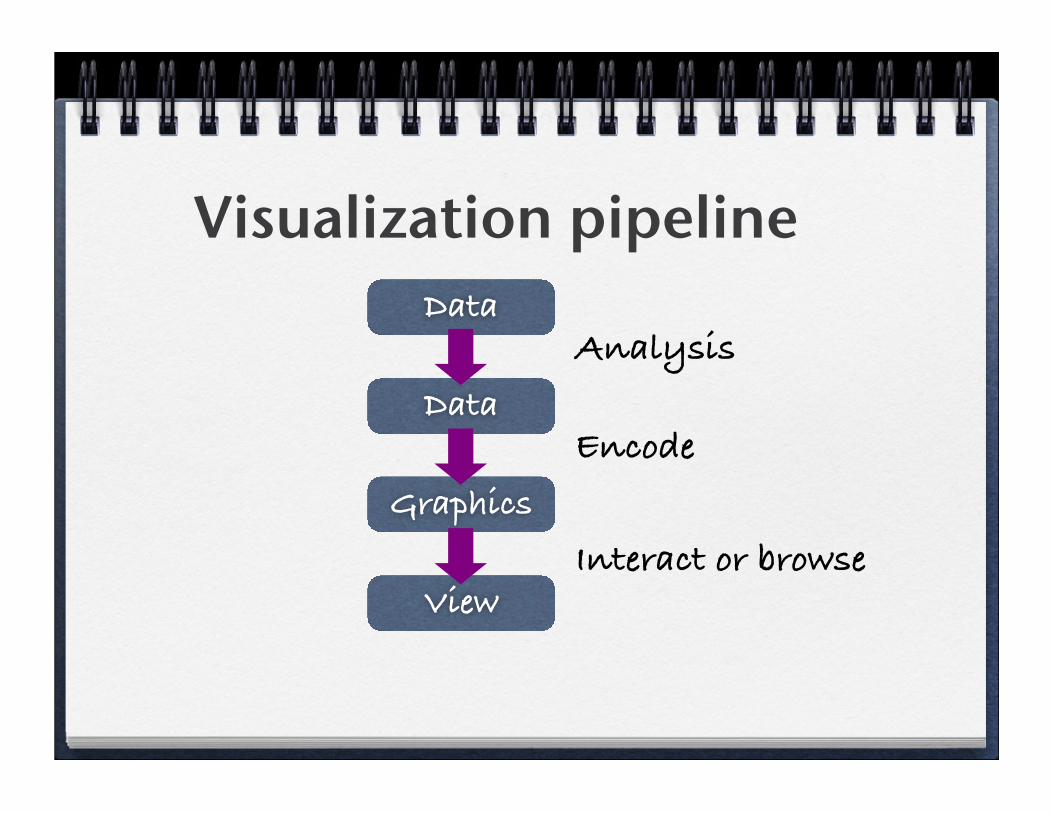
Visualization pipeline
Data
Graphics
View
DataAnalysis
Encode
Interact or browse

The VTK pipeline
Your VTK program creates objects and joins them together
Every VTK program has at least one pipeline

Pipeline diagram (1)Source (data)
Mapper
Actor
Renderer
Window
Interactor
Either reads the data from a file or create the data from scratch
Moves the data from VTK to opengl
For setting colors, surface properties, and the position of the object.
The rectangle of the computer screen that VTK draws into.
The window, including the title bar and decorations.
Allows the mouse to be used to interact with the data.

Pipeline diagram
Reader (data)
Filter (data)
Read the data from a file
Process the data
Viewer, renderer, interactorAll the rest

I don’t program, what should I do?
Paraview (http://www.paraview.org/paraview/resources/software.html)
All you need to know are the concepts we learned today and the vtk format (http://www.vtk.org/VTK/img/file-formats.pdf)
TITAN (for InfoVis: https://www.kitware.com/
InfovisWiki/index.php/Main_Page)

Thank you for your attention