Embed Size (px)
Citation preview
Scientific Visualization with VTK,The Visualization Toolkit
Science and Technology Support GroupHigh Performance Computing
Ohio Supercomputer Center1224 Kinnear Road
Columbus, OH 43212-1163
2Scientific Visualization with VTK
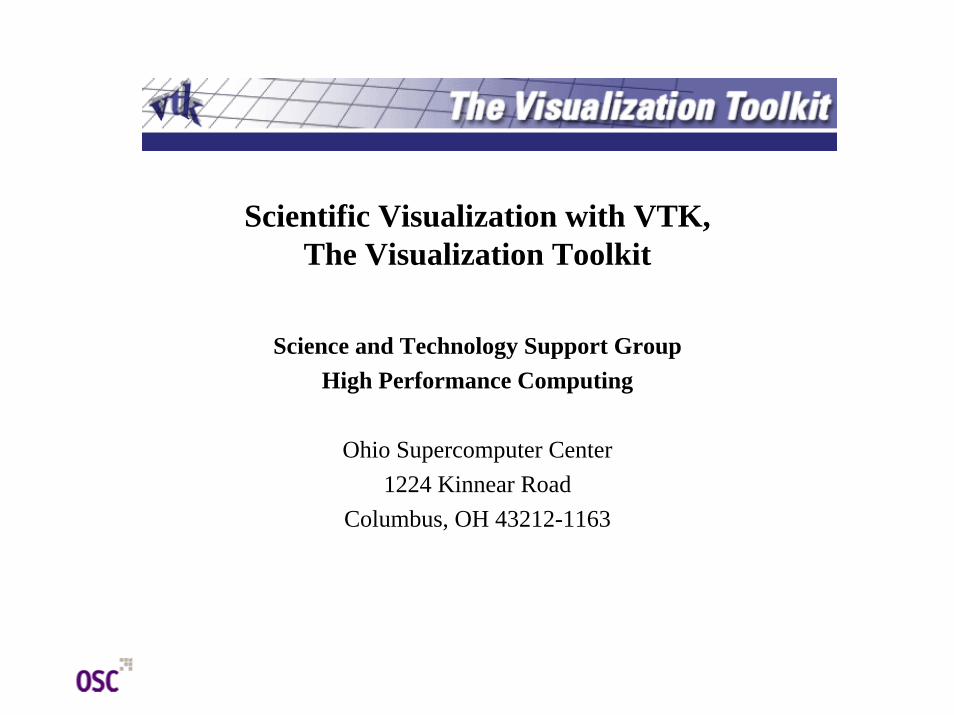
Table of Contents
• Day 1: Session 1– Preparation on BALE Cluster– What is VTK?– Installing VTK!
• Cmake, C++• Java, Tcl/Tk, Python
– First Look• Using the four platforms• C++, Python, Tcl, Java
– VTK Overview• Graphics model• Visualization model
– Programming and the Visualization Pipeline
• Day 1: Session 2– Basics
• Interacting with the Window• Procedural Source Objects• Read Source Objects• Filtering Data• Controlling Cameras• Controlling Lights• Controlling 3D Props• Textures• Picking• Other Controls
– Annotation– LOD-Level of Detail– Assemblies– Volume
– Special Plotting Classes• Scalar Bars• X-Y Plots• Bounding Box Axes• Labeling Data
– 3D Widgets
3Scientific Visualization with VTK
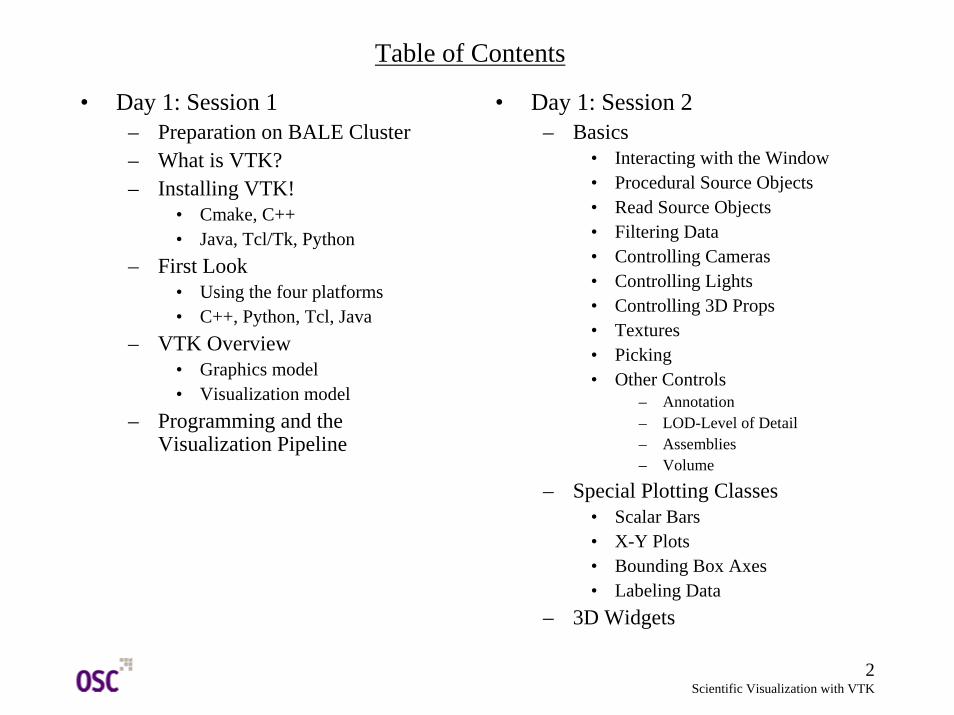
Table of Contents
• Day 2: Session 1– Visualization Techniques
• Color mapping• Contouring• Glyphing• Streamlines• Streamsurfaces• Cutting• Merge data• Probing• Isosurfaces
• Day 2: Session 2– Case Study
• Material defects• Computational Fluid Dynamics• Finite Element Analysis• Segmented Volume Data
4Scientific Visualization with VTK
Preparation on BALE Cluster
• Limited disk space for workshop accounts in ${HOME}
• Change the shell environment – >> tcsh
• Change to larger disk space – >> cd /tmp
• Copy the resource directory to the local disk– >> cp –r ~pete/VTKWorkshop .– >> cd VTKWorkshop– >> source Stuff/cshrc
• Creates needed environment variables• Contents of directory
– Docs • Supporting documentation
– Stuff– Examples– Graphics– Textbook
5Scientific Visualization with VTK
Preparation on BALE Cluster
• Looking for VTK expression– Position shell script, search.csh, in Examples
• >> cd Examples• cp ../Stuff/search.csh .
– >> search.csh dir vtkexpression• dir is one of Cxx | Python | Tcl• vtkexpression is any VTK class or function
name• >> search.csh Python SetColor
• For the rest of this workshop this will be your working directory
6Scientific Visualization with VTK
What is VTK?
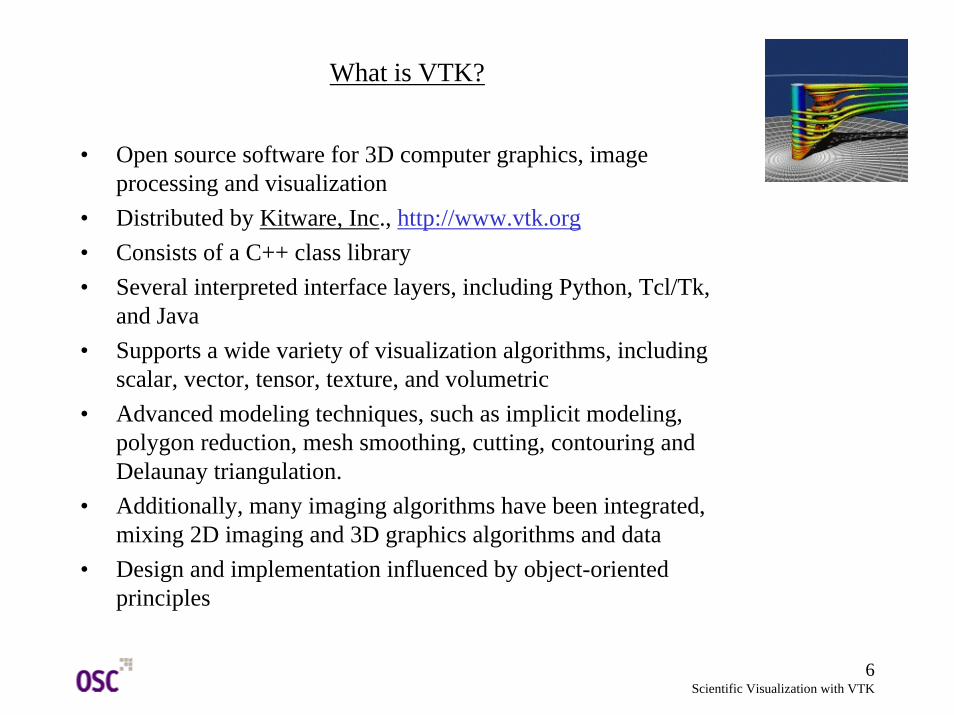
• Open source software for 3D computer graphics, image processing and visualization
• Distributed by Kitware, Inc., http://www.vtk.org• Consists of a C++ class library• Several interpreted interface layers, including Python, Tcl/Tk,
and Java• Supports a wide variety of visualization algorithms, including
scalar, vector, tensor, texture, and volumetric• Advanced modeling techniques, such as implicit modeling,
polygon reduction, mesh smoothing, cutting, contouring and Delaunay triangulation.
• Additionally, many imaging algorithms have been integrated, mixing 2D imaging and 3D graphics algorithms and data
• Design and implementation influenced by object-oriented principles
7Scientific Visualization with VTK
What is VTK?
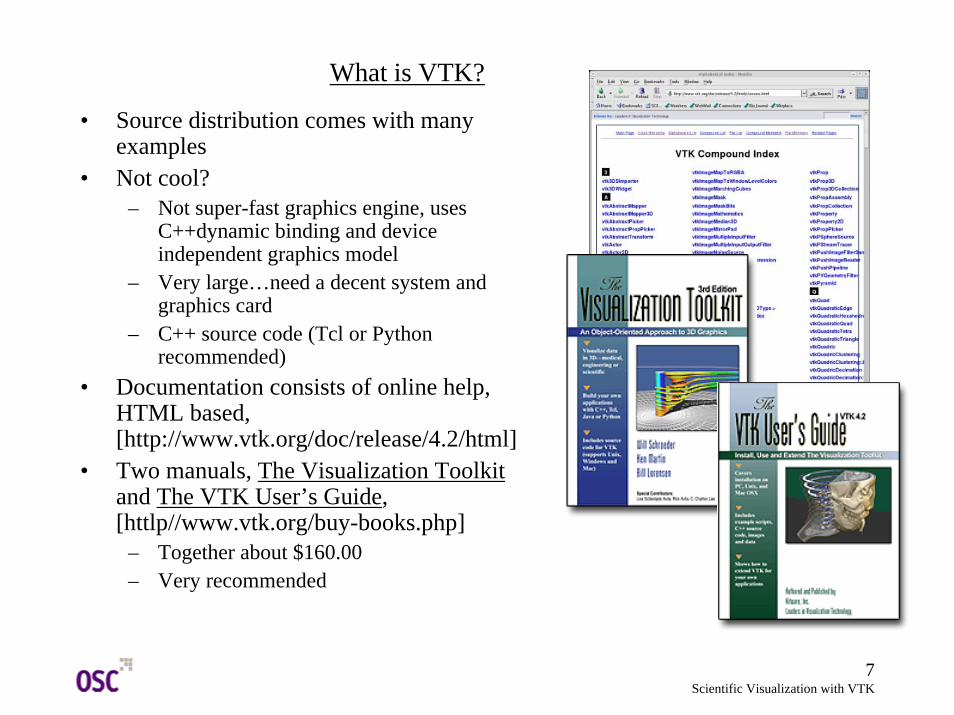
• Source distribution comes with many examples
• Not cool?– Not super-fast graphics engine, uses
C++dynamic binding and device independent graphics model
– Very large…need a decent system and graphics card
– C++ source code (Tcl or Python recommended)
• Documentation consists of online help, HTML based, [http://www.vtk.org/doc/release/4.2/html]
• Two manuals, The Visualization Toolkitand The VTK User’s Guide, [httlp//www.vtk.org/buy-books.php]
– Together about $160.00– Very recommended
8Scientific Visualization with VTK
Installing VTK!
• No Unix, No Linux, No Service• OSC forums,
[http://www.osc.edu/forums]– Look for a VTK/Paraview forum– Issues of an open access vs. secure access
• Additional resources– Sebastien Barre’s links
[http://www.barre.nom.fr/vtk/links.html]– Vtkusers mailing list
[http://public.kitware.com/mailman/listinfo/vtkusers]
• Compiling from source recommended because of dependencies
• Useful Linux tools– Looking for installed executables: “which
command”– Locating specific files, libraries, include
files: “locate filename”• Installation instructions very straight
forward• Cmake installation required; url linked
off http://www.vtk.org• Installing as root highly recommended
• Install any of the support programming platforms first
– C++ should be already installed• /usr/bin/c++• /usr/bin/gcc
– Tcl/Tk [http://www.tcl.org]– Python [http://www.python.org]
• Should install Tkinter.py– Java [http://www.java.sun.com]
• Terminal based user interface, ccmake– Cmake typically will find and set most
options• Customizing build using interactive
wizard mode, “cmake –i”– Most options will be set by cmake– But check to be sure, especially with
settings for libraries/includes for support platforms
• After cmake, three steps– make (makes binaries/libraries)– make test
• Will create a report of successes/failures– make install (if root)
9Scientific Visualization with VTK
First Look
• Running an example under the four different platforms
• Change directory to /tmp/dirname/Examples/Tutorial/Step1
• C++– Change directory to Cxx/– Do not need to compile any
additional support like Java, Python or Tcl/Tk
– Cmake generates a makefile• >> cmake .• The dot, ‘.’, is required
– Use the make command to generate the executable
– To execute type the command ‘./Cone’
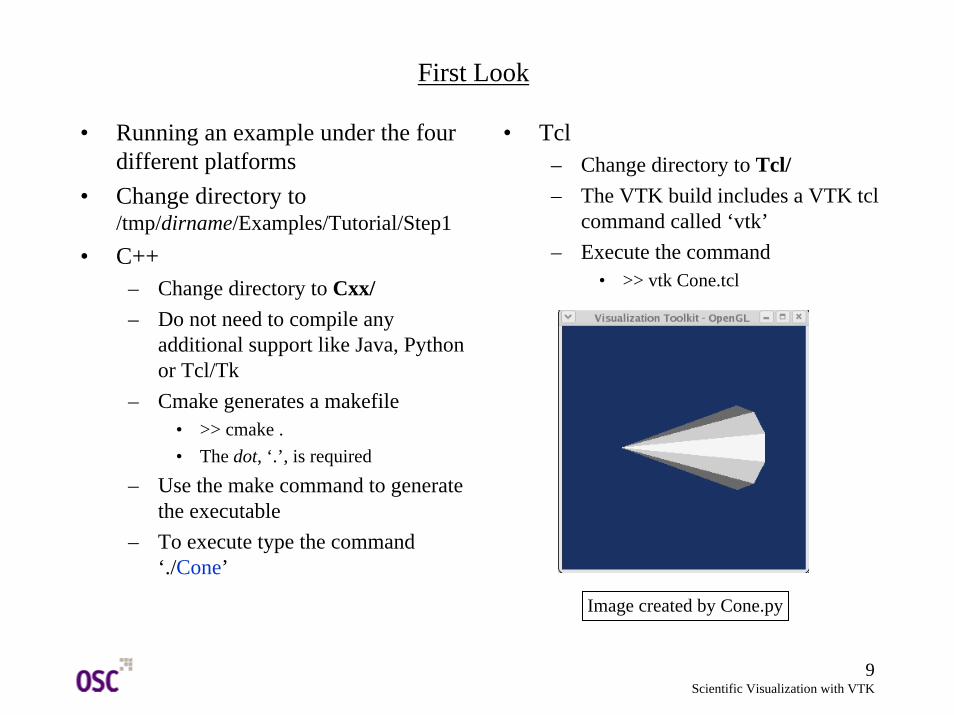
• Tcl– Change directory to Tcl/– The VTK build includes a VTK tcl
command called ‘vtk’– Execute the command
• >> vtk Cone.tcl
Image created by Cone.py
10Scientific Visualization with VTK
First Look
• Python– Change directory to Python– VTK build includes a VTK python
command called ‘vtkpython’– May want to alias this to something short
• >> alias vtkpython vp• Make sure no other command called vp• >> which vp• For BALE this is done by sourcing Stuff/cshrc
• Java– Change directory to Java/– Make certain Java CLASSPATH
environment variable is set to the VKT-java directory
• PathtoVTK/Wrapping/java/vtk
– Byte compile java code using ‘javac’• Creates ‘Cone.class’
– Execute using java runtime• >> java Cone
11Scientific Visualization with VTK
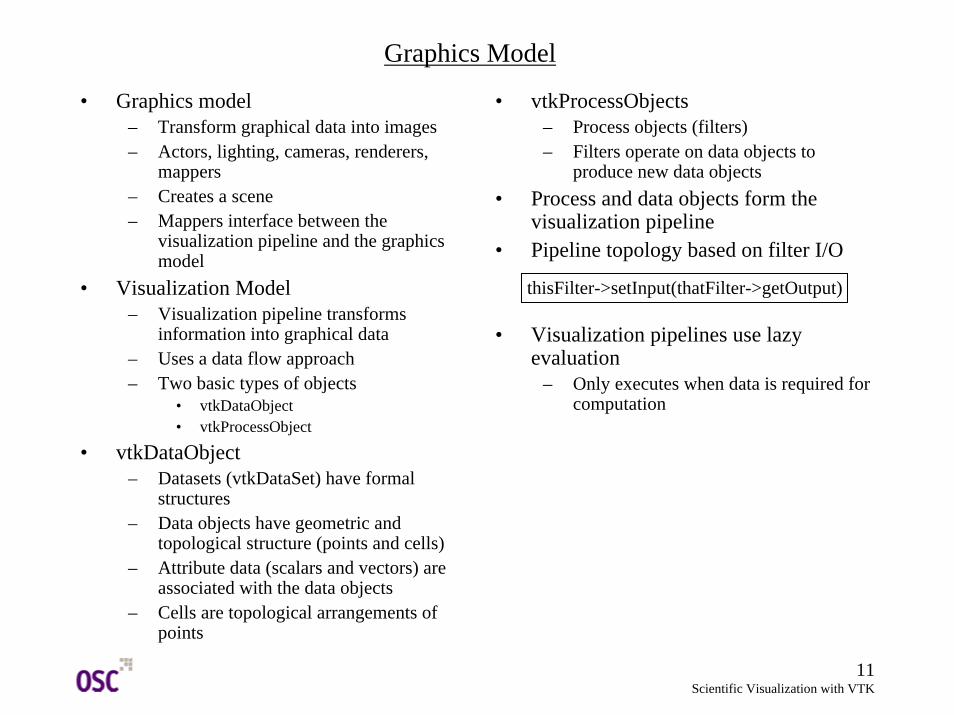
• vtkProcessObjects– Process objects (filters) – Filters operate on data objects to
produce new data objects• Process and data objects form the
visualization pipeline• Pipeline topology based on filter I/O
• Visualization pipelines use lazy evaluation
– Only executes when data is required for computation
Graphics Model
• Graphics model– Transform graphical data into images– Actors, lighting, cameras, renderers,
mappers– Creates a scene– Mappers interface between the
visualization pipeline and the graphics model
• Visualization Model– Visualization pipeline transforms
information into graphical data– Uses a data flow approach– Two basic types of objects
• vtkDataObject• vtkProcessObject
• vtkDataObject– Datasets (vtkDataSet) have formal
structures– Data objects have geometric and
topological structure (points and cells)– Attribute data (scalars and vectors) are
associated with the data objects– Cells are topological arrangements of
points
thisFilter->setInput(thatFilter->getOutput)
12Scientific Visualization with VTK
Graphics Model
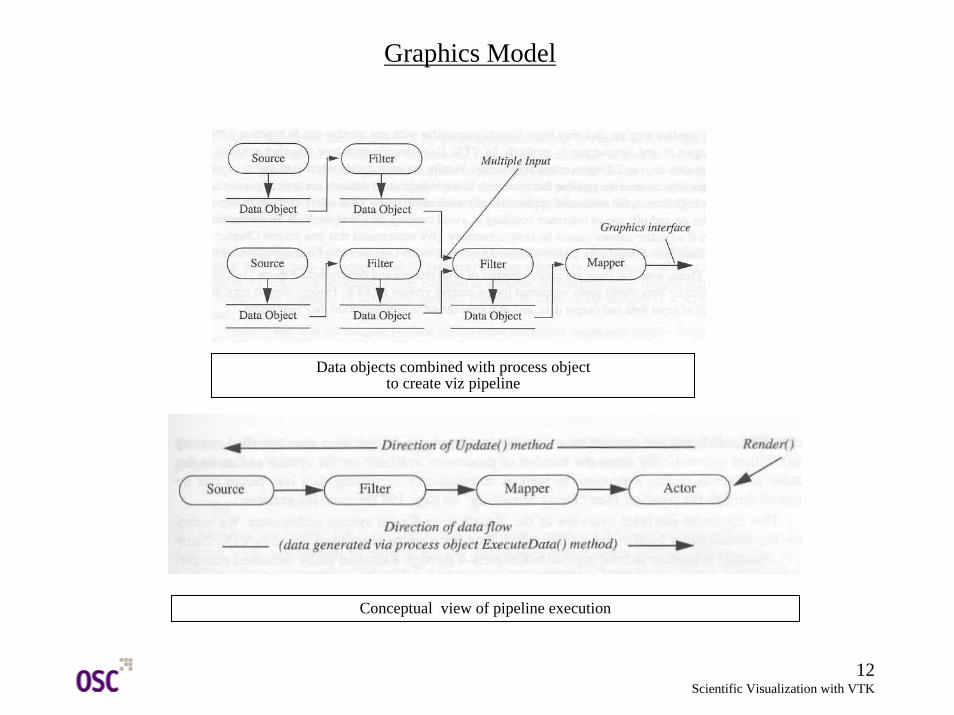
Conceptual view of pipeline execution
Data objects combined with process objectto create viz pipeline
13Scientific Visualization with VTK
Graphics Model
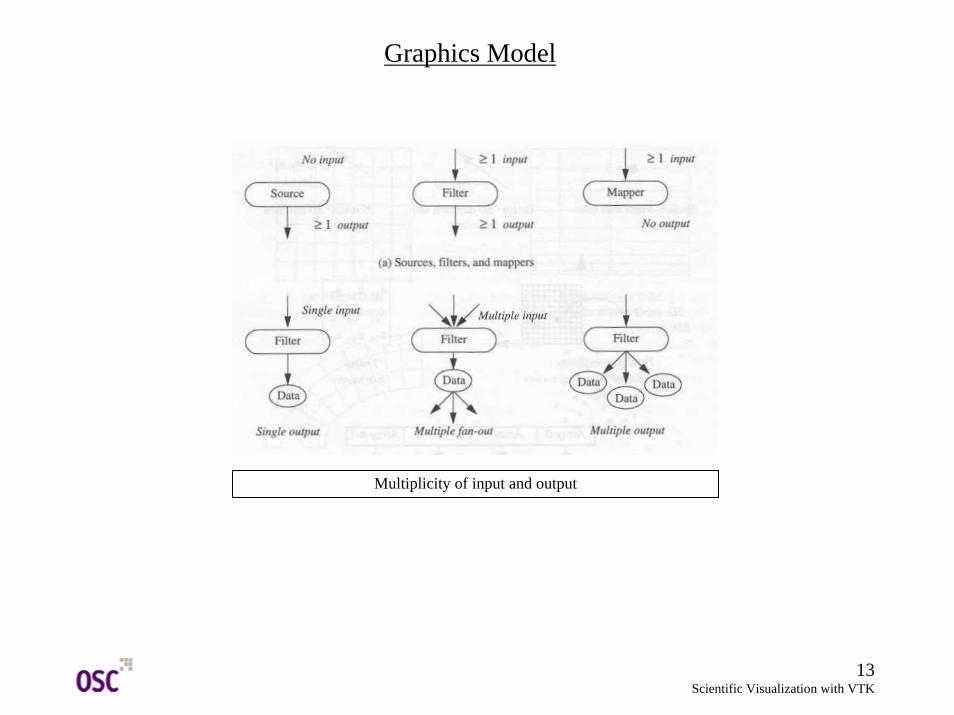
Multiplicity of input and output
14Scientific Visualization with VTK
Graphics Model
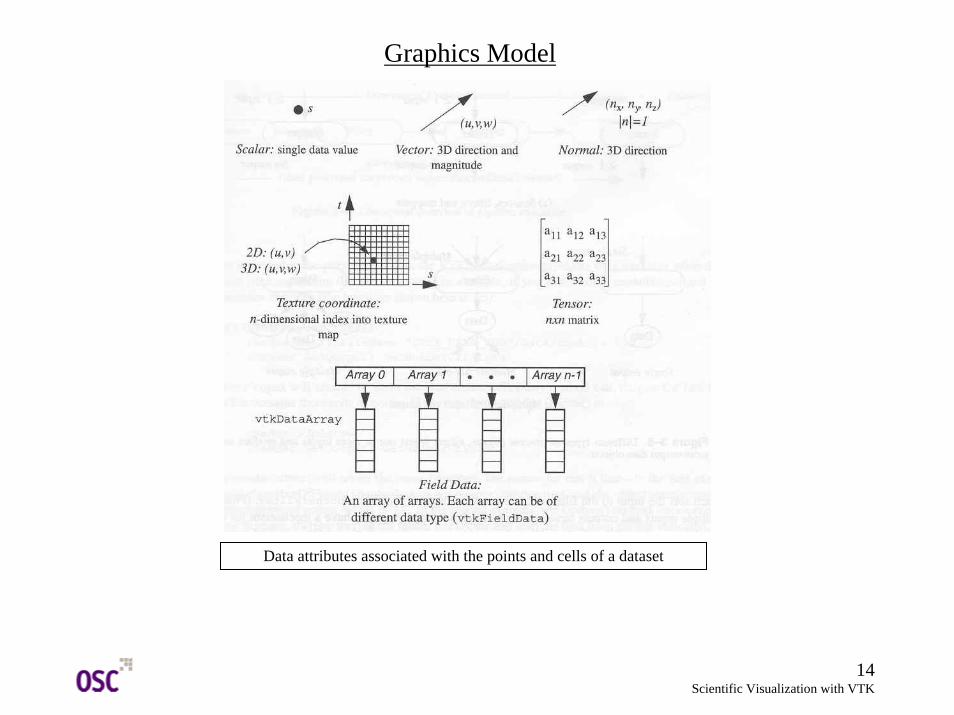
Data attributes associated with the points and cells of a dataset
15Scientific Visualization with VTK
Graphics Model
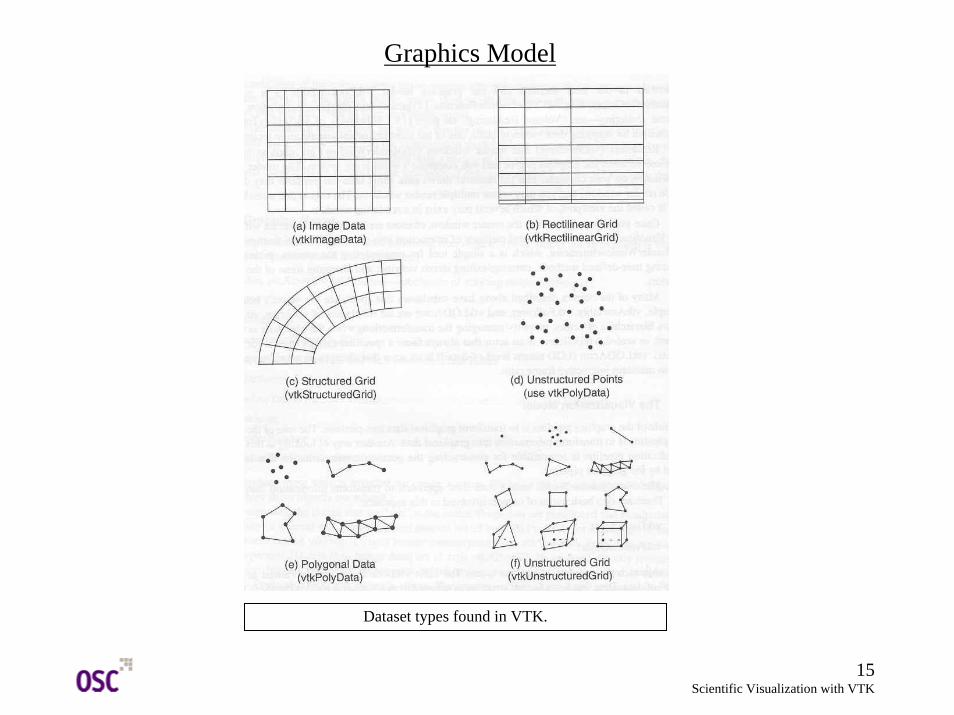
Dataset types found in VTK.
16Scientific Visualization with VTK
Programming and the Visualization Pipeline
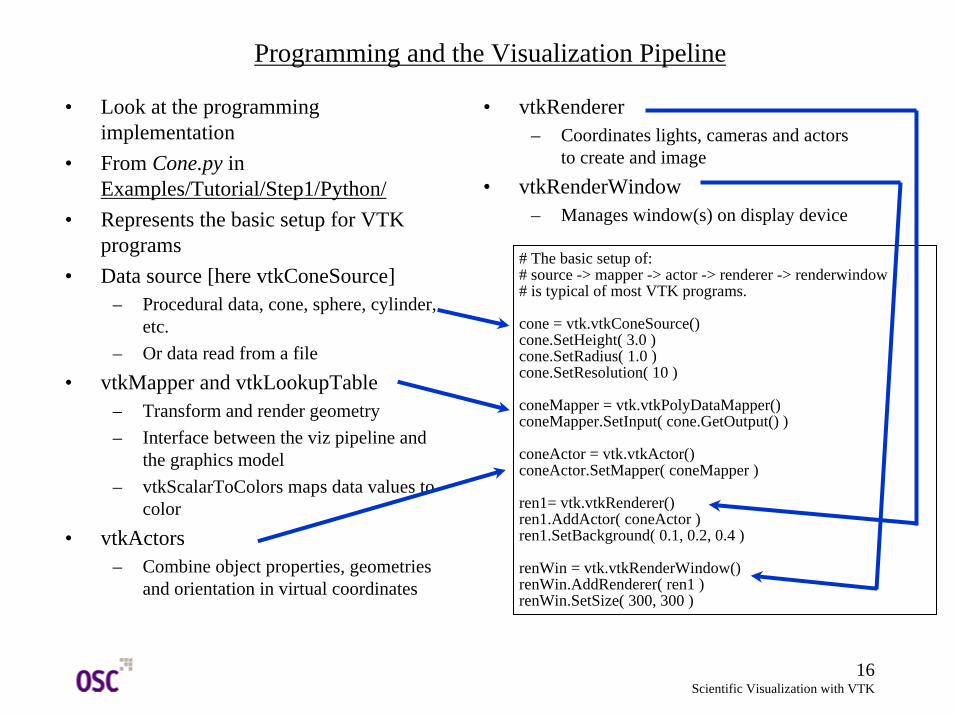
• Look at the programming implementation
• From Cone.py in Examples/Tutorial/Step1/Python/
• Represents the basic setup for VTK programs
• Data source [here vtkConeSource]– Procedural data, cone, sphere, cylinder,
etc.– Or data read from a file
• vtkMapper and vtkLookupTable– Transform and render geometry– Interface between the viz pipeline and
the graphics model– vtkScalarToColors maps data values to
color• vtkActors
– Combine object properties, geometries and orientation in virtual coordinates
# The basic setup of: # source -> mapper -> actor -> renderer -> renderwindow# is typical of most VTK programs.
cone = vtk.vtkConeSource()cone.SetHeight( 3.0 )cone.SetRadius( 1.0 )cone.SetResolution( 10 )
coneMapper = vtk.vtkPolyDataMapper()coneMapper.SetInput( cone.GetOutput() )
coneActor = vtk.vtkActor()coneActor.SetMapper( coneMapper )
ren1= vtk.vtkRenderer()ren1.AddActor( coneActor )ren1.SetBackground( 0.1, 0.2, 0.4 )
renWin = vtk.vtkRenderWindow()renWin.AddRenderer( ren1 )renWin.SetSize( 300, 300 )
• vtkRenderer– Coordinates lights, cameras and actors
to create and image• vtkRenderWindow
– Manages window(s) on display device
17Scientific Visualization with VTK
Programming and the Visualization Pipeline
• Conversions between languages relatively straightforward
– Class names and method names remain the same– Implementation details change (syntax)– GUI details change– Example, in the Cone program
• Python: “ren1.GetActiveCamera().Azimuth( 1 )”
• C++: “ren1->GetActiveCamera()->Azimuth( 1 );”• Tcl: “[ren1 GetActiveCamera] Azimuth 1”• Java: “ren1.GetActiveCamera().Azimuth( 1 );”
18Scientific Visualization with VTK
Basics - Interacting with the Window
• Interacting with the data once rendered• Using the vtkRenderWindowInteractor
– Keypress j | t• Toggle between joystick or trackball mode• In joystick style the motion occurs
continuously as long as the mouse button is pressed
• In trackball style the motion occurs when the mouse button is pressed and the mouse cursor moves
– Keypress c | a• Toggle between camera and actor modes• In camera mode, the mouse events affect the
camera position and focal point• In actor mode, the mouse events affect the
object under the mouse pointer
– LMB • Rotate camera or actor • Camera rotated around its focal point• Actor rotated around its origin
• vtkRenderWindowInteractor (cont’d)– MMB
• Pan camera or translate actor• In joystick mode direction of pan/translation
is from center of the viewport toward the mouse position
• In trackball mode, direction of motion in the direction of the mouse movement MMB
– RMB • Zoom camera or scale actor• Zoom in/increase scale in top half of the
viewport• Zoom out/decrease scale in lower half of the
viewport• In joystick mode amount is controlled by
distance of the pointer from the horizontal center line
– Keypress 3• Toggle in and out of stereo mode• Default is red-blue stereo pairs
– Keypress e | q• Exit/quit application
19Scientific Visualization with VTK
Basics - Interacting with the Window
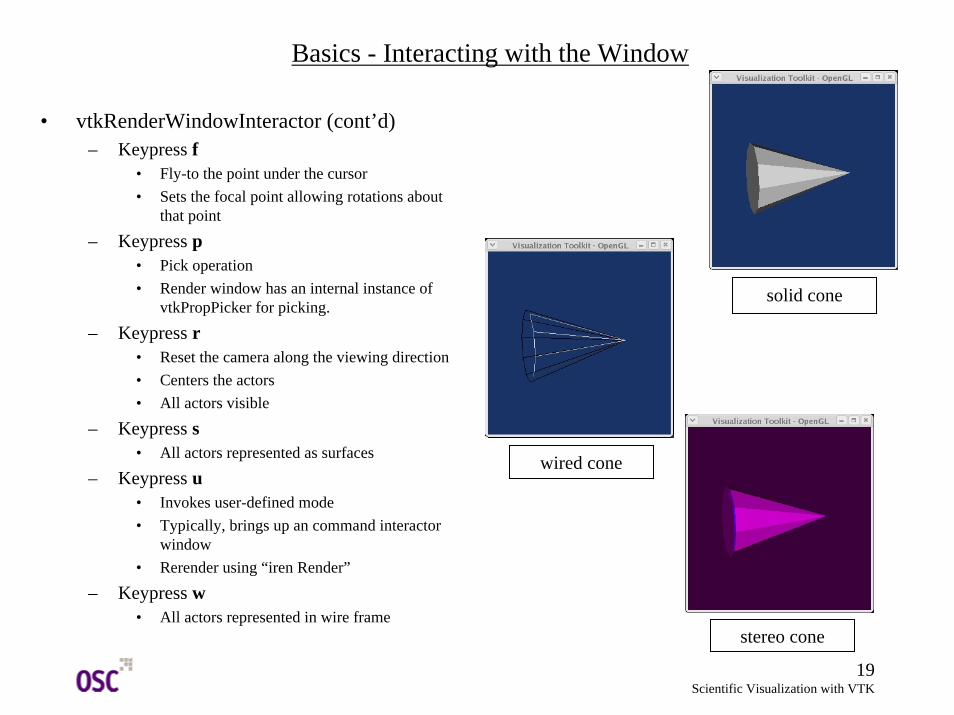
• vtkRenderWindowInteractor (cont’d)– Keypress f
• Fly-to the point under the cursor• Sets the focal point allowing rotations about
that point
– Keypress p• Pick operation• Render window has an internal instance of
vtkPropPicker for picking.
– Keypress r• Reset the camera along the viewing direction• Centers the actors • All actors visible
– Keypress s• All actors represented as surfaces
– Keypress u• Invokes user-defined mode• Typically, brings up an command interactor
window• Rerender using “iren Render”
– Keypress w• All actors represented in wire frame
wired cone
solid cone
stereo cone
20Scientific Visualization with VTK
Basics – Creating Models
• Two basic ways to obtain data– Read into a system from file, stream, etc.– Procedurally created by math expression or
algorithm• Creating a procedural object
– Load the vtk resources• vtkinteraction permits typing commands at
run time, among other resources• vtktesting defines a set of colors
– Create a cylinder defining the geometry– Using the SetInput method the cylinder
mapper is created from the cylinder geometry– Pipeline consists of two objects, source and
mapper– As yet, no data processed, lazy evaluation– Create graphics objects to render actor(s)
• ren1 coordinates rendering process for the viewport
• renWin controls the mapping of the viewportto the device
• iren is a 3D widget for manipulating the camera
…/Examples/Rendering/Tcl/Cylinder.tcl:
package require vtkpackage require vtkinteractionpackage require vtktesting
vtkCylinderSource cylindercylinder SetResolution 8
vtkPolyDataMapper cylinderMappercylinderMapper SetInput [cylinder GetOutput]
vtkActor cylinderActorcylinderActor SetMapper cylinderMappereval [cylinderActor GetProperty] SetColor $tomatocylinderActor RotateX 30.0cylinderActor RotateY -45.0
vtkRenderer ren1vtkRenderWindow renWin
renWin AddRenderer ren1vtkRenderWindowInteractor iren
iren SetRenderWindow renWin
21Scientific Visualization with VTK
Basics – Creating Models
• Creating a procedural object (cont’d)– Renderer is connected to the render window– Must connect actor(s) to renderer– Associate GUI interactor with render window
interactor’s user-defined method– Initialize method begins the event loop– Tcl/Tk command withdraw defines that the
interpreter widget, .vtkInteract, is not visible at startup
– Pipeline executes because rendering process will request data
– Force execution of pipeline with by invoking renWin Render
• Creating reader object– Similar to previous example– Exception is that reading data from disk– 42400-IDGH.stl is in binary STL data format– STL is stereo-lithography file– If changes made to file, pipeline not re-
executed– Invoke Modified() method
…/Examples/Rendering/Tcl/Cylinder.tcl:
ren1 AddActor cylinderActorren1 SetBackground 0.1 0.2 0.4renWin SetSize 200 200
iren AddObserver UserEvent {wm deiconify\.vtkInteract}
iren Initialize
[ren1 GetActiveCamera] Zoom 1.5renWin Render
# suppress Tcl/Tk empty “.” window# with VTK “withdraw” commandwm withdraw .
…/Examples/Rendering/Tcl/CADPart.tcl:
# This creates a polygonal cylinder model with# eight circumferential facets.#vtkSTLReader part
part SetFileName \"$VTK_DATA_ROOT/Data/42400-IDGH.stl"
22Scientific Visualization with VTK
Basics – Creating Models
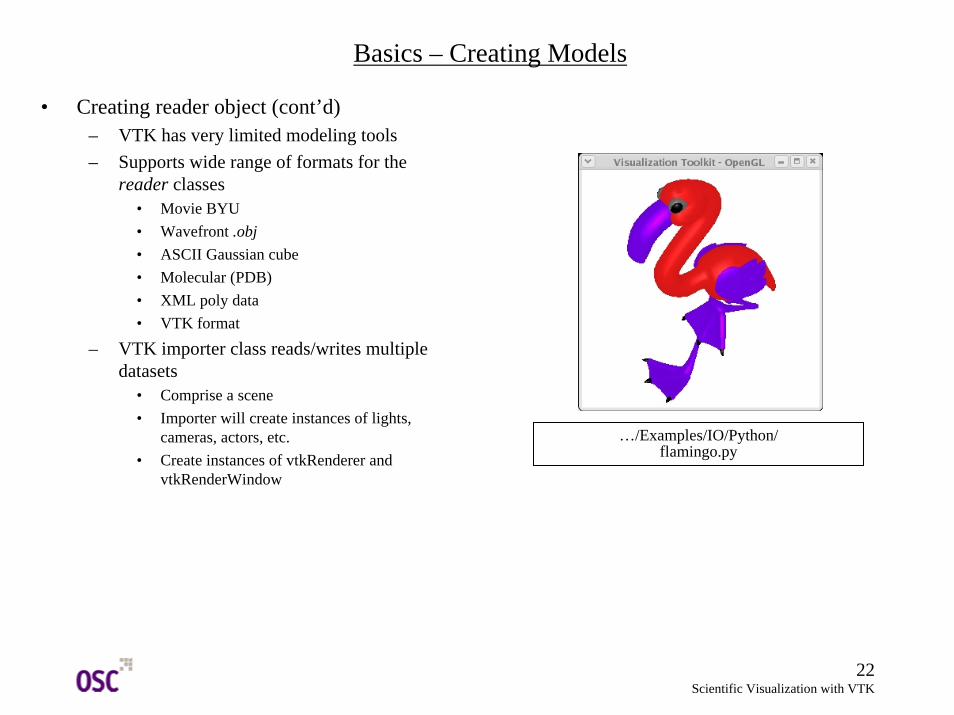
• Creating reader object (cont’d)– VTK has very limited modeling tools– Supports wide range of formats for the
reader classes• Movie BYU• Wavefront .obj• ASCII Gaussian cube• Molecular (PDB)• XML poly data• VTK format
– VTK importer class reads/writes multiple datasets
• Comprise a scene• Importer will create instances of lights,
cameras, actors, etc.• Create instances of vtkRenderer and
vtkRenderWindow
…/Examples/IO/Python/flamingo.py
23Scientific Visualization with VTK
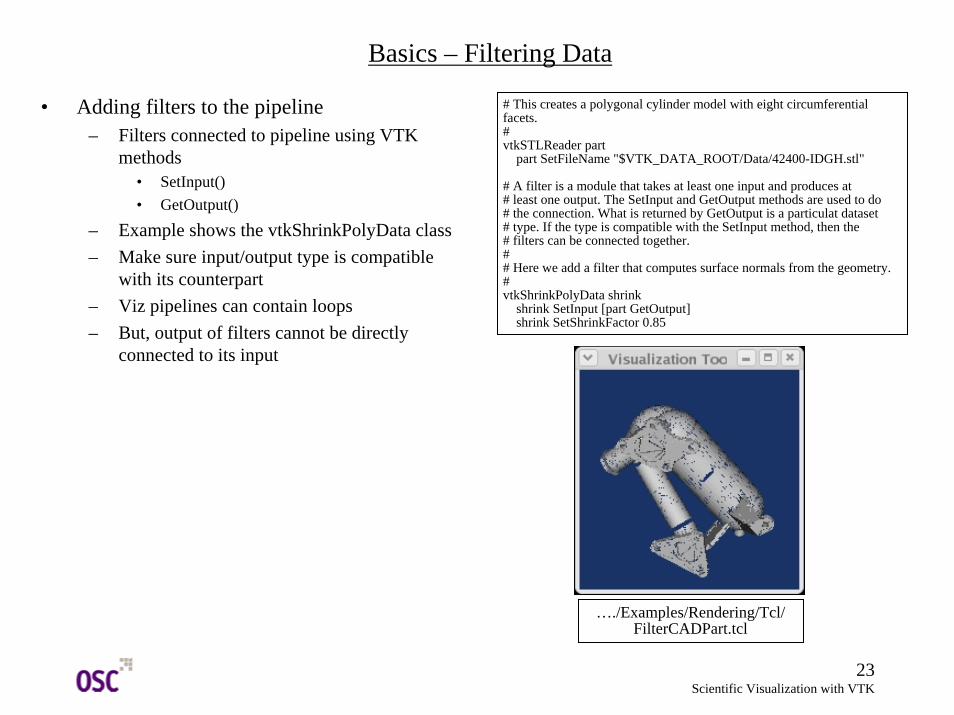
Basics – Filtering Data
• Adding filters to the pipeline– Filters connected to pipeline using VTK
methods • SetInput()• GetOutput()
– Example shows the vtkShrinkPolyData class– Make sure input/output type is compatible
with its counterpart– Viz pipelines can contain loops– But, output of filters cannot be directly
connected to its input
…./Examples/Rendering/Tcl/FilterCADPart.tcl
# This creates a polygonal cylinder model with eight circumferential facets.#vtkSTLReader part
part SetFileName "$VTK_DATA_ROOT/Data/42400-IDGH.stl"
# A filter is a module that takes at least one input and produces at# least one output. The SetInput and GetOutput methods are used to do# the connection. What is returned by GetOutput is a particulat dataset# type. If the type is compatible with the SetInput method, then the# filters can be connected together.## Here we add a filter that computes surface normals from the geometry.#vtkShrinkPolyData shrink
shrink SetInput [part GetOutput]shrink SetShrinkFactor 0.85
24Scientific Visualization with VTK
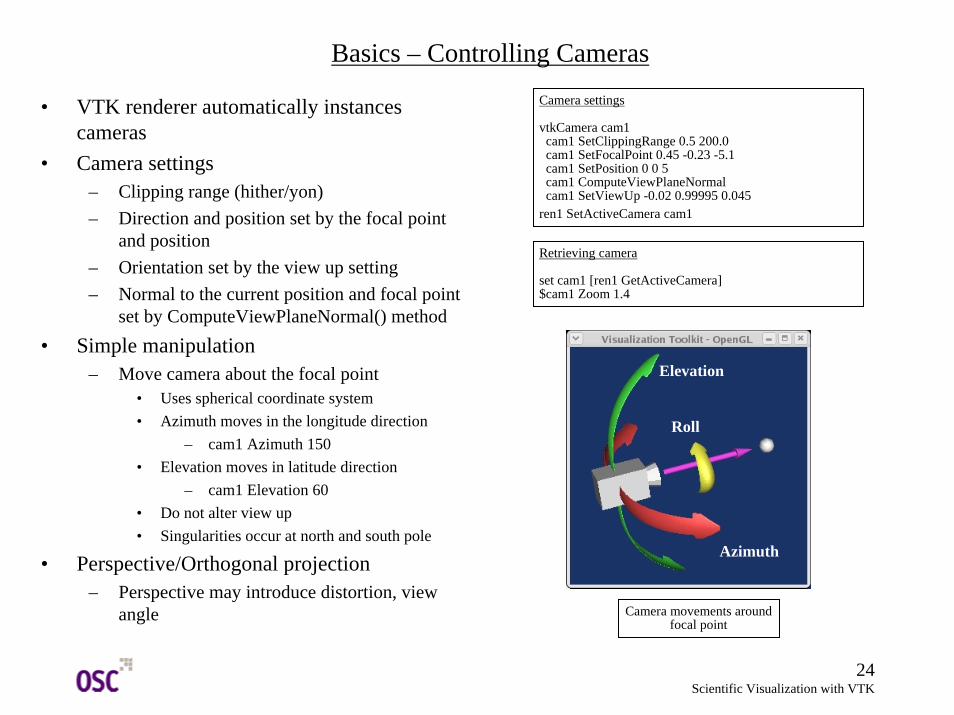
Basics – Controlling Cameras
• VTK renderer automatically instances cameras
• Camera settings– Clipping range (hither/yon)– Direction and position set by the focal point
and position– Orientation set by the view up setting– Normal to the current position and focal point
set by ComputeViewPlaneNormal() method• Simple manipulation
– Move camera about the focal point• Uses spherical coordinate system• Azimuth moves in the longitude direction
– cam1 Azimuth 150• Elevation moves in latitude direction
– cam1 Elevation 60• Do not alter view up• Singularities occur at north and south pole
• Perspective/Orthogonal projection– Perspective may introduce distortion, view
angle Camera movements around focal point
Camera settings
vtkCamera cam1cam1 SetClippingRange 0.5 200.0cam1 SetFocalPoint 0.45 -0.23 -5.1cam1 SetPosition 0 0 5cam1 ComputeViewPlaneNormalcam1 SetViewUp -0.02 0.99995 0.045
ren1 SetActiveCamera cam1
Retrieving camera
set cam1 [ren1 GetActiveCamera]$cam1 Zoom 1.4
Elevation
Roll
Azimuth
25Scientific Visualization with VTK
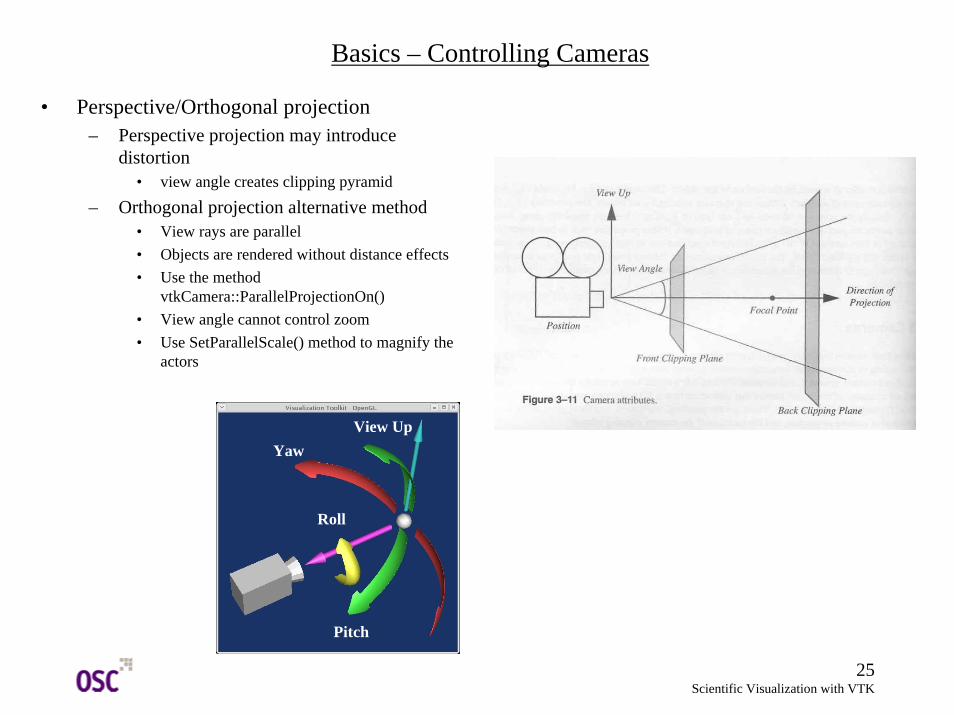
Basics – Controlling Cameras
• Perspective/Orthogonal projection– Perspective projection may introduce
distortion• view angle creates clipping pyramid
– Orthogonal projection alternative method• View rays are parallel• Objects are rendered without distance effects• Use the method
vtkCamera::ParallelProjectionOn()• View angle cannot control zoom• Use SetParallelScale() method to magnify the
actors
Yaw
Roll
Pitch
View Up
26Scientific Visualization with VTK
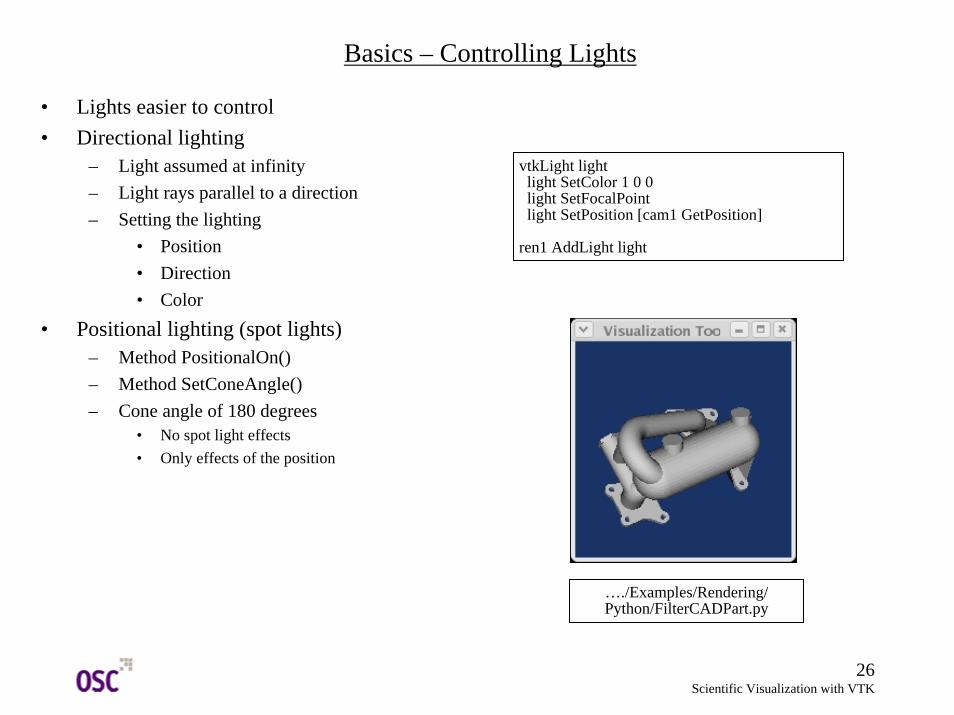
Basics – Controlling Lights
• Lights easier to control • Directional lighting
– Light assumed at infinity– Light rays parallel to a direction– Setting the lighting
• Position• Direction • Color
• Positional lighting (spot lights)– Method PositionalOn()– Method SetConeAngle()– Cone angle of 180 degrees
• No spot light effects• Only effects of the position
…./Examples/Rendering/Python/FilterCADPart.py
vtkLight lightlight SetColor 1 0 0light SetFocalPointlight SetPosition [cam1 GetPosition]
ren1 AddLight light
27Scientific Visualization with VTK
Basics – Controlling 3D Props
• vtkProp3D superclass of types of props existing in 3D space
– Has a 4x4 transformation matrix– Supports scaling, translating, rotating and
geometric projection• Class vtkActor is a type vtkProp3D
– Analytic primitives define geometry• Polygons• Lines
• Defining Position– SetPosition(x, y, z) in world coordinates– AddPosition(x, y, z), translates from the
current position– RotateX(theta), RotateY(theta),
RotateZ(theta), rotate around the respective axis by theta degrees
– SetOrientation(x, y, z), rotate, in degrees, about the z axis, then x axis, and finally y axis
– AddOrientation(t1, t2, t3), add to the current orientation
• Defining Position (cont’d)– RotateWXYZ(theta, x, y, z), rotate theta degrees
about the axis determined by the x-y-z vector– Scale(sx, sy, sz), scale in the x, y, z axes
directions– SetOrigin(x, y, z), specify origin, around which
rotations and scaling occur• Actors are the most common type of vtkProp3D
– Group rendering attributes • Surface properties• Representation• Texture maps • Geometric definition
– Defining geometry• Specified by the SetMapper() method
vtkPolyDataMapper mappermapper SetInput [aFilter GetOutput]
vtkActor anActoranActor SetMapper mapper
28Scientific Visualization with VTK
Basics – Controlling 3D Props
• Actors (cont’d)– Properties
• control the appearance of the actor• Features include controlling color, shading,
representation, opacity and lighting effects• May dereference property using
GetProperty() method• Alternate method is create a property then
assign it to the actor• advantage is that one property may be used
for a number of actors
– Color• Use the SetColor() method• Sets red, green, blue in that order• Values range from zero to one• Alternatively, set ambient, specular and
diffuse colors separately
vtkActor anActoranActor SetMapper mapper[anActor getProperty] SetOpacity 0.25[anActor getProperty] SetAmbient 0.25[anActor getProperty] SetDiffuse 0.25[anActor getProperty] SetSpecular 0.25[anActor getProperty] SetSpecularPower 0.25
vtkProperty propprop SetOpacity 0.25prop SetAmbient 0.25prop SetDiffuse 0.25prop SetSpecular 0.25prop SetSpecularPower 0.25
vtkActor anActoranActor SetMapper mapperanActor SetProperty prop
anActor SetColor 0.8 0.5 0.01
vtkActor anActoranActor SetMapper mapper[anActor getProperty] SetAmbientColor .1 .1 .1[anActor getProperty] SetDiffuseColor .1 .6. 78[anActor getProperty] SetSpecularColor 1 1 1
29Scientific Visualization with VTK
Basics – Controlling 3D Props
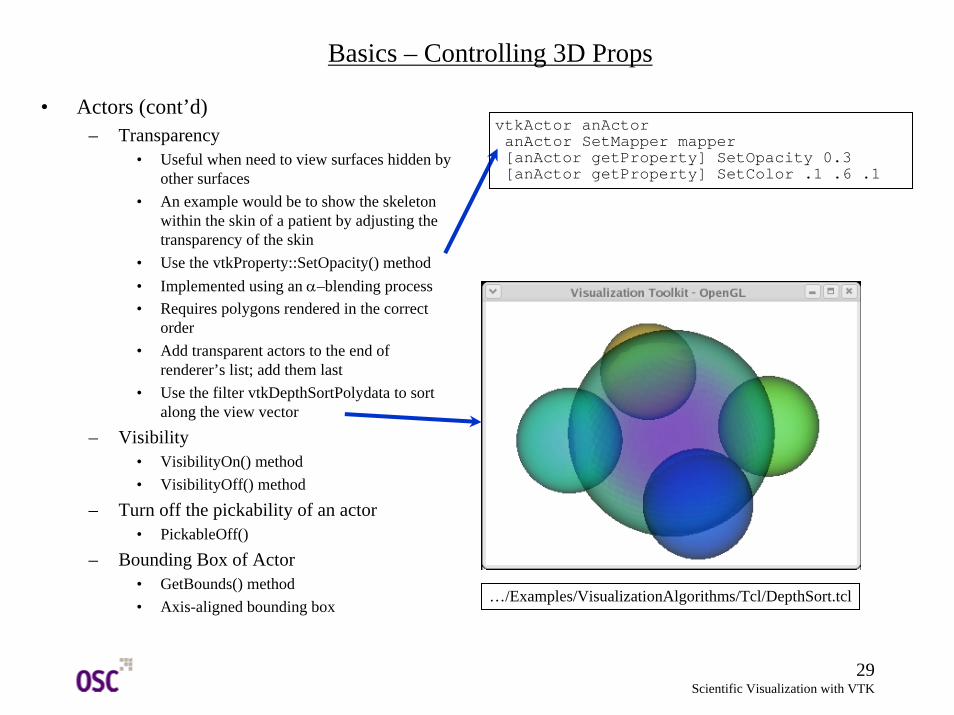
• Actors (cont’d)– Transparency
• Useful when need to view surfaces hidden by other surfaces
• An example would be to show the skeleton within the skin of a patient by adjusting the transparency of the skin
• Use the vtkProperty::SetOpacity() method• Implemented using an α–blending process• Requires polygons rendered in the correct
order• Add transparent actors to the end of
renderer’s list; add them last• Use the filter vtkDepthSortPolydata to sort
along the view vector
– Visibility• VisibilityOn() method• VisibilityOff() method
– Turn off the pickability of an actor• PickableOff()
– Bounding Box of Actor• GetBounds() method• Axis-aligned bounding box
vtkActor anActoranActor SetMapper mapper[anActor getProperty] SetOpacity 0.3[anActor getProperty] SetColor .1 .6 .1
…/Examples/VisualizationAlgorithms/Tcl/DepthSort.tcl
30Scientific Visualization with VTK
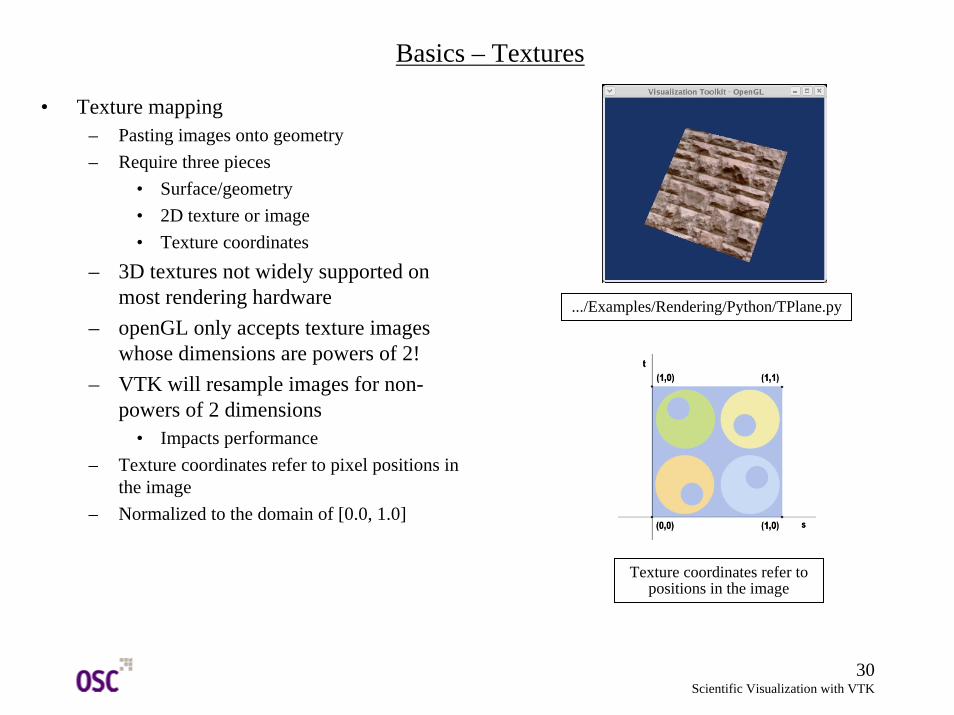
Basics – Textures
• Texture mapping– Pasting images onto geometry– Require three pieces
• Surface/geometry• 2D texture or image• Texture coordinates
– 3D textures not widely supported on most rendering hardware
– openGL only accepts texture images whose dimensions are powers of 2!
– VTK will resample images for non-powers of 2 dimensions
• Impacts performance– Texture coordinates refer to pixel positions in
the image– Normalized to the domain of [0.0, 1.0]
.../Examples/Rendering/Python/TPlane.py
Texture coordinates refer to positions in the image
31Scientific Visualization with VTK
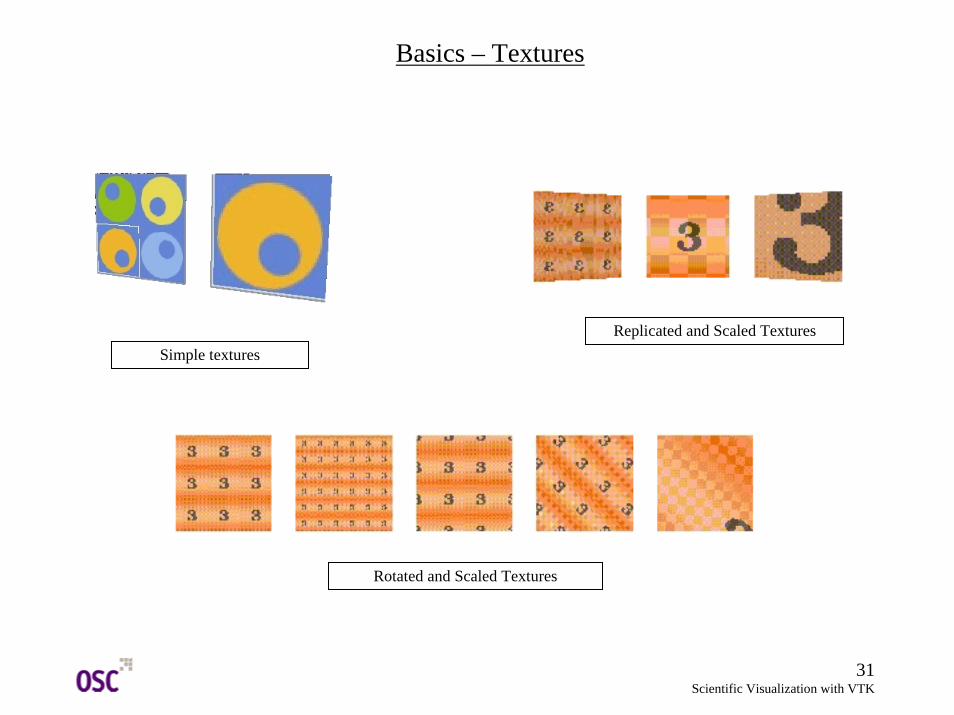
Basics – Textures
Simple textures
Rotated and Scaled Textures
Replicated and Scaled Textures
32Scientific Visualization with VTK
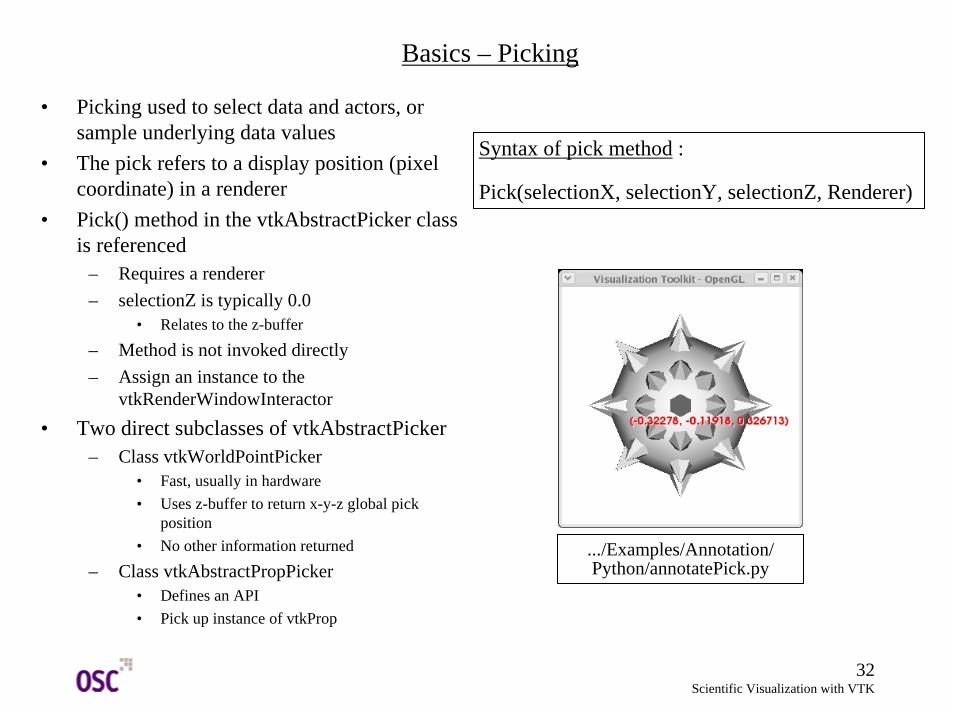
Basics – Picking
• Picking used to select data and actors, or sample underlying data values
• The pick refers to a display position (pixel coordinate) in a renderer
• Pick() method in the vtkAbstractPicker class is referenced
– Requires a renderer– selectionZ is typically 0.0
• Relates to the z-buffer
– Method is not invoked directly– Assign an instance to the
vtkRenderWindowInteractor• Two direct subclasses of vtkAbstractPicker
– Class vtkWorldPointPicker• Fast, usually in hardware• Uses z-buffer to return x-y-z global pick
position• No other information returned
– Class vtkAbstractPropPicker• Defines an API • Pick up instance of vtkProp
Syntax of pick method :
Pick(selectionX, selectionY, selectionZ, Renderer)
.../Examples/Annotation/Python/annotatePick.py
33Scientific Visualization with VTK
Basics – Picking
– Class vtkAbstractPropPicker (cont’d)• Defines an API • Pick up instance of vtkProp
• Several convenience methods to determine return type of pick
– GetProp()-pointer to instance of vtkProp, otherwise NULL
– GetProp3D()-pointer to instance of vtkProp3D– GetActor2D()- pointer to instance of vtkActor2D– GetActor()- pointer to instance of vtkActor– GetVolume()- pointer to instance of vtkVolumn– GetAssembly()- pointer to instance of vtkAssembly– GetPropAssembly()- pointer to instance of
vtkPropAssembly• Two subclasses of vtkAbstractPropPicker
– Class vtkPropPicker• Uses hardware picking• Determines the instance of vtkProp• Generally, faster than vtkPicker• Can’t return information about the cell picked
34Scientific Visualization with VTK
Basics – Picking
– Class vtkPicker (cont’d)• Software based• Selects vtpProp’s by bounding box• Casts ray from camera through the selection point• Returns closest prop3D• Here, the picker binds the procedure annotatePick to
the EndPickEvent• In annotatePick, note the methods GetSelectionPoint
and GetPickPosition
# Create a Tcl procedure to create the text for the text# mapper used to display the results of picking.
proc annotatePick {} {if { [picker GetCellId] < 0 } {
textActor VisibilityOff
} else {set selPt [picker GetSelectionPoint]set x [lindex $selPt 0] set y [lindex $selPt 1]set pickPos [picker GetPickPosition]set xp [lindex $pickPos 0] set yp [lindex $pickPos 1]set zp [lindex $pickPos 2]
textMapper SetInput "($xp, $yp, $zp)"textActor SetPosition $x $ytextActor VisibilityOn
}
renWin Render}
# Pick the cell at this location.picker Pick 85 126 0 ren1
# Create a cell picker.vtkCellPicker picker
picker AddObserver EndPickEvent annotatePick
35Scientific Visualization with VTK
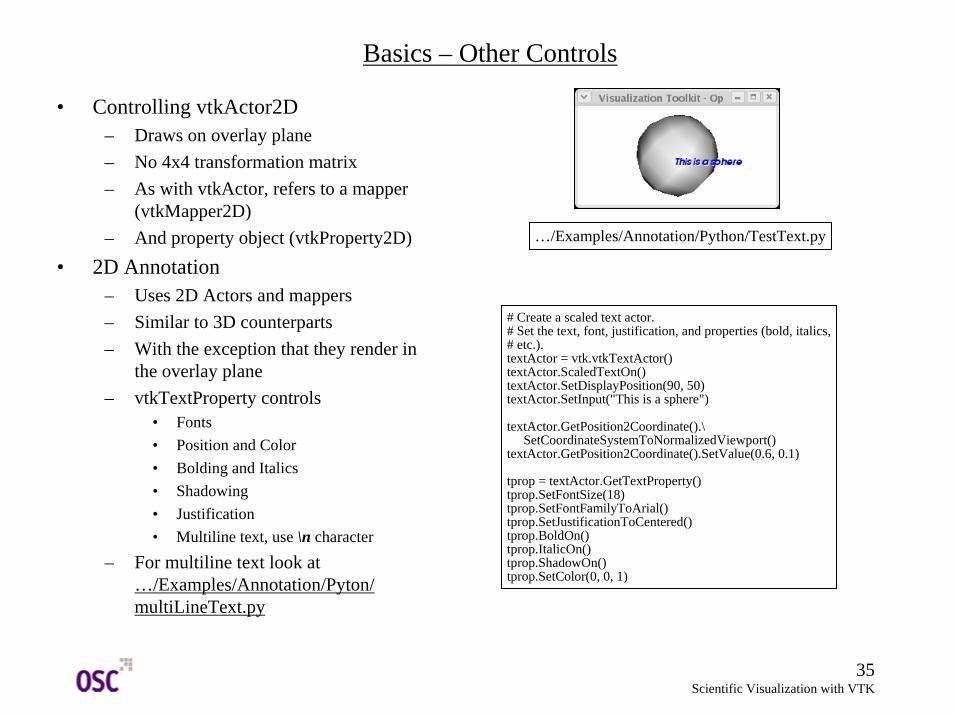
# Create a scaled text actor. # Set the text, font, justification, and properties (bold, italics,# etc.).textActor = vtk.vtkTextActor()textActor.ScaledTextOn()textActor.SetDisplayPosition(90, 50)textActor.SetInput("This is a sphere")
textActor.GetPosition2Coordinate().\SetCoordinateSystemToNormalizedViewport()
textActor.GetPosition2Coordinate().SetValue(0.6, 0.1)
tprop = textActor.GetTextProperty()tprop.SetFontSize(18)tprop.SetFontFamilyToArial()tprop.SetJustificationToCentered()tprop.BoldOn()tprop.ItalicOn()tprop.ShadowOn()tprop.SetColor(0, 0, 1)
Basics – Other Controls
• Controlling vtkActor2D– Draws on overlay plane– No 4x4 transformation matrix– As with vtkActor, refers to a mapper
(vtkMapper2D)– And property object (vtkProperty2D)
• 2D Annotation – Uses 2D Actors and mappers– Similar to 3D counterparts– With the exception that they render in
the overlay plane– vtkTextProperty controls
• Fonts• Position and Color• Bolding and Italics• Shadowing• Justification• Multiline text, use \n character
– For multiline text look at …/Examples/Annotation/Pyton/ multiLineText.py
…/Examples/Annotation/Python/TestText.py
36Scientific Visualization with VTK
Basics – Other Controls
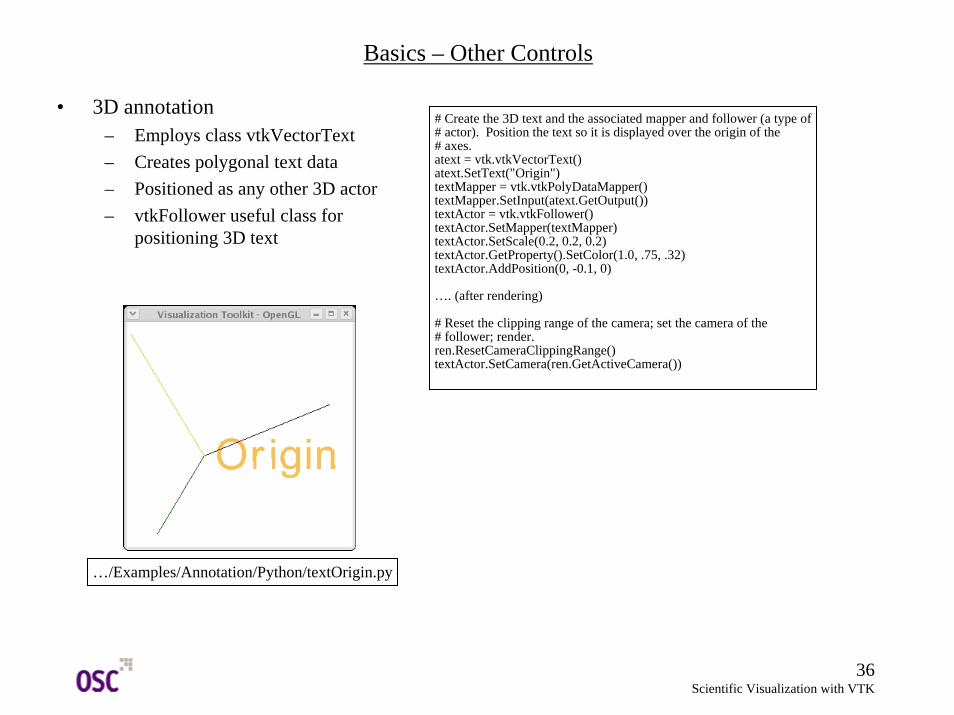
• 3D annotation– Employs class vtkVectorText– Creates polygonal text data– Positioned as any other 3D actor– vtkFollower useful class for
positioning 3D text
…/Examples/Annotation/Python/textOrigin.py
# Create the 3D text and the associated mapper and follower (a type of# actor). Position the text so it is displayed over the origin of the# axes.atext = vtk.vtkVectorText()atext.SetText("Origin")textMapper = vtk.vtkPolyDataMapper()textMapper.SetInput(atext.GetOutput())textActor = vtk.vtkFollower()textActor.SetMapper(textMapper)textActor.SetScale(0.2, 0.2, 0.2)textActor.GetProperty().SetColor(1.0, .75, .32)textActor.AddPosition(0, -0.1, 0)
…. (after rendering)
# Reset the clipping range of the camera; set the camera of the# follower; render.ren.ResetCameraClippingRange()textActor.SetCamera(ren.GetActiveCamera())
37Scientific Visualization with VTK
Basics – Other Controls
• LOD-Level of Detail– Enhance performance of graphics
system– Reduces resolution of viewable object– Replaces instances of vtkActor with
vtkLODActor– Control of the level of representation– Default LOD has two additional
lower-resolution models• Point cloud (default is 150 points)• Bounding box
– Additional levels through use of vtkAddLODMapper() method
• Do not need to add in order of complexity
vtkLODActor dotActordotActor SetMapper dotMapperdotActor SetNumberOfCloudPoints 1000
vtkRenderWindow ren1renWin SetDesiredUpdateRate 5.0
– Set the desired frame rate – Appropriate level-of-detail selected
automatically
• Assemblies– Reference …/Examples/Rendering/
Python/assembly.py– Hierarchical assembies (eg. Robot
limbs)– Subclass of vtkProp3D– Has no notion of properties or mappers– Leaf nodes of vtkAssembly carry
information• Material properties• Geometry
– Actors used by multiple assemblies– AddActor() method registers top actor
of assembly with renderer– Actors at lower levels added
recursively• Volumes
– vtkVolume used for volume rendering– Inherits from vtkProp3D for position
and orientation– vtkVolumeProperty method is
associated property object
38Scientific Visualization with VTK
Special Plotting Classes
• Scalar Bar– Creates color-coded key – Relates color values to data values– Three parts
• Colored segment• Labels• Title
– Must instance of vtkLookupTable• Defines colors• Defines range of data values
– Position and Orientation on the overlay plane
– Specify attributes• Color• Number of labels• Title text string• vtkSetOrientationToHorizontal() and
vtkSetOrientationToVertical() methods control orientation
Placeholder for scalar bar image
39Scientific Visualization with VTK
Special Plotting Classes
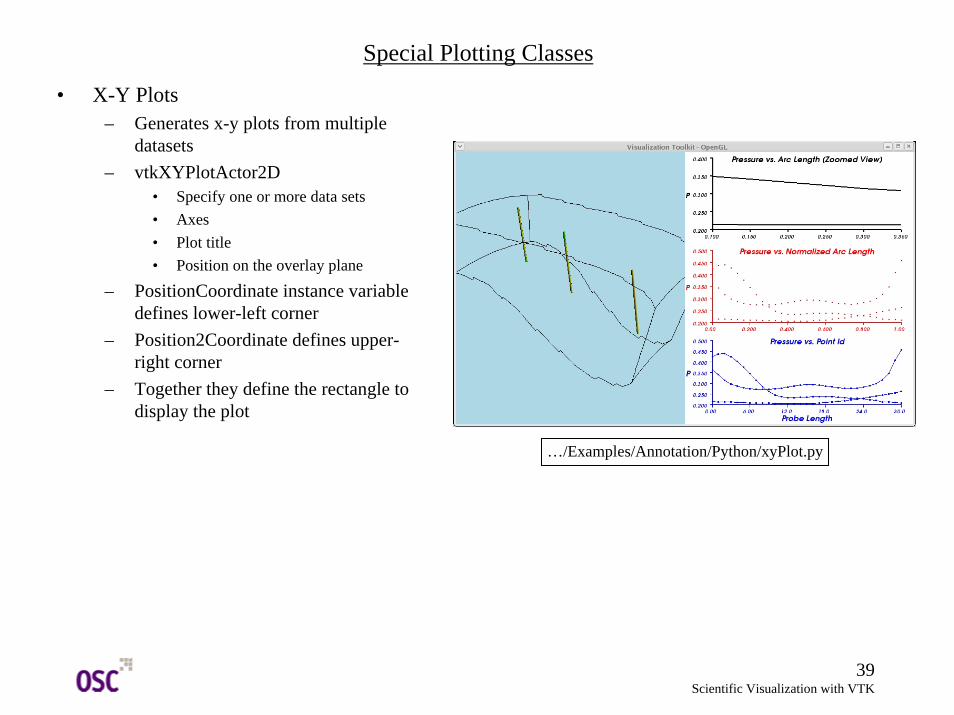
• X-Y Plots– Generates x-y plots from multiple
datasets– vtkXYPlotActor2D
• Specify one or more data sets• Axes• Plot title• Position on the overlay plane
– PositionCoordinate instance variable defines lower-left corner
– Position2Coordinate defines upper-right corner
– Together they define the rectangle to display the plot
…/Examples/Annotation/Python/xyPlot.py
40Scientific Visualization with VTK
Special Plotting Classes
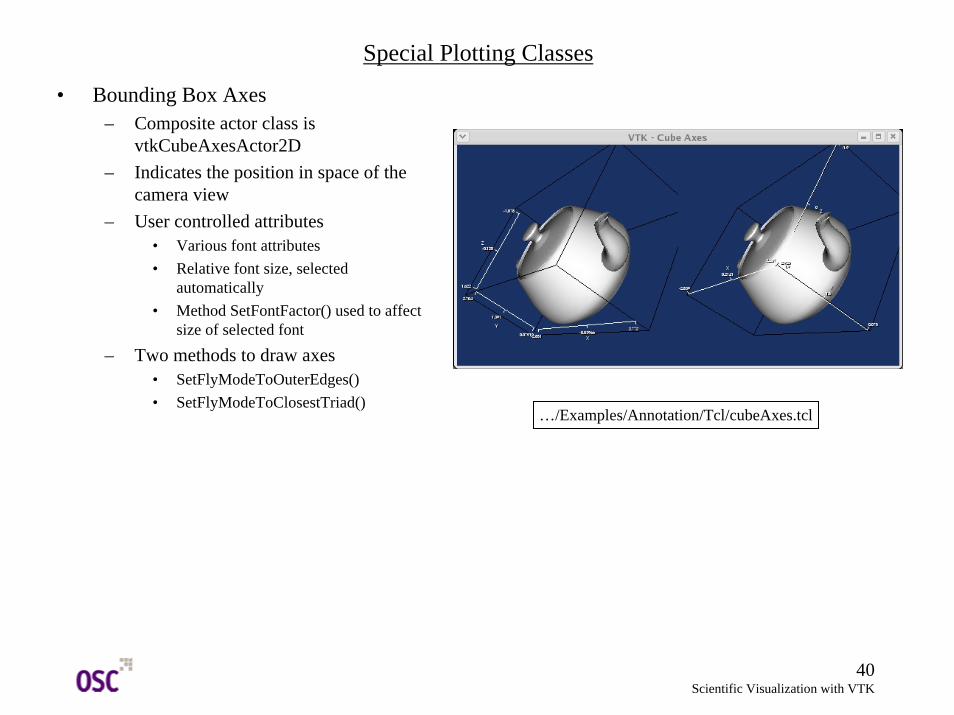
• Bounding Box Axes– Composite actor class is
vtkCubeAxesActor2D– Indicates the position in space of the
camera view– User controlled attributes
• Various font attributes• Relative font size, selected
automatically• Method SetFontFactor() used to affect
size of selected font
– Two methods to draw axes• SetFlyModeToOuterEdges()• SetFlyModeToClosestTriad()
…/Examples/Annotation/Tcl/cubeAxes.tcl
41Scientific Visualization with VTK
Special Plotting Classes
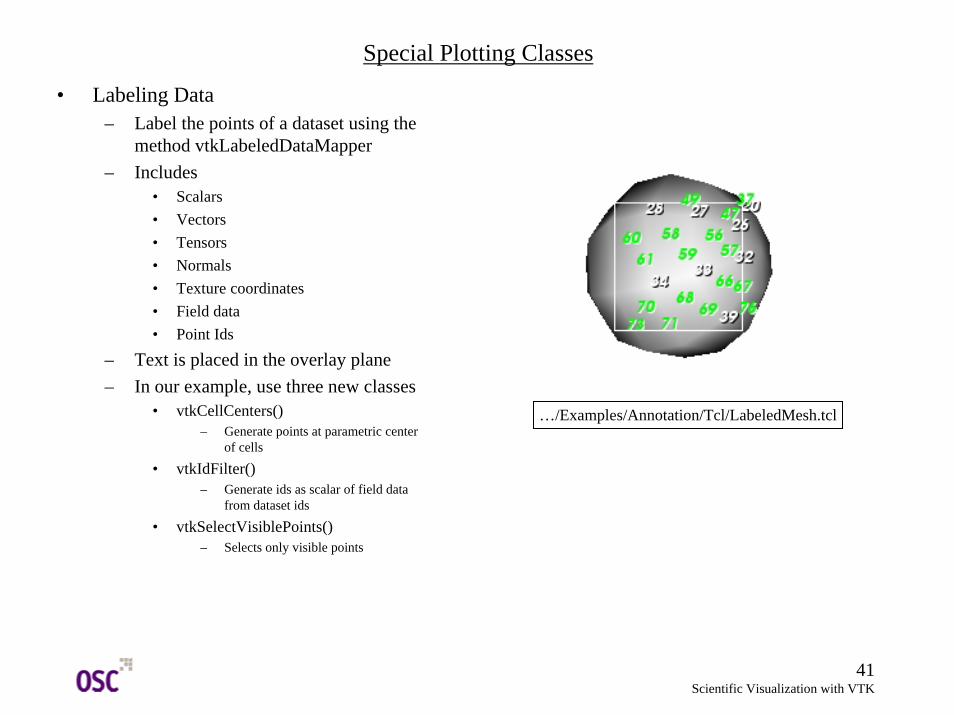
• Labeling Data– Label the points of a dataset using the
method vtkLabeledDataMapper– Includes
• Scalars• Vectors• Tensors• Normals• Texture coordinates• Field data • Point Ids
– Text is placed in the overlay plane– In our example, use three new classes
• vtkCellCenters()– Generate points at parametric center
of cells
• vtkIdFilter()– Generate ids as scalar of field data
from dataset ids
• vtkSelectVisiblePoints()– Selects only visible points
…/Examples/Annotation/Tcl/LabeledMesh.tcl
42Scientific Visualization with VTK
3D Widgets
• Subclasses of vtkInteractorObserver• Watch for events invoked by
vtkRenderWindowInteractor• 3D widgets represent themselves in the
scene• List of most important widgets
– vtkScalarBarWidget– vtkPointWidget– vtkLineWidget– vtkPlaneWidget– vtkImplicitPlane– vtkBoxWidget– vtkImagePlaneWidget– vtkSphereWidget– vtkSplineWidget
• Widgets differ in function• Offer different API
• Procedure much the same for all widgets
– Instantiate the widget– Specify the
vtkRenderWindowInteractor• Invokes events the widget may process
– Create callbacks (functions) – Widgets invoke events
• StartInteractionEvent• InteractionEvent• EndInteractionEvent
– Most widgets require placing• Instancing of vtkProp3D• A dataset• Invoke PlaceWidget() method
– Enable the widget• keypress I• Widget will appear in the scene
43Scientific Visualization with VTK
3D Widgets
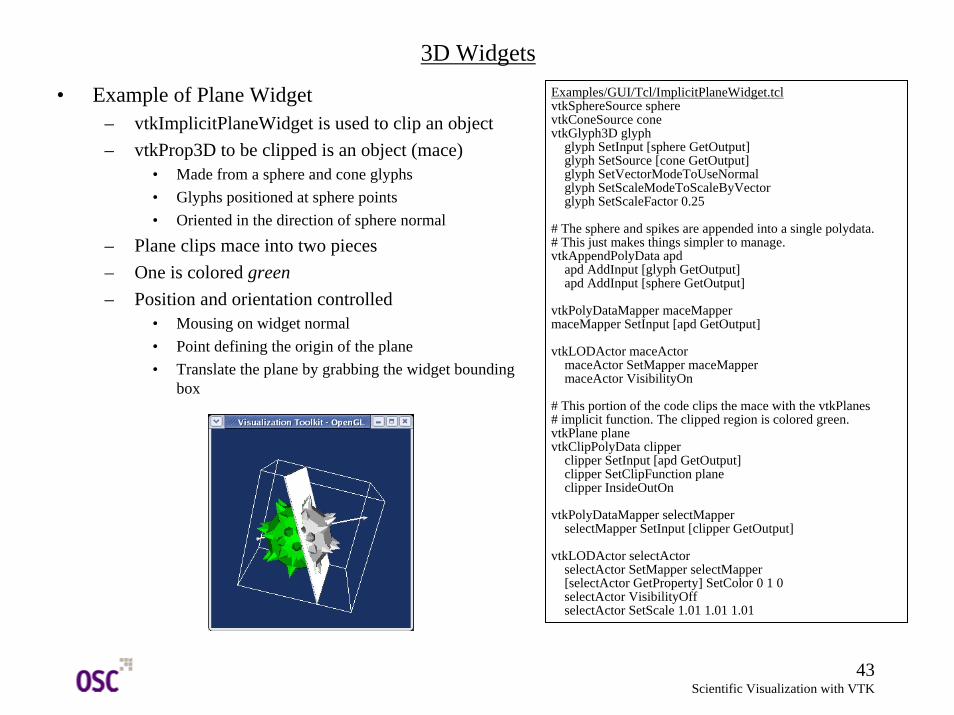
• Example of Plane Widget– vtkImplicitPlaneWidget is used to clip an object– vtkProp3D to be clipped is an object (mace)
• Made from a sphere and cone glyphs• Glyphs positioned at sphere points• Oriented in the direction of sphere normal
– Plane clips mace into two pieces– One is colored green– Position and orientation controlled
• Mousing on widget normal• Point defining the origin of the plane• Translate the plane by grabbing the widget bounding
box
Examples/GUI/Tcl/ImplicitPlaneWidget.tclvtkSphereSource spherevtkConeSource conevtkGlyph3D glyph
glyph SetInput [sphere GetOutput]glyph SetSource [cone GetOutput]glyph SetVectorModeToUseNormalglyph SetScaleModeToScaleByVectorglyph SetScaleFactor 0.25
# The sphere and spikes are appended into a single polydata. # This just makes things simpler to manage.vtkAppendPolyData apd
apd AddInput [glyph GetOutput]apd AddInput [sphere GetOutput]
vtkPolyDataMapper maceMappermaceMapper SetInput [apd GetOutput]
vtkLODActor maceActormaceActor SetMapper maceMappermaceActor VisibilityOn
# This portion of the code clips the mace with the vtkPlanes# implicit function. The clipped region is colored green.vtkPlane planevtkClipPolyData clipper
clipper SetInput [apd GetOutput]clipper SetClipFunction planeclipper InsideOutOn
vtkPolyDataMapper selectMapperselectMapper SetInput [clipper GetOutput]
vtkLODActor selectActorselectActor SetMapper selectMapper[selectActor GetProperty] SetColor 0 1 0selectActor VisibilityOffselectActor SetScale 1.01 1.01 1.01
44Scientific Visualization with VTK
3D Widgets# Create the RenderWindow, Renderer and both Actors#vtkRenderer ren1vtkRenderWindow renWin
renWin AddRenderer ren1vtkRenderWindowInteractor iren
iren SetRenderWindow renWin
# Associate the line widget with the interactorvtkImplicitPlaneWidget planeWidget
planeWidget SetInteractor irenplaneWidget SetPlaceFactor 1.25planeWidget SetInput [glyph GetOutput]planeWidget PlaceWidgetplaneWidget AddObserver InteractionEvent myCallback
ren1 AddActor maceActorren1 AddActor selectActor
# Add the actors to the renderer, set the background and size#ren1 SetBackground 1 1 1renWin SetSize 300 300ren1 SetBackground 0.1 0.2 0.4
# render the image#iren AddObserver UserEvent {wm deiconify .vtkInteract}renWin Render
# Prevent the tk window from showing up then start the event loop.wm withdraw .
proc myCallback {} {planeWidget GetPlane planeselectActor VisibilityOn
}
• Example of Plane Widget (cont’d)– Placing widget is with respect to a dataset
• planeWidget SetInput [glyph GetOutput]
– PlaceFactor adjusts relative size of widget• planeWidget SetPlaceFactor 1.25
– Key to behaviour is adding an observer– Observer responds to the InteractionEvent
• StartInteraction and EndInteraction invoked on mouse down and mouse up
• InteractionEvent on mouse move
– InteractionEvent tied to myCallback() procedure
• Copies widget plane to an instance of vtkPlane• An implicit function which does the clipping
45Scientific Visualization with VTK
Visualization Techniques
…/Examples/Rendering/Python/rainbow.py
lut = vtk.vtkLookupTable()
# This creates a black to white lut.##lut.SetHueRange(0, 0)##lut.SetSaturationRange(0, 0)##lut.SetValueRange(0.2, 1.0)
# This creates a red to blue lut.##lut.SetHueRange(0.0, 0.667)
# This creates a blue to red lut.##lut.SetHueRange(0.667, 0.0)
# This creates a wierd effect. lut.SetNumberOfColors(256)lut.Build()for i in range(0, 16):
lut.SetTableValue(i*16, red[0], red[1], red[2], 1)lut.SetTableValue(i*16+1, green[0], green[1], green[2], 1)lut.SetTableValue(i*16+2, blue[0], blue[1], blue[2], 1)lut.SetTableValue(i*16+3, black[0], black[1], black[2], 1)
…..
planeMapper = vtk.vtkPolyDataMapper()planeMapper.SetLookupTable(lut)planeMapper.SetInput(plane.GetOutput())planeMapper.SetScalarRange(pl3d.GetOutput().GetScalarRange())planeActor = vtk.vtkActor()planeActor.SetMapper(planeMapper)
• Color mapping– Coloring objects by scalar values– Scalar values mapped through lookup table– Color applied during rendering – Modifies appearance of points or cells– Scalars and the lookup table used by
instances of vtkMapper– Use any data array
• Method ColorByArrayComponent()
– If not specified, a default lookup table is created by the mapper
– Lookup table manipulated in two different ways
• Specify a HSVA ramp• Manually insert colors at specific locations
– Scalars mapped into lookup table by mapper’s SetScalarRange() method
– SetColorModeToDefault() method invokes default mapper behaviour
• Treats scalars of unsigned char as colors, performs no mapping
• All other scalars mapped through lookup table
46Scientific Visualization with VTK
Visualization Techniques
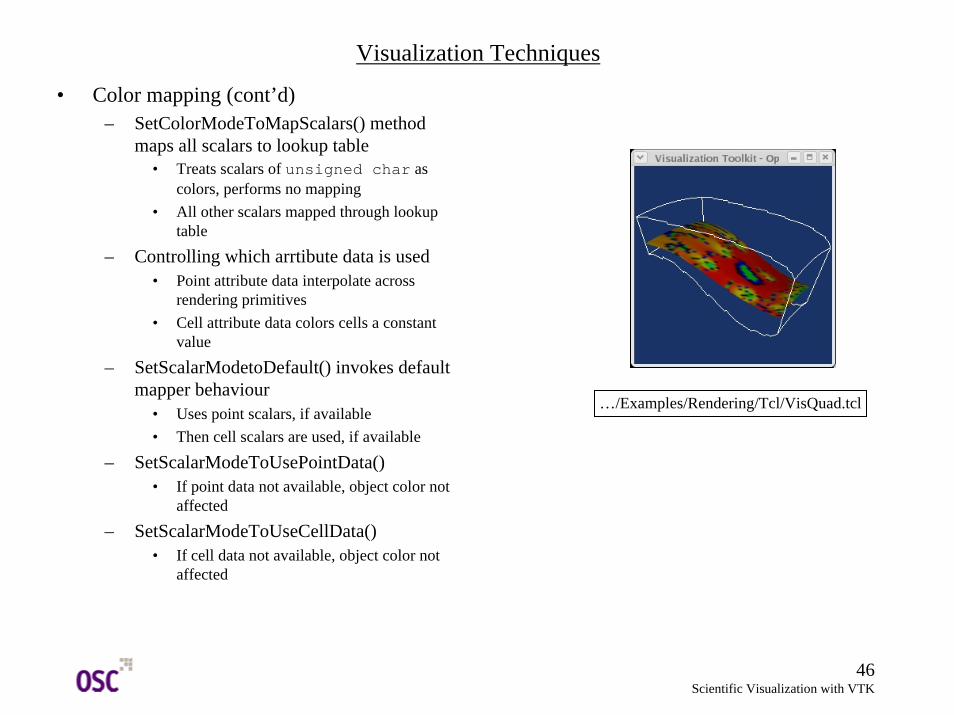
• Color mapping (cont’d)– SetColorModeToMapScalars() method
maps all scalars to lookup table• Treats scalars of unsigned char as
colors, performs no mapping• All other scalars mapped through lookup
table
– Controlling which arrtibute data is used• Point attribute data interpolate across
rendering primitives• Cell attribute data colors cells a constant
value
– SetScalarModetoDefault() invokes default mapper behaviour
• Uses point scalars, if available• Then cell scalars are used, if available
– SetScalarModeToUsePointData()• If point data not available, object color not
affected
– SetScalarModeToUseCellData()• If cell data not available, object color not
affected
…/Examples/Rendering/Tcl/VisQuad.tcl
47Scientific Visualization with VTK
Visualization Techniques
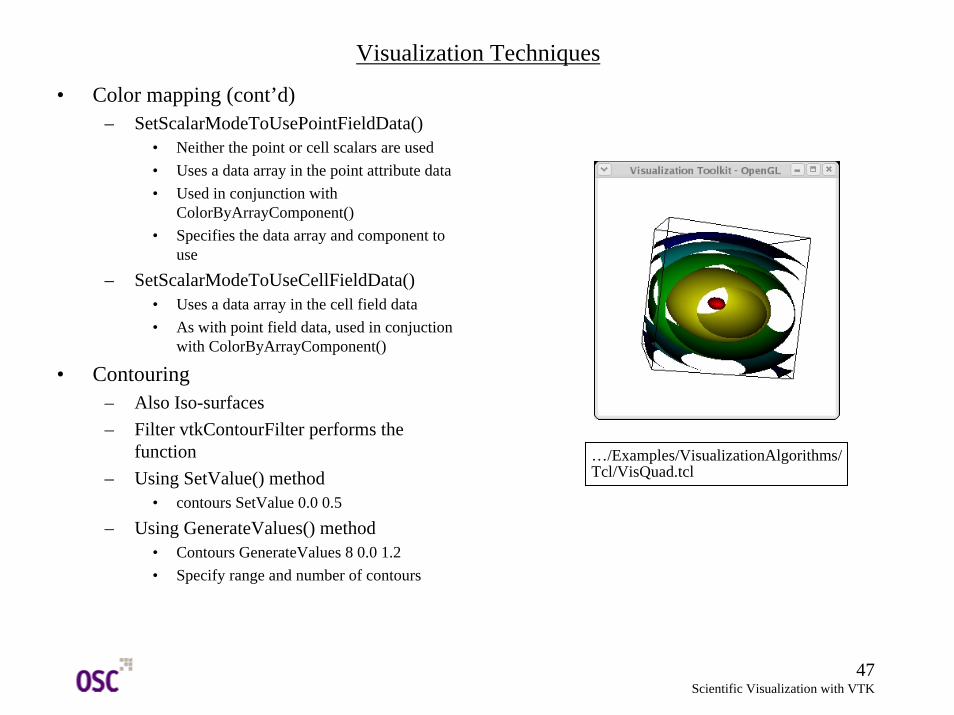
• Color mapping (cont’d)– SetScalarModeToUsePointFieldData()
• Neither the point or cell scalars are used• Uses a data array in the point attribute data• Used in conjunction with
ColorByArrayComponent() • Specifies the data array and component to
use
– SetScalarModeToUseCellFieldData()• Uses a data array in the cell field data• As with point field data, used in conjuction
with ColorByArrayComponent()
• Contouring– Also Iso-surfaces– Filter vtkContourFilter performs the
function– Using SetValue() method
• contours SetValue 0.0 0.5
– Using GenerateValues() method• Contours GenerateValues 8 0.0 1.2• Specify range and number of contours
…/Examples/VisualizationAlgorithms/Tcl/VisQuad.tcl
48Scientific Visualization with VTK
Visualization Techniques
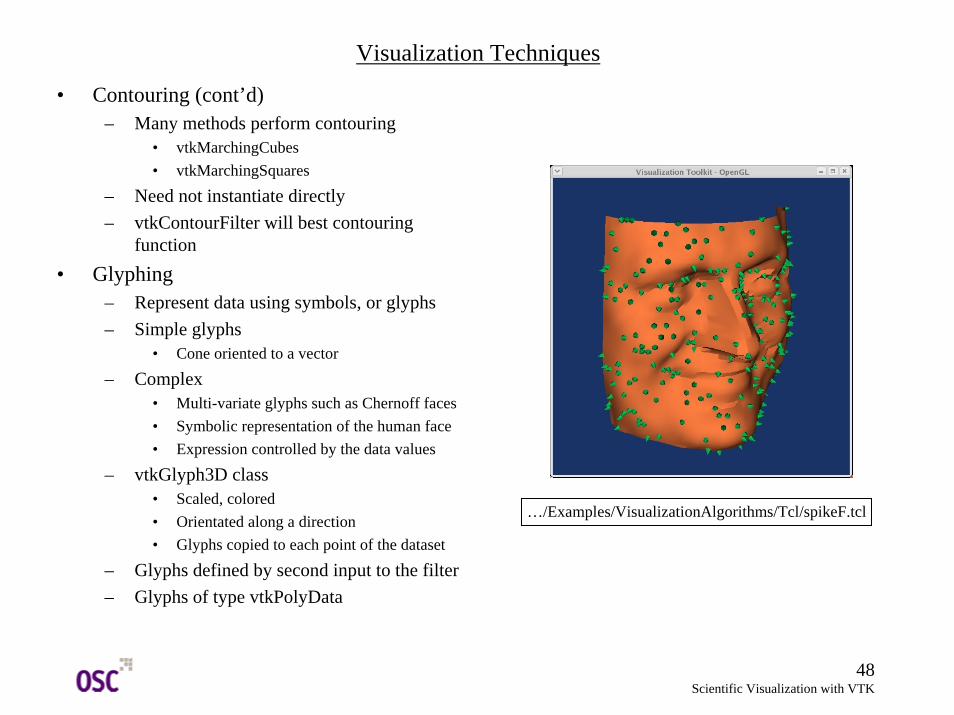
• Contouring (cont’d)– Many methods perform contouring
• vtkMarchingCubes• vtkMarchingSquares
– Need not instantiate directly– vtkContourFilter will best contouring
function• Glyphing
– Represent data using symbols, or glyphs– Simple glyphs
• Cone oriented to a vector
– Complex• Multi-variate glyphs such as Chernoff faces• Symbolic representation of the human face• Expression controlled by the data values
– vtkGlyph3D class• Scaled, colored• Orientated along a direction • Glyphs copied to each point of the dataset
– Glyphs defined by second input to the filter– Glyphs of type vtkPolyData
…/Examples/VisualizationAlgorithms/Tcl/spikeF.tcl
49Scientific Visualization with VTK
Visualization Techniques
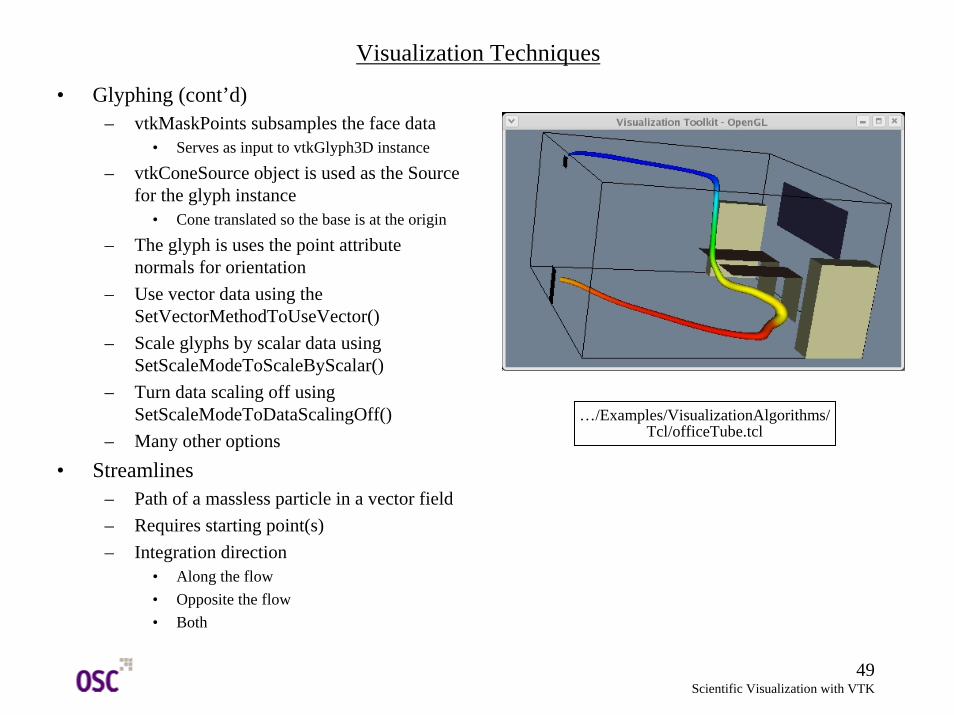
• Glyphing (cont’d)– vtkMaskPoints subsamples the face data
• Serves as input to vtkGlyph3D instance
– vtkConeSource object is used as the Source for the glyph instance
• Cone translated so the base is at the origin
– The glyph is uses the point attribute normals for orientation
– Use vector data using the SetVectorMethodToUseVector()
– Scale glyphs by scalar data using SetScaleModeToScaleByScalar()
– Turn data scaling off using SetScaleModeToDataScalingOff()
– Many other options• Streamlines
– Path of a massless particle in a vector field– Requires starting point(s)– Integration direction
• Along the flow• Opposite the flow• Both
…/Examples/VisualizationAlgorithms/Tcl/officeTube.tcl
50Scientific Visualization with VTK
Visualization Techniques
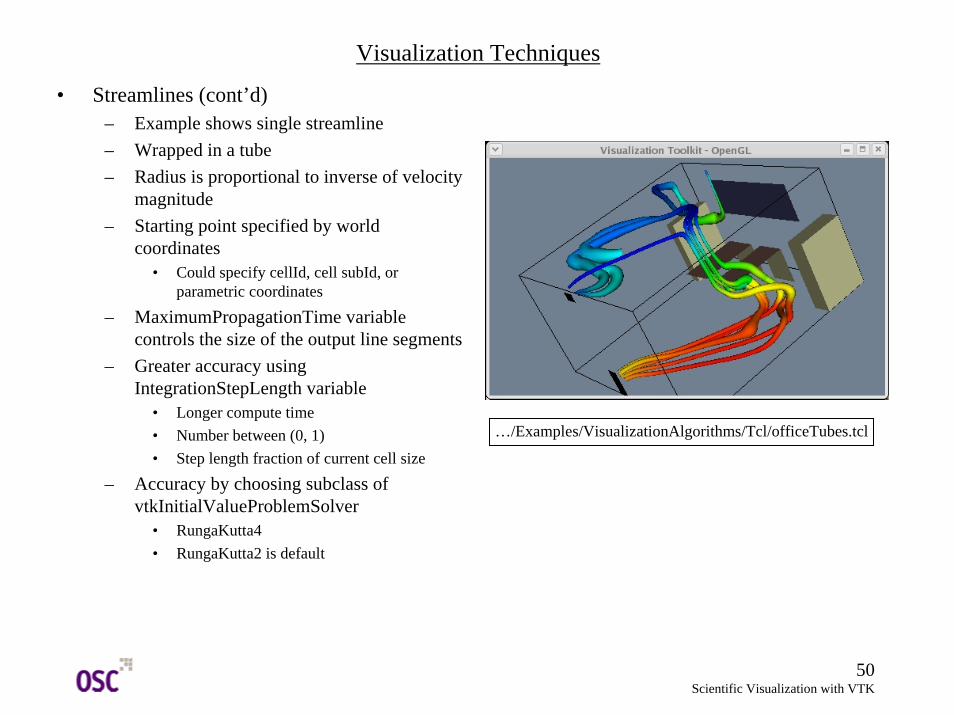
• Streamlines (cont’d)– Example shows single streamline– Wrapped in a tube– Radius is proportional to inverse of velocity
magnitude– Starting point specified by world
coordinates• Could specify cellId, cell subId, or
parametric coordinates
– MaximumPropagationTime variable controls the size of the output line segments
– Greater accuracy using IntegrationStepLength variable
• Longer compute time• Number between (0, 1)• Step length fraction of current cell size
– Accuracy by choosing subclass of vtkInitialValueProblemSolver
• RungaKutta4• RungaKutta2 is default
…/Examples/VisualizationAlgorithms/Tcl/officeTubes.tcl
51Scientific Visualization with VTK
Visualization Techniques
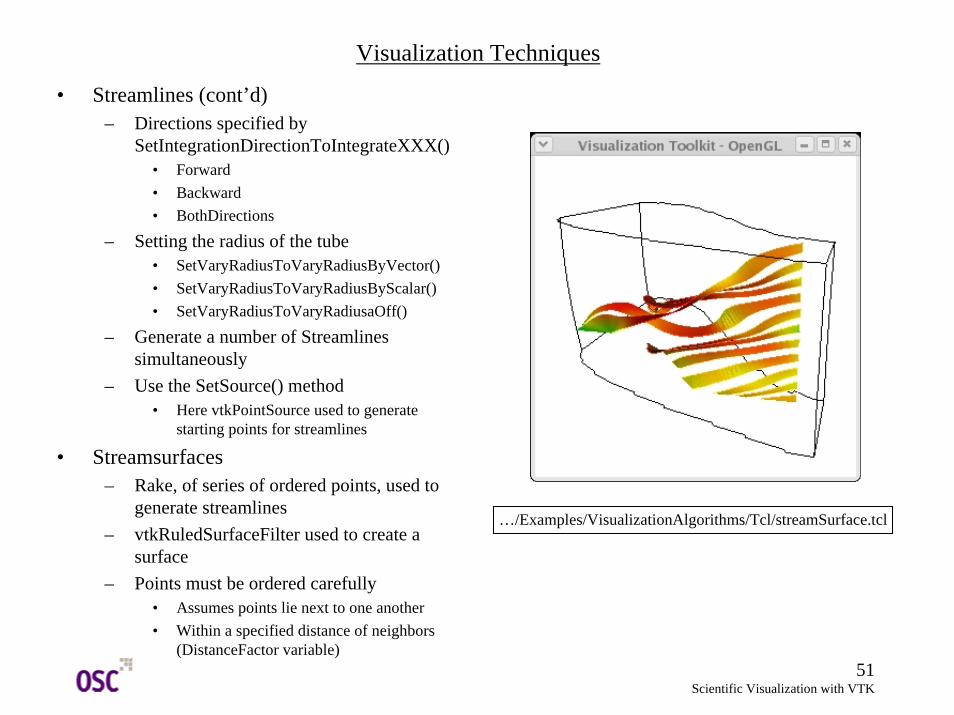
• Streamlines (cont’d)– Directions specified by
SetIntegrationDirectionToIntegrateXXX()• Forward • Backward • BothDirections
– Setting the radius of the tube• SetVaryRadiusToVaryRadiusByVector()• SetVaryRadiusToVaryRadiusByScalar()• SetVaryRadiusToVaryRadiusaOff()
– Generate a number of Streamlines simultaneously
– Use the SetSource() method• Here vtkPointSource used to generate
starting points for streamlines
• Streamsurfaces– Rake, of series of ordered points, used to
generate streamlines– vtkRuledSurfaceFilter used to create a
surface– Points must be ordered carefully
• Assumes points lie next to one another• Within a specified distance of neighbors
(DistanceFactor variable)
…/Examples/VisualizationAlgorithms/Tcl/streamSurface.tcl
52Scientific Visualization with VTK
Visualization Techniques
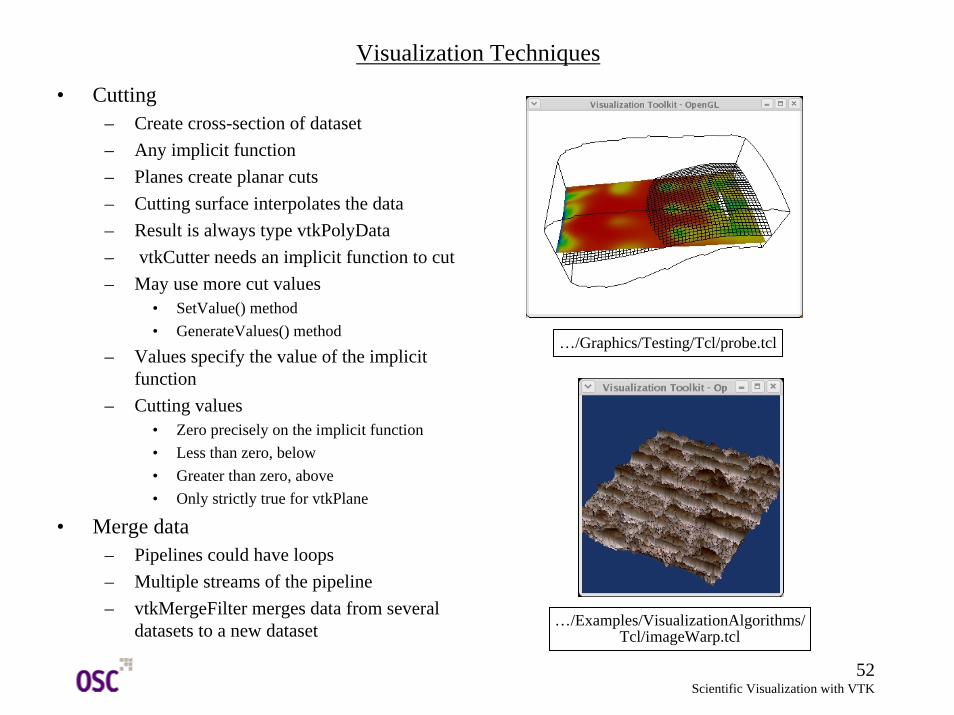
• Cutting– Create cross-section of dataset– Any implicit function– Planes create planar cuts– Cutting surface interpolates the data– Result is always type vtkPolyData– vtkCutter needs an implicit function to cut– May use more cut values
• SetValue() method• GenerateValues() method
– Values specify the value of the implicit function
– Cutting values• Zero precisely on the implicit function• Less than zero, below• Greater than zero, above• Only strictly true for vtkPlane
• Merge data– Pipelines could have loops– Multiple streams of the pipeline– vtkMergeFilter merges data from several
datasets to a new dataset …/Examples/VisualizationAlgorithms/Tcl/imageWarp.tcl
…/Graphics/Testing/Tcl/probe.tcl
53Scientific Visualization with VTK
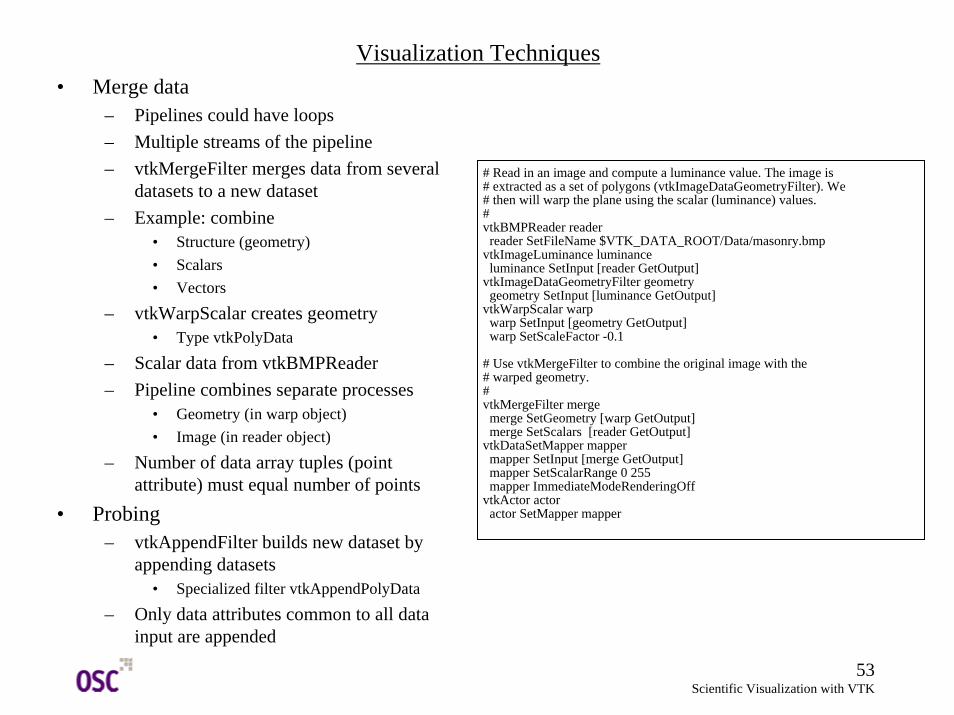
Visualization Techniques• Merge data
– Pipelines could have loops– Multiple streams of the pipeline– vtkMergeFilter merges data from several
datasets to a new dataset– Example: combine
• Structure (geometry)• Scalars• Vectors
– vtkWarpScalar creates geometry• Type vtkPolyData
– Scalar data from vtkBMPReader– Pipeline combines separate processes
• Geometry (in warp object)• Image (in reader object)
– Number of data array tuples (point attribute) must equal number of points
• Probing– vtkAppendFilter builds new dataset by
appending datasets• Specialized filter vtkAppendPolyData
– Only data attributes common to all data input are appended
# Read in an image and compute a luminance value. The image is # extracted as a set of polygons (vtkImageDataGeometryFilter). We # then will warp the plane using the scalar (luminance) values.#vtkBMPReader reader
reader SetFileName $VTK_DATA_ROOT/Data/masonry.bmpvtkImageLuminance luminance
luminance SetInput [reader GetOutput]vtkImageDataGeometryFilter geometry
geometry SetInput [luminance GetOutput]vtkWarpScalar warp
warp SetInput [geometry GetOutput]warp SetScaleFactor -0.1
# Use vtkMergeFilter to combine the original image with the # warped geometry.#vtkMergeFilter merge
merge SetGeometry [warp GetOutput]merge SetScalars [reader GetOutput]
vtkDataSetMapper mappermapper SetInput [merge GetOutput]mapper SetScalarRange 0 255mapper ImmediateModeRenderingOff
vtkActor actoractor SetMapper mapper
54Scientific Visualization with VTK
Visualization Techniques
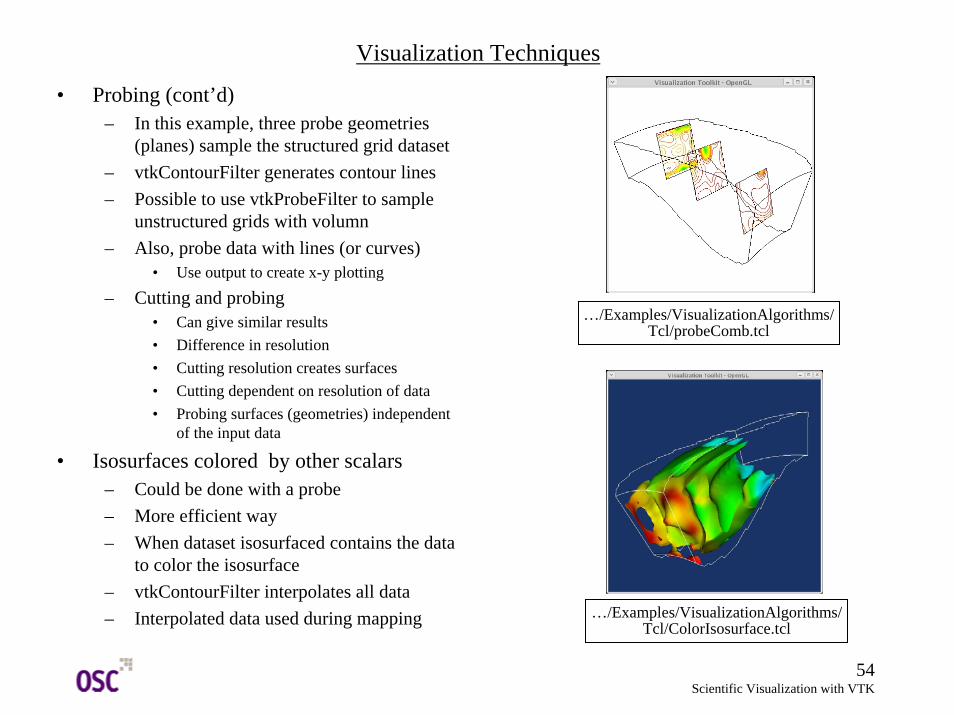
• Probing (cont’d)– In this example, three probe geometries
(planes) sample the structured grid dataset– vtkContourFilter generates contour lines– Possible to use vtkProbeFilter to sample
unstructured grids with volumn– Also, probe data with lines (or curves)
• Use output to create x-y plotting
– Cutting and probing• Can give similar results• Difference in resolution• Cutting resolution creates surfaces• Cutting dependent on resolution of data• Probing surfaces (geometries) independent
of the input data
• Isosurfaces colored by other scalars– Could be done with a probe– More efficient way– When dataset isosurfaced contains the data
to color the isosurface– vtkContourFilter interpolates all data – Interpolated data used during mapping
…/Examples/VisualizationAlgorithms/Tcl/probeComb.tcl
…/Examples/VisualizationAlgorithms/Tcl/ColorIsosurface.tcl
55Scientific Visualization with VTK
Case Studies - Modeling
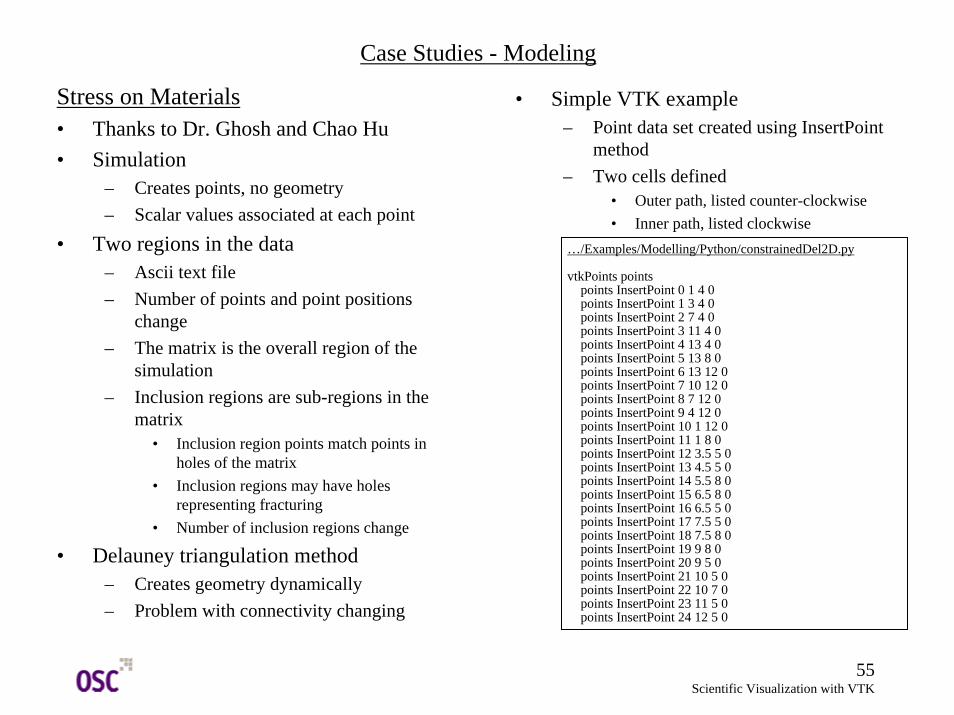
Stress on Materials• Thanks to Dr. Ghosh and Chao Hu• Simulation
– Creates points, no geometry– Scalar values associated at each point
• Two regions in the data– Ascii text file– Number of points and point positions
change– The matrix is the overall region of the
simulation – Inclusion regions are sub-regions in the
matrix• Inclusion region points match points in
holes of the matrix• Inclusion regions may have holes
representing fracturing• Number of inclusion regions change
• Delauney triangulation method– Creates geometry dynamically– Problem with connectivity changing
…/Examples/Modelling/Python/constrainedDel2D.py
vtkPoints pointspoints InsertPoint 0 1 4 0points InsertPoint 1 3 4 0points InsertPoint 2 7 4 0points InsertPoint 3 11 4 0points InsertPoint 4 13 4 0points InsertPoint 5 13 8 0points InsertPoint 6 13 12 0points InsertPoint 7 10 12 0points InsertPoint 8 7 12 0points InsertPoint 9 4 12 0points InsertPoint 10 1 12 0points InsertPoint 11 1 8 0points InsertPoint 12 3.5 5 0points InsertPoint 13 4.5 5 0points InsertPoint 14 5.5 8 0points InsertPoint 15 6.5 8 0points InsertPoint 16 6.5 5 0points InsertPoint 17 7.5 5 0points InsertPoint 18 7.5 8 0points InsertPoint 19 9 8 0points InsertPoint 20 9 5 0points InsertPoint 21 10 5 0points InsertPoint 22 10 7 0points InsertPoint 23 11 5 0points InsertPoint 24 12 5 0
• Simple VTK example– Point data set created using InsertPoint
method– Two cells defined
• Outer path, listed counter-clockwise• Inner path, listed clockwise
56Scientific Visualization with VTK
Case Studies - Modeling
points InsertPoint 25 10.5 8 0points InsertPoint 26 12 11 0points InsertPoint 27 11 11 0points InsertPoint 28 10 9 0points InsertPoint 29 10 11 0points InsertPoint 30 9 11 0points InsertPoint 31 9 9 0points InsertPoint 32 7.5 9 0points InsertPoint 33 7.5 11 0points InsertPoint 34 6.5 11 0points InsertPoint 35 6.5 9 0points InsertPoint 36 5 9 0points InsertPoint 37 4 6 0points InsertPoint 38 3 9 0points InsertPoint 39 2 9 0
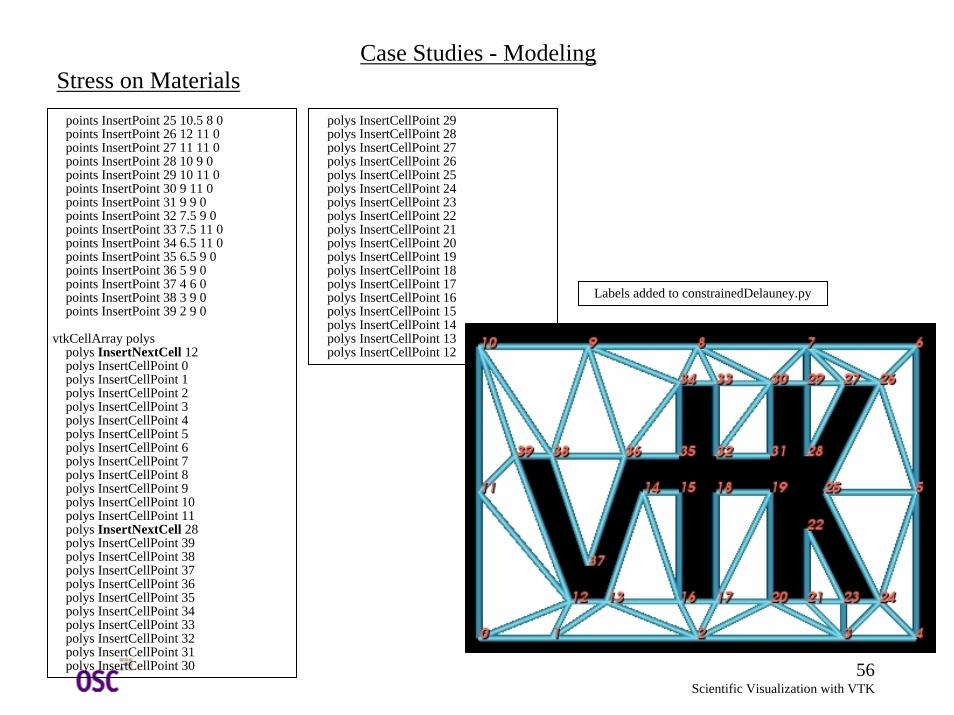
vtkCellArray polyspolys InsertNextCell 12polys InsertCellPoint 0polys InsertCellPoint 1polys InsertCellPoint 2polys InsertCellPoint 3polys InsertCellPoint 4polys InsertCellPoint 5polys InsertCellPoint 6polys InsertCellPoint 7polys InsertCellPoint 8polys InsertCellPoint 9polys InsertCellPoint 10polys InsertCellPoint 11polys InsertNextCell 28polys InsertCellPoint 39polys InsertCellPoint 38polys InsertCellPoint 37polys InsertCellPoint 36polys InsertCellPoint 35polys InsertCellPoint 34polys InsertCellPoint 33 polys InsertCellPoint 32polys InsertCellPoint 31polys InsertCellPoint 30
polys InsertCellPoint 29polys InsertCellPoint 28polys InsertCellPoint 27polys InsertCellPoint 26polys InsertCellPoint 25polys InsertCellPoint 24polys InsertCellPoint 23polys InsertCellPoint 22polys InsertCellPoint 21polys InsertCellPoint 20polys InsertCellPoint 19polys InsertCellPoint 18polys InsertCellPoint 17polys InsertCellPoint 16polys InsertCellPoint 15polys InsertCellPoint 14polys InsertCellPoint 13polys InsertCellPoint 12
Stress on Materials
Labels added to constrainedDelauney.py
57Scientific Visualization with VTK
Case Studies - Modeling
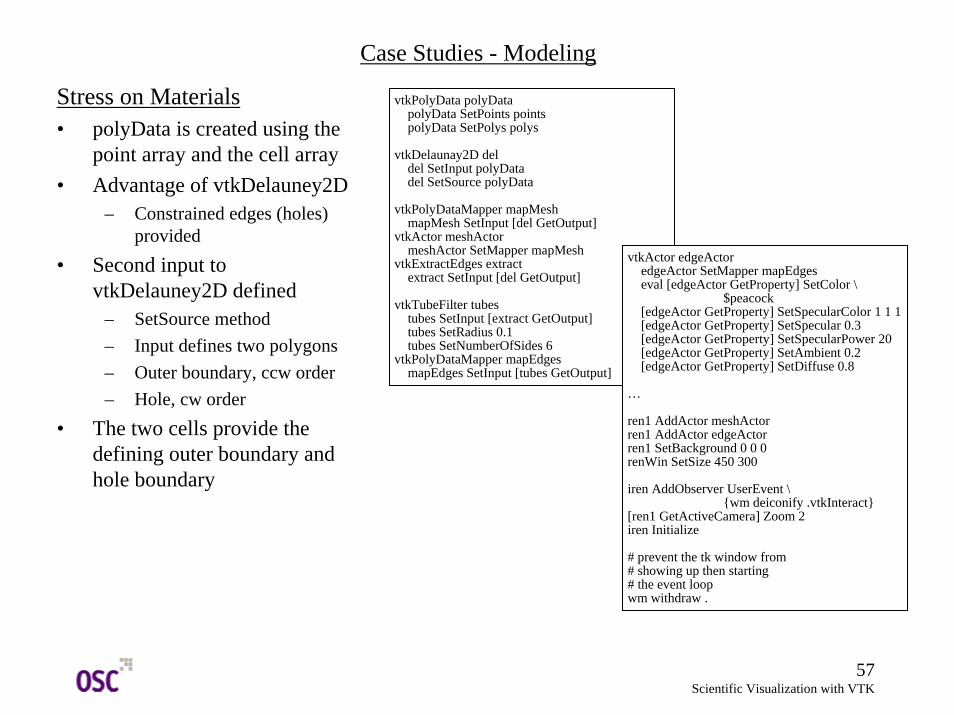
Stress on Materials• polyData is created using the
point array and the cell array• Advantage of vtkDelauney2D
– Constrained edges (holes) provided
• Second input to vtkDelauney2D defined
– SetSource method– Input defines two polygons– Outer boundary, ccw order– Hole, cw order
• The two cells provide the defining outer boundary and hole boundary
vtkPolyData polyDatapolyData SetPoints pointspolyData SetPolys polys
vtkDelaunay2D deldel SetInput polyDatadel SetSource polyData
vtkPolyDataMapper mapMeshmapMesh SetInput [del GetOutput]
vtkActor meshActormeshActor SetMapper mapMesh
vtkExtractEdges extractextract SetInput [del GetOutput]
vtkTubeFilter tubestubes SetInput [extract GetOutput]tubes SetRadius 0.1tubes SetNumberOfSides 6
vtkPolyDataMapper mapEdgesmapEdges SetInput [tubes GetOutput]
vtkActor edgeActoredgeActor SetMapper mapEdgeseval [edgeActor GetProperty] SetColor \
$peacock[edgeActor GetProperty] SetSpecularColor 1 1 1[edgeActor GetProperty] SetSpecular 0.3[edgeActor GetProperty] SetSpecularPower 20[edgeActor GetProperty] SetAmbient 0.2[edgeActor GetProperty] SetDiffuse 0.8
…
ren1 AddActor meshActorren1 AddActor edgeActorren1 SetBackground 0 0 0renWin SetSize 450 300
iren AddObserver UserEvent \{wm deiconify .vtkInteract}
[ren1 GetActiveCamera] Zoom 2iren Initialize
# prevent the tk window from # showing up then starting# the event loopwm withdraw .
58Scientific Visualization with VTK
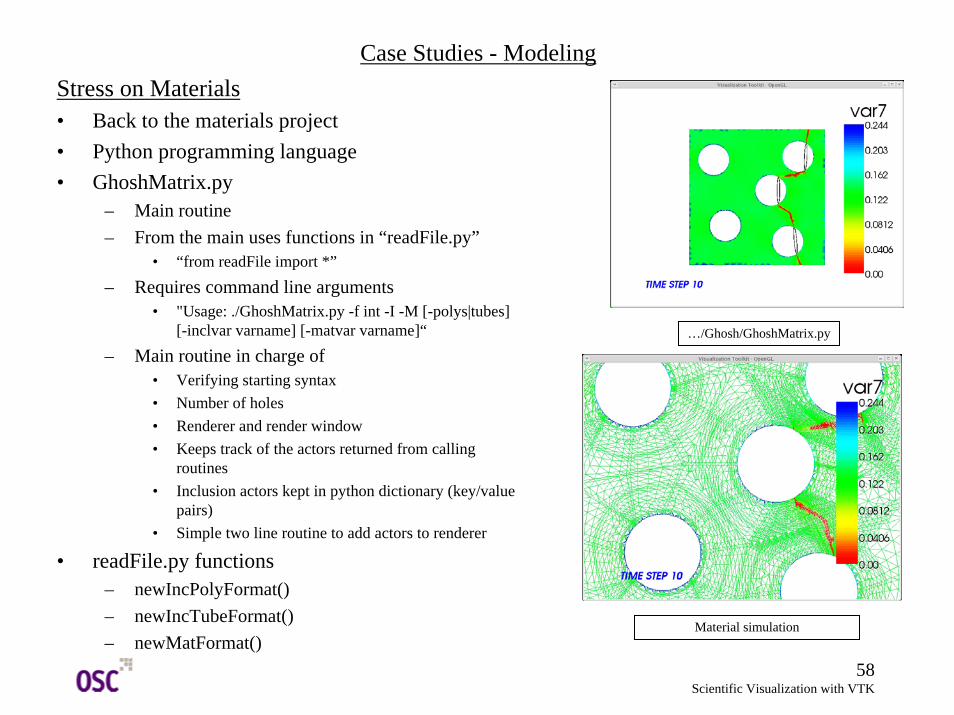
Stress on Materials• Back to the materials project• Python programming language• GhoshMatrix.py
– Main routine– From the main uses functions in “readFile.py”
• “from readFile import *”
– Requires command line arguments• "Usage: ./GhoshMatrix.py -f int -I -M [-polys|tubes]
[-inclvar varname] [-matvar varname]“
– Main routine in charge of• Verifying starting syntax• Number of holes • Renderer and render window• Keeps track of the actors returned from calling
routines• Inclusion actors kept in python dictionary (key/value
pairs)• Simple two line routine to add actors to renderer
• readFile.py functions– newIncPolyFormat()– newIncTubeFormat()– newMatFormat()
Case Studies - Modeling
…/Ghosh/GhoshMatrix.py
Material simulation
59Scientific Visualization with VTK
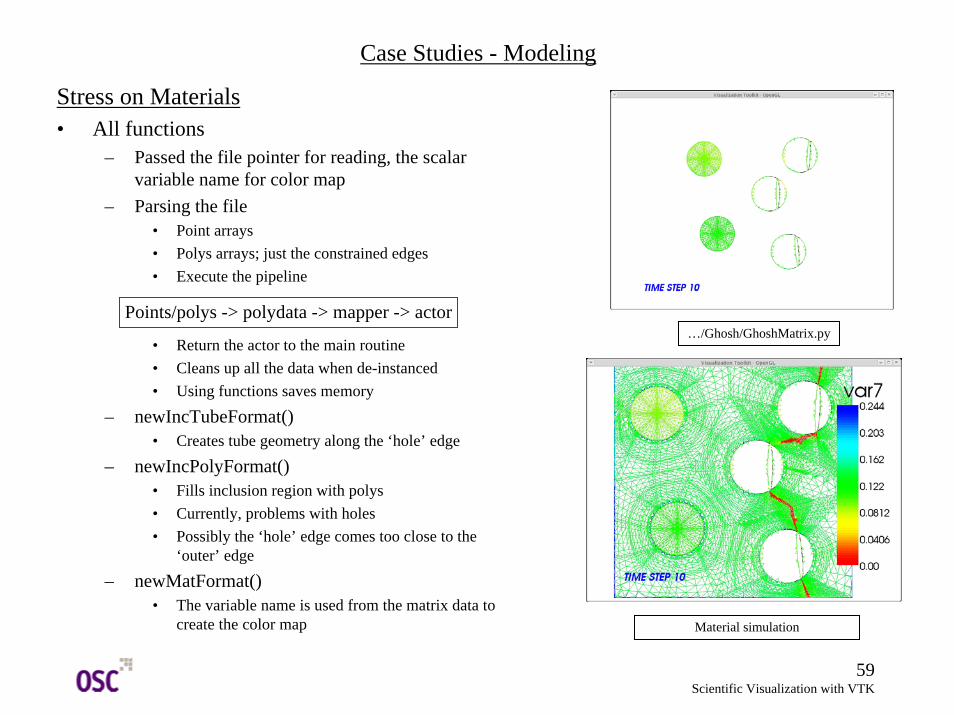
Stress on Materials• All functions
– Passed the file pointer for reading, the scalar variable name for color map
– Parsing the file• Point arrays• Polys arrays; just the constrained edges• Execute the pipeline
• Return the actor to the main routine• Cleans up all the data when de-instanced• Using functions saves memory
– newIncTubeFormat()• Creates tube geometry along the ‘hole’ edge
– newIncPolyFormat()• Fills inclusion region with polys• Currently, problems with holes • Possibly the ‘hole’ edge comes too close to the
‘outer’ edge
– newMatFormat()• The variable name is used from the matrix data to
create the color map
Case Studies - Modeling
…/Ghosh/GhoshMatrix.py
Material simulation
Points/polys -> polydata -> mapper -> actor
60Scientific Visualization with VTK
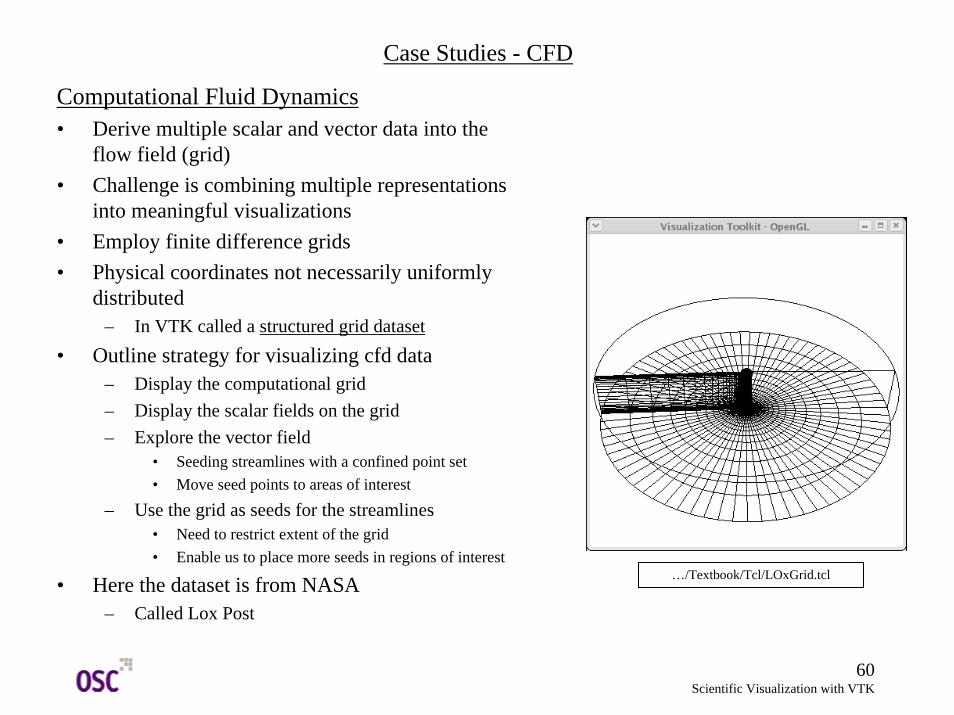
Computational Fluid Dynamics• Derive multiple scalar and vector data into the
flow field (grid)• Challenge is combining multiple representations
into meaningful visualizations• Employ finite difference grids• Physical coordinates not necessarily uniformly
distributed– In VTK called a structured grid dataset
• Outline strategy for visualizing cfd data– Display the computational grid– Display the scalar fields on the grid– Explore the vector field
• Seeding streamlines with a confined point set• Move seed points to areas of interest
– Use the grid as seeds for the streamlines• Need to restrict extent of the grid• Enable us to place more seeds in regions of interest
• Here the dataset is from NASA– Called Lox Post
Case Studies - CFD
…/Textbook/Tcl/LOxGrid.tcl
61Scientific Visualization with VTK
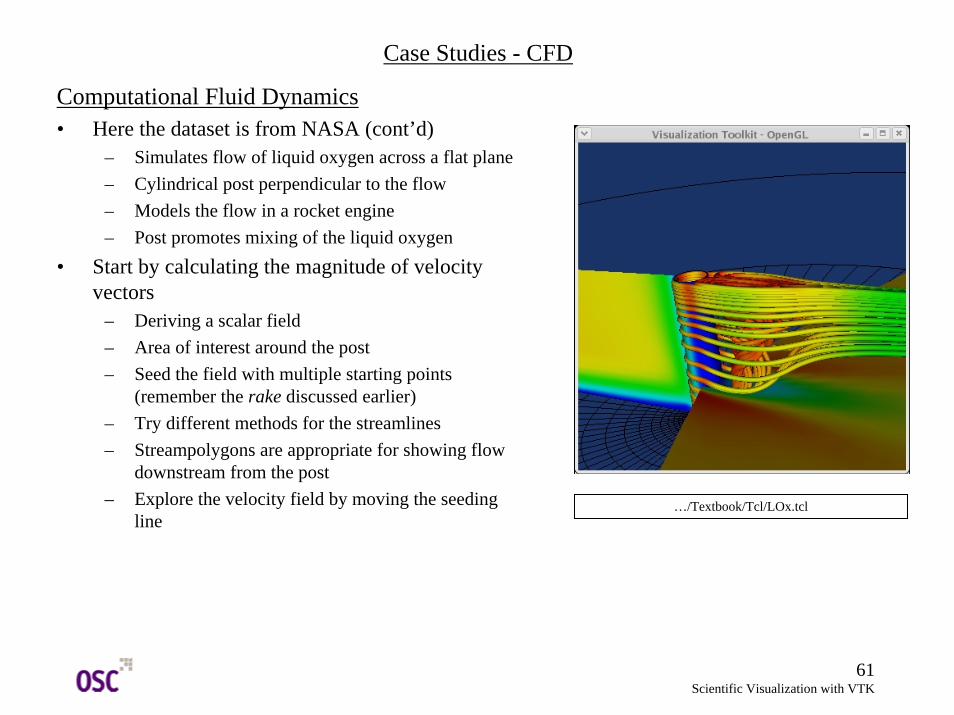
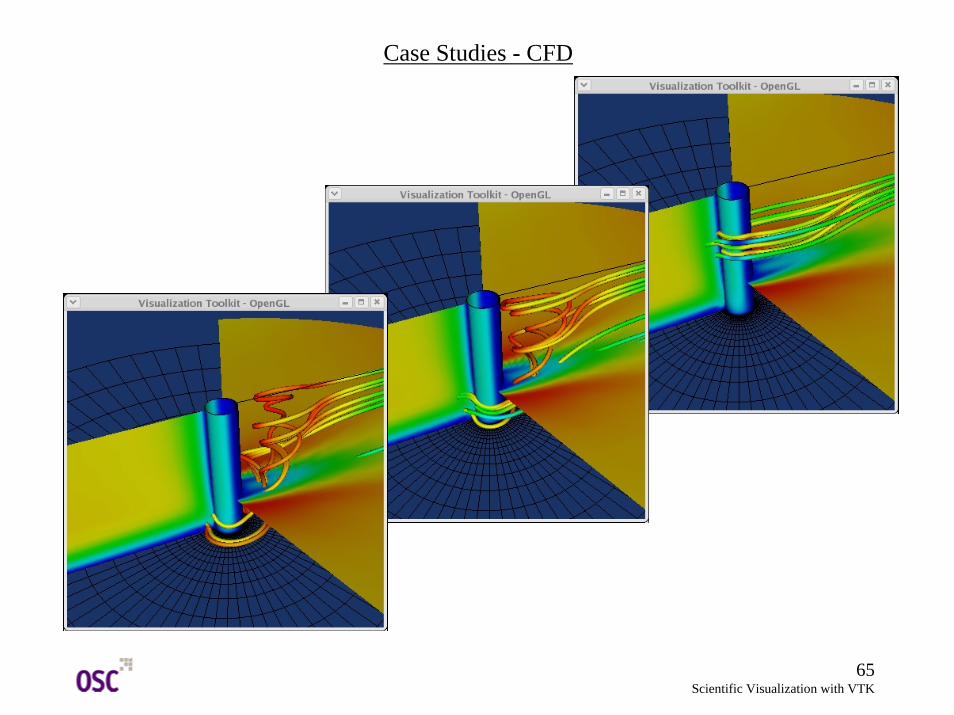
Computational Fluid Dynamics• Here the dataset is from NASA (cont’d)
– Simulates flow of liquid oxygen across a flat plane– Cylindrical post perpendicular to the flow– Models the flow in a rocket engine– Post promotes mixing of the liquid oxygen
• Start by calculating the magnitude of velocity vectors
– Deriving a scalar field– Area of interest around the post– Seed the field with multiple starting points
(remember the rake discussed earlier)– Try different methods for the streamlines– Streampolygons are appropriate for showing flow
downstream from the post– Explore the velocity field by moving the seeding
line
Case Studies - CFD
…/Textbook/Tcl/LOx.tcl
62Scientific Visualization with VTK
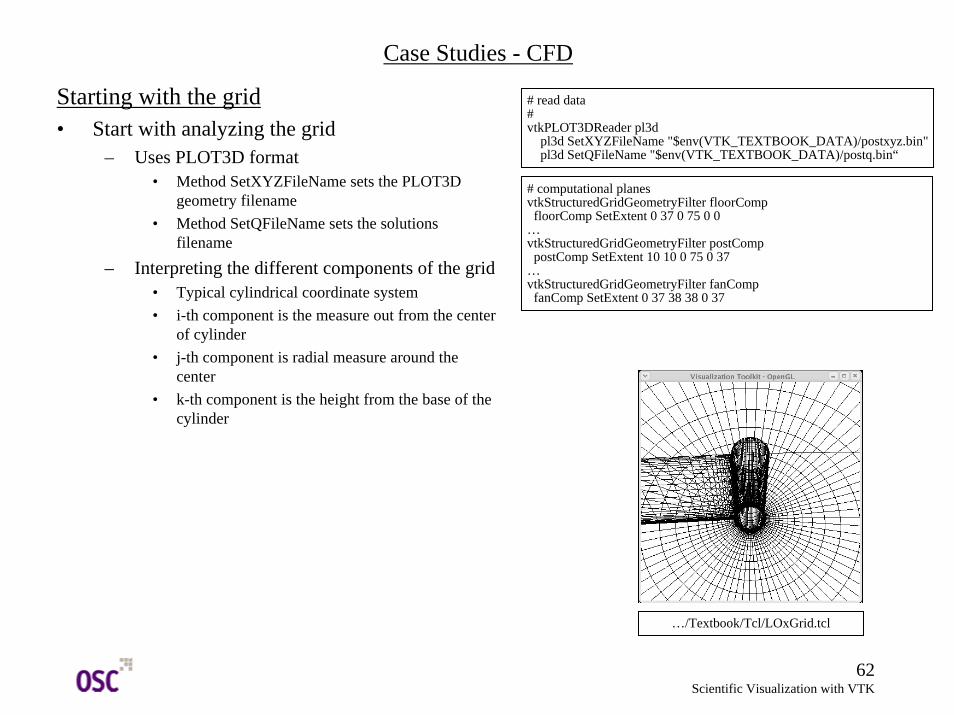
Starting with the grid• Start with analyzing the grid
– Uses PLOT3D format• Method SetXYZFileName sets the PLOT3D
geometry filename• Method SetQFileName sets the solutions
filename
– Interpreting the different components of the grid• Typical cylindrical coordinate system• i-th component is the measure out from the center
of cylinder• j-th component is radial measure around the
center• k-th component is the height from the base of the
cylinder
Case Studies - CFD
…/Textbook/Tcl/LOxGrid.tcl
# read data#vtkPLOT3DReader pl3d
pl3d SetXYZFileName "$env(VTK_TEXTBOOK_DATA)/postxyz.bin"pl3d SetQFileName "$env(VTK_TEXTBOOK_DATA)/postq.bin“
# computational planesvtkStructuredGridGeometryFilter floorComp
floorComp SetExtent 0 37 0 75 0 0…vtkStructuredGridGeometryFilter postComp
postComp SetExtent 10 10 0 75 0 37…vtkStructuredGridGeometryFilter fanComp
fanComp SetExtent 0 37 38 38 0 37
63Scientific Visualization with VTK
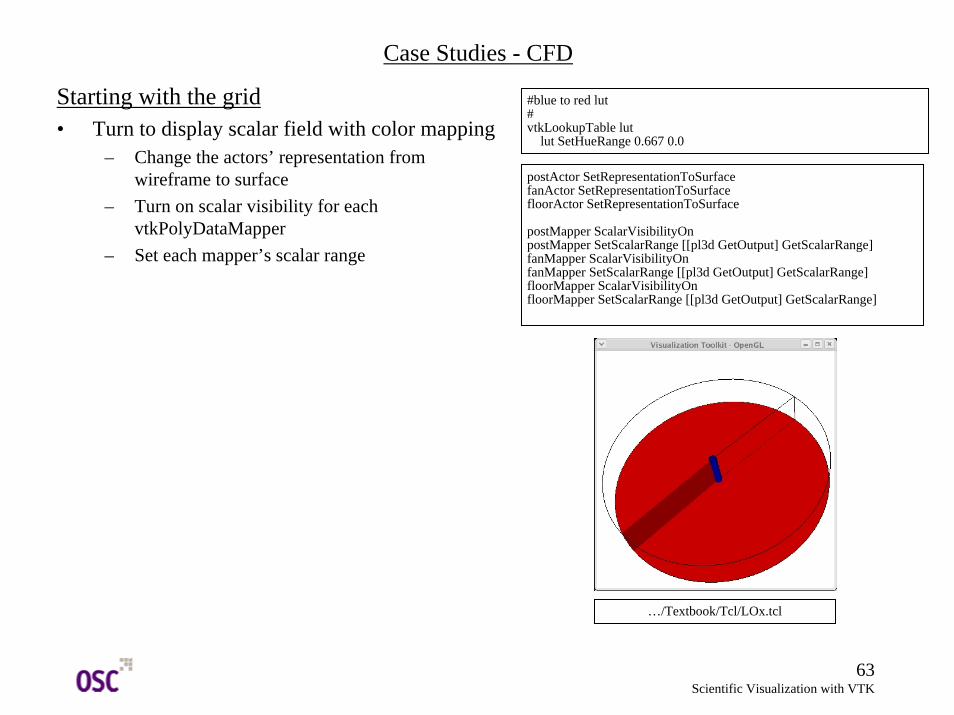
Starting with the grid• Turn to display scalar field with color mapping
– Change the actors’ representation from wireframe to surface
– Turn on scalar visibility for each vtkPolyDataMapper
– Set each mapper’s scalar range
Case Studies - CFD
…/Textbook/Tcl/LOx.tcl
#blue to red lut#vtkLookupTable lut
lut SetHueRange 0.667 0.0
postActor SetRepresentationToSurfacefanActor SetRepresentationToSurfacefloorActor SetRepresentationToSurface
postMapper ScalarVisibilityOnpostMapper SetScalarRange [[pl3d GetOutput] GetScalarRange] fanMapper ScalarVisibilityOnfanMapper SetScalarRange [[pl3d GetOutput] GetScalarRange]floorMapper ScalarVisibilityOnfloorMapper SetScalarRange [[pl3d GetOutput] GetScalarRange]
64Scientific Visualization with VTK
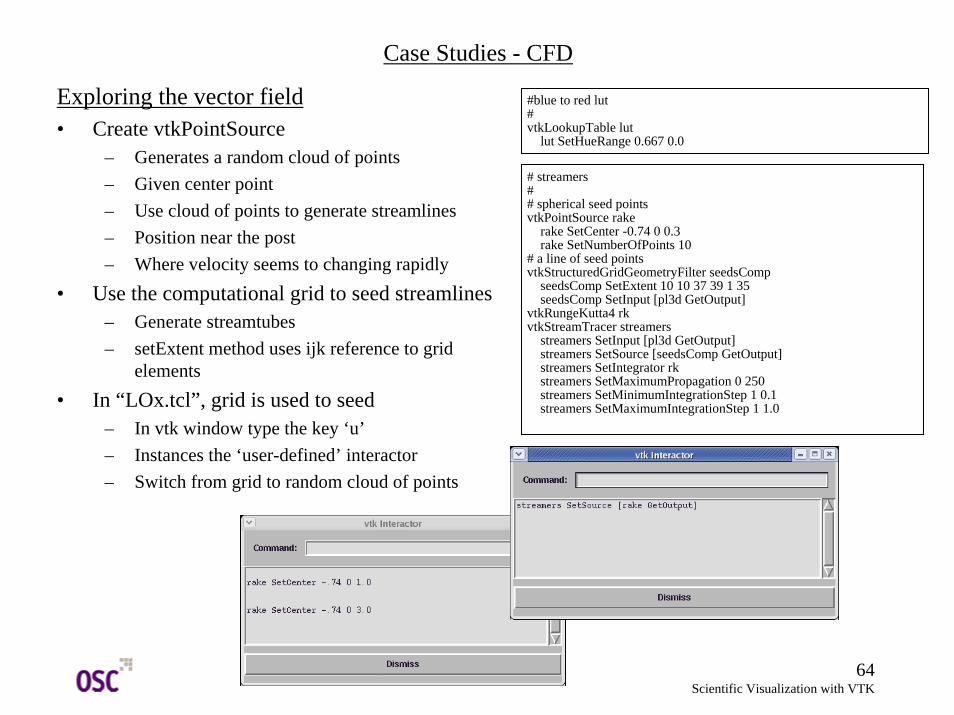
Exploring the vector field• Create vtkPointSource
– Generates a random cloud of points– Given center point– Use cloud of points to generate streamlines– Position near the post – Where velocity seems to changing rapidly
• Use the computational grid to seed streamlines– Generate streamtubes– setExtent method uses ijk reference to grid
elements• In “LOx.tcl”, grid is used to seed
– In vtk window type the key ‘u’– Instances the ‘user-defined’ interactor– Switch from grid to random cloud of points
Case Studies - CFD
#blue to red lut#vtkLookupTable lut
lut SetHueRange 0.667 0.0
# streamers## spherical seed pointsvtkPointSource rake
rake SetCenter -0.74 0 0.3rake SetNumberOfPoints 10
# a line of seed pointsvtkStructuredGridGeometryFilter seedsComp
seedsComp SetExtent 10 10 37 39 1 35seedsComp SetInput [pl3d GetOutput]
vtkRungeKutta4 rkvtkStreamTracer streamers
streamers SetInput [pl3d GetOutput]streamers SetSource [seedsComp GetOutput]streamers SetIntegrator rkstreamers SetMaximumPropagation 0 250streamers SetMinimumIntegrationStep 1 0.1streamers SetMaximumIntegrationStep 1 1.0
65Scientific Visualization with VTK
Case Studies - CFD
66Scientific Visualization with VTK
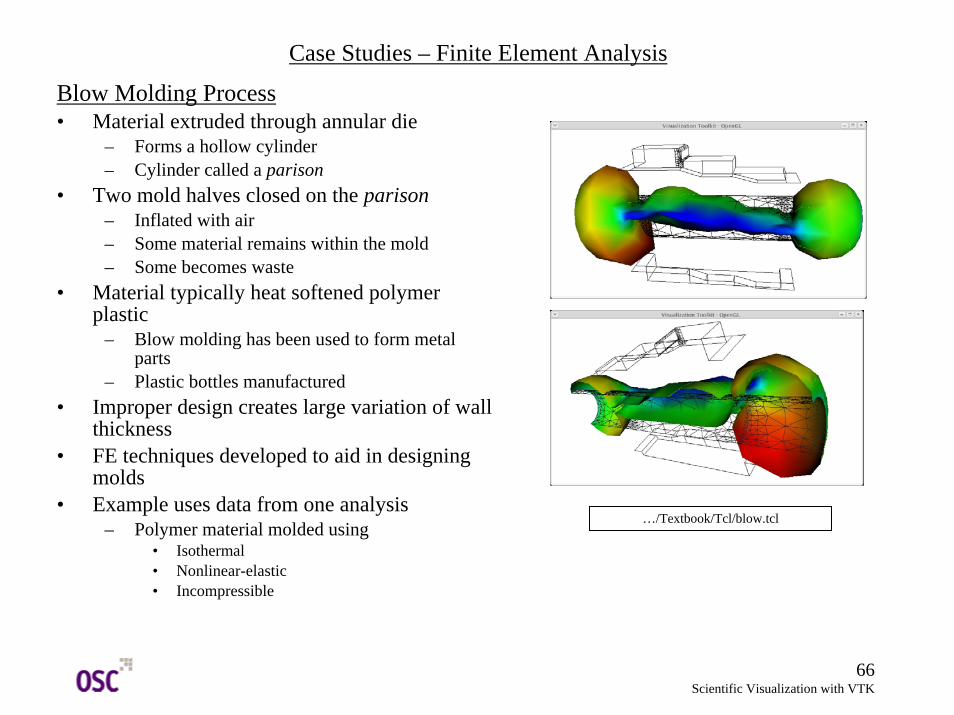
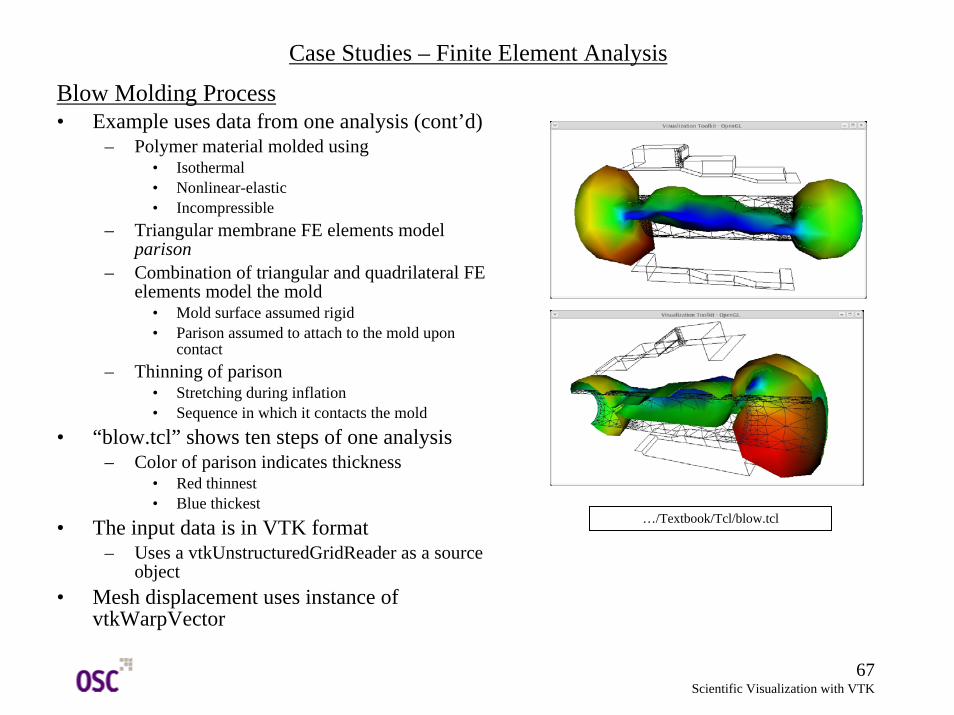
Blow Molding Process• Material extruded through annular die
– Forms a hollow cylinder– Cylinder called a parison
• Two mold halves closed on the parison– Inflated with air– Some material remains within the mold – Some becomes waste
• Material typically heat softened polymer plastic
– Blow molding has been used to form metal parts
– Plastic bottles manufactured• Improper design creates large variation of wall
thickness• FE techniques developed to aid in designing
molds• Example uses data from one analysis
– Polymer material molded using• Isothermal• Nonlinear-elastic• Incompressible
Case Studies – Finite Element Analysis
…/Textbook/Tcl/blow.tcl
67Scientific Visualization with VTK
Blow Molding Process• Example uses data from one analysis (cont’d)
– Polymer material molded using• Isothermal• Nonlinear-elastic• Incompressible
– Triangular membrane FE elements model parison
– Combination of triangular and quadrilateral FE elements model the mold
• Mold surface assumed rigid• Parison assumed to attach to the mold upon
contact– Thinning of parison
• Stretching during inflation • Sequence in which it contacts the mold
• “blow.tcl” shows ten steps of one analysis– Color of parison indicates thickness
• Red thinnest• Blue thickest
• The input data is in VTK format– Uses a vtkUnstructuredGridReader as a source
object• Mesh displacement uses instance of
vtkWarpVector
Case Studies – Finite Element Analysis
…/Textbook/Tcl/blow.tcl
68Scientific Visualization with VTK
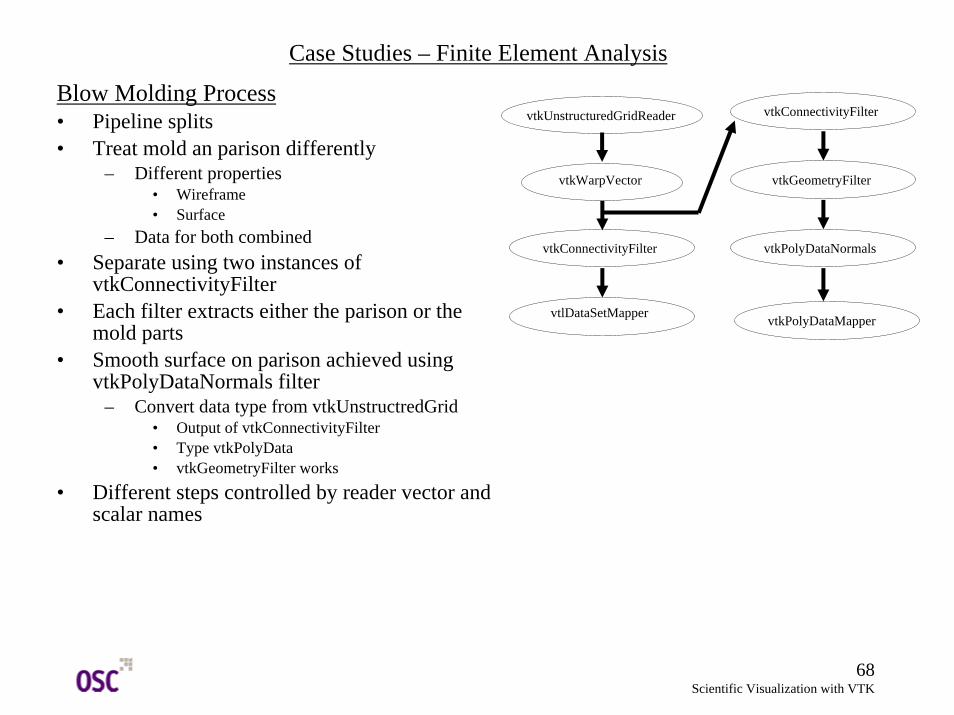
Blow Molding Process• Pipeline splits• Treat mold an parison differently
– Different properties • Wireframe• Surface
– Data for both combined• Separate using two instances of
vtkConnectivityFilter• Each filter extracts either the parison or the
mold parts• Smooth surface on parison achieved using
vtkPolyDataNormals filter– Convert data type from vtkUnstructredGrid
• Output of vtkConnectivityFilter• Type vtkPolyData• vtkGeometryFilter works
• Different steps controlled by reader vector and scalar names
Case Studies – Finite Element Analysis
vtkUnstructuredGridReader
vtkWarpVector
vtkConnectivityFilter
vtlDataSetMapper
vtkConnectivityFilter
vtkGeometryFilter
vtkPolyDataNormals
vtkPolyDataMapper
69Scientific Visualization with VTK
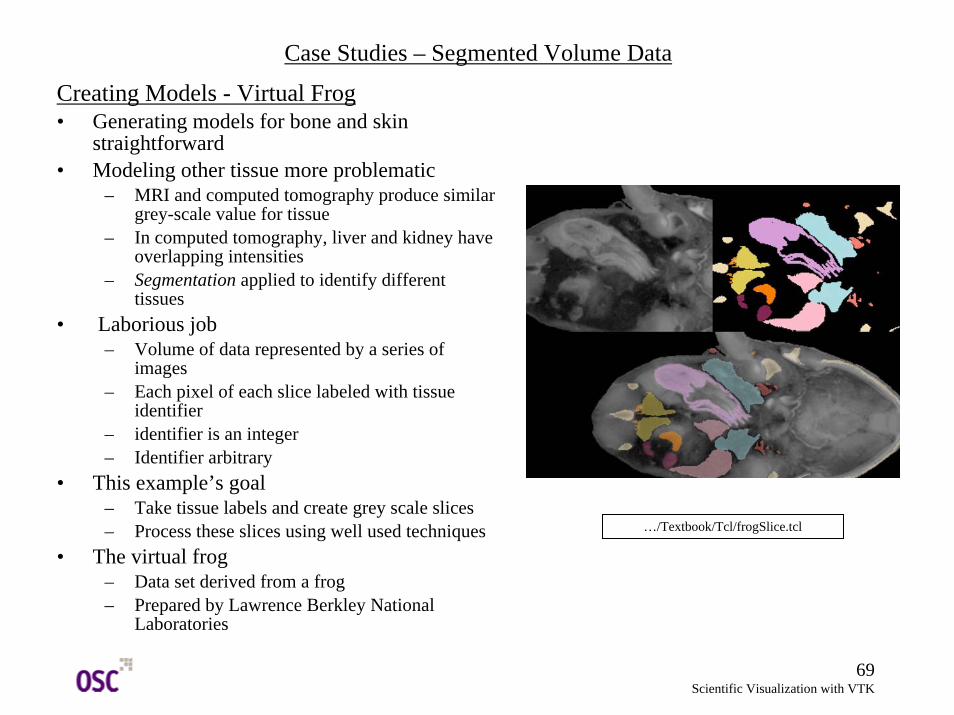
Creating Models - Virtual Frog • Generating models for bone and skin
straightforward• Modeling other tissue more problematic
– MRI and computed tomography produce similar grey-scale value for tissue
– In computed tomography, liver and kidney have overlapping intensities
– Segmentation applied to identify different tissues
• Laborious job– Volume of data represented by a series of
images– Each pixel of each slice labeled with tissue
identifier– identifier is an integer– Identifier arbitrary
• This example’s goal – Take tissue labels and create grey scale slices– Process these slices using well used techniques
• The virtual frog– Data set derived from a frog– Prepared by Lawrence Berkley National
Laboratories
Case Studies – Segmented Volume Data
…/Textbook/Tcl/frogSlice.tcl
70Scientific Visualization with VTK
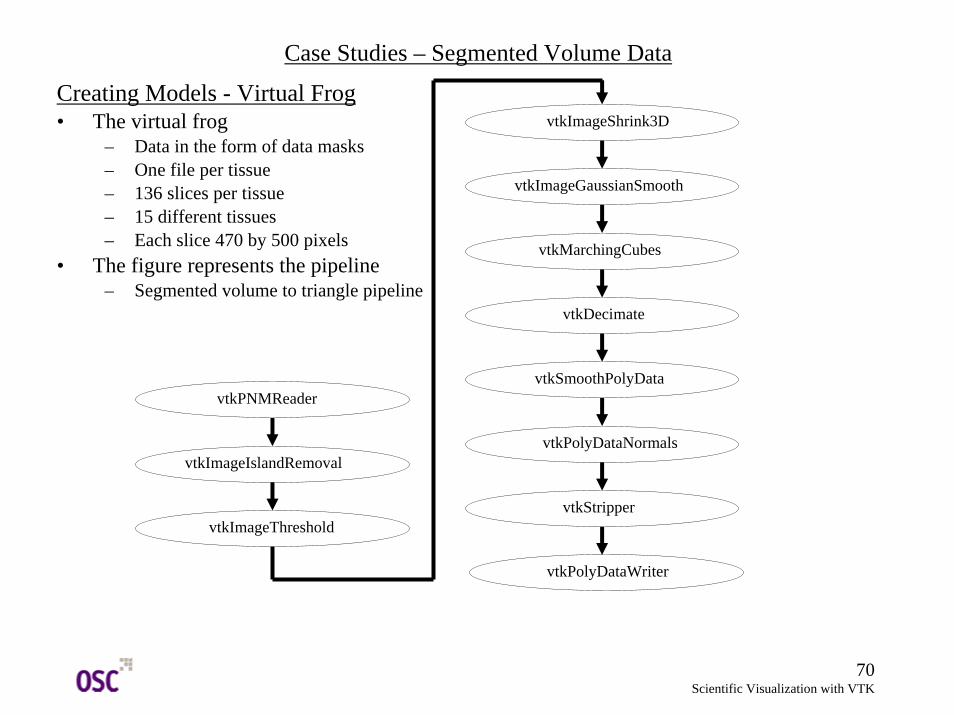
Creating Models - Virtual Frog • The virtual frog
– Data in the form of data masks– One file per tissue– 136 slices per tissue– 15 different tissues– Each slice 470 by 500 pixels
• The figure represents the pipeline – Segmented volume to triangle pipeline
Case Studies – Segmented Volume Data
vtkPNMReader
vtkImageIslandRemoval
vtkImageThreshold
vtkImageShrink3D
vtkImageGaussianSmooth
vtkMarchingCubes
vtkDecimate
vtkSmoothPolyData
vtkPolyDataNormals
vtkStripper
vtkPolyDataWriter
71Scientific Visualization with VTK
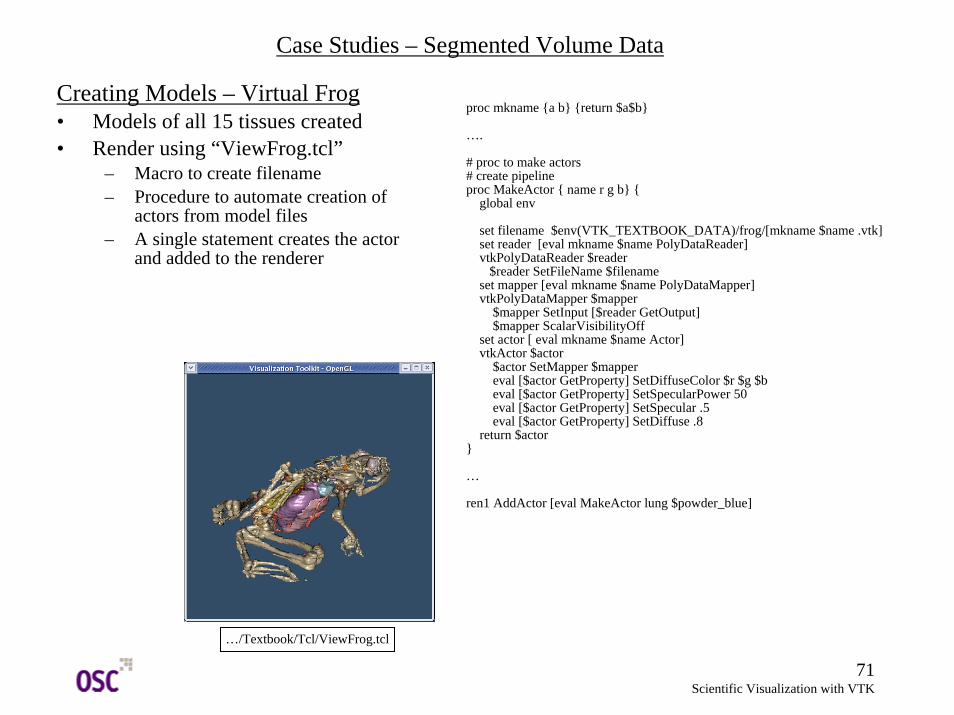
Creating Models – Virtual Frog • Models of all 15 tissues created• Render using “ViewFrog.tcl”
– Macro to create filename– Procedure to automate creation of
actors from model files– A single statement creates the actor
and added to the renderer
Case Studies – Segmented Volume Data
…/Textbook/Tcl/ViewFrog.tcl
proc mkname {a b} {return $a$b}
….
# proc to make actors# create pipelineproc MakeActor { name r g b} {
global env
set filename $env(VTK_TEXTBOOK_DATA)/frog/[mkname $name .vtk]set reader [eval mkname $name PolyDataReader]vtkPolyDataReader $reader
$reader SetFileName $filenameset mapper [eval mkname $name PolyDataMapper]vtkPolyDataMapper $mapper
$mapper SetInput [$reader GetOutput]$mapper ScalarVisibilityOff
set actor [ eval mkname $name Actor]vtkActor $actor
$actor SetMapper $mappereval [$actor GetProperty] SetDiffuseColor $r $g $beval [$actor GetProperty] SetSpecularPower 50eval [$actor GetProperty] SetSpecular .5eval [$actor GetProperty] SetDiffuse .8
return $actor}
…
ren1 AddActor [eval MakeActor lung $powder_blue]
72Scientific Visualization with VTK
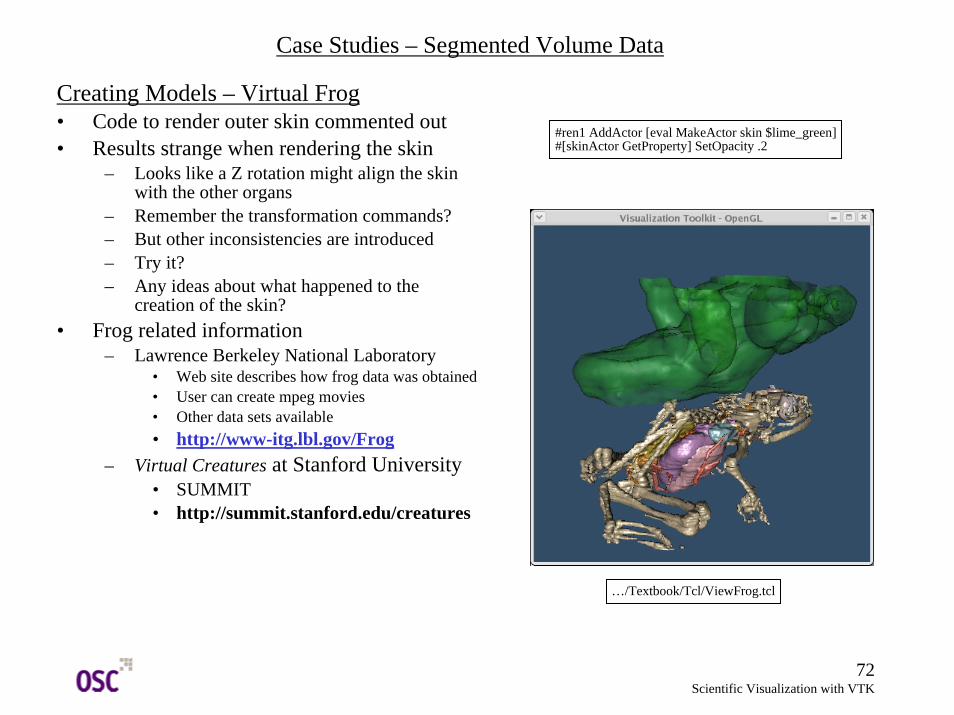
Creating Models – Virtual Frog • Code to render outer skin commented out• Results strange when rendering the skin
– Looks like a Z rotation might align the skin with the other organs
– Remember the transformation commands?– But other inconsistencies are introduced– Try it?– Any ideas about what happened to the
creation of the skin?• Frog related information
– Lawrence Berkeley National Laboratory• Web site describes how frog data was obtained• User can create mpeg movies• Other data sets available• http://www-itg.lbl.gov/Frog
– Virtual Creatures at Stanford University• SUMMIT• http://summit.stanford.edu/creatures
Case Studies – Segmented Volume Data
…/Textbook/Tcl/ViewFrog.tcl
#ren1 AddActor [eval MakeActor skin $lime_green]#[skinActor GetProperty] SetOpacity .2