Embed Size (px)
Citation preview

© 2014 PerkinElmer
HUMAN HEALTH • ENVIRONMENTAL HEALTH
Interactive Visualisation for Precision and Translational Medicine Dr. Christof Gaenzler

2
Introduction
• Precision and Translational medicine change healthcare
• Visual Interactive Analytics should drive decision-making
• Customers need more complete solutions
• Too much effort is invested in Data Collection and Curation
• A shift towards higher value activities is needed

3
Shift Effort Towards the Higher Value Activities

4
Shift Effort Towards the Higher Value Activities

5
Shift Effort Towards the Higher Value Activities
6
Visual Information Seeking
• Visual browsing & interacting with data • Graphical interactive display of data • drill-down, drill-across, filtering
• Important in Translational Science • Disparate datasources not designed to fit together

7
Translational Medicine Workflows
Raw Data
Select Processed Data
QA/QC Results
Review Secondary Analysis Select Clinical
Subject & Samples
Secondary Analysis
Data Processing
Select Secondary Results
Perform Integrated
Analysis
Bioinformatician/ Data Scientist Focuses on single
experiment and starts with instrument run
Translational Scientist Start with scientific hypothesis and use scientific Entities

8
Spotfire as „Query Tool“ for Selection steps

9
How does it all fit together?
Signals for Translational Combines technologies into a single solution for the translational scientist Public Data Source Connectors Leverage existing data sources with the power of the platform Signals Perspectives Adds data discovery for disparate data sets
10
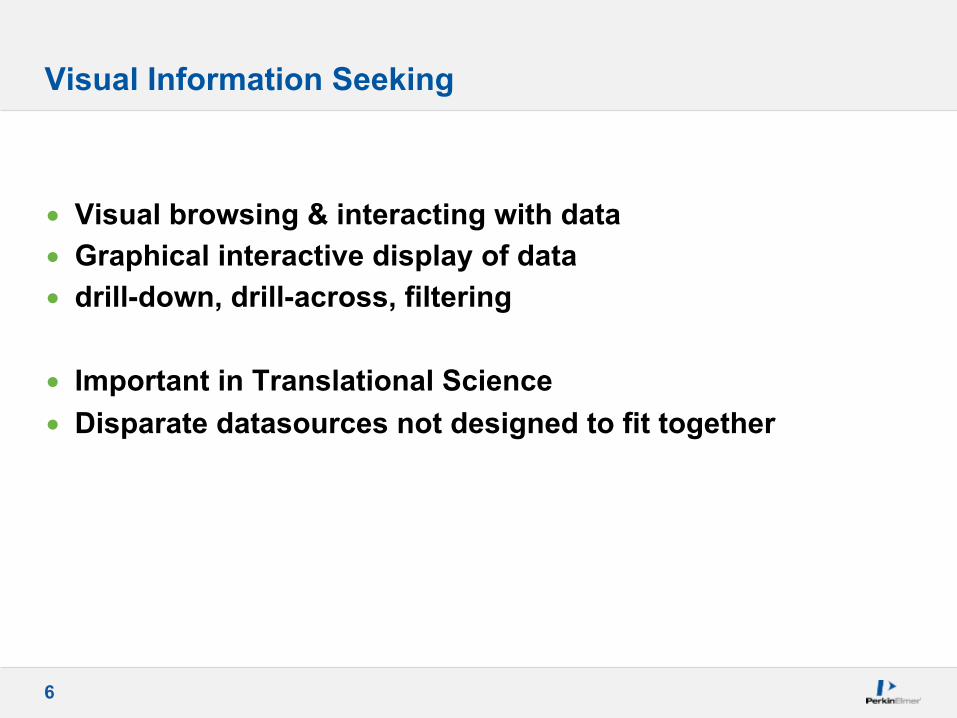
PerkinElmer Signals Embedded in TIBCO™ Spotfire®
11
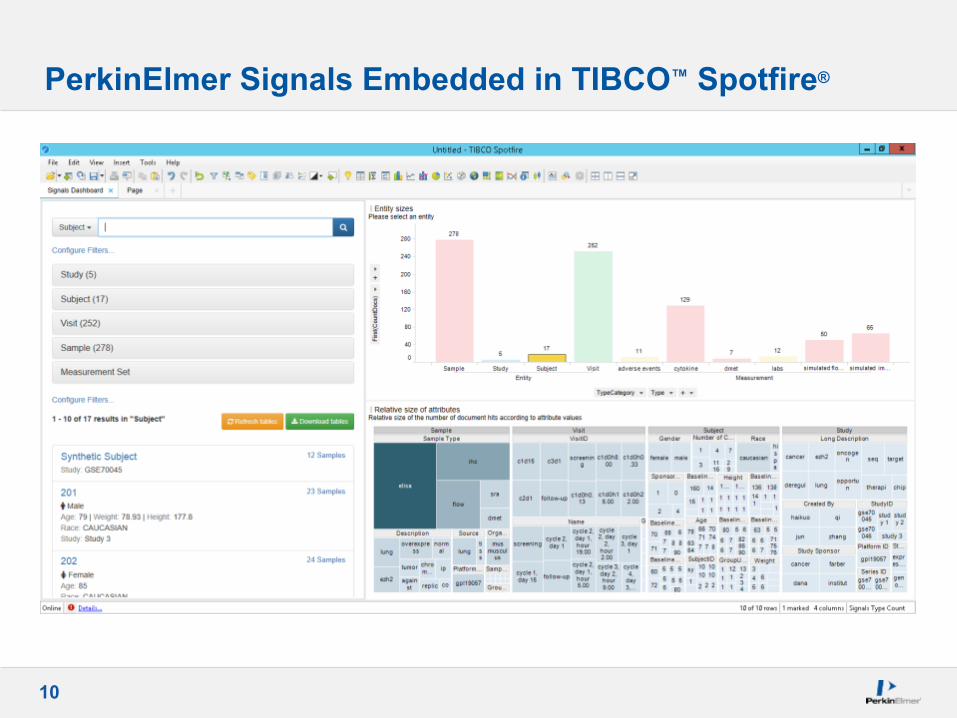
Visual Metadata Exploration…

12
…and Data Filtering

13
Real World Evidence across the Pharma Value Chain
• R&D ◦ Translational, Trial Simulation & Recruitment
• Medical & Safety
◦ AE / Signal Detection, Risk Management
• HEOR ◦ Local Burden of disease and cost
• Market Access
◦ Speed to market, outcomes-based pricing
• Commercial ◦ Patient flow, Launch planning

14
RWE Use Case Specific Analysis
Kaplan-Meier Plot - also known as the product limit/
survival estimator
Forest Plot of hazard ratios by cohort

15
IHC
Multiplex ELISA
NGS
GEA
CNV and Translocations
Cohort Studies - Data Mashup: Combining Clinical and Biomarker Data
Patient Population Stratified Patient Population
Quantitative Pathology
Getting the right drug to the right patient at the right time

16
IHC
Multiplex ELISA
NGS
GEA
CNV and Translocations
Translational Medicine will become Personalized Medicine
Quantitative Pathology
Getting the right drug to the right patient at the right time
? Precise diagnosis
Targeted Therapy

17
Features of Desired Analytical Ecosystem
• Open and Collaborative ◦ Within and between Business units ◦ Also with Vendors
• Comprehensive ◦ Deep set of “out of the box” capabilities ◦ From data to insight
• Flexible ◦ Exists as part of current architecture without disruption
• Grows and changes over time!

18

![MSc in Translational (Neuroscience) · PDF fileMSc in Translational Pathology [Neuroscience] Why Translational Pathology? The MSc Translational Pathology (Neuroscience) course combines](https://img.pdfslide.us/doc/110x75/5a7454947f8b9a0d558bb440/msc-in-translational-neuroscience-a-msc-in-translational-pathology-neuroscience.jpg)