Embed Size (px)
Citation preview
Interaction of europium and nickel with calcite studied
by Rutherford Backscattering Spectrometry and
Time-Resolved Laser Fluorescence Spectroscopy
A Sabau, Y Pipon, N Toulhoat, C Lomenech, N Jordan, N Moncoffre, A
Barkleit, N Marmier, V Brendler, S Surble, et al.
To cite this version:
A Sabau, Y Pipon, N Toulhoat, C Lomenech, N Jordan, et al.. Interaction of eu-ropium and nickel with calcite studied by Rutherford Backscattering Spectrometry andTime-Resolved Laser Fluorescence Spectroscopy. Nuclear Instruments and Methods inPhysics Research Section B: Beam Interactions with Materials and Atoms, Elsevier, 2014,<10.1016/j.nimb.2014.02.041>. <hal-01306310>
HAL Id: hal-01306310
https://hal.archives-ouvertes.fr/hal-01306310
Submitted on 22 Apr 2016
HAL is a multi-disciplinary open accessarchive for the deposit and dissemination of sci-entific research documents, whether they are pub-lished or not. The documents may come fromteaching and research institutions in France orabroad, or from public or private research centers.
L’archive ouverte pluridisciplinaire HAL, estdestinee au depot et a la diffusion de documentsscientifiques de niveau recherche, publies ou non,emanant des etablissements d’enseignement et derecherche francais ou etrangers, des laboratoirespublics ou prives.
Page 1
Interaction of Europium and Nickel with calcite studied by Rutherford Backscattering Spectrometry and
Time-Resolved Laser Fluorescence Spectroscopy
A. Sabau1,2, Y. Pipon3,4,*, N. Toulhoat3,5, C. Lomenech2, N. Jordan6, N. Moncoffre3,
A. Barkleit6, N. Marmier2, V. Brendler6, S. Surblé7,8, E. Giffaut1
1 Agence Nationale pour la gestion des Déchets RAdioactifs, 1-7 rue J. Monnet, Parc de la Croix Blanche, 92298
Châtenay-Malabry Cedex, France.
2 Université de Nice Sophia Antipolis, Ecosystèmes Côtiers Marins et Réponses aux Stress (ECOMERS), 28
avenue Valrose, 06108 Nice Cedex 2, France.
3 Institut de Physique Nucléaire de Lyon (IPNL), Université Lyon 1, CNRS/IN2P3, 4 rue Enrico Fermi, 69 622
Villeurbanne Cedex, France.
4 Institut Universitaire de Technologie (IUT) Lyon-1, Université Claude Bernard Lyon 1, 69 622 Villeurbanne
Cedex, France.
5 CEA/DEN, Saclay, 91191 Gif sur Yvette, France
6 Helmholtz Zentrum Dresden Rossendorf (HZDR), Institute of Resource Ecology (IRE), Germany.
7 CEA / IRAMIS / SIS2M / LEEL, F-91191 Gif-sur-Yvette, France.
8 CNRS / UMR 3299 / SIS2M / LEEL, F-91191 Gif-sur-Yvette, France.
* Corresponding author. Present address: IPNL, Bâtiment Paul Dirac, 4, rue Enrico Fermi, F-69622 Villeurbanne
cedex, France. Tel.: +33 4 72 43 10 57 (Y. Pipon). E-mail: [email protected]
Abstract
This study aims at elucidating the mechanisms regulating the interaction of Eu and Ni with calcite (CaCO3).
Calcite powders or single crystals (some mm sized) were put into contact with Eu or Ni solutions at
concentrations ranging from 10−3 to 10−5 mol.L−1 for Eu and 10−3 mol.L−1 for Ni. The sorption durations ranged
from one week to one month. Rutherford Backscattering Spectrometry (RBS) well adapted to discriminate
incorporation processes such as: (i) adsorption or co precipitation at the mineral surfaces or, (ii) incorporation
into the mineral structure (through diffusion for instance), has been carried out. Moreover, using the fluorescence
properties of Europium, the results have been compared to those obtained by Time-Resolved Laser Fluorescence
Spectroscopy (TRLFS) on calcite powders. For the single crystals, complementary SEM observations of the
Page 2
mineral surfaces at low voltage were also performed. Results showed that Ni accumulates at the calcite surface
whereas Eu is also incorporated at a greater depth. Eu seems therefore to be incorporated into two different states
in calcite: (i) heterogeneous surface accumulation and (ii) incorporation at depth greater than 160 nm after 1
month of sorption. Ni was found to accumulate at the surface of calcite without incorporation.
Keywords
Calcite; Europium; Nickel; RBS; TRLFS, Sorption.
Introduction
Calcium carbonate minerals are present in the French Callovo Oxfordian shales where the radioactive waste
should be disposed of. An important number of waste repository concepts enclose cement base components and
calcite is the main secondary alteration product formed during the degradation of cement over geological time
scales [1]. Europium is a fission product (154Eu and 155Eu, with t1/2 = 8.6 years and 4.7 years, respectively) also
used as analogue of trivalent actinides. Nickel is an activation product (63Ni and 59Ni, with t1/2 = 100.1 years and
7.6 × 10⁴ years, respectively). Therefore, for safety reasons, the evaluation of the retention capabilities of calcite
with respect to these radionuclides has to be fully understood. Interactions between cations and natural or
synthetic calcite may include incorporation processes, resulting in the irreversibility of some sorption reactions.
Understanding and quantification of poorly to non-reversible trapping mechanisms can be considered as a
significant improvement in the description of a geological barrier or a backfill material performance in the safety
assessment. Little is known about the mechanism of the transfer process from the surface to the bulk. Trapping
of ions can proceed either via progressive incorporation into the lattice of the solid, including continuous
dissolution/precipitation processes and diffusion or via irreversible surface precipitation.
Rutherford Backscattering spectroscopy (RBS) is an analysis technique that is widely used to follow the
incorporation or migration of different elements in minerals. For example, the incorporation of rare earth
elements (REE) and Pb and Sr into calcite and into apatite has been studied by Cherniak [2-5]. The comparison
of the results of these studies proves that these elements diffuse rather rapidly into calcite in comparison to other
minerals. Alonso et al. [6] investigated the diffusion of Eu, U, Sr and Re into clay by means of RBS, and clearly
showed different behaviors for Eu and U (strong adsorbing elements) compared with Sr and Re. Carroll [7]
combined a RBS study to SEM and EDS measurements and observed the incorporation of U(VI), Nd and Th(IV)
in calcite as solid solutions.
Page 3
Europium’s luminescent properties enable the use of TRLFS to elucidate interaction mechanisms with calcite.
Fernandes et al. [8] successfully demonstrated the formation of solid solution between Eu3+ with calcite, by
substitution of Ca2+ on the lattice site [9]. Calcite presented both surface sorption and incorporation capacities for
Eu(III) [9]. The incorporation had already been evidenced by Piriou et al. [10]. Schmidt et al. [11] studied Eu
sorption onto aragonite (metastable CaCO3) and found only structural incorporation of Eu3+, without any surface
sorption. The reactivity of CaCO3 was thus shown to be dependent on its polymorphism. Substitution of divalent
Ca2+ by trivalent Eu3+ was found to be accompanied by a charge compensation which proceeds via a coupled
substitution mechanism, originating from the simultaneous substitution of two Ca2+ by one Eu(III) and one Na+
ion [8, 9].
Our work aims at studying the different mechanisms leading to a potential incorporation of europium and nickel
in calcite. We have decided to work on the Eu-CO2-NaCl-CaCO3 and Ni-CO2-NaCl-CaCO3 system at pH ~ 8.3,
buffered by calcite under air and corresponding to the typical pH range of natural interstitial groundwaters. Our
study relies on the RBS technique to comprehensively characterize the Eu-CO2-NaCl-CaCO3 and the Ni-CO2-
NaCl-CaCO3, and associates TRLFS analyses for Eu. The investigated samples were prepared under atmospheric
conditions, on different calcite samples (powders and millimetric crystals), for different initial concentrations of
europium and nickel, these parameters being assumed to be amongst the most important controlling the sorption
mechanisms.
1. Materials and methods
1.1 Materials
At first, an appropriate material for sorption experiments was selected based on characterization studies. From a
variety of sources, the attention was focused on two calcite powders from SOLVAY (SOCAL U1-R) and from
OMYA (Hydrocarb 90). The particle size was estimated by Scanning Electron Microscopy (SEM) to be,
respectively, ~ 0.2 µm and ~ 50 µm. The specific surface areas were determined to be, respectively, 18.4 m2 g−1
and 0.66 m2 g−1 by applying the Brunauer-Emmet-Teller (BET) equation with nitrogen adsorption isotherms at
77 K (Multi-point Beckman Coulter Surface Analyzer SA 3100). Purity of the calcite samples and absence of
polymorphic CaCO3 compounds (i.e. vaterite and aragonite) were confirmed by XRD (X-ray Diffraction),
DRIFT (Diffuse Reflectance Infra-Red Fourier Transform Spectroscopy) and TEM (Transmission Electron
Microscopy). Elemental analysis performed by ICP-MS (Inductively Coupled Plasma-Mass Spectrometry,
ELAN 9000 Perkin Elmer) after digestion showed the absence of Ni in the SOLVAY sample (<0.01 μg g−1) and
Page 4
the presence of a very low concentration of Eu (5.83.10−2 μg g−1), whereas in the OMYA sample a small amount
of Ni was detected (13.11 μg g−1), whereas Eu was not detected (<0.01 μg g−1). Single crystals provided by Alfa
Aesar were also investigated, with a surface size around 1 x 1 mm2 and a thickness of 2 to 3 mm. Small amounts
of Eu (<0.07 μg g−1) and for Ni (0.41 μg g−1) were determined by ICP-MS after digestion of 50 mg of single
crystals.
1.2 Sample preparation
The europium (5 × 10⁻³ M) and nickel (2 × 10⁻³ M) stock solutions were prepared by dissolving EuCl3·6H2O
(Sigma-Aldrich, trace elements basis, 99.99%) and NiCl2.6H2O (Sigma-Aldrich, 99%) in UHQ water. All
experiments were carried out using diluted fractions of these solutions. All sorption experiments were done
under atmospheric conditions (pCO2 = 10−3.5 atm) and carried out in duplicate.
For powder samples, 500 mg of calcite was suspended in 100 mL of 0.1 mol L−1 NaCl solution in Teflon vials, to
get a mass-volume ratio of 5 g L−1. A first step resulting in the pre-equilibration of calcite was performed, i.e. the
calcite suspension was stirred until an equilibrium pH of ~8.3 was reached. Required amounts of europium were
then added to reach a europium concentration of 10−3 and 10−4 mol L−1 and a nickel concentration of 10−3 mol
L−1 at ambient pressure and temperature and the samples were subsequently stirred during 1 month. After
sorption, the suspension was directly measured by TRLFS and for RBS experiments, samples were centrifuged
at 5000 rpm for 30 minutes, the solid was dried in air for 4 days and then compacted to pellets about 1 cm in
diameter.
For millimetric single crystals, 10 to 12 crystals (resulting in a solid/liquid ratio of 0.3 g L-1) were directly
immersed in 100 mL of a Eu or Ni-enriched solution (10−5 and 10−4 mol L−1 for Eu, 10−4 and 10−3 mol L−1 for Ni),
since the pre-equilibration could not be reached easily; the pH was adjusted using a dilute NaOH solution to
reach a value of ~ 8.3. Two contact times (1 week and 1 month) were selected, during which the solution was
periodically stirred by hand. For the RBS measurements, powders were pressed to pellets and were, as well as
the single crystals, coated with a layer of carbon (about 10 nm) prior to the measurement in order to prevent
charging of the surface.
1.3 TRLFS
The TRLFS measurements were carried out with a pulsed flash lamp pumped Nd:YAG-OPO laser system
(Powerlite Precision II 9020 laser equipped with a Green PANTHER EX OPO from Continuum, Santa Clara,
Page 5
CA, USA) at an excitation wavelength of 394 nm and a constant time gate width of 1 ms (10−5 and 10−4 mol L−1
Eu3+) or 0.1 ms (10−3 mol L−1 Eu3+). Details on the laser system are given elsewhere [12]. Static and time-
resolved luminescence spectra of Eu3+ were recorded in the range of 570 – 650 nm (1200 lines mm−1 grating, 0.2
nm resolution) and 550 – 740 nm (300 lines mm−1 grating, 0.7 nm resolution), respectively. For time-resolved
measurements, 61 spectra with delay steps of 20, 50, 250 or 500 µs, depending on the luminescence lifetime,
were recorded per sample. The luminescence spectra were analyzed using OriginPro 7.5G (OriginLab,
Northhampton, MA, USA) to obtain peak positions and lifetimes. The lifetimes were calculated by fitting the
integrated luminescence signal to a sum of exponential decay functions:
)/exp()( i
i
i tEtE (1)
where E is the total luminescence intensity at the time t, Ei the initial luminescence intensity of the species i at t
= 0, and i the corresponding lifetime.
The number of water molecules in the first coordination shell of Eu3+ was determined from the luminescence
lifetimes (in ms) using the linear relationship developed by Horrocks and Sudnick [13] and the resultant
empirical formula from Kimura and Choppin [14]. This equation is only valid for lifetimes higher than 110 μs.
n(H2O) ± 0.5 = 1.07 • −1 − 0.62 (2)
1.4 RBS (Rutherford Backscattering Spectrometry) analysis
RBS analysis was performed at IPNL on a 4 MV Van de Graaff accelerator. Beam was normal to the sample
surfaces and 4He detection was performed at 172° using a surface barrier silicon detector. Two different energies
have been used for the incident beam: 4 MeV and 1.5 MeV. The 4 MeV beam allowed probing Eu and Ni in
order to measure the incorporation of Eu and Ni in function of depth and the 1.5 MeV experiments were
performed in order to increase the surface resolution and to accurately probe the first hundreds nanometers near
the surface. The circular incident beam was around 1 mm in diameter and the current density was kept low with
a maximum value of 2 µA cm−2 in order to avoid element (Eu or Ni) migration or calcite degradation during
RBS analysis.
The SIMNRA 6.06 simulation program [15] was used to simulate the experimental spectra and to determine
concentration profiles of Eu and Ni. Constant layers were used to make the simulation and the thickness value
was set to the value of the technique resolution which was determined for each experimental condition with
RESOLNRA [16].
Page 6
2. Results and discussion
2.1 Results on powders
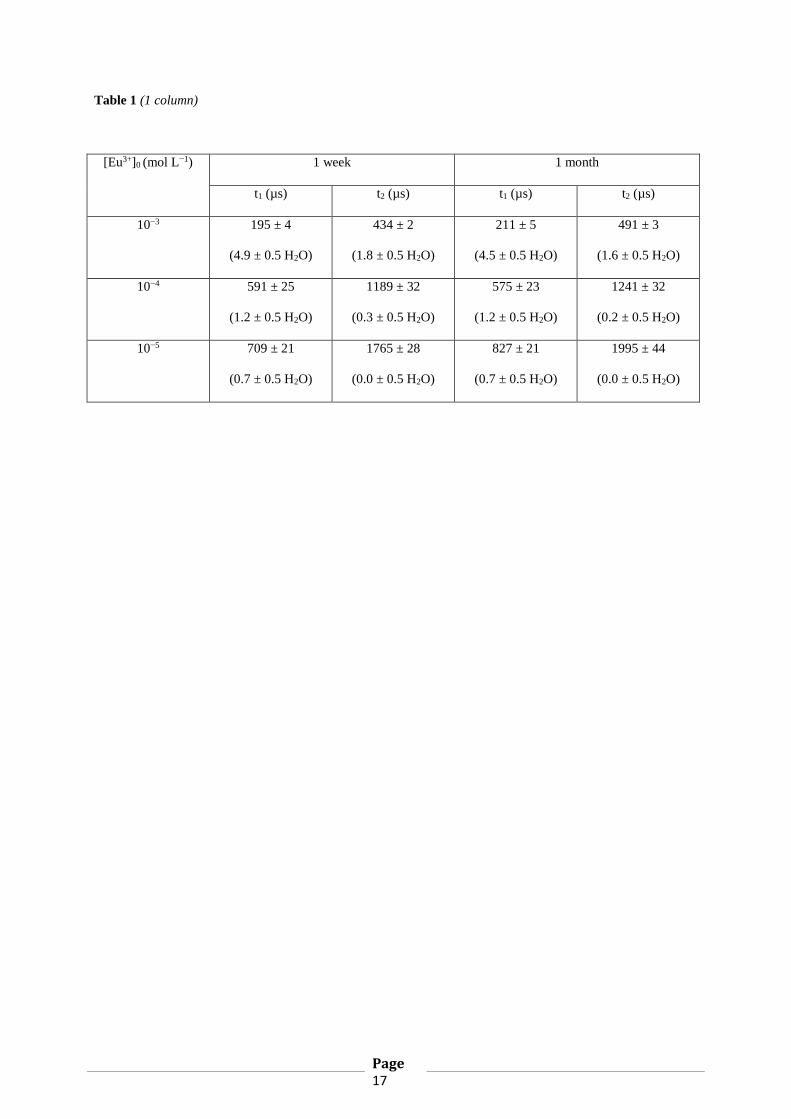
Concerning the analyses by TRLFS, the lifetimes obtained on the SOLVAY powders for three Eu concentrations
(10−3, 10−4 and 10−5 mol L−1) and two contact times (1 week and 1 month) are presented in Table 1. Three main
observations can be done:
- all measurements reveal two different lifetimes in each sample, indicating two different local environments
for Eu in calcite,
- for each concentration, the number of H2O molecules remains almost unchanged between 1 week and 1
month, which means that no significant structural changes with time could be observed and,
- an obvious evolution as a function of the initial concentration of Eu(III), since the lifetimes get higher when
the concentration decreases.
The first short lifetimes (195 - 211 μs) are close to those found for isolated Eu solid carbonates listed in the
literature [17], especially NaEu(CO3)2:5H2O or Eu2(CO3)3:nH2O. These short lifetimes could then be attributed
to the formation of europium carbonate species at the calcite surface. The lifetimes with an intermediate value
(434 - 1241 μs) may be attributed to hydrated species or surface complexes [8, 10, 11], having had a partial loss
of their hydration sphere, 1 or 2 water molecules surrounding europium. Such an environment has been
identified in three studies of the literature: while Fernandes et al. [8] associated a measured lifetime of 800-1080
μs to the possibility of formation of a europium surface complex on calcite, Piriou et al. [10] also reported
intermediate lifetimes of 450 and 850 μs, corresponding to two types of environment where Eu is surrounded by
water or hydroxyl ions, one observed for the highest Eu concentration and being more hydrated than the other
one, and Yeghicheyan [18] reported lifetimes of 420 and 560 μs corresponding to hydrated/hydroxylated
environments. Piriou et al. [10] postulated incorporation into a hydrated and/or hydroxylated surface layer of
calcite. The higher lifetimes measured in our study (>1765 μs) would correspond to a total loss of the hydration
sphere, and we may suppose that even already after 1 week, incorporation of Eu(III) in the calcite lattice already
took place, despite the measured lifetime is lower than those previously reported in the literature [8, 10, 11].
Concerning the RBS analyses, calcite powders enriched during 1 month with Eu (10−3 M and 10−4 M) and Ni
(10−3 M) and pressed to pellets afterwards have been analyzed with a 4 MeV 4He incident beam. At this energy,
the depth resolution is about 35 nm near the surface. It must be noted that two different analyses at different
Page 7
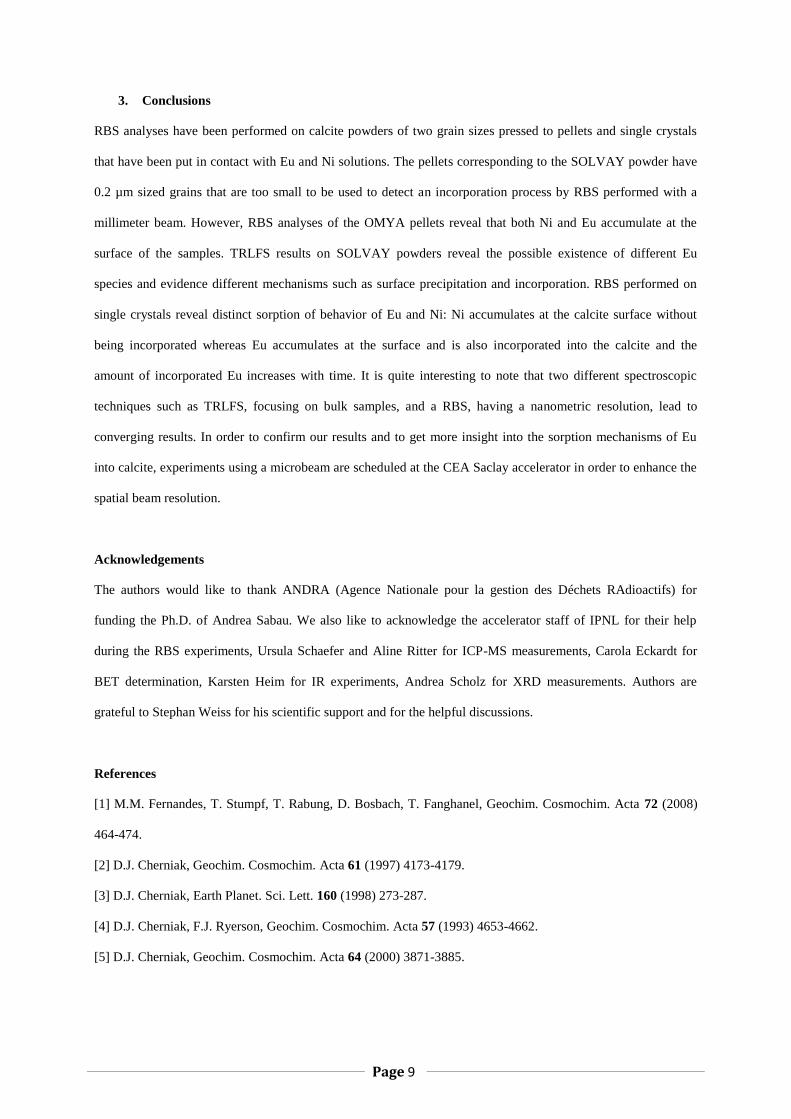
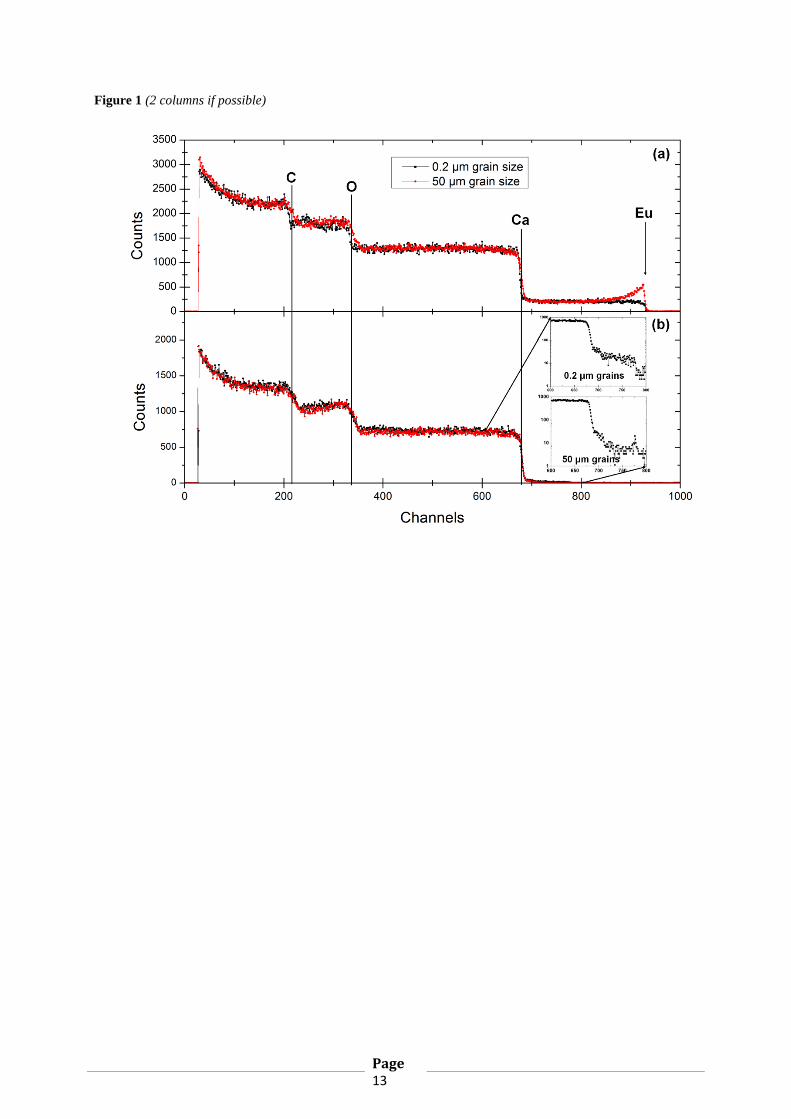
points have been made on each pellet and that a good reproducibility was obtained. Figure 1 displays the
backscattered 4He spectrum in function of channel obtained on the pellets enriched respectively with 10−3 M Eu
(1a) and 10−3 M Ni (1b). Two main observations can be made:
- the spectra obtained on the OMYA (50 µm grain size) pellets display a surface peak (of Eu or Ni) that is
not present for the SOLVAY (0.2 µm grain size) pellets.
- on the left side of this surface peak (toward the lower channel numbers), the Eu (or Ni) signals, OMYA
and SOLVAY pellets, remain equal and constant.
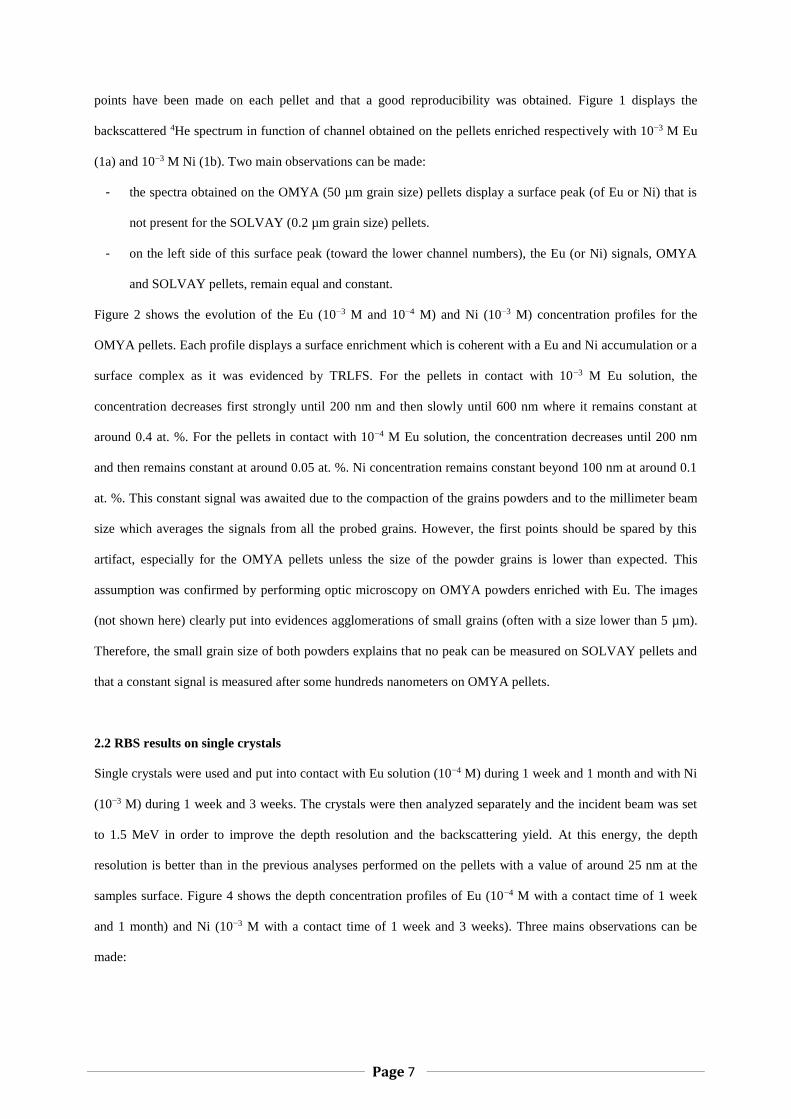
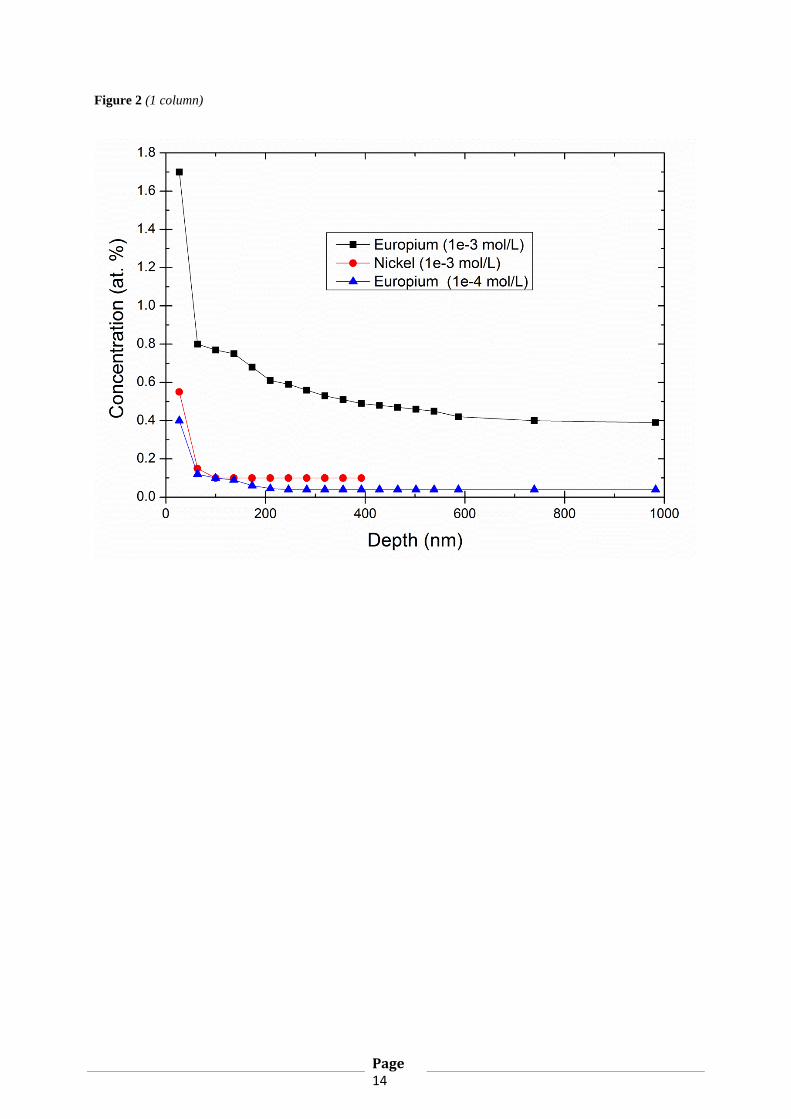
Figure 2 shows the evolution of the Eu (10−3 M and 10−4 M) and Ni (10−3 M) concentration profiles for the
OMYA pellets. Each profile displays a surface enrichment which is coherent with a Eu and Ni accumulation or a
surface complex as it was evidenced by TRLFS. For the pellets in contact with 10−3 M Eu solution, the
concentration decreases first strongly until 200 nm and then slowly until 600 nm where it remains constant at
around 0.4 at. %. For the pellets in contact with 10−4 M Eu solution, the concentration decreases until 200 nm
and then remains constant at around 0.05 at. %. Ni concentration remains constant beyond 100 nm at around 0.1
at. %. This constant signal was awaited due to the compaction of the grains powders and to the millimeter beam
size which averages the signals from all the probed grains. However, the first points should be spared by this
artifact, especially for the OMYA pellets unless the size of the powder grains is lower than expected. This
assumption was confirmed by performing optic microscopy on OMYA powders enriched with Eu. The images
(not shown here) clearly put into evidences agglomerations of small grains (often with a size lower than 5 µm).
Therefore, the small grain size of both powders explains that no peak can be measured on SOLVAY pellets and
that a constant signal is measured after some hundreds nanometers on OMYA pellets.
2.2 RBS results on single crystals
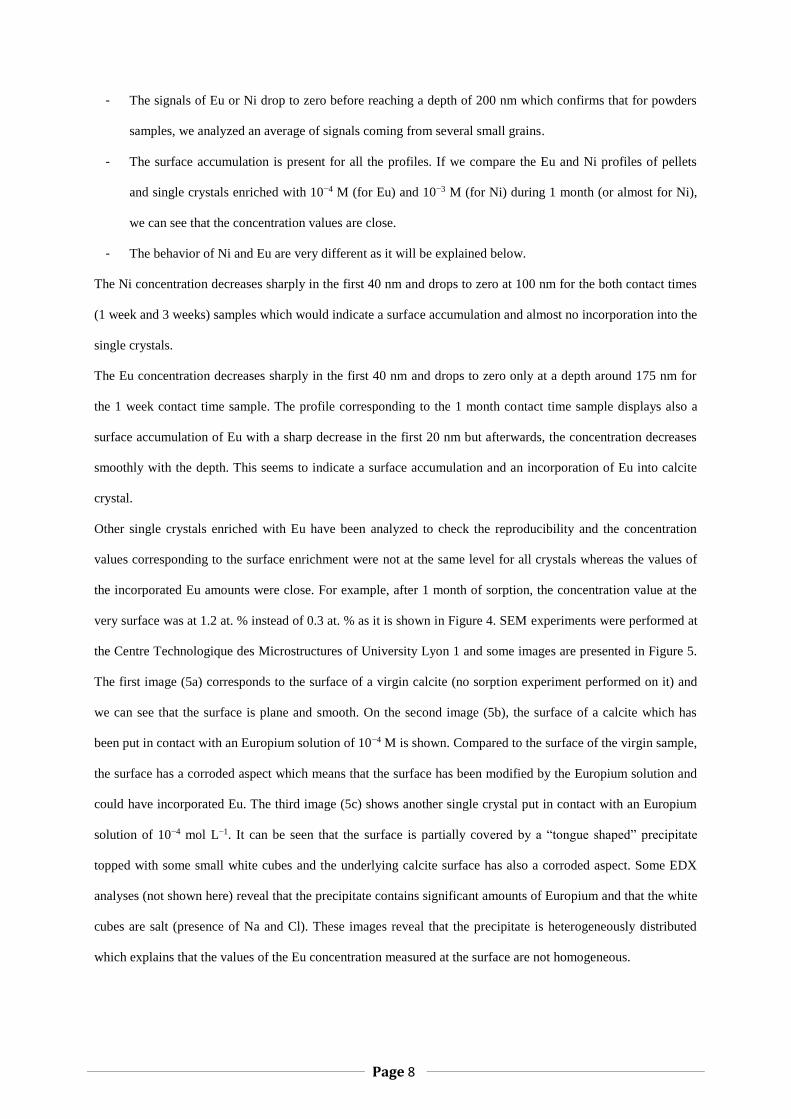
Single crystals were used and put into contact with Eu solution (10−4 M) during 1 week and 1 month and with Ni
(10−3 M) during 1 week and 3 weeks. The crystals were then analyzed separately and the incident beam was set
to 1.5 MeV in order to improve the depth resolution and the backscattering yield. At this energy, the depth
resolution is better than in the previous analyses performed on the pellets with a value of around 25 nm at the
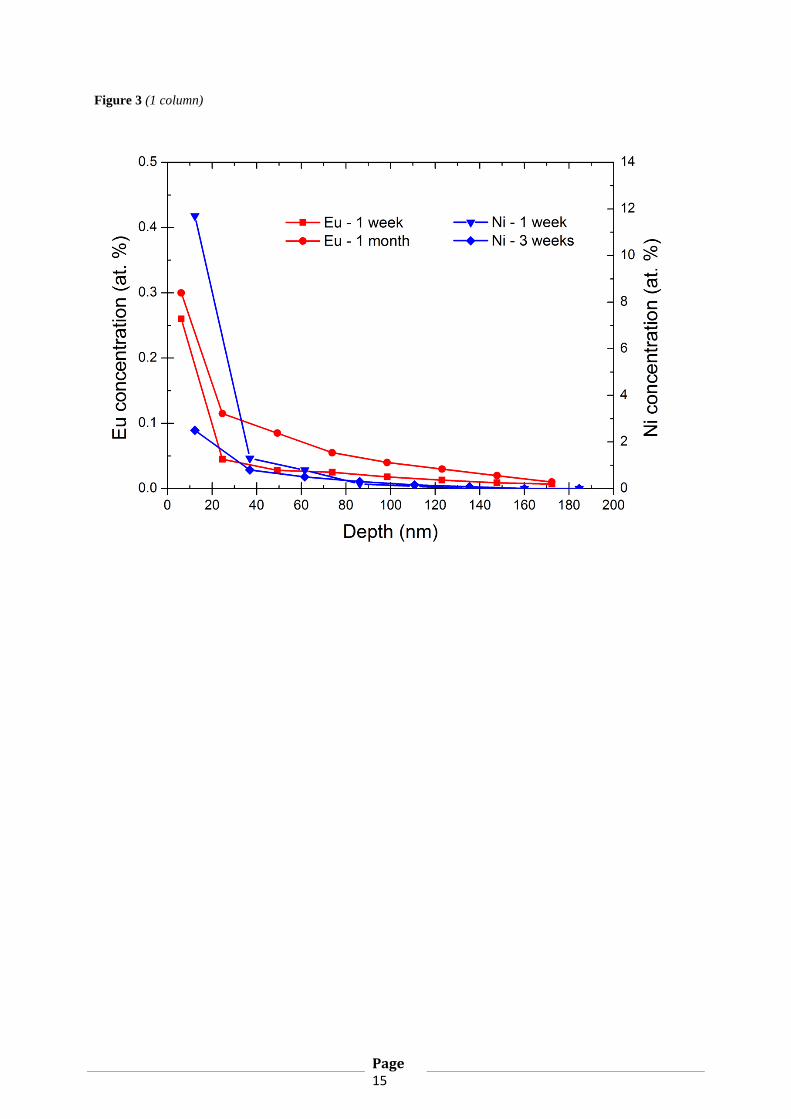
samples surface. Figure 4 shows the depth concentration profiles of Eu (10−4 M with a contact time of 1 week
and 1 month) and Ni (10−3 M with a contact time of 1 week and 3 weeks). Three mains observations can be
made:
Page 8
- The signals of Eu or Ni drop to zero before reaching a depth of 200 nm which confirms that for powders
samples, we analyzed an average of signals coming from several small grains.
- The surface accumulation is present for all the profiles. If we compare the Eu and Ni profiles of pellets
and single crystals enriched with 10−4 M (for Eu) and 10−3 M (for Ni) during 1 month (or almost for Ni),
we can see that the concentration values are close.
- The behavior of Ni and Eu are very different as it will be explained below.
The Ni concentration decreases sharply in the first 40 nm and drops to zero at 100 nm for the both contact times
(1 week and 3 weeks) samples which would indicate a surface accumulation and almost no incorporation into the
single crystals.
The Eu concentration decreases sharply in the first 40 nm and drops to zero only at a depth around 175 nm for
the 1 week contact time sample. The profile corresponding to the 1 month contact time sample displays also a
surface accumulation of Eu with a sharp decrease in the first 20 nm but afterwards, the concentration decreases
smoothly with the depth. This seems to indicate a surface accumulation and an incorporation of Eu into calcite
crystal.
Other single crystals enriched with Eu have been analyzed to check the reproducibility and the concentration
values corresponding to the surface enrichment were not at the same level for all crystals whereas the values of
the incorporated Eu amounts were close. For example, after 1 month of sorption, the concentration value at the
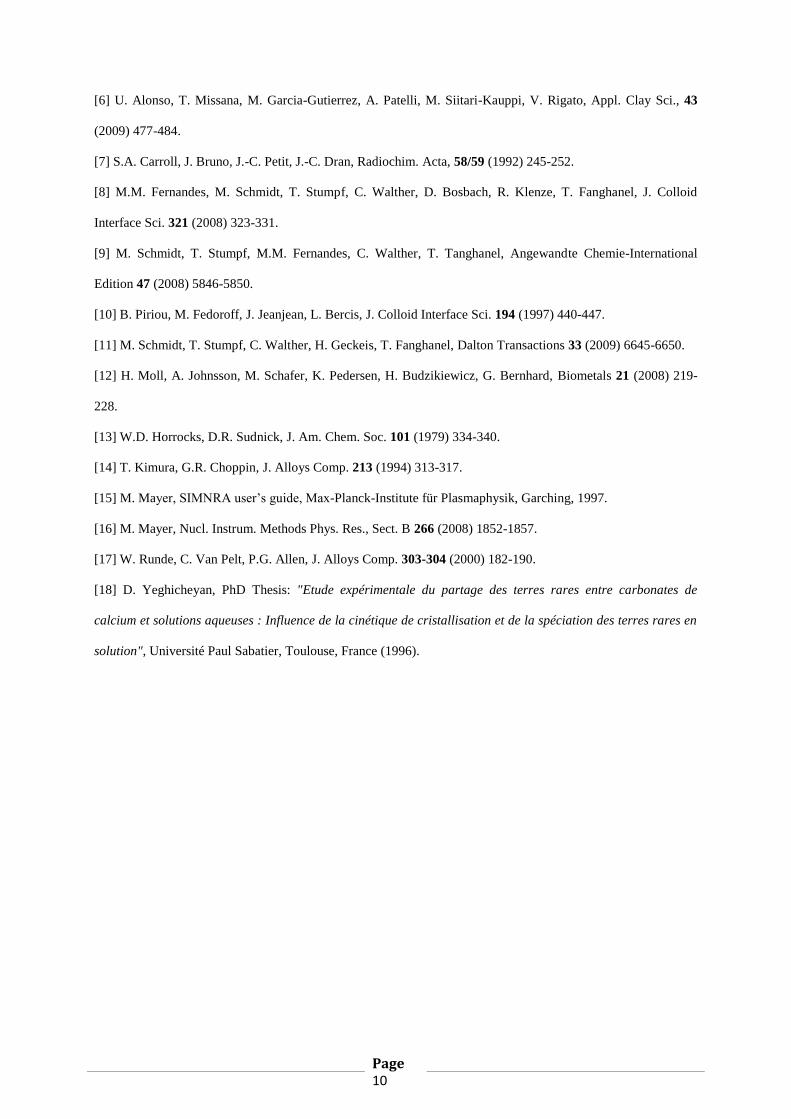
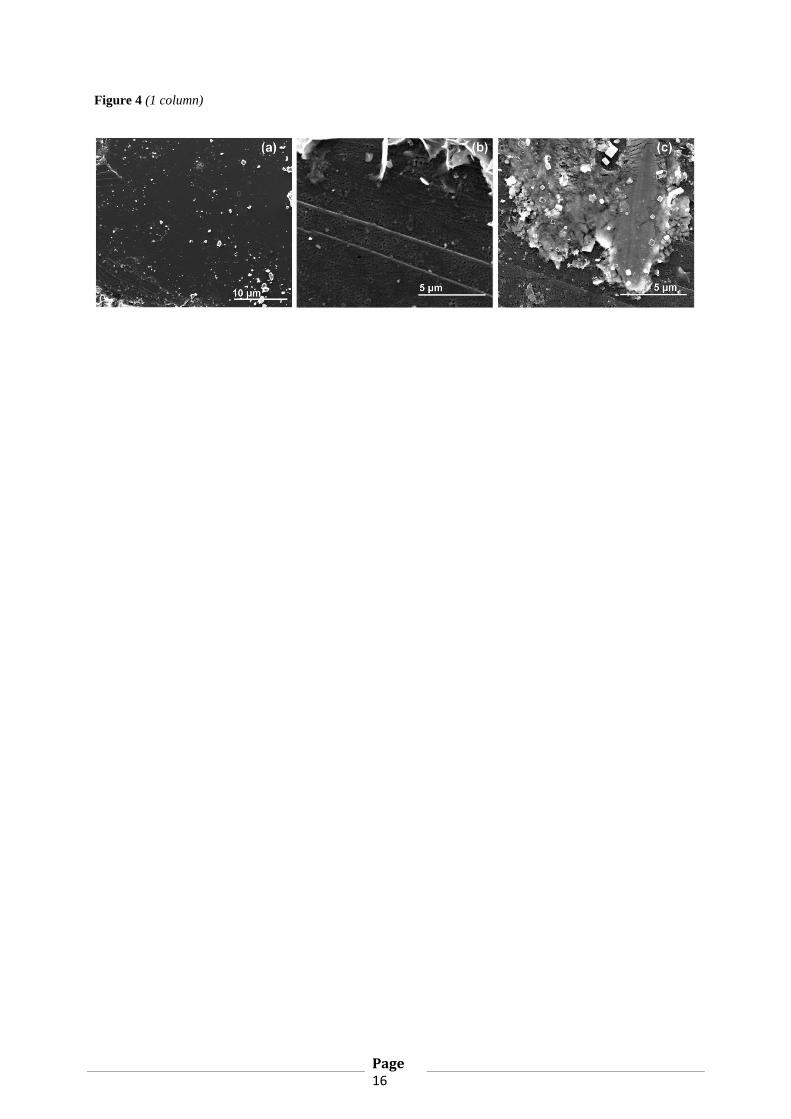
very surface was at 1.2 at. % instead of 0.3 at. % as it is shown in Figure 4. SEM experiments were performed at
the Centre Technologique des Microstructures of University Lyon 1 and some images are presented in Figure 5.
The first image (5a) corresponds to the surface of a virgin calcite (no sorption experiment performed on it) and
we can see that the surface is plane and smooth. On the second image (5b), the surface of a calcite which has
been put in contact with an Europium solution of 10−4 M is shown. Compared to the surface of the virgin sample,
the surface has a corroded aspect which means that the surface has been modified by the Europium solution and
could have incorporated Eu. The third image (5c) shows another single crystal put in contact with an Europium
solution of 10−4 mol L−1. It can be seen that the surface is partially covered by a “tongue shaped” precipitate
topped with some small white cubes and the underlying calcite surface has also a corroded aspect. Some EDX
analyses (not shown here) reveal that the precipitate contains significant amounts of Europium and that the white
cubes are salt (presence of Na and Cl). These images reveal that the precipitate is heterogeneously distributed
which explains that the values of the Eu concentration measured at the surface are not homogeneous.
Page 9
3. Conclusions
RBS analyses have been performed on calcite powders of two grain sizes pressed to pellets and single crystals
that have been put in contact with Eu and Ni solutions. The pellets corresponding to the SOLVAY powder have
0.2 µm sized grains that are too small to be used to detect an incorporation process by RBS performed with a
millimeter beam. However, RBS analyses of the OMYA pellets reveal that both Ni and Eu accumulate at the
surface of the samples. TRLFS results on SOLVAY powders reveal the possible existence of different Eu
species and evidence different mechanisms such as surface precipitation and incorporation. RBS performed on
single crystals reveal distinct sorption of behavior of Eu and Ni: Ni accumulates at the calcite surface without
being incorporated whereas Eu accumulates at the surface and is also incorporated into the calcite and the
amount of incorporated Eu increases with time. It is quite interesting to note that two different spectroscopic
techniques such as TRLFS, focusing on bulk samples, and a RBS, having a nanometric resolution, lead to
converging results. In order to confirm our results and to get more insight into the sorption mechanisms of Eu
into calcite, experiments using a microbeam are scheduled at the CEA Saclay accelerator in order to enhance the
spatial beam resolution.
Acknowledgements
The authors would like to thank ANDRA (Agence Nationale pour la gestion des Déchets RAdioactifs) for
funding the Ph.D. of Andrea Sabau. We also like to acknowledge the accelerator staff of IPNL for their help
during the RBS experiments, Ursula Schaefer and Aline Ritter for ICP-MS measurements, Carola Eckardt for
BET determination, Karsten Heim for IR experiments, Andrea Scholz for XRD measurements. Authors are
grateful to Stephan Weiss for his scientific support and for the helpful discussions.
References
[1] M.M. Fernandes, T. Stumpf, T. Rabung, D. Bosbach, T. Fanghanel, Geochim. Cosmochim. Acta 72 (2008)
464-474.
[2] D.J. Cherniak, Geochim. Cosmochim. Acta 61 (1997) 4173-4179.
[3] D.J. Cherniak, Earth Planet. Sci. Lett. 160 (1998) 273-287.
[4] D.J. Cherniak, F.J. Ryerson, Geochim. Cosmochim. Acta 57 (1993) 4653-4662.
[5] D.J. Cherniak, Geochim. Cosmochim. Acta 64 (2000) 3871-3885.
Page 10
[6] U. Alonso, T. Missana, M. Garcia-Gutierrez, A. Patelli, M. Siitari-Kauppi, V. Rigato, Appl. Clay Sci., 43
(2009) 477-484.
[7] S.A. Carroll, J. Bruno, J.-C. Petit, J.-C. Dran, Radiochim. Acta, 58/59 (1992) 245-252.
[8] M.M. Fernandes, M. Schmidt, T. Stumpf, C. Walther, D. Bosbach, R. Klenze, T. Fanghanel, J. Colloid
Interface Sci. 321 (2008) 323-331.
[9] M. Schmidt, T. Stumpf, M.M. Fernandes, C. Walther, T. Tanghanel, Angewandte Chemie-International
Edition 47 (2008) 5846-5850.
[10] B. Piriou, M. Fedoroff, J. Jeanjean, L. Bercis, J. Colloid Interface Sci. 194 (1997) 440-447.
[11] M. Schmidt, T. Stumpf, C. Walther, H. Geckeis, T. Fanghanel, Dalton Transactions 33 (2009) 6645-6650.
[12] H. Moll, A. Johnsson, M. Schafer, K. Pedersen, H. Budzikiewicz, G. Bernhard, Biometals 21 (2008) 219-
228.
[13] W.D. Horrocks, D.R. Sudnick, J. Am. Chem. Soc. 101 (1979) 334-340.
[14] T. Kimura, G.R. Choppin, J. Alloys Comp. 213 (1994) 313-317.
[15] M. Mayer, SIMNRA user’s guide, Max-Planck-Institute für Plasmaphysik, Garching, 1997.
[16] M. Mayer, Nucl. Instrum. Methods Phys. Res., Sect. B 266 (2008) 1852-1857.
[17] W. Runde, C. Van Pelt, P.G. Allen, J. Alloys Comp. 303-304 (2000) 182-190.
[18] D. Yeghicheyan, PhD Thesis: "Etude expérimentale du partage des terres rares entre carbonates de
calcium et solutions aqueuses : Influence de la cinétique de cristallisation et de la spéciation des terres rares en
solution", Université Paul Sabatier, Toulouse, France (1996).
Page 11
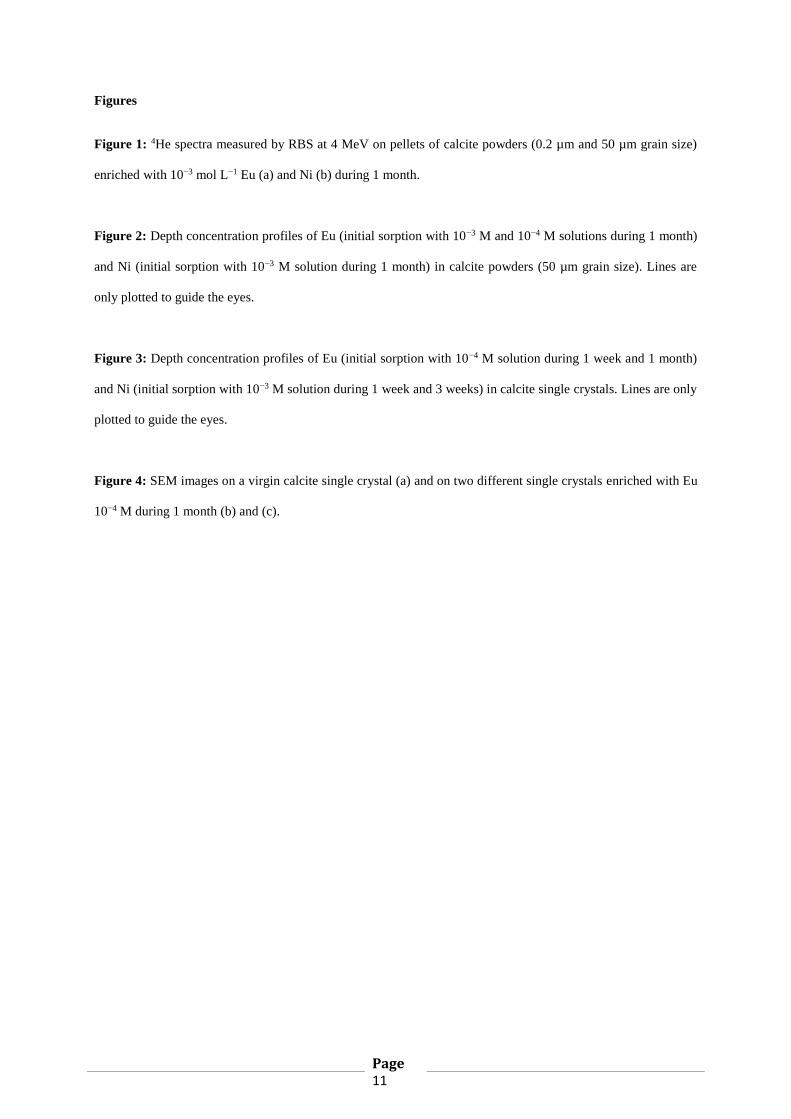
Figures
Figure 1: 4He spectra measured by RBS at 4 MeV on pellets of calcite powders (0.2 µm and 50 µm grain size)
enriched with 10−3 mol L−1 Eu (a) and Ni (b) during 1 month.
Figure 2: Depth concentration profiles of Eu (initial sorption with 10−3 M and 10−4 M solutions during 1 month)
and Ni (initial sorption with 10−3 M solution during 1 month) in calcite powders (50 µm grain size). Lines are
only plotted to guide the eyes.
Figure 3: Depth concentration profiles of Eu (initial sorption with 10−4 M solution during 1 week and 1 month)
and Ni (initial sorption with 10−3 M solution during 1 week and 3 weeks) in calcite single crystals. Lines are only
plotted to guide the eyes.
Figure 4: SEM images on a virgin calcite single crystal (a) and on two different single crystals enriched with Eu
10−4 M during 1 month (b) and (c).
Page 12
Table
Table 1: Fluorescence lifetimes of Eu(III) sorbed on calcite powders (0.2 µm grain size) as a function of time
and initial concentration. t1 and t2 correspond to the two measured lifetimes in each sample. The number of water
molecules surrounding Eu calculated using Horrock’s equation is indicated in brackets.
Page 13
Figure 1 (2 columns if possible)
Page 14
Figure 2 (1 column)
Page 15
Figure 3 (1 column)
Page 16
Figure 4 (1 column)
Page 17
Table 1 (1 column)
[Eu3+]0 (mol L−1) 1 week 1 month
t1 (µs) t2 (µs) t1 (µs) t2 (µs)
10−3 195 ± 4
(4.9 ± 0.5 H2O)
434 ± 2
(1.8 ± 0.5 H2O)
211 ± 5
(4.5 ± 0.5 H2O)
491 ± 3
(1.6 ± 0.5 H2O)
10−4 591 ± 25
(1.2 ± 0.5 H2O)
1189 ± 32
(0.3 ± 0.5 H2O)
575 ± 23
(1.2 ± 0.5 H2O)
1241 ± 32
(0.2 ± 0.5 H2O)
10−5 709 ± 21
(0.7 ± 0.5 H2O)
1765 ± 28
(0.0 ± 0.5 H2O)
827 ± 21
(0.7 ± 0.5 H2O)
1995 ± 44
(0.0 ± 0.5 H2O)