Embed Size (px)
Citation preview
Electrochemical reduction of europium(III) using tetra-n-octyl diglycolamide functionalized ordered mesoporous
carbon microelectrodes
Journal: Journal of Materials Chemistry C
Manuscript ID TC-ART-02-2020-000824.R1
Article Type: Paper
Date Submitted by the Author: 06-Apr-2020
Complete List of Authors: Bertelsen, Erin; Colorado School of Mines, Chemistry; Colorado School of MinesAntonio, Mark; Argonne National Laboratory, Chemical Sciences & Engineering DivisionTrewyn, Brian; Colorado School of Mines, ChemistryKovach, Nolan; Colorado School of Mines, ChemistryShafer, Jenifer ; Colorado School of Mines, Department of Chemistry and Geochemistry
Journal of Materials Chemistry C
ARTICLE
Please do not adjust margins
Please do not adjust margins
Received 00th January 20xx,
Accepted 00th January 20xx
DOI: 10.1039/x0xx00000x
Electrochemical reduction of europium(III) using tetra-n-octyl diglycolamide functionalized ordered mesoporous carbon microelectrodes
Erin R. Bertelsen,a Nolan Kovach, a Brian G. Trewyn,a,b Mark R. Antonioc and Jenifer C. Shafer*a,d
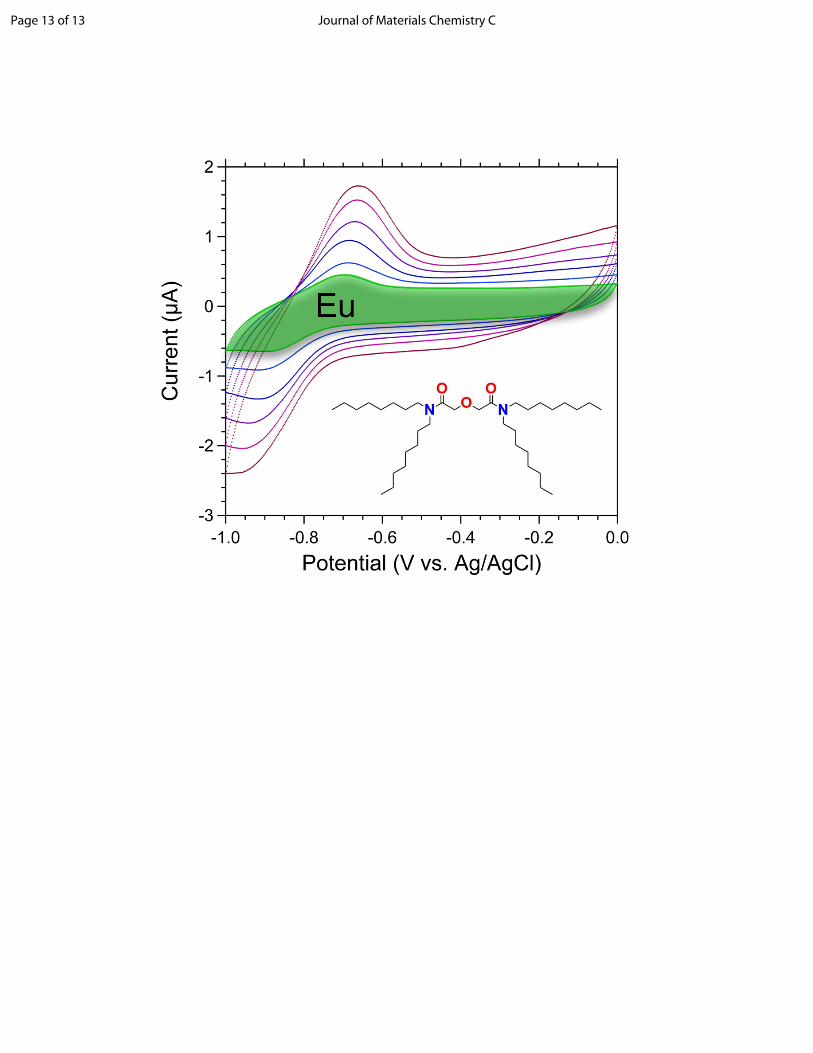
This work investigates the one-electron reduction of Eu(III) to Eu(II) with ordered mesoporous carbon (OMC) in cavity
microelectrode (CME) systems. OMC materials with and without tetra-n-octyl diglycolamide (TODGA) functionalization were
subjected to voltammetric measurements and compared with commercial carbon black Vulcan® XC-72. The electrochemical
reduction of solution Eu(III) with unfunctionalized OMC, XC-72, and TODGA-functionalized OMC—both within the electrode
matrix and on the electrode surface—is reported. The complexation of Eu(III) by TODGA-functionalized OMC prior to
electrode preparation incorporates Eu(III) as part of the bulk electrode matrix. Under these conditions, the high capacitance
obscures the Eu(III)/Eu(II) redox couple. A signal emerges above the background (capacitive) currents when 2-octanol is
added to the TODGA-functionalized OMC as a wetting agent. In contrast, surface Eu(III)-TODGA complexation, when Eu(III)
contacts the electrode surface exclusively after electrode preparation, provides a strong response. The addition of 2-octanol
to TODGA reduces the capacitance of the electrode and narrows the Eu(III)/Eu(II) redox peak widths. The desorption by
reductive stripping of Eu(II) was demonstrated using a 2-octanol modified TODGA OMC CME, opening the possibility for
selective separation of Eu from adjacent trivalent lanthanides.
Introduction
The one-electron reduction of Eu(III) to Eu(II) is a facile process
in solution electrolytes. The readily accessible electrode
potential, –0.55 V vs. Ag/AgCl, for the Eu(III)/Eu(II) couple1 and
the comparatively stable divalent oxidation state2 are the basis
of historical and contemporary strategies to separate Eu from
the adjacent trivalent lanthanides (Sm, Gd) and from its actinide
electronic analog, Am(III).3-8 The trivalent lanthanides are
arguably some of the most difficult elements to separate
because of the small decrease in ionic radii across the 4f-
period.9 As such, the electroanalytical chemistry of Eu provides
a convenient entry to effective separation processes. A
profusion of basic and applied research has shown that both
photons and electrons (from appropriate reagents and through
the controlled polarization of an electrode surface) can be
tuned for the selective and efficient reduction of Eu(III) in
aqueous and nonaqueous solution electrolytes.10-14
With conventional fluid electrolytes, three methods are
commonly used to separate Eu(II) from its trivalent neighbors:
(1) selective precipitation (with sulfate); (2) liquid-solid
extraction chromatography (EXC), and; (3) liquid-liquid
extraction (LLE).15 Despite the extensive practical exploitation
of the Eu redox response in separation science, very little direct
information is known about its electroanalytical chemistry in
chemical separations systems of direct relevance to practical
liquid-solid and liquid-liquid extraction. To address this gap in
knowledge, we have probed the electrochemical properties of
Eu using carbonaceous extraction chromatographic materials
with and without TODGA (N,N,N’,N’-tetra-n-octyl
diglycolamide). This amidic, neutral solvating extractant is of
contemporary significance in the ALSEP (Actinide-Lanthanide
SEParation) concept for actinide-lanthanide separation because
of its exceptionally high affinity for the trivalent lanthanides,16
particularly Eu.
Since its synthesis in 2001 by Sasaki et al.,17 TODGA has been
extensively studied for 4f/5f-element separations in EXC, LLE,
and supported liquid membrane (SLM) systems.16, 18 In LLE
extraction systems, TODGA is known to coordinate with the
trivalent lanthanides in a 3 : 1 (TODGA : Ln) stoichiometry19-22
following the equilibrium equation:
𝐿𝑛3+aq + 3𝑁𝑂3−aq+ 3𝑇𝑂𝐷𝐺𝐴org ⇌ 𝐿𝑛(𝑁𝑂3)3𝑇𝑂𝐷𝐺𝐴3org (1)
Further, it has been shown that TODGA is highly selective for
the light lanthanides.17 This selectivity is attributed to the
Ln(III)–TODGA complex outer-coordination sphere, which
contains the charge-neutralizing counter anions along with
water molecules.19, 23 TODGA does not demonstrate a high
uptake of the divalent alkaline earth cations.24, 25 In view of the
fact that the ionic radii of Sr(II) and Eu(II) are essentially
a. Department of Chemistry, Colorado School of Mines, Golden, CO 80401, USA. Email: [email protected]
b. Material Science Program, Colorado School of Mines, Golden, CO 80401, USA. c. Chemical Sciences & Engineering Division, Argonne National Laboratory, Lemont,
IL 60439, USA. d. Nuclear Science and Engineering Program, Colorado School of Mines, Golden, CO
80401, USA. † Electronic Supplementary Information (ESI) available. See DOI: 10.1039/x0xx00000x
Page 1 of 13 Journal of Materials Chemistry C
ARTICLE Journal Name
2 | J. Name., 2012, 00, 1-3 This journal is © The Royal Society of Chemistry 20xx
Please do not adjust margins
Please do not adjust margins
equivalent (1.30 and 1.31 Å, respectively, for CN = IX),26 and that
their chemistry is astoundingly similar,27 it is not unreasonable
to imagine that TODGA would only poorly extract Eu(II) and
desorb it from TODGA-loaded carbonaceous EXC materials
consisting of ordered mesoporous carbon (OMC).
Like other neutral, solvating extractants, TODGA tends to
form reverse micelles with hydrophilic cores and hydrophobic
ends. The exposed octyl chains create a lipophilic environment
and may be involved in extended intermolecular interactions.28,
29 The addition of modifiers, such as 2-octanol, break up the
TODGA reverse micelles and hydrogen-bonding networks.28, 29
The 2-octanol acts as a wetting agent, decreasing the
lipophilicity of the extractant and allowing for greater diffusion
of analytes within the extractant.
Considerable attention has been given to OMC since its
development by Ryoo et al. in 1999.30 The graphitic nature of
OMC, giving rise to its electrical conductivity,31 has attracted
research efforts for use in energy conversion and storage,32-35
catalysts,36-42 electrochemical sensors,34, 43-48 and biosensors.34,
49-52 The desirable electrochemical properties of OMC stem
from its highly ordered pore structure—allowing for fast
diffusion of the analyte—and its high surface area.44, 53
Furthermore, hard-templated OMC enables improved analyte
diffusion, with larger average mesopore diameters, than soft-
templated OMC. The large electroactive surface area of OMC
results in a high specific capacitance desirable for electrical
double-layer capacitor applications.35 OMC materials are also
resistant to acidic and basic environments, making them ideal
lanthanide adsorbents.54
Generally, there are two methods to employ OMC materials
in electrochemical devices. The first method uses OMC as the
bulk material for carbon paste electrodes (CPE), while the
second method uses the OMC as a thin surface coating on a
solid electrode to produce a mesoporous carbon-modified
electrode.44, 49 In the present study, OMC and Vulcan® XC-72
were used as bulk conducting powders in cavity microelectrode
(CME) voltammetry studies of the one-electron reduction of
Eu(III) to Eu(II). The prospect for the electrochemical separation
of Eu from trivalent lanthanides by reductive stripping was also
examined by physisorbing OMC with TODGA (and TODGA
modified with 2-octanol) for use in the CME. Insights into the
non-Faradaic responses of the OMCs, as well as the Faradaic
responses associated with the Eu(III)/Eu(II) couple for the Eu-
TODGA complexes on the OMC systems by use of CME
voltammetry, are cast in context of general developments in the
chemistry of Eu(II) for applications in synthesis, medicine, and
energy sciences.55, 56 In this vein, the redox properties of Eu
complexes with prospective application as MRI ligands57 and in
systems of relevance to hydrothermal geochemistry58 have
been studied extensively.
Experimental
Reagents
The l-MSN (large pore mesoporous silica nanoparticle) template
was prepared according to previously reported literature.59
Vulcan XC-72 was obtained from Cabot specialty carbon blacks.
The extractant used was N,N,N’,N’-tetra-n-octyl diglycolamide
(TODGA, Marshallton Research Laboratories Incorporated).
Sulfuric acid (98%) and optima grade nitric acid (69%) were
obtained from Fisher Scientific. Sucrose, Eu(NO3)3·5H2O, LiNO3,
and 2-octanol were purchased from Sigma-Aldrich. All
chemicals were used as received. Ultrapure (> 18.2 MΩ cm)
deionized water was used for all aqueous solutions and carbon
synthesis steps.
Instrumentation
Europium extractions were completed using an Eppendorf
ThermoMixer C and Eppendorf Centrifuge 5702 RH. Small scale
europium extractions employed a VWR vortex mixer and BD
Clay Adams Compact II Centrifuge. The gross 152/154Eu(III)
gamma activity was monitored using a Packard Cobra II NaI(Tl)
solid scintillation auto-gamma counter. Voltammetry data were
obtained using a BAS 100B/W electrochemical analyzer, BASi
reference electrode (Ag/AgCl, BASi MR-2052), Pt rod (0.064”
diam.) auxiliary electrode, and a Pt wire cavity microelectrode
(previously prepared in-house as described elsewhere)60 with a
microcavity of approximately 100 µm i.d. × 30 µm.
Synthesis of OMC
Large-pore ordered mesoporous carbon (OMC) was synthesized
as previously described using a hard-templating method.59 In a
ceramic crucible, 2 g of l-MSN (BET surface area: 337 m2 g–1; BJH
pore volume: 1.2 cm3 g–1) was dry mixed with 1.2 g of sucrose
followed by the addition of 5.0 mL of water. After hand stirring
until aggregate-free, 200 µL of concentrated sulfuric acid was
pipetted into the suspension and mixed for 5 min by hand.
During this time, approximately 2.0 mL of water was added to
resuspend any OMC aggregated on the crucible sidewalls. The
crucible was then placed into an air convection oven at 100 °C
for 6 hr followed by 160 °C for 6 hr to drive partial carbonization
of the polymerized glucose framework. This process was then
repeated three more times adding 0.89 g, 0.12 g, and 0.21 g of
sucrose, respectively, to ensure complete casting of the carbon
precursor within the silica template pores. After this, the
sample was loaded into a quartz combustion boat and
carbonized in a horizontal tube furnace. Under argon flow of
150 sccm, the sucrose-OMC powder was heated from ambient
to 600 °C (ramp rate 6.5 °C min-1), 600 to 900 °C (ramp rate 1 °C
min-1), and held static at 900 °C for 6 hr. After cooling, the
sample was divided into two 50 mL plastic centrifuge tubes and
etched with 35 mL of 10% hydrofluoric acid overnight. The
suspensions were centrifuged at 3750 ×g for 10 min, decanted,
and washed with 35 mL of water. Three more water washes
were followed by an ethanol wash to ensure removal of any
residual fluoride ions. After decanting the ethanol, the wetted
OMC was dried overnight in an open-air oven at 80 °C.
TODGA and TODGA/2-octanol physisorption
Functionalized electrode materials were prepared by
suspending approximately 250 mg of OMC in 2.0 mL of
methanol in a 15 mL plastic centrifuge tube. The suspension was
Page 2 of 13Journal of Materials Chemistry C
Journal Name ARTICLE
This journal is © The Royal Society of Chemistry 20xx J. Name., 2013, 00, 1-3 | 3
Please do not adjust margins
Please do not adjust margins
disaggregated in an ultrasonic bath for 5 min prior to the next
step. A solution containing 145.2 mg of TODGA and 19.7 mg of
2-octanol, or 69.6 mg of TODGA and 55.4 mg of 2-octanol in 1.0
mL of methanol was added to the OMC suspension. Samples
with TODGA only were loaded in two rounds with 100 mg of
TODGA in 1.0 mL methanol each. Drying in an open-air oven at
80 °C overnight furnished the OMC surface with the extractant
and surface modifier.
OMC material characterization
Nitrogen sorption analysis was performed using a Micromeritics
TriStar II Surface Area and Porosity instrument. Prior to each
analysis, approximately 100.0 mg of OMC was loaded into a
sample tube and degassed under nitrogen flow at 60 °C for 6 hr.
The surface area was obtained from Brunauer-Emmett-Teller
(BET) theory derived from the adsorption branch in the range of
0.05 < P/P0 < 0.30, while pore volume and pore-size
distributions were computed from Barrett, Joyner and Helenda
method from the desorption branch of the isotherms. Isotherm
morphology was used to qualitatively affirm the porosity of the
materials. The TGA experiments were run on a TA Instrument
Q50 Thermogravimetric Analyzer with a ceramic sample pan
and a constant nitrogen flow of 50 mL min–1. Approximately 20
mg of sample was loaded into the pan and subjected to a
constant heat rate of 10 °C min–1 from ambient to 800 °C. The
loadings of 2-octanol and TODGA onto the OMC were
determined by defining the regions of mass loss (30 °C < 2-
octanol < 250 °C < TODGA < 440 °C).
Europium extraction by functionalized OMC
A 1 M HNO3 concentration was chosen to facilitate sufficient
Eu(III) extraction by TODGA. As a neutral, solvating ligand,
TODGA extracts the trivalent lanthanides under moderate to
high nitric acid conditions.61 The acidic europium(III) nitrate
solutions were prepared by dissolving Eu(NO3)3·5H2O in 1 M
HNO3 so that the initial Eu(III) concentrations were 0.050 and
0.425 M. A 9 mL aliquot of the Eu(III) solution was then
contacted with 90 mg of functionalized OMC material in a 15 mL
centrifuge tube. Contacts were made at ambient temperature
(23 °C) for 60 min followed by centrifugation at 3000 × g with
the Eppendorf 5702 RH. The aqueous phase was removed using
a fine tip plastic transfer pipet. The remaining damp Eu-loaded
OMC material was transferred to folded weigh paper and
sandwiched to remove excess aqueous solution. The OMC
material was then left to dry in air before transferring to a
microcentrifuge tube for storage.
The extraction process was also done on a small scale using
5 mg of functionalized OMC, 0.495 mL of Eu(III) solution, and 5
µL of an approximately 3.5 mM 152/154Eu(III) radiotracer in 0.001
M HNO3 (prepared as previously described by Drader et al.).62
After contacting, 350 µL aliquots of the supernatant aqueous
phase was taken for gross gamma counting. The activity of the
functionalized OMC was determined by delta calculation. These
values were used to approximate the Eu(III) loading in the
functionalized OMC electrode materials.
Cavity microelectrode preparation
A small mass of carbonaceous material was placed on a
microscope slide. Any aggregated material was manually
broken up between weigh paper using a glass stir rod. The cavity
microelectrode was filled by firmly pressing the empty cavity
against the carbonaceous material on the microscope slide.
Filling of the cavity was confirmed using a magnifying glass prior
to use. After use, the CME was cleaned by sonicating for 10 s in
ethanol followed by sonication for 10 s in water. The CME was
then dried in air before packing with new material.
Voltammetry
Differential pulse voltammetry (DPV) and cyclic voltammetry
(CV) data were collected at room temperature (23 °C) in 1 M
LiNO3 (pH 6.7), unless otherwise stated. The DPV data were
acquired at 20 mV s–1. For three-phase-electrode
voltammetry,63-65 a 5 mL solution of 0.5 M TODGA in n-
dodecane was contacted with an equal volume of a 0.6 M
Eu(NO3)3–3 M LiNO3 solution at ambient temperature, 21 ± 0.5
°C, according to standard techniques in LLE. The clear and
colorless third phase in the usual location between the bottom,
aqueous equilibrium phase and the upper, organic equilibrium
phase was isolated for voltammetry.
Results and discussion
OMC material properties
The BET surface area and pore characteristics for the electrode
materials are given in Table 1 (see ESI† Figure S1). The nitrogen
physisorption isotherms reveal a high surface area (1241 m2 g–
1) for the OMC. Pore volume distributions gleaned from the
desorption branch for OMC show a pore diameter c.a. 5 nm
with a narrow distribution (ESI† Figure S1, inset). Further
characterization, including TEM images and low angle XRD, are
provided in the ESI† (Figures S2 and S3, respectively). As
expected, with the addition of TODGA or TODGA/2-octanol the
surface area and average pore width decrease.59 The TGA
results are shown in ESI† Figure S4. The repeated TODGA
loading for the OMC sample without 2-octanol afforded the
highest weight percent loading (34 wt% TODGA). The 2-octanol
modified samples show deviations from the theoretical loadings
of about 35 wt% TODGA/5 wt% 2-octanol and 19 wt%
TODGA/15 wt% 2-octanol. TGA show the actual extractant
loadings to be 22 wt% TODGA/4 wt% 2-octanol and 16 wt%
TODGA/8 wt% 2-octanol, respectively.
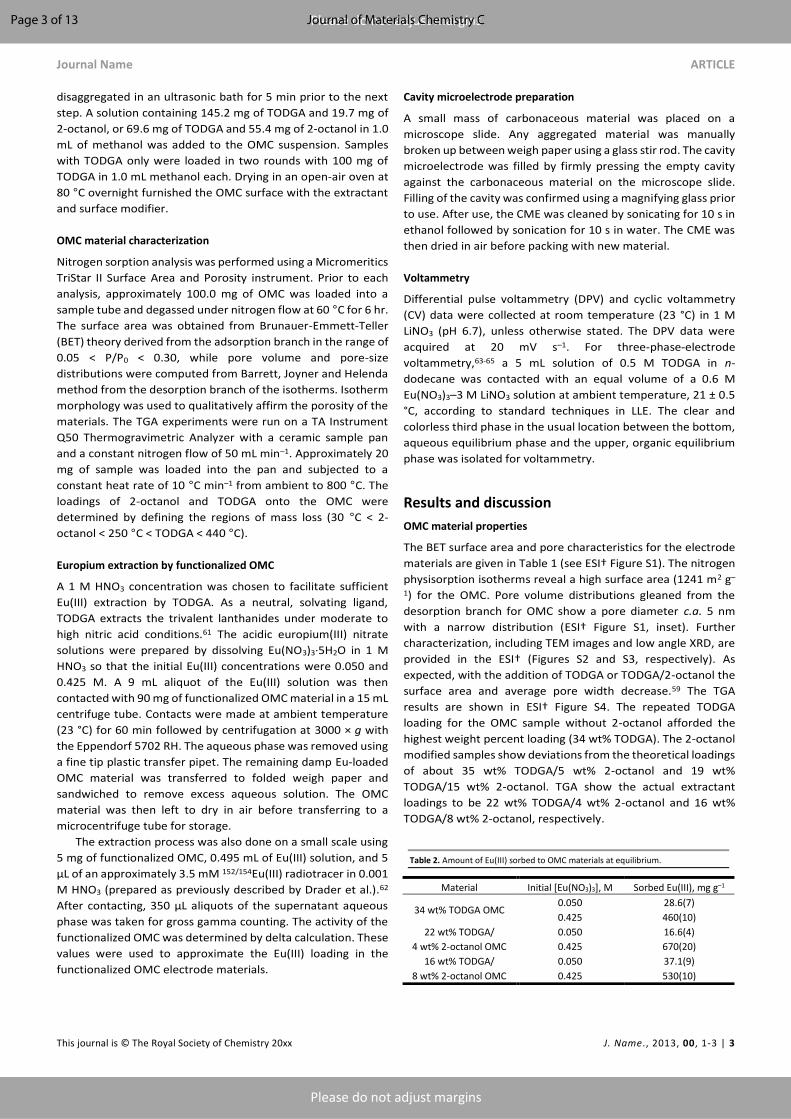
Table 2. Amount of Eu(III) sorbed to OMC materials at equilibrium.
Material Initial [Eu(NO3)3], M Sorbed Eu(III), mg g–1
34 wt% TODGA OMC 0.050 28.6(7)
0.425 460(10)
22 wt% TODGA/
4 wt% 2-octanol OMC
0.050 16.6(4)
0.425 670(20)
16 wt% TODGA/
8 wt% 2-octanol OMC
0.050 37.1(9)
0.425 530(10)
Page 3 of 13 Journal of Materials Chemistry C
ARTICLE Journal Name
4 | J. Name., 2012, 00, 1-3 This journal is © The Royal Society of Chemistry 20xx
Please do not adjust margins
Please do not adjust margins
Europium extraction by functionalized OMC
Europium(III) extraction by 34 wt% TODGA OMC, 22 wt%
TODGA/4 wt% 2-octanol OMC, and 16 wt% TODGA/8 wt% 2-
octanol OMC was determined using a 152/154Eu(III) radiotracer
following Equation 2:
𝑞𝑒 = (𝐴0−𝐴
𝐴0) (
𝑉
𝑚) 𝐶0 (2)
where qe is moles Eu(III) sorbed per g of solid material at
equilibrium, A0 and A are the activities (cpm) of the aqueous
phase before and after equilibrium, respectively, V is the
volume (L) of the aqueous phase, m is the mass (g) of the solid
material, and C0 is the initial molar concentration of Eu(III) in the
aqueous phase. Table 2 shows the initial Eu(III) concentrations
and the approximate Eu(III) sorbed onto the functionalized
OMC materials. All contacts were done once. Errors shown are
± 1σ determined from the counting statistics propagated
through the calculation. The amount of sorbed Eu(III) found in
the radiotracer studies was assumed to reflect the Eu(III) sorbed
on the materials in the bulk extractions.
Carbonaceous CME capacitance
Capacitance measurements were made as a baseline
characterization of the CME materials and demonstrate that no
faradaic response occurs with the functionalization by TODGA
or modification with 2-octanol. OMC materials are graphitic,
mesoporous, and have a high surface area, making them
suitable candidates in electrical double-layer capacitor
applications.56, 67 Pristine Vulcan XC-72 was used as a
comparative conductive porous carbonaceous material for the
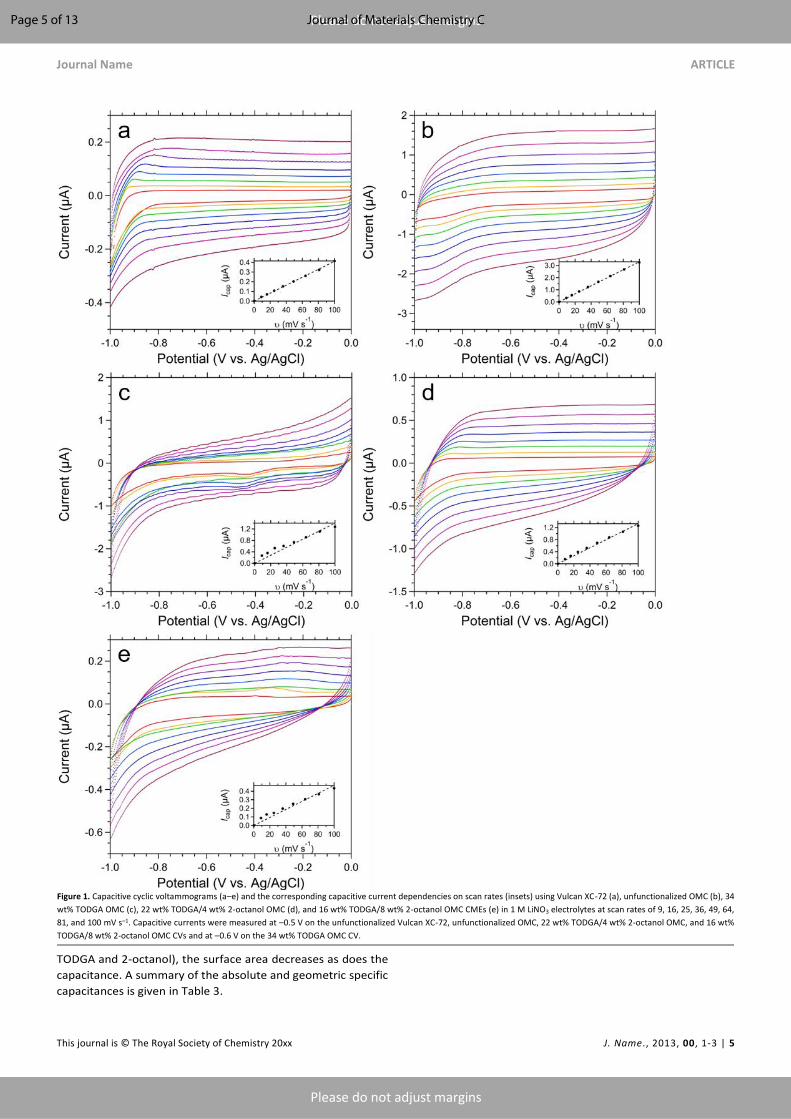
unfunctionalized OMC. The capacitance of the materials was
determined from CV data collected at scan rates of 9–100 mV s–
1 in the polarization window of –1.0 to 0.0 V. The data for both
materials exhibit a flat and featureless response with a
rectangular shape (Figures 1a and b) indicative of a electrical
double-layer capacitor,68 albeit with distortion most prominent
between –0.8 and –1.0 V. The capacitance was calculated using
Equation 3:69
|𝐼𝑎 − 𝐼𝑐| = 2𝐶(d𝑉/d𝑡) (3)
where Ia and Ic are the anodic and cathodic currents (A),
respectively, C is the capacitance (F), and dV/dt is the scan rate
(mV s–1). The capacitive currents for the Vulcan XC-72 and
unfunctionalized OMC were measured at –0.5 V.
Previous work by Zhou et al.70 established that both surface
area and porosity play a significant role in the capacitance of
carbonaceous materials. Specifically, higher surface area
increases capacitance but only if the surface area is accessible
to the electrolyte ions. That is, the surface area created by
micropores is negated in its influence for capacitance;
therefore, high mesoporosity is desirable in the design of
carbon-based electrical double-layer capacitors. The Vulcan XC-
72 has a wide distribution of porosity, including micropores (<
2 nm), whereas the pore size distribution for the OMC is
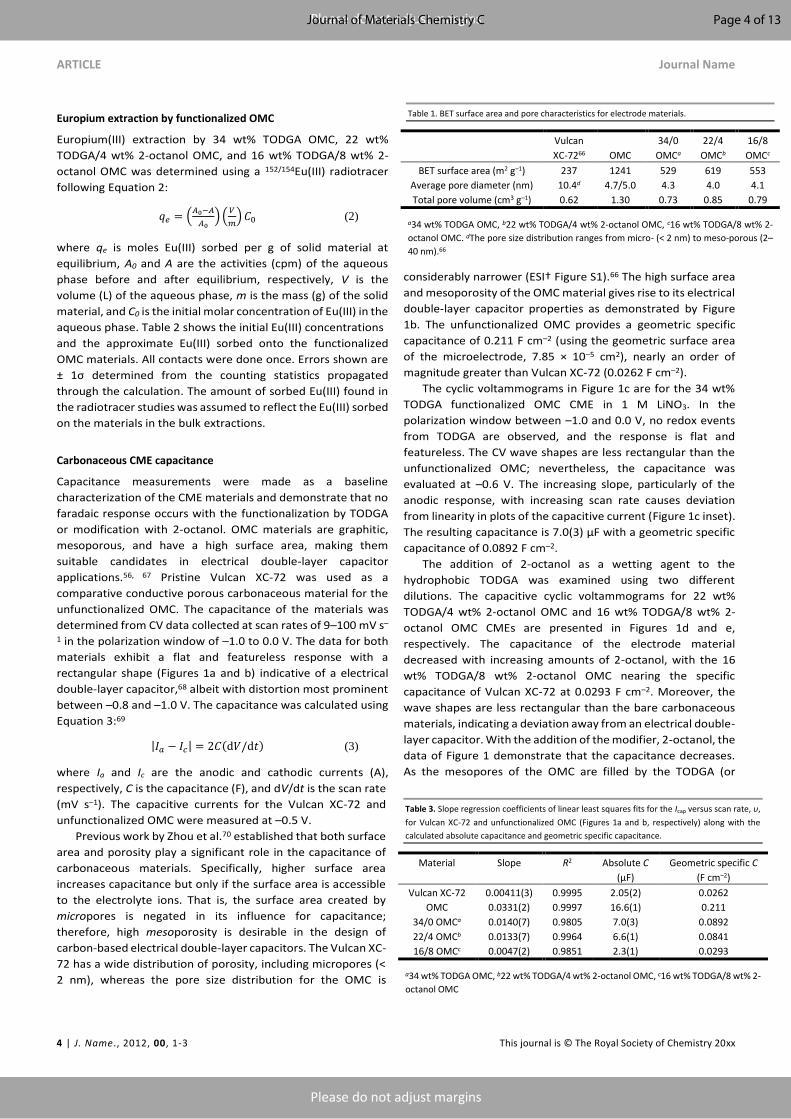
considerably narrower (ESI† Figure S1).66 The high surface area
and mesoporosity of the OMC material gives rise to its electrical
double-layer capacitor properties as demonstrated by Figure
1b. The unfunctionalized OMC provides a geometric specific
capacitance of 0.211 F cm–2 (using the geometric surface area
of the microelectrode, 7.85 × 10⁻⁵ cm2), nearly an order of
magnitude greater than Vulcan XC-72 (0.0262 F cm–2).
The cyclic voltammograms in Figure 1c are for the 34 wt%
TODGA functionalized OMC CME in 1 M LiNO3. In the
polarization window between –1.0 and 0.0 V, no redox events
from TODGA are observed, and the response is flat and
featureless. The CV wave shapes are less rectangular than the
unfunctionalized OMC; nevertheless, the capacitance was
evaluated at –0.6 V. The increasing slope, particularly of the
anodic response, with increasing scan rate causes deviation
from linearity in plots of the capacitive current (Figure 1c inset).
The resulting capacitance is 7.0(3) µF with a geometric specific
capacitance of 0.0892 F cm–2.
The addition of 2-octanol as a wetting agent to the
hydrophobic TODGA was examined using two different
dilutions. The capacitive cyclic voltammograms for 22 wt%
TODGA/4 wt% 2-octanol OMC and 16 wt% TODGA/8 wt% 2-
octanol OMC CMEs are presented in Figures 1d and e,
respectively. The capacitance of the electrode material
decreased with increasing amounts of 2-octanol, with the 16
wt% TODGA/8 wt% 2-octanol OMC nearing the specific
capacitance of Vulcan XC-72 at 0.0293 F cm–2. Moreover, the
wave shapes are less rectangular than the bare carbonaceous
materials, indicating a deviation away from an electrical double-
layer capacitor. With the addition of the modifier, 2-octanol, the
data of Figure 1 demonstrate that the capacitance decreases.
As the mesopores of the OMC are filled by the TODGA (or
Table 1. BET surface area and pore characteristics for electrode materials.
Vulcan
XC-7266 OMC
34/0
OMCa
22/4
OMCb
16/8
OMCc
BET surface area (m2 g–1) 237 1241 529 619 553
Average pore diameter (nm) 10.4d 4.7/5.0 4.3 4.0 4.1
Total pore volume (cm3 g–1) 0.62 1.30 0.73 0.85 0.79
a34 wt% TODGA OMC, b22 wt% TODGA/4 wt% 2-octanol OMC, c16 wt% TODGA/8 wt% 2-
octanol OMC. dThe pore size distribution ranges from micro- (< 2 nm) to meso-porous (2–
40 nm).66
Table 3. Slope regression coefficients of linear least squares fits for the Icap versus scan rate, υ,
for Vulcan XC-72 and unfunctionalized OMC (Figures 1a and b, respectively) along with the
calculated absolute capacitance and geometric specific capacitance.
Material Slope R2 Absolute C
(µF)
Geometric specific C
(F cm–2)
Vulcan XC-72 0.00411(3) 0.9995 2.05(2) 0.0262
OMC 0.0331(2) 0.9997 16.6(1) 0.211
34/0 OMCa 0.0140(7) 0.9805 7.0(3) 0.0892
22/4 OMCb 0.0133(7) 0.9964 6.6(1) 0.0841
16/8 OMCc 0.0047(2) 0.9851 2.3(1) 0.0293
a34 wt% TODGA OMC, b22 wt% TODGA/4 wt% 2-octanol OMC, c16 wt% TODGA/8 wt% 2-
octanol OMC
Page 4 of 13Journal of Materials Chemistry C
Journal Name ARTICLE
This journal is © The Royal Society of Chemistry 20xx J. Name., 2013, 00, 1-3 | 5
Please do not adjust margins
Please do not adjust margins
TODGA and 2-octanol), the surface area decreases as does the
capacitance. A summary of the absolute and geometric specific
capacitances is given in Table 3.
Figure 1. Capacitive cyclic voltammograms (a–e) and the corresponding capacitive current dependencies on scan rates (insets) using Vulcan XC-72 (a), unfunctionalized OMC (b), 34
wt% TODGA OMC (c), 22 wt% TODGA/4 wt% 2-octanol OMC (d), and 16 wt% TODGA/8 wt% 2-octanol OMC CMEs (e) in 1 M LiNO3 electrolytes at scan rates of 9, 16, 25, 36, 49, 64,
81, and 100 mV s–1. Capacitive currents were measured at –0.5 V on the unfunctionalized Vulcan XC-72, unfunctionalized OMC, 22 wt% TODGA/4 wt% 2-octanol OMC, and 16 wt%
TODGA/8 wt% 2-octanol OMC CVs and at –0.6 V on the 34 wt% TODGA OMC CV.
Page 5 of 13 Journal of Materials Chemistry C
ARTICLE Journal Name
6 | J. Name., 2012, 00, 1-3 This journal is © The Royal Society of Chemistry 20xx
Please do not adjust margins
Please do not adjust margins
Electrochemical behavior of the Eu(III)/Eu(II) redox couple using
unfunctionalized carbonaceous CMEs
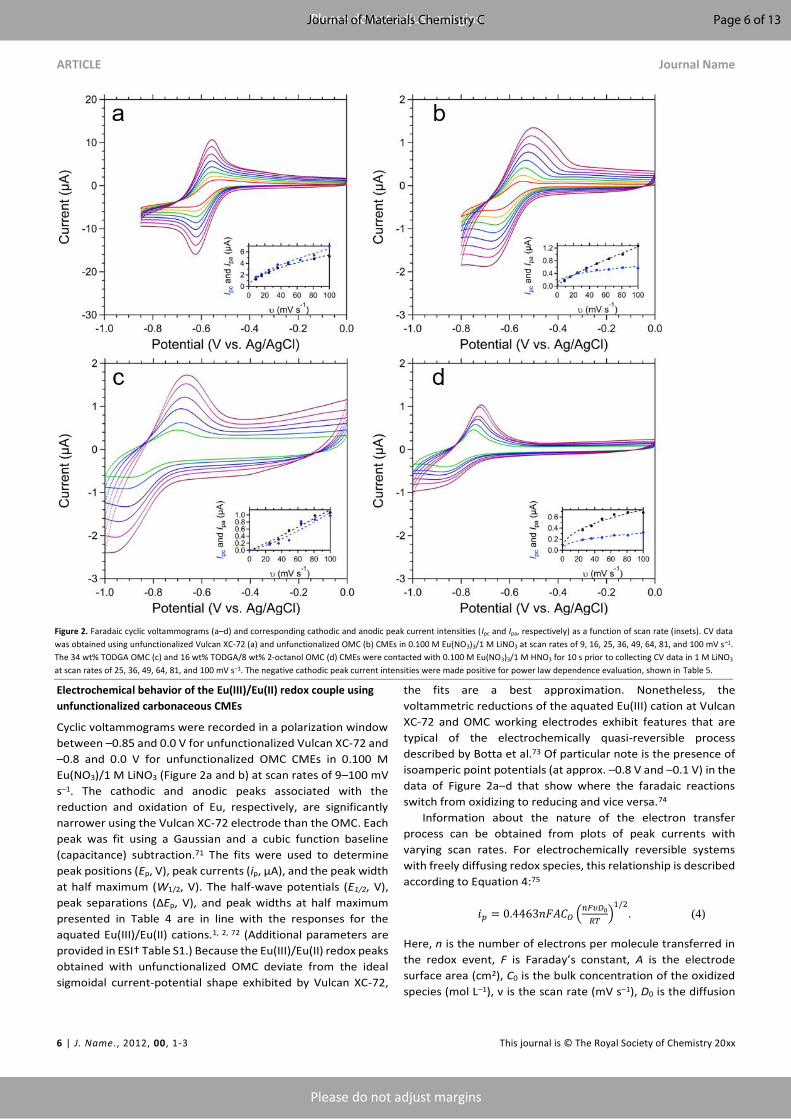
Cyclic voltammograms were recorded in a polarization window
between –0.85 and 0.0 V for unfunctionalized Vulcan XC-72 and
–0.8 and 0.0 V for unfunctionalized OMC CMEs in 0.100 M
Eu(NO3)/1 M LiNO3 (Figure 2a and b) at scan rates of 9–100 mV
s–1. The cathodic and anodic peaks associated with the
reduction and oxidation of Eu, respectively, are significantly
narrower using the Vulcan XC-72 electrode than the OMC. Each
peak was fit using a Gaussian and a cubic function baseline
(capacitance) subtraction.71 The fits were used to determine
peak positions (Ep, V), peak currents (ip, µA), and the peak width
at half maximum (W1/2, V). The half-wave potentials (E1/2, V),
peak separations (ΔEp, V), and peak widths at half maximum
presented in Table 4 are in line with the responses for the
aquated Eu(III)/Eu(II) cations.1, 2, 72 (Additional parameters are
provided in ESI† Table S1.) Because the Eu(III)/Eu(II) redox peaks
obtained with unfunctionalized OMC deviate from the ideal
sigmoidal current-potential shape exhibited by Vulcan XC-72,
the fits are a best approximation. Nonetheless, the
voltammetric reductions of the aquated Eu(III) cation at Vulcan
XC-72 and OMC working electrodes exhibit features that are
typical of the electrochemically quasi-reversible process
described by Botta et al.73 Of particular note is the presence of
isoamperic point potentials (at approx. –0.8 V and –0.1 V) in the
data of Figure 2a–d that show where the faradaic reactions
switch from oxidizing to reducing and vice versa.74
Information about the nature of the electron transfer
process can be obtained from plots of peak currents with
varying scan rates. For electrochemically reversible systems
with freely diffusing redox species, this relationship is described
according to Equation 4:75
𝑖𝑝 = 0.4463𝑛𝐹𝐴𝐶𝑂 (𝑛𝐹𝜐𝐷0
𝑅𝑇)1/2
. (4)
Here, n is the number of electrons per molecule transferred in
the redox event, F is Faraday’s constant, A is the electrode
surface area (cm2), C0 is the bulk concentration of the oxidized
species (mol L–1), ν is the scan rate (mV s–1), D0 is the diffusion
Figure 2. Faradaic cyclic voltammograms (a–d) and corresponding cathodic and anodic peak current intensities (Ipc and Ipa, respectively) as a function of scan rate (insets). CV data
was obtained using unfunctionalized Vulcan XC-72 (a) and unfunctionalized OMC (b) CMEs in 0.100 M Eu(NO3)3/1 M LiNO3 at scan rates of 9, 16, 25, 36, 49, 64, 81, and 100 mV s–1.
The 34 wt% TODGA OMC (c) and 16 wt% TODGA/8 wt% 2-octanol OMC (d) CMEs were contacted with 0.100 M Eu(NO3)3/1 M HNO3 for 10 s prior to collecting CV data in 1 M LiNO3
at scan rates of 25, 36, 49, 64, 81, and 100 mV s–1. The negative cathodic peak current intensities were made positive for power law dependence evaluation, shown in Table 5.
Page 6 of 13Journal of Materials Chemistry C
Journal Name ARTICLE
This journal is © The Royal Society of Chemistry 20xx J. Name., 2013, 00, 1-3 | 7
Please do not adjust margins
Please do not adjust margins
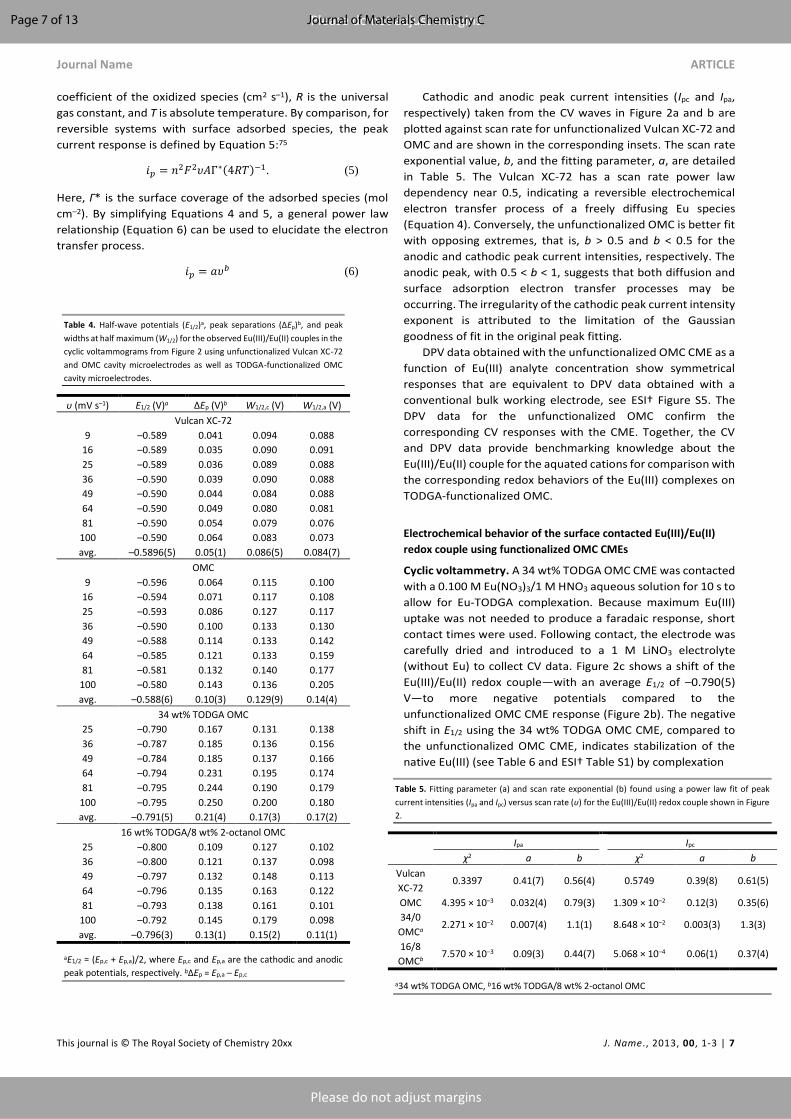
coefficient of the oxidized species (cm2 s–1), R is the universal
gas constant, and T is absolute temperature. By comparison, for
reversible systems with surface adsorbed species, the peak
current response is defined by Equation 5:75
𝑖𝑝 = 𝑛2𝐹2𝜐𝐴Γ∗(4𝑅𝑇)−1. (5)
Here, Γ* is the surface coverage of the adsorbed species (mol
cm–2). By simplifying Equations 4 and 5, a general power law
relationship (Equation 6) can be used to elucidate the electron
transfer process.
𝑖𝑝 = 𝑎𝜐𝑏 (6)
Cathodic and anodic peak current intensities (Ipc and Ipa,
respectively) taken from the CV waves in Figure 2a and b are
plotted against scan rate for unfunctionalized Vulcan XC-72 and
OMC and are shown in the corresponding insets. The scan rate
exponential value, b, and the fitting parameter, a, are detailed
in Table 5. The Vulcan XC-72 has a scan rate power law
dependency near 0.5, indicating a reversible electrochemical
electron transfer process of a freely diffusing Eu species
(Equation 4). Conversely, the unfunctionalized OMC is better fit
with opposing extremes, that is, b > 0.5 and b < 0.5 for the
anodic and cathodic peak current intensities, respectively. The
anodic peak, with 0.5 < b < 1, suggests that both diffusion and
surface adsorption electron transfer processes may be
occurring. The irregularity of the cathodic peak current intensity
exponent is attributed to the limitation of the Gaussian
goodness of fit in the original peak fitting.
DPV data obtained with the unfunctionalized OMC CME as a
function of Eu(III) analyte concentration show symmetrical
responses that are equivalent to DPV data obtained with a
conventional bulk working electrode, see ESI† Figure S5. The
DPV data for the unfunctionalized OMC confirm the
corresponding CV responses with the CME. Together, the CV
and DPV data provide benchmarking knowledge about the
Eu(III)/Eu(II) couple for the aquated cations for comparison with
the corresponding redox behaviors of the Eu(III) complexes on
TODGA-functionalized OMC.
Electrochemical behavior of the surface contacted Eu(III)/Eu(II)
redox couple using functionalized OMC CMEs
Cyclic voltammetry. A 34 wt% TODGA OMC CME was contacted
with a 0.100 M Eu(NO3)3/1 M HNO3 aqueous solution for 10 s to
allow for Eu-TODGA complexation. Because maximum Eu(III)
uptake was not needed to produce a faradaic response, short
contact times were used. Following contact, the electrode was
carefully dried and introduced to a 1 M LiNO3 electrolyte
(without Eu) to collect CV data. Figure 2c shows a shift of the
Eu(III)/Eu(II) redox couple—with an average E1/2 of –0.790(5)
V—to more negative potentials compared to the
unfunctionalized OMC CME response (Figure 2b). The negative
shift in E1/2 using the 34 wt% TODGA OMC CME, compared to
the unfunctionalized OMC CME, indicates stabilization of the
native Eu(III) (see Table 6 and ESI† Table S1) by complexation
Table 4. Half-wave potentials (E1/2)a, peak separations (ΔEp)b, and peak
widths at half maximum (W1/2) for the observed Eu(III)/Eu(II) couples in the
cyclic voltammograms from Figure 2 using unfunctionalized Vulcan XC-72
and OMC cavity microelectrodes as well as TODGA-functionalized OMC
cavity microelectrodes.
υ (mV s–1) E1/2 (V)a ΔEp (V)b W1/2,c (V) W1/2,a (V)
Vulcan XC-72
9 –0.589 0.041 0.094 0.088
16 –0.589 0.035 0.090 0.091
25 –0.589 0.036 0.089 0.088
36 –0.590 0.039 0.090 0.088
49 –0.590 0.044 0.084 0.088
64 –0.590 0.049 0.080 0.081
81 –0.590 0.054 0.079 0.076
100 –0.590 0.064 0.083 0.073
avg. –0.5896(5) 0.05(1) 0.086(5) 0.084(7)
OMC
9 –0.596 0.064 0.115 0.100
16 –0.594 0.071 0.117 0.108
25 –0.593 0.086 0.127 0.117
36 –0.590 0.100 0.133 0.130
49 –0.588 0.114 0.133 0.142
64 –0.585 0.121 0.133 0.159
81 –0.581 0.132 0.140 0.177
100 –0.580 0.143 0.136 0.205
avg. –0.588(6) 0.10(3) 0.129(9) 0.14(4)
34 wt% TODGA OMC
25 –0.790 0.167 0.131 0.138
36 –0.787 0.185 0.136 0.156
49 –0.784 0.185 0.137 0.166
64 –0.794 0.231 0.195 0.174
81 –0.795 0.244 0.190 0.179
100 –0.795 0.250 0.200 0.180
avg. –0.791(5) 0.21(4) 0.17(3) 0.17(2)
16 wt% TODGA/8 wt% 2-octanol OMC
25 –0.800 0.109 0.127 0.102
36 –0.800 0.121 0.137 0.098
49 –0.797 0.132 0.148 0.113
64 –0.796 0.135 0.163 0.122
81 –0.793 0.138 0.161 0.101
100 –0.792 0.145 0.179 0.098
avg. –0.796(3) 0.13(1) 0.15(2) 0.11(1)
aE1/2 = (Ep,c + Ep,a)/2, where Ep,c and Ep,a are the cathodic and anodic
peak potentials, respectively. bΔEp = Ep,a – Ep,c
Table 5. Fitting parameter (a) and scan rate exponential (b) found using a power law fit of peak
current intensities (Ipa and Ipc) versus scan rate (υ) for the Eu(III)/Eu(II) redox couple shown in Figure
2.
Ipa Ipc
χ2 a b χ2 a b
Vulcan
XC-72 0.3397 0.41(7) 0.56(4) 0.5749 0.39(8) 0.61(5)
OMC 4.395 × 10⁻³ 0.032(4) 0.79(3) 1.309 × 10⁻² 0.12(3) 0.35(6)
34/0
OMCa 2.271 × 10⁻² 0.007(4) 1.1(1) 8.648 × 10⁻² 0.003(3) 1.3(3)
16/8
OMCb 7.570 × 10⁻³ 0.09(3) 0.44(7) 5.068 × 10⁻⁴ 0.06(1) 0.37(4)
a34 wt% TODGA OMC, b16 wt% TODGA/8 wt% 2-octanol OMC
Page 7 of 13 Journal of Materials Chemistry C
ARTICLE Journal Name
8 | J. Name., 2012, 00, 1-3 This journal is © The Royal Society of Chemistry 20xx
Please do not adjust margins
Please do not adjust margins
with TODGA. Metal-ligand complexation, in general, stabilizes
the higher oxidation state of metal ions, here Eu(III). For
example, CV measurements of Eu macrocycles by Tóth et al.72
reveal stabilization of Eu(III). This situation is manifest by the
electrode potentials for the Eu(III)/Eu(II) couples of the
macrocycle complexes (with ODDA, ODDM, DOTA, and DTPA)‡
that are more negative than that for the simple aquated cation,
much like what is observed here. That is, coordination does not
stabilize Eu(II). The non-sigmoidal shapes of the redox peaks in
Figure 2c makes quantitative analysis difficult, particularly for
the cathodic peak. The anodic and cathodic peak currents were
not linearly proportional to either the scan rate or the square
root of the scan rate as demonstrated by the power law fit
(Figure 2c inset) according to Equation 6.
Figure 2d shows the CV data acquired for the CME consisting
of 16 wt% TODGA/8 wt% 2-octanol OMC contacted with 0.100
M Eu(NO3)3/1 M HNO3. The addition of 2-octanol exhibits a
striking difference in the CV wave shape, especially for the
anodic peak, compared to the response (Figure 2c) without 2-
octanol. Nonetheless, the average E1/2 for the 2-octanol
modified TODGA OMC is –0.796(3) V, very similar to the 34 wt%
TODGA OMC (average E1/2 = –0.790(5) V). The anodic peak for
the 16 wt% TODGA/8 wt% 2-octanol OMC is about 0.060 V
narrower than the 34 wt% TODGA OMC (see Table 4).
The non-ideal (i.e., non-Nernstian) faradaic behavior of the
Eu(III)/Eu(II) couple with the OMC electrodes—both
unfunctionalized and functionalized (Figure 2b-d)—may be due
to insufficient diffusion of Eu ions within the OMC pores. The
OMC material, and particularly the TODGA-functionalized OMC
systems, are hydrophobic. This property will inhibit the
diffusion of the aqueous electrolyte within the mesopores.
Another contribution to the non-ideal behavior of the OMC
systems is attributed to the packing of the material into the CME
as the packing process may cause some physical blockage of the
channels and disrupt uniform pore distribution. Even though
the packing process produces fresh electrodes, there are
inevitable variations that lead to subtly different CMEs each
time one is made.
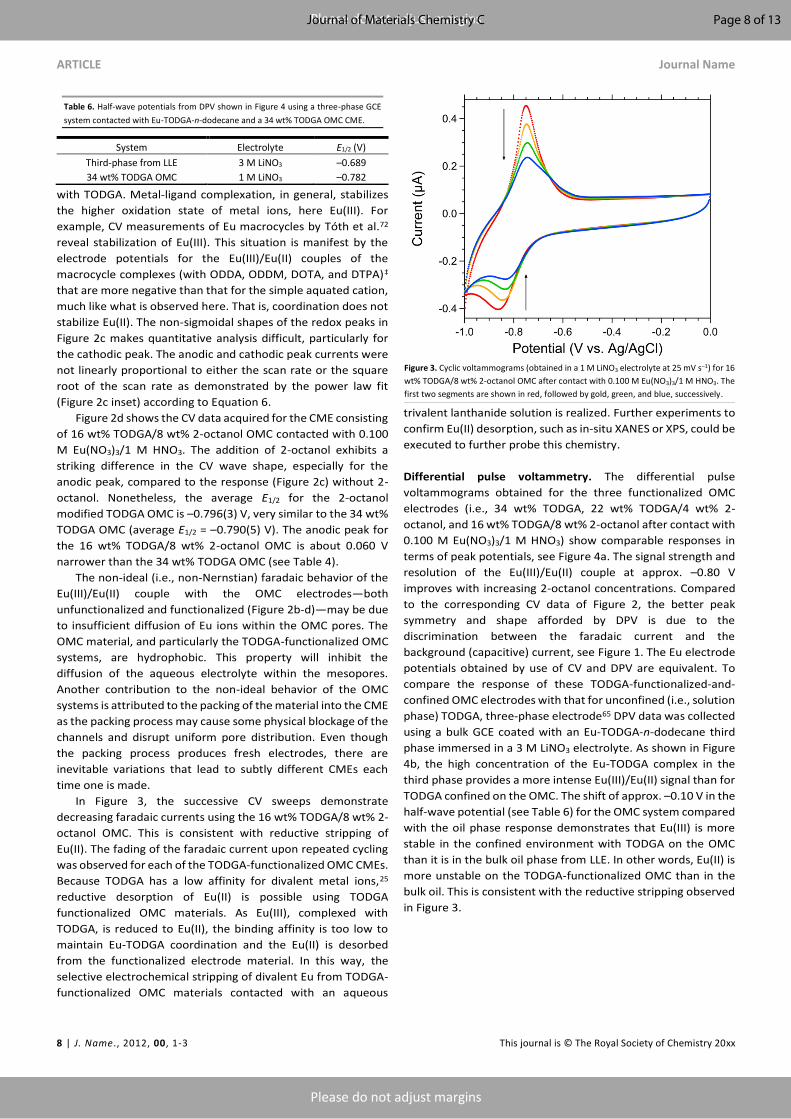
In Figure 3, the successive CV sweeps demonstrate
decreasing faradaic currents using the 16 wt% TODGA/8 wt% 2-
octanol OMC. This is consistent with reductive stripping of
Eu(II). The fading of the faradaic current upon repeated cycling
was observed for each of the TODGA-functionalized OMC CMEs.
Because TODGA has a low affinity for divalent metal ions,25
reductive desorption of Eu(II) is possible using TODGA
functionalized OMC materials. As Eu(III), complexed with
TODGA, is reduced to Eu(II), the binding affinity is too low to
maintain Eu-TODGA coordination and the Eu(II) is desorbed
from the functionalized electrode material. In this way, the
selective electrochemical stripping of divalent Eu from TODGA-
functionalized OMC materials contacted with an aqueous
trivalent lanthanide solution is realized. Further experiments to
confirm Eu(II) desorption, such as in-situ XANES or XPS, could be
executed to further probe this chemistry.
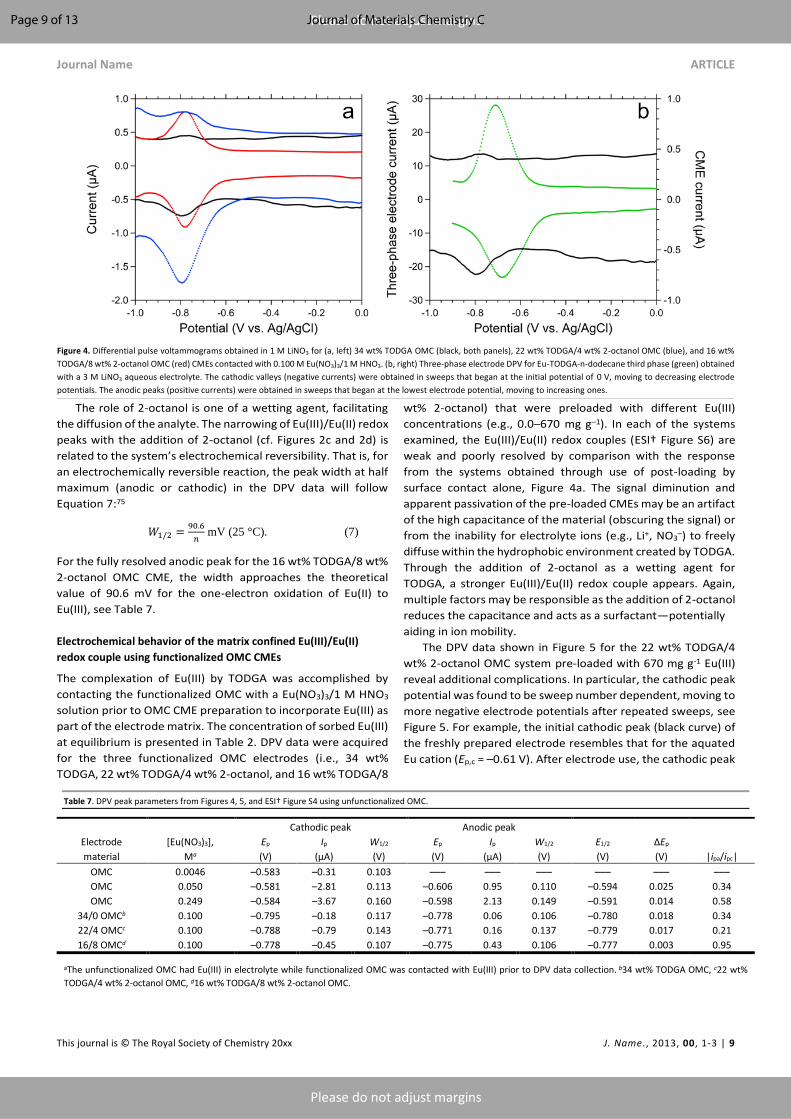
Differential pulse voltammetry. The differential pulse
voltammograms obtained for the three functionalized OMC
electrodes (i.e., 34 wt% TODGA, 22 wt% TODGA/4 wt% 2-
octanol, and 16 wt% TODGA/8 wt% 2-octanol after contact with
0.100 M Eu(NO3)3/1 M HNO3) show comparable responses in
terms of peak potentials, see Figure 4a. The signal strength and
resolution of the Eu(III)/Eu(II) couple at approx. –0.80 V
improves with increasing 2-octanol concentrations. Compared
to the corresponding CV data of Figure 2, the better peak
symmetry and shape afforded by DPV is due to the
discrimination between the faradaic current and the
background (capacitive) current, see Figure 1. The Eu electrode
potentials obtained by use of CV and DPV are equivalent. To
compare the response of these TODGA-functionalized-and-
confined OMC electrodes with that for unconfined (i.e., solution
phase) TODGA, three-phase electrode65 DPV data was collected
using a bulk GCE coated with an Eu-TODGA-n-dodecane third
phase immersed in a 3 M LiNO3 electrolyte. As shown in Figure
4b, the high concentration of the Eu-TODGA complex in the
third phase provides a more intense Eu(III)/Eu(II) signal than for
TODGA confined on the OMC. The shift of approx. –0.10 V in the
half-wave potential (see Table 6) for the OMC system compared
with the oil phase response demonstrates that Eu(III) is more
stable in the confined environment with TODGA on the OMC
than it is in the bulk oil phase from LLE. In other words, Eu(II) is
more unstable on the TODGA-functionalized OMC than in the
bulk oil. This is consistent with the reductive stripping observed
in Figure 3.
Table 6. Half-wave potentials from DPV shown in Figure 4 using a three-phase GCE
system contacted with Eu-TODGA-n-dodecane and a 34 wt% TODGA OMC CME.
System Electrolyte E1/2 (V)
Third-phase from LLE 3 M LiNO3 –0.689
34 wt% TODGA OMC 1 M LiNO3 –0.782
Figure 3. Cyclic voltammograms (obtained in a 1 M LiNO3 electrolyte at 25 mV s–1) for 16
wt% TODGA/8 wt% 2-octanol OMC after contact with 0.100 M Eu(NO3)3/1 M HNO3. The
first two segments are shown in red, followed by gold, green, and blue, successively.
Page 8 of 13Journal of Materials Chemistry C
Journal Name ARTICLE
This journal is © The Royal Society of Chemistry 20xx J. Name., 2013, 00, 1-3 | 9
Please do not adjust margins
Please do not adjust margins
The role of 2-octanol is one of a wetting agent, facilitating
the diffusion of the analyte. The narrowing of Eu(III)/Eu(II) redox
peaks with the addition of 2-octanol (cf. Figures 2c and 2d) is
related to the system’s electrochemical reversibility. That is, for
an electrochemically reversible reaction, the peak width at half
maximum (anodic or cathodic) in the DPV data will follow
Equation 7:75
𝑊1/2 =90.6
𝑛 mV (25 °C). (7)
For the fully resolved anodic peak for the 16 wt% TODGA/8 wt%
2-octanol OMC CME, the width approaches the theoretical
value of 90.6 mV for the one-electron oxidation of Eu(II) to
Eu(III), see Table 7.
Electrochemical behavior of the matrix confined Eu(III)/Eu(II)
redox couple using functionalized OMC CMEs
The complexation of Eu(III) by TODGA was accomplished by
contacting the functionalized OMC with a Eu(NO3)3/1 M HNO3
solution prior to OMC CME preparation to incorporate Eu(III) as
part of the electrode matrix. The concentration of sorbed Eu(III)
at equilibrium is presented in Table 2. DPV data were acquired
for the three functionalized OMC electrodes (i.e., 34 wt%
TODGA, 22 wt% TODGA/4 wt% 2-octanol, and 16 wt% TODGA/8
wt% 2-octanol) that were preloaded with different Eu(III)
concentrations (e.g., 0.0–670 mg g–1). In each of the systems
examined, the Eu(III)/Eu(II) redox couples (ESI† Figure S6) are
weak and poorly resolved by comparison with the response
from the systems obtained through use of post-loading by
surface contact alone, Figure 4a. The signal diminution and
apparent passivation of the pre-loaded CMEs may be an artifact
of the high capacitance of the material (obscuring the signal) or
from the inability for electrolyte ions (e.g., Li+, NO3–) to freely
diffuse within the hydrophobic environment created by TODGA.
Through the addition of 2-octanol as a wetting agent for
TODGA, a stronger Eu(III)/Eu(II) redox couple appears. Again,
multiple factors may be responsible as the addition of 2-octanol
reduces the capacitance and acts as a surfactant—potentially
aiding in ion mobility.
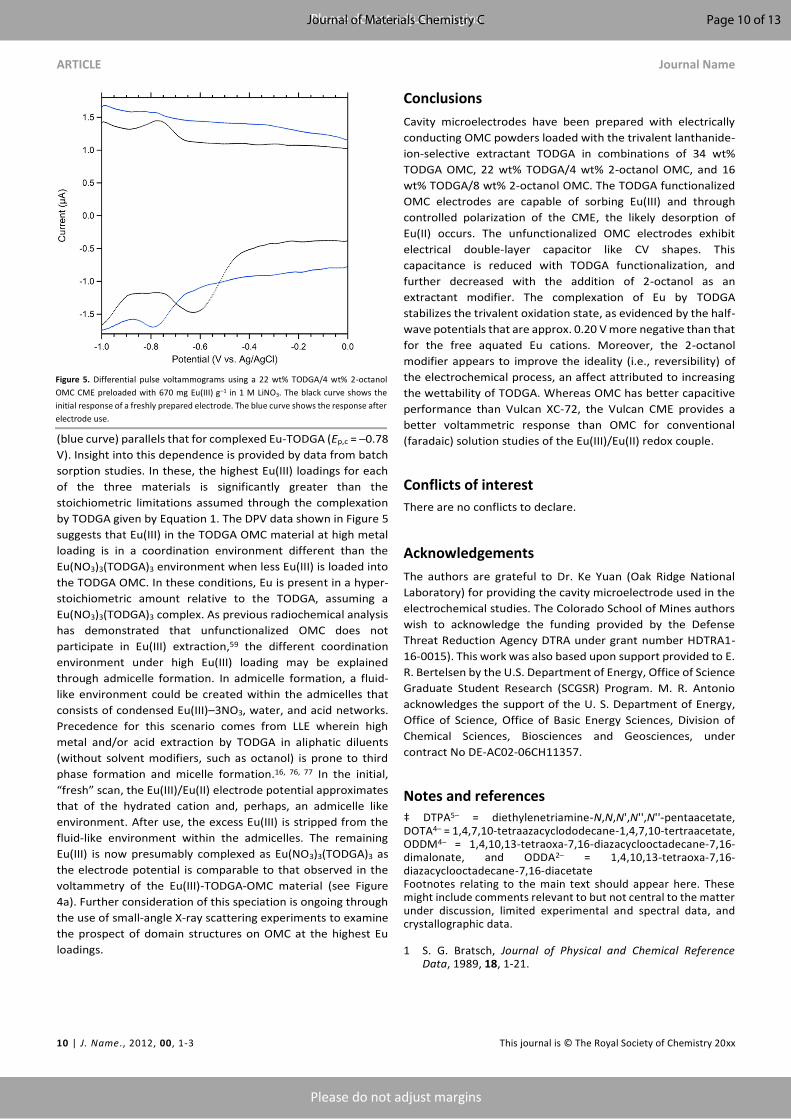
The DPV data shown in Figure 5 for the 22 wt% TODGA/4
wt% 2-octanol OMC system pre-loaded with 670 mg g-1 Eu(III)
reveal additional complications. In particular, the cathodic peak
potential was found to be sweep number dependent, moving to
more negative electrode potentials after repeated sweeps, see
Figure 5. For example, the initial cathodic peak (black curve) of
the freshly prepared electrode resembles that for the aquated
Eu cation (Ep,c = –0.61 V). After electrode use, the cathodic peak
Table 7. DPV peak parameters from Figures 4, 5, and ESI† Figure S4 using unfunctionalized OMC.
Cathodic peak Anodic peak
Electrode
material
[Eu(NO3)3],
Ma
Ep
(V)
Ip
(µA)
W1/2
(V)
Ep
(V)
Ip
(µA)
W1/2
(V)
E1/2
(V)
ΔEp
(V) |ipa/ipc|
OMC 0.0046 –0.583 –0.31 0.103 ––– ––– ––– ––– ––– –––
OMC 0.050 –0.581 –2.81 0.113 –0.606 0.95 0.110 –0.594 0.025 0.34
OMC 0.249 –0.584 –3.67 0.160 –0.598 2.13 0.149 –0.591 0.014 0.58
34/0 OMCb 0.100 –0.795 –0.18 0.117 –0.778 0.06 0.106 –0.780 0.018 0.34
22/4 OMCc 0.100 –0.788 –0.79 0.143 –0.771 0.16 0.137 –0.779 0.017 0.21
16/8 OMCd 0.100 –0.778 –0.45 0.107 –0.775 0.43 0.106 –0.777 0.003 0.95
aThe unfunctionalized OMC had Eu(III) in electrolyte while functionalized OMC was contacted with Eu(III) prior to DPV data collection. b34 wt% TODGA OMC, c22 wt%
TODGA/4 wt% 2-octanol OMC, d16 wt% TODGA/8 wt% 2-octanol OMC.
Figure 4. Differential pulse voltammograms obtained in 1 M LiNO3 for (a, left) 34 wt% TODGA OMC (black, both panels), 22 wt% TODGA/4 wt% 2-octanol OMC (blue), and 16 wt%
TODGA/8 wt% 2-octanol OMC (red) CMEs contacted with 0.100 M Eu(NO3)3/1 M HNO3. (b, right) Three-phase electrode DPV for Eu-TODGA-n-dodecane third phase (green) obtained
with a 3 M LiNO3 aqueous electrolyte. The cathodic valleys (negative currents) were obtained in sweeps that began at the initial potential of 0 V, moving to decreasing electrode
potentials. The anodic peaks (positive currents) were obtained in sweeps that began at the lowest electrode potential, moving to increasing ones.
Page 9 of 13 Journal of Materials Chemistry C
ARTICLE Journal Name
10 | J. Name., 2012, 00, 1-3 This journal is © The Royal Society of Chemistry 20xx
Please do not adjust margins
Please do not adjust margins
(blue curve) parallels that for complexed Eu-TODGA (Ep,c = –0.78
V). Insight into this dependence is provided by data from batch
sorption studies. In these, the highest Eu(III) loadings for each
of the three materials is significantly greater than the
stoichiometric limitations assumed through the complexation
by TODGA given by Equation 1. The DPV data shown in Figure 5
suggests that Eu(III) in the TODGA OMC material at high metal
loading is in a coordination environment different than the
Eu(NO3)3(TODGA)3 environment when less Eu(III) is loaded into
the TODGA OMC. In these conditions, Eu is present in a hyper-
stoichiometric amount relative to the TODGA, assuming a
Eu(NO3)3(TODGA)3 complex. As previous radiochemical analysis
has demonstrated that unfunctionalized OMC does not
participate in Eu(III) extraction,59 the different coordination
environment under high Eu(III) loading may be explained
through admicelle formation. In admicelle formation, a fluid-
like environment could be created within the admicelles that
consists of condensed Eu(III)–3NO3, water, and acid networks.
Precedence for this scenario comes from LLE wherein high
metal and/or acid extraction by TODGA in aliphatic diluents
(without solvent modifiers, such as octanol) is prone to third
phase formation and micelle formation.16, 76, 77 In the initial,
“fresh” scan, the Eu(III)/Eu(II) electrode potential approximates
that of the hydrated cation and, perhaps, an admicelle like
environment. After use, the excess Eu(III) is stripped from the
fluid-like environment within the admicelles. The remaining
Eu(III) is now presumably complexed as Eu(NO3)3(TODGA)3 as
the electrode potential is comparable to that observed in the
voltammetry of the Eu(III)-TODGA-OMC material (see Figure
4a). Further consideration of this speciation is ongoing through
the use of small-angle X-ray scattering experiments to examine
the prospect of domain structures on OMC at the highest Eu
loadings.
Conclusions
Cavity microelectrodes have been prepared with electrically
conducting OMC powders loaded with the trivalent lanthanide-
ion-selective extractant TODGA in combinations of 34 wt%
TODGA OMC, 22 wt% TODGA/4 wt% 2-octanol OMC, and 16
wt% TODGA/8 wt% 2-octanol OMC. The TODGA functionalized
OMC electrodes are capable of sorbing Eu(III) and through
controlled polarization of the CME, the likely desorption of
Eu(II) occurs. The unfunctionalized OMC electrodes exhibit
electrical double-layer capacitor like CV shapes. This
capacitance is reduced with TODGA functionalization, and
further decreased with the addition of 2-octanol as an
extractant modifier. The complexation of Eu by TODGA
stabilizes the trivalent oxidation state, as evidenced by the half-
wave potentials that are approx. 0.20 V more negative than that
for the free aquated Eu cations. Moreover, the 2-octanol
modifier appears to improve the ideality (i.e., reversibility) of
the electrochemical process, an affect attributed to increasing
the wettability of TODGA. Whereas OMC has better capacitive
performance than Vulcan XC-72, the Vulcan CME provides a
better voltammetric response than OMC for conventional
(faradaic) solution studies of the Eu(III)/Eu(II) redox couple.
Conflicts of interest
There are no conflicts to declare.
Acknowledgements
The authors are grateful to Dr. Ke Yuan (Oak Ridge National
Laboratory) for providing the cavity microelectrode used in the
electrochemical studies. The Colorado School of Mines authors
wish to acknowledge the funding provided by the Defense
Threat Reduction Agency DTRA under grant number HDTRA1-
16-0015). This work was also based upon support provided to E.
R. Bertelsen by the U.S. Department of Energy, Office of Science
Graduate Student Research (SCGSR) Program. M. R. Antonio
acknowledges the support of the U. S. Department of Energy,
Office of Science, Office of Basic Energy Sciences, Division of
Chemical Sciences, Biosciences and Geosciences, under
contract No DE-AC02-06CH11357.
Notes and references
‡ DTPA5– = diethylenetriamine-N,N,N',N'',N''-pentaacetate, DOTA4– = 1,4,7,10-tetraazacyclododecane-1,4,7,10-tertraacetate, ODDM4– = 1,4,10,13-tetraoxa-7,16-diazacyclooctadecane-7,16-dimalonate, and ODDA2– = 1,4,10,13-tetraoxa-7,16-diazacyclooctadecane-7,16-diacetate Footnotes relating to the main text should appear here. These might include comments relevant to but not central to the matter under discussion, limited experimental and spectral data, and crystallographic data.
1 S. G. Bratsch, Journal of Physical and Chemical Reference
Data, 1989, 18, 1-21.
Figure 5. Differential pulse voltammograms using a 22 wt% TODGA/4 wt% 2-octanol
OMC CME preloaded with 670 mg Eu(III) g–1 in 1 M LiNO3. The black curve shows the
initial response of a freshly prepared electrode. The blue curve shows the response after
electrode use.
Page 10 of 13Journal of Materials Chemistry C
Journal Name ARTICLE
This journal is © The Royal Society of Chemistry 20xx J. Name., 2013, 00, 1-3 | 11
Please do not adjust margins
Please do not adjust margins
2 M. Van de Voorde, B. Geboes, T. Vander Hoogerstraete, K. Van Hecke, T. Cardinaels and K. Binnemans, Dalton Transactions, 2019, 48, 14758-14768.
3 L. Jelinek, Y. Wei, T. Arai and M. Kumagai, Solvent Extraction and Ion Exchange, 2007, 25, 503-513.
4 S. C. Li, S. C. Kim, C. S. Kang, C. J. Kim and C. J. Kang, Hydrometallurgy, 2018, 178, 181-187.
5 D. F. Peppard, E. P. Horwitz and G. W. Mason, Journal of Inorganic and Nuclear Chemistry, 1962, 24, 429-439.
6 J. S. Preston and A. C. du Preez, Solvent Extraction and Ion Exchange, 1991, 9, 237-257.
7 J. S. Preston and A. C. du Preez, Journal of Chemical Technology and Biotechnology, 1996, 65, 93-101.
8 M. Van de Voorde, K. Van Hecke, K. v. Binnemans and T. Cardinaels, RSC Advances, 2018, 8, 20077-20086.
9 T. Moeller, in The Chemistry of the Lanthanides, ed. T. Moeller, 1973, DOI: 10.1016/B978-0-08-018878-2.50005-2, pp. 1-101.
10 A. G. Atanasyants and A. N. Seryogin, Hydrometallurgy, 1995, 37, 367-374.
11 T. Donohue, Optical Engineering, 1979, 18, 181-186. 12 T. Hirai and I. Komasawa, presented in part at the Solvent
Extraction in the Process Industries, London, 1993. 13 J. M. Schwantes, R. Sudowe, H. Nitsche and D. C. Hoffman,
Journal of Radioanalytical and Nuclear Chemistry, 2008, 276, 543-548.
14 A. Yörükoğlu and İ. Girgin, Hydrometallurgy, 2002, 63, 85-91. 15 A. Kumari, M. K. Jha, D. D. Pathak, S. Chakravarty and J.-c. Lee,
Separation & Purification Reviews, 2019, 48, 91-121. 16 S. A. Ansari, P. Pathak, P. K. Mohapatra and V. K. Manchanda,
Chemical Reviews, 2012, 112, 1751-1772. 17 Y. Sasaki, Y. Sugo, S. Suzuki and S. Tachimori, Solvent
Extraction and Ion Exchange, 2001, 19, 91-103. 18 D. Whittaker, A. Geist, G. Modolo, R. Taylor, M. Sarsfield and
A. Wilden, Solvent Extraction and Ion Exchange, 2018, 36, 223-256.
19 D. M. Brigham, A. S. Ivanov, B. A. Moyer, L. H. Delmau, V. S. Bryantsev and R. J. Ellis, Journal of the American Chemical Society, 2017, 139, 17350-17358.
20 E. Metwally, A. S. Saleh and H. A. El-Naggar, Journal of Nuclear and Radiochemical Sciences, 2013, 13, 1-7.
21 E. A. Mowafy and H. F. Aly, Solvent Extraction and Ion Exchange, 2007, 25, 205-224.
22 Y. Sasaki, P. Rapold, M. Arisaka, M. Hirata, T. Kimura, C. Hill and G. Cote, Solvent Extraction and Ion Exchange, 2007, 25, 187-204.
23 A. G. Baldwin, A. S. Ivanov, N. J. Williams, R. J. Ellis, B. A. Moyer, V. S. Bryantsev and J. C. Shafer, ACS Central Science, 2018, 4, 739-747.
24 E. P. Horwitz, D. R. McAlister, A. H. Bond and R. Barrans Jr, Solvent Extraction and Ion Exchange, 2005, 23, 319-344.
25 Y. Sasaki, Z. X. Zhu, Y. Sugo and T. Kimura, Journal of Nuclear and Radiochemical Sciences, 2007, 44, 405-409.
26 R. D. Shannon, Acta Crystallographica Section A, 1976, 32, 751-767.
27 S. Harder, Angewandte Chemie International Edition, 2004, 43, 2714-2718.
28 S. Nave, G. Modolo, C. Madic and F. Testard, Solvent Extraction and Ion Exchange, 2004, 22, 527-551.
29 P. N. Pathak, S. A. Ansari, S. Kumar, B. S. Tomar and V. K. Manchanda, Journal of Colloid and Interface Science, 2010, 342, 114-118.
30 R. Ryoo, S. H. Joo and S. Jun, The Journal of Physical Chemistry B, 1999, 103, 7743-7746.
31 A. Eftekhari and Z. Fan, Materials Chemistry Frontiers, 2017, 1, 1001-1027.
32 J. Schuster, G. He, B. Mandlmeier, T. Yim, K. T. Lee, T. Bein and L. F. Nazar, Angewandte Chemie International Edition, 2012, 51, 3591-3595.
33 C. Vix-Guterl, E. Frackowiak, K. Jurewicz, M. Friebe, J. Parmentier and F. Béguin, Carbon, 2005, 43, 1293-1302.
34 A. Walcarius, Chemical Society Reviews, 2013, 42, 4098-4140. 35 Y. Zhai, Y. Dou, D. Zhao, P. F. Fulvio, R. T. Mayes and S. Dai,
Advanced Materials, 2011, 23, 4828-4850. 36 J. Bai, X. Bo, D. Zhu, G. Wang and L. Guo, Electrochimica Acta,
2010, 56, 657-662. 37 H. Chang, S. H. Joo and C. Pak, Journal of Materials Chemistry,
2007, 17, 3078-3088. 38 J. K. Dombrovskis, H. Y. Jeong, K. Fossum, O. Terasaki and A.
E. C. Palmqvist, Chemistry of Materials, 2013, 25, 856-861. 39 M. Joglekar, S. Pylypenko, M. M. Otting, J. S. Valenstein and B.
G. Trewyn, Chemistry of Materials, 2014, 26, 2873-2882. 40 F. Li, K.-Y. Chan, H. Yung, C. Yang and S. W. Ting, Physical
Chemistry Chemical Physics, 2013, 15, 13570-13577. 41 A. K. Sahu, P. Sridhar and S. Pitchumani, Journal of the Indian
Institute of Science, 2009, 89, 437-445. 42 H. Wang, B. Qi, B. Lu, X. Bo and L. Guo, Electrochimica Acta,
2011, 56, 3042-3048. 43 N. Jia, Z. Wang, G. Yang, H. Shen and L. Zhu, Electrochemistry
Communications, 2007, 9, 233-238. 44 A. Walcarius, Trends in Analytical Chemistry, 2012, 38, 79-97. 45 A. Walcarius, Electroanalysis, 2015, 27, 1303-1340. 46 J. Zang, C. X. Guo, F. Hu, L. Yu and C. M. Li, Analytica Chimica
Acta, 2011, 683, 187-191. 47 M. Zhou, J. Ding, L.-p. Guo and Q.-k. Shang, Analytical
Chemistry, 2007, 79, 5328-5335. 48 M. Zhou, L. Shang, B. Li, L. Huang and S. Dong,
Electrochemistry Communications, 2008, 10, 859-863. 49 A. Walcarius, S. D. Minteer, J. Wang, Y. Lin and A. Merkoçi,
Journal of Materials Chemistry B, 2013, 1, 4878-4908. 50 M. Zhou, L. Shang, B. Li, L. Huang and S. Dong, Biosensors and
Bioelectronics, 2008, 24, 442-447. 51 L. Zhu, C. Tian, D. Yang, X. Jiang and R. Yang, Electroanalysis,
2008, 20, 2518-2525. 52 L. Zhu, C. Tian, D. Zhu and R. Yang, Electroanalysis, 2008, 20,
1128-1134. 53 A. Walcarius, Sensors, 2017, 17. 54 Z. Wang, A. T. Brown, K. Tan, Y. J. Chabal and K. J. Balkus,
Journal of the American Chemical Society, 2018, 140, 14735-14739.
55 L. A. Basal and M. J. Allen, Frontiers in Chemistry, 2018, 6. 56 J. Garcia and M. J. Allen, European Journal of Inorganic
Chemistry, 2012, 2012, 4550-4563. 57 M. Gál, F. Kielar, R. Sokolová, Š. Ramešová and V. Kolivoška,
European Journal of Inorganic Chemistry, 2013, 2013, 3217-3223.
58 B. A. Bilal, Zeitschrift für Naturforschung A, 2014, 46, 1108-1116.
59 E. R. Bertelsen, G. Deodhar, K. T. Kluherz, M. Davidson, M. L. Adams, B. G. Trewyn and J. C. Shafer, Journal of Chromatography A, 2019, 1595, 248-256.
60 K. Yuan, D. Renock, R. C. Ewing and U. Becker, Geochimica et Cosmochimica Acta, 2015, 156, 194-206.
61 Y. Sasaki, Y. Sugo, S. Suzuki and S. Tachimori, Solvent Extraction and Ion Exchange, 2001, 19, 91-103.
62 J. A. Drader, L. Zhu, P. Smith, K. McCann, S. Boyes and J. C. Braley, Separation and Purification Technology, 2016, 163, 352-356.
63 M. K. Bera, T. H. Bray, R. J. Ellis and M. R. Antonio, ChemElectroChem, 2014, 1, 1173-1181.
64 R. J. Ellis, M. K. Bera, B. Reinhart and M. R. Antonio, Physical Chemistry Chemical Physics, 2016, 18, 31254-31259.
65 F. Scholz and R. Gulaboski, ChemPhysChem, 2005, 6, 16-28.
Page 11 of 13 Journal of Materials Chemistry C
ARTICLE Journal Name
12 | J. Name., 2012, 00, 1-3 This journal is © The Royal Society of Chemistry 20xx
Please do not adjust margins
Please do not adjust margins
66 A. D. Moore, S. M. Holmes and E. P. L. Roberts, RSC Advances, 2012, 2, 1669-1674.
67 P. Simon and Y. Gogotsi, Nature Materials, 2008, 7, 845-854. 68 R. Lin, P. L. Taberna, J. Chmiola, D. Guay, Y. Gogotsi and P.
Simon, Journal of The Electrochemical Society, 2009, 156, A7-A12.
69 C. Portet, J. Chmiola, Y. Gogotsi, S. Park and K. Lian, Electrochimica Acta, 2008, 53, 7675-7680.
70 S.-y. Zhou, X.-h. Li, Z.-x. Wang, H.-j. Guo and W.-j. Peng, Transactions of Nonferrous Metals Society of China, 2007, 17, 1328-1333.
71 using Igor Pro 6 software from WaveMetrics, Inc. 72 É. Tóth, L. Burai and A. E. Merbach, Coordination Chemistry
Reviews, 2001, 216-217, 363-382. 73 M. Botta, M. Ravera, A. Barge, M. Bottaro and D. Osella,
Dalton Transactions, 2003, DOI: 10.1039/B211533F, 1628-1633.
74 B.-Y. Chang, Journal of Electrochemical Science and Technology, 2017, 8, 244-249.
75 A. J. Bard and L. R. Faulkner, Electrochemical Methods: Fundamentals and Applications, Wiley, 2 edn., 2000.
76 S. Tachimori, Y. Sasaki and S.-i. Suzuki, Solvent Extraction and Ion Exchange, 2002, 20, 687-699.
77 D. Woodhead, F. McLachlan, R. Taylor, U. Müllich, A. Geist, A. Wilden and G. Modolo, Solvent Extraction and Ion Exchange, 2019, 37, 173-190.
Page 12 of 13Journal of Materials Chemistry C
Page 13 of 13 Journal of Materials Chemistry C