Embed Size (px)
Citation preview

Interacting Influences on Financial Well-Being
Jeffrey Anvari-ClarkUniversity of Maryland School of Social WorkSeptember 24, 2020

Background
Financial well-being (FWB): Subjective perception of a person’s dual sense of security and freedom of choice, both in the present and in the future (CFPB, 2017). Impacted by:
Financial shocks Costly events – job loss, large medical bill, etc.
Income and savings Income & dynamics, assets
Financial product use Bank account, life insurance, payday loans, etc.
Financial management behaviors Active saving, budgeting, bill paying behaviors
Sherraden, M. (2013). Building blocks of financial capability. In J. Birkenmaier, M. Sherraden, & J. Curley (Eds.), Financial capability and asset development: research, education, policy, and practice (pp. 3-43). New York, NY: Oxford University Press.
Financial Capability Theoretical Framework
ShocksInc volatility $ Amount in
Savings
Income
Product use
Savings Behavior
Financial Well-Being
Purpose of the study
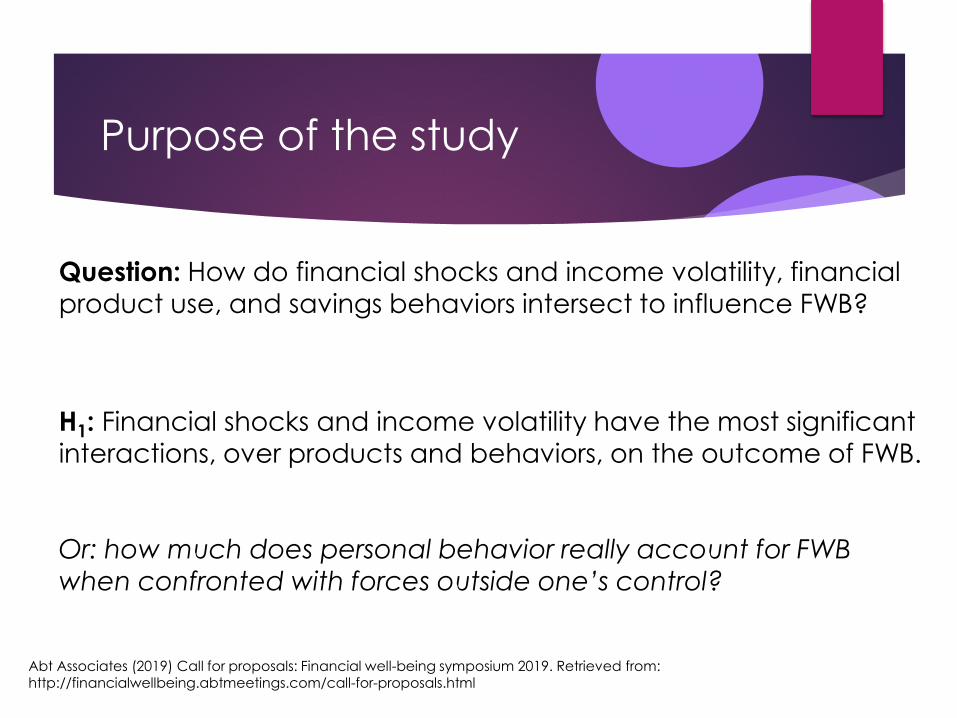
H1: Financial shocks and income volatility have the most significant interactions, over products and behaviors, on the outcome of FWB.
Or: how much does personal behavior really account for FWB when confronted with forces outside one’s control?
Question: How do financial shocks and income volatility, financial product use, and savings behaviors intersect to influence FWB?
Abt Associates (2019) Call for proposals: Financial well-being symposium 2019. Retrieved from: http://financialwellbeing.abtmeetings.com/call-for-proposals.html
Design & Sample
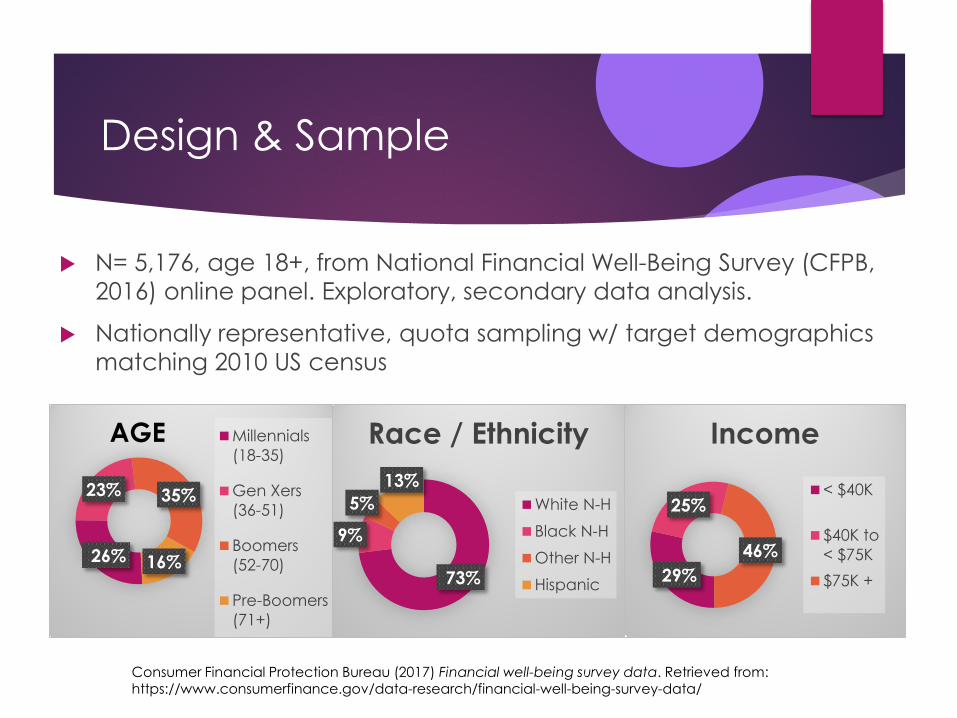
N= 5,176, age 18+, from National Financial Well-Being Survey (CFPB, 2016) online panel. Exploratory, secondary data analysis.
Nationally representative, quota sampling w/ target demographics matching 2010 US census
26%
23% 35%
16%
Millennials(18-35)
Gen Xers(36-51)
Boomers(52-70)
Pre-Boomers(71+)
73%
9%
5%13%
Race / Ethnicity
White N-HBlack N-HOther N-HHispanic 29%
25%
46%
Income< $40K
$40K to< $75K$75K +
Consumer Financial Protection Bureau (2017) Financial well-being survey data. Retrieved from: https://www.consumerfinance.gov/data-research/financial-well-being-survey-data/
AGE

Measures & Variables
• 11Q, Y/N scale (indexed)
Financial Shocks
• 1Q, 3pt scaleIncome Volatility
• 10Q, 5pt scale (CFPB – FinW-B Scale)
Financial Well-Being
• Race / Ethnicity• Generational Age• Gender• Household Income
Controls
• 8Q, Y/N scale (indexed)
Financial Products
• 5Q, Y/N scale (indexed)
Alternative Products
• 1Q, 6pt scaleSavings Habit
• 1Q, 7pt scaleAmount in Savings
Dependent VariableIndependent Variables
Data Analysis
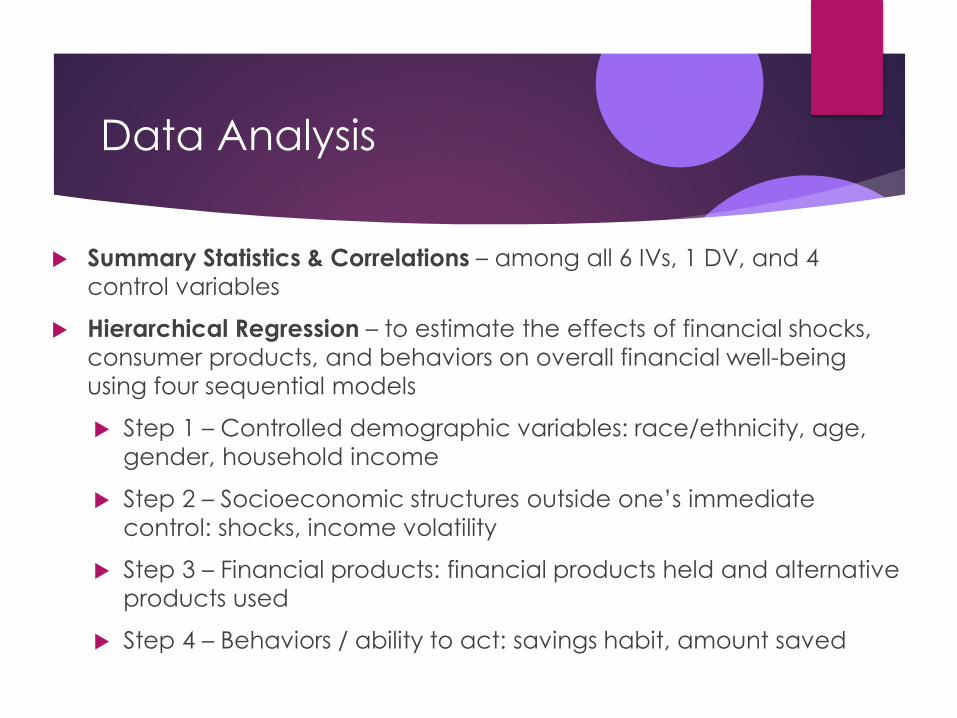
Summary Statistics & Correlations – among all 6 IVs, 1 DV, and 4 control variables
Hierarchical Regression – to estimate the effects of financial shocks, consumer products, and behaviors on overall financial well-being using four sequential models
Step 1 – Controlled demographic variables: race/ethnicity, age, gender, household income
Step 2 – Socioeconomic structures outside one’s immediate control: shocks, income volatility
Step 3 – Financial products: financial products held and alternative products used
Step 4 – Behaviors / ability to act: savings habit, amount saved

Summary Statistics & Unadjusted Regression Correlations on Financial Well-Being
Variable M SD Corr. Coeff.
FWB Score 55.75 14.47White Non-Hispanic 0.73 0.44 .16**Black Non-Hispanic 0.09 0.29 -.09**Other Non-Hispanic 0.05 0.21 -.03*_Hispanic 0.13 0.33 -.12**Millennial 0.26 0.44 -.20**Gen X 0.23 0.42 -.12**Boomer 0.35 0.48 .11**Pre-Boomer 0.16 0.37 .23**Gender (1=M; 0=F) 0.54 0.5 .07**HH Income 5.64 2.64 .43**Financial Shocks 0.81 1.02 -.20**Income Volatility 1.33 0.59 -.19**Financial Products 3.63 1.77 .43** Alt Financial Products 0.24 0.53 -.26**Savings Habit 4.35 1.49 .51**Amt Saved (seven bins) 4.49 1.8 .65**
Note. N = 5,176. SD = standard deviation.*p < 0.05. **p < 0.01.
Variable B (SE) 95% CI for B β t
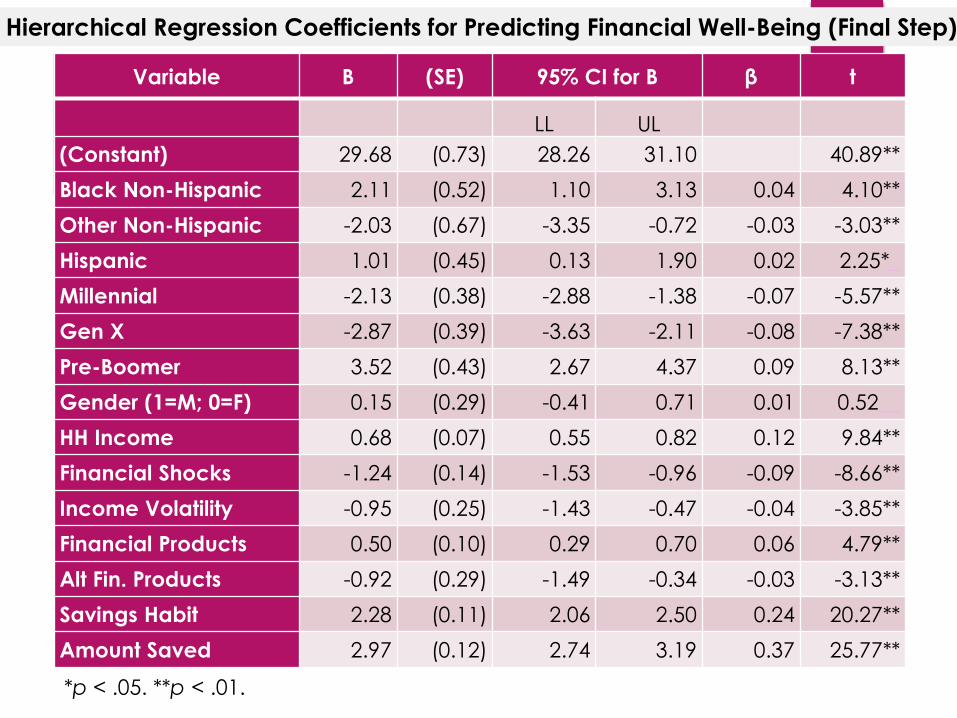
LL UL(Constant) 29.68 (0.73) 28.26 31.10 40.89**Black Non-Hispanic 2.11 (0.52) 1.10 3.13 0.04 4.10**Other Non-Hispanic -2.03 (0.67) -3.35 -0.72 -0.03 -3.03**Hispanic 1.01 (0.45) 0.13 1.90 0.02 2.25*_Millennial -2.13 (0.38) -2.88 -1.38 -0.07 -5.57**Gen X -2.87 (0.39) -3.63 -2.11 -0.08 -7.38**Pre-Boomer 3.52 (0.43) 2.67 4.37 0.09 8.13**Gender (1=M; 0=F) 0.15 (0.29) -0.41 0.71 0.01 0.52__HH Income 0.68 (0.07) 0.55 0.82 0.12 9.84**Financial Shocks -1.24 (0.14) -1.53 -0.96 -0.09 -8.66**Income Volatility -0.95 (0.25) -1.43 -0.47 -0.04 -3.85**Financial Products 0.50 (0.10) 0.29 0.70 0.06 4.79**Alt Fin. Products -0.92 (0.29) -1.49 -0.34 -0.03 -3.13**Savings Habit 2.28 (0.11) 2.06 2.50 0.24 20.27**Amount Saved 2.97 (0.12) 2.74 3.19 0.37 25.77**
Hierarchical Regression Coefficients for Predicting Financial Well-Being (Final Step)
*p < .05. **p < .01.

Hierarchical Regression Final Results
*** p < .001
Adj. R2 ΔR2 F ΔF
Step 1 (Demographics)
0.28 245.12***
Step 2(Shocks & Volatility)
0.30 0.03 223.74*** 100.45***
Step 3(Fin. & Alt. Products)
0.34 0.03 218.07*** 132.67***
Step 4(Savings Amt & Hbt)
0.51 0.17 383.06*** 911.54***
Results, con’t
The hypothesis – that financial shocks and income volatility have the most significant interactions, over products and behaviors, on the outcome of financial well-being, was not fully supported.
But rather, personal behaviors – as exemplified by savings habits and amounts – accounted for the most variance, while shocks and volatility, and products were relatively equal contributors to financial well-being.
Strengths & Limitations
Model accounted for 51% of variance in FWB.
Poor measure of volatility, size / type of shocks not considered.
Financial Products (+) and Alternative Products (-) may have cancelling effect.
Individualist conception of money management.
Other behaviors were not included, which may have a significant impact on FWB. (i.e. money management behaviors, financial self-efficacy)
High sampling of $100K income respondents (-), but weighted to bring mean income to $55K (+)
Implications
Support for shifting financial education’s emphasis from technical information to behavioral.
“Running start” saving incentives for younger cohorts.
Role of income and savings to mitigate impact of shocks & volatility on FWB.
Q: Do the correlations and findings stand:
When looking only at individuals with low-income levels?
When looking at particular racial, ethnic, or cultural groups (operating with more collective orientations)?


![Phytochromes and Phytochrome Interacting Factors1[OPEN] · Update on Phytochromes and Phytochrome Interacting Factors Phytochromes and Phytochrome Interacting Factors1[OPEN] Vinh](https://img.pdfslide.us/doc/110x75/5e9224c5cbd0a85457462c45/phytochromes-and-phytochrome-interacting-factors1open-update-on-phytochromes-and.jpg)