Embed Size (px)
Citation preview
INTER-NOISE 2006 3-6 DECEMBER 2006
HONOLULU, HAWAII, USA Motor racing tracks sound emission model: a comparison between prediction software and experimental data in Umbria Motordrome
(Italy)
Cinzia Burattia University of Perugia
Department of Industrial Engineering Via G. Duranti, 67
06125 Perugia Italy
Marco Vergonib University of Perugia
Department of Industrial Engineering Via G. Duranti, 67
06125 Perugia Italy
ABSTRACT Most recent commercial acoustic prediction softwares offer a full set of standard models for several kinds of noise sources, such as roads, railways, aircrafts and industries, but no motor racing track models are implemented. The aim of the present paper is to create a motor racing tracks-dedicated model, which could be applied to both cars and motorcycles without any restriction in number or categories, by using one of the commercial sound prediction software. The model is realized by means of experimental data measured at the Umbria Motordrome (Italy).
1 INTRODUCTION Most recent commercial acoustic prediction softwares offer a full set of standard models for
several kinds of noise sources, such as roads, railways, aircrafts and industries, but no motor racing track models are implemented.
The aim of the present paper is to create a motor racing tracks-dedicated model, which universally applies to both cars and motorcycles without any restriction in number or categories, by using a sound prediction software: SoundPLAN by Braunstein & Berndt GmbH. Moving vehicles are modeled by a continuous line source located in the circuit middle line. Sound power emission level is assigned to the line source after a calibration in one internal point using a third-octave band spectrum. Other sources, such as motorways and railroads, are modeled and a separation of the contribution of each one is allowed, giving the global sound pressure level measured in any point of the whole investigation area. Moreover, it is possible to calculate the rise of the sound pressure level caused by the only race track activity.
In order to validate the model, the sound pressure levels calculated by the prediction software are compared to the experimental ones, obtained during several measurement sessions in Umbria Motordrome of Magione (Italy), during the 2005 activity season.
2 LAWS AND TECHNICAL NORMS Italian normatives that directly concern the present case of study are the D.P.R. April 3rd
2001, n. 304, “Regolamento recante disciplina delle emissioni sonore prodotte nello svolgimento delle attività motoristiche, a norma dell'articolo 11 della Legge 26 novembre 1995, n. 447” and the D.M. March 16th 1998, “Tecniche di rilevamento e di misurazione dell’inquinamento acustico”. The first one generally concerns the motordromes and the racing tracks, establishing definitions and limits to apply for the different fittings within the day; the second one gives the
a Email address: [email protected] b Email address: [email protected]
specifications for the instrumentations, the measurements techniques and the requisites for the presentation of results.
Moreover, another important legislative action is the recent D.L. August 19th 2005, n. 194, “Attuazione della direttiva 2002/49/CE relativa alla determinazione e alla gestione del rumore ambientale”. It establishes the competences and the procedures and it doesn't enter the worth of the technical novelties contained in the European Directive, but it introduces, for the first time in the Italian legislation, prediction tools with standards implemented via software.
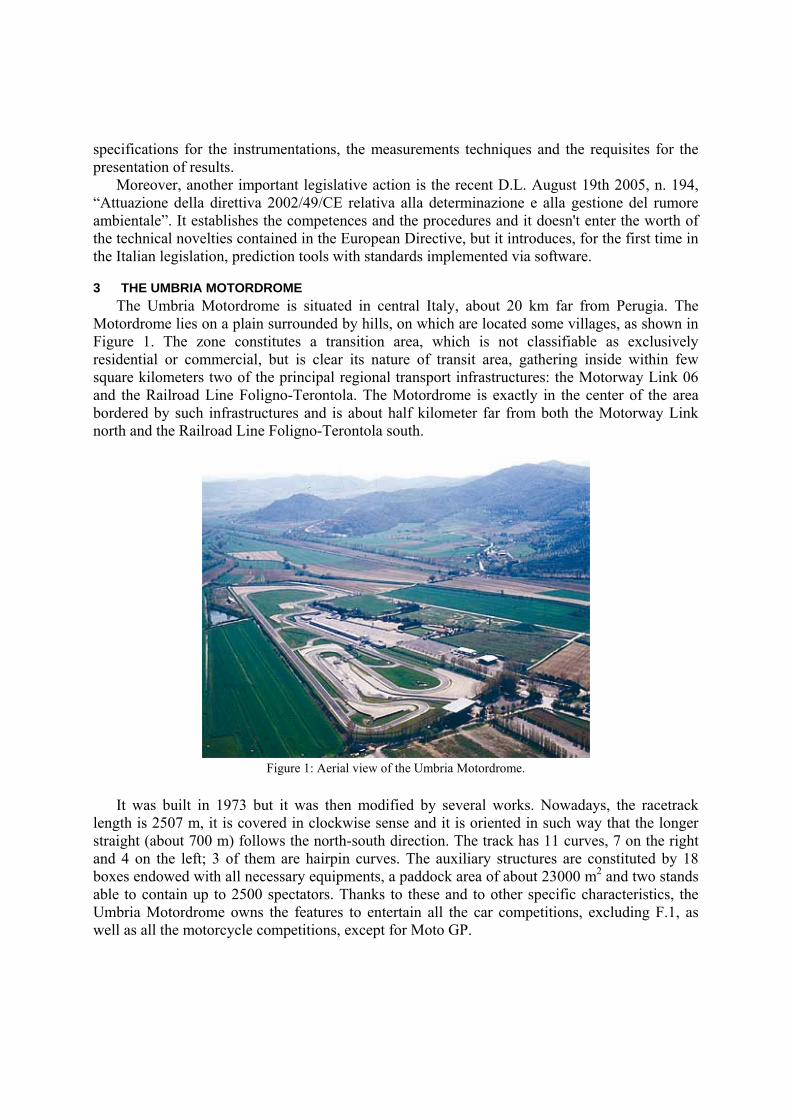
3 THE UMBRIA MOTORDROME The Umbria Motordrome is situated in central Italy, about 20 km far from Perugia. The
Motordrome lies on a plain surrounded by hills, on which are located some villages, as shown in Figure 1. The zone constitutes a transition area, which is not classifiable as exclusively residential or commercial, but is clear its nature of transit area, gathering inside within few square kilometers two of the principal regional transport infrastructures: the Motorway Link 06 and the Railroad Line Foligno-Terontola. The Motordrome is exactly in the center of the area bordered by such infrastructures and is about half kilometer far from both the Motorway Link north and the Railroad Line Foligno-Terontola south.
Figure 1: Aerial view of the Umbria Motordrome.
It was built in 1973 but it was then modified by several works. Nowadays, the racetrack
length is 2507 m, it is covered in clockwise sense and it is oriented in such way that the longer straight (about 700 m) follows the north-south direction. The track has 11 curves, 7 on the right and 4 on the left; 3 of them are hairpin curves. The auxiliary structures are constituted by 18 boxes endowed with all necessary equipments, a paddock area of about 23000 m2 and two stands able to contain up to 2500 spectators. Thanks to these and to other specific characteristics, the Umbria Motordrome owns the features to entertain all the car competitions, excluding F.1, as well as all the motorcycle competitions, except for Moto GP.
4 NOISE MEASUREMENTS
4.1 Measurement instruments Noise measurements were carried out by two different acquisition systems, both produced by
the French firm "01dB": Solo and Symphonie. Solo is a digital integrating sound level meter, which allows to carry out measurements on a
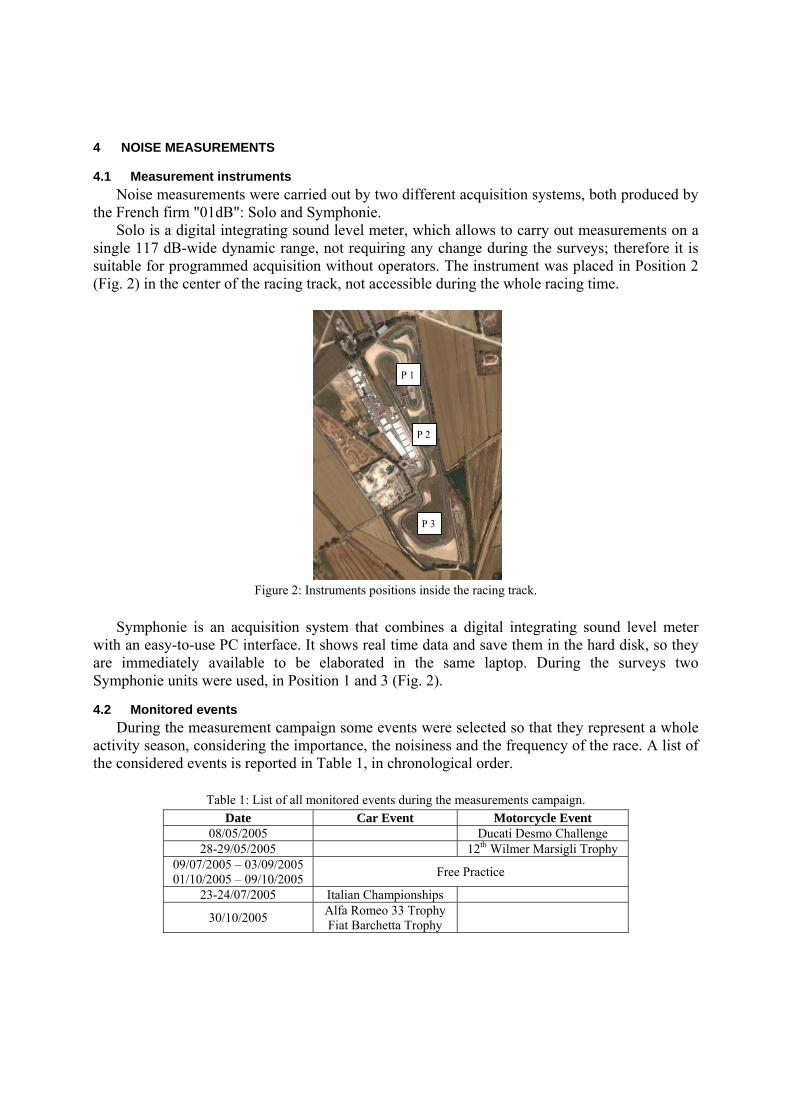
single 117 dB-wide dynamic range, not requiring any change during the surveys; therefore it is suitable for programmed acquisition without operators. The instrument was placed in Position 2 (Fig. 2) in the center of the racing track, not accessible during the whole racing time.
Figure 2: Instruments positions inside the racing track.
Symphonie is an acquisition system that combines a digital integrating sound level meter
with an easy-to-use PC interface. It shows real time data and save them in the hard disk, so they are immediately available to be elaborated in the same laptop. During the surveys two Symphonie units were used, in Position 1 and 3 (Fig. 2).
4.2 Monitored events During the measurement campaign some events were selected so that they represent a whole
activity season, considering the importance, the noisiness and the frequency of the race. A list of the considered events is reported in Table 1, in chronological order.
Table 1: List of all monitored events during the measurements campaign.
Date Car Event Motorcycle Event 08/05/2005 Ducati Desmo Challenge
28-29/05/2005 12th Wilmer Marsigli Trophy 09/07/2005 – 03/09/2005 01/10/2005 – 09/10/2005 Free Practice
23-24/07/2005 Italian Championships
30/10/2005 Alfa Romeo 33 Trophy Fiat Barchetta Trophy
P 1
P 2
P 3
“Free Practice” means the subdivision of the activity day in 25 minutes shifts, reserved alternatively to cars and motorcycles. A 5 minutes break separate two successive shifts. Unless explicit notice, no differentiation in cars or motorcycles categories is provided, so all shifts can contain each type of cars or bikes. The maximum capacity of the track for this kind of event is 40 motorcycles and 30 cars in each shift. The activity of Free Practice is particularly important within a season since it repeats with high frequency (35 - 40 times).
4.3 Internal points Internal points were used for a double aim: to know the emission level emitted during the
activity of the Motordrome and to characterize any particular acoustic anomaly along the track. Three points were selected, located internally to the racing track, in safe position protected by guard-rails and nets (Position 1, 2 and 3). Moreover, each position was defined by a dynamic GPS survey.
4.4 External points External points were used in the model validation step, to compare the model-predicted noise
levels with the measured ones. Their positions were located along the two North-South and East-West geographical directions, and were named according to the cardinal points (North, South, East, West). All these points were chosen according to these requirements: accessibility, closeness to the racing track, no influence by local noise sources. As for the internal points, their position was determined by GPS surveys.
4.5 External sensitive receivers The external receiver points were used to verify the model-predicted noise levels reliability
near the densely inhabited areas, which are extremely sensitive to the acoustic pollution. They were located at an appropriate distance from villages, so that the local sound emissions can’t reach the survey positions. All the selected points have got a free view in direction of the racing track, excluding the presence of obstacles that could screen the noise and affect the measurements. Each of these points keeps the name of the nearby village: Monte Sperello, Monte Melino, Castelvieto, Taverne, Villa, Soccorso and Magione. Also in this case, several dynamic GPS surveys were carried out to locate the points.
4.6 Measured parameters All the acoustic measurements were carried out in compliance with D.M. March 16th 1998,
particularly in absence of precipitations and with a wind speed ≤5m/s, suspending them even if only one of these conditions failed. The microphone, endowed with an apposite wind screen, was positioned at least 1.5 m above the ground. During the internal points measurements, the microphone was directed upwards, in order to not privilege a particular sound direction; in all the external points, instead, it was directed towards the racing track. Before and after each measurement cycle, the instruments calibration was regularly performed, verifying that the difference between the two level values was less than 0.5 dB.
The acquired parameters during all the surveys include the continuous equivalent sound pressure level with “A” weighting (Leq(A)), calculated by 1 s short-Leq, and the 1/3-octave bands spectrum with linear weighting.
5 MOTORDROME ACOUSTIC MODEL
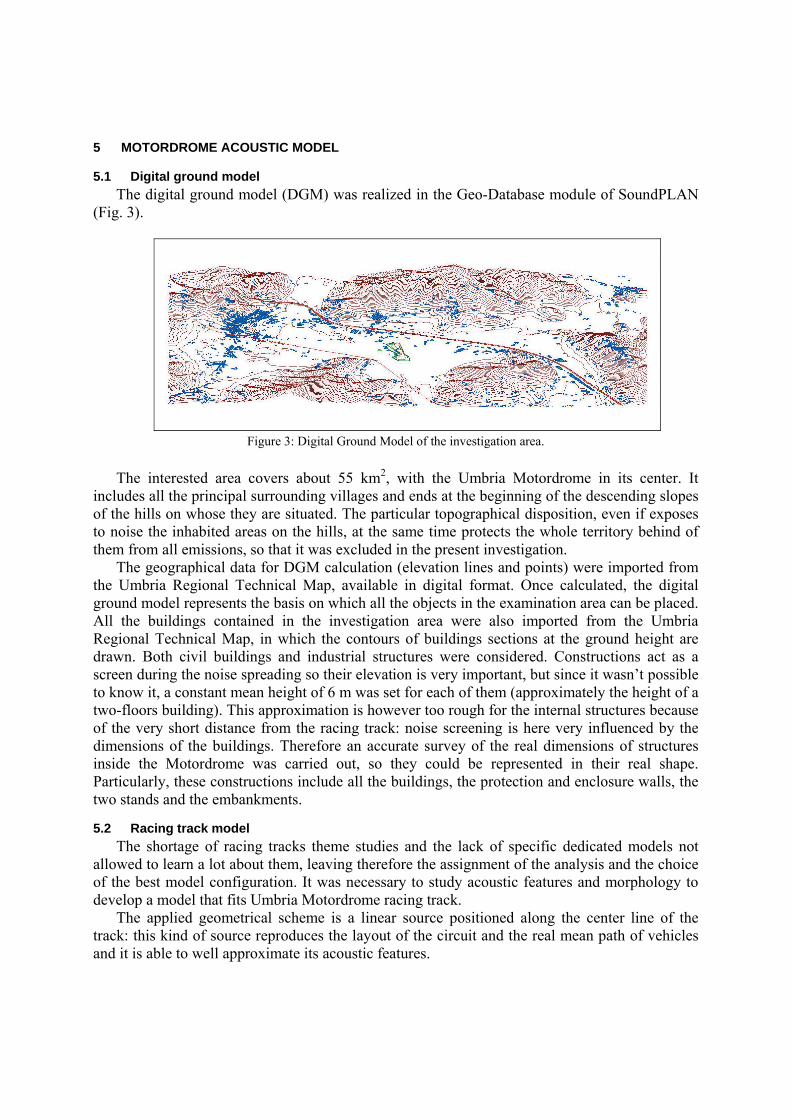
5.1 Digital ground model The digital ground model (DGM) was realized in the Geo-Database module of SoundPLAN
(Fig. 3).
Figure 3: Digital Ground Model of the investigation area.
The interested area covers about 55 km2, with the Umbria Motordrome in its center. It
includes all the principal surrounding villages and ends at the beginning of the descending slopes of the hills on whose they are situated. The particular topographical disposition, even if exposes to noise the inhabited areas on the hills, at the same time protects the whole territory behind of them from all emissions, so that it was excluded in the present investigation.
The geographical data for DGM calculation (elevation lines and points) were imported from the Umbria Regional Technical Map, available in digital format. Once calculated, the digital ground model represents the basis on which all the objects in the examination area can be placed. All the buildings contained in the investigation area were also imported from the Umbria Regional Technical Map, in which the contours of buildings sections at the ground height are drawn. Both civil buildings and industrial structures were considered. Constructions act as a screen during the noise spreading so their elevation is very important, but since it wasn’t possible to know it, a constant mean height of 6 m was set for each of them (approximately the height of a two-floors building). This approximation is however too rough for the internal structures because of the very short distance from the racing track: noise screening is here very influenced by the dimensions of the buildings. Therefore an accurate survey of the real dimensions of structures inside the Motordrome was carried out, so they could be represented in their real shape. Particularly, these constructions include all the buildings, the protection and enclosure walls, the two stands and the embankments.
5.2 Racing track model The shortage of racing tracks theme studies and the lack of specific dedicated models not
allowed to learn a lot about them, leaving therefore the assignment of the analysis and the choice of the best model configuration. It was necessary to study acoustic features and morphology to develop a model that fits Umbria Motordrome racing track.
The applied geometrical scheme is a linear source positioned along the center line of the track: this kind of source reproduces the layout of the circuit and the real mean path of vehicles and it is able to well approximate its acoustic features.
In comparison with the most used road models, the height of source is kept to 0.5 m above the ground, because of most part of racing vehicles are road-derived and have the same mean emission height.
A lane of reflecting smooth asphalt was positioned under the source, modeled as a no emission road which have the same width of the racing track: its purpose is to reproduce the noise contribution caused by reflecting sound waves on the surface of track.
The source was considered active for the whole day period, from 6,00 to 22,00, with a constant emission level: this solution allowed to compare the values of Leq(A) directly with those of other modeled sources, which use standards developed for such time period.
ISO 9613-2 1996 spreading standard was finally chosen considering it was created for outdoor noise propagation, especially for wide areas as the considered one.
5.3 Other sources models The Motorway Link 06 was modeled as "road", in compliance with RLS 90 standard:
according to this model, road dimensions, type of road surface, traffic and speed data are required. The source is considered linear and situated along the middle of the outer lane for each way, 0.5 m above the road surface. In this case, being a 4-lane road, it is represented by two linear sources above the center line of the two inside lanes. Traffic and speed data were supplied by Umbria Region Mobility Observatory, using surveys performed between May and June 2000, elaborated according to the standard for the only day time range (6,00-22,00).
The Foligno-Terontola Railroad Line was modeled as "railroad", according to SCHALL 03 standard. As the road model RLS 90, it considers day and night time ranges for which it calculates the mean noise level. Considering the only day time period, it was possible to extract from the Umbria Regional Railroads Timetable the number and type of the passing trains, classifying them according to their categories (Regional and Interregional, Intercity). For these types of trains it was also possible to find out parameters required by the standard, such as maximum speed, length, percentage of disk brake. In Table 2 is shown a summary of the main input data of the standard above mentioned.
Table 2: Input data for the Motorway Link 06 (left) and Railroad Line (right). RLS 90 standard SCHALL 03 standard road flooring: reflecting smooth asphalt binary on ballast bed with wooden ties light vehicles mean speed: 100 km/h radius of curves: >500 m heavy vehicles mean speed (>2.8 t): 80 km/h Regional/Interregional: 36 trains average traffic: 856 cars/h; 133 trucks/h Intercity: 1 train
5.4 Model validation The aim of the validation procedure is to compare experimental data to the software
predicted ones. It allows to test and verify the model reliability, that is the main purpose of the work. Validation procedure consists of three fundamental steps.
1) Source calibration: the calibration of racing track emission is performed using only data obtained in Position 2, in the center of the circuit. All the measured noise levels were acquired with the contemporary emission of Motorway Link 06 and Foligno-Terontola Railroad. Therefore, during all the calibration operations these two other sources were considered as active. One-third octave band noise level spectrum (25 Hz÷20 KHz) measured in the Position 2 with linear weightings is assigned to the emission of the racing track. A simulation is performed and the noise level is calculated for each one-third octave band. Values are then compared to the measured ones, evaluating the differences for each band; the differences are then added to the
spectrum values previously attributed to the source. Using this new spectrum, another simulation is carried out: such iteration process is repeated until calculated differences between measured and predicted one-third octave band levels are negligible: the source could be now considered calibrated.
2) External points predicted levels calculation: after assigning emission spectrum to the racing track by calibration procedure, a new simulation is performed to calculate Leq(A) values in the external selected points. Also in this operation all modeled sources were considered active (Motordrome, Motorway Link, Railroad Line).
3) Comparison between predicted and measured data in the external points: after calculating, Leq(A) predicted values were compared to those experimentally measured in the external points during the surveys. In such points the reliability of the model is as greater as smaller are the differences found.
Prediction model validation was carried out in three different days; results are shown in Tables 3 and 4.
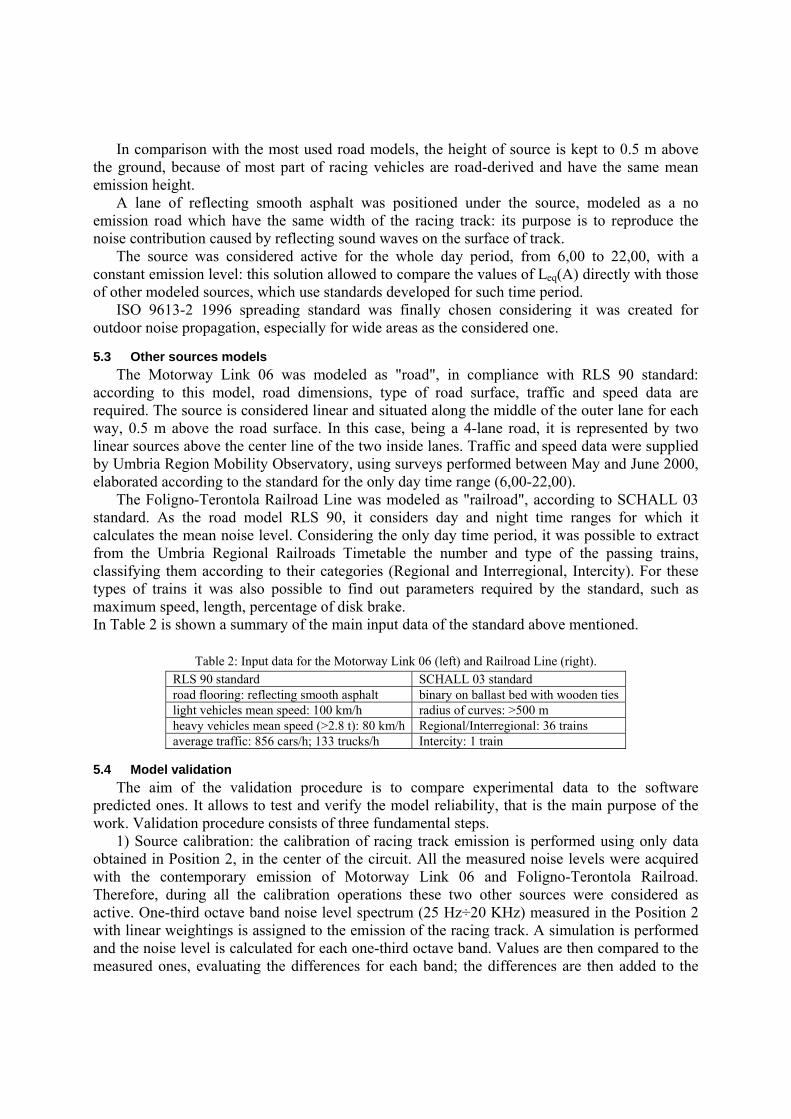
Table 3: Prediction model validation in the external sensitive receivers (Italian Championships, 24/07/2005).
Point Simulated Leq(A) [dB(A)]
Measured Leq(A) [dB(A)]
Difference [dB(A)]
Distance Point-Position 2
[m] Monte Sperello 49.6 53.4 -3.8 1330 Monte Melino 66.7 63.5 3.2 2010
Castelvieto 55.2 55.2 0 2080 Taverne 65.9 62.7 3.2 1850
Villa 49.2 48.6 0.6 2680 Soccorso 46.9 48.2 -1.3 2550 Magione 52.1 49.7 2.4 3420
Differences between simulated and calculated data in the external sensitive receivers show
that the model fits well the real noise emission at high distances. The mean difference is about 2 dB(A), for a mean distance of about 2270 m.
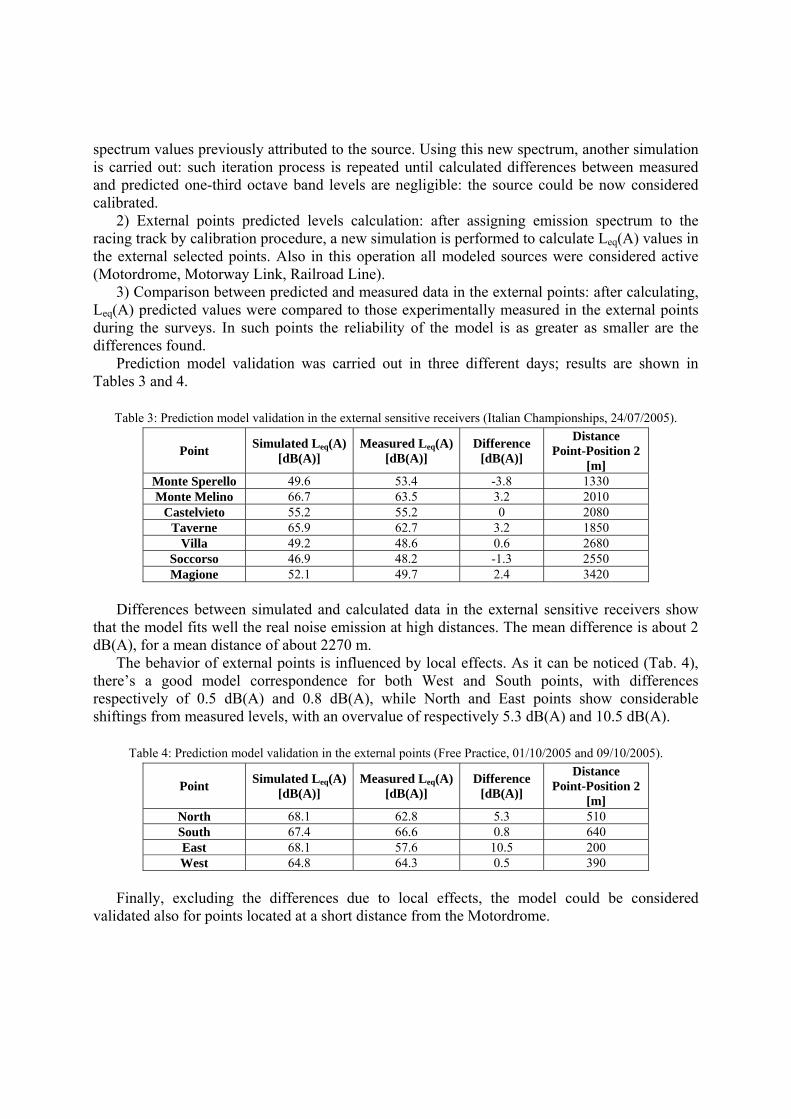
The behavior of external points is influenced by local effects. As it can be noticed (Tab. 4), there’s a good model correspondence for both West and South points, with differences respectively of 0.5 dB(A) and 0.8 dB(A), while North and East points show considerable shiftings from measured levels, with an overvalue of respectively 5.3 dB(A) and 10.5 dB(A).
Table 4: Prediction model validation in the external points (Free Practice, 01/10/2005 and 09/10/2005).
Point Simulated Leq(A) [dB(A)]
Measured Leq(A) [dB(A)]
Difference [dB(A)]
Distance Point-Position 2
[m] North 68.1 62.8 5.3 510 South 67.4 66.6 0.8 640 East 68.1 57.6 10.5 200 West 64.8 64.3 0.5 390
Finally, excluding the differences due to local effects, the model could be considered
validated also for points located at a short distance from the Motordrome.
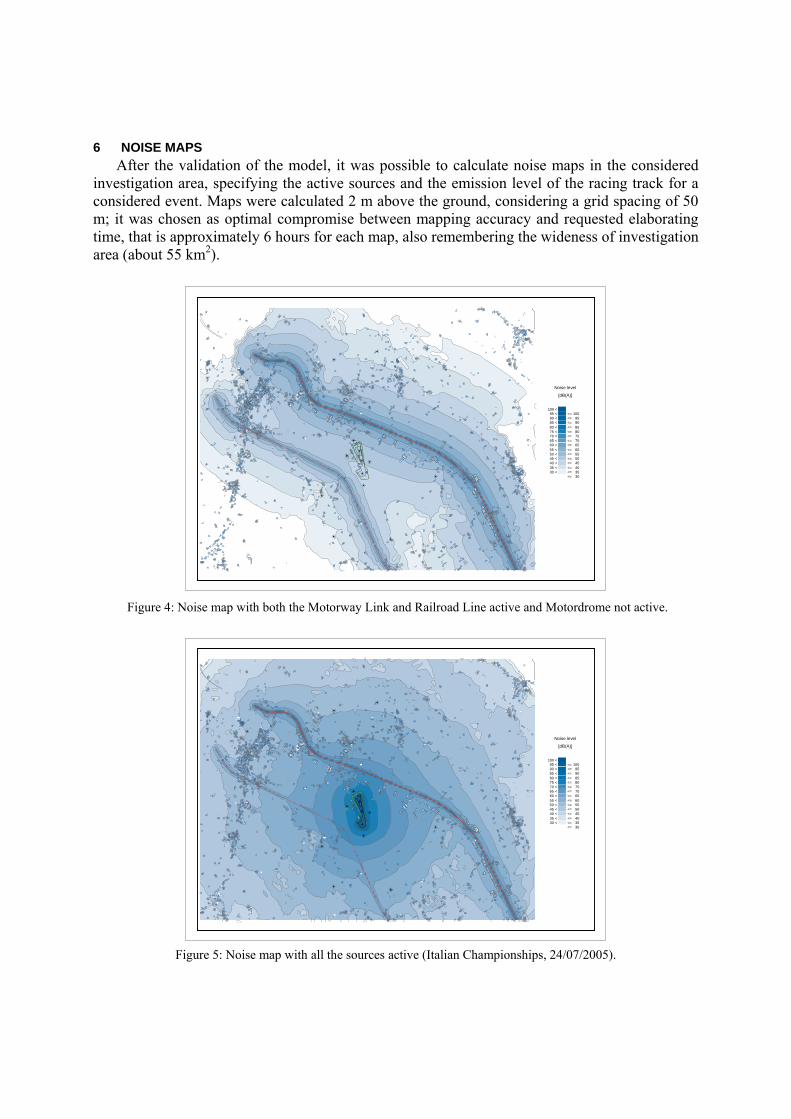
6 NOISE MAPS After the validation of the model, it was possible to calculate noise maps in the considered
investigation area, specifying the active sources and the emission level of the racing track for a considered event. Maps were calculated 2 m above the ground, considering a grid spacing of 50 m; it was chosen as optimal compromise between mapping accuracy and requested elaborating time, that is approximately 6 hours for each map, also remembering the wideness of investigation area (about 55 km2).
Noise level
[dB(A)]
100 < 95 < <= 10090 < <= 9585 < <= 9080 < <= 8575 < <= 8070 < <= 7565 < <= 7060 < <= 6555 < <= 6050 < <= 5545 < <= 5040 < <= 4535 < <= 4030 < <= 35
<= 30
Figure 4: Noise map with both the Motorway Link and Railroad Line active and Motordrome not active.
Noise level
[dB(A)]
100 < 95 < <= 10090 < <= 9585 < <= 9080 < <= 8575 < <= 8070 < <= 7565 < <= 7060 < <= 6555 < <= 6050 < <= 5545 < <= 5040 < <= 4535 < <= 4030 < <= 35
<= 30
Figure 5: Noise map with all the sources active (Italian Championships, 24/07/2005).
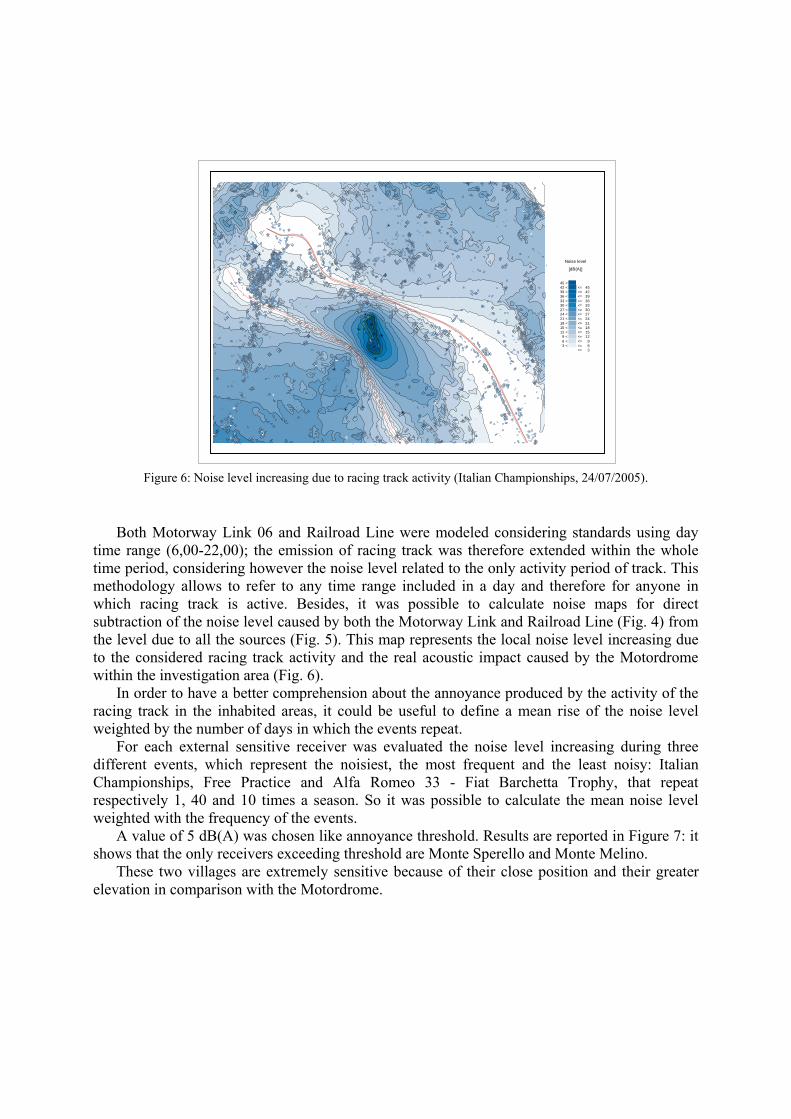
Noise level
[dB(A)]
45 < 42 < <= 4539 < <= 4236 < <= 3933 < <= 3630 < <= 3327 < <= 3024 < <= 2721 < <= 2418 < <= 2115 < <= 1812 < <= 15
9 < <= 126 < <= 93 < <= 6 <= 3
Figure 6: Noise level increasing due to racing track activity (Italian Championships, 24/07/2005).
Both Motorway Link 06 and Railroad Line were modeled considering standards using day
time range (6,00-22,00); the emission of racing track was therefore extended within the whole time period, considering however the noise level related to the only activity period of track. This methodology allows to refer to any time range included in a day and therefore for anyone in which racing track is active. Besides, it was possible to calculate noise maps for direct subtraction of the noise level caused by both the Motorway Link and Railroad Line (Fig. 4) from the level due to all the sources (Fig. 5). This map represents the local noise level increasing due to the considered racing track activity and the real acoustic impact caused by the Motordrome within the investigation area (Fig. 6).
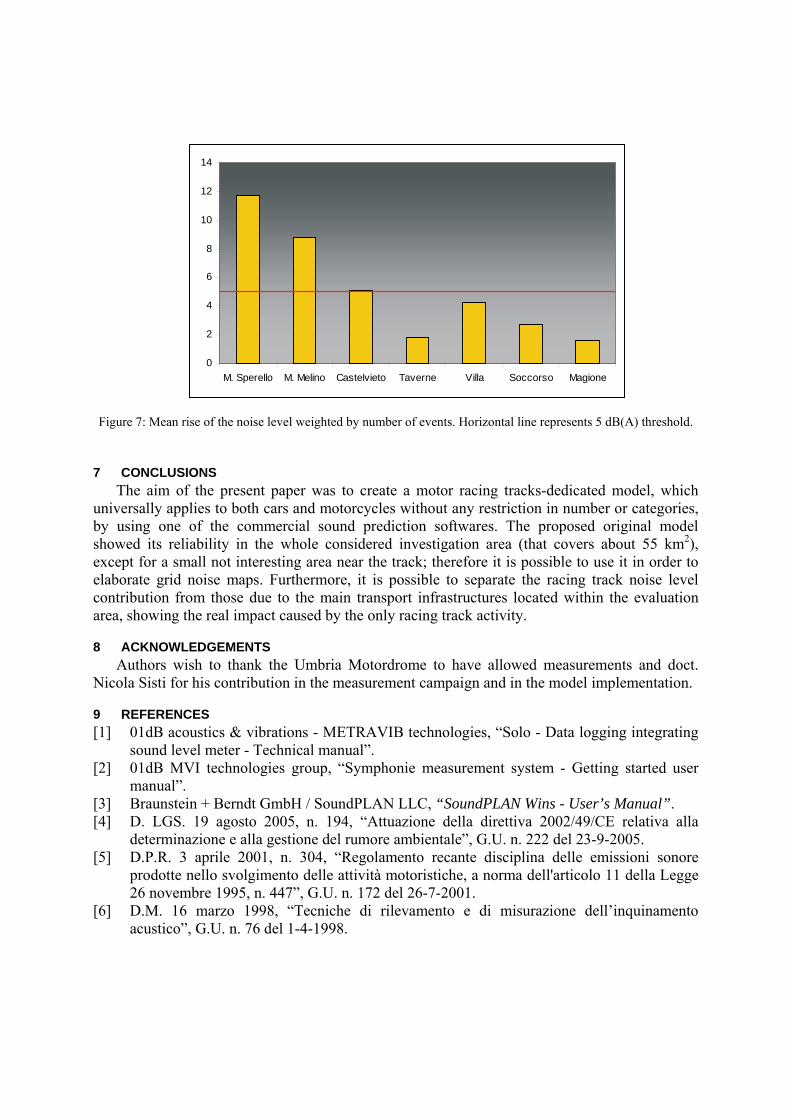
In order to have a better comprehension about the annoyance produced by the activity of the racing track in the inhabited areas, it could be useful to define a mean rise of the noise level weighted by the number of days in which the events repeat.
For each external sensitive receiver was evaluated the noise level increasing during three different events, which represent the noisiest, the most frequent and the least noisy: Italian Championships, Free Practice and Alfa Romeo 33 - Fiat Barchetta Trophy, that repeat respectively 1, 40 and 10 times a season. So it was possible to calculate the mean noise level weighted with the frequency of the events.
A value of 5 dB(A) was chosen like annoyance threshold. Results are reported in Figure 7: it shows that the only receivers exceeding threshold are Monte Sperello and Monte Melino.
These two villages are extremely sensitive because of their close position and their greater elevation in comparison with the Motordrome.
0
2
4
6
8
10
12
14
M. Sperello M. Melino Castelvieto Taverne Villa Soccorso Magione
Figure 7: Mean rise of the noise level weighted by number of events. Horizontal line represents 5 dB(A) threshold.
7 CONCLUSIONS The aim of the present paper was to create a motor racing tracks-dedicated model, which
universally applies to both cars and motorcycles without any restriction in number or categories, by using one of the commercial sound prediction softwares. The proposed original model showed its reliability in the whole considered investigation area (that covers about 55 km2), except for a small not interesting area near the track; therefore it is possible to use it in order to elaborate grid noise maps. Furthermore, it is possible to separate the racing track noise level contribution from those due to the main transport infrastructures located within the evaluation area, showing the real impact caused by the only racing track activity.
8 ACKNOWLEDGEMENTS Authors wish to thank the Umbria Motordrome to have allowed measurements and doct.
Nicola Sisti for his contribution in the measurement campaign and in the model implementation.
9 REFERENCES [1] 01dB acoustics & vibrations - METRAVIB technologies, “Solo - Data logging integrating
sound level meter - Technical manual”. [2] 01dB MVI technologies group, “Symphonie measurement system - Getting started user
manual”. [3] Braunstein + Berndt GmbH / SoundPLAN LLC, “SoundPLAN Wins - User’s Manual”. [4] D. LGS. 19 agosto 2005, n. 194, “Attuazione della direttiva 2002/49/CE relativa alla
determinazione e alla gestione del rumore ambientale”, G.U. n. 222 del 23-9-2005. [5] D.P.R. 3 aprile 2001, n. 304, “Regolamento recante disciplina delle emissioni sonore
prodotte nello svolgimento delle attività motoristiche, a norma dell'articolo 11 della Legge 26 novembre 1995, n. 447”, G.U. n. 172 del 26-7-2001.
[6] D.M. 16 marzo 1998, “Tecniche di rilevamento e di misurazione dell’inquinamento acustico”, G.U. n. 76 del 1-4-1998.