Embed Size (px)
Citation preview
INTELLIGENCE, PERSONALITY AND GAINS FROM
COOPERATION
IN REPEATED INTERACTIONS
EUGENIO PROTO, ALDO RUSTICHINI, AND ANDIS SOFIANOS
Abstract: Intelligence and personality significantly affect social outcomes of indi-viduals. We study how and why these traits affect the outcome of groups, lookingspecifically at how these characteristics operate in repeated interactions providingopportunity for profitable cooperation. Our experimental method creates two groupsof subjects who are similar but have different levels of certain traits, such as higheror lower levels of intelligence, Conscientiousness and Agreeableness. We find thatintelligence has a large and positive long-run effect on cooperative behavior whenthere is a conflict between short-run gains and long-run losses. Initially similar,cooperation rates for groups with different intelligence levels diverge, declining ingroups of lower intelligence, and increasing to reach almost full cooperation levels ingroups of higher intelligence. Cooperation levels exhibited by more intelligent sub-jects are payoff sensitive, and not unconditional. Personality traits have a natural,significant although transitory effect on cooperation rates.JEL classification: C73, C91, C92, B83Keywords: Repeated Prisoner’s Dilemma, Cooperation, Intelligence
1. Introduction
Intelligence and personality affect individual behavior in social environments.
With no interaction, as in single-agent decision problems, the relationship is straight-
forward. For example, when the task involves generosity to others, and the trait is
the Altruism facet of Agreeableness, we can expect generous behavior to increase
with the Altruism score; when the task is a cognitive task (as in a parlour game) we
can expect behavior to be closer to optimal in individuals with higher intelligence.
Date: September 27, 2016.The authors thank several co-authors and colleagues for discussions on this and related re-
search, especially Gary Charness, Pedro Dal Bo, Drew Fudenberg, Guillaume Frechette, GianlucaGrimalda, John Kagel, David Levine, Josh Miller, Mahnaz Nazneen, Andrew Oswald, AntonioPenta, Doris Pischedda, Louis Putterman, Carlo Reverberi, Andrew Shotter. and the participantsof the NBER Economics of Culture and Institutions 2015 Meeting in Boston. We thank CAGE(The Center for Competitive Advantage in the Global Economy) and the Behavioural Science GlobalResearch Priority for generous funding. AR thanks the NSF, grant SES-1357877. AS thanks thesupport by the Economic and Social Research Council [grant number ES/J500203/1].

2 EUGENIO PROTO, ALDO RUSTICHINI, AND ANDIS SOFIANOS
When the interaction is strategic, instead, the link may be complex. If the interac-
tion is simple, as in strictly competitive games, the link might be the one we have
seen for single-agent problems. But in games where equilibrium does not provide
us with a unique solution, a completely new approach is needed. This is what we
develop here. First, consider the matter of intelligence. We use here the widely
accepted definition proposed in a 1996 report by a Task Force created by the Board
of Scientific Affairs of the American Psychological Association (Neisser et al., 1996).
There, intelligence is defined as “the ability to understand complex ideas, to adapt
effectively to the environment, to learn from experience, to engage in various forms
of reasoning, to overcome obstacles by taking thought.” If this definition is adopted,
the relationship between intelligence and outcomes for a single individual is natural
and clear. Higher intelligence functions, everything else being equal, as a technolog-
ical factor; it allows larger, faster and better levels of production. This prediction
is natural and is also supported by extensive research in psychology and economics
(Neal and Johnson, 1996; Gottfredson, 1997; Bowles et al., 2001; Heckman et al.,
2006; Jones and Schneider, 2010)
The relationship between intelligence and outcomes is less clear when one instead
considers the link between intelligence and strategic behavior, and when one seeks
to explain how the outcomes of groups are influenced. The technological factor
becomes less important, since social outcomes depend less on skill and more on the
behavior of others. A conceptual link is missing.
Choice as a cognitive task. A possible conceptual link between intelligence and be-
havior in social situations is to view choice in economic and social interactions as a
cognitive task; the link follows as a corollary. This produces the general view that
intelligence reduces behavioral biases (e.g. Frederick, 2005; Oechssler et al., 2009;
Dohmen et al., 2010; Benjamin et al., 2013). For example, higher intelligence may
reduce violations of transitivity; or, in choice under uncertainty, the behavior of
subjects with higher intelligence is better described by expected subjective utility.
When we apply this intuition to behavior in strategic environments, we are led to
the conjecture that more intelligent individuals in real life - and more intelligent
subjects in an experiment - will exhibit a behavior closer to the game theoretic
predictions. When refinements of the Nash concept are relevant, particularly sub-
game perfection, behavior more in line with the prediction of the refinement for the
individual is expected in subjects of higher intelligence.
This prediction finds some support when games are strictly competitive (such as
the Hit 15 game in Burks et al. (2009)). Palacios-Huerta and Volij (2009) show

INTELLIGENCE AND PERSONALITY IN REPEATED INTERACTIONS 3
that individuals who are better trained (or better able) to solve complex problems
by backward induction make choices that are closer to game theoretic predictions
in the centipede game. In a repeated beauty contest experiment, Gill and Prowse
(forthcoming) show that more intelligent individuals demonstrate better analytic
reasoning and thus converge faster to the unique Nash equilibrium.
While these contributions provide important insights into the way cognition af-
fects reasoning on strategic interactions, fundamental questions remain. First, in
games that are not strictly competitive, and perhaps more relevant for social behav-
ior, the prediction fails. This occurs already in the case of one-shot games. In Burks
et al. (2009), the authors additionally study the behavior of subjects in a sequential
trust game. Using a strategy method to identify choices as first and second mover,
and relating this behavior to the intelligence of the subjects, the authors find that
initial transfers are increasing with the IQ score, a behavior which is further from
the prediction of the sub-game perfect equilibrium, and so the opposite of what
we should expect according to the general hypothesis. Similarly, transfers as second
movers among the more intelligent subjects are higher when the first mover transfers
more, and smaller in the opposite case. A second and more important consideration
is that a unique strategic behavior is more the exception than the rule: for example,
repeated games generally present a multiplicity of equilibria. Thus, games with a
unique Nash equilibrium cannot address the crucial issue for the social sciences of
how individuals coordinate to reach one among many possible equilibria. Game
theory and the initial intuition of modeling strategic behavior as a cognitive task
leave us with no useful prediction.
Strategies as rules. To progress, we need to consider choice as a cognitive task, and
to think of strategies as rules. This paper shows that this approach is fruitful.
When we consider performance of players in isolation (as opposed to performance in
games), evidence suggests that intelligence may affect implementation of strategies
or, more generally, of rules – even in simple tasks. Duncan et al. (2008) label one
specific form of failure as goal neglect; that is, while an individual knows he should
apply a rule, and is able to state the rule if asked, he nevertheless fails to apply
it. Patients with major damage of the frontal lobes exhibit this when executing the
Wisconsin Card-Sorting Task. They have to categorize a card sometimes depending
on the color (“color” rule) and other times depending on the shape (“shape” rule).
Patients may fail to adjust to a change from one rule to another, even if they know
that the rule has changed. The research on goal neglect has shown that a similar
failure occurs in individuals with lower intelligence. Goal neglect is identified in
4 EUGENIO PROTO, ALDO RUSTICHINI, AND ANDIS SOFIANOS
a task in which subjects have to consider pairs of numbers and letters presented
sequentially (for example, (A, 7), (S,M), (2, 6).) They have initially to follow this
rule: read the item on the right, if it is a letter, and ignore it, if a number. So, in
our example they should read the letter M in the second pair and nothing from the
other two pairs. At some random interval, a plus or a minus sign appears which
modifies the rule. The plus means “continue as before”, and the minus means “read
the item on the left,” again, only if it is a letter. With subjects of lower intelligence,
the modifier of the rule (the plus or the minus) tends to be ignored. The result is
a high correlation between IQ score and the ability to adjust to the switch required
by the appearance of the minus sign.
Experimental design. The main hypothesis we test is the potential association be-
tween intelligence and strategic behavior in groups. The strategic interaction takes
place between two players, but in a pool similar in intelligence level. We rely on a
well-established methodology in the experimental analysis of repeated games, and
use the same setting as in Dal Bo and Frechette (2011) (henceforth DBF), where
they show how, with appropriate probability of continuation and payoffs in place,
subjects in a repeated Prisoner’s Dilemma game with a random probability of termi-
nation may collectively converge to cooperation equilibria. We test whether higher
intelligence in a complex environment (such as repeated social interaction) favors a
more flexible, effective approach that allows processing of richer information, so that
higher intelligence allows more efficient equilibria to be reached. Furthermore, we
use the same methodology to test whether other personality features have an effect
on the way subjects coordinate in the different equilibria. In particular, we consider
groups homogeneous in terms of levels of Conscientiousness and Agreeableness.
An open question left when we use this methodology is if we are missing something
important when individuals are not homogeneous, hence if interactions between
subjects with different characteristics, especially in intelligence, generate specific
behavior. Related literature (Camerer et al., 2002; Hyndman et al., 2012) has shown
that some subjects in a laboratory setting tend to act with the aim of disciplining
the others, and so, it is plausible to link this behavior with intelligence levels. At the
same time, it is also plausible to imagine that more intelligent subjects might exploit
their cognitive advantage to extract surplus from less intelligent players, rather than
trying to coordinate on more efficient equilibria.
For this reason we also run a series of sessions where subjects are not separated by
any specific characteristic, and we compare the results with the outcomes in settings
where subjects are separated by different characteristics. Our results support the
INTELLIGENCE AND PERSONALITY IN REPEATED INTERACTIONS 5
first hypothesis that less intelligent subjects seem to benefit from more intelligent
participants by learning to play more efficiently.
Earlier experimental work provides some support for some of the hypotheses we
test here. Jones (2008) studies the cooperation rates in experiments on repeated
Prisoner’s Dilemma (PD) games conducted at different universities by analyzing the
differences that emerge according to the average SAT score of participating univer-
sities at that time. He finds that the cooperation rate increases by 5 to 8 percent
for every 100 points in the SAT score. Of course, the evidence is indirect: students
at those universities differed on a large variety of characteristics, and each of them
could have been used as the variable of interest in the correlation. Furthermore this
analysis can provide only limited insights on the mechanism linking intelligence and
strategic behavior. However, such evidence is broadly consistent with the findings
we present here.
Our results – summarized in the abstract – have potentially important implica-
tions for policy. While the complex effects of early childhood intervention on the
development of intelligence are still currently being evaluated (e.g. Heckman, 2006;
Brinch and Galloway, 2012; Heckman et al., 2013), our results suggest that any such
effect would potentially enhance not only the economic success of the individual,
but the level of cooperation in society (at least when interactions are repeated).
Along similar lines, Mani et al. (2013) have recently shown that poverty directly im-
pedes cognitive function; therefore, our results suggest the possibility that poverty
enhances conflict and hence policy tackling poverty could be effective in avoiding
conflicts.
To the best of our knowledge, we are the first to analyze the effect of group intelli-
gence on the level of cooperation in a setting with repeated interactions. There are,
however, several strands of literature analyzing the effect of individual heterogeneity
on strategic behavior.
The literature emphasizes how subjects’ heterogeneity in terms of different degrees
of sophistication determines whether the strategies adopted are more or less rational
(e.g. Nagel, 1995; Stahl and Wilson, 1995; Costa-Gomes et al., 2001; Costa-Gomes
and Crawford, 2006; Agranov et al., 2012; Alaoui and Penta, 2015). Our findings
are consistent with this literature, but the results also go a step further by showing
that intelligence plays a role in the selection of different Nash equilibria.
Kagel and McGee (2014) investigate the role personality plays in finitely repeated
PD games, and find that in the first stage of a supergame, cooperative behavior is
significantly related to Agreeableness. We find a similar effect in the first period of
our experimental sessions, where agents play a series of infinitely repeated PD, but

6 EUGENIO PROTO, ALDO RUSTICHINI, AND ANDIS SOFIANOS
in our experiment this effect vanishes with experience. The effect of risk aversion in
an infinitely repeated setting is ambiguous. We – along with Dreber et al. (2014) and
Davis et al. (2016) – find no systematically significant effect of risk aversion on the
cooperation rates. By contrast, Sabater-Grande and Georgantzis (2002) show that
when individuals are grouped according to risk aversion, the effect on cooperation
is negative. Our results shed perhaps some light on this apparent contradiction: the
Cautiousness facet of Conscientiousness, like risk aversion, has a negative effect on
cooperation only in the treatment where individuals are more homogeneous along
this dimension.
Our analysis shows that intelligence is the only trait that can affect cooperation
in the long run, and only in games with a conflict between short- and long-run gains:
this is consistent with the view that individuals in infinitely repeated interactions
are motivated primarily by strategic, payment-maximizing considerations.1
A large experimental literature analyzes cooperation with repeated interaction,
and points out, in different ways, that flexibility and the capacity to adapt to a com-
plex environment are the key factors in allowing partners to cooperate within each
other. Cooperation has been shown to be sustainable in experiments with random
termination (e.g. Roth and Murnighan, 1978; Holt, 1985; Feinberg and Husted, 1993;
Palfrey and Rosenthal, 1994), and also in experiments with fixed termination (e.g.
Selten and Stoecker, 1986; Andreoni and Miller, 1993). In experiments with fixed
termination, however, the level of cooperation is substantially lower (e.g. Dal Bo,
2005). Other elements can affect cooperation in a repeated interaction. Aoyagi and
Frechette (2009) show that the level of cooperation increases with the quality of the
signal if public monitoring is allowed. Duffy and Ochs (2009) find that cooperation
increases as subjects gain more experience under fixed matching, but not under ran-
dom matching. DBF show that individuals learn to cooperate after a sufficiently
large number of interactions, but only when the benefits of cooperation in the stage
game are big enough. Blonski et al. (2011) emphasize the effect of the discount
factor. All these contributions suggest that the strategies leading to cooperation
or defection, in a repeated interaction setting, are extremely complex because they
are sensitive to a very large number of factors. Furthermore, strategies leading to
cooperation are unlikely to be based on a fixed rule. On the contrary, they need to
be flexible in the sense of adapting to the circumstances. In this respect, Fudenberg
et al. (2012) show that individuals adapt when they play their strategies in order to
1See Dal Bo and Frechette (2016) for a survey on experimental results in infinitely repeatedgames.
INTELLIGENCE AND PERSONALITY IN REPEATED INTERACTIONS 7
increase the possibility of coordinating on the most profitable cooperative equilib-
ria, while Friedman and Oprea (2012) show that when agents are able to adjust in
continuous time, cooperation rates are higher.
The paper is organized as follows: in section 2 we present the hypotheses driv-
ing our research; in section 3 we illustrate our experimental design; in section 4
we present the role of the conflict between short-run gain and long-run loss, and
we show how intelligence modulates the effect on strategic behavior (strategy im-
plementation). In section 5 we investigate how intelligence affects strategic choice.
Section 6 examines the effect of two important traits (Conscientiousness and Agree-
ableness) on behavior. Section 7 considers the time to decide and what it teaches
us. Section 8 concludes. In appendix C, we present the details of the experiment de-
sign, the time-line of the experiment and the dates and sample sizes of each session.
Appendix D presents descriptive statistics and finally, appendix H presents some
additional analysis. In supplementary material online we make the following avail-
able: the letter we circulated to recruit subjects, the experiment’s instructions, and
the questionnaire completed by the subjects at the conclusion of the experiment.2
2. Intelligence, Personality and Strategic Behavior: Hypotheses
We study how repeated interaction among players is affected by their intelligence
and personality. Our main treatment studies subjects clustered in different groups
according to characteristics of personality; the key behavioral variable is the pattern
of choices. In a repeated game with high discount, the set of sub-game perfect
equilibrium outcomes is large, so the analysis of the effect of personality, or any
working hypothesis, may seem hard at first sight. However, experimental evidence
on subjects’ behavior indicates that the set of observed outcomes is considerably
smaller. Typically subjects reach a tacit (the only communication occurs through
history of actions) agreement on outcomes that are efficient within the equilibrium
set (constrained efficient). The outcomes are also simple to implement; for example,
a formulation of the strategy profile with a finite state automaton is natural, and
the number of the states of the automaton is small. Finally, the agreement is usually
reached on outcomes that are at least approximately fair, within the limits imposed
by the payoff of the game. We summarize these criteria as an assumption to organize
our analysis:
2Available from the page http://www2.warwick.ac.uk/fac/soc/economics/staff/eproto/
workingpapers/supplementary_material.pdf.
8 EUGENIO PROTO, ALDO RUSTICHINI, AND ANDIS SOFIANOS
Assumption 2.1. Subjects try to achieve a constrained efficient, simple outcome
with minimum difference among final payoffs of the players.
Our data in this paper offer additional support for assumption 2.1.
2.1. Strategic Reasoning and Rule Implementation. We investigate first how
intelligence affects strategic behavior in repeated interactions; we hypothesize that
intelligence may affect behavior in two different ways:
(i) Intelligence may affect the choice of the strategies. More intelligent individuals
may choose more profitable strategies in the available set. For example playing Tit-
for-Tat rather than Always Defect (AD) seems a better choice in an environment in
which cooperation has been observed in previous repeated games, and intelligence
may help a player to realize this. A very elementary way in which intelligence may
affect the choice of strategies is by affecting the strategies that are conceived by
the individual. For example, a strategy like AD in a repeated PD is very simple to
conceive. By contrast, a strategy prescribing to cooperate in the first round, defect
against a defection of the partner for three periods, and then return to cooperation
only after the partner has cooperated for the past three periods, is more complex
to ideate.
(ii) Intelligence may affect the implementation of the strategies. From a cognitive
point of view, a strategy can be defined as a set of rules, or conditional prescriptions,
assigning a choice of action in specific circumstances. More complex strategies
are more difficult to implement; for example the AD strategy does not require a
record of actions of the two players, and does not require a check of a sequence of
conditional statements, whereas the relenting strategy does. We hypothesize that
the performance failure of lower intelligence players is related, although different,
to that observed in goal neglect: an important difference is that the rule here is
generated by the subject’s decision, not assigned by the experimenter.
We formulate the general hypothesis:
Hypothesis 2.1. Higher intelligence subjects (i) find a better – that is, with higher
payoff – strategy in a given environment (this includes conceiving a larger set of
strategies); and (ii) are more consistent in their implementation. Given the aim
stated in assumption 2.1 (which holds independently of the intelligence level), higher
intelligence subjects will achieve, in general, higher rates of cooperation.
We will test part (ii) of the hypothesis in section 4 and part (i) in section 5;
in the rest of this section we will derive from them more specific predictions. Let
us first clarify some simple methodological issues. First, our hypotheses usually

INTELLIGENCE AND PERSONALITY IN REPEATED INTERACTIONS 9
state a relative, not an absolute, effect. We are claiming that subjects or groups
of higher intelligence will behave differently from those with lower intelligence at
least within the range of intelligence exhibited by the subjects participating in our
experiments. Of course our results have also implications on the effect of absolute
value of intelligence, but these effects will be very specific and hard to evaluate (e.g.
“individuals with an IQ score between 90 and 110 will behave this way in a repeated
game with this stage game and these payoffs and this continuation probability”).
Second, we are claiming a specific direction of this relative effect. Third, differential
effects are design specific. If no treatment effect is detected, this does not imply
that the effect is absent in general, but only for the experimental design we used. IQ
scores are very sensitive to differences in intelligence by having been selected over the
years as a result of the work of experimental psychologists; however, experimental
analysis of strategic behavior is only at a relatively early stage. As a result, in order
to offer more specific predictions we need to consider our experimental setup.
In our experiments we consider repeated games with a symmetric two-player two-
action stage game. The reason for this choice is that we have now a reasonably good
understanding of behavior of human subjects in this environment, and so we have
a fine-tuned tool for our analysis of a new issue, namely personality and strategic
behavior. After re-labeling of the action of one or both players, this game can be
written in the standard form:
(1)
L R
T a, a c, b
B b, c d, d
where a, b, c and d are four possibly different numbers. Again re-labeling if necessary
we can assume a ≥ d and b ≥ c.
2.2. Strategic behavior and Intelligence. In appendix A we present a detailed
and simple analysis of the equilibria of repeated games (with discount δ ∈ (0, 1)))
with such stage games. We will formulate our specific hypotheses on the basis of
this analysis. Here are our main conclusions.
First, the four different repeated games we use in the paper are representative
of different and very specific strategic situations. They are Prisoner’s Dilemma
PD (table 1), Battle of Sexes BoS (table 3), Stag Hunt SH (table 4) and a game
that we call the Battle of the Sexes with Compromise BoSC (table 2). The latter
may be considered as the Hawk-Dove game with the condition that the payoff from
(Hawk,Dove) is strictly larger than the mean of (Hawk,Dove) and (Dove, Hawk).
10 EUGENIO PROTO, ALDO RUSTICHINI, AND ANDIS SOFIANOS
The specific payoffs we used are reported in tables 1–4. Actions are labeled in
the paper with convenient mnemonic letters C and D for the PD, B (both players’
favorite action) and W for BoS and BoSC and finally S (stag) and H (hare) for SH.
In the analysis (appendix A) we show that the stage games we consider in this
paper cover the interesting cases of repeated games with stage games of the form
(1) above. The few (two) cases we do not address have no substantial independent
interest. The first is a stage game with a single equal outcome Nash equilibrium
which is efficient (this is case 3 in appendix A); we consider this game too trivial to
be worth analyzing experimentally, since the efficient equilibrium is obvious. The
other is mentioned in 4 (b), namely the PD with an efficient alternating equilibrium:
but the essential point of this game is covered by the BoSC.
The games we consider have natural and simple equilibria: the corresponding
action profiles outcomes are (S,S) in every round giving the SH efficient outcome;
an alternation between the action profiles giving the best outcome for one player
and the worst (among the positive ones) outcome for the second, that is (B,W) and
(W, B) for BoS, and joint cooperation (C, C) in every round for PD, when the
parameters make cooperation sustainable. In these equilibria the outcome in every
round is either a repetition of the same action profile, or an alternation between
two action profiles (in BoS). As we mentioned, game BoSC is new; it has a simple
outcome mirroring that of the BoS of alternating between (B, W) and (W, B); but
the compromise action profile (W,W) in every round gives a payoff (48, 48) compared
to the average of the two outcomes (52, 12) and (12, 52) given by alternating. The
positive and symmetric (10, 10) for the (B,B) profile (rather than (0, 0)) was chosen
to make the coordination on the constant outcome (W,W ) more difficult. In all
cases, an equilibrium that satisfies assumption 2.1 is easy to discover after simple
inspection of the stage game; that is, within the class of symmetric two-player two-
action stage games, a typical college student can easily identify the equilibrium, and
assume that the partner does too. The existing literature on experimental Repeated
Games confirms for PD, BoS and SH that the equilibria we describe as natural are
indeed typically the outcome. In light of these considerations, it is possible that,
when subjects are college students, there is no substantial difference in the ideation
of the possible strategies in the class of repeated games with a symmetric two-player
two-action stage game. To see these differences, research will have to adopt different
groups of subjects or a different class of games.
There is a specific difficulty in the case of the BoS which is clearer when we com-
pare it with the SH, a game where (as we are going to see later) there should be no
difference in implementation. The efficient equilibrium outcome in SH is particularly

INTELLIGENCE AND PERSONALITY IN REPEATED INTERACTIONS 11
simple to see, and achieving coordination on it is easy: the only tempting feature
of the choice of action H is the lack of risk associated with it. By comparison, the
alternating equilibrium in BoS is more complex. First, subjects have to understand
that alternation is a way to avoid the zero payoff outcomes, and they have to com-
municate this idea to their partner. Second, they have to agree of the order of the
alternation, and the only symmetric way to do this is to play randomly either action
in the early rounds, starting the alternation at the first instance of coordination on
a positive payoff outcome. Although these considerations are within the intellectual
reach of a college student, the details of the coordination process are more complex
in the BoS, hence there might be a difference in the speed at which subjects of dif-
ferent intelligence reach coordination and also the possibility that players of lower
intelligence never reach that point. Thus, we formulate:
Hypothesis 2.2. Subjects of higher intelligence are faster in achieving coordina-
tion in the efficient alternating equilibrium in BoS, whereas there is no substantial
difference in SH.
From the point of view of strategy implementation, instead, there are two classes
of games with a substantial difference concerning the tradeoff between gain from
deviation in the current round and loss from deviation in the continuation game. In
a first group (which includes BoS, SH, and in general the class 1, 2a, 3 in appendix
A) there is no tradeoff between gain from deviation in current round and change in
the continuation value: a deviation induces a loss in both. The other group (which
includes PD and BoSC, and in general classes 2b and 4 in appendix A) there is a
conflict: deviating from the equilibrium action profile induces a gain in the current
payoff, and a loss in the continuation value.
This opens the possibility of errors depending on the intelligence level of the
subjects, similar to the goal neglect concept described in section 1. When there
is a conflict between short- and long-term gains, subjects of lower intelligence may
neglect to follow the rule dictated by the chosen strategy, and may play to maximize
their earnings in the short term. Accordingly, a fundamental difference between SH
and BoS on one hand and PD and BoSC on the other is that at the equilibrium
action profile there is a conflict present in every round between short-run gain from
deviation and long-run loss; choosing an action different from the equilibrium action
profile for that round induces a larger current payoff but a lower continuation value.
Instead, there is no such conflict in SH and BoS: deviating induces a lower payoff
both in the current round and in the continuation value. This justifies a specific
hypothesis in our environment:
12 EUGENIO PROTO, ALDO RUSTICHINI, AND ANDIS SOFIANOS
Hypothesis 2.3. The conflict between current gain and continuation value loss
from deviation in PD and BoSC produces a difference in cooperation rates across IQ
groups in these games. In SH and BoS, there is no conflict, and, thus, no difference
in the implementation between the IQ groups, once coordination is reached.
For the historical record, hypothesis 2.3 was formulated on the basis of the analysis
of behavior of subjects in the repeated PD . The game BoSC was identified, on the
basis of the analysis presented in section 2.2 and appendix A, as we searched for a
game with the conflict property but different from PD, to provide an independent
test of the hypothesis. The analysis shows that BoSC and PD are the only interesting
games in our class with this property. A test based on BoS and SH was another
clear implication of hypothesis 2.3, in its second part. Hypothesis 2.2 was natural
given the higher complexity of the proposed alternating equilibrium in BoS.
2.3. Strategic Behavior and Personality. Two of the Big Five factors are poten-
tially relevant for strategic behavior: Agreeableness and Conscientiousness. Agree-
ableness affects the social behavior of individuals; Conscientiousness influences the
effectiveness and orderliness of execution of tasks, in particular of cognitive tasks as
strategy implementation.
In the IPIP-NEO-120 inventory (Johnson, 2014) we use for measurement and con-
ceptualization of personality, Conscientiousness has six facets. Four are potentially
relevant in fostering cooperation in our context, because they insure an effective and
mindful implementation of the strategy, considered here as a rule of individual be-
havior; they are Self-Efficacy, Orderliness, Achievement-Striving and Self-Discipline.
Two other facets are more specific to the strategic side of our experiment: a higher
score in Dutifulness might prevent a subject from defecting; whereas a higher score
in Cautiousness might induce the individual to refrain from cooperation in PD, be-
cause it exposes her to a risk of defection of the other. Part of this effect may be
captured by risk aversion, but Cautiousness might have a distinct effect, and be par-
ticularly relevant when the individual has experienced past defection. In summary,
the first five facets might induce a more cooperative behavior; while Cautiousness
might have an opposite effect on the willingness of the individual to cooperate.3
Hypothesis 2.4. The facet Cautiousness of Conscientiousness may decrease un-
conditional cooperative behavior in Repeated PD; the other facets may increase it;
thus the overall effect of Conscientiousness is ambiguous, and may require analysis
of the facets.
3All the questions we used to assess the personality traits and their facets can be found in theonline supplementary material. See note 2.

INTELLIGENCE AND PERSONALITY IN REPEATED INTERACTIONS 13
Agreeableness has six facets; three are particularly relevant for behavior in Re-
peated Games. One, Altruism may indicate how much the payoff to the other player
matters to the subject. The other two, Trust and Cooperation, should affect how
likely they expect cooperative behavior from others (for example when choosing C
in PD), and how inclined they are to cooperate with others.
All these facets should clearly provide a motivation to cooperate. Our natural
hypothesis is then:
Hypothesis 2.5. Agreeableness increases unconditional cooperative behavior in Re-
peated PD through the facets of Altruism, Trust and Cooperation.
3. Experimental Design
Our design involves a two-part experiment administered over two different days
separated by one day in between. Participants are allocated into two groups ac-
cording to some individual characteristic that is measured during the first part, and
they are asked to return to a specific session to play several repetitions of a repeated
game. Each repeated game is played with a new partner. The individual characteris-
tics that we consider are: Intelligence, Agreeableness and Conscientiousness, across
different treatments that we will define as IQ-split, A-split and C-split, respectively.
In one treatment, participants are not separated according to any characteristic, but
rather allocated to ensure similar groups across characteristics; we define this the
combined treatment.
The matching of partners is done within each session under an anonymous and
random re-matching protocol. The group size of different sessions varies depending
on the numbers recruited in each week.4 Unless specified otherwise the length of
play of the repeated game during the second day part was 45 minutes. As usual,
we define as a supergame each repeated game played; period refers to the round
within a specific supergame; and, finally, round refers to an overall count of number
of times the stage game has been played across supergames during the session.
The exact way in which the allocation to different groups is made across the dif-
ferent treatments is detailed in Appendix C. Tables A.42 to A.48 show that subjects
4The bottom panels of tables A.1 up to A.7 list the sample size of each session across alltreatments. Participants were not directly informed of the number of subjects in their session, butthey could see how many people would take part prior to their entry to the lab.

14 EUGENIO PROTO, ALDO RUSTICHINI, AND ANDIS SOFIANOS
in the two different groups based on the specific characteristic of the different treat-
ments are otherwise reasonably similar.5 Only in one treatment, the C-split, can we
observe systematic differences in a group of variables. However, this is unlikely to
generate confounding as will be clear from the econometric analysis below.
Across all treatments, the subjects are not informed about the basis upon which
the split was made.6 In fact, in a subset of our sessions (IQ-split sessions only)
we ask the participants during the de-briefing stage (i.e., after all the tasks were
completed during the second day part) whether they understood the basis upon
which the allocation to sessions was made. Only one or two participants out of
the approximately 100 asked mentioned intelligence as the possible determining
characteristic; the rest appeared not to be aware of the allocation procedure (many
participants believed that the allocations were done randomly).
The different treatments administered were:
(1) Prisoner’s Dilemma PD, High Continuation Probability, δ = 0.75, IQ-split
(2) PD, Low Continuation Probability, δ = 0.5, IQ-split
(3) Battle of Sexes with Compromise BoSC (with δ = 0.75), IQ-split
(4) Battle of Sexes BoS (with δ = 0.75), IQ-split
(5) Stag-Hunt SH (with δ = 0.75), IQ-split
(6) PD) (with δ = 0.75), Combined
(7) PD (with δ = 0.75), Conscientiousness Split, C-split
(8) PD (with δ = 0.75), Agreeableness Split, A-split
Unless stated otherwise, all participants were non-economists who had not taken
any game theory modules or classes.7 A total of 792 subjects participated in the
final experimental sessions, earning on average around 20 GBP; the participation
5Furthermore, the University of Warwick, where almost all the experiments were conducted, be-longs to an elite group of UK universities with a population of students who are largely homogenousin term of socioeconomic background.
6We initially ran two sessions in the beginning where we informed participants about their Ravenscore as well as the average in the session, the cooperation rates of these sessions are presented insection F of the appendix and do not seem to be different from the other sessions without thisinformation. In general, it is arguable that when interactions are repeated, it is unlikely that thisinformation changes behaviour in the long run since subjects can infer other subjects’ strategicintelligence by repeatedly playing among each other. On the other side, informing subjects abouttheir relative level of intelligence might have an emotional effect that is difficult to predict.
7The recruitment was conducted with the DRAW (Decision Research at Warwick) system, basedon the SONA recruitment software. The recruitment ensured that the participants were selectedfrom across the university student population and represented a wide variety of degree courses,which were evenly divided across sessions. Some examples of the participants’ degree courses are:Accounting & Finance, Business, Film Studies, Physics, Psychology (see tables A.8 up to A.14 inappendix C for the full list of degree courses across the different treatments).

INTELLIGENCE AND PERSONALITY IN REPEATED INTERACTIONS 15
payment was 4 GBP. The software used for the entire experiment was Z-Tree (Fis-
chbacher, 2007). The Ethical Approval for the design was granted by the Humanities
and Social Sciences Research Ethics Committee at the University of Warwick under
the DRAW (Decision Research at Warwick) Umbrella Approval (Ref: 81/12-13).
All details about the design are in appendix C, descriptive statistics of the different
sessions and treatments, are in appendix D.
4. Conflict and goal neglect
In our general hypothesis 2.1 we identified two possible main directions of the
effect of intelligence. As we are going to see, consistency in strategy implementation
has the strongest effect, and we begin from that point. Our main substantive hy-
pothesis (2.3) predicts a difference in behavior between the two groups of subjects
with different intelligence in games (such as, in our design, PD and BoSC)) where
the natural equilibria (those satisfying assumption (2.1) and described in section
2.2 and appendix A) exhibit a conflict between short-term gain from deviation and
long-term loss.
4.1. Games with Conflict. We present here the evidence supporting hypothesis
2.3, focusing first on the repeated PD, where cooperation is likely in general groups
of subjects (as shown in DBF), and on the BoSC, both with high continuation
probability, δ = 0.75. The natural equilibria we consider are those giving (C,C)
outcome in all periods in PD (for example a pair of Grim Trigger strategies for each
player: the analysis of the empirical frequency of the strategies is developed later),
and those giving (W,W ) outcome for the BoSC (for example, a pair of strategies
where both players play W until either defects, and then play the mixed strategy
equilibrium). The feature common to the two games is the short-run gain (of 2
points in PD and 4 points in BoSC) at the equilibrium choice and the continuation
value loss from deviating. The difference between the two games is that for PD a
continuation payoff is easy to identify (play (D,D) in all periods); whereas what
to do after the agreement to play (W,W ) fails is harder to identify. Some natural
possibilities are switching to the mixed strategy or to alternate between (B,W ) and
(W,B), but coordinating on one of these is harder.
4.1.1. Differences in Cooperation and Compromise. In the top left panel of figure 1,
we present the evolution of cooperation in the low- and high-IQ sessions of the PD.8
The initial cooperation rates (first five supergames) are similar in the two groups,
but they progressively diverge until the rate reaches between 80 and 90 percent
8Similar patterns replicate when we consider each individual IQ session, see appendix F.
16 EUGENIO PROTO, ALDO RUSTICHINI, AND ANDIS SOFIANOS
for the high-IQ group, while remaining at about 40 percent for the low-IQ group.
The average individual payoff per round follows that of the cooperation rates (right
panel of figure 1). In figure 2 we report the cooperation rates for PD sessions where
individuals are not separated according to IQ (i.e. the combined treatment); in the
analysis of these sessions, we group players into statistical partitions of high (Raven
score larger than the specific session median) and low IQ. Here the cooperation rate
increases over time in both partitions but it is consistently higher among the high-
IQ partition’s subjects, who also earn higher payoffs per supergame.9 This pattern
lends support to the hypothesis that individuals with higher intelligence may try to
teach individuals with lower intelligence, as in Hyndman et al. (2012). We will see
below more evidence consistent with this hypothesis. The payoffs of both partitions
tend to grow and converge in the end, which seems to rule out the possibility that
more intelligent individuals might extract surplus from those less intelligent.
The top left panel of figure 3 reports the percentage of subjects reaching the
compromise outcome in the BoSC;10 the data are aggregated as in figure 1.11 The
figure clearly illustrates a difference in long-run behavior in compromise rates of the
two IQ groups. In the high-IQ group the fraction of subjects playing the compromise
outcome (W,W ) is higher than in the low-IQ group, with an overall trend which
seems positive for those in the high-IQ group and negative for those in the low-IQ
group. The bottom panel of figure 3 shows that the behavior in the first period is
similar in the two groups. The top middle panel of figure 3 shows that the low-IQ
group more frequently plays the coordination outcomes (W,B) or (B,W ), which
constitute a lower average payoff. The difference in this frequency is approximately
of the same size as the difference in the two groups’ compromise rates.
Therefore, in summary, we can say that: In PD and in BoSC the high-IQ group
has larger rates of cooperation and (respectively) compromise than the low-IQ group,
as hypothesis (2.3) predicts.
4.1.2. Effect of individual intelligence on cooperation and compromise. Tables 5, 6
and 7 estimate the effect of individual IQ, and show that the effect of intelligence
is not due to observable confounding factors at the individual levels and/or envi-
ronmental factors at the session levels (observable or not). In table 5 we use a
9Similar patterns replicate when we consider each individual session, see appendix F.10In the BoSC and later in the BoS we consider outcome rather than choice as the dependent
variable. In both games there are different natural equilibria: for example in BoSC alternatingbetween (W,B) and (B,W ), or compromising on (W,W ). So, it is easier to identify whether theyhave coordinated on the first or on the second by considering outcomes.
11Similar patterns replicate when we consider each individual session, see appendix G.

INTELLIGENCE AND PERSONALITY IN REPEATED INTERACTIONS 17
version of model A-1 to estimate the effect of IQ on cooperation rates and payoffs
by controlling for personality, gender, age and performance in a decoding task that
we consider to be an index of motivation.12 Crucially, we include session fixed ef-
fects, which allows us to separate in aggregate the effect of IQ from the effect of
the sessions’ environment, such as the interaction with individuals with similar in-
telligence.13 Column 1 of table 6 that estimates a version of the model A-3 leads to
similar conclusions.
Table 7 reports the same analysis, using model A-3, for the BoSC.14 Intelligence
has a highly significant effect on rates of compromise, and no other trait has a
significant effect. As we noted, corresponding to a higher frequency of compromise,
subjects of higher intelligence have a lower frequency of the outcomes (B,W ) or
(W,B) (see column 2 of table 7).
Furthermore, from table 5, we note that payoffs are on average increasing in IQ.
This effect is significant and large: between 4 and 6 experimental units for the PD.
The relevant comparison, since these are averages per period, is with the stage game
payoffs in table 1. These are gains per unit of time (rounds) and, on top of that,
we control for experience by introducing session fixed effects in the PD regressions,
so they can reasonably be considered independent of the faster decision time of
subjects in the high-IQ groups. No other individual characteristic is systematically
significant. Table 5 also shows that for PD the cooperation rate increases between
30-35 percent depending on the specific model; it is perhaps also interesting to note
that an individual characteristic which is significant is gender in PD (a reduction of
the cooperation rate in female subjects of around 6-7 percent).15 Agreeableness is
significant in some regressions in the PD, and, as we will explain later, the sign is
the expected one. The coefficients of all other individual traits are not statistically
significant, and this is also true for the BoSC (in table 7).
To further estimate the effects of individual intelligence and assess the effect of the
group intelligence, in table 8 we compare the effect of the treatment of separating
individuals according to their IQ group with the combined sessions. We note that
12See Appendix C.4 where we explain the task and argue for it being an index of motivation.13 To increase the power of our estimation, in these regressions we include all data concerning
the PD. Hence, we also use the low continuation probability treatment data, and the personalitysplit treatments that will be illustrated below.
14An important difference between table 6 and table 7 is that in table 7 we do not include sessionfixed effects. The reason is that, since we did not have a BoSC combined treatment, the sessions’dummies will explain an important portion of the variance otherwise explained by the coefficient ofIQ; given this high level of collinearity between these coefficients the estimation would be unreliable.For the same reason we we did not estimate model A-1 for the BoSC.
15This result is consistent with the literature (Dal Bo and Frechette, 2016)
18 EUGENIO PROTO, ALDO RUSTICHINI, AND ANDIS SOFIANOS
the cooperation rate in the low-IQ sessions is about 14 percent lower than in the
combined sessions, costing about 3.5 units per round. There is no significant differ-
ence between high-IQ sessions and combined sessions. From column 3 we derive an
estimate of the loss, in terms of payoffs, for any individual with a given level of IQ,
in participating in a low-IQ session. This is about 3 experimental units per round,
not considering the experience effect of being able to play more rounds (column 3).
This becomes about 3.9 units if we consider also the effect of the experience (column
6).
4.1.3. Evolution of Behavior over the Session. We cannot make specific predictions
for initial rates of cooperation in the two groups: subjects in the early stages of
the session know that they are facing repeated interactions within a match, and
repeated partners within the session, so it is difficult to predict what they are think-
ing about the behavior of others before they see how the others are playing. For
example, if the natural strategies in a game were complex, some initial difference
in behavior according to intelligence might be possible. It is a fact however that in
our sessions we consistently observed a very similar behavior in the initial periods
in the two groups. In our sample, the difference in behavior follows almost entirely
from experience.
The bottom panels of figure 1 show that there is no significant difference in the
first period. The first period cooperation choice for the PD is examined in detail in
table 9.16 In column 1, there is no significant effect due to the IQ level; considering
the other individual characteristics, only Agreeableness has a significant positive
effect in the expected direction of increasing the initial cooperation rate. This effect,
as we will argue later, is transitory. In the BoSC, figure 3 shows no difference in
the rate of compromise outcomes in the initial period (However, recall that in the
BoSC we are considering the outcome rather than the choice, the interpretation is
less straightforward because of the difficulty of achieving coordination in period 1
between pairs).17
As subjects play repeated games with different partners, their initial choices may
change. We examine how the difference in cooperation and compromise rates be-
tween the two groups develop, taking as benchmark the first-round choice of a player,
16Where we consider all PD data together, see footnote 13.17Moreover, in the debriefing questionnaire we asked subjects about their intrinsic motivation to
cooperate, and found no significant difference between the two IQ groups. Participants were askedwhether they agreed that they cooperate because: “I feel that is the right thing to do” and “Itmakes me feel nice”; there are no significant differences in the responses between the two IQ groups(p− value = 0.7402 and p− value = 0.2443 respectively).

INTELLIGENCE AND PERSONALITY IN REPEATED INTERACTIONS 19
who, by definition, is facing a new partner, and, hence, cannot draw on a history of
play. The estimated odds ratios in column 2 and 3 of table 6 (where we estimate
some specification of model A-2) show that players in high-IQ groups are increas-
ingly more likely to open with a cooperative choice (coefficient of the interaction
High-IQ*Period) if compared with the benchmark represented by the combined ses-
sions. This trend in the low-IQ session is smaller, although not significantly different
from the trend in the combined sessions. The C-split treatment has a significant
impact on the trend, as we will discuss below. Considering the trend of compromise
outcomes BoSC in column 3 of table 7 (where the benchmark is the low-IQ group),
we cannot detect any difference in the trends of the 1st rounds outcomes between
the high- and low-IQ groups. The reason could be that in the BoSC the difference
between high- and low- IQ groups appears faster than in the PD because coordina-
tion is probably more difficult in the BoSC than in the PD; we discuss the difficulty
of achieving coordination more extensively in section 5.2.
4.1.4. Cooperation with Low Continuation Probability. We have seen substantial dif-
ferences in the long-run rate of cooperation of the two groups of players, with more
intelligent groups achieving higher rates of cooperation. This could be explained by
an unconditional attitude: more intelligent players could have a generalized incli-
nation to cooperate in strategic environments. Here we reject this hypothesis, by
considering repeated games with the same PD stage game (payoffs again as in table
1), but lower continuation probability, δ = 0.5. Cooperation rates in all low-IQ
sessions decline from an initial 50 per cent to very low values (see panel B of figure
A.6 in appendix F). In the high-IQ sessions high rates of cooperation occur, but are
infrequent. In only one session (session 7) cooperation rates increase. In the other
high-IQ sessions (sessions 1, 3 and 5) cooperation declines or it is roughly stable as
in the low-IQ sessions. Figure 4 aggregates the different sessions; the broken blue
line represents session 7. If we exclude that exception, cooperation rates in the two
groups are similar, and low, as in Dal Bo and Frechette (2011) when they use the
same parameters we use in this treatment (Dal Bo and Frechette, 2011, p. 419:
figure 1, 3rd panel in top row). We conclude that subjects of higher intelligence
are not unconditional cooperators. In some cases they fail to establish high rates of
cooperation or even an upward trend.
4.1.5. Inconsistencies in the Strategy Implementation. We have seen that coopera-
tion and compromise rates in the low- and high-IQ groups are initially similar and
diverge later. Our hypothesis 2.3 predicts that they differ in consistency of strategy
implementation. Here we examine support for the prediction and for the hypothesis
20 EUGENIO PROTO, ALDO RUSTICHINI, AND ANDIS SOFIANOS
that such inconsistency explains the divergence in behavior. This hypothesis is sup-
ported: we see a cumulative effect of a small but significant difference in cooperation
and compromise induced by the choices of the partner in the past. These small dif-
ferences cumulate to produce large changes. Figures 5 and 6 illustrate how low-IQ
groups less frequently choose cooperation following cooperation of the partner in
the last period (left panels of both figures; the histograms report the analysis for
the entire session data). This lower C response to C of the partner in the previous
period may be due either to a higher general inclination to choose D, or to a switch
to D after a joint (C,C), choice.
The right panels of both figures 5 and 6 show that a significant part the decline
in cooperation is explained by a defection after a joint cooperation in the low-IQ
group, as goal neglect theory would suggest (the number of observations of joint
cooperation in this group is small, hence the higher standard errors). Following
defection, we see a very high rate of D choice in both groups; if anything, the rate
is higher in high-IQ group (see bottom middle panel): more intelligent players are
better at disciplining behavior of defectors, and, thus, they are better teachers.
Figure 7 shows the corresponding results for compromise rates in BoSC; the pat-
tern matches what we have seen in the PD, as hypothesis 2.3 predicts. In this case
the low-IQ group subjects are less likely to respond to a W choice of the partner
in the previous period making the same W choice in turn (left panels).18 After a
choice of the best-outcome action B by the partner the response is, in both groups,
a choice of B. The deviation to a B choice after a joint compromise choice (W,W )
is significantly and clearly higher for the low-IQ group (right panels of figure 7), as
the goal neglect hypothesis 2.3 proposes.
In tables 10 and 11 we use some variations of model A-2 in appendix B to analyze
how subjects react to partners’ choices.19 In table 10, we note that (as we saw
in figures 5 and 6), subjects’ choice at round 2 of each supergame depends on the
partners’ choices at 1, and this response increases with subjects’ IQ (see column 1
of table 10). The response is also increasing with time (column 2). The interaction
IQ*Partner Choice[t-1] seems significant in the first supergame as well (column
3). In table 11 we obtain comparable results for the BoSC. The likelihood of a
compromise outcome at round 2 is increasing in the compromise choice at round 1,
and this positive reaction is increasing with the subjects’ IQ (column 1) this attitude
18See the stage game matrix of the BoSC in table 2.19By introducing the individual fixed effect implied that we could not cluster the errors at the
individuals’ level. If we run a similar regression using individual random effect with errors clusteredat the individual levels would not change qualitatively the results

INTELLIGENCE AND PERSONALITY IN REPEATED INTERACTIONS 21
of reciprocation among the high-IQ groups is increasing with the periods (column
2). Finally the interaction IQ*Partner Compromise[t-1] seems significant from the
1st supergame as well (column 3).
Figure 8 shows the effect of individual intelligence on the probability of defec-
tion in PD and failure to compromise in BoSC. We graph the fraction of deviating
choices following successful cooperation or compromise in the previous round; hence,
representing the propensity to exhibit goal neglect. The probability of goal neglect
declines with intelligence. Comparing the histograms in figure 8 between the IQ-
split and the combined treatments, we can argue that in the combined treatment,
the choices that individuals make in the second lowest IQ quantile are less inconsis-
tent than those in the IQ-split treatment, suggesting that they benefit from being
combined with subjects of higher intelligence. It is also interesting to note that in
the BoSC subjects seem to be more inconsistent than in the PD, which is reasonable
since the BoSC is a more complex game as we argued above. We then conclude this
section by stating that in the BoSC and in the PD subjects of higher intelligence
are more consistent in strategy implementation.
4.2. Games with no Conflict. The second prediction of our substantive hypoth-
esis (2.3) is the similarity in behavior of the two groups of subjects with different
intelligence in games where the natural equilibria do not have the short term-long
term tradeoff (BoS and SH). Our data provide strong support for this hypothesis.
In the treatment where subjects – separated according to their IQ – play a
repeated Stag Hunt (SH) game (payoffs in table 4) and continuation probability
δ = 0.75, cooperation is reached soon and maintained throughout the session; this
is true independently of the intelligence group as we illustrate in figure 9.20 The
stability of the agreement hinges on the small deviations from past successes in
implementing cooperation on (S, S): see figure 10; this holds for both groups.21
In the BoS, (payoffs in table 3) and δ = 0.75, coordination is more complex be-
cause players have to find an agreement on how to implement the alternation; lacking
communication, and absent a natural symmetric way to reach an agreement, players
have to rely on chance, for example waiting until the first time coordination on a
positive outcome occurs. In the top panel of figure 11, where we aggregated the
level of coordination and payoffs of all sessions by IQ group, we can see that a very
20In figure A.13 of appendix G, we see similar patterns replicated in each pair of contiguoussessions. Tables A.49 and A.50 in appendix H confirm what figure 9 suggests: IQ is a non-significantpredictor of the rate of S choice, payoffs and the S choice in period 1.
21In table A.60 of the appendix, we present the estimation of the individuals strategies in thetwo groups

22 EUGENIO PROTO, ALDO RUSTICHINI, AND ANDIS SOFIANOS
similar pattern between the two groups is realized, with the high-IQ group achieving
coordination slightly faster.22 However, figure 12 suggests that once coordination is
achieved by alternation both groups of subjects deviate very little from the alter-
nating strategy and in a way that is not statistically different. This is consistent
with our hypothesis 2.3 relating strategy implementation and intelligence in games
with no conflict between short-run gain and continuation loss stating that in SH and
BoS no significant coordination differences should occur in the two groups. Instead,
we find that the two groups undergo a different process to reach agreement.23 We
discuss this next.
5. Strategic Reasoning
The second general way in which intelligence may affect strategic behavior is in
the ability to identify the most profitable strategies in an environment, as we state
in our general hypothesis 2.1.
5.1. Best Response and Intelligence. A direct test of the hypothesis that intel-
ligence affects the ability to identify the most profitable strategies is to test whether
subjects’ choices are the best responses to the empirical frequency of the strategy of
the other participants in the session. We consider, consistently with DBF (p. 423)
the set (Always Defect, Always Cooperate, Grim Trigger, Tit for Tat, Win Stay Lose
Shift, Tit for 2 Tats ), respectively defined as {AD, AC, GT, TfT, WSLS, TfT2 }of strategies in the repeated game. For each pair of such strategies we can compute
the payoff in a repeated game, if the two players adopt that pair. We call Sophisti-
cated Cooperation , SC, any strategy in the set different from AD and AC. A very
useful simplification of the analysis is possible because the payoff to each player is
the same for any representative strategy we choose in this set. For instance, the
profile (AD,GT ) gives a profile of payoffs ((1− δ)50 + δ25, (1− δ)12 + δ25), which is
the same as the payoff induced by (AD,TfT ). We have thus defined a new normal
form game, that we call the strategy choice game. The payoff matrix for the row
player is:
22See figure A.12 in appendix G for the plots of coordination per single session, where similarpatterns per each group are displayed. Table A.51 in appendix H shows that IQ has no effect inthe coordination rate (column 1 and 2).
23In table A.61 of the appendix , we present the estimation of the individuals strategies in thetwo groups
INTELLIGENCE AND PERSONALITY IN REPEATED INTERACTIONS 23
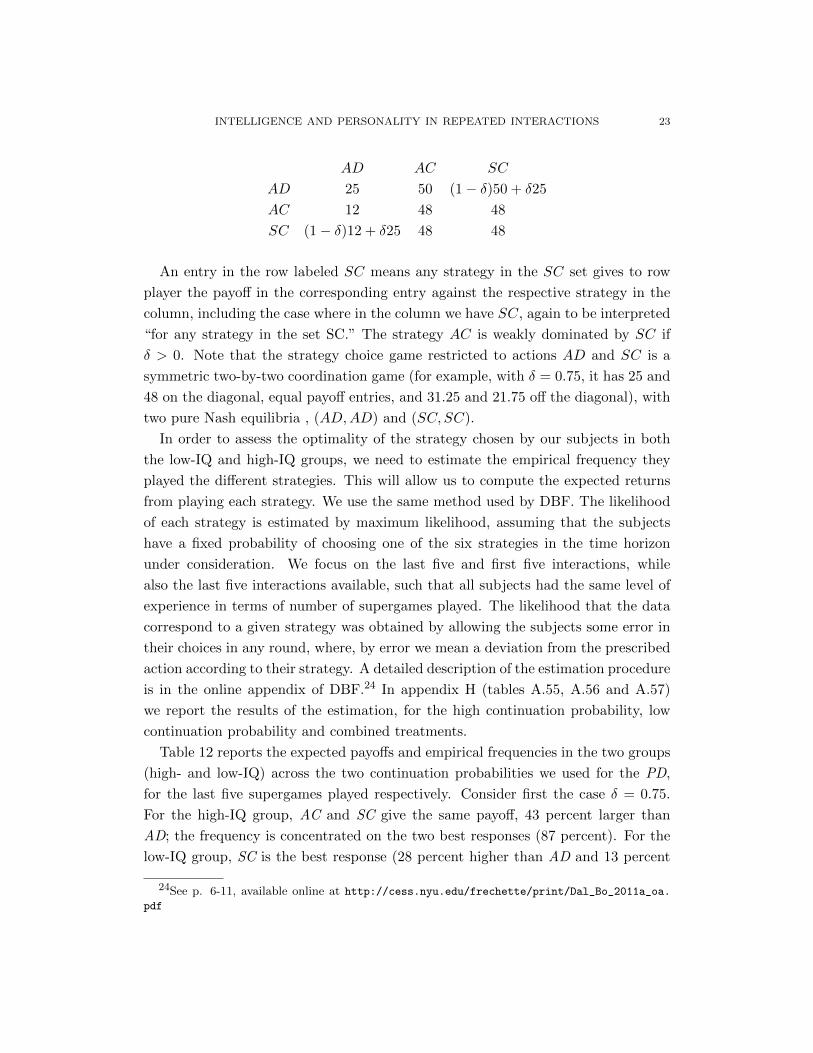
AD AC SC
AD 25 50 (1− δ)50 + δ25
AC 12 48 48
SC (1− δ)12 + δ25 48 48
An entry in the row labeled SC means any strategy in the SC set gives to row
player the payoff in the corresponding entry against the respective strategy in the
column, including the case where in the column we have SC, again to be interpreted
“for any strategy in the set SC.” The strategy AC is weakly dominated by SC if
δ > 0. Note that the strategy choice game restricted to actions AD and SC is a
symmetric two-by-two coordination game (for example, with δ = 0.75, it has 25 and
48 on the diagonal, equal payoff entries, and 31.25 and 21.75 off the diagonal), with
two pure Nash equilibria , (AD,AD) and (SC, SC).
In order to assess the optimality of the strategy chosen by our subjects in both
the low-IQ and high-IQ groups, we need to estimate the empirical frequency they
played the different strategies. This will allow us to compute the expected returns
from playing each strategy. We use the same method used by DBF. The likelihood
of each strategy is estimated by maximum likelihood, assuming that the subjects
have a fixed probability of choosing one of the six strategies in the time horizon
under consideration. We focus on the last five and first five interactions, while
also the last five interactions available, such that all subjects had the same level of
experience in terms of number of supergames played. The likelihood that the data
correspond to a given strategy was obtained by allowing the subjects some error in
their choices in any round, where, by error we mean a deviation from the prescribed
action according to their strategy. A detailed description of the estimation procedure
is in the online appendix of DBF.24 In appendix H (tables A.55, A.56 and A.57)
we report the results of the estimation, for the high continuation probability, low
continuation probability and combined treatments.
Table 12 reports the expected payoffs and empirical frequencies in the two groups
(high- and low-IQ) across the two continuation probabilities we used for the PD,
for the last five supergames played respectively. Consider first the case δ = 0.75.
For the high-IQ group, AC and SC give the same payoff, 43 percent larger than
AD; the frequency is concentrated on the two best responses (87 percent). For the
low-IQ group, SC is the best response (28 percent higher than AD and 13 percent
24See p. 6-11, available online at http://cess.nyu.edu/frechette/print/Dal_Bo_2011a_oa.
24 EUGENIO PROTO, ALDO RUSTICHINI, AND ANDIS SOFIANOS
higher than AD), but the best response is played 53 percent of the time, the worst
44 percent of the time. In the case δ = 0.5: for the high-IQ group SC and AD
give approximately the same payoff, 15 percent higher than the AC; and the best
responses are the only strategies played. The low-IQ group plays the best response
AD (giving a payoff 8 percent higher than the second-best response, SC) 77 percent
of the time.
The comparison we just made does not take adequately into account the fact
that players with higher intelligence play a larger number of games, so if experience
comes from the number of rounds played rather that time elapsed, they are more
experienced in the last games. A way to compensate for this is to consider the
frequency at rounds where players of the two groups have equivalent experience.
Table 13 reports the same analysis for the last five supergames with equivalent
experience. It shows that the difference in ability to best respond is already in place.
For example, in the case δ = 0.75, SC gives the highest payoff, 5 percent larger than
AC and 38 percent larger than AD; the frequency is already concentrated in the
responses (74 percent), with the inferior strategy AD chosen 21 percent of the time.
For the low-IQ group the highest payoff strategy (SC) is played 50 percent of the
time, the worst strategy (AD) 43 percent of the time. If we consider the low δ case:
in the high-IQ group, the best response is AD or SC (the payoff from these two
strategies is approximately equal, and 20 percent higher than AC, and it is played
91 percent of the time. In the low-IQ group, the best response is AD (9 percent
higher than SC, and it is played 73 percent of the times.
The average payoff per round in the high IQ-group is higher than in the low-
IQ group. For example, in table 13 the expected payoff (from empirical frequency
against empirical frequency) for the high-IQ group is 39.86, while for the low-IQ
group it is 33.57. We can think of this difference as the outcome of two separate
effects. The first effect is on individual choice: a subject in a group can increase his
payoff by choosing the best response to the frequency of the group. In the high-IQ
group, shifting from AD to SC gives a large gain (a gain of 11.68 over the 30.75 from
using AD); while in the low-IQ group the shift gives a smaller gain (a gain of 6.8
over the 29.99 from using AD). The reason for the smaller gain is, of course, that
a large fraction of subjects in the latter group are playing AD. The second effect is
on group choice. We measure this effect with the difference between the maximum
payoffs that a subject can achieve in the two groups at the best response within his
group. This difference is only due to the group behavior. In the high-IQ group the
difference is 42.43, in the low-IQ group it is 36.79.

INTELLIGENCE AND PERSONALITY IN REPEATED INTERACTIONS 25
In conclusion, independently of the fact that higher total payoffs will accrue to
highly intelligent players simply because they play a larger number of rounds, sub-
jects in the high IQ sessions have a higher payoff per round in part because they are
closer to the best response, but also in substantial part because they are coordinating
closer to the (SC, SC) equilibrium of the strategy choice game. This is particularly
noticeable in the last five supergames, where the fraction of AD in the high-IQ
group has fallen below 5 percent. An additional benefit of higher intelligence in our
experiment, and likely in real life, is the ability to process information faster, hence
to accumulate more extensive experience, and to learn from it.25
5.2. Achieving Coordination. As we argued in section 2.2, achieving coordina-
tion on the natural alternating equilibrium in BoS is harder than coordinating in SH.
This provides a test of the hypothesis that more intelligent players identify efficient
equilibria more rapidly. Figure 11 shows that although the two groups are virtually
identical in the frequency of achieving coordination on a positive payoff outcome
(and thus on payoffs), they differ in the frequency of alternating coordination, even
in the long run, with a difference of more than 10 percent (bottom left panel). The
bottom right panel indicates that subjects in low-IQ sessions achieve coordination
more frequently for a substantial part of the session by imposing B and conceding
with W, and only later are they able to alternate coordination.
Achieving coordination at the alternating equilibrium is not easy without commu-
nication. Clearly, in the first round of a repeated game with a new partner, subjects
have no way to coordinate, even if they have a history of successful coordination
with previous partners, and are very intelligent, or inclined to cooperation. But in
the second round of a repeated game, the successful start of an alternating equilib-
rium may take place, and this depends crucially on the correct choice of the move:
the player who played B should now play W and vice versa. This is significantly
more likely when the player has higher intelligence, as shown by the coefficient of the
interaction between intelligence and choice of W of partner in the previous period
in table 14.26 Subjects in the low-IQ group are more likely to replicate the same
outcome between two consecutive periods, as we can see from the right bottom
25One has to consider these results with some care, considering the difference between the ana-lyst’s situation and that of the subjects. In estimating the best response we are using informationon frequency of strategies that subjects do not have; they do not observe the entire sequence ofplays. Instead, they only observe the sequence of plays for the games in which they are participants.Limiting the identification of the strategies to the sample observed by each subject is impossiblebecause the sample is too small.
26This is confirmed by table A.51 in appendix H, which shows that IQ has a very strong andsignificant effect on alternating (see column 3), and no effect on coordination (column 2).
26 EUGENIO PROTO, ALDO RUSTICHINI, AND ANDIS SOFIANOS
panel of figure 11. Similar reasoning applies for the BoSC: from figure 3 we note
that in the high-IQ groups more participants reach the most efficient outcome (i.e.
compromise) almost from the beginning.
6. Personality and Strategic Behavior
6.1. Conscientiousness. In section 2.3 we hypothesized that, in general, the effect
of Conscientiousness may be different for different facets, making the net effect that
can be predicted on theoretical grounds ambiguous. In our data, the net effect in the
C-split treatment is clear in figure 13: Conscientiousness reduces cooperation rates,
and it does so from the first period, even before interaction takes place and learning
modifies behavior. The reduction is particularly strong in one of the sessions of
high-Conscientiousness (high-C); the trend relative to this session is singled out in
figure 13.27 The histogram at the bottom of figure 13 shows that the difference is
substantial and significant in the first period. The effect is in the same direction for
payoffs. The pooled data of subjects in the low-Conscientiousness (low-C) sessions,
displayed in the last three columns of table 15, show an increase of more than 15
percent in the cooperation rate, and an increase of four experimental units in payoff.
The effect is also evident from table 6, where we note that in the low-C sessions the
odds ratio for the trend is bigger than in the combined sessions.
Figure 14 shows that the effect of Conscientiousness on cooperative choices is
even smaller (and non-significant) if we consider the data in the combined sessions.
Clearly, as was the case for the role of intelligence, the effect of Conscientiousness
on behavior is stronger when individuals with a similar score interact. However,
Conscientiousness appears to be distinct from intelligence in that the presence of
two highly conscientious players – rather than one individual – seems a necessary
condition for the trait to have a measurable impact on outcomes. This could ex-
plain why in table 5, where we include session fixed-effects, we do not observe any
significant effect of individual Conscientiousness.
The negative effect of Conscientiousness in the C-split treatment is clear from the
strategy table A.59 that we include in appendix H, where the frequency of strategies
used by different groups in early and late supergames is identified. Subjects in the
high-C group start with a larger fraction of the always defect (AD) strategy, 31
percent against 12 percent of the low-C group; this is consistent with the first-period
behavior shown in figure 13. Why this negative net effect of Conscientiousness?
27In appendix F we present a more detailed analysis of all sessions of the C-split treatments infigure A.9.
INTELLIGENCE AND PERSONALITY IN REPEATED INTERACTIONS 27
Our hypothesis 2.4 identifies the Cautiousness facet as possibly producing a re-
duction of cooperation rates in our environment, with all the other facets having the
opposite effect. We test this explanation by considering the specific effect of each
facet. We first perform factor analysis on the answers provided to the questionnaire
by subjects, and identify four main factors (with eigenvalue larger than 1). Analyz-
ing the coefficients of each question we identify the first factor as the Cautiousness
facet.28,29 We then regress cooperation rate and payoff on the four factors we have
identified, and the Conscientiousness score. The analysis reported in table 16 con-
firms the role of Cautiousness: the corresponding factor 1 is the only significant
factor, and its single effect is a reduction of cooperation rate by between 35 to 42
percent. In conclusion: Conscientiousness has a negative impact on cooperation due
to the Cautiousness facet.
6.2. Agreeableness. Agreeableness as a factor is naturally associated with coop-
erative behavior, and so are all its facets (see hypothesis 2.5); this should trans-
late to higher cooperation rates, independent of experience, and should be realized
from first periods. Our data, as seen in figure 15, confirm this. The bottom his-
tograms show a large and significant positive difference in the cooperation rates of
high-Agreeableness (high-A) groups compared to low-Agreeableness (low-A) groups,
with a difference of approximately 10 percent, giving support to hypothesis 2.5 that
Agreeableness increases unconditional cooperation. This strong initial effect is con-
firmed in table 9, where we find a significant effect for Agreeableness even after in-
cluding session fixed effects (i.e. controlling for “environmental” effects; and, more
specifically, for the effect of being in a high-A group as well). The odds that a more
agreeable person cooperates are 4.5 times greater than those for a less agreeable
person. This is the only significant predictor in the regression.
From the top right panel of figure 15 (where we exclude an anomalous session
represented by the the broken line – see appendix F for details), we note that both
groups have a positive trend of cooperation. In the long run, however, the difference
is small, both in cooperation rates and payoffs. In table 15 (first three columns)
the effect of being in a low- or high-A group on all periods is small on payoffs and
insignificant on cooperation rates. Consistently, table 5 – where we consider all the
sessions – reports similar effects of Agreableness in columns 1 and 3.
28For example, the two items with highest coefficient for the first factor are “Jump into thingswithout thinking” and “make rush decisions” (both reverse coded).
29Table A.52 in appendix H reports the items, facets and the coefficients for each item.
28 EUGENIO PROTO, ALDO RUSTICHINI, AND ANDIS SOFIANOS
From column 2 of table 6, we note that there is no difference in the trend of co-
operation between low- and high-A groups and the combined groups. From column
2 of table 10, we note that subjects scoring higher on Agreeableness are less likely
to reciprocate more as they acquire more experience, again suggesting that Agree-
ableness mostly has an effect on unconditional cooperation. Figure 16 shows that
the effect of Agreeableness on cooperative choices is similar if we consider the two
partitions in the combined treatment. In particular, from figure 16, we can clearly
observe the difference between the high- and low-A partitions in the beginning and
their convergence towards the final rounds.
In conclusion: Agreeableness has a positive impact on cooperation, but the effect
is strong in magnitude only in the early stages.
7. Response time
The time to decide has minor direct interest for economic analysis, but provides
very useful information on the decision process and thus on how interesting social
and economic differences (in cooperation rates and payoffs) originate. In the first
part of this section we set the theoretical framework, in the second we analyze our
results.
Our first hypothesis concerns equilibrium choices and deviations, or response to
deviations. Convergence to a natural equilibrium makes a behavior that has been
implicitly agreed upon, the natural choice. Hence, an output of a decision that
should not require specific attention; on the contrary, a choice of deviation or the
response to a deviation of others is slower:
Hypothesis 7.1. For all types of subjects, the equilibrium choice takes less time
than a deviation or a response to a deviation.
The relationship between personality traits and time to decide is more complex
than it may appear at first sight. Let’s begin with intelligence. A very mechanical
relationship is plausible, but of limited use: the time to execute the same cognitive
task at the same level of performance is likely to be inversely proportional to the
intelligence level. This simple relationship does not provide very strict predictions
when either of the two conditions fail. In our experiment, both conditions are ex-
ante unlikely to hold, and we know for a fact that they fail in our sample. Let’s
consider this point in detail.
The cognitive task is not “playing the repeated game”, but rather executing a
complex set of subtasks that are all endogenously determined by the subject. We can
list a few: considering the game and the incentives to the player and the opponent,
INTELLIGENCE AND PERSONALITY IN REPEATED INTERACTIONS 29
observing the moves of the other, keeping track of past moves of both, inferring
a pattern of behavior of others, estimating a distribution of characteristics of the
players in the session, and so on. Similarly, the level of desired performance on each
subtask is decided by the subject, who has to take the effort cost into account, and
the estimated value of the quality of execution for the final payoff.
In summary, once the real nature of the task is taken into account, the mechanical
relationship we described at the outset is just as likely to be reversed as it is to hold,
so from ex-ante considerations we might as well expect that less intelligent players
take less time to choose the action in a round. It is easy, in fact, to illustrate how
this may happen: the strategy Always Defect is very simple to conceive, requires no
record keeping of past actions, and no conditional rule (such as “if this happens, do
this; otherwise, do that”). This strategy is more likely to be used by less intelligent
players (and our data support this prediction). Now consider this next to the higher
frequency of choice of an infinite memory strategy like Grim Trigger in high-IQ
groups, and one can see how easily the time to respond may be higher in the high-
IQ group. The preliminary considerations may suggest that the idea of finding a
stable relationship between intelligence and time to decide is an impossible task. But
the conceptual structure we have developed provides more structure to the decision-
making process, and, thus, it provides the groundwork to build tighter predictions.
The crucial characteristic of the repeated game that we have identified is the
presence or absence of the tradeoff between current payoff gain and continuation
value loss from deviation. Accordingly we hypothesize that less intelligent players
who have to avoid the goal neglect error, will need more time in this specific cir-
cumstance. In BoS and SH games, where the tradeoff is absent, the task is similar
for all players, and is also very simple. Thus:
Hypothesis 7.2. In PD and BoSC, namely games with a conflict between short-run
gain and long-run loss from deviation at the natural equilibrium, response time is
shorter for players of higher intelligence when they choose cooperation for PD and
compromise for BoSC than when they choose otherwise. There is little difference in
response time in the two choices in BoS and SH.
7.1. Effect of Intelligence on Response time. In PD and in the BoSC, high-
IQ groups have a shorter response time, as we note from figure 17. In line with
hypothesis 7.1, subjects think longer when they decide to deviate from cooperation
to defection in the PD: this difference is large and significant for the high-IQ group,
30 EUGENIO PROTO, ALDO RUSTICHINI, AND ANDIS SOFIANOS
and small and not statistically significant in the low-IQ group, where cooperation
does not emerge as an equilibrium, as predicted in hypothesis 7.1.30
In BoSC, the analysis is complicated by the fact that we have more than one
natural equilibrium. Subjects can coordinate on compromise (i.e. outcome (W,W )
in table 2) or alternate between the two outcomes (W,B) and (B,W ), or finally settle
on one of the (W,B), (B,W ) outcomes. The analysis is unambiguous for equilibria
yielding the (W,W ) outcome. The bottom panels of figure 17 confirm hypothesis
7.2: more intelligent players that saw the compromise (W,W ) outcome at t−1 have
a shorter response time for when they choose W (aiming at a compromise outcome)
than when they choose B.31 For games with no conflict between short-term and
long-term advantages, figure 18 confirms that there is little difference in response
time between the two actions both in the high-IQ and low-IQ groups for BoS. In
SH the lower payoff action H takes longer for both types, and particularly for the
low IQ-group. Given that this is a complex tradeoff (between riskiness and payoff),
the difference is natural.
The other trait that might be related to response time length is Conscientiousness.
There is some evidence (discussed for instance in Powers and Kaufman (2004))
that subjects with high score in Conscientiousness are very careful in test taking,
which would suggest the natural hypothesis that response time increases with the
Conscientiousness score. The evidence, however, is weak, and another direction of
the effect is possible: once the optimal rules are set, and the socially acceptable
behavior is considered to have been agreed upon, then subjects with higher level
of Conscientiousness may be more resolute in implementing the rules, rather than
idling in the execution. Our data show that the resolute implementation dominates:
the response time seems shorter for the subjects in high-C groups (figure A.14 in
appendix H). So, being careful in the decision-making process means here being
resolute and deliberate, rather than thoughtful beyond necessity.
8. Conclusions
Our experimental setup tested the hypothesis that groups of individuals with dif-
ferent levels of intelligence, or with different personalities, but who are otherwise
30Table A.53 in appendix H confirms this: individuals choosing C take less time to make thechoice (sign of cooperate in column 1) and this effect is stronger the higher is the subjects’ IQ(column 2).
31Table A.54 in appendix H confirms the result illustrated in figure 17 for the BoSC: individualsin general respond faster when they are playing the compromise (W,W ) outcome (column 1) andthis decision is quicker for higher IQ individuals (column 2). This last effect is not significant butis quite high in magnitude, this is possibly due to the rarity of event B at t, if (W,W ) at t− 1.
INTELLIGENCE AND PERSONALITY IN REPEATED INTERACTIONS 31
similar, would exhibit different levels of cooperation in bilateral interactions with
others within their group. The interactions were repeated, giving time and opportu-
nity for each participant to observe and to reflect on the past behavior of the other,
and to use this information to guide future choices. The outcome of games with a
conflict between short-run gain and continuation value was strikingly different when
played by subjects with higher or lower levels of intelligence. In such situations,
higher intelligence resulted in significantly higher levels of cooperation and earn-
ings. The failure of individuals with lower intelligence to appropriately estimate
the future consequences of current actions accounts for the difference in outcomes.
Personality also affects behavior, but in smaller measure, and with low persistence.
Our main conclusions for the class of repeated games that are the subject of our
analysis are detailed as follows:
Everything else being equal, groups composed of individuals with higher levels of
intelligence exhibit higher levels of cooperation. In our data, intelligence is associated
with different long-run behavior in a sequence of repeated games played within the
group, and higher cooperation rates are associated with higher intelligence.
Higher cooperation rates are produced by interaction over time in groups composed
of individuals with higher intelligence. Cooperation rates in the initial rounds (ap-
proximately 20) are statistically equal in the two groups. Thus, the experience of
past interaction, not a difference in attitude in the initial stages, explains the higher
cooperation rate. There is no inherent association of higher and lower intelligence
with a behavior: the specific history of past interactions is what matters.
Higher cooperation is sensitive to the continuation probability, so it is not the
result of an unconditional inclination of higher intelligence individuals to cooper-
ate. Intelligence operates via strategy implementation and strategic thinking. We
have identified a crucial distinction among games in which the gain from deviation
from a given strategy has to be weighed against future losses, and those in which
it cannot. When this tradeoff has to evaluated, individuals with higher intelligence
achieve a substantially higher rate of cooperation; the difference in intelligence levels
is rendered irrelevant when this tradeoff is absent. In the low continuation proba-
bility game cooperation is less profitable in the long-run, and subjects in the higher
intelligence groups also experience large and growing rates of defection over time.
Both environment and incentives matter: intelligence modulates the response to
incentives, rather than directly determining behavior.
Intelligence matters substantially more in the long run than other factors and
personality traits. Our method allows for a direct and an indirect test. The direct

32 EUGENIO PROTO, ALDO RUSTICHINI, AND ANDIS SOFIANOS
test is based on examining the cooperative behavior of groups differing in a given
trait. The indirect test is based on the analysis of a statistical relationship of traits
with the choice to cooperate. We find a transitory association of cooperation rates
with personality traits: intelligence is the determining factor in long-run cooperative
behavior.
Intelligence operates through thinking about strategic choices. Differences in be-
havior could arise for different reasons. For instance, intelligence might be associated
with a cooperative attitude, either as a result of a behavioral inclination, or as the
result of a type of utility that individuals might derive from the outcome such as
winning approval of others or by avoiding conflict with others. Our data instead
provide support for the idea that intelligence is mainly likely to influence the way in
which subjects think about the behavior of others, how they learn from it, and how
they choose to modify it as far as possible. Intelligence is relevant for learning and
teaching. We have produced two pieces of evidence supporting this interpretation.
The first is the difference in the evolution over time of the response of individuals
to the choices made by their partner in the past. A small, but significant difference
to the choice to cooperate with the current partner in the last period builds up over
the session for players of higher intelligence, and this eventually produces a sub-
stantial difference in cooperation rates. The second piece of evidence comes from
response times. Among subjects of higher intelligence, cooperation after the initial
stages becomes the default mode; defection instead requires a specifically dedicated
and careful balancing of the anticipated loss of future cooperation with the need
to retaliate to avoid future defections. For groups composed of lower intelligence
individuals there is no difference.
Conscientiousness affects strategic behavior in the direction of cautiousness, thus
reducing cooperation. Theoretical analysis suggests an ambiguous effect of Consci-
entiousness, predicting an increase of cooperation due to facets like Dutifulness and
Orderliness; but a decrease due to Cautiousness. We find that the second domi-
nates. This effect is clear in a game such as the PD, in which the conflict between
the short-run gain and continuation loss may be perceived as risky, thus leading a
cautious individual to make the safe choice of always defecting.
Agreeableness induces an increase in cooperation. The effect is natural, and is
the one we should expect from the theory of social preferences and other regard-
ing preferences. It is, however, small and transitory compared to that induced by
intelligence.

INTELLIGENCE AND PERSONALITY IN REPEATED INTERACTIONS 33
Our results suggest important questions for the theory of learning in games, as
well as on the link between intelligence and strategies’ ideation and implementation.
The extension to the ability of subjects to conceive different sets of strategies will
require an extension of the design to a more general class of games, in particular
with non-symmetric stage games. These are the subjects of current, and future,
research.
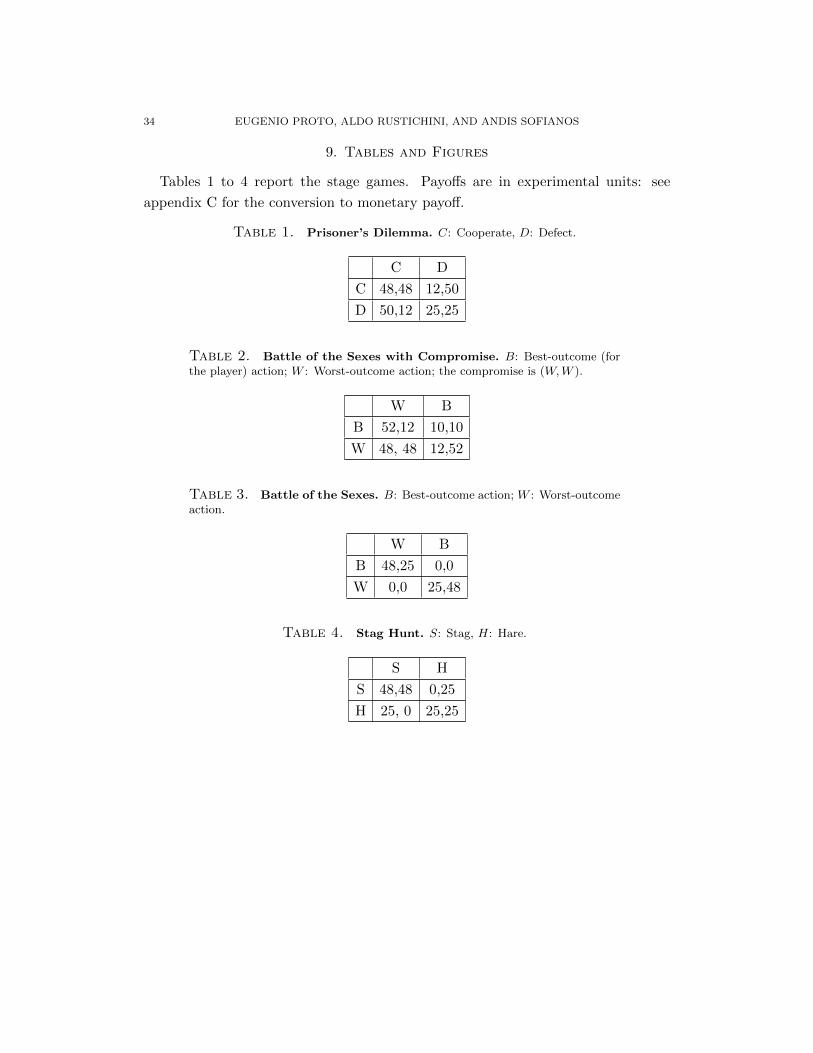
34 EUGENIO PROTO, ALDO RUSTICHINI, AND ANDIS SOFIANOS
9. Tables and Figures
Tables 1 to 4 report the stage games. Payoffs are in experimental units: see
appendix C for the conversion to monetary payoff.
Table 1. Prisoner’s Dilemma. C: Cooperate, D: Defect.
C D
C 48,48 12,50
D 50,12 25,25
Table 2. Battle of the Sexes with Compromise. B: Best-outcome (forthe player) action; W : Worst-outcome action; the compromise is (W,W ).
W B
B 52,12 10,10
W 48, 48 12,52
Table 3. Battle of the Sexes. B: Best-outcome action; W : Worst-outcomeaction.
W B
B 48,25 0,0
W 0,0 25,48
Table 4. Stag Hunt. S: Stag, H: Hare.
S H
S 48,48 0,25
H 25, 0 25,25

INTELLIGENCE AND PERSONALITY IN REPEATED INTERACTIONS 35
Table 5. PD: Effects of IQ, Personality and other characteristics oncooperation rates and payoffs. The regressions include the data from PD(high and low δ), IQ-split, C-split, A-split and combined treatments. The depen-dent variable is average cooperation and average payoff across all interactions.OLS estimator; IQ, personality traits and risk aversion are normalized between 0and 1 (see appendix B.1 for details). Standard errors in brackets; ∗ p−value < 0.1,∗∗ p− value < 0.05, ∗∗∗ p− value < 0.01
Cooperate PayoffAll Periods All Periods All Periods All Periods
b/se b/se b/se b/se
IQ 0.3112*** 0.3645*** 4.4152*** 5.7455***
(0.0721) (0.1026) (0.9244) (1.4109)Conscientiousness –0.0628 0.1250 –0.4816 1.3922
(0.0687) (0.1186) (0.8809) (1.6307)
Agreeableness 0.1001 0.2211** 1.5990* 2.1377(0.0677) (0.0990) (0.8679) (1.3620)
Openness –0.0357 –0.0106 –0.3939 –0.7716
(0.0676) (0.0978) (0.8666) (1.3446)Extraversion –0.1149* –0.0072 –1.1337 –0.7697
(0.0645) (0.1016) (0.8264) (1.3972)Neuroticism 0.0799 0.1167 1.2741 2.0863
(0.0660) (0.1017) (0.8457) (1.3984)
Risk Aversion –0.0439 –0.0478 0.3649 0.9585(0.0665) (0.0939) (0.8521) (1.2917)
Female –0.0640*** –0.0172 –0.6483** –0.0349
(0.0246) (0.0374) (0.3149) (0.5150)Age –0.0014 0.0016 0.0200 0.0113
(0.0031) (0.0056) (0.0403) (0.0766)
Decoding task 0.0029 0.0022(0.0040) (0.0543)
Session Fixed-Effects Yes Yes Yes Yes
Culture Fixed-Effects Yes Yes Yes Yes
r2 0.424 0.365 0.708 0.593N 526 232 526 232
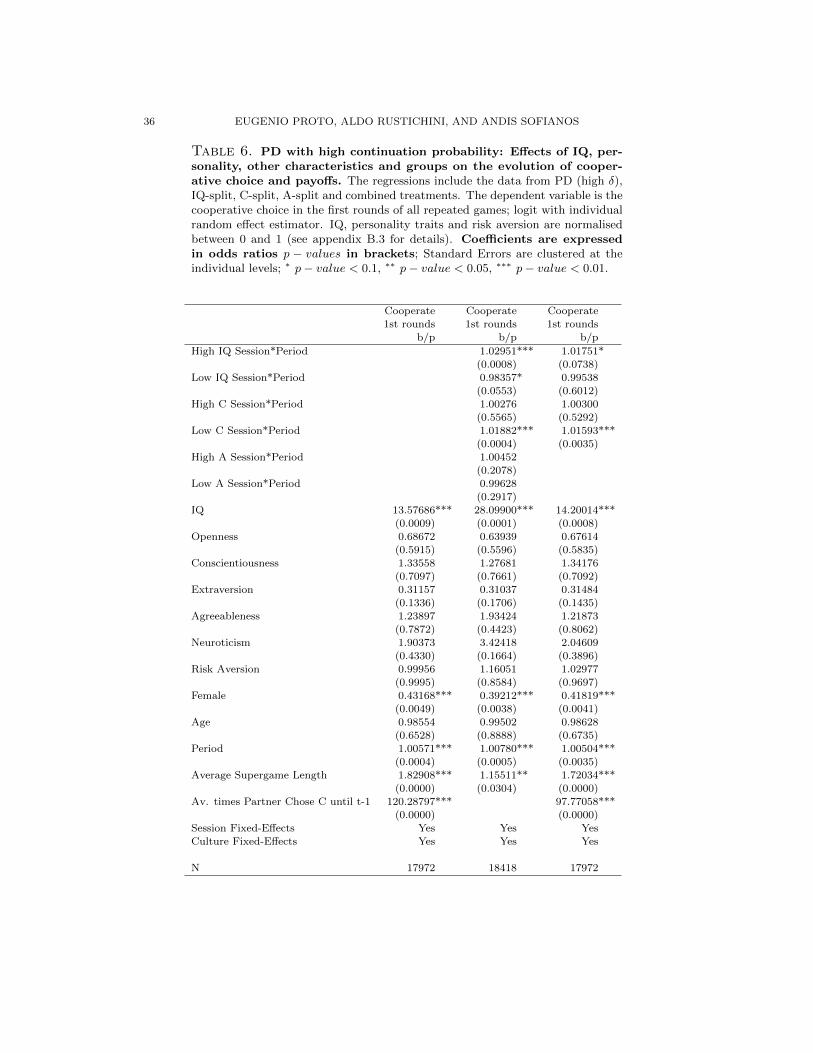
36 EUGENIO PROTO, ALDO RUSTICHINI, AND ANDIS SOFIANOS
Table 6. PD with high continuation probability: Effects of IQ, per-sonality, other characteristics and groups on the evolution of cooper-ative choice and payoffs. The regressions include the data from PD (high δ),IQ-split, C-split, A-split and combined treatments. The dependent variable is thecooperative choice in the first rounds of all repeated games; logit with individualrandom effect estimator. IQ, personality traits and risk aversion are normalisedbetween 0 and 1 (see appendix B.3 for details). Coefficients are expressedin odds ratios p − values in brackets; Standard Errors are clustered at theindividual levels; ∗ p− value < 0.1, ∗∗ p− value < 0.05, ∗∗∗ p− value < 0.01.
Cooperate Cooperate Cooperate
1st rounds 1st rounds 1st rounds
b/p b/p b/p
High IQ Session*Period 1.02951*** 1.01751*(0.0008) (0.0738)
Low IQ Session*Period 0.98357* 0.99538
(0.0553) (0.6012)High C Session*Period 1.00276 1.00300
(0.5565) (0.5292)
Low C Session*Period 1.01882*** 1.01593***(0.0004) (0.0035)
High A Session*Period 1.00452
(0.2078)Low A Session*Period 0.99628
(0.2917)
IQ 13.57686*** 28.09900*** 14.20014***(0.0009) (0.0001) (0.0008)
Openness 0.68672 0.63939 0.67614(0.5915) (0.5596) (0.5835)
Conscientiousness 1.33558 1.27681 1.34176
(0.7097) (0.7661) (0.7092)Extraversion 0.31157 0.31037 0.31484
(0.1336) (0.1706) (0.1435)
Agreeableness 1.23897 1.93424 1.21873(0.7872) (0.4423) (0.8062)
Neuroticism 1.90373 3.42418 2.04609
(0.4330) (0.1664) (0.3896)Risk Aversion 0.99956 1.16051 1.02977
(0.9995) (0.8584) (0.9697)
Female 0.43168*** 0.39212*** 0.41819***(0.0049) (0.0038) (0.0041)
Age 0.98554 0.99502 0.98628(0.6528) (0.8888) (0.6735)
Period 1.00571*** 1.00780*** 1.00504***
(0.0004) (0.0005) (0.0035)Average Supergame Length 1.82908*** 1.15511** 1.72034***
(0.0000) (0.0304) (0.0000)Av. times Partner Chose C until t-1 120.28797*** 97.77058***
(0.0000) (0.0000)Session Fixed-Effects Yes Yes Yes
Culture Fixed-Effects Yes Yes Yes
N 17972 18418 17972
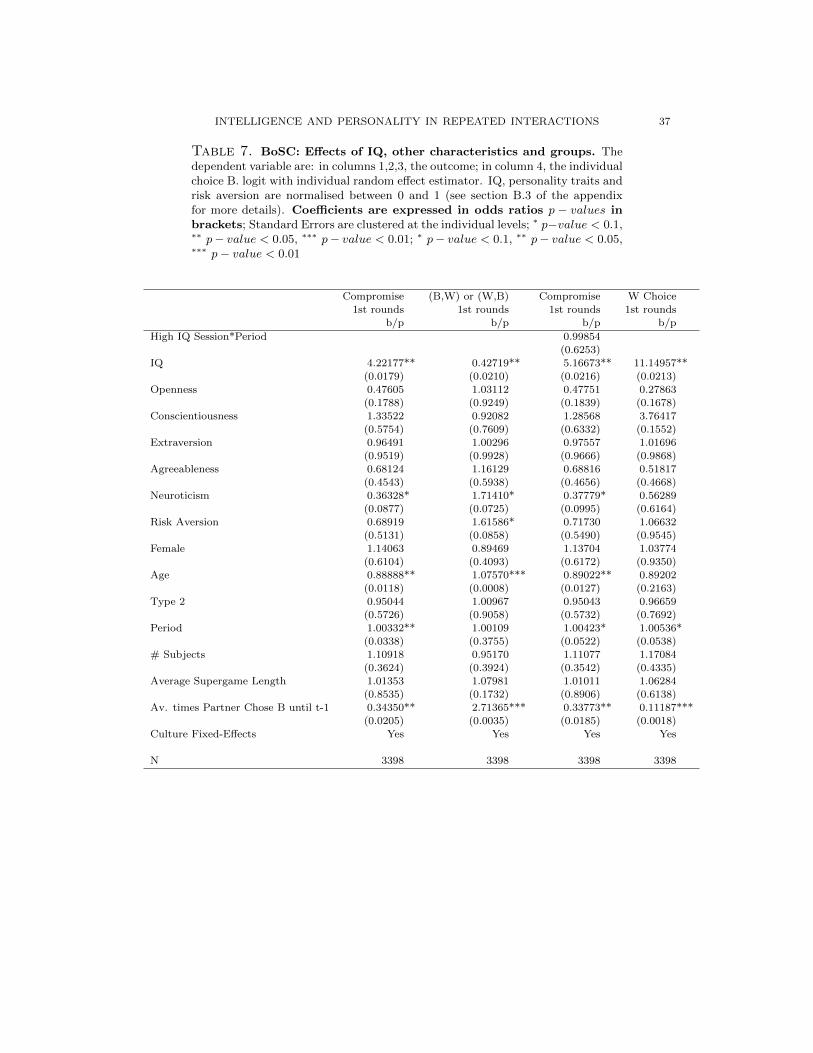
INTELLIGENCE AND PERSONALITY IN REPEATED INTERACTIONS 37
Table 7. BoSC: Effects of IQ, other characteristics and groups. Thedependent variable are: in columns 1,2,3, the outcome; in column 4, the individualchoice B. logit with individual random effect estimator. IQ, personality traits andrisk aversion are normalised between 0 and 1 (see section B.3 of the appendixfor more details). Coefficients are expressed in odds ratios p − values inbrackets; Standard Errors are clustered at the individual levels; ∗ p−value < 0.1,∗∗ p− value < 0.05, ∗∗∗ p− value < 0.01; ∗ p− value < 0.1, ∗∗ p− value < 0.05,∗∗∗ p− value < 0.01
Compromise (B,W) or (W,B) Compromise W Choice
1st rounds 1st rounds 1st rounds 1st rounds
b/p b/p b/p b/p
High IQ Session*Period 0.99854
(0.6253)IQ 4.22177** 0.42719** 5.16673** 11.14957**
(0.0179) (0.0210) (0.0216) (0.0213)Openness 0.47605 1.03112 0.47751 0.27863
(0.1788) (0.9249) (0.1839) (0.1678)
Conscientiousness 1.33522 0.92082 1.28568 3.76417(0.5754) (0.7609) (0.6332) (0.1552)
Extraversion 0.96491 1.00296 0.97557 1.01696
(0.9519) (0.9928) (0.9666) (0.9868)Agreeableness 0.68124 1.16129 0.68816 0.51817
(0.4543) (0.5938) (0.4656) (0.4668)
Neuroticism 0.36328* 1.71410* 0.37779* 0.56289(0.0877) (0.0725) (0.0995) (0.6164)
Risk Aversion 0.68919 1.61586* 0.71730 1.06632
(0.5131) (0.0858) (0.5490) (0.9545)Female 1.14063 0.89469 1.13704 1.03774
(0.6104) (0.4093) (0.6172) (0.9350)Age 0.88888** 1.07570*** 0.89022** 0.89202
(0.0118) (0.0008) (0.0127) (0.2163)
Type 2 0.95044 1.00967 0.95043 0.96659(0.5726) (0.9058) (0.5732) (0.7692)
Period 1.00332** 1.00109 1.00423* 1.00536*
(0.0338) (0.3755) (0.0522) (0.0538)# Subjects 1.10918 0.95170 1.11077 1.17084
(0.3624) (0.3924) (0.3542) (0.4335)
Average Supergame Length 1.01353 1.07981 1.01011 1.06284(0.8535) (0.1732) (0.8906) (0.6138)
Av. times Partner Chose B until t-1 0.34350** 2.71365*** 0.33773** 0.11187***
(0.0205) (0.0035) (0.0185) (0.0018)Culture Fixed-Effects Yes Yes Yes Yes
N 3398 3398 3398 3398
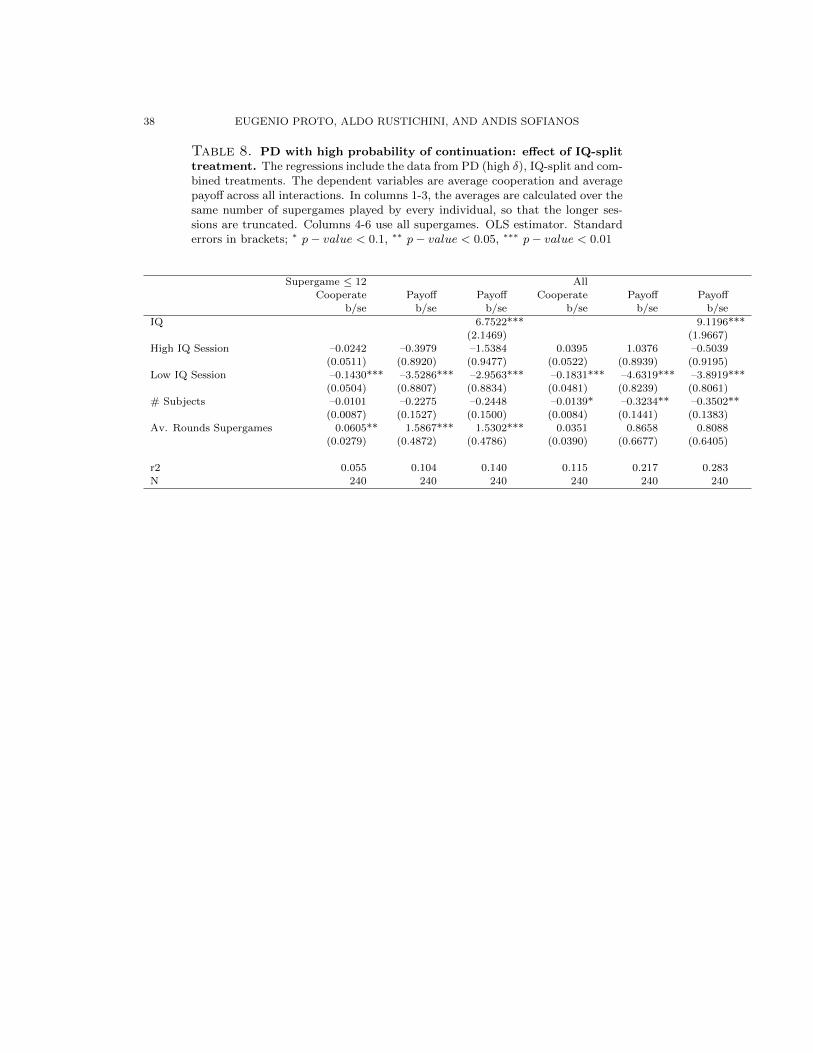
38 EUGENIO PROTO, ALDO RUSTICHINI, AND ANDIS SOFIANOS
Table 8. PD with high probability of continuation: effect of IQ-splittreatment. The regressions include the data from PD (high δ), IQ-split and com-bined treatments. The dependent variables are average cooperation and averagepayoff across all interactions. In columns 1-3, the averages are calculated over thesame number of supergames played by every individual, so that the longer ses-sions are truncated. Columns 4-6 use all supergames. OLS estimator. Standarderrors in brackets; ∗ p− value < 0.1, ∗∗ p− value < 0.05, ∗∗∗ p− value < 0.01
Supergame ≤ 12 AllCooperate Payoff Payoff Cooperate Payoff Payoff
b/se b/se b/se b/se b/se b/se
IQ 6.7522*** 9.1196***
(2.1469) (1.9667)High IQ Session –0.0242 –0.3979 –1.5384 0.0395 1.0376 –0.5039
(0.0511) (0.8920) (0.9477) (0.0522) (0.8939) (0.9195)
Low IQ Session –0.1430*** –3.5286*** –2.9563*** –0.1831*** –4.6319*** –3.8919***(0.0504) (0.8807) (0.8834) (0.0481) (0.8239) (0.8061)
# Subjects –0.0101 –0.2275 –0.2448 –0.0139* –0.3234** –0.3502**
(0.0087) (0.1527) (0.1500) (0.0084) (0.1441) (0.1383)Av. Rounds Supergames 0.0605** 1.5867*** 1.5302*** 0.0351 0.8658 0.8088
(0.0279) (0.4872) (0.4786) (0.0390) (0.6677) (0.6405)
r2 0.055 0.104 0.140 0.115 0.217 0.283
N 240 240 240 240 240 240
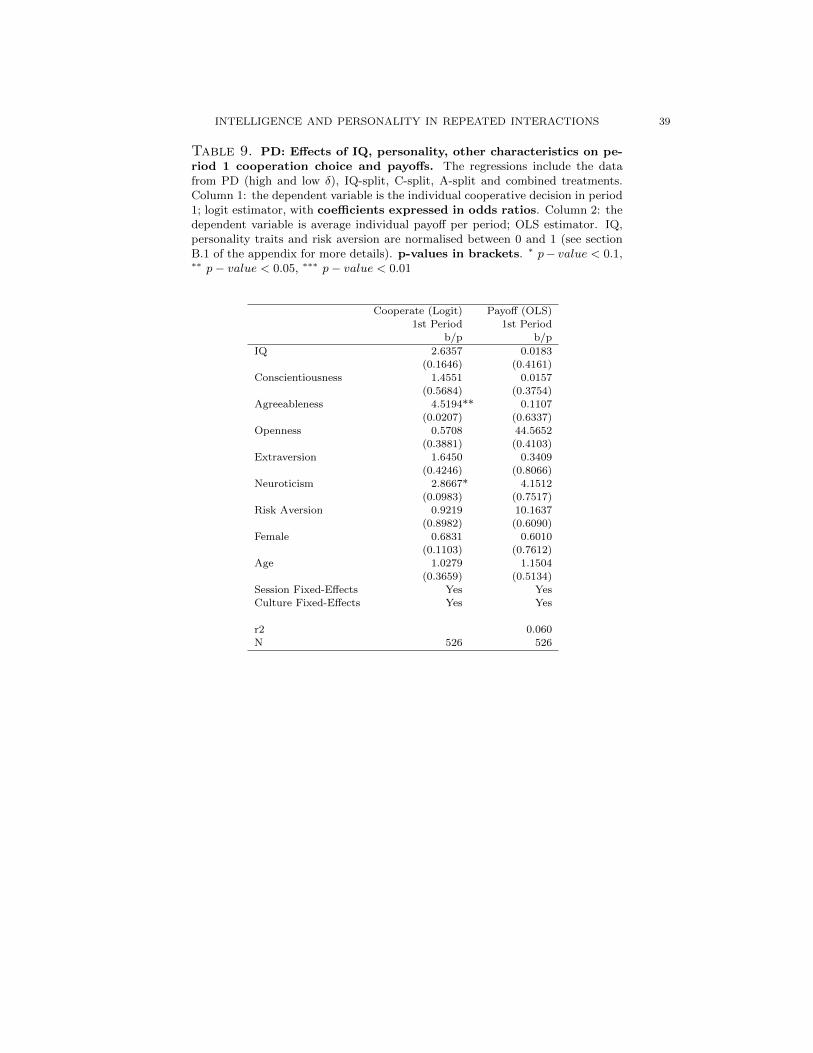
INTELLIGENCE AND PERSONALITY IN REPEATED INTERACTIONS 39
Table 9. PD: Effects of IQ, personality, other characteristics on pe-riod 1 cooperation choice and payoffs. The regressions include the datafrom PD (high and low δ), IQ-split, C-split, A-split and combined treatments.Column 1: the dependent variable is the individual cooperative decision in period1; logit estimator, with coefficients expressed in odds ratios. Column 2: thedependent variable is average individual payoff per period; OLS estimator. IQ,personality traits and risk aversion are normalised between 0 and 1 (see sectionB.1 of the appendix for more details). p-values in brackets. ∗ p− value < 0.1,∗∗ p− value < 0.05, ∗∗∗ p− value < 0.01
Cooperate (Logit) Payoff (OLS)
1st Period 1st Period
b/p b/p
IQ 2.6357 0.0183(0.1646) (0.4161)
Conscientiousness 1.4551 0.0157
(0.5684) (0.3754)Agreeableness 4.5194** 0.1107
(0.0207) (0.6337)
Openness 0.5708 44.5652(0.3881) (0.4103)
Extraversion 1.6450 0.3409
(0.4246) (0.8066)Neuroticism 2.8667* 4.1512
(0.0983) (0.7517)
Risk Aversion 0.9219 10.1637(0.8982) (0.6090)
Female 0.6831 0.6010(0.1103) (0.7612)
Age 1.0279 1.1504
(0.3659) (0.5134)Session Fixed-Effects Yes Yes
Culture Fixed-Effects Yes Yes
r2 0.060
N 526 526

40 EUGENIO PROTO, ALDO RUSTICHINI, AND ANDIS SOFIANOS
Table 10. PD with high probability of continuation: Effects of IQ,personality, other characteristics and groups on conditional coopera-tion. The regressions include the data from PD (high δ), IQ-split, C-split, A-splitand combined treatments. Columns 1 and 2: the dependent variable is the coop-erative choice in the second rounds of all repeated games; logit with individualfixed effect estimator. Columns 3: the dependent variable is the cooperativechoice in the second periods; logit estimator. IQ, personality traits and risk aver-sion are normalised between 0 and 1 (see section B.3 of the appendix for moredetails). Coefficients are expressed in odds ratios p− values in brackets;∗ p− value < 0.1, ∗∗ p− value < 0.05, ∗∗∗ p− value < 0.01
Cooperate Cooperate Cooperate
2nd Rounds 2nd Rounds 2nd Period
b/p b/p b/p
Partn. Ch.[t− 1] 3.26738*** 1.89584 0.49548(0.0042) (0.1912) (0.4543)
IQ*Partn. Ch.[t− 1] 71.08330*** 21.68136*** 4.19146*
(0.0000) (0.0000) (0.0622)IQ*Period*Partn. Ch.[t− 1] 1.01770***
(0.0000)
Consc.*Partn. Ch.[t− 1] 1.79506 1.50672 0.33455(0.1546) (0.4239) (0.1947)
Consc*Period*Partn. Ch.[t− 1] 1.00061
(0.8947)Period*Partn. Ch.[t− 1] 1.00794**
(0.0333)Agre.*Partn. Ch.[t− 1] 0.90808 1.87127 3.16397
(0.8056) (0.1962) (0.1430)
Agre.*Period*Partn. Ch.[t− 1] 0.98957**(0.0168)
Low δ*Partn. Ch.[t− 1] 0.34067*** 0.35701*** 1.62789
(0.0000) (0.0000) (0.2910)Female*Partn. Ch.[t− 1] 0.63154*** 0.62917*** 1.60615*
(0.0012) (0.0012) (0.0967)
Risk.Aversion*Partn. Ch.[t− 1] 2.03041* 1.73107 3.13800(0.0733) (0.1668) (0.2112)
Av. Supergame Length 1.77557*** 1.45633***
(0.0000) (0.0000)Av. times Partner Chose C until t-2 21.40094*** 10.87719***
(0.0000) (0.0000)
N 14689 14689 364
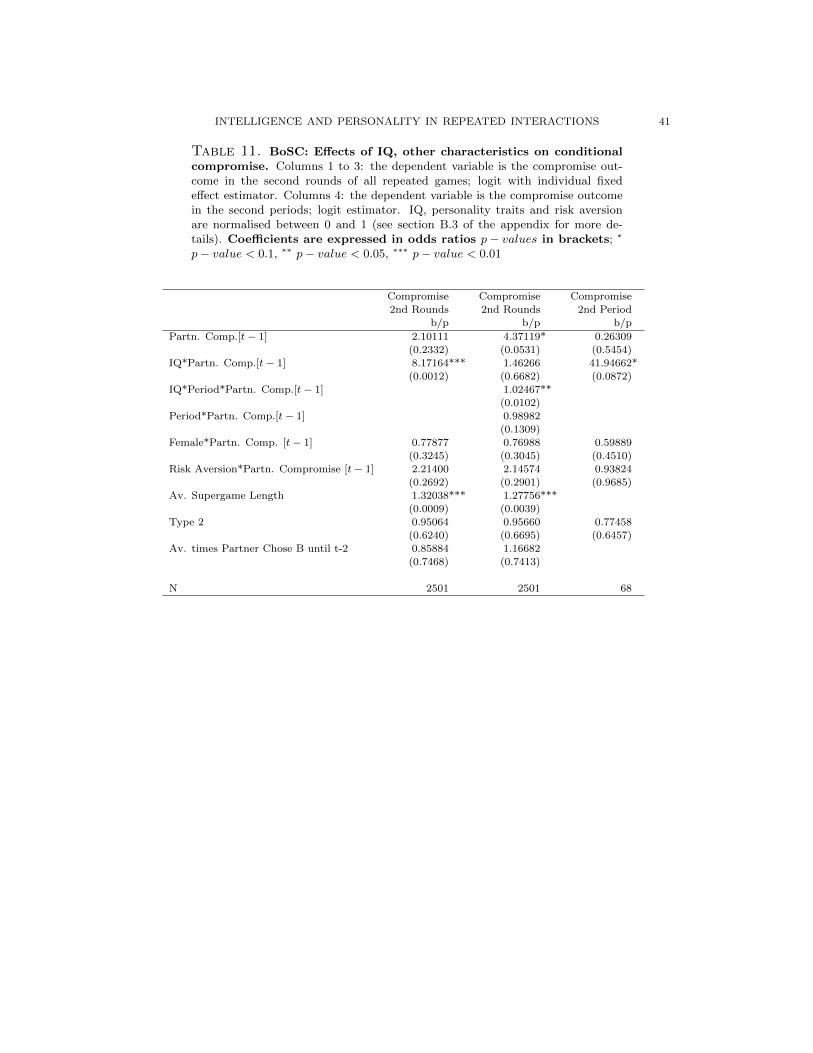
INTELLIGENCE AND PERSONALITY IN REPEATED INTERACTIONS 41
Table 11. BoSC: Effects of IQ, other characteristics on conditionalcompromise. Columns 1 to 3: the dependent variable is the compromise out-come in the second rounds of all repeated games; logit with individual fixedeffect estimator. Columns 4: the dependent variable is the compromise outcomein the second periods; logit estimator. IQ, personality traits and risk aversionare normalised between 0 and 1 (see section B.3 of the appendix for more de-tails). Coefficients are expressed in odds ratios p− values in brackets; ∗
p− value < 0.1, ∗∗ p− value < 0.05, ∗∗∗ p− value < 0.01
Compromise Compromise Compromise
2nd Rounds 2nd Rounds 2nd Period
b/p b/p b/p
Partn. Comp.[t− 1] 2.10111 4.37119* 0.26309
(0.2332) (0.0531) (0.5454)IQ*Partn. Comp.[t− 1] 8.17164*** 1.46266 41.94662*
(0.0012) (0.6682) (0.0872)IQ*Period*Partn. Comp.[t− 1] 1.02467**
(0.0102)
Period*Partn. Comp.[t− 1] 0.98982(0.1309)
Female*Partn. Comp. [t− 1] 0.77877 0.76988 0.59889
(0.3245) (0.3045) (0.4510)Risk Aversion*Partn. Compromise [t− 1] 2.21400 2.14574 0.93824
(0.2692) (0.2901) (0.9685)
Av. Supergame Length 1.32038*** 1.27756***(0.0009) (0.0039)
Type 2 0.95064 0.95660 0.77458
(0.6240) (0.6695) (0.6457)Av. times Partner Chose B until t-2 0.85884 1.16682
(0.7468) (0.7413)
N 2501 2501 68

42 EUGENIO PROTO, ALDO RUSTICHINI, AND ANDIS SOFIANOS
Table 12. Payoff at empirical frequency and frequency. The Frequencycolumn reports the empirical frequency of each strategy in the set {AC, AD, SC}in the last 5 supergames, as reported in Table A.55 for the high δ and A.56 for thelow δ. The Payoff column reports the expected payoff using the strategy againstthe empirical frequency. The Expected payoff is computed using the empiricalfrequency against the empirical frequency. Top panel: high δ, bottom panel: lowδ.
High IQ Low IQ
payoff frequency payoff frequencyAC 46.49 0.089 32.03 0.027
AD 32.65 0.042 28.97 0.443 δ = 0.75
SC 46.90 0.869 36.36 0.530Exp. Payoff 46.27 32.97
AC 26.33 0 20.21 0
AD 29.97 0.602 27.85 0.772 δ = 0.5SC 30.24 0.398 25.22 0.228
Exp. Payoff 30.08 27.25
Table 13. Payoff at empirical frequency and frequency. The Frequencycolumn reports the empirical frequency of each strategy in the set {AC, AD,SC} in the last 5 equivalent experience supergames, as reported in Table A.55for the high δ and A.56 for the low δ. The Payoff column reports the expectedpayoff using the strategy against the empirical frequency. The Expected payoffis computed using the empirical frequency against the empirical frequency. Toppanel: high δ, bottom panel: low δ.
High IQ Low IQ
payoff frequency payoff frequency
AC 40.36 0.044 32.62 0.075
AD 30.75 0.212 29.99 0.427 δ = 0.75SC 42.43 0.743 36.79 0.498
Exp. Payoff 39.86 33.57
AC 25.79 0.081 21.45 0.037
AD 30.81 0.616 28.74 0.737 δ = 0.5SC 29.80 0.301 26.24 0.226
Exp. Payoff 30.09 27.91
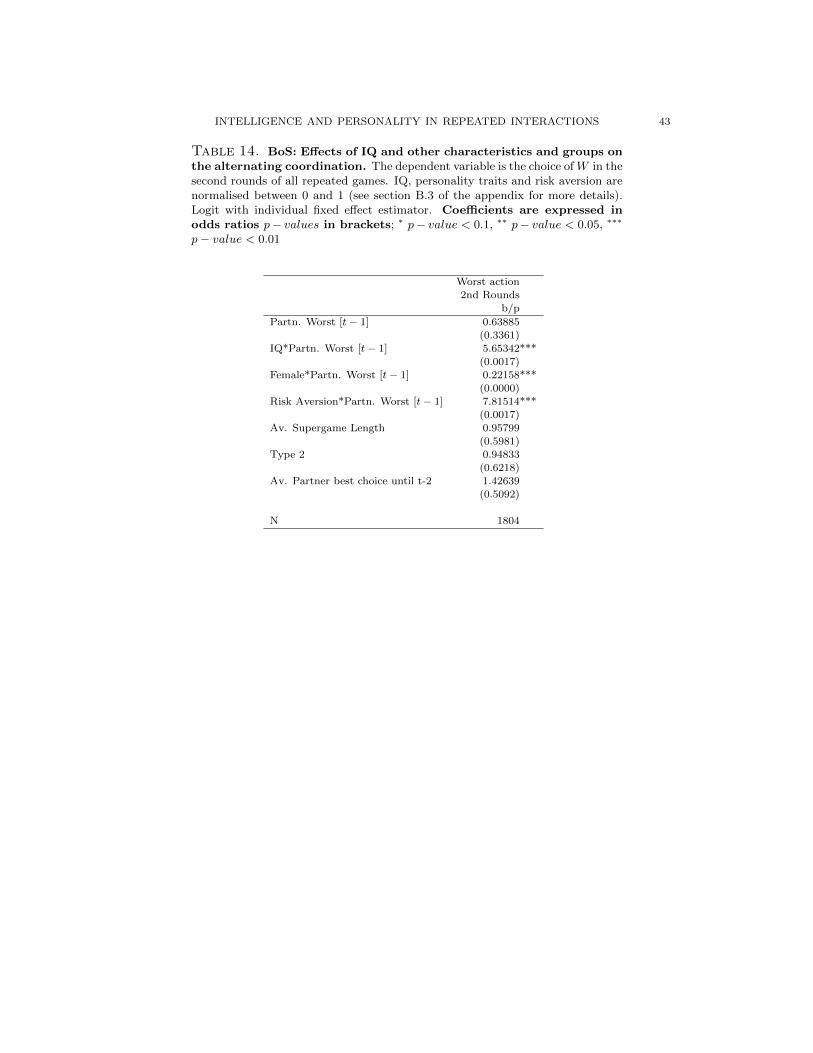
INTELLIGENCE AND PERSONALITY IN REPEATED INTERACTIONS 43
Table 14. BoS: Effects of IQ and other characteristics and groups onthe alternating coordination. The dependent variable is the choice ofW in thesecond rounds of all repeated games. IQ, personality traits and risk aversion arenormalised between 0 and 1 (see section B.3 of the appendix for more details).Logit with individual fixed effect estimator. Coefficients are expressed inodds ratios p− values in brackets; ∗ p− value < 0.1, ∗∗ p− value < 0.05, ∗∗∗
p− value < 0.01
Worst action2nd Rounds
b/p
Partn. Worst [t− 1] 0.63885
(0.3361)IQ*Partn. Worst [t− 1] 5.65342***
(0.0017)
Female*Partn. Worst [t− 1] 0.22158***(0.0000)
Risk Aversion*Partn. Worst [t− 1] 7.81514***
(0.0017)Av. Supergame Length 0.95799
(0.5981)Type 2 0.94833
(0.6218)
Av. Partner best choice until t-2 1.42639(0.5092)
N 1804
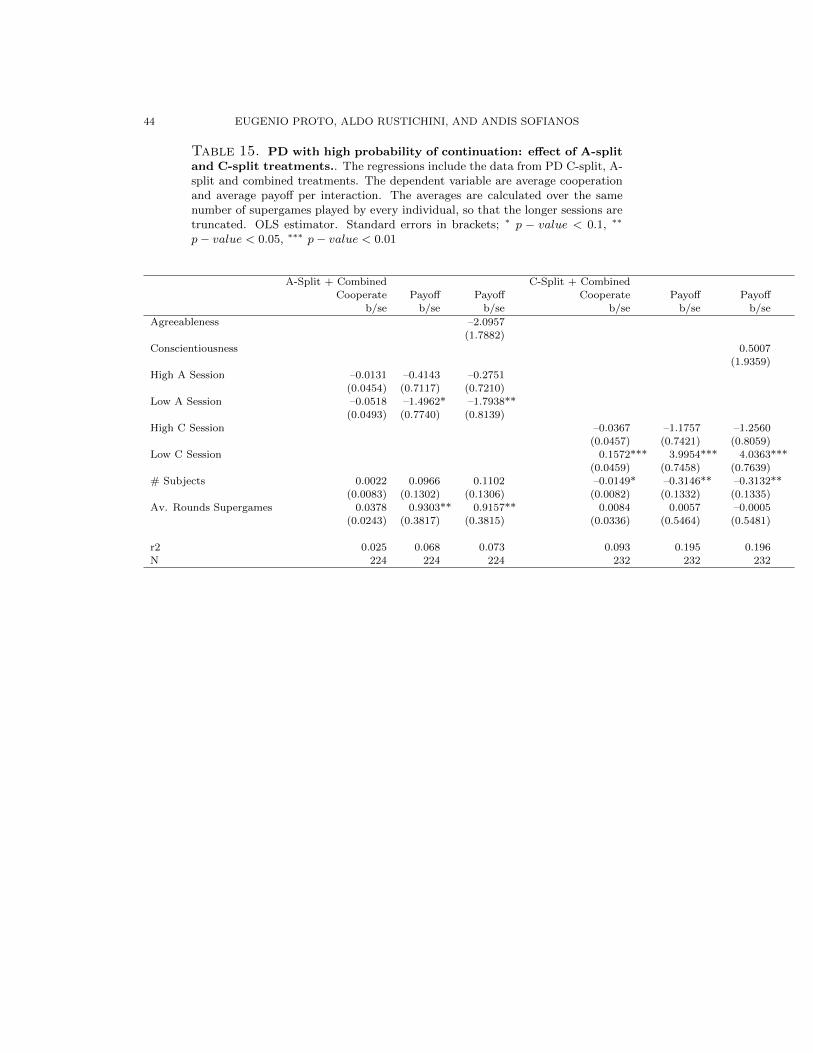
44 EUGENIO PROTO, ALDO RUSTICHINI, AND ANDIS SOFIANOS
Table 15. PD with high probability of continuation: effect of A-splitand C-split treatments.. The regressions include the data from PD C-split, A-split and combined treatments. The dependent variable are average cooperationand average payoff per interaction. The averages are calculated over the samenumber of supergames played by every individual, so that the longer sessions aretruncated. OLS estimator. Standard errors in brackets; ∗ p − value < 0.1, ∗∗
p− value < 0.05, ∗∗∗ p− value < 0.01
A-Split + Combined C-Split + CombinedCooperate Payoff Payoff Cooperate Payoff Payoff
b/se b/se b/se b/se b/se b/se
Agreeableness –2.0957
(1.7882)Conscientiousness 0.5007
(1.9359)
High A Session –0.0131 –0.4143 –0.2751(0.0454) (0.7117) (0.7210)
Low A Session –0.0518 –1.4962* –1.7938**
(0.0493) (0.7740) (0.8139)High C Session –0.0367 –1.1757 –1.2560
(0.0457) (0.7421) (0.8059)Low C Session 0.1572*** 3.9954*** 4.0363***
(0.0459) (0.7458) (0.7639)
# Subjects 0.0022 0.0966 0.1102 –0.0149* –0.3146** –0.3132**(0.0083) (0.1302) (0.1306) (0.0082) (0.1332) (0.1335)
Av. Rounds Supergames 0.0378 0.9303** 0.9157** 0.0084 0.0057 –0.0005
(0.0243) (0.3817) (0.3815) (0.0336) (0.5464) (0.5481)
r2 0.025 0.068 0.073 0.093 0.195 0.196
N 224 224 224 232 232 232
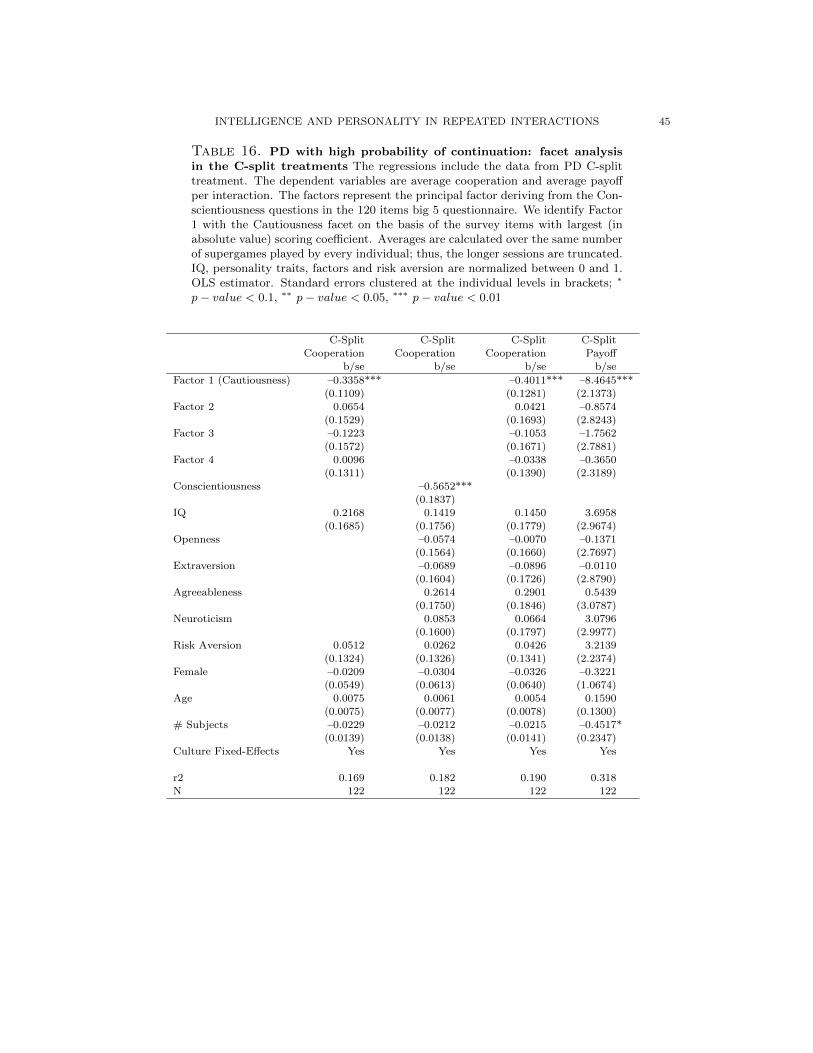
INTELLIGENCE AND PERSONALITY IN REPEATED INTERACTIONS 45
Table 16. PD with high probability of continuation: facet analysisin the C-split treatments The regressions include the data from PD C-splittreatment. The dependent variables are average cooperation and average payoffper interaction. The factors represent the principal factor deriving from the Con-scientiousness questions in the 120 items big 5 questionnaire. We identify Factor1 with the Cautiousness facet on the basis of the survey items with largest (inabsolute value) scoring coefficient. Averages are calculated over the same numberof supergames played by every individual; thus, the longer sessions are truncated.IQ, personality traits, factors and risk aversion are normalized between 0 and 1.OLS estimator. Standard errors clustered at the individual levels in brackets; ∗
p− value < 0.1, ∗∗ p− value < 0.05, ∗∗∗ p− value < 0.01
C-Split C-Split C-Split C-Split
Cooperation Cooperation Cooperation Payoffb/se b/se b/se b/se
Factor 1 (Cautiousness) –0.3358*** –0.4011*** –8.4645***(0.1109) (0.1281) (2.1373)
Factor 2 0.0654 0.0421 –0.8574
(0.1529) (0.1693) (2.8243)Factor 3 –0.1223 –0.1053 –1.7562
(0.1572) (0.1671) (2.7881)Factor 4 0.0096 –0.0338 –0.3650
(0.1311) (0.1390) (2.3189)
Conscientiousness –0.5652***(0.1837)
IQ 0.2168 0.1419 0.1450 3.6958
(0.1685) (0.1756) (0.1779) (2.9674)Openness –0.0574 –0.0070 –0.1371
(0.1564) (0.1660) (2.7697)
Extraversion –0.0689 –0.0896 –0.0110(0.1604) (0.1726) (2.8790)
Agreeableness 0.2614 0.2901 0.5439
(0.1750) (0.1846) (3.0787)Neuroticism 0.0853 0.0664 3.0796
(0.1600) (0.1797) (2.9977)Risk Aversion 0.0512 0.0262 0.0426 3.2139
(0.1324) (0.1326) (0.1341) (2.2374)
Female –0.0209 –0.0304 –0.0326 –0.3221(0.0549) (0.0613) (0.0640) (1.0674)
Age 0.0075 0.0061 0.0054 0.1590
(0.0075) (0.0077) (0.0078) (0.1300)# Subjects –0.0229 –0.0212 –0.0215 –0.4517*
(0.0139) (0.0138) (0.0141) (0.2347)Culture Fixed-Effects Yes Yes Yes Yes
r2 0.169 0.182 0.190 0.318
N 122 122 122 122
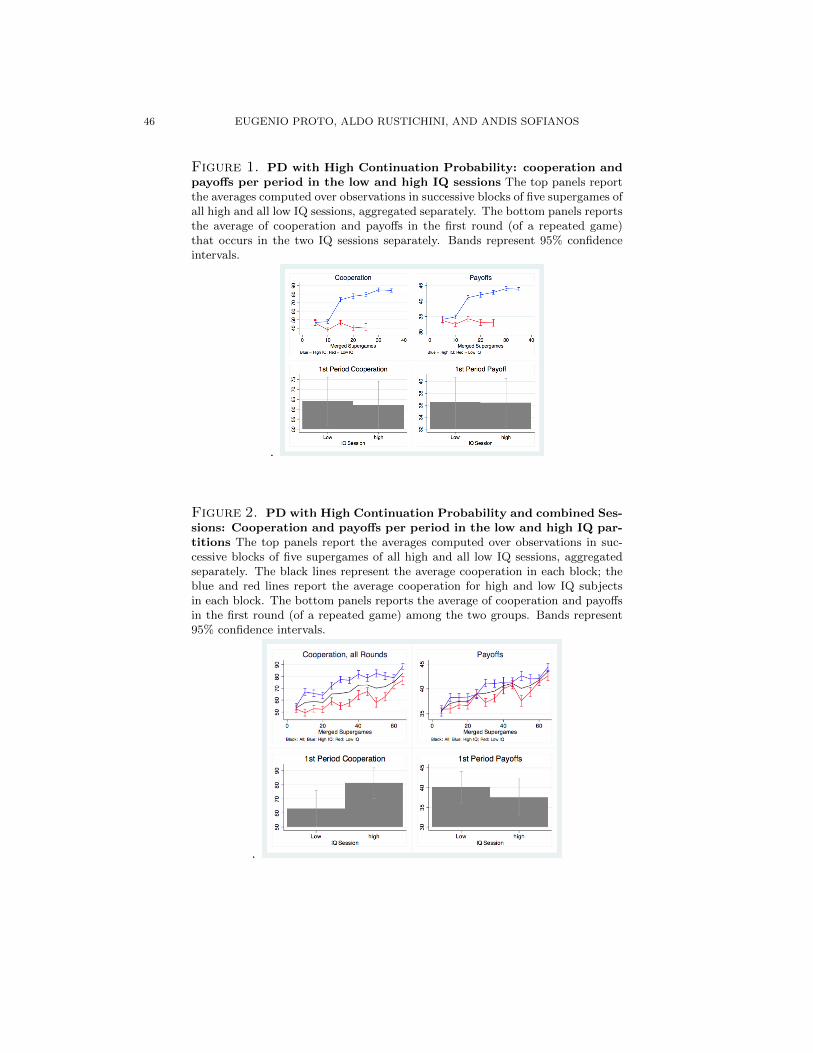
46 EUGENIO PROTO, ALDO RUSTICHINI, AND ANDIS SOFIANOS
Figure 1. PD with High Continuation Probability: cooperation andpayoffs per period in the low and high IQ sessions The top panels reportthe averages computed over observations in successive blocks of five supergames ofall high and all low IQ sessions, aggregated separately. The bottom panels reportsthe average of cooperation and payoffs in the first round (of a repeated game)that occurs in the two IQ sessions separately. Bands represent 95% confidenceintervals.
.
Figure 2. PD with High Continuation Probability and combined Ses-sions: Cooperation and payoffs per period in the low and high IQ par-titions The top panels report the averages computed over observations in suc-cessive blocks of five supergames of all high and all low IQ sessions, aggregatedseparately. The black lines represent the average cooperation in each block; theblue and red lines report the average cooperation for high and low IQ subjectsin each block. The bottom panels reports the average of cooperation and payoffsin the first round (of a repeated game) among the two groups. Bands represent95% confidence intervals.
.
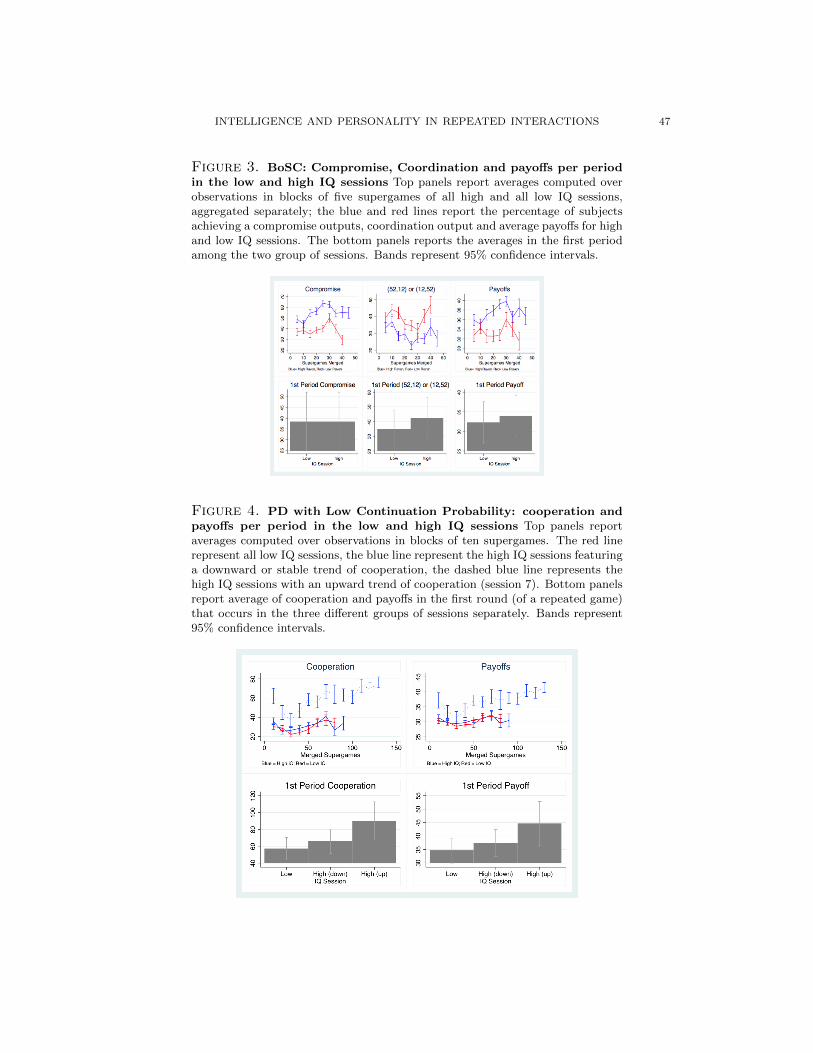
INTELLIGENCE AND PERSONALITY IN REPEATED INTERACTIONS 47
Figure 3. BoSC: Compromise, Coordination and payoffs per periodin the low and high IQ sessions Top panels report averages computed overobservations in blocks of five supergames of all high and all low IQ sessions,aggregated separately; the blue and red lines report the percentage of subjectsachieving a compromise outputs, coordination output and average payoffs for highand low IQ sessions. The bottom panels reports the averages in the first periodamong the two group of sessions. Bands represent 95% confidence intervals.
Figure 4. PD with Low Continuation Probability: cooperation andpayoffs per period in the low and high IQ sessions Top panels reportaverages computed over observations in blocks of ten supergames. The red linerepresent all low IQ sessions, the blue line represent the high IQ sessions featuringa downward or stable trend of cooperation, the dashed blue line represents thehigh IQ sessions with an upward trend of cooperation (session 7). Bottom panelsreport average of cooperation and payoffs in the first round (of a repeated game)that occurs in the three different groups of sessions separately. Bands represent95% confidence intervals.
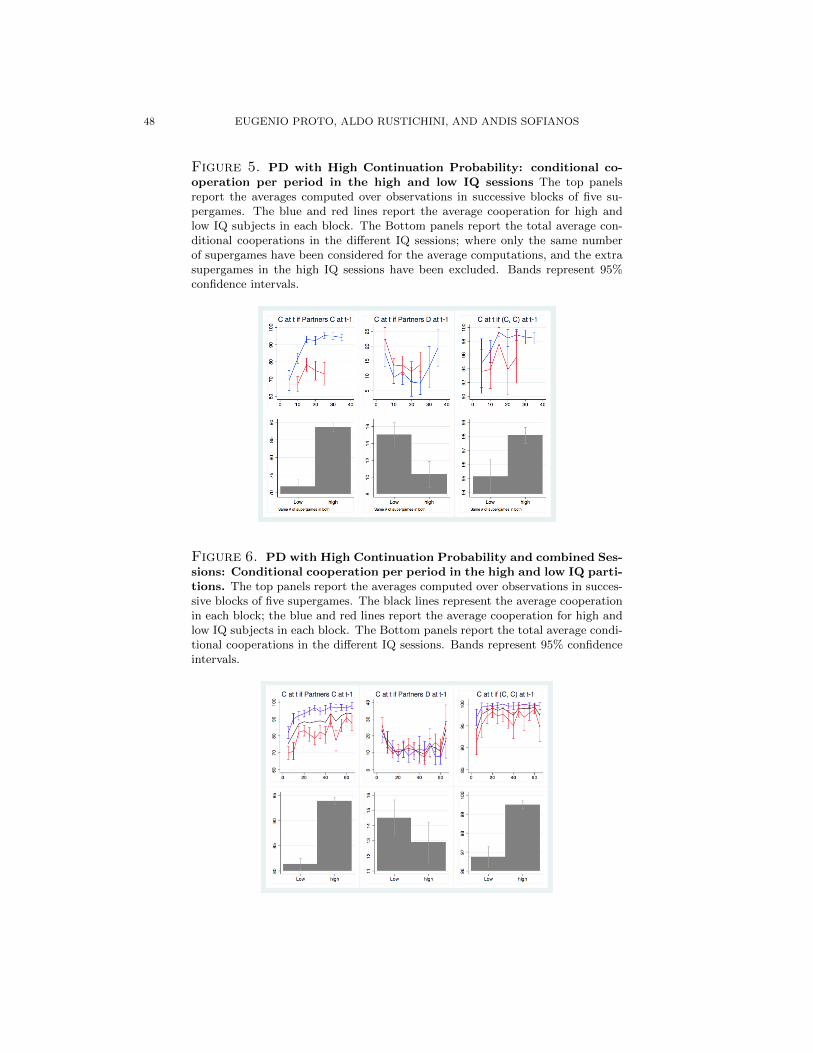
48 EUGENIO PROTO, ALDO RUSTICHINI, AND ANDIS SOFIANOS
Figure 5. PD with High Continuation Probability: conditional co-operation per period in the high and low IQ sessions The top panelsreport the averages computed over observations in successive blocks of five su-pergames. The blue and red lines report the average cooperation for high andlow IQ subjects in each block. The Bottom panels report the total average con-ditional cooperations in the different IQ sessions; where only the same numberof supergames have been considered for the average computations, and the extrasupergames in the high IQ sessions have been excluded. Bands represent 95%confidence intervals.
Figure 6. PD with High Continuation Probability and combined Ses-sions: Conditional cooperation per period in the high and low IQ parti-tions. The top panels report the averages computed over observations in succes-sive blocks of five supergames. The black lines represent the average cooperationin each block; the blue and red lines report the average cooperation for high andlow IQ subjects in each block. The Bottom panels report the total average condi-tional cooperations in the different IQ sessions. Bands represent 95% confidenceintervals.

INTELLIGENCE AND PERSONALITY IN REPEATED INTERACTIONS 49
Figure 7. BoSC: Conditional compromise per period in the high andlow IQ sessions The top panels report the averages computed over observationsin successive blocks of ten supergames. The red line represents all low IQ sessions,the bold blue line represent the high IQ sessions . The Bottom panels report thetotal average conditional cooperations in the two different IQ sessions separately;the bands represent 95% confidence intervals.
Figure 8. PD and BoSC: Deviation from natural equilibrium if nat-ural equilibrium is the outcome at time t-1 by subjects sorted in IQquantiles. Vertical axis: fraction of D choice when the action profile in the pre-vious period was (C,C) for PD and fraction of B choice when the action profilein the previous period was (W,W ) . Bands represent 95% confidence intervals.

50 EUGENIO PROTO, ALDO RUSTICHINI, AND ANDIS SOFIANOS
Figure 9. SH: stag choice and payoffs per period in the low and highIQ sessions The top panels report the averages computed over observations insuccessive blocks of five supergames of all high and all low IQ sessions, aggregatedseparately; the blue and red lines report the average stag choices for high and lowIQ subjects in each block respectively. The bottom panels report the stag choicesand payoffs in the first period in the two IQ sessions separately. Bands represent95% confidence intervals.
Figure 10. SH: Stag choice in t, conditional on (Stag, Stag) at t−1. Theleft panel reports the percentage of the Stag choices if the same pair coordinatedon (Stag, Stag) in period t− 1, computed over observations in successive blocksof five supergames, of all high and all low IQ sessions aggregated separately. Theblue and red lines refer to the high and low IQ subjects in each block respectively.The right panel reports the averages in the total averages in the two IQ sessionsseparately. Bands represent 95% confidence intervals.
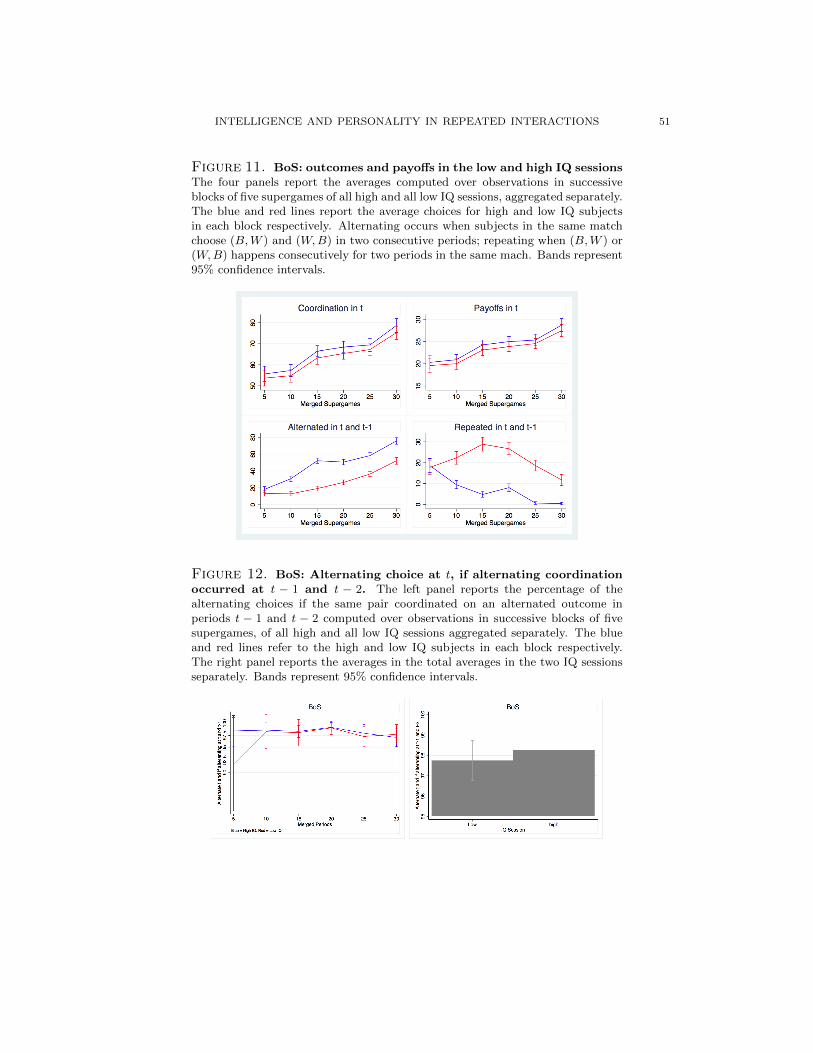
INTELLIGENCE AND PERSONALITY IN REPEATED INTERACTIONS 51
Figure 11. BoS: outcomes and payoffs in the low and high IQ sessionsThe four panels report the averages computed over observations in successiveblocks of five supergames of all high and all low IQ sessions, aggregated separately.The blue and red lines report the average choices for high and low IQ subjectsin each block respectively. Alternating occurs when subjects in the same matchchoose (B,W ) and (W,B) in two consecutive periods; repeating when (B,W ) or(W,B) happens consecutively for two periods in the same mach. Bands represent95% confidence intervals.
Figure 12. BoS: Alternating choice at t, if alternating coordinationoccurred at t − 1 and t − 2. The left panel reports the percentage of thealternating choices if the same pair coordinated on an alternated outcome inperiods t − 1 and t − 2 computed over observations in successive blocks of fivesupergames, of all high and all low IQ sessions aggregated separately. The blueand red lines refer to the high and low IQ subjects in each block respectively.The right panel reports the averages in the total averages in the two IQ sessionsseparately. Bands represent 95% confidence intervals.

52 EUGENIO PROTO, ALDO RUSTICHINI, AND ANDIS SOFIANOS
Figure 13. PD with High Continuation Probability: Cooperationand payoffs per period in the low and high Conscientiousness sessions.The top panels report the averages computed over observations in successiveblocks of five supergames of all high and all low Conscientiousness sessions, ag-gregated separately; the blue and red lines report the average cooperation andaverage payoffs for high and low Conscientiousness sessions respectively. The bluedotted line represents session 5 that has not been aggregated with the other HighC sessions. The bottom panels report the average of cooperation and payoffs inthe first period among the two groups of sessions. Bands represent 95% confidenceintervals.
Figure 14. PD with High Continuation Probability and combinedSessions: Cooperation and payoffs per period in the low and high Con-scientiousness partitions. The top panels report the averages computed overobservations in successive blocks of five supergames of all sessions, aggregatedseparately. The black lines represent the average cooperation in each block; theblue and red lines report the average cooperation for high and low C subjects ineach block. The bottom panels reports the average of cooperation and payoffs inthe first round (of a repeated game) among the two groups. Bands represent 95%confidence intervals.

INTELLIGENCE AND PERSONALITY IN REPEATED INTERACTIONS 53
Figure 15. PD with High Continuation Probability: Cooperationand payoffs per period in the low and high Agreeableness sessions Thetop panels report the averages computed over observations in successive blocksof five supergames of all high and all low Agreeableness sessions, aggregatedseparately; the blue and red lines report the average cooperation and averagepayoffs for high and low Agreeableness sessions. The blue dotted line representsession 7 not been aggregated with the other High A sessions. The bottom panelsreports the average of cooperation and payoffs in the first period among the twogroup of sessions. Bands represent 95% confidence intervals.
Figure 16. PD with High Continuation Probability and combinedSessions: Cooperation and payoffs per period in the low and highAgreeableness partitions The top panels report the averages computed overobservations in successive blocks of five supergames of all sessions, aggregatedseparately. The black lines represent the average cooperation in each block; theblue and red lines report the average cooperation for high and low A subjects ineach block. The bottom panels reports the average of cooperation and payoffs inthe first round (of a repeated game) among the two groups. Bands represent 95%confidence intervals.
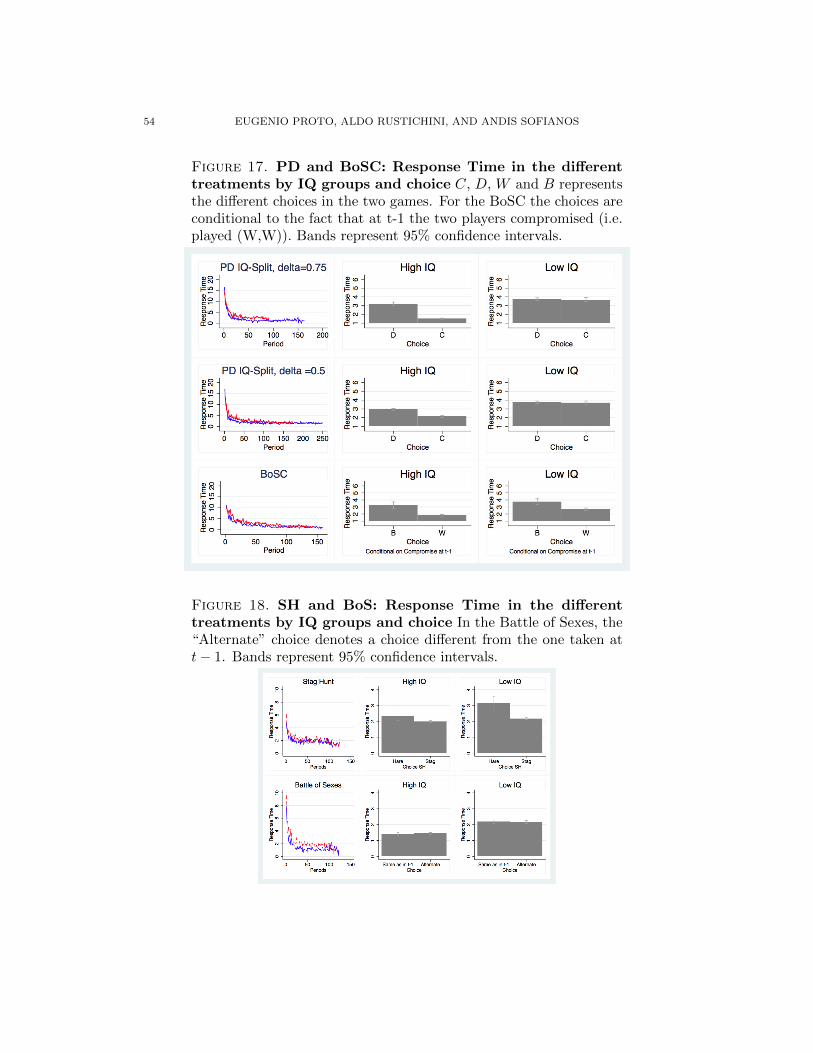
54 EUGENIO PROTO, ALDO RUSTICHINI, AND ANDIS SOFIANOS
Figure 17. PD and BoSC: Response Time in the differenttreatments by IQ groups and choice C, D, W and B representsthe different choices in the two games. For the BoSC the choices areconditional to the fact that at t-1 the two players compromised (i.e.played (W,W)). Bands represent 95% confidence intervals.
Figure 18. SH and BoS: Response Time in the differenttreatments by IQ groups and choice In the Battle of Sexes, the“Alternate” choice denotes a choice different from the one taken att− 1. Bands represent 95% confidence intervals.

INTELLIGENCE AND PERSONALITY IN REPEATED INTERACTIONS 55
References
Agranov, M., Potamites, E., Schotter, A. and Tergiman, C. (2012). Beliefs and en-
dogenous cognitive levels: An experimental study, Games and Economic Behavior
75(2): 449–463.
Alaoui, L. and Penta, A. (2015). Endogenous depth of reasoning, The Review of
Economic Studies p. rdv052.
Andreoni, J. and Miller, J. H. (1993). Rational cooperation in the finitely repeated
prisoner’s dilemma: Experimental evidence, The Economic Journal pp. 570–585.
Aoyagi, M. and Frechette, G. (2009). Collusion as public monitoring becomes noisy:
Experimental evidence, Journal of Economic Theory 144(3): 1135–1165.
Benjamin, D. J., Brown, S. A. and Shapiro, J. M. (2013). Who is behavioral?
cognitive ability and anomalous preferences, Journal of the European Economic
Association 11(6): 1231–1255.
Blonski, M., Ockenfels, P. and Spagnolo, G. (2011). Equilibrium selection in the
repeated prisoner’s dilemma: Axiomatic approach and experimental evidence,
American Economic Journal: Microeconomics 3(3): 164–192.
Blonski, M. and Spagnolo, G. (2015). Prisoners other dilemma, International Jour-
nal of Game Theory 44(1): 61–81.
Bowles, S., Gintis, H. and Osborne, M. (2001). The determinants of earnings: A
behavioral approach, Journal of Economic Literature pp. 1137–1176.
Brinch, C. N. and Galloway, T. A. (2012). Schooling in adolescence raises iq scores,
Proceedings of the National Academy of Sciences 109(2): 425–430.
Burks, S. V., Carpenter, J. P., Goette, L. and Rustichini, A. (2009). Cognitive skills
affect economic preferences, strategic behavior, and job attachment, Proceedings
of the National Academy of Sciences 106(19): 7745–7750.
Camerer, C. F., Ho, T.-H. and Chong, J.-K. (2002). Sophisticated experience-
weighted attraction learning and strategic teaching in repeated games, Journal of
Economic Theory 104(1): 137–188.
Carpenter, P. A., Just, M. A. and Shell, P. (1990). What one intelligence test
measures: a theoretical account of the processing in the raven progressive matrices
test., Psychological Review 97(3): 404–431.
Charness, G., Masclet, D. and Villeval, M. C. (2013). The dark side of competition
for status, Management Science 60(1): 38–55.
Charness, G., Rustichini, A. and van de Ven, J. (2011). Self-confidence and strategic
deterrence, Technical report, Tinbergen Institute Discussion Paper.
56 EUGENIO PROTO, ALDO RUSTICHINI, AND ANDIS SOFIANOS
Costa-Gomes, M. A. and Crawford, V. P. (2006). Cognition and behavior in
two-person guessing games: An experimental study, American Economic Review
pp. 1737–1768.
Costa-Gomes, M., Crawford, V. P. and Broseta, B. (2001). Cognition and behavior
in normal-form games: An experimental study, Econometrica pp. 1193–1235.
Dal Bo, P. (2005). Cooperation under the shadow of the future: experimental
evidence from infinitely repeated games, American Economic Review pp. 1591–
1604.
Dal Bo, P. and Frechette, G. R. (2011). The evolution of cooperation in infinitely re-
peated games: Experimental evidence, American Economic Review 101(1): 411–
429.
Dal Bo, P. and Frechette, G. R. (2016). On the determinants of cooperation in
infinitely repeated games: A survey.
Davis, D., Ivanov, A. and Korenok, O. (2016). Individual characteristics and behav-
ior in repeated games: an experimental study, Experimental Economics 19(1): 67–
99.
Dohmen, T., Falk, A., Huffman, D. and Sunde, U. (2010). Are risk aversion and
impatience related to cognitive ability?, American Economic Review 100: 1238–
1260.
Dreber, A., Fudenberg, D. and Rand, D. G. (2014). Who cooperates in repeated
games: The role of altruism, inequity aversion, and demographics, Journal of
Economic Behavior & Organization 98: 41–55.
Duffy, J. and Ochs, J. (2009). Cooperative behavior and the frequency of social
interaction, Games and Economic Behavior 66(2): 785–812.
Duncan, J., Parr, A., Woolgar, A., Thompson, R., Bright, P., Cox, S., Bishop, S.
and Nimmo-Smith, I. (2008). Goal neglect and spearman’s g: competing parts of
a complex task., Journal of Experimental Psychology: General 137(1): 131–148.
Feinberg, R. M. and Husted, T. A. (1993). An experimental test of discount-rate
effects on collusive behaviour in duopoly markets, The Journal of Industrial Eco-
nomics pp. 153–160.
Fischbacher, U. (2007). Z-tree: Zurich toolbox for ready-made economic experi-
ments, Experimental Economics 10(2): 171–178.
Frederick, S. (2005). Cognitive reflection and decision making, Journal of Economic
Perspectives pp. 25–42.
Friedman, D. and Oprea, R. (2012). A continuous dilemma, American Economic
Review pp. 337–363.

INTELLIGENCE AND PERSONALITY IN REPEATED INTERACTIONS 57
Fudenberg, D., Rand, D. G. and Dreber, A. (2012). Slow to anger and fast to forgive:
Cooperation in an uncertain world, American Economic Review 102(2): 720–749.
Gill, D. and Prowse, V. L. (forthcoming). Cognitive ability, character skills, and
learning to play equilibrium: A level-k analysis, Journal of Political Economy .
Gottfredson, L. S. (1997). Why g matters: The complexity of everyday life, Intelli-
gence 24(1): 79–132.
Heckman, J. J. (2006). Skill formation and the economics of investing in disadvan-
taged children, Science 312(5782): 1900–1902.
Heckman, J. J., Stixrud, J. and Urzua, S. (2006). The effects of cognitive and
noncognitive abilities on labor market outcomes and social behavior, Journal of
Labor Economics 24(3): 411–482.
Heckman, J., Pinto, R. and Savelyev, P. (2013). Understanding the mechanisms
through which an influential early childhood program boosted adult outcomes,
American Economic Review 103(6): 1–35.
Holt, C. A. (1985). An experimental test of the consistent-conjectures hypothesis,
American Economic Review pp. 314–325.
Holt, C. A. and Laury, S. K. (2002). Risk aversion and incentive effects, American
Economic Review 92(5): 1644–1655.
Hyndman, K., Ozbay, E. Y., Schotter, A. and Ehrblatt, W. Z. (2012). Convergence:
an experimental study of teaching and learning in repeated games, Journal of the
European Economic Association 10(3): 573–604.
John, O. P., Donahue, E. M. and Kentle, R. L. (1991). The big five inventory:
versions 4a and 54, Berkeley, CA: University of California, Berkeley, Institute of
Personality and Social Research.
John, O. P., Naumann, L. P. and Soto, C. J. (2008). Paradigm shift to the integrative
big five trait taxonomy, in R. W. R. Oliver P. John and L. A. Pervin (eds),
Handbook of Personality: Theory and Research, Guilford Press New York, NY,
pp. 114–158.
Johnson, J. A. (2014). Measuring thirty facets of the five factor model with a 120-
item public domain inventory: Development of the IPIP-NEO-120, Journal of
Research in Personality 51: 78–89.
Jones, G. (2008). Are smarter groups more cooperative? evidence from prisoner’s
dilemma experiments, 1959–2003, Journal of Economic Behavior & Organization
68(3): 489–497.
Jones, G. and Schneider, W. (2010). IQ in the production function: Evidence from
immigrant earnings, Economic Inquiry 48(3): 743–755.

58 EUGENIO PROTO, ALDO RUSTICHINI, AND ANDIS SOFIANOS
Kagel, J. and McGee, P. (2014). Personality and cooperation in finitely repeated
prisoners dilemma games, Economics Letters 124(2): 274–277.
Larson, G. E., Saccuzzo, D. P. and Brown, J. (1994). Motivation: Cause or confound
in information processing/intelligence correlations?, Acta Psychologica 85(1): 25–
37.
Mani, A., Mullainathan, S., Shafir, E. and Zhao, J. (2013). Poverty impedes cogni-
tive function, Science 341(6149): 976–980.
Nagel, R. (1995). Unraveling in guessing games: An experimental study, American
Economic Review 85(5): 1313–1326.
Neal, D. A. and Johnson, W. R. (1996). The role of premarket factors in black-white
wage differences, Journal of Political Economy 104(5): 869–895.
Neisser, U., Boodoo, G., Bouchard Jr, T. J., Boykin, A. W., Brody, N., Ceci,
S. J., Halpern, D. F., Loehlin, J. C., Perloff, R., Sternberg, R. J. et al. (1996).
Intelligence: knowns and unknowns., American Psychologist 51(2): 77–101.
Oechssler, J., Roider, A. and Schmitz, P. W. (2009). Cognitive abilities and behav-
ioral biases, Journal of Economic Behavior & Organization 72(1): 147–152.
Palacios-Huerta, I. and Volij, O. (2009). Field centipedes, American Economic
Review 99(4): 1619–1635.
Palfrey, T. R. and Rosenthal, H. (1994). Repeated play, cooperation and coordina-
tion: An experimental study, The Review of Economic Studies 61(3): 545–565.
Powers, D. E. and Kaufman, J. C. (2004). Do standardized tests penalize deep-
thinking, creative, or conscientious students? some personality correlates of grad-
uate record examinations test scores, Intelligence 32(2): 145–153.
Roth, A. E. and Murnighan, J. K. (1978). Equilibrium behavior and repeated play
of the prisoner’s dilemma, Journal of Mathematical Psychology 17(2): 189–198.
Sabater-Grande, G. and Georgantzis, N. (2002). Accounting for risk aversion in
repeated prisoners dilemma games: An experimental test, Journal of Economic
Behavior & Organization 48(1): 37–50.
Selten, R. and Stoecker, R. (1986). End behavior in sequences of finite prisoner’s
dilemma supergames a learning theory approach, Journal of Economic Behavior
& Organization 7(1): 47–70.
Stahl, D. O. (1991). The graph of prisoners’ dilemma supergame payoffs as a function
of the discount factor, Games and Economic Behavior 3(3): 368–384.
Stahl, D. O. and Wilson, P. W. (1995). On players models of other players: Theory
and experimental evidence, Games and Economic Behavior 10(1): 218–254.
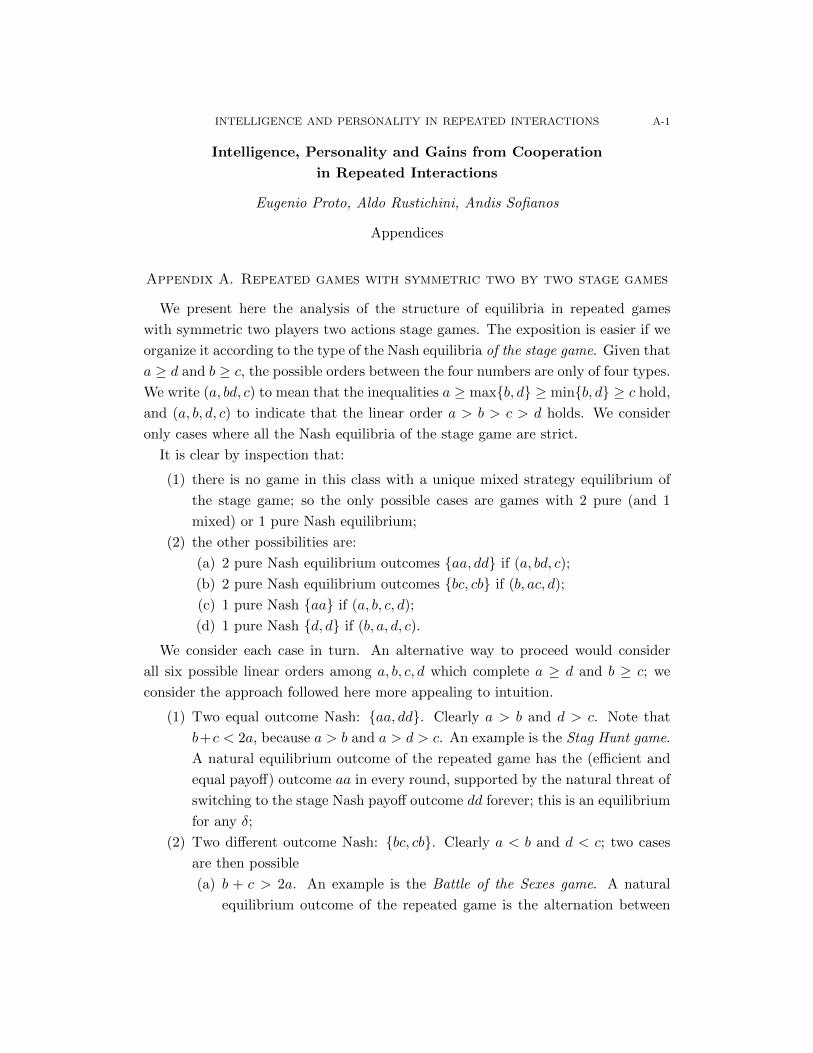
INTELLIGENCE AND PERSONALITY IN REPEATED INTERACTIONS A-1
Intelligence, Personality and Gains from Cooperation
in Repeated Interactions
Eugenio Proto, Aldo Rustichini, Andis Sofianos
Appendices
Appendix A. Repeated games with symmetric two by two stage games
We present here the analysis of the structure of equilibria in repeated games
with symmetric two players two actions stage games. The exposition is easier if we
organize it according to the type of the Nash equilibria of the stage game. Given that
a ≥ d and b ≥ c, the possible orders between the four numbers are only of four types.
We write (a, bd, c) to mean that the inequalities a ≥ max{b, d} ≥ min{b, d} ≥ c hold,
and (a, b, d, c) to indicate that the linear order a > b > c > d holds. We consider
only cases where all the Nash equilibria of the stage game are strict.
It is clear by inspection that:
(1) there is no game in this class with a unique mixed strategy equilibrium of
the stage game; so the only possible cases are games with 2 pure (and 1
mixed) or 1 pure Nash equilibrium;
(2) the other possibilities are:
(a) 2 pure Nash equilibrium outcomes {aa, dd} if (a, bd, c);
(b) 2 pure Nash equilibrium outcomes {bc, cb} if (b, ac, d);
(c) 1 pure Nash {aa} if (a, b, c, d);
(d) 1 pure Nash {d, d} if (b, a, d, c).
We consider each case in turn. An alternative way to proceed would consider
all six possible linear orders among a, b, c, d which complete a ≥ d and b ≥ c; we
consider the approach followed here more appealing to intuition.
(1) Two equal outcome Nash: {aa, dd}. Clearly a > b and d > c. Note that
b+c < 2a, because a > b and a > d > c. An example is the Stag Hunt game.
A natural equilibrium outcome of the repeated game has the (efficient and
equal payoff) outcome aa in every round, supported by the natural threat of
switching to the stage Nash payoff outcome dd forever; this is an equilibrium
for any δ;
(2) Two different outcome Nash: {bc, cb}. Clearly a < b and d < c; two cases
are then possible
(a) b + c > 2a. An example is the Battle of the Sexes game. A natural
equilibrium outcome of the repeated game is the alternation between

A-2 EUGENIO PROTO, ALDO RUSTICHINI, AND ANDIS SOFIANOS
bc and cb, supported by threat of reverting to the stage Nash payoff
outcome cb forever if player 1 deviates to the outcome dd when the
outcome cb is to be played; this is an equilibrium for all δ, since c > d.
The payoffs are b+δc1+δ ,
c+δb1+δ if the outcome in the first round is bc; given
that b ≥ c then the player who gets b first has a higher payoff; the
difference is 1−δ1+δ (b− c).
(b) b+ c < 2a. An example is the Battle of the Sexes with a Compromise.
An efficient outcome has aa in every round, and this is an equilibrium if
δ ≥ b−ab−c under the threat of switching to the stage Nash payoff outcome
cb forever if player 1 deviates, and to bc if player 2 deviates. The classic
Hawk-Dove game occurs when b+ c = 2a.
(3) One equal outcome Nash, {aa}. Clearly a > b and c > d, thus since b ≥ c we
have the linear order (a, b, c, d). Then the equal payoff outcome aa in every
round is also a natural Nash equilibrium outcome of the repeated game
(4) One equal outcome Nash, {dd}. Clearly b > a > d > c;
(a) b+c ≤ 2a. An example is the Prisoner’s Dilemma game. The aa payoff
outcome in every round is an equilibrium under the threat of switching
to the stage Nash payoff outcome dd if δ ≥ b−ab−d ; this equilibrium is also
efficient.
(b) b+ c > 2a. Again, an example is the Prisoner’s Dilemma (but with the
violation of the usual condition b+ c ≤ 2a); in this case the alternation
between the outcomes bc and cb is an equilibrium under the threat of
switching to the stage Nash payoff outcome dd if δ ≥ d−cb−d .
Appendix B. Econometric Models
In the experiment we will generally collect multiple data for each subjects i ∈{1, ..., N} making choices or achieving a payoff in different period t ∈ {1, ..., Ti},that we aim to explain. Hence our raw data have a panel structure.
In this section, we present the 3 types of models we estimate in the following
analysis.
B.1. Cross Sectional Models. In order to assess the effect of the individual char-
acteristics on individual cooperation rates, say chi (or on individual average payoff),
we estimate the following model
(A-1) chi = α+ xiβ + ziγ1 + diγ2 + εi
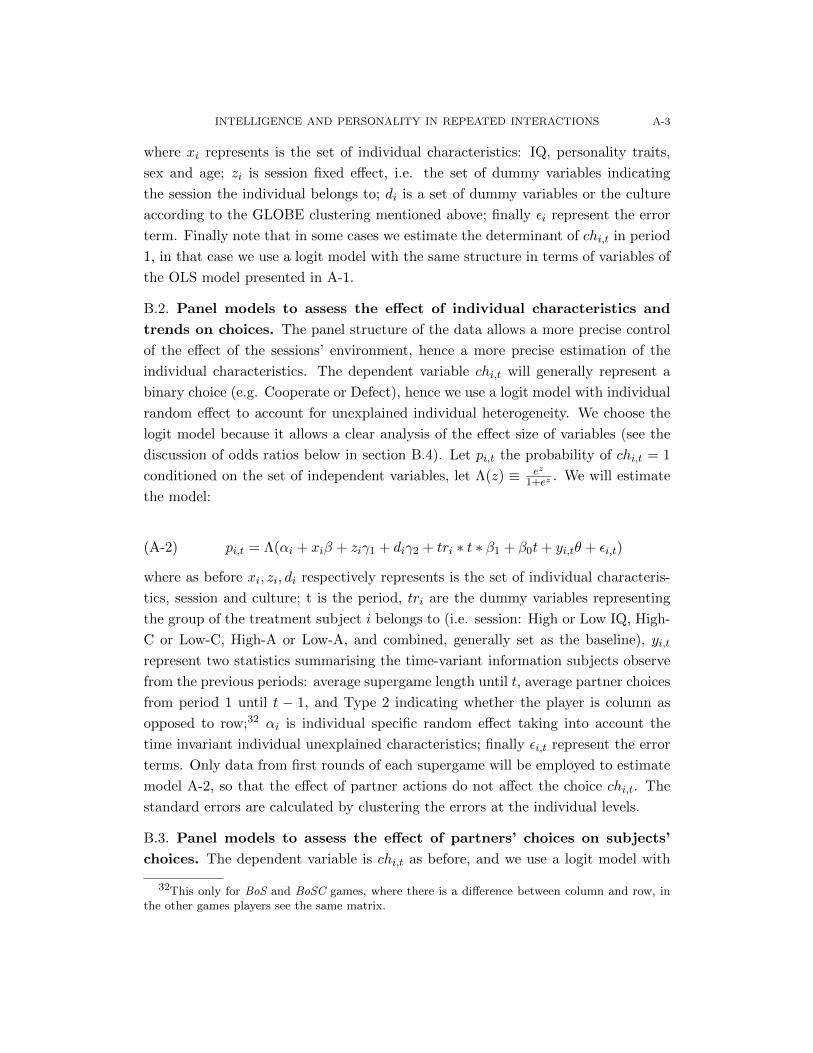
INTELLIGENCE AND PERSONALITY IN REPEATED INTERACTIONS A-3
where xi represents is the set of individual characteristics: IQ, personality traits,
sex and age; zi is session fixed effect, i.e. the set of dummy variables indicating
the session the individual belongs to; di is a set of dummy variables or the culture
according to the GLOBE clustering mentioned above; finally εi represent the error
term. Finally note that in some cases we estimate the determinant of chi,t in period
1, in that case we use a logit model with the same structure in terms of variables of
the OLS model presented in A-1.
B.2. Panel models to assess the effect of individual characteristics and
trends on choices. The panel structure of the data allows a more precise control
of the effect of the sessions’ environment, hence a more precise estimation of the
individual characteristics. The dependent variable chi,t will generally represent a
binary choice (e.g. Cooperate or Defect), hence we use a logit model with individual
random effect to account for unexplained individual heterogeneity. We choose the
logit model because it allows a clear analysis of the effect size of variables (see the
discussion of odds ratios below in section B.4). Let pi,t the probability of chi,t = 1
conditioned on the set of independent variables, let Λ(z) ≡ ez
1+ez . We will estimate
the model:
(A-2) pi,t = Λ(αi + xiβ + ziγ1 + diγ2 + tri ∗ t ∗ β1 + β0t+ yi,tθ + εi,t)
where as before xi, zi, di respectively represents is the set of individual characteris-
tics, session and culture; t is the period, tri are the dummy variables representing
the group of the treatment subject i belongs to (i.e. session: High or Low IQ, High-
C or Low-C, High-A or Low-A, and combined, generally set as the baseline), yi,t
represent two statistics summarising the time-variant information subjects observe
from the previous periods: average supergame length until t, average partner choices
from period 1 until t − 1, and Type 2 indicating whether the player is column as
opposed to row;32 αi is individual specific random effect taking into account the
time invariant individual unexplained characteristics; finally εi,t represent the error
terms. Only data from first rounds of each supergame will be employed to estimate
model A-2, so that the effect of partner actions do not affect the choice chi,t. The
standard errors are calculated by clustering the errors at the individual levels.
B.3. Panel models to assess the effect of partners’ choices on subjects’
choices. The dependent variable is chi,t as before, and we use a logit model with
32This only for BoS and BoSC games, where there is a difference between column and row, inthe other games players see the same matrix.
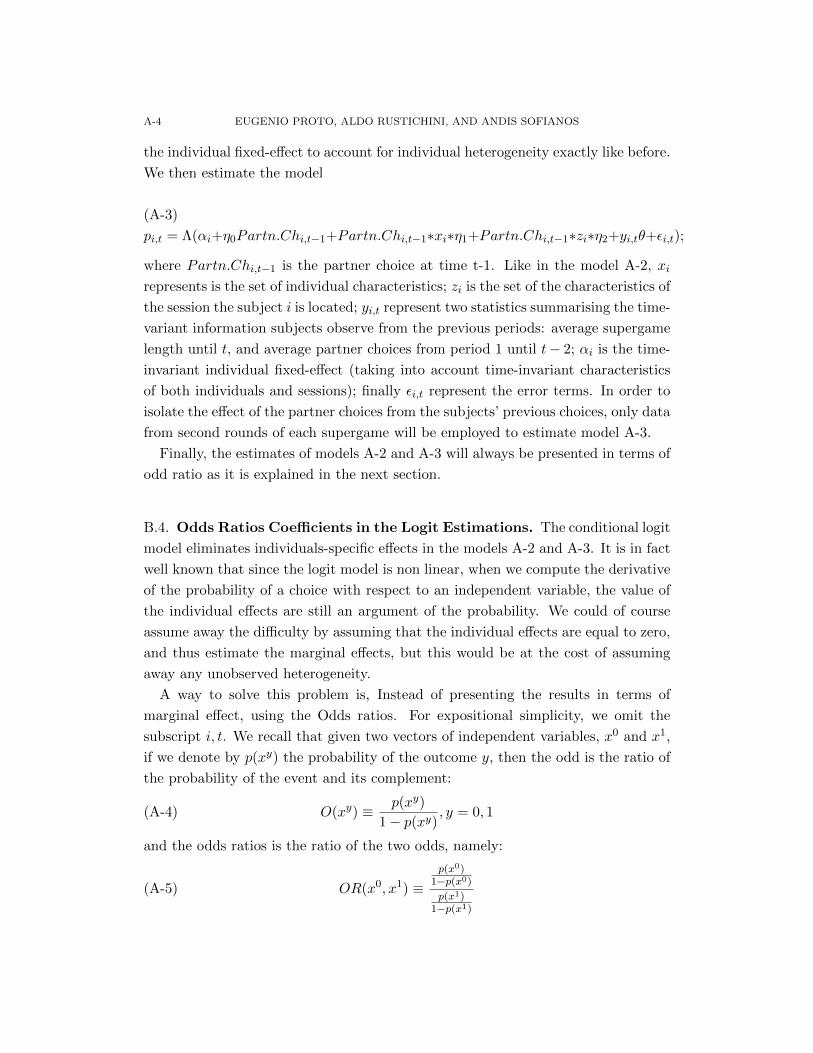
A-4 EUGENIO PROTO, ALDO RUSTICHINI, AND ANDIS SOFIANOS
the individual fixed-effect to account for individual heterogeneity exactly like before.
We then estimate the model
(A-3)
pi,t = Λ(αi+η0Partn.Chi,t−1+Partn.Chi,t−1∗xi∗η1+Partn.Chi,t−1∗zi∗η2+yi,tθ+εi,t);
where Partn.Chi,t−1 is the partner choice at time t-1. Like in the model A-2, xi
represents is the set of individual characteristics; zi is the set of the characteristics of
the session the subject i is located; yi,t represent two statistics summarising the time-
variant information subjects observe from the previous periods: average supergame
length until t, and average partner choices from period 1 until t− 2; αi is the time-
invariant individual fixed-effect (taking into account time-invariant characteristics
of both individuals and sessions); finally εi,t represent the error terms. In order to
isolate the effect of the partner choices from the subjects’ previous choices, only data
from second rounds of each supergame will be employed to estimate model A-3.
Finally, the estimates of models A-2 and A-3 will always be presented in terms of
odd ratio as it is explained in the next section.
B.4. Odds Ratios Coefficients in the Logit Estimations. The conditional logit
model eliminates individuals-specific effects in the models A-2 and A-3. It is in fact
well known that since the logit model is non linear, when we compute the derivative
of the probability of a choice with respect to an independent variable, the value of
the individual effects are still an argument of the probability. We could of course
assume away the difficulty by assuming that the individual effects are equal to zero,
and thus estimate the marginal effects, but this would be at the cost of assuming
away any unobserved heterogeneity.
A way to solve this problem is, Instead of presenting the results in terms of
marginal effect, using the Odds ratios. For expositional simplicity, we omit the
subscript i, t. We recall that given two vectors of independent variables, x0 and x1,
if we denote by p(xy) the probability of the outcome y, then the odd is the ratio of
the probability of the event and its complement:
(A-4) O(xy) ≡ p(xy)
1− p(xy), y = 0, 1
and the odds ratios is the ratio of the two odds, namely:
(A-5) OR(x0, x1) ≡p(x0)
1−p(x0)
p(x1)1−p(x1)

INTELLIGENCE AND PERSONALITY IN REPEATED INTERACTIONS A-5
so a value of OR(x0, x1) equal to 1 indicates that the change of the independent
variable from x0 to x1 induces no change on the odds, and hence no change on the
value of p(x).
For sake of simplicity, assume that the probability follows the logit model
(A-6) p(xyi ) =eαi+xiβ+ziδ+zixiγ1
1 + eαi+xiβ+ziδ+zixiγ1
where αi is the value of the individual effect for subject i, then
(A-7) OR(x0, x1) = e(x0−x1)β+zi(x0−x1)γ1
First of all, equation A-7 clearly indicates that the odds ratios are independent of
the fixed effects (both unobserved, ui and observed, zi, which cancel when we take
the odds ratios). Furthermore, Equation A-7 has a relatively easy interpretation: for
example, when the coefficients of β and γ are positive, then an increase in the value
of xi induces an increase of size e(x0−x1)βezi(x0−x1)γ1 of the odds ratios. The term
e(x0−x1)β is the direct effect of the x variables independent of the values of zi, while
ezi(x0−x1)γ1 is the effect proportional to the value of zi. Finally, note that we said
that in equations A-2 and A-3 we sometimes add a term with a triple interaction, if
we add a triple interacted term, say zix′ixiγ2 in model A-6; then an increase in the
value of xi induces an increase of size e(x0−x1)βezi(x0−x1)γ1ezix
′i(x
0−x1)γ2 of the odds
ratios, with the same interpretation as before.
Appendix C. Experimental Design Details and Implementation
C.1. High & Low Continuation Probability PD IQ-split.
Day One. The Raven test
On the first day of the experiment, the participants were asked to complete a
Raven Advanced Progressive Matrices (APM) test of 30 tables. They had a maxi-
mum of 30 seconds for each table. Before the test, the subjects were shown a table
with an example of a matrix with the correct answer provided below for 45 seconds.
For each item a 3 × 3 matrix of images was displayed on the subjects’ screen; the
image in the bottom right corner was missing. The subjects were then asked to
complete the pattern choosing one out of 8 possible choices presented on the screen.
The 30 tables were presented in order of progressive difficulty and were selected
from Set II of the APM.
The Raven test is a non-verbal test commonly used to measure reasoning ability
and general intelligence. Matrices from Set II of the APM are appropriate for adults
and adolescents of higher average intelligence. The test is able to elicit stable and
A-6 EUGENIO PROTO, ALDO RUSTICHINI, AND ANDIS SOFIANOS
sizeable differences in performances among this pool of individuals. The correlation
between Raven test scores and measures of intellectual achievement suggests that the
underlying processes may be general rather than specific to this one test (Carpenter
et al., 1990). In the economic literature, individuals with higher Raven scores feature
a learning process closer to Bayesian updating (Charness et al., 2011) and have more
accurate beliefs (Burks et al., 2009).
Subjects are not normally rewarded for the Raven test. However it has been
reported that there is a small increase in Raven scores after a monetary reward
is offered to higher than average intelligence subjects similar to the subjects in
our pool (e.g. Larson et al., 1994). Since we wanted to measure intelligence with
minimum confounding with motivation, we decided to reward our subjects with 1
British pound per correct answer from a random choice of three out of the total of
30 matrices. Always with the aim of minimising confounding with other factors, we
never mentioned that Raven is a test of intelligence or cognitive abilities and the
subjects were never informed that they would be separated on the basis of their
performances in this test. We argue below by analysing the distribution of the
subjects’ characteristics in the two Raven sessions, that confounding is unlikely to
be a concern in our experiment and the Raven test allowed the two groups to be
separated uniquely according to the subjects’ level of cognitive ability.
Other tests and questions
Following the Raven test, the participants were asked to respond to a Holt-Laury
task (Holt and Laury, 2002), measuring risk attitudes. The first two experimental
sessions of the high delta treatment did not include the Holt-Laury task, while also
the first two sessions of the low delta treatment did not either. The participants
were paid according to a randomly chosen lottery out of their choices.
Lastly, on the first day participants were asked to respond to a standard Big Five
personality questionnaire together with some demographic questions, a subjective
well-being question and a question on previous experience with a Raven’s test. No
monetary payment was offered for this section of the session. The subjects were
informed of this fact. We used the Big Five Inventory (BFI); the inventory is based
on 44 questions with answers coded on a Likert scale. The version we used was
developed by John et al. (1991) and has been recently investigated by John et al.
(2008).
All the instructions given on the first day are included in the online supplementary
material.33
33see note 2

INTELLIGENCE AND PERSONALITY IN REPEATED INTERACTIONS A-7
Day Two. On the second day, the participants were asked to come back to the lab
and they were allocated to two separate experimental sessions according to their
Raven scores: subjects with a score higher than the median were gathered in one
session, and the remaining subjects in the other. We will refer to the two sessions as
high-IQ and low-IQ sessions.34 The task they were asked to perform was to play an
induced infinitely repeated Prisoner’s Dilemma (PD) game. Participants played the
game used by DBF, who found convergence of full cooperation after the game was
repeated for a sufficient number of times in every repetition of the same experiment
(see DBF p. 419, figure 1, bottom right-hand diagram).
Following standard practice in the experimental literature, we induced an infin-
itely repeated game in the laboratory using a random continuation rule: after each
round the computer decided whether to finish the repeated game or to have an ad-
ditional round depending on the realization of a random number. The continuation
probability used in the high continuation probability treatment was δ = 0.75. The
stage game used was the PD game in table 1. The parameters used are identical
to the ones used by DBF. They argue that the payoffs and continuation probability
chosen (i.e. δ = 0.75) entail an infinitely repeated prisoner’s dilemma game where
the cooperation equilibrium is both subgame perfect and risk dominant.35 The low
continuation probability treatment that was administered was identical to what has
so far been explained with the only difference being that we used a lower continua-
tion probability. Specifically, we used δ = 0.5 which again according to DBF entails
an infinitely repeated prisoner’s dilemma game where the cooperation equilibrium
is both subgame perfect and risk dominant. Note that in their experiment, not all
repetitions resulted in convergence of full cooperation (see DBF p. 419, figure 1,
bottom middle diagram).
Within each session, participants were randomly and anonymously matched with
someone in the lab. They play as partners for as long as the random continuation
rule determines that the particular partnership is to continue. Once each match
was terminated, the subjects were again randomly and anonymously matched and
started playing the game again according to the respective continuation probabil-
ity for each of the treatments. Each decision round for the game was terminated
when every participant had made their decision. After all participants made their
34The attrition rate was small, and is documented in tables A.1 and A.2 for the high and lowcontinuation probability treatments respectively.
35The subgame perfect equilibrium set of subgame perfect equilibria are calculated as in Stahl(1991) and assuming risk neutrality. The risk dominant strategy is calculated using a simplifiedversion of the game assuming only two possible strategies following Blonski and Spagnolo (2015).See DBF, p. 415 for more details
A-8 EUGENIO PROTO, ALDO RUSTICHINI, AND ANDIS SOFIANOS
decisions, a screen appeared that reminded them of their own decision, indicated
their partner’s decision while also indicated the units they earned for that particular
round.
The payoffs in table 1 are in experimental units; the exchange rate applied to the
payoff table was 0.004 British pounds per unit. This exchange rate was calculated
in order to equalise the payoff matrix with the monetary units used in the DBF ex-
periment. The participants were paid the full sum of points they earned through all
the repetitions of the game. The first 4 sessions of the high continuation probability
treatment, were stopped once 30 minutes had passed and the last repeated game
was concluded. For the last 4 sessions, 45 minutes were allowed to pass instead.
The first 2 sessions of the low continuation probability treatment were stopped af-
ter 30 minutes had passed, while again the last 6 sessions of the low continuation
probability were longer as 45 minutes were allowed to pass.
The subjects in the high-IQ and low-IQ sessions played exactly the same game.
The only difference was the composition of each group, as for the high-IQ sessions
the subjects had higher Raven scores compared to those in the low-IQ sessions.
Upon completing the PD game, the participants were asked to respond to a short
questionnaire about any knowledge they had of the PD game. Additionally, in
sessions 5-8 of the high continuation probability treatment and sessions 4-8 of the
low continuation probability treatment, the subjects were asked questions about
their attitudes to cooperative behaviour and some strategy-eliciting questions.
Implementation. We conducted a total of 8 sessions for the high continuation prob-
ability treatment; four-high IQ and four low-IQ sessions. There were a total of 130
participants, with 66 in the high-IQ and 64 in the low-IQ sessions. The low contin-
uation probability treatment was conducted in 8 sessions with 110 subjects: 54 in
the high- and 56 in the low-IQ sessions.
The first two sessions of the high continuation probability treatment and first con-
tinuation probability of the low delta treatment contained some economics students.
The rest of the sessions did not. The recruitment ensured that the participants were
part of a wide variety of degree courses from across the university student popula-
tion which were evenly split across raven sessions.Some examples of the participants’
degree courses are: Accounting & Finance, Business, Film Studies, Physics, Psy-
chology (see tables A.8 and A.9 for the full list for high continuation probability
and low continuation probability treatments respectively). Overall, the participants
didn’t know each other and they were from many different courses hence meaning
they could not infer the abilities of others in their session before entry into the lab.
INTELLIGENCE AND PERSONALITY IN REPEATED INTERACTIONS A-9
The recruitment letter circulated is in the supplementary material. The dates of the
sessions and the number of participants per session, are presented in tables A.1 and
A.2.
As already noted at the beginning of this section, to allocate participants in the
two IQ sessions for Day Two they were first ranked according to their Raven score.
Subsequently, the participants were split into two groups. In cases where there
were participants with equal scores at the cutoff, two tie rules were used based on
whether they reported previous experience of the Raven task and high school grades.
Participants who had done the task before36 (and were tied with others who had
not) were allocated to the low-IQ session, while if there were still ties, participants
with higher high school grades were put in the high session.
Table A.15 summarises the statistics about the Raven scores for each session in
the high continuation probability treatment and table A.16 for the low continuation
probability treatment. In the high continuation probability treatment, for all but
sessions 3 and 4 the cutoff Raven score was 18. In sessions 3 and 4 the cutoff
was 16 because the participants in these sessions scored lower on average than the
rest of the participants in all the other sessions (mean Raven score for sessions 3
and 4: 15.69, while the mean Raven score for all sessions: 17.95). The top row of
figure A.1 presents the total distribution of the Raven scores and the distributions in
the separate IQ sessions for the high continuation probability sessions (tables A.22
and A.23 present a description of the main data in the low- and high-IQ sessions
respectively, and table A.35 shows the correlations among individual characteristics).
The second row of figure A.1 presents the total distribution of the Raven scores and
the distributions in the separate IQ sessions for the low continuation probability
sessions (tables A.24 and A.25 present a description of the main data in the low-
and high-IQ sessions respectively, and table A.36 shows the correlations among
individual characteristics).
Tables A.42 and A.43 show that the samples in the high- and low-IQ sessions
have similar characteristics for the high and low continuation probability treatments
respectively. Only the differences in Raven scores are statistically different at the
5 percent confidence level. Overall we can say that the subjects in the high- and
low-IQ sessions differ only in their intelligence. The two groups are similar in terms
36Specifically, participants were asked on whether they had completed a similar pattern game inthe past. Out of 130 participants in the high continuation probability treatment 60 stated previousexperience, while 67 out of the 110 participants in the low continuation probability treatment alsodid.
A-10 EUGENIO PROTO, ALDO RUSTICHINI, AND ANDIS SOFIANOS
of personality. In particular, there is no difference in the conscientiousness score.37
This lends support to the fact that motivation had a negligible effect on the Raven
scores, as is reasonable for subjects with higher than average cognitive ability. If this
were not true, subjects with low level of Conscientiousness would disproportionately
belong to the low-IQ sessions.38
A similar argument applies to the possibility that anxiety to perform well in
the Raven test might have affected the performance of some subjects; if this were
true more neurotic subjects should have performed worse.39 From tables A.42 and
A.43 we can observe that the average level of neuroticism in the two groups is not
statistically different.40
We also pay attention to the culture composition of the two raven groups across
the two treatments. To do this, we group countries using the ten societal clusters
identified by GLOBE.41 By looking at the bottom panel of table A.42 we can notice
that there is no statistical difference in the representation of the different culture
groupings across IQ groups. This should make it clear that any results could not
be driven by differences in culture across the IQ groups. Looking at the bottom
panel of table A.43 instead, we can notice that once again there are no significant
differences across the IQ groups other than for the grouping of Sub-Saharan Africa.
For this grouping though, we have very few instances in comparison to the whole
sample of the low continuation probability treatment (only 4 out of the total of 110
participants), hence making it very unlikely that these few observations could be
explaining any differences of behaviour across the IQ groups.
37This is true even when we consider a non parametric test. The Kolmogorov-Smirnov test forequality of distribution functions cannot reject the hypothesis that the distribution of Conscien-tiousness is the same in the two groups with a p− value = 0.985 for high continuation probabilityand a p− value = 0.751 for low continuation probability.
38Conscientiousness is usually defined as: “The degree to which a person is willing to comply withconventional rules, norms, and standards. The trait is usually measured by survey questions, someof them explicitly asking subjects to report reliability and care in work. The entire questionnaireis in the supplementary material.
39Neuroticism is associated with anxiety and fear of failing. Some of the statements contributingto the neuroticism score are: Is relaxed; handles stress well (R); Can be tense; Worries a lot; Remainscalm in tense situations (R); Gets nervous easily.
40The Kolmogorov-Smirnov test for equality of distribution functions cannot reject the hypoth-esis that the distribution of neuroticism is the same in the two groups with a p− value = 0.832 forhigh continuation probability and p− value = 0.473 for low continuation probability.
41GLOBE is the acronym for Global Leadership and Organizational Behavior Effectiveness. Thisis a cross-cultural research effort in understanding leadership worldwide. We borrow the societalclusters they identify to group our participants in cultural backgrounds.

INTELLIGENCE AND PERSONALITY IN REPEATED INTERACTIONS A-11
A detailed timeline of the experiment is presented further down this section of the
appendix and all the instructions and any other pertinent documents are available
online in the supplementary material.42
C.2. Battle of Sexes with Compromise (BoSC) IQ-split. This treatment was
identical to the high continuation probability PD IQ-split treatment with the only
difference being that the stage game that was played during the second day part
was the BoSC game (see table 2) instead of PD.
Implementation. We conducted a total of 8 sessions for the BoSC treatment with a
total of 104 participants. The dates of the sessions and the number of participants
per session, are presented in table A.6.43
Table A.20 summarises the statistics about the Raven scores for each session.
Figure A.3 presents the distribution of the raven scores (tables A.31 and A.32 present
a description of the main data in different separated sessions and table A.40 show
the correlations among individual characteristics).44
Table A.47 contrasts the main characteristics of the participants across high- and
low-IQ sessions. Overall, we can say that the two pairs of sessions are very similar
in all characteristics and have a very similar representation of the different culture
groupings as seen in the bottom panel of table A.47. The apparent significant
difference on the Conscientiousness trait is controlled for in the statistical analysis
of the data.
C.3. Battle of Sexes (BoS) & Stag-Hunt (SH) IQ-split. This treatment was
identical to the high continuation probability PD IQ-split treatment with the only
difference being that the stage games that was played during the second day part
were BoS (see table 3) and SH (see table 4) instead of PD. Because in this treatment
participants played two different games within the same time as other treatments
this meant they only played 30 minutes of each game. We reverse the order by which
the games were administered across sessions and we highlight which came first in
table A.7. The order of play had no effect on decisions.
Implementation. We conducted a total of 8 sessions for the BoS & SH treatment
with a total of 102 participants. Some of the sessions were ran at the University
of Minnesota, the dates of the sessions, the number of participants per session and
42See note 243See table A.13 for the full list of degree courses that the participants were under.44In the interest of completeness, when asked, 71 out of the 104 participants declared previous
experience with the pattern game.
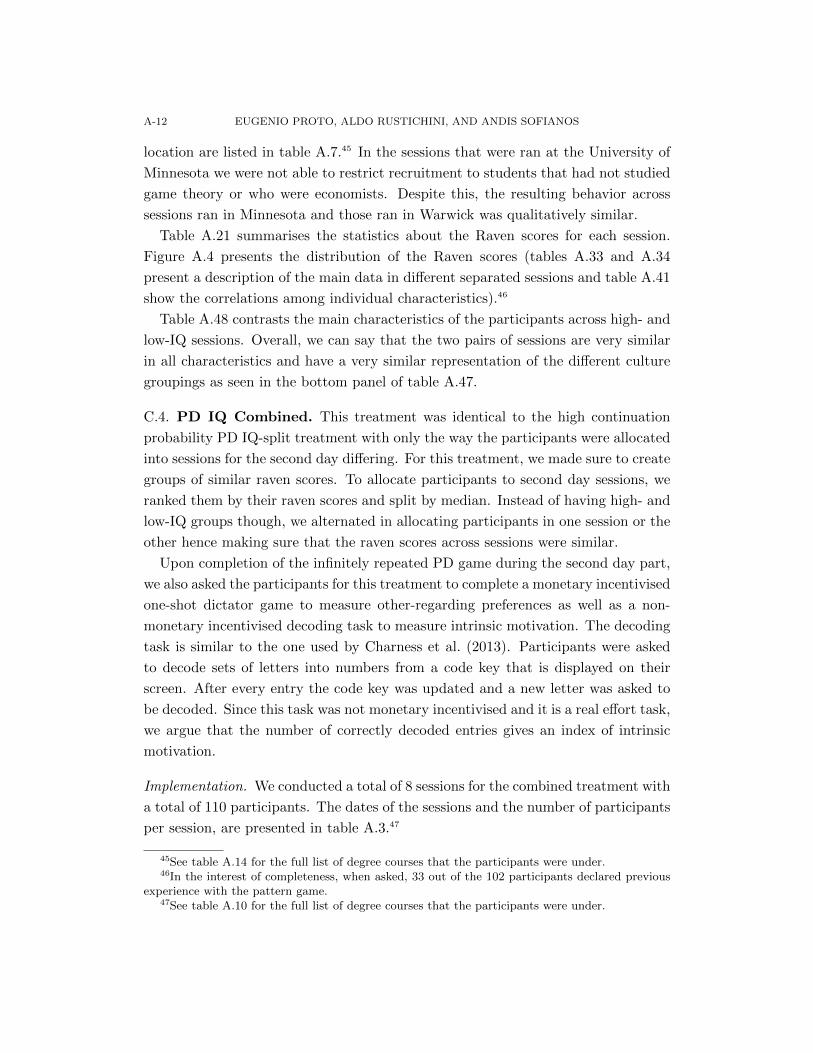
A-12 EUGENIO PROTO, ALDO RUSTICHINI, AND ANDIS SOFIANOS
location are listed in table A.7.45 In the sessions that were ran at the University of
Minnesota we were not able to restrict recruitment to students that had not studied
game theory or who were economists. Despite this, the resulting behavior across
sessions ran in Minnesota and those ran in Warwick was qualitatively similar.
Table A.21 summarises the statistics about the Raven scores for each session.
Figure A.4 presents the distribution of the Raven scores (tables A.33 and A.34
present a description of the main data in different separated sessions and table A.41
show the correlations among individual characteristics).46
Table A.48 contrasts the main characteristics of the participants across high- and
low-IQ sessions. Overall, we can say that the two pairs of sessions are very similar
in all characteristics and have a very similar representation of the different culture
groupings as seen in the bottom panel of table A.47.
C.4. PD IQ Combined. This treatment was identical to the high continuation
probability PD IQ-split treatment with only the way the participants were allocated
into sessions for the second day differing. For this treatment, we made sure to create
groups of similar raven scores. To allocate participants to second day sessions, we
ranked them by their raven scores and split by median. Instead of having high- and
low-IQ groups though, we alternated in allocating participants in one session or the
other hence making sure that the raven scores across sessions were similar.
Upon completion of the infinitely repeated PD game during the second day part,
we also asked the participants for this treatment to complete a monetary incentivised
one-shot dictator game to measure other-regarding preferences as well as a non-
monetary incentivised decoding task to measure intrinsic motivation. The decoding
task is similar to the one used by Charness et al. (2013). Participants were asked
to decode sets of letters into numbers from a code key that is displayed on their
screen. After every entry the code key was updated and a new letter was asked to
be decoded. Since this task was not monetary incentivised and it is a real effort task,
we argue that the number of correctly decoded entries gives an index of intrinsic
motivation.
Implementation. We conducted a total of 8 sessions for the combined treatment with
a total of 110 participants. The dates of the sessions and the number of participants
per session, are presented in table A.3.47
45See table A.14 for the full list of degree courses that the participants were under.46In the interest of completeness, when asked, 33 out of the 102 participants declared previous
experience with the pattern game.47See table A.10 for the full list of degree courses that the participants were under.

INTELLIGENCE AND PERSONALITY IN REPEATED INTERACTIONS A-13
Table A.17 summarises the statistics of the Raven scores for each session in the
combined treatment. The bottom row of figure A.1 presents the total distribution
of the Raven scores and the distributions in comparison across all odd numbered
and even numbered sessions for the combined treatment (table A.26 presents a de-
scription of the main data across the sessions, and table A.37 shows the correlations
among individual characteristics).
Table A.44 contrasts the main characteristics of the participants across odd and
even numbered sessions of the combined treatment. Overall, we can say that the
two pairs of sessions are very similar in all characteristics and have a very similar
representation of the different culture groupings as seen in the bottom panel of table
A.44.
C.5. PD A-split & C-split. The two personality split treatments were identical
in tasks and order as the high continuation probability PD IQ-split treatment. The
only difference was that the allocation to separate sessions for day two was done
according to personality traits rather than Raven scores. In order to obtain a more
precise measure of each of the two traits we separated sessions by (Agreeableness
and Conscientiousness) for each of the respective treatments we appended within
the personality questionnaire additional 24 questions for the trait in question that
we borrowed from Johnson (2014) 120-item IPIP NEO-PI-R.48
Implementation. We conducted a total of 8 sessions for each of the A-split and C-
split treatments with a total of 114 participants for the A-split sessions and 122
participants for the C-split sessions. The dates of the sessions and the number of
participants per session, are presented in table A.4 for the A-split treatment and in
table A.5 for the C-split treatment.49
To allocate participants to the different personality sessions we ranked them ac-
cording their long personality scores (i.e. using the longer question versions of each
trait score - as measured by the appended 24 questions (see above)). In cases where
there were ties we allocated participants according the shorter type personality
scores of the respective trait that was being treated. Table A.18 summarises the
statistics about the Agreeableness scores for each session of the A-split treatment
and table A.19 summarises the statistics about the Conscientiousness scores for each
48These additional questions were scattered around the personality questionnaire we originallyhad administered and is described in the section explaining the high and low continuation proba-bility PD IQ-split treatments.
49See tables A.11 and A.12 for the full list of degree courses that the participants were under.
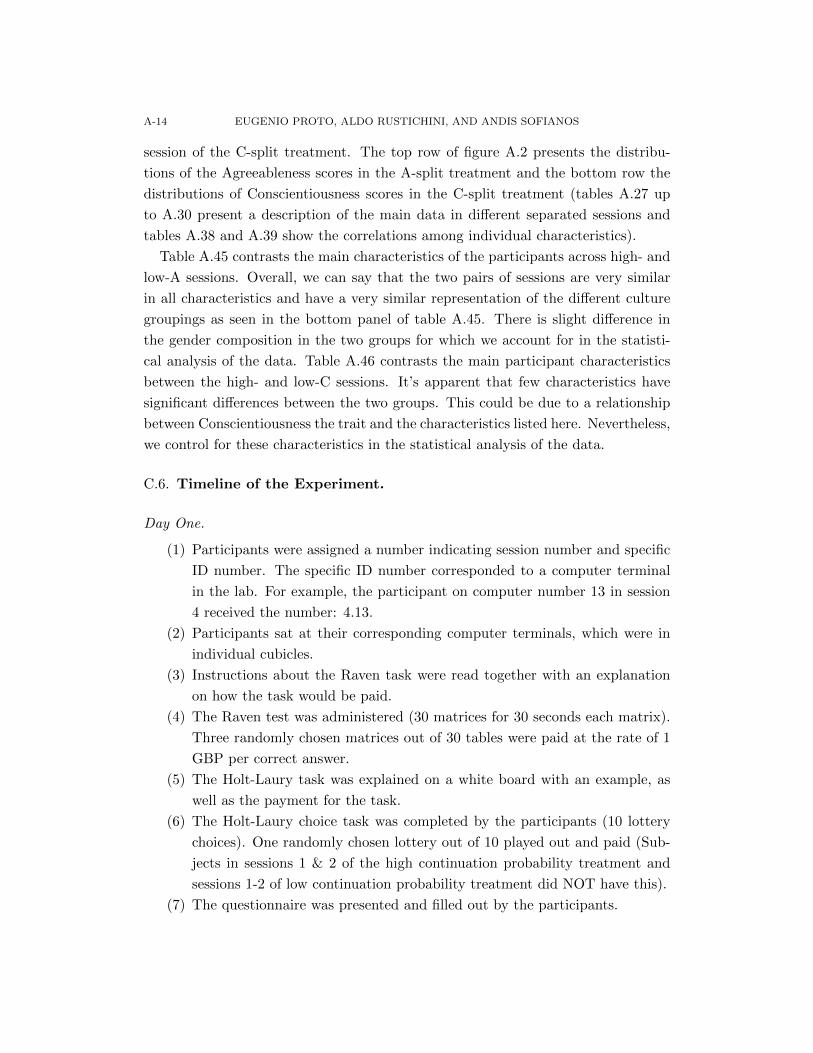
A-14 EUGENIO PROTO, ALDO RUSTICHINI, AND ANDIS SOFIANOS
session of the C-split treatment. The top row of figure A.2 presents the distribu-
tions of the Agreeableness scores in the A-split treatment and the bottom row the
distributions of Conscientiousness scores in the C-split treatment (tables A.27 up
to A.30 present a description of the main data in different separated sessions and
tables A.38 and A.39 show the correlations among individual characteristics).
Table A.45 contrasts the main characteristics of the participants across high- and
low-A sessions. Overall, we can say that the two pairs of sessions are very similar
in all characteristics and have a very similar representation of the different culture
groupings as seen in the bottom panel of table A.45. There is slight difference in
the gender composition in the two groups for which we account for in the statisti-
cal analysis of the data. Table A.46 contrasts the main participant characteristics
between the high- and low-C sessions. It’s apparent that few characteristics have
significant differences between the two groups. This could be due to a relationship
between Conscientiousness the trait and the characteristics listed here. Nevertheless,
we control for these characteristics in the statistical analysis of the data.
C.6. Timeline of the Experiment.
Day One.
(1) Participants were assigned a number indicating session number and specific
ID number. The specific ID number corresponded to a computer terminal
in the lab. For example, the participant on computer number 13 in session
4 received the number: 4.13.
(2) Participants sat at their corresponding computer terminals, which were in
individual cubicles.
(3) Instructions about the Raven task were read together with an explanation
on how the task would be paid.
(4) The Raven test was administered (30 matrices for 30 seconds each matrix).
Three randomly chosen matrices out of 30 tables were paid at the rate of 1
GBP per correct answer.
(5) The Holt-Laury task was explained on a white board with an example, as
well as the payment for the task.
(6) The Holt-Laury choice task was completed by the participants (10 lottery
choices). One randomly chosen lottery out of 10 played out and paid (Sub-
jects in sessions 1 & 2 of the high continuation probability treatment and
sessions 1-2 of low continuation probability treatment did NOT have this).
(7) The questionnaire was presented and filled out by the participants.

INTELLIGENCE AND PERSONALITY IN REPEATED INTERACTIONS A-15
Between Day One and Two.
(1) Allocation to high and low groups made. An email was sent out to all
participants listing their allocation according to the number they received
before starting Day One.
Day Two.
(1) Participants arrived and were given a new ID corresponding to the ID they
received in Day One. The new ID indicated their new computer terminal
number at which they were sat.
(2) The game that would be played was explained on a white-board (in the
Minnesota sessions no white-board was available so the game was explained
by using examples on the participants’ screens), as was the way the matching
between partners, the continuation probability and how the payment would
be made.
(3) The infinitely repeated game was played. Each experimental unit earned
corresponded to 0.004 GBP.
(4) In the combined treatment participants completed a decoding task and a
one-shot dictator game.
(5) A de-briefing questionnaire was administered.
(6) Calculation of payment was made and subjects were paid accordingly.
C.7. Dates and Details. Tables A.1 up to A.7 below illustrate the dates and
timings of each session across all treatments. In the top panels the total number
of subjects that participated in Day 1 of the experiment is listed and by comparing
with the corresponding ’Total Returned’ column from the bottom panels it becomes
apparent that there is relatively small attrition between Day 1 and Day 2. For
example, for the high delta treatment, only 10 subjects out of 140 did not return on
Day 2.
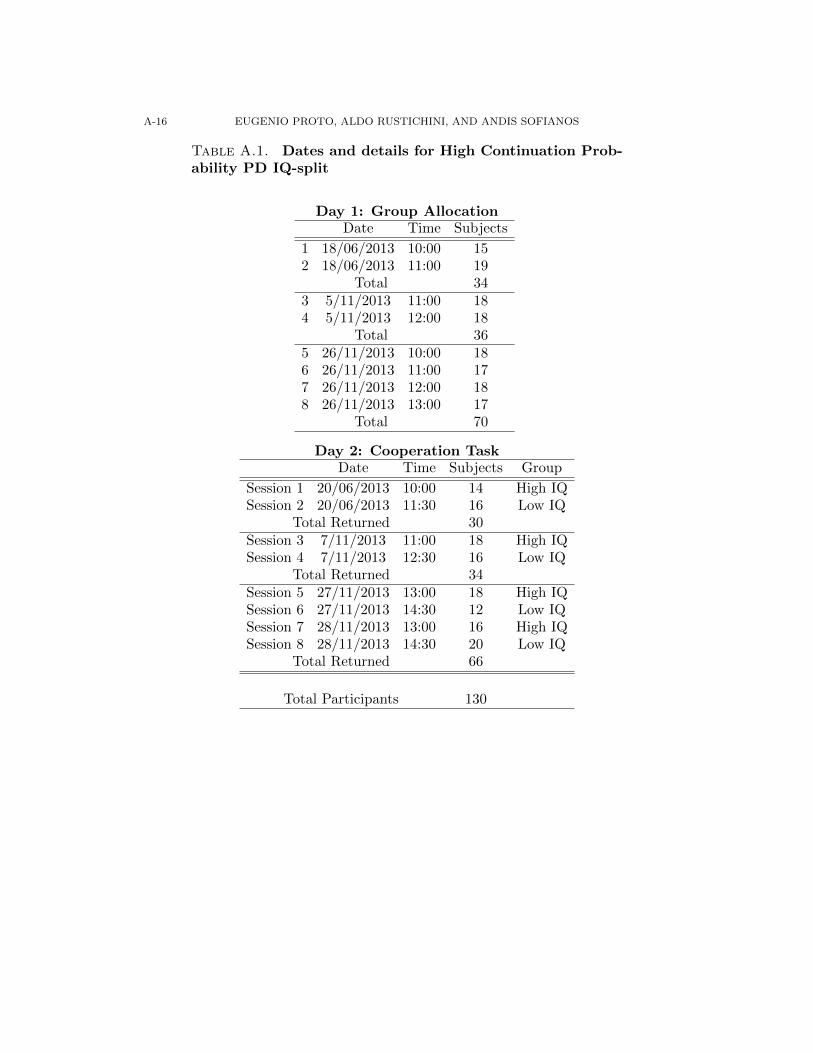
A-16 EUGENIO PROTO, ALDO RUSTICHINI, AND ANDIS SOFIANOS
Table A.1. Dates and details for High Continuation Prob-ability PD IQ-split
Day 1: Group AllocationDate Time Subjects
1 18/06/2013 10:00 152 18/06/2013 11:00 19
Total 343 5/11/2013 11:00 184 5/11/2013 12:00 18
Total 365 26/11/2013 10:00 186 26/11/2013 11:00 177 26/11/2013 12:00 188 26/11/2013 13:00 17
Total 70
Day 2: Cooperation TaskDate Time Subjects Group
Session 1 20/06/2013 10:00 14 High IQSession 2 20/06/2013 11:30 16 Low IQ
Total Returned 30Session 3 7/11/2013 11:00 18 High IQSession 4 7/11/2013 12:30 16 Low IQ
Total Returned 34Session 5 27/11/2013 13:00 18 High IQSession 6 27/11/2013 14:30 12 Low IQSession 7 28/11/2013 13:00 16 High IQSession 8 28/11/2013 14:30 20 Low IQ
Total Returned 66
Total Participants 130

INTELLIGENCE AND PERSONALITY IN REPEATED INTERACTIONS A-17
Table A.2. Dates and details for Low Continuation Proba-bility PD IQ-split
Day 1: Group AllocationDate Time Subjects
1 11/06/2013 12:00 192 11/06/2013 13:00 14
Total 333 25/11/2014 10:00 204 25/11/2014 11:00 16
Total 365 23/02/2016 10:00 176 23/02/2016 11:00 16
Total 337 03/05/2016 12:00 138 03/05/2016 14:00 99 04/05/2016 13:00 7
Total 29
Day 2: Cooperation TaskDate Time Subjects Group
Session 1 13/06/2013 13:00 16 High IQSession 2 13/06/2013 14:30 14 Low IQ
Total Returned 30Session 3 27/11/2014 10:00 14 High IQSession 4 27/11/2014 11:30 14 Low IQ
Total Returned 28Session 5 25/02/2016 10:00 14 High IQSession 6 25/02/2016 11:30 14 Low IQ
Total Returned 28Session 7 5/05/2016 10:00 10 High IQSession 8 5/05/2016 11:30 14 Low IQ
Total Returned 24
Total Participants 110

A-18 EUGENIO PROTO, ALDO RUSTICHINI, AND ANDIS SOFIANOS
Table A.3. Dates and details for PD Combined
Day 1: Group AllocationDate Time Subjects
1 29/02/2016 10:00 112 29/02/2016 11:30 13
Total 243 1/03/2016 10:00 44 1/03/2016 11:30 105 1/03/2016 16:00 10
Total 246 9/05/2016 10:00 57 9/05/2016 11:30 138 9/05/2016 16:00 3
Total 219 18/05/2016 14:00 1110 18/05/2016 15:00 311 18/05/2016 16:00 5
Total 1912 31/05/2016 10:00 313 31/05/2016 11:30 12
Total 1514 13/06/2016 15:00 1115 13/06/2016 16:30 7
Total 18
Day 2: Cooperation TaskDate Time Subjects
Session 1 2/03/2016 14:00 10Session 2 2/03/2016 15:30 12
Total Returned 22Session 3 3/03/2016 10:00 12Session 4 3/03/2016 11:45 12
Total Returned 24Session 5 11/05/2016 14:00 16
Total Returned 16Session 6 20/05/2016 10:00 16
Total Returned 16Session 7 2/06/2016 11:45 16
Total Returned 16Session 8 15/06/2016 11:45 16
Total Returned 16
Total Participants 110
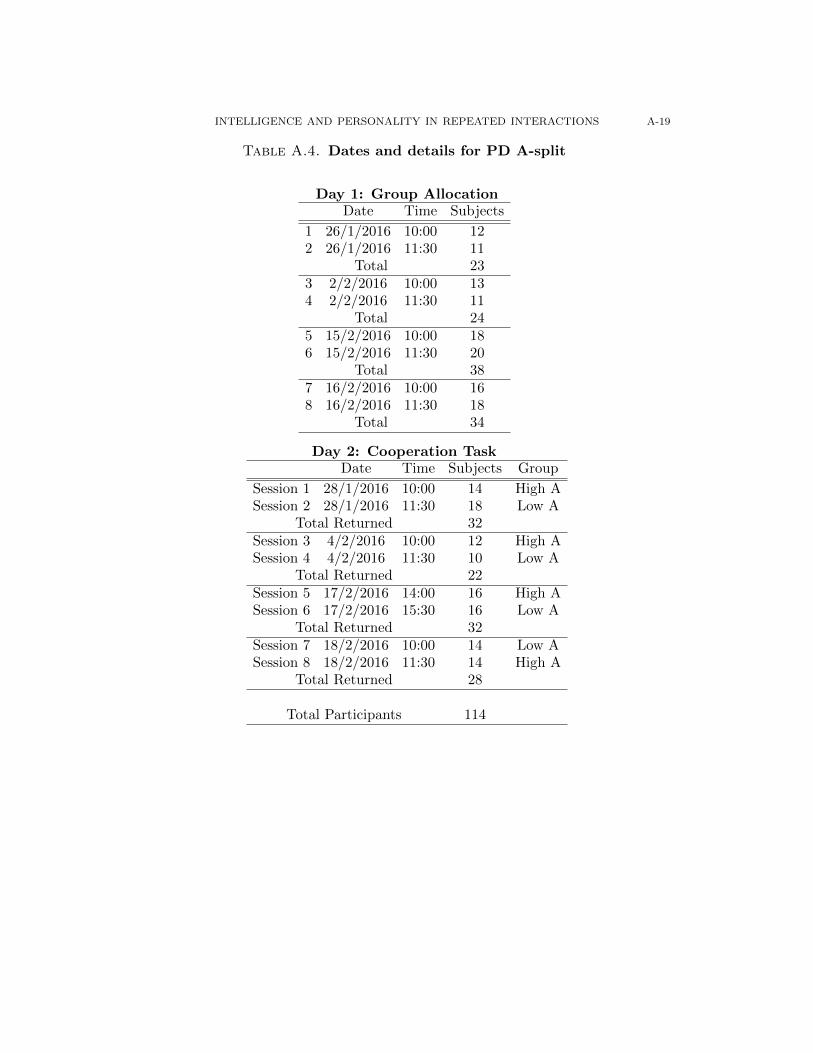
INTELLIGENCE AND PERSONALITY IN REPEATED INTERACTIONS A-19
Table A.4. Dates and details for PD A-split
Day 1: Group AllocationDate Time Subjects
1 26/1/2016 10:00 122 26/1/2016 11:30 11
Total 233 2/2/2016 10:00 134 2/2/2016 11:30 11
Total 245 15/2/2016 10:00 186 15/2/2016 11:30 20
Total 387 16/2/2016 10:00 168 16/2/2016 11:30 18
Total 34
Day 2: Cooperation TaskDate Time Subjects Group
Session 1 28/1/2016 10:00 14 High ASession 2 28/1/2016 11:30 18 Low A
Total Returned 32Session 3 4/2/2016 10:00 12 High ASession 4 4/2/2016 11:30 10 Low A
Total Returned 22Session 5 17/2/2016 14:00 16 High ASession 6 17/2/2016 15:30 16 Low A
Total Returned 32Session 7 18/2/2016 10:00 14 Low ASession 8 18/2/2016 11:30 14 High A
Total Returned 28
Total Participants 114
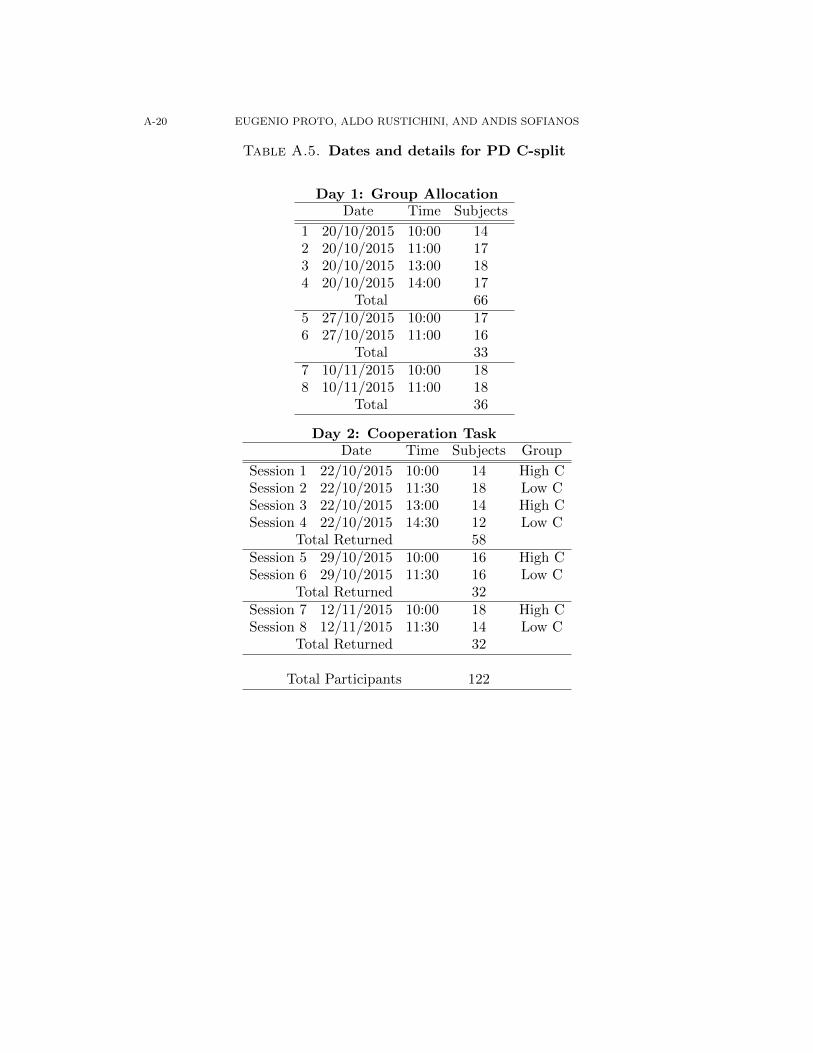
A-20 EUGENIO PROTO, ALDO RUSTICHINI, AND ANDIS SOFIANOS
Table A.5. Dates and details for PD C-split
Day 1: Group AllocationDate Time Subjects
1 20/10/2015 10:00 142 20/10/2015 11:00 173 20/10/2015 13:00 184 20/10/2015 14:00 17
Total 665 27/10/2015 10:00 176 27/10/2015 11:00 16
Total 337 10/11/2015 10:00 188 10/11/2015 11:00 18
Total 36
Day 2: Cooperation TaskDate Time Subjects Group
Session 1 22/10/2015 10:00 14 High CSession 2 22/10/2015 11:30 18 Low CSession 3 22/10/2015 13:00 14 High CSession 4 22/10/2015 14:30 12 Low C
Total Returned 58Session 5 29/10/2015 10:00 16 High CSession 6 29/10/2015 11:30 16 Low C
Total Returned 32Session 7 12/11/2015 10:00 18 High CSession 8 12/11/2015 11:30 14 Low C
Total Returned 32
Total Participants 122

INTELLIGENCE AND PERSONALITY IN REPEATED INTERACTIONS A-21
Table A.6. Dates and details for BoSC IQ-split
Day 1: Group AllocationDate Time Subjects
1 23/11/2015 10:00 142 23/11/2015 11:30 19
Total 333 30/11/2015 10:00 114 30/11/2015 11:30 135 30/11/2015 14:00 166 30/11/2015 15:30 15
Total 557 18/1/2016 10:00 148 18/1/2016 11:30 12
Total 26
Day 2: Cooperation TaskDate Time Subjects Group
Session 1 25/11/2015 14:00 14 High IQSession 2 25/11/2015 15:45 14 Low IQ
Total Returned 28Session 3 2/12/2015 10:00 12 High IQSession 4 2/12/2015 11:45 14 Low IQSession 5 2/12/2015 14:00 14 High IQSession 6 2/12/2015 11:45 12 Low IQ
Total Returned 52Session 7 20/1/2016 14:00 12 High IQSession 8 20/1/2016 15:45 12 Low IQ
Total Returned 24
Total Participants 104
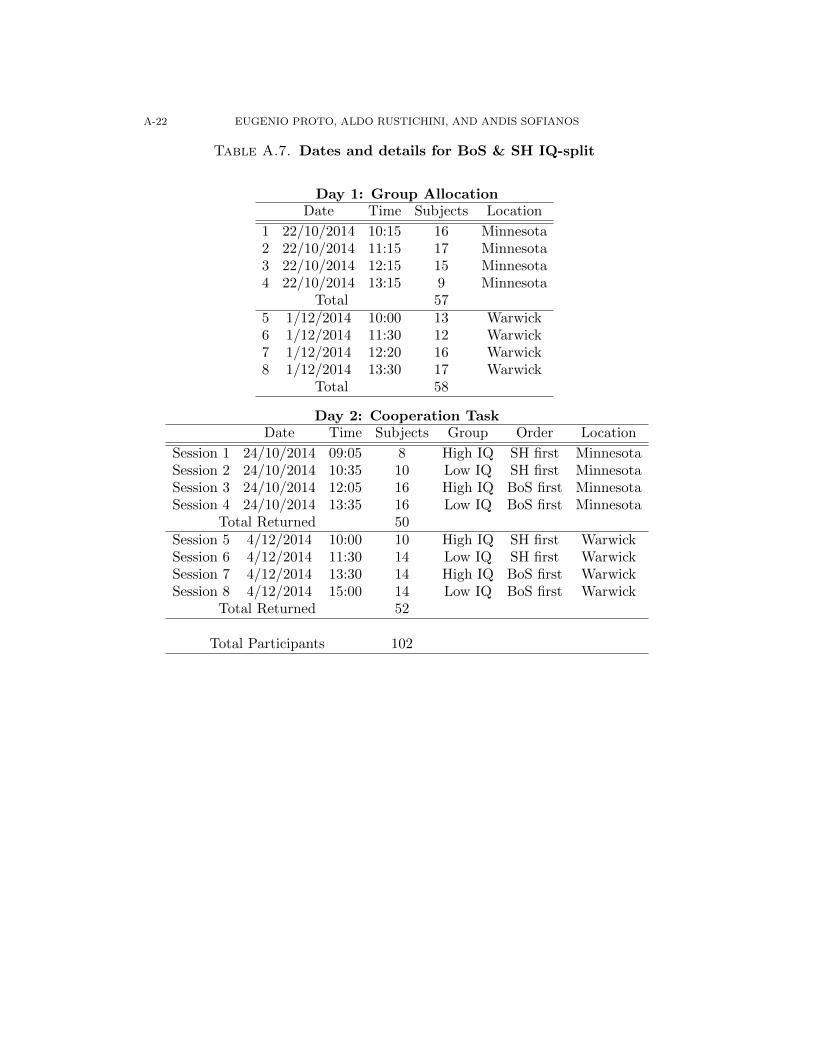
A-22 EUGENIO PROTO, ALDO RUSTICHINI, AND ANDIS SOFIANOS
Table A.7. Dates and details for BoS & SH IQ-split
Day 1: Group AllocationDate Time Subjects Location
1 22/10/2014 10:15 16 Minnesota2 22/10/2014 11:15 17 Minnesota3 22/10/2014 12:15 15 Minnesota4 22/10/2014 13:15 9 Minnesota
Total 575 1/12/2014 10:00 13 Warwick6 1/12/2014 11:30 12 Warwick7 1/12/2014 12:20 16 Warwick8 1/12/2014 13:30 17 Warwick
Total 58
Day 2: Cooperation TaskDate Time Subjects Group Order Location
Session 1 24/10/2014 09:05 8 High IQ SH first MinnesotaSession 2 24/10/2014 10:35 10 Low IQ SH first MinnesotaSession 3 24/10/2014 12:05 16 High IQ BoS first MinnesotaSession 4 24/10/2014 13:35 16 Low IQ BoS first Minnesota
Total Returned 50Session 5 4/12/2014 10:00 10 High IQ SH first WarwickSession 6 4/12/2014 11:30 14 Low IQ SH first WarwickSession 7 4/12/2014 13:30 14 High IQ BoS first WarwickSession 8 4/12/2014 15:00 14 Low IQ BoS first Warwick
Total Returned 52
Total Participants 102
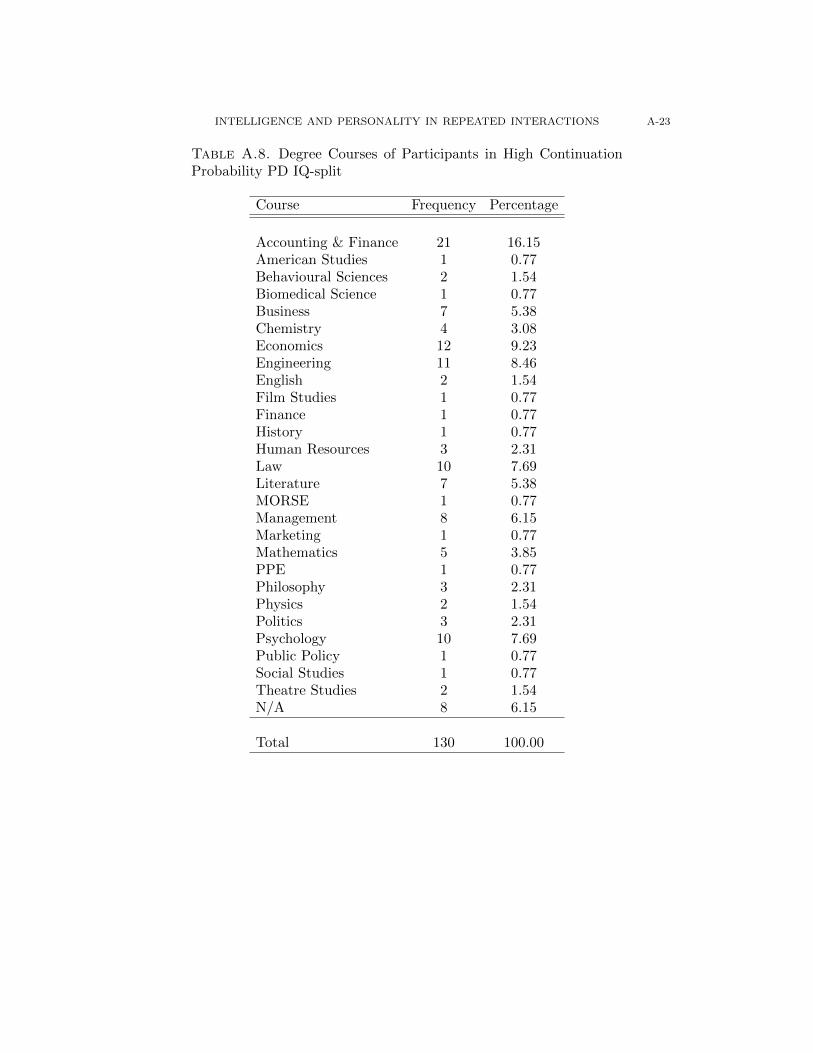
INTELLIGENCE AND PERSONALITY IN REPEATED INTERACTIONS A-23
Table A.8. Degree Courses of Participants in High ContinuationProbability PD IQ-split
Course Frequency Percentage
Accounting & Finance 21 16.15American Studies 1 0.77Behavioural Sciences 2 1.54Biomedical Science 1 0.77Business 7 5.38Chemistry 4 3.08Economics 12 9.23Engineering 11 8.46English 2 1.54Film Studies 1 0.77Finance 1 0.77History 1 0.77Human Resources 3 2.31Law 10 7.69Literature 7 5.38MORSE 1 0.77Management 8 6.15Marketing 1 0.77Mathematics 5 3.85PPE 1 0.77Philosophy 3 2.31Physics 2 1.54Politics 3 2.31Psychology 10 7.69Public Policy 1 0.77Social Studies 1 0.77Theatre Studies 2 1.54N/A 8 6.15
Total 130 100.00
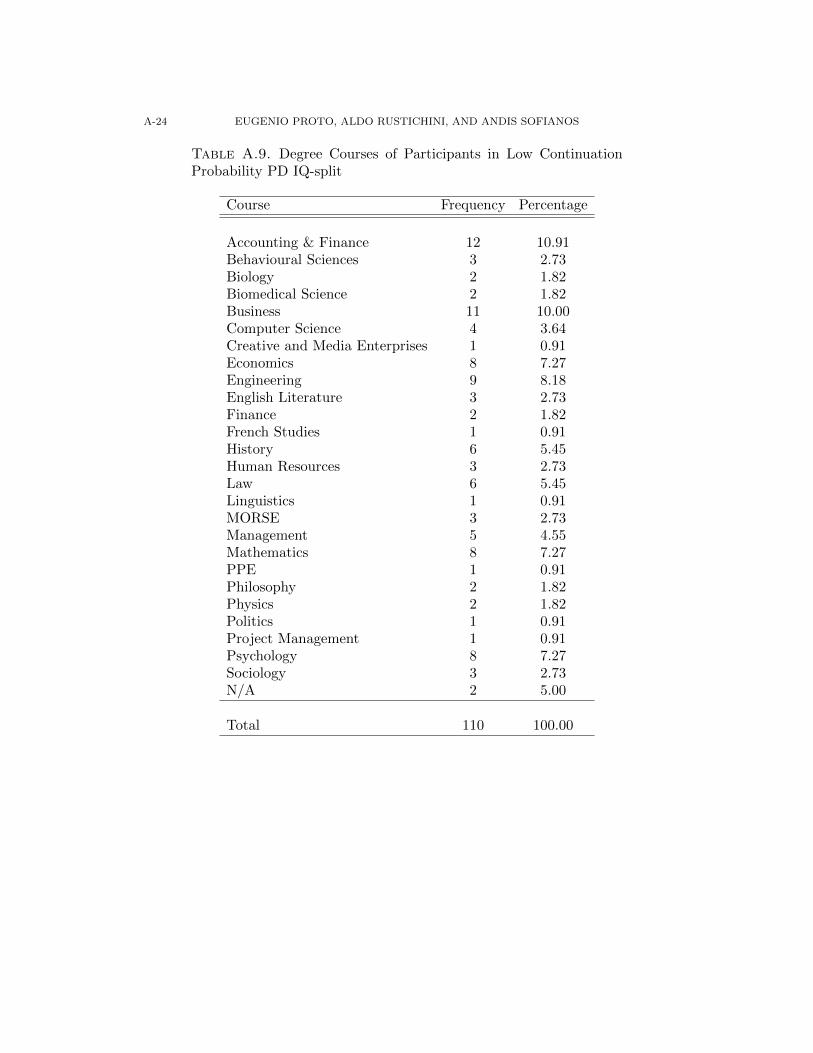
A-24 EUGENIO PROTO, ALDO RUSTICHINI, AND ANDIS SOFIANOS
Table A.9. Degree Courses of Participants in Low ContinuationProbability PD IQ-split
Course Frequency Percentage
Accounting & Finance 12 10.91Behavioural Sciences 3 2.73Biology 2 1.82Biomedical Science 2 1.82Business 11 10.00Computer Science 4 3.64Creative and Media Enterprises 1 0.91Economics 8 7.27Engineering 9 8.18English Literature 3 2.73Finance 2 1.82French Studies 1 0.91History 6 5.45Human Resources 3 2.73Law 6 5.45Linguistics 1 0.91MORSE 3 2.73Management 5 4.55Mathematics 8 7.27PPE 1 0.91Philosophy 2 1.82Physics 2 1.82Politics 1 0.91Project Management 1 0.91Psychology 8 7.27Sociology 3 2.73N/A 2 5.00
Total 110 100.00
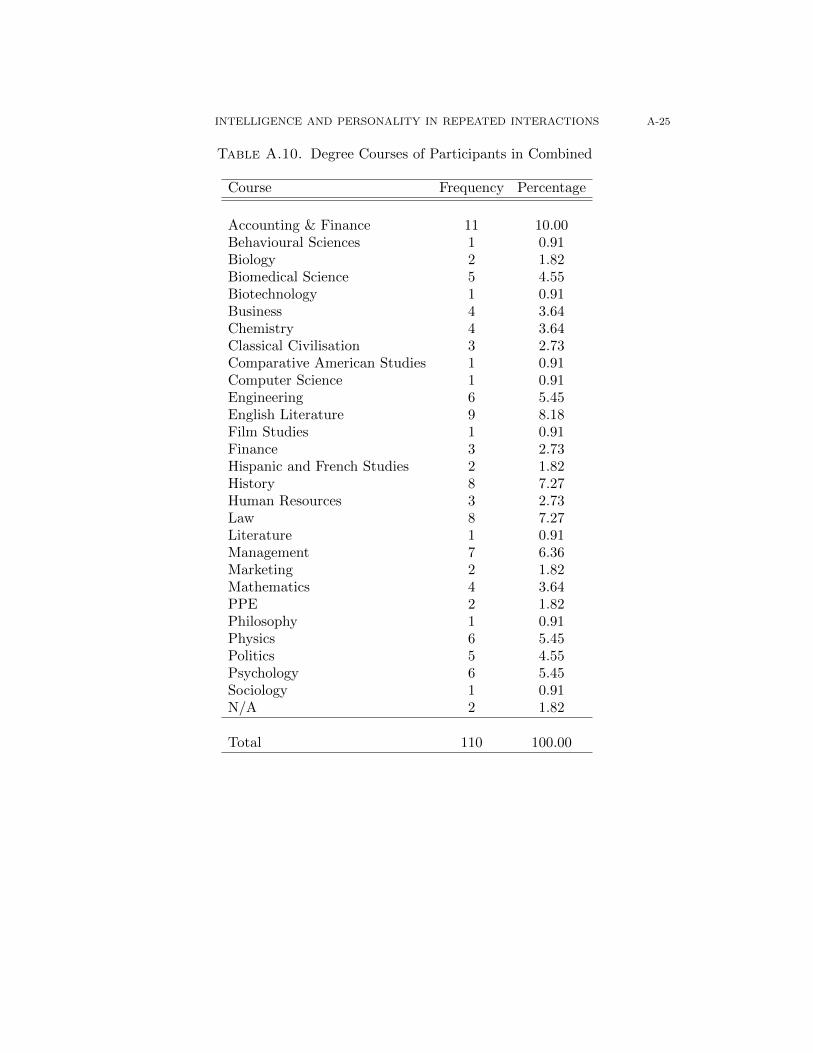
INTELLIGENCE AND PERSONALITY IN REPEATED INTERACTIONS A-25
Table A.10. Degree Courses of Participants in Combined
Course Frequency Percentage
Accounting & Finance 11 10.00Behavioural Sciences 1 0.91Biology 2 1.82Biomedical Science 5 4.55Biotechnology 1 0.91Business 4 3.64Chemistry 4 3.64Classical Civilisation 3 2.73Comparative American Studies 1 0.91Computer Science 1 0.91Engineering 6 5.45English Literature 9 8.18Film Studies 1 0.91Finance 3 2.73Hispanic and French Studies 2 1.82History 8 7.27Human Resources 3 2.73Law 8 7.27Literature 1 0.91Management 7 6.36Marketing 2 1.82Mathematics 4 3.64PPE 2 1.82Philosophy 1 0.91Physics 6 5.45Politics 5 4.55Psychology 6 5.45Sociology 1 0.91N/A 2 1.82
Total 110 100.00
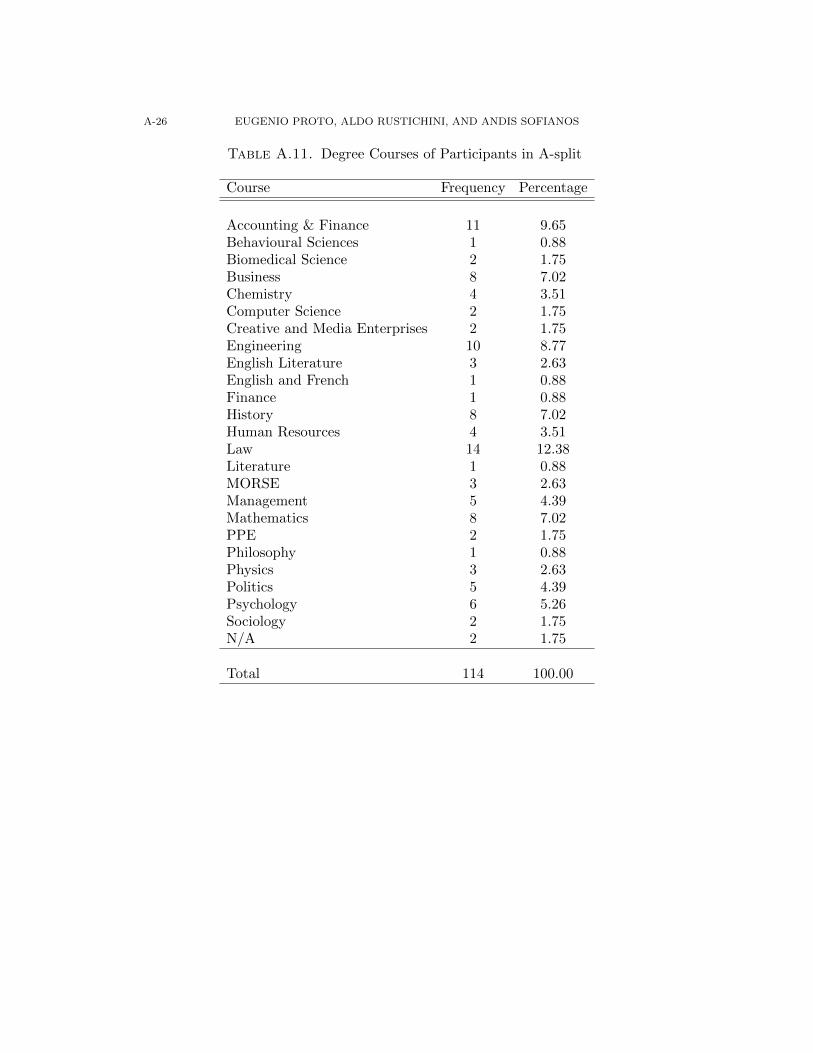
A-26 EUGENIO PROTO, ALDO RUSTICHINI, AND ANDIS SOFIANOS
Table A.11. Degree Courses of Participants in A-split
Course Frequency Percentage
Accounting & Finance 11 9.65Behavioural Sciences 1 0.88Biomedical Science 2 1.75Business 8 7.02Chemistry 4 3.51Computer Science 2 1.75Creative and Media Enterprises 2 1.75Engineering 10 8.77English Literature 3 2.63English and French 1 0.88Finance 1 0.88History 8 7.02Human Resources 4 3.51Law 14 12.38Literature 1 0.88MORSE 3 2.63Management 5 4.39Mathematics 8 7.02PPE 2 1.75Philosophy 1 0.88Physics 3 2.63Politics 5 4.39Psychology 6 5.26Sociology 2 1.75N/A 2 1.75
Total 114 100.00

INTELLIGENCE AND PERSONALITY IN REPEATED INTERACTIONS A-27
Table A.12. Degree Courses of Participants in C-split
Course Frequency Percentage
Accounting & Finance 44 36.07Behavioural Sciences 4 3.28Computer Science 2 1.64Engineering 6 4.92French Studies 2 1.64History 2 1.64Law 22 18.03MORSE 4 3.28Management 10 8.20Mathematics 2 1.64Medicine 1 0.82PPE 1 0.82Philosophy 1 0.82Physics 1 0.82Psychology 6 4.92Sociology 1 0.82Statistics 1 0.82Urban Analytics and Informatics 1 0.82N/A 7 5.74
Total 122 100.00

A-28 EUGENIO PROTO, ALDO RUSTICHINI, AND ANDIS SOFIANOS
Table A.13. Degree Courses of Participants in BoSC IQ-split
Course Frequency Percentage
Accounting & Finance 16 15.38Behavioural Sciences 1 0.96Biochemistry 3 2.88Business 3 2.88CAS 1 0.96Chemistry 1 0.96Comparative American Studies 3 2.88Computer Science 1 0.96Creative Writing 1 0.96Engineering 3 2.88English Language Teaching 1 0.96English Literature 2 1.92English and French 2 1.92Finance 2 1.92French 2 1.92Global Media and Communication 1 0.96History 2 1.92ISMI 1 0.96Law 15 14.42MORSE 3 2.88Management 6 5.77Mathematics 7 6.73Modern Languages 3 2.88PPE 5 4.81Physics 3 2.88Policy 1 0.96Politics 2 1.92Psychology 9 8.65N/A 4 3.85
Total 104 100.00
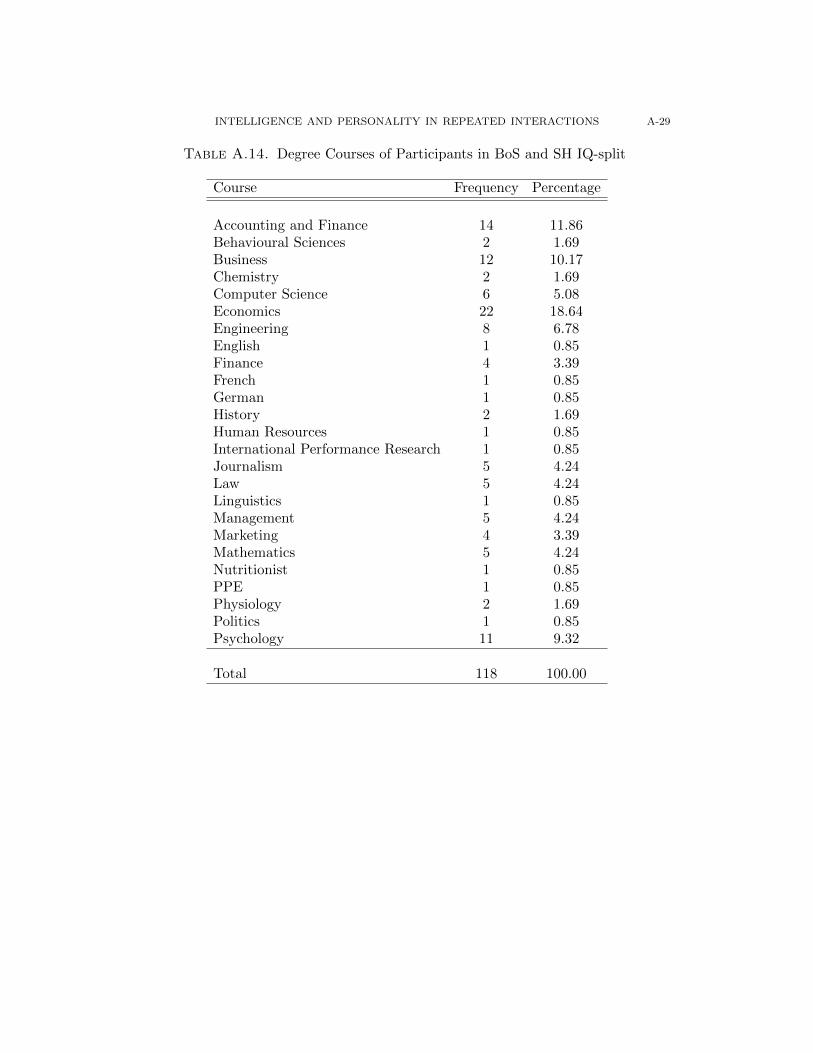
INTELLIGENCE AND PERSONALITY IN REPEATED INTERACTIONS A-29
Table A.14. Degree Courses of Participants in BoS and SH IQ-split
Course Frequency Percentage
Accounting and Finance 14 11.86Behavioural Sciences 2 1.69Business 12 10.17Chemistry 2 1.69Computer Science 6 5.08Economics 22 18.64Engineering 8 6.78English 1 0.85Finance 4 3.39French 1 0.85German 1 0.85History 2 1.69Human Resources 1 0.85International Performance Research 1 0.85Journalism 5 4.24Law 5 4.24Linguistics 1 0.85Management 5 4.24Marketing 4 3.39Mathematics 5 4.24Nutritionist 1 0.85PPE 1 0.85Physiology 2 1.69Politics 1 0.85Psychology 11 9.32
Total 118 100.00
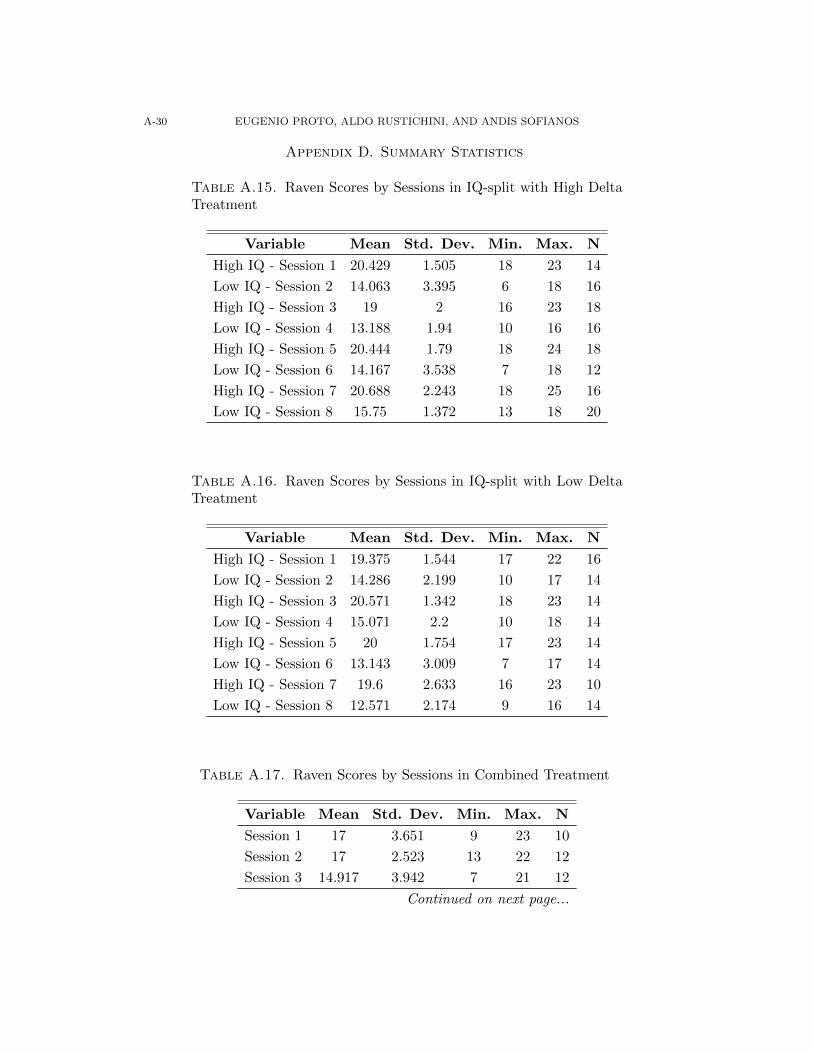
A-30 EUGENIO PROTO, ALDO RUSTICHINI, AND ANDIS SOFIANOS
Appendix D. Summary Statistics
Table A.15. Raven Scores by Sessions in IQ-split with High DeltaTreatment
Variable Mean Std. Dev. Min. Max. N
High IQ - Session 1 20.429 1.505 18 23 14
Low IQ - Session 2 14.063 3.395 6 18 16
High IQ - Session 3 19 2 16 23 18
Low IQ - Session 4 13.188 1.94 10 16 16
High IQ - Session 5 20.444 1.79 18 24 18
Low IQ - Session 6 14.167 3.538 7 18 12
High IQ - Session 7 20.688 2.243 18 25 16
Low IQ - Session 8 15.75 1.372 13 18 20
Table A.16. Raven Scores by Sessions in IQ-split with Low DeltaTreatment
Variable Mean Std. Dev. Min. Max. N
High IQ - Session 1 19.375 1.544 17 22 16
Low IQ - Session 2 14.286 2.199 10 17 14
High IQ - Session 3 20.571 1.342 18 23 14
Low IQ - Session 4 15.071 2.2 10 18 14
High IQ - Session 5 20 1.754 17 23 14
Low IQ - Session 6 13.143 3.009 7 17 14
High IQ - Session 7 19.6 2.633 16 23 10
Low IQ - Session 8 12.571 2.174 9 16 14
Table A.17. Raven Scores by Sessions in Combined Treatment
Variable Mean Std. Dev. Min. Max. N
Session 1 17 3.651 9 23 10
Session 2 17 2.523 13 22 12
Session 3 14.917 3.942 7 21 12
Continued on next page...
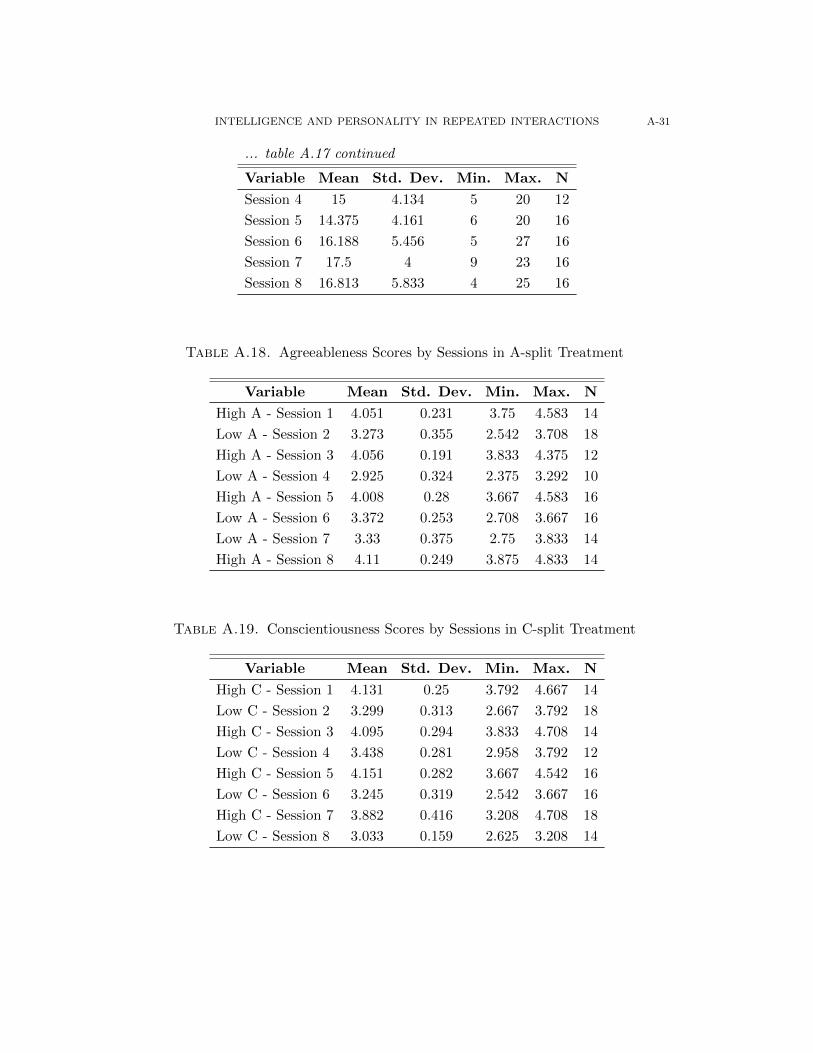
INTELLIGENCE AND PERSONALITY IN REPEATED INTERACTIONS A-31
... table A.17 continued
Variable Mean Std. Dev. Min. Max. N
Session 4 15 4.134 5 20 12
Session 5 14.375 4.161 6 20 16
Session 6 16.188 5.456 5 27 16
Session 7 17.5 4 9 23 16
Session 8 16.813 5.833 4 25 16
Table A.18. Agreeableness Scores by Sessions in A-split Treatment
Variable Mean Std. Dev. Min. Max. N
High A - Session 1 4.051 0.231 3.75 4.583 14
Low A - Session 2 3.273 0.355 2.542 3.708 18
High A - Session 3 4.056 0.191 3.833 4.375 12
Low A - Session 4 2.925 0.324 2.375 3.292 10
High A - Session 5 4.008 0.28 3.667 4.583 16
Low A - Session 6 3.372 0.253 2.708 3.667 16
Low A - Session 7 3.33 0.375 2.75 3.833 14
High A - Session 8 4.11 0.249 3.875 4.833 14
Table A.19. Conscientiousness Scores by Sessions in C-split Treatment
Variable Mean Std. Dev. Min. Max. N
High C - Session 1 4.131 0.25 3.792 4.667 14
Low C - Session 2 3.299 0.313 2.667 3.792 18
High C - Session 3 4.095 0.294 3.833 4.708 14
Low C - Session 4 3.438 0.281 2.958 3.792 12
High C - Session 5 4.151 0.282 3.667 4.542 16
Low C - Session 6 3.245 0.319 2.542 3.667 16
High C - Session 7 3.882 0.416 3.208 4.708 18
Low C - Session 8 3.033 0.159 2.625 3.208 14
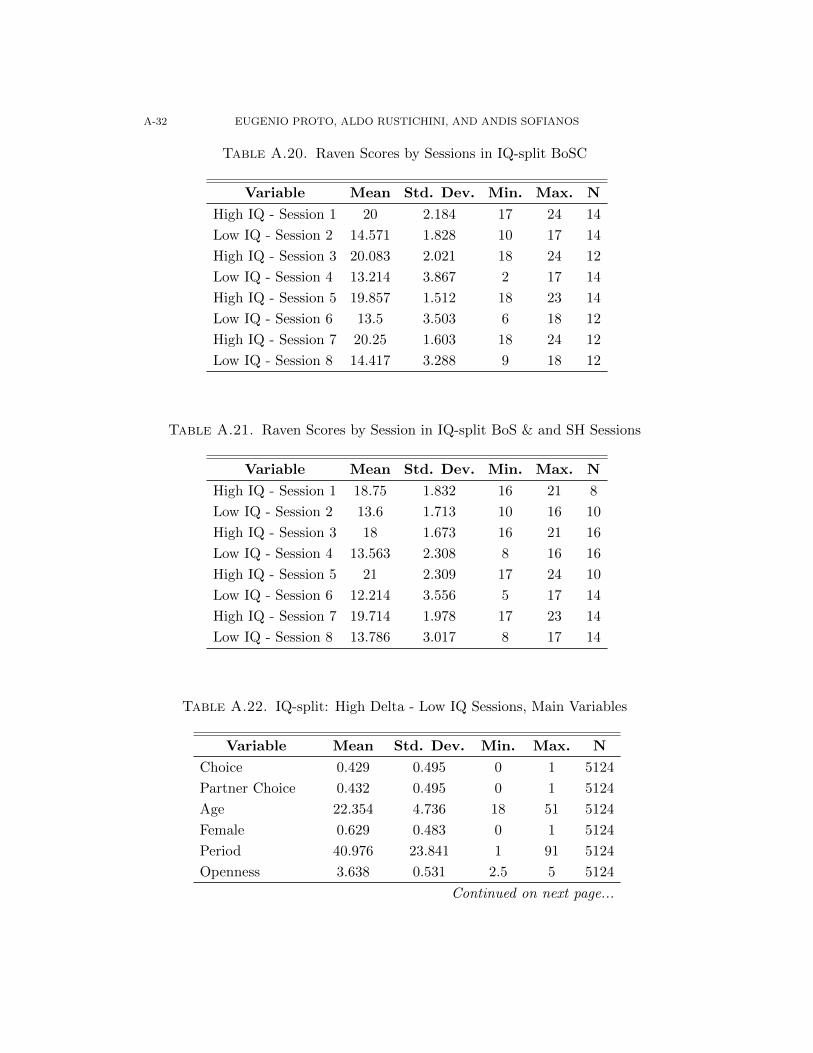
A-32 EUGENIO PROTO, ALDO RUSTICHINI, AND ANDIS SOFIANOS
Table A.20. Raven Scores by Sessions in IQ-split BoSC
Variable Mean Std. Dev. Min. Max. N
High IQ - Session 1 20 2.184 17 24 14
Low IQ - Session 2 14.571 1.828 10 17 14
High IQ - Session 3 20.083 2.021 18 24 12
Low IQ - Session 4 13.214 3.867 2 17 14
High IQ - Session 5 19.857 1.512 18 23 14
Low IQ - Session 6 13.5 3.503 6 18 12
High IQ - Session 7 20.25 1.603 18 24 12
Low IQ - Session 8 14.417 3.288 9 18 12
Table A.21. Raven Scores by Session in IQ-split BoS & and SH Sessions
Variable Mean Std. Dev. Min. Max. N
High IQ - Session 1 18.75 1.832 16 21 8
Low IQ - Session 2 13.6 1.713 10 16 10
High IQ - Session 3 18 1.673 16 21 16
Low IQ - Session 4 13.563 2.308 8 16 16
High IQ - Session 5 21 2.309 17 24 10
Low IQ - Session 6 12.214 3.556 5 17 14
High IQ - Session 7 19.714 1.978 17 23 14
Low IQ - Session 8 13.786 3.017 8 17 14
Table A.22. IQ-split: High Delta - Low IQ Sessions, Main Variables
Variable Mean Std. Dev. Min. Max. N
Choice 0.429 0.495 0 1 5124
Partner Choice 0.432 0.495 0 1 5124
Age 22.354 4.736 18 51 5124
Female 0.629 0.483 0 1 5124
Period 40.976 23.841 1 91 5124
Openness 3.638 0.531 2.5 5 5124
Continued on next page...
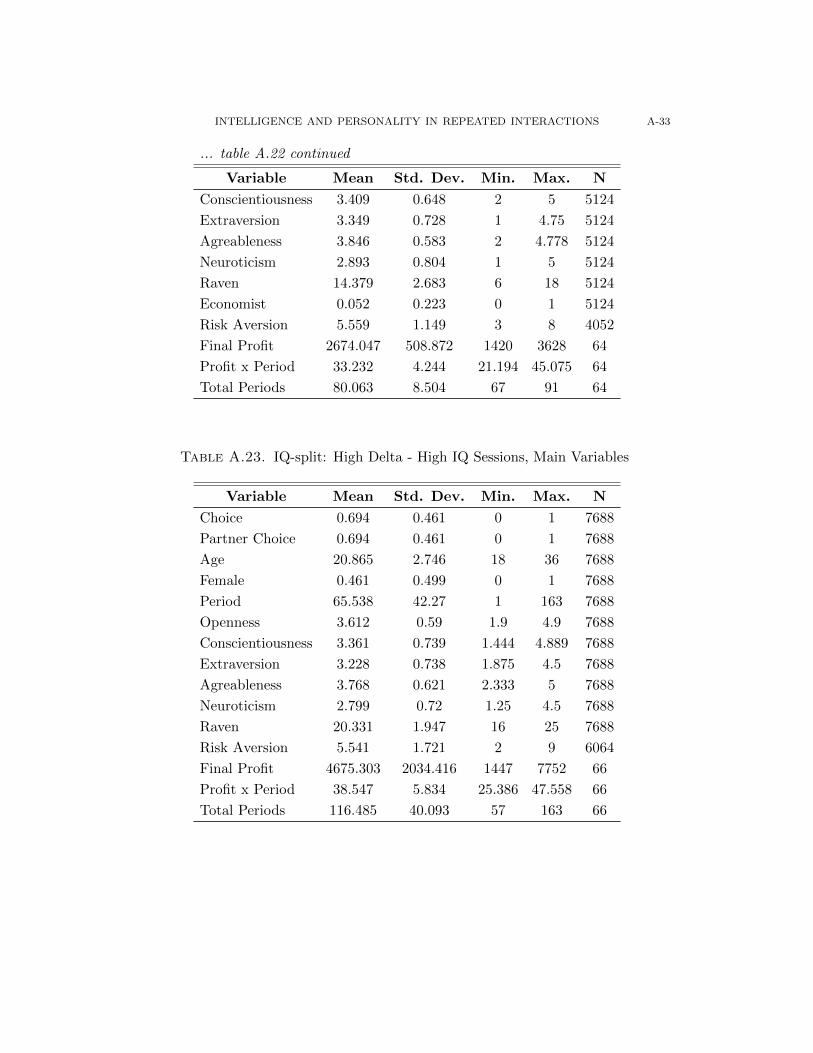
INTELLIGENCE AND PERSONALITY IN REPEATED INTERACTIONS A-33
... table A.22 continued
Variable Mean Std. Dev. Min. Max. N
Conscientiousness 3.409 0.648 2 5 5124
Extraversion 3.349 0.728 1 4.75 5124
Agreableness 3.846 0.583 2 4.778 5124
Neuroticism 2.893 0.804 1 5 5124
Raven 14.379 2.683 6 18 5124
Economist 0.052 0.223 0 1 5124
Risk Aversion 5.559 1.149 3 8 4052
Final Profit 2674.047 508.872 1420 3628 64
Profit x Period 33.232 4.244 21.194 45.075 64
Total Periods 80.063 8.504 67 91 64
Table A.23. IQ-split: High Delta - High IQ Sessions, Main Variables
Variable Mean Std. Dev. Min. Max. N
Choice 0.694 0.461 0 1 7688
Partner Choice 0.694 0.461 0 1 7688
Age 20.865 2.746 18 36 7688
Female 0.461 0.499 0 1 7688
Period 65.538 42.27 1 163 7688
Openness 3.612 0.59 1.9 4.9 7688
Conscientiousness 3.361 0.739 1.444 4.889 7688
Extraversion 3.228 0.738 1.875 4.5 7688
Agreableness 3.768 0.621 2.333 5 7688
Neuroticism 2.799 0.72 1.25 4.5 7688
Raven 20.331 1.947 16 25 7688
Risk Aversion 5.541 1.721 2 9 6064
Final Profit 4675.303 2034.416 1447 7752 66
Profit x Period 38.547 5.834 25.386 47.558 66
Total Periods 116.485 40.093 57 163 66
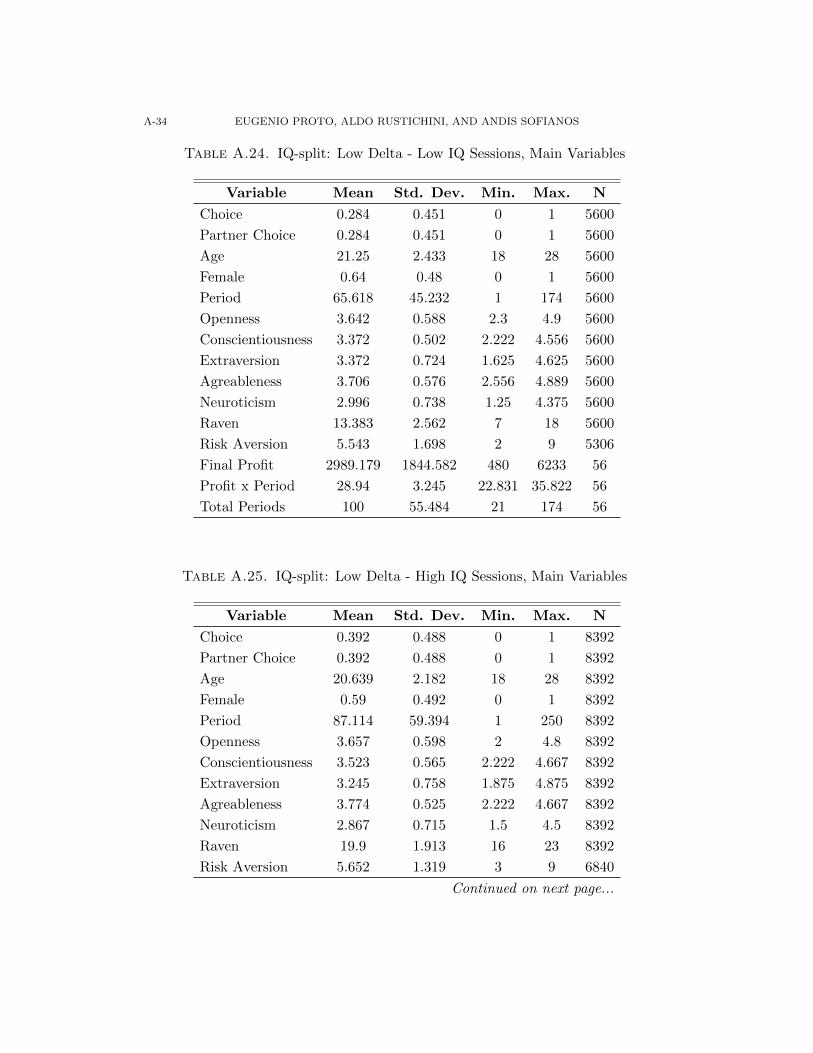
A-34 EUGENIO PROTO, ALDO RUSTICHINI, AND ANDIS SOFIANOS
Table A.24. IQ-split: Low Delta - Low IQ Sessions, Main Variables
Variable Mean Std. Dev. Min. Max. N
Choice 0.284 0.451 0 1 5600
Partner Choice 0.284 0.451 0 1 5600
Age 21.25 2.433 18 28 5600
Female 0.64 0.48 0 1 5600
Period 65.618 45.232 1 174 5600
Openness 3.642 0.588 2.3 4.9 5600
Conscientiousness 3.372 0.502 2.222 4.556 5600
Extraversion 3.372 0.724 1.625 4.625 5600
Agreableness 3.706 0.576 2.556 4.889 5600
Neuroticism 2.996 0.738 1.25 4.375 5600
Raven 13.383 2.562 7 18 5600
Risk Aversion 5.543 1.698 2 9 5306
Final Profit 2989.179 1844.582 480 6233 56
Profit x Period 28.94 3.245 22.831 35.822 56
Total Periods 100 55.484 21 174 56
Table A.25. IQ-split: Low Delta - High IQ Sessions, Main Variables
Variable Mean Std. Dev. Min. Max. N
Choice 0.392 0.488 0 1 8392
Partner Choice 0.392 0.488 0 1 8392
Age 20.639 2.182 18 28 8392
Female 0.59 0.492 0 1 8392
Period 87.114 59.394 1 250 8392
Openness 3.657 0.598 2 4.8 8392
Conscientiousness 3.523 0.565 2.222 4.667 8392
Extraversion 3.245 0.758 1.875 4.875 8392
Agreableness 3.774 0.525 2.222 4.667 8392
Neuroticism 2.867 0.715 1.5 4.5 8392
Raven 19.9 1.913 16 23 8392
Risk Aversion 5.652 1.319 3 9 6840
Continued on next page...
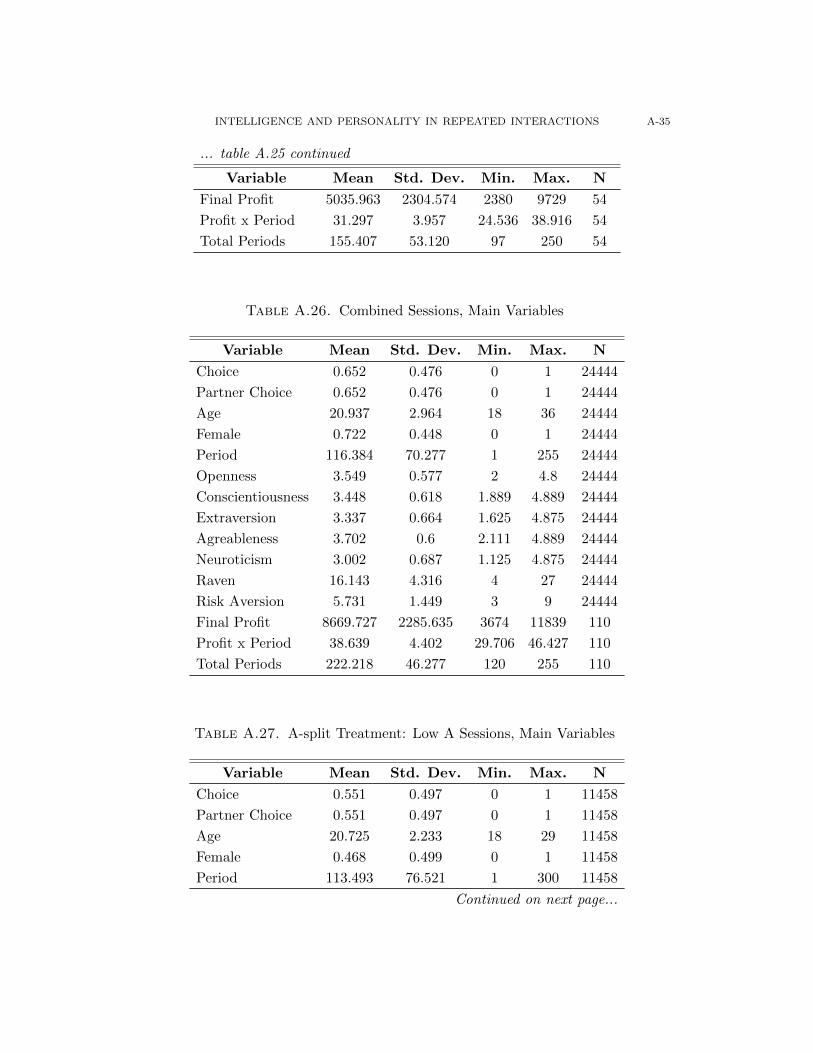
INTELLIGENCE AND PERSONALITY IN REPEATED INTERACTIONS A-35
... table A.25 continued
Variable Mean Std. Dev. Min. Max. N
Final Profit 5035.963 2304.574 2380 9729 54
Profit x Period 31.297 3.957 24.536 38.916 54
Total Periods 155.407 53.120 97 250 54
Table A.26. Combined Sessions, Main Variables
Variable Mean Std. Dev. Min. Max. N
Choice 0.652 0.476 0 1 24444
Partner Choice 0.652 0.476 0 1 24444
Age 20.937 2.964 18 36 24444
Female 0.722 0.448 0 1 24444
Period 116.384 70.277 1 255 24444
Openness 3.549 0.577 2 4.8 24444
Conscientiousness 3.448 0.618 1.889 4.889 24444
Extraversion 3.337 0.664 1.625 4.875 24444
Agreableness 3.702 0.6 2.111 4.889 24444
Neuroticism 3.002 0.687 1.125 4.875 24444
Raven 16.143 4.316 4 27 24444
Risk Aversion 5.731 1.449 3 9 24444
Final Profit 8669.727 2285.635 3674 11839 110
Profit x Period 38.639 4.402 29.706 46.427 110
Total Periods 222.218 46.277 120 255 110
Table A.27. A-split Treatment: Low A Sessions, Main Variables
Variable Mean Std. Dev. Min. Max. N
Choice 0.551 0.497 0 1 11458
Partner Choice 0.551 0.497 0 1 11458
Age 20.725 2.233 18 29 11458
Female 0.468 0.499 0 1 11458
Period 113.493 76.521 1 300 11458
Continued on next page...
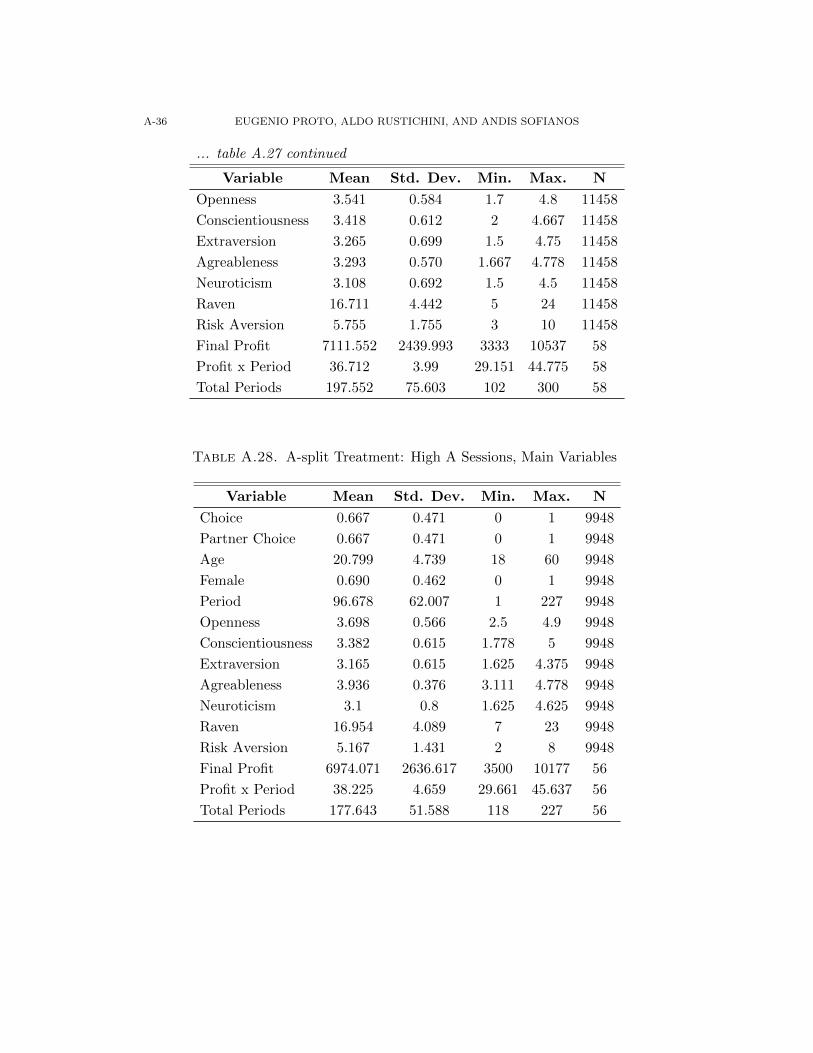
A-36 EUGENIO PROTO, ALDO RUSTICHINI, AND ANDIS SOFIANOS
... table A.27 continued
Variable Mean Std. Dev. Min. Max. N
Openness 3.541 0.584 1.7 4.8 11458
Conscientiousness 3.418 0.612 2 4.667 11458
Extraversion 3.265 0.699 1.5 4.75 11458
Agreableness 3.293 0.570 1.667 4.778 11458
Neuroticism 3.108 0.692 1.5 4.5 11458
Raven 16.711 4.442 5 24 11458
Risk Aversion 5.755 1.755 3 10 11458
Final Profit 7111.552 2439.993 3333 10537 58
Profit x Period 36.712 3.99 29.151 44.775 58
Total Periods 197.552 75.603 102 300 58
Table A.28. A-split Treatment: High A Sessions, Main Variables
Variable Mean Std. Dev. Min. Max. N
Choice 0.667 0.471 0 1 9948
Partner Choice 0.667 0.471 0 1 9948
Age 20.799 4.739 18 60 9948
Female 0.690 0.462 0 1 9948
Period 96.678 62.007 1 227 9948
Openness 3.698 0.566 2.5 4.9 9948
Conscientiousness 3.382 0.615 1.778 5 9948
Extraversion 3.165 0.615 1.625 4.375 9948
Agreableness 3.936 0.376 3.111 4.778 9948
Neuroticism 3.1 0.8 1.625 4.625 9948
Raven 16.954 4.089 7 23 9948
Risk Aversion 5.167 1.431 2 8 9948
Final Profit 6974.071 2636.617 3500 10177 56
Profit x Period 38.225 4.659 29.661 45.637 56
Total Periods 177.643 51.588 118 227 56

INTELLIGENCE AND PERSONALITY IN REPEATED INTERACTIONS A-37
Table A.29. C-split Treatment: Low C Sessions, Main Variables
Variable Mean Std. Dev. Min. Max. N
Choice 0.753 0.431 0 1 8270
Partner Choice 0.753 0.431 0 1 8270
Age 20.355 2.112 18 31 8270
Female 0.661 0.473 0 1 8270
Period 70.329 41.396 1 164 8270
Openness 3.283 0.674 2 4.9 8270
Conscientiousness 3.164 0.391 2.222 4 8270
Extraversion 3.165 0.635 1.875 4.5 8270
Agreableness 3.525 0.55 2.444 4.667 8270
Neuroticism 3.291 0.690 1.625 4.875 8270
Raven 18.499 2.778 11 25 8270
Risk Aversion 5.654 2.172 0 9 8270
Final Profit 5722.533 761.16 3965 7254 60
Profit x Period 41.582 3.562 30.736 47.702 60
Total Periods 137.833 15.992 121 164 60
Table A.30. C-split Treatment: High C Sessions, Main Variables
Variable Mean Std. Dev. Min. Max. N
Choice 0.591 0.492 0 1 9816
Partner Choice 0.591 0.492 0 1 9816
Age 21.962 4.88 18 45 9816
Female 0.538 0.499 0 1 9816
Period 81.035 47.954 1 182 9816
Openness 3.717 0.63 1.5 4.7 9816
Conscientiousness 3.983 0.433 3 4.778 9816
Extraversion 3.249 0.828 1.125 4.75 9816
Agreableness 3.8 0.592 2.222 4.889 9816
Neuroticism 2.816 0.844 1.125 4.875 9816
Raven 17.459 4.267 7 24 9816
Risk Aversion 5.343 1.957 0 9 9816
Continued on next page...
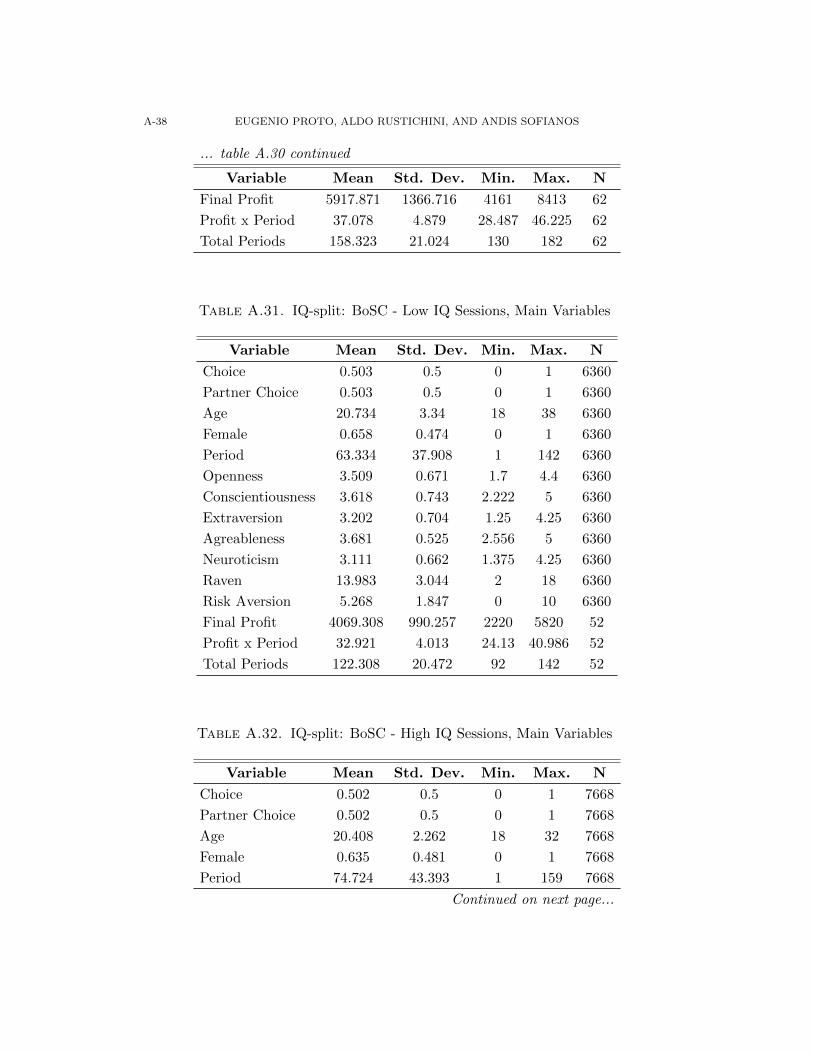
A-38 EUGENIO PROTO, ALDO RUSTICHINI, AND ANDIS SOFIANOS
... table A.30 continued
Variable Mean Std. Dev. Min. Max. N
Final Profit 5917.871 1366.716 4161 8413 62
Profit x Period 37.078 4.879 28.487 46.225 62
Total Periods 158.323 21.024 130 182 62
Table A.31. IQ-split: BoSC - Low IQ Sessions, Main Variables
Variable Mean Std. Dev. Min. Max. N
Choice 0.503 0.5 0 1 6360
Partner Choice 0.503 0.5 0 1 6360
Age 20.734 3.34 18 38 6360
Female 0.658 0.474 0 1 6360
Period 63.334 37.908 1 142 6360
Openness 3.509 0.671 1.7 4.4 6360
Conscientiousness 3.618 0.743 2.222 5 6360
Extraversion 3.202 0.704 1.25 4.25 6360
Agreableness 3.681 0.525 2.556 5 6360
Neuroticism 3.111 0.662 1.375 4.25 6360
Raven 13.983 3.044 2 18 6360
Risk Aversion 5.268 1.847 0 10 6360
Final Profit 4069.308 990.257 2220 5820 52
Profit x Period 32.921 4.013 24.13 40.986 52
Total Periods 122.308 20.472 92 142 52
Table A.32. IQ-split: BoSC - High IQ Sessions, Main Variables
Variable Mean Std. Dev. Min. Max. N
Choice 0.502 0.5 0 1 7668
Partner Choice 0.502 0.5 0 1 7668
Age 20.408 2.262 18 32 7668
Female 0.635 0.481 0 1 7668
Period 74.724 43.393 1 159 7668
Continued on next page...

INTELLIGENCE AND PERSONALITY IN REPEATED INTERACTIONS A-39
... table A.32 continued
Variable Mean Std. Dev. Min. Max. N
Openness 3.612 0.507 2.3 4.600 7668
Conscientiousness 3.239 0.631 1.667 4.556 7668
Extraversion 3.142 0.753 1.625 4.875 7668
Agreableness 3.637 0.671 2.111 5 7668
Neuroticism 3.145 0.839 1.5 5 7668
Raven 20.04 1.765 17 24 7668
Risk Aversion 5.823 1.667 3 10 7668
Final Profit 5513.308 582.054 4082 6932 52
Profit x Period 37.54 4.137 25.673 45.492 52
Total Periods 147.462 12.179 130 159 52
Table A.33. IQ-split: BoS & SH - Low-IQ Sessions, Main Variables
Variable Mean Std. Dev. Min. Max. N
Choice SH 0.076 0.265 0 1 5644
Partner Choice SH 0.076 0.265 0 1 5644
Choice BoS 0.449 0.497 0 1 5750
Partner Choice BoS 0.449 0.497 0 1 5750
Age 21.312 6.315 18 52 5974
Female 0.467 0.499 0 1 5974
Periods 54.031 32.254 1 125 5644
Periods 54.311 31.661 1 118 5750
Openness 3.462 0.574 2.1 4.5 5974
Conscientiousness 3.487 0.582 2.111 4.667 5974
Extraversion 3.279 0.773 1.75 4.625 5974
Agreableness 3.83 0.624 1.889 5 5974
Neuroticism 2.665 0.674 1.125 4 5974
Raven 13.354 2.709 5 17 5974
Risk Aversion 4.636 1.55 0 8 5974
Final Profit SH 4667.944 916.658 2680 6000 54
Profit x Period SH 44.507 3.811 32.289 48 54
Total Periods SH 104.519 16.459 83 125 54
Continued on next page...
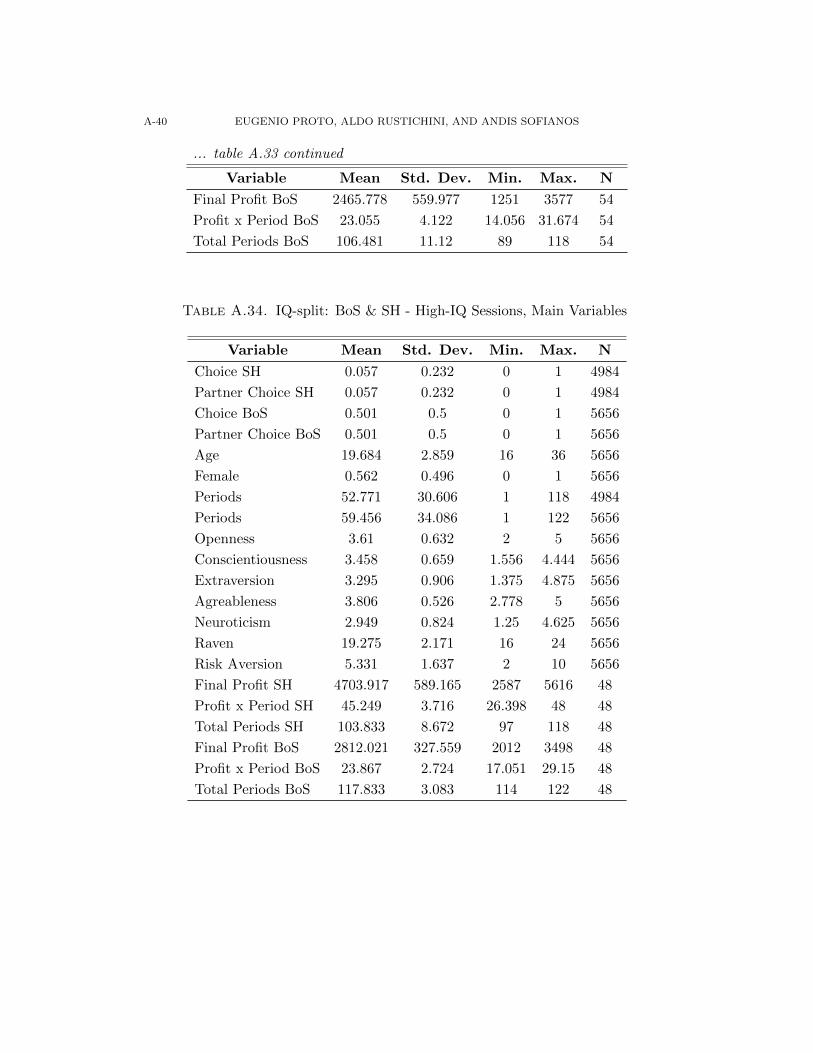
A-40 EUGENIO PROTO, ALDO RUSTICHINI, AND ANDIS SOFIANOS
... table A.33 continued
Variable Mean Std. Dev. Min. Max. N
Final Profit BoS 2465.778 559.977 1251 3577 54
Profit x Period BoS 23.055 4.122 14.056 31.674 54
Total Periods BoS 106.481 11.12 89 118 54
Table A.34. IQ-split: BoS & SH - High-IQ Sessions, Main Variables
Variable Mean Std. Dev. Min. Max. N
Choice SH 0.057 0.232 0 1 4984
Partner Choice SH 0.057 0.232 0 1 4984
Choice BoS 0.501 0.5 0 1 5656
Partner Choice BoS 0.501 0.5 0 1 5656
Age 19.684 2.859 16 36 5656
Female 0.562 0.496 0 1 5656
Periods 52.771 30.606 1 118 4984
Periods 59.456 34.086 1 122 5656
Openness 3.61 0.632 2 5 5656
Conscientiousness 3.458 0.659 1.556 4.444 5656
Extraversion 3.295 0.906 1.375 4.875 5656
Agreableness 3.806 0.526 2.778 5 5656
Neuroticism 2.949 0.824 1.25 4.625 5656
Raven 19.275 2.171 16 24 5656
Risk Aversion 5.331 1.637 2 10 5656
Final Profit SH 4703.917 589.165 2587 5616 48
Profit x Period SH 45.249 3.716 26.398 48 48
Total Periods SH 103.833 8.672 97 118 48
Final Profit BoS 2812.021 327.559 2012 3498 48
Profit x Period BoS 23.867 2.724 17.051 29.15 48
Total Periods BoS 117.833 3.083 114 122 48

INTELLIGENCE AND PERSONALITY IN REPEATED INTERACTIONS A-41
TableA.35.
IQ-s
pli
t:H
igh
Con
tinu
atio
nP
rob
abil
ity
-C
orre
lati
ons
Tab
le(p−values
inb
rack
ets)
Var
iab
les
Rav
enF
emal
eR
isk
Aver
sion
Op
enn
ess
Con
scie
nti
ou
snes
sE
xtr
aver
sion
Agre
ab
len
ess
Neu
roti
cism
Rav
en1.
000
Fem
ale
-0.1
601.
000
(0.0
68)
Ris
kA
ver
sion
0.03
0-0
.039
1.0
00
(0.7
64)
(0.6
99)
Op
enn
ess
-0.1
52-0
.017
-0.0
86
1.0
00
(0.0
84)
(0.8
44)
(0.3
96)
Con
scie
nti
ousn
ess
0.08
50.
004
0.0
73
0.1
57
1.0
00
(0.3
37)
(0.9
65)
(0.4
70)
(0.0
75)
Extr
aver
sion
-0.0
76-0
.086
0.0
04
0.3
19
0.0
54
1.0
00
(0.3
91)
(0.3
30)
(0.9
70)
(0.0
00)
(0.5
39)
Agr
eab
len
ess
-0.0
20-0
.052
-0.1
06
0.1
83
0.2
69
0.1
83
1.0
00
(0.8
23)
(0.5
54)
(0.2
96)
(0.0
38)
(0.0
02)
(0.0
37)
Neu
roti
cism
-0.0
360.
424
0.0
72
-0.1
30
-0.3
05
-0.3
15
-0.3
51
1.0
00
(0.6
84)
(0.0
00)
(0.4
78)
(0.1
41)
(0.0
00)
(0.0
00)
(0.0
00)
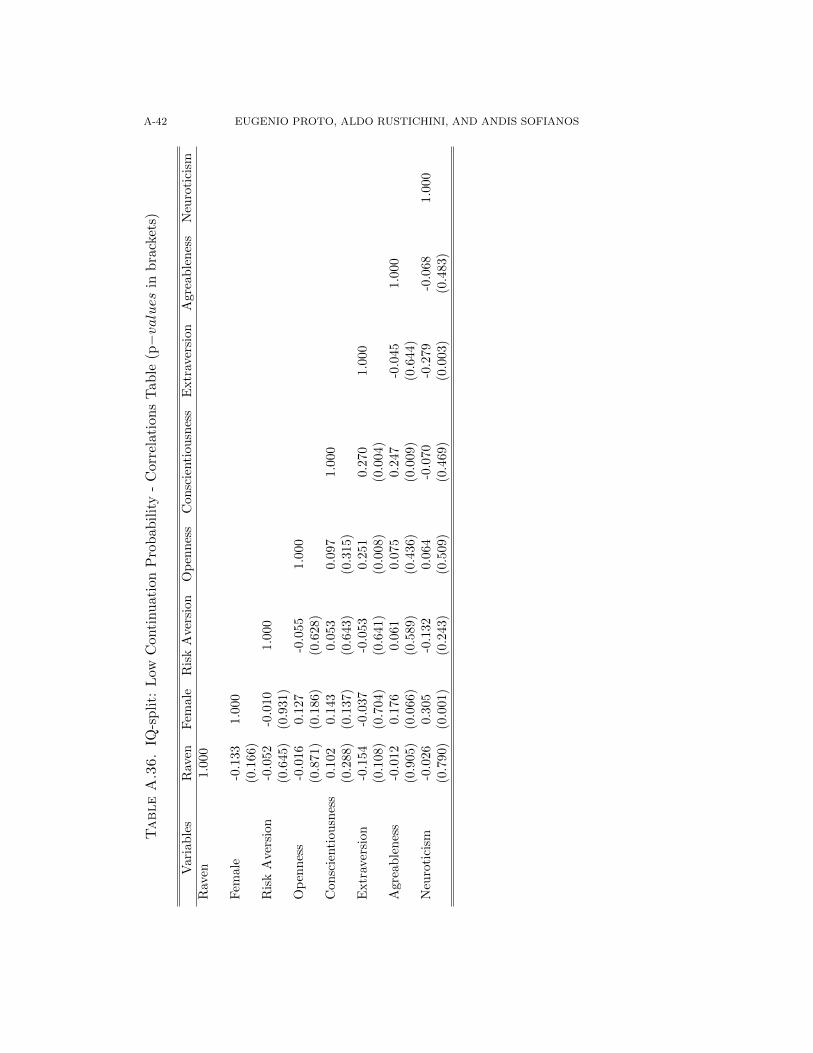
A-42 EUGENIO PROTO, ALDO RUSTICHINI, AND ANDIS SOFIANOS
TableA.36.
IQ-s
pli
t:L
owC
onti
nu
atio
nP
rob
abil
ity
-C
orre
lati
ons
Tab
le(p−values
inb
rack
ets)
Var
iab
les
Rav
enF
emal
eR
isk
Aver
sion
Op
enn
ess
Con
scie
nti
ou
snes
sE
xtr
aver
sion
Agre
ab
len
ess
Neu
roti
cism
Rav
en1.
000
Fem
ale
-0.1
331.
000
(0.1
66)
Ris
kA
ver
sion
-0.0
52-0
.010
1.0
00
(0.6
45)
(0.9
31)
Op
enn
ess
-0.0
160.
127
-0.0
55
1.0
00
(0.8
71)
(0.1
86)
(0.6
28)
Con
scie
nti
ousn
ess
0.10
20.
143
0.0
53
0.0
97
1.0
00
(0.2
88)
(0.1
37)
(0.6
43)
(0.3
15)
Extr
aver
sion
-0.1
54-0
.037
-0.0
53
0.2
51
0.2
70
1.0
00
(0.1
08)
(0.7
04)
(0.6
41)
(0.0
08)
(0.0
04)
Agr
eab
len
ess
-0.0
120.
176
0.0
61
0.0
75
0.2
47
-0.0
45
1.0
00
(0.9
05)
(0.0
66)
(0.5
89)
(0.4
36)
(0.0
09)
(0.6
44)
Neu
roti
cism
-0.0
260.
305
-0.1
32
0.0
64
-0.0
70
-0.2
79
-0.0
68
1.0
00
(0.7
90)
(0.0
01)
(0.2
43)
(0.5
09)
(0.4
69)
(0.0
03)
(0.4
83)
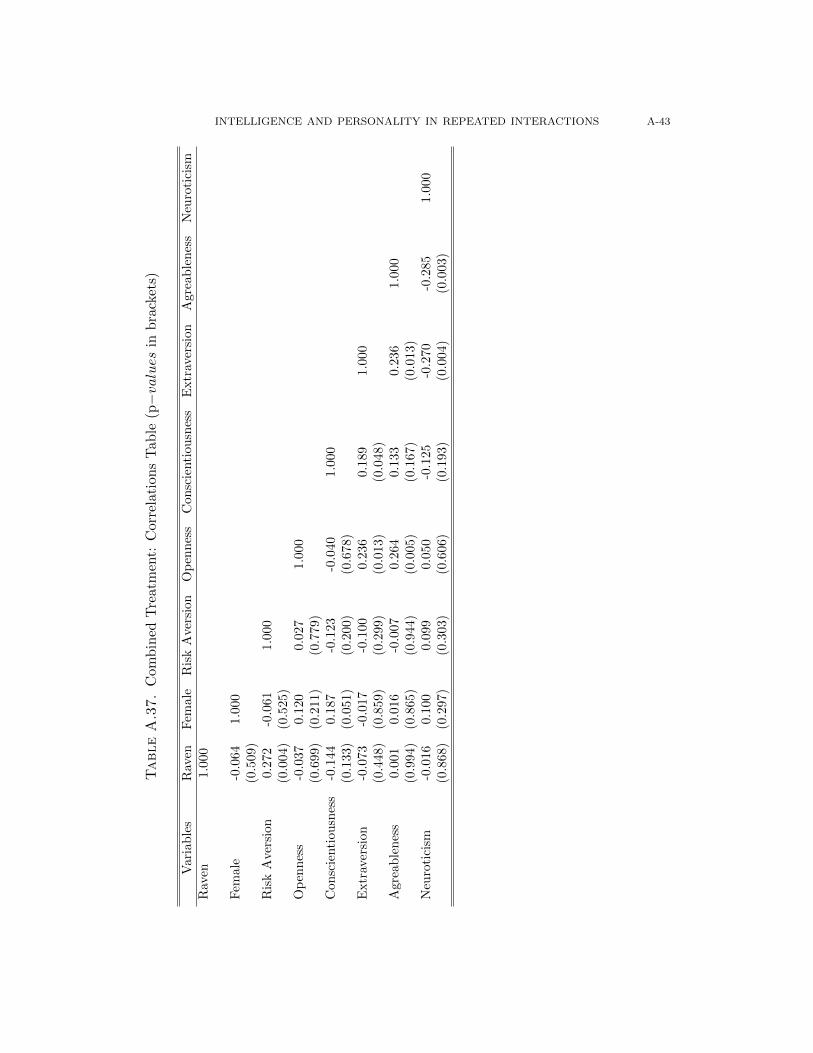
INTELLIGENCE AND PERSONALITY IN REPEATED INTERACTIONS A-43
TableA.37.
Com
bin
edT
reat
men
t:C
orre
lati
ons
Tab
le(p−values
inb
rack
ets)
Var
iab
les
Rav
enF
emal
eR
isk
Aver
sion
Op
enn
ess
Con
scie
nti
ou
snes
sE
xtr
aver
sion
Agre
ab
len
ess
Neu
roti
cism
Rav
en1.
000
Fem
ale
-0.0
641.
000
(0.5
09)
Ris
kA
ver
sion
0.27
2-0
.061
1.0
00
(0.0
04)
(0.5
25)
Op
enn
ess
-0.0
370.
120
0.0
27
1.0
00
(0.6
99)
(0.2
11)
(0.7
79)
Con
scie
nti
ousn
ess
-0.1
440.
187
-0.1
23
-0.0
40
1.0
00
(0.1
33)
(0.0
51)
(0.2
00)
(0.6
78)
Extr
aver
sion
-0.0
73-0
.017
-0.1
00
0.2
36
0.1
89
1.0
00
(0.4
48)
(0.8
59)
(0.2
99)
(0.0
13)
(0.0
48)
Agr
eab
len
ess
0.00
10.
016
-0.0
07
0.2
64
0.1
33
0.2
36
1.0
00
(0.9
94)
(0.8
65)
(0.9
44)
(0.0
05)
(0.1
67)
(0.0
13)
Neu
roti
cism
-0.0
160.
100
0.0
99
0.0
50
-0.1
25
-0.2
70
-0.2
85
1.0
00
(0.8
68)
(0.2
97)
(0.3
03)
(0.6
06)
(0.1
93)
(0.0
04)
(0.0
03)
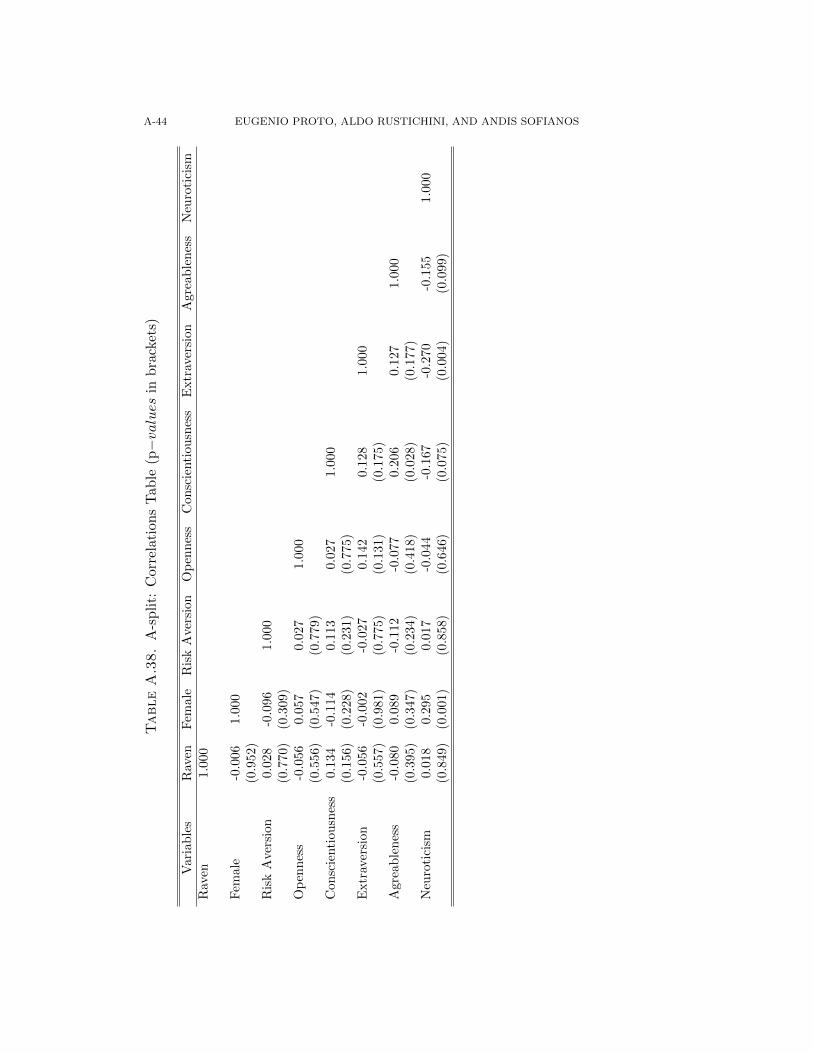
A-44 EUGENIO PROTO, ALDO RUSTICHINI, AND ANDIS SOFIANOS
TableA.38.
A-s
pli
t:C
orre
lati
ons
Tab
le(p−values
inb
rack
ets)
Var
iab
les
Rav
enF
emal
eR
isk
Aver
sion
Op
enn
ess
Con
scie
nti
ou
snes
sE
xtr
aver
sion
Agre
ab
len
ess
Neu
roti
cism
Rav
en1.
000
Fem
ale
-0.0
061.
000
(0.9
52)
Ris
kA
ver
sion
0.02
8-0
.096
1.0
00
(0.7
70)
(0.3
09)
Op
enn
ess
-0.0
560.
057
0.0
27
1.0
00
(0.5
56)
(0.5
47)
(0.7
79)
Con
scie
nti
ousn
ess
0.13
4-0
.114
0.1
13
0.0
27
1.0
00
(0.1
56)
(0.2
28)
(0.2
31)
(0.7
75)
Extr
aver
sion
-0.0
56-0
.002
-0.0
27
0.1
42
0.1
28
1.0
00
(0.5
57)
(0.9
81)
(0.7
75)
(0.1
31)
(0.1
75)
Agr
eab
len
ess
-0.0
800.
089
-0.1
12
-0.0
77
0.2
06
0.1
27
1.0
00
(0.3
95)
(0.3
47)
(0.2
34)
(0.4
18)
(0.0
28)
(0.1
77)
Neu
roti
cism
0.01
80.
295
0.0
17
-0.0
44
-0.1
67
-0.2
70
-0.1
55
1.0
00
(0.8
49)
(0.0
01)
(0.8
58)
(0.6
46)
(0.0
75)
(0.0
04)
(0.0
99)

INTELLIGENCE AND PERSONALITY IN REPEATED INTERACTIONS A-45
TableA.39.
C-s
pli
t:C
orre
lati
ons
Tab
le(p−values
inb
rack
ets)
Var
iab
les
Rav
enF
emal
eR
isk
Aver
sion
Op
enn
ess
Con
scie
nti
ou
snes
sE
xtr
aver
sion
Agre
ab
len
ess
Neu
roti
cism
Rav
en1.
000
Fem
ale
-0.2
221.
000
(0.0
14)
Ris
kA
ver
sion
0.13
7-0
.106
1.0
00
(0.1
32)
(0.2
46)
Op
enn
ess
-0.1
130.
021
0.0
22
1.0
00
(0.2
17)
(0.8
19)
(0.8
13)
Con
scie
nti
ousn
ess
-0.1
28-0
.107
-0.0
53
0.2
59
1.0
00
(0.1
59)
(0.2
41)
(0.5
64)
(0.0
04)
Extr
aver
sion
-0.1
76-0
.079
0.0
05
0.3
28
0.1
32
1.0
00
(0.0
53)
(0.3
88)
(0.9
58)
(0.0
00)
(0.1
48)
Agr
eab
len
ess
0.07
7-0
.135
0.0
02
0.0
40
0.3
44
0.3
01
1.0
00
(0.4
00)
(0.1
39)
(0.9
84)
(0.6
65)
(0.0
00)
(0.0
01)
Neu
roti
cism
0.01
20.
436
0.0
29
-0.2
94
-0.3
06
-0.3
68
-0.3
54
1.0
00
(0.8
92)
(0.0
00)
(0.7
48)
(0.0
01)
(0.0
01)
(0.0
00)
(0.0
00)

A-46 EUGENIO PROTO, ALDO RUSTICHINI, AND ANDIS SOFIANOS
TableA.40.
IQ-s
pli
t:B
oSC
-C
orre
lati
ons
Tab
le(p−values
inb
rack
ets)
Var
iab
les
Rav
enF
emal
eR
isk
Aver
sion
Op
enn
ess
Con
scie
nti
ou
snes
sE
xtr
aver
sion
Agre
ab
len
ess
Neu
roti
cism
Rav
en1.
000
Fem
ale
-0.0
441.
000
(0.6
59)
Ris
kA
ver
sion
0.05
6-0
.061
1.0
00
(0.5
75)
(0.5
39)
Op
enn
ess
0.09
4-0
.005
-0.0
82
1.0
00
(0.3
45)
(0.9
57)
(0.4
06)
Con
scie
nti
ousn
ess
-0.1
73-0
.058
0.0
49
-0.0
01
1.0
00
(0.0
79)
(0.5
56)
(0.6
21)
(0.9
94)
Extr
aver
sion
-0.0
64-0
.006
0.0
93
0.3
25
0.1
46
1.0
00
(0.5
21)
(0.9
49)
(0.3
45)
(0.0
01)
(0.1
40)
Agr
eab
len
ess
-0.0
16-0
.073
0.0
68
-0.1
39
0.2
77
-0.0
50
1.0
00
(0.8
69)
(0.4
60)
(0.4
95)
(0.1
59)
(0.0
04)
(0.6
16)
Neu
roti
cism
-0.0
970.
300
-0.0
82
0.0
37
-0.1
45
-0.2
01
-0.2
50
1.0
00
(0.3
28)
(0.0
02)
(0.4
09)
(0.7
10)
(0.1
41)
(0.0
41)
(0.0
11)
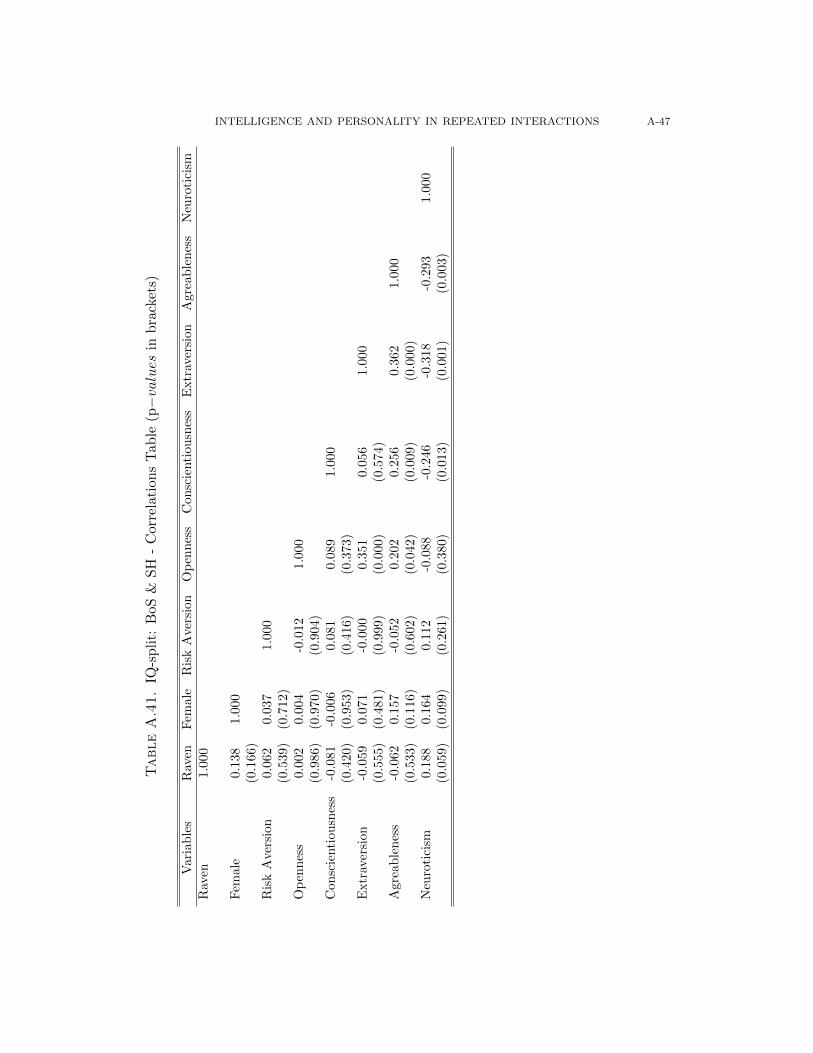
INTELLIGENCE AND PERSONALITY IN REPEATED INTERACTIONS A-47
TableA.41.
IQ-s
pli
t:B
oS&
SH
-C
orre
lati
ons
Tab
le(p−values
inb
rack
ets)
Var
iab
les
Rav
enF
emal
eR
isk
Aver
sion
Op
enn
ess
Con
scie
nti
ou
snes
sE
xtr
aver
sion
Agre
ab
len
ess
Neu
roti
cism
Rav
en1.
000
Fem
ale
0.13
81.
000
(0.1
66)
Ris
kA
ver
sion
0.06
20.
037
1.0
00
(0.5
39)
(0.7
12)
Op
enn
ess
0.00
20.
004
-0.0
12
1.0
00
(0.9
86)
(0.9
70)
(0.9
04)
Con
scie
nti
ousn
ess
-0.0
81-0
.006
0.0
81
0.0
89
1.0
00
(0.4
20)
(0.9
53)
(0.4
16)
(0.3
73)
Extr
aver
sion
-0.0
590.
071
-0.0
00
0.3
51
0.0
56
1.0
00
(0.5
55)
(0.4
81)
(0.9
99)
(0.0
00)
(0.5
74)
Agr
eab
len
ess
-0.0
620.
157
-0.0
52
0.2
02
0.2
56
0.3
62
1.0
00
(0.5
33)
(0.1
16)
(0.6
02)
(0.0
42)
(0.0
09)
(0.0
00)
Neu
roti
cism
0.18
80.
164
0.1
12
-0.0
88
-0.2
46
-0.3
18
-0.2
93
1.0
00
(0.0
59)
(0.0
99)
(0.2
61)
(0.3
80)
(0.0
13)
(0.0
01)
(0.0
03)

A-48 EUGENIO PROTO, ALDO RUSTICHINI, AND ANDIS SOFIANOS
Figure A.1. Distribution of Raven Scores. Top row showsraven distribution for all sessions of high continuation probabilityPD IQ-split in first column and second and third column separateacross low and high IQ sessions. Second row presents the equivalentdistributions for the low continuation probability PD IQ-split. Thirdrow presents the distribution for the combined treatment in the firstcolumn and splits across odd and even sessions in the second andthird columns respectively.
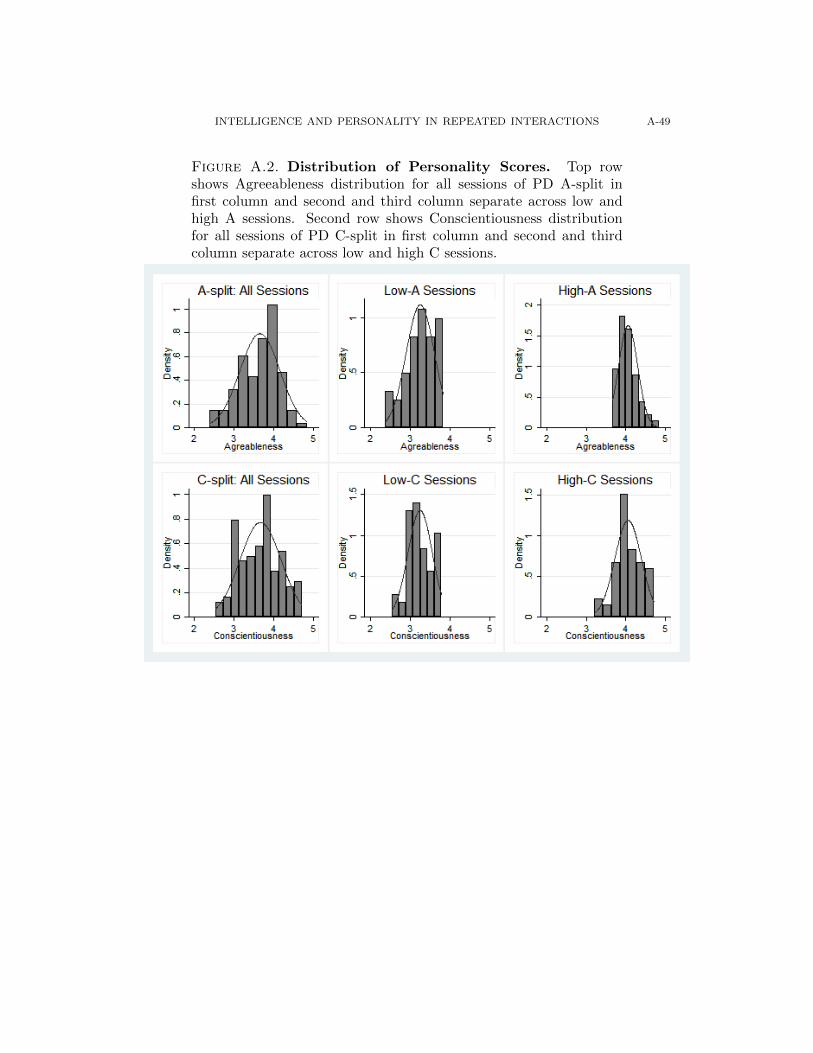
INTELLIGENCE AND PERSONALITY IN REPEATED INTERACTIONS A-49
Figure A.2. Distribution of Personality Scores. Top rowshows Agreeableness distribution for all sessions of PD A-split infirst column and second and third column separate across low andhigh A sessions. Second row shows Conscientiousness distributionfor all sessions of PD C-split in first column and second and thirdcolumn separate across low and high C sessions.

A-50 EUGENIO PROTO, ALDO RUSTICHINI, AND ANDIS SOFIANOS
Figure A.3. Distribution of the Raven Scores for the IQ-split BoSC treatment. The top panel depicts the distribution ofthe entire sample. The bottom panel presents the distributions inthe separate IQ sessions.
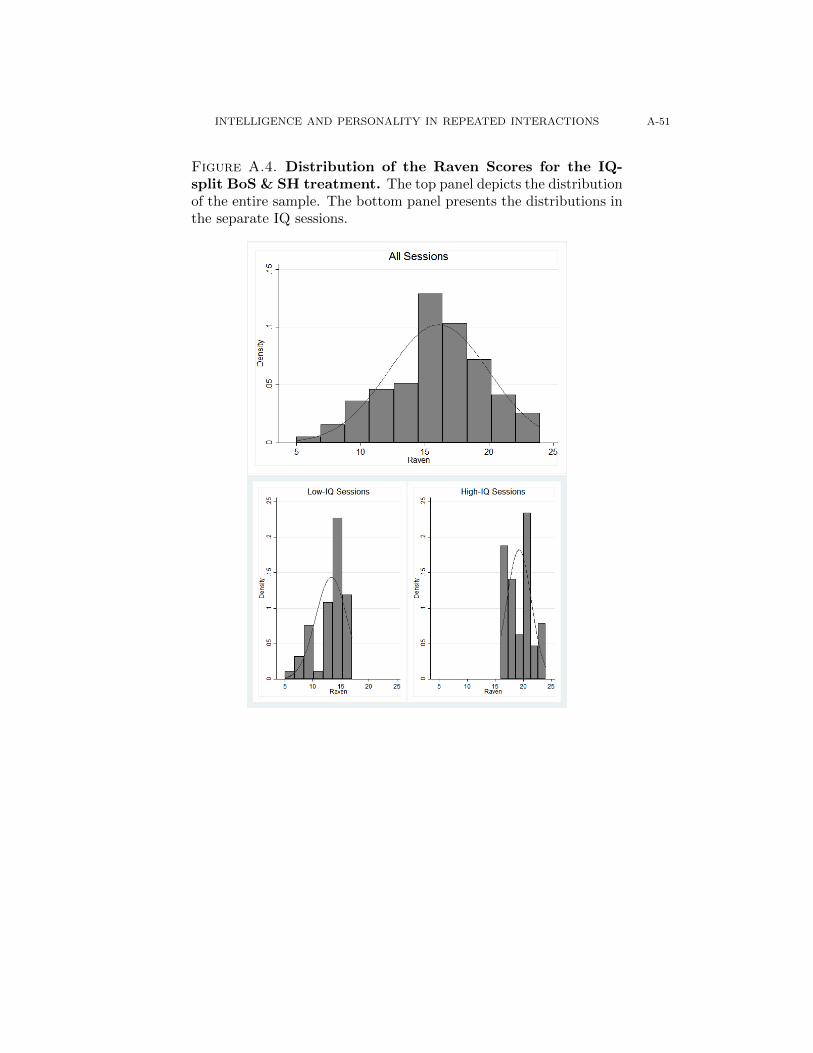
INTELLIGENCE AND PERSONALITY IN REPEATED INTERACTIONS A-51
Figure A.4. Distribution of the Raven Scores for the IQ-split BoS & SH treatment. The top panel depicts the distributionof the entire sample. The bottom panel presents the distributions inthe separate IQ sessions.
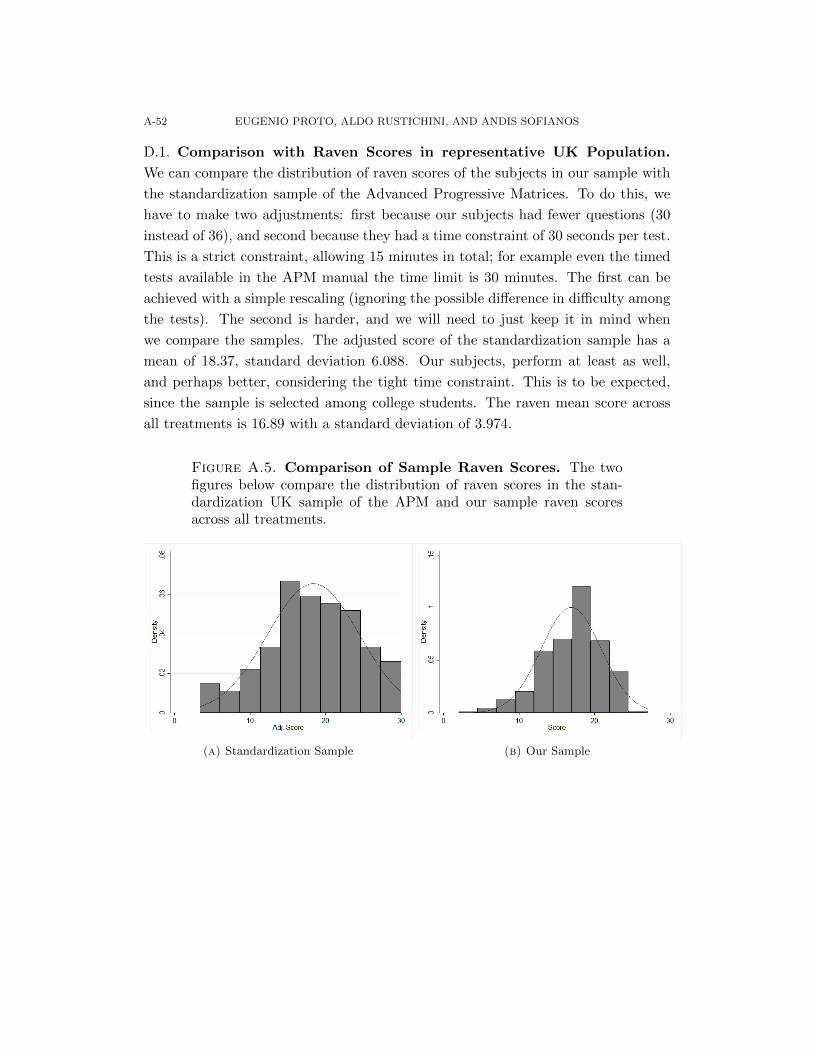
A-52 EUGENIO PROTO, ALDO RUSTICHINI, AND ANDIS SOFIANOS
D.1. Comparison with Raven Scores in representative UK Population.
We can compare the distribution of raven scores of the subjects in our sample with
the standardization sample of the Advanced Progressive Matrices. To do this, we
have to make two adjustments: first because our subjects had fewer questions (30
instead of 36), and second because they had a time constraint of 30 seconds per test.
This is a strict constraint, allowing 15 minutes in total; for example even the timed
tests available in the APM manual the time limit is 30 minutes. The first can be
achieved with a simple rescaling (ignoring the possible difference in difficulty among
the tests). The second is harder, and we will need to just keep it in mind when
we compare the samples. The adjusted score of the standardization sample has a
mean of 18.37, standard deviation 6.088. Our subjects, perform at least as well,
and perhaps better, considering the tight time constraint. This is to be expected,
since the sample is selected among college students. The raven mean score across
all treatments is 16.89 with a standard deviation of 3.974.
Figure A.5. Comparison of Sample Raven Scores. The twofigures below compare the distribution of raven scores in the stan-dardization UK sample of the APM and our sample raven scoresacross all treatments.
(a) Standardization Sample (b) Our Sample
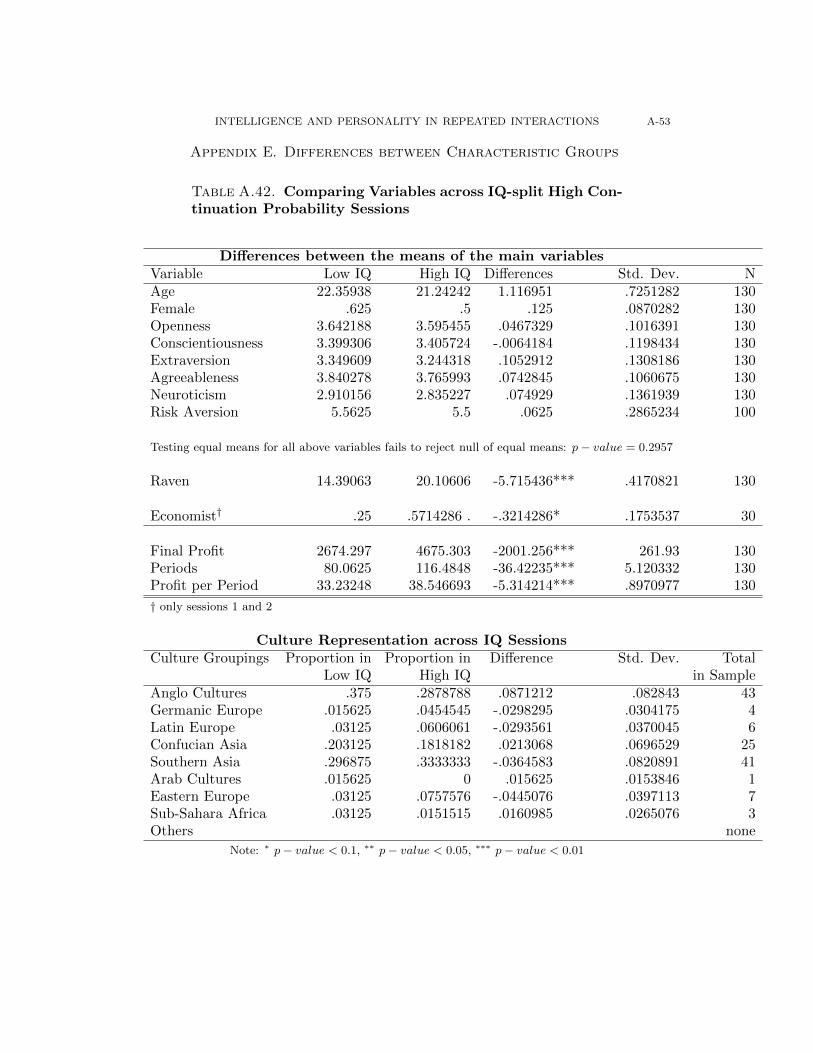
INTELLIGENCE AND PERSONALITY IN REPEATED INTERACTIONS A-53
Appendix E. Differences between Characteristic Groups
Table A.42. Comparing Variables across IQ-split High Con-tinuation Probability Sessions
Differences between the means of the main variablesVariable Low IQ High IQ Differences Std. Dev. NAge 22.35938 21.24242 1.116951 .7251282 130Female .625 .5 .125 .0870282 130Openness 3.642188 3.595455 .0467329 .1016391 130Conscientiousness 3.399306 3.405724 -.0064184 .1198434 130Extraversion 3.349609 3.244318 .1052912 .1308186 130Agreeableness 3.840278 3.765993 .0742845 .1060675 130Neuroticism 2.910156 2.835227 .074929 .1361939 130Risk Aversion 5.5625 5.5 .0625 .2865234 100
Testing equal means for all above variables fails to reject null of equal means: p− value = 0.2957
Raven 14.39063 20.10606 -5.715436*** .4170821 130
Economist† .25 .5714286 . -.3214286* .1753537 30
Final Profit 2674.297 4675.303 -2001.256*** 261.93 130Periods 80.0625 116.4848 -36.42235*** 5.120332 130Profit per Period 33.23248 38.546693 -5.314214*** .8970977 130
† only sessions 1 and 2
Culture Representation across IQ SessionsCulture Groupings Proportion in Proportion in Difference Std. Dev. Total
Low IQ High IQ in SampleAnglo Cultures .375 .2878788 .0871212 .082843 43Germanic Europe .015625 .0454545 -.0298295 .0304175 4Latin Europe .03125 .0606061 -.0293561 .0370045 6Confucian Asia .203125 .1818182 .0213068 .0696529 25Southern Asia .296875 .3333333 -.0364583 .0820891 41Arab Cultures .015625 0 .015625 .0153846 1Eastern Europe .03125 .0757576 -.0445076 .0397113 7Sub-Sahara Africa .03125 .0151515 .0160985 .0265076 3Others none
Note: ∗ p− value < 0.1, ∗∗ p− value < 0.05, ∗∗∗ p− value < 0.01

A-54 EUGENIO PROTO, ALDO RUSTICHINI, AND ANDIS SOFIANOS
Table A.43. Comparing Variables across IQ-split with LowContinuation Probability Sessions
Differences between the means of the main variablesVariable Low IQ High IQ Differences Std. Dev. NAge 21.19643 21.01852 .1779101 .4517162 110Female .5892857 .6111111 -.0218254 .0942731 110Openness 3.653571 3.633333 .0202381 .1158957 110Conscientiousness 3.414683 3.532922 -.1182393 .1055989 110Extraversion 3.310268 3.289352 .020916 .1390815 110Agreeableness 3.700397 3.751029 -.050632 .1064611 110Neuroticism 2.950893 2.854167 .0967262 .1402351 110Risk Aversion 5.547619 5.631579 -.0839599 .3578302 80
Testing equal means for all above variables fails to reject null of equal means: p− value = 0.7653
Raven 13.76786 19.88889 -6.121032*** .4230287 110
Final Profit 2989.179 5035.963 -2046.784*** 397.2878 110Periods 100 155.4074 -55.40741*** 10.36334 110Profit per Period 28.94046 31.29716 -2.356697*** .6889489 110
Culture Representation across IQ SessionsCulture Groupings Proportion in Proportion in Difference Std. Dev. Total
Low IQ High IQ in SampleAnglo Cultures .3035714 .2777778 .0257937 .0873865 32Germanic Europe .0178571 .037037 -.0191799 .0312965 3Latin Europe .0535714 .037037 .0165344 .0400622 5Confucian Asia .1607143 .2037037 -.0429894 .0741239 20Southern Asia .3035714 .2777778 .0257937 .0873865 32Arab Cultures .0178571 0.0185185 -.0006614 .0257171 2Eastern Europe .0535714 .1481481 -.0945767 .0570229 11Sub-Sahara Africa .0714286 0 .0714286** .0353697 4Others .0178571 0 .0178571 .0181878 1
Note: ∗ p− value < 0.1, ∗∗ p− value < 0.05, ∗∗∗ p− value < 0.01
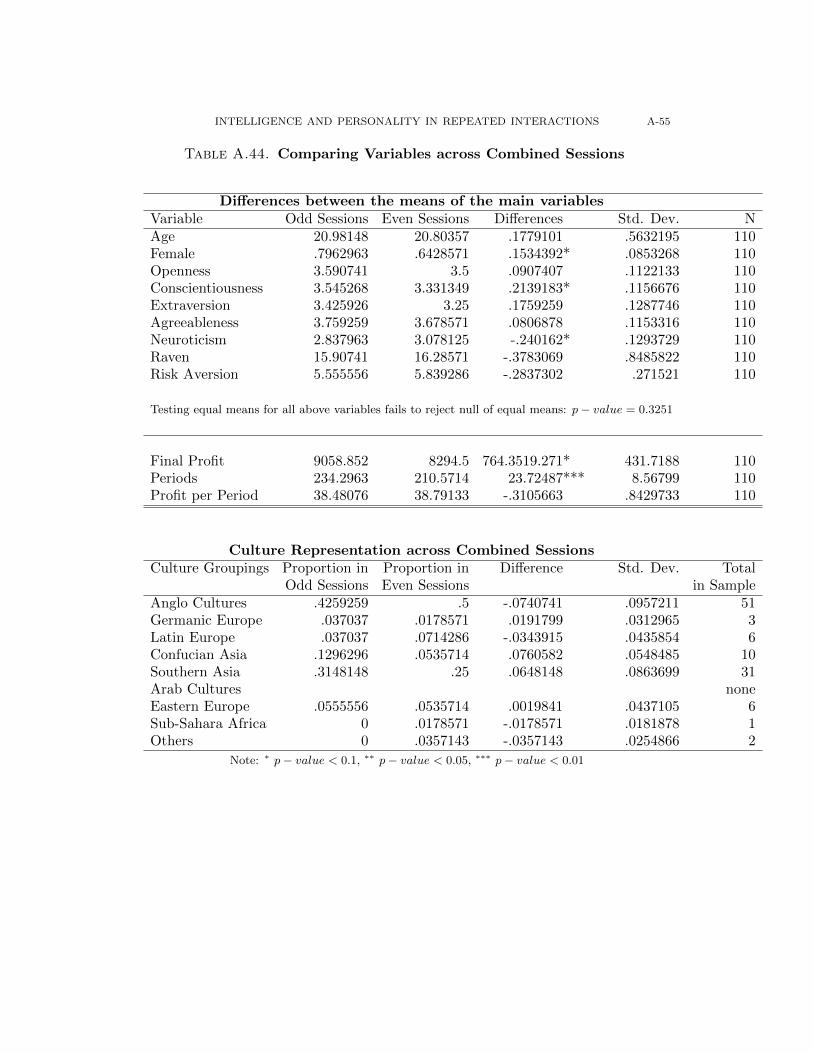
INTELLIGENCE AND PERSONALITY IN REPEATED INTERACTIONS A-55
Table A.44. Comparing Variables across Combined Sessions
Differences between the means of the main variablesVariable Odd Sessions Even Sessions Differences Std. Dev. NAge 20.98148 20.80357 .1779101 .5632195 110Female .7962963 .6428571 .1534392* .0853268 110Openness 3.590741 3.5 .0907407 .1122133 110Conscientiousness 3.545268 3.331349 .2139183* .1156676 110Extraversion 3.425926 3.25 .1759259 .1287746 110Agreeableness 3.759259 3.678571 .0806878 .1153316 110Neuroticism 2.837963 3.078125 -.240162* .1293729 110Raven 15.90741 16.28571 -.3783069 .8485822 110Risk Aversion 5.555556 5.839286 -.2837302 .271521 110
Testing equal means for all above variables fails to reject null of equal means: p− value = 0.3251
Final Profit 9058.852 8294.5 764.3519.271* 431.7188 110Periods 234.2963 210.5714 23.72487*** 8.56799 110Profit per Period 38.48076 38.79133 -.3105663 .8429733 110
Culture Representation across Combined SessionsCulture Groupings Proportion in Proportion in Difference Std. Dev. Total
Odd Sessions Even Sessions in SampleAnglo Cultures .4259259 .5 -.0740741 .0957211 51Germanic Europe .037037 .0178571 .0191799 .0312965 3Latin Europe .037037 .0714286 -.0343915 .0435854 6Confucian Asia .1296296 .0535714 .0760582 .0548485 10Southern Asia .3148148 .25 .0648148 .0863699 31Arab Cultures noneEastern Europe .0555556 .0535714 .0019841 .0437105 6Sub-Sahara Africa 0 .0178571 -.0178571 .0181878 1Others 0 .0357143 -.0357143 .0254866 2
Note: ∗ p− value < 0.1, ∗∗ p− value < 0.05, ∗∗∗ p− value < 0.01
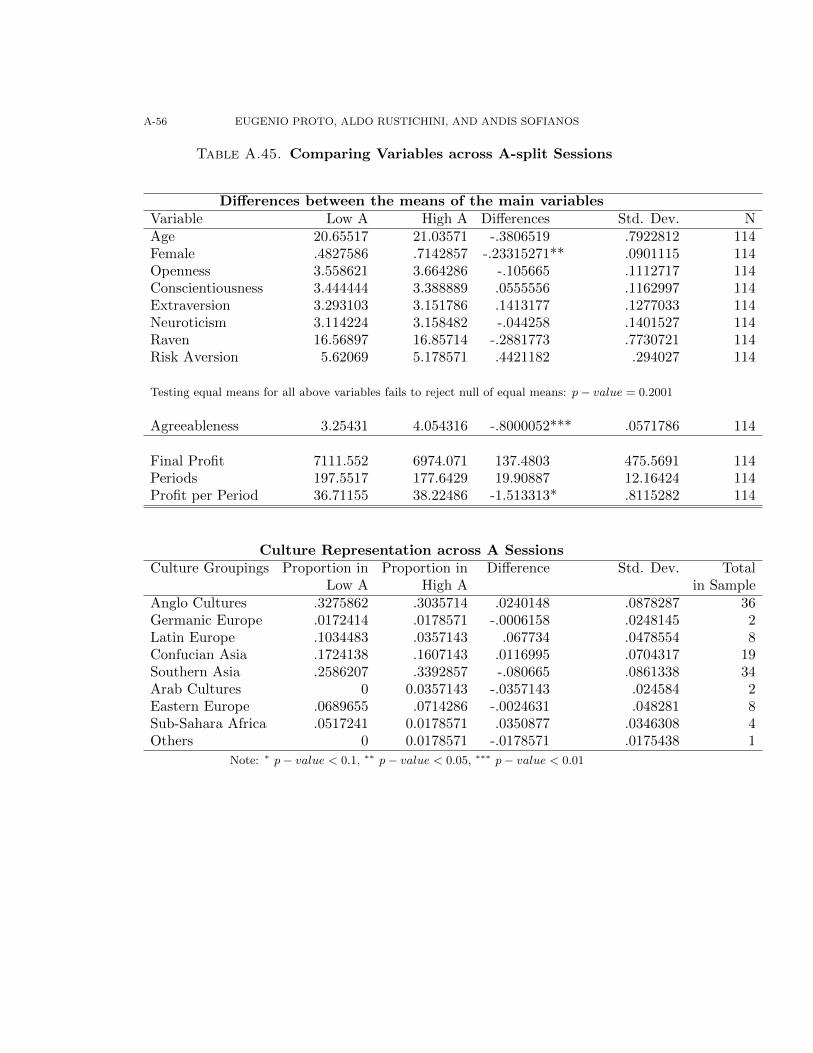
A-56 EUGENIO PROTO, ALDO RUSTICHINI, AND ANDIS SOFIANOS
Table A.45. Comparing Variables across A-split Sessions
Differences between the means of the main variablesVariable Low A High A Differences Std. Dev. NAge 20.65517 21.03571 -.3806519 .7922812 114Female .4827586 .7142857 -.23315271** .0901115 114Openness 3.558621 3.664286 -.105665 .1112717 114Conscientiousness 3.444444 3.388889 .0555556 .1162997 114Extraversion 3.293103 3.151786 .1413177 .1277033 114Neuroticism 3.114224 3.158482 -.044258 .1401527 114Raven 16.56897 16.85714 -.2881773 .7730721 114Risk Aversion 5.62069 5.178571 .4421182 .294027 114
Testing equal means for all above variables fails to reject null of equal means: p− value = 0.2001
Agreeableness 3.25431 4.054316 -.8000052*** .0571786 114
Final Profit 7111.552 6974.071 137.4803 475.5691 114Periods 197.5517 177.6429 19.90887 12.16424 114Profit per Period 36.71155 38.22486 -1.513313* .8115282 114
Culture Representation across A SessionsCulture Groupings Proportion in Proportion in Difference Std. Dev. Total
Low A High A in SampleAnglo Cultures .3275862 .3035714 .0240148 .0878287 36Germanic Europe .0172414 .0178571 -.0006158 .0248145 2Latin Europe .1034483 .0357143 .067734 .0478554 8Confucian Asia .1724138 .1607143 .0116995 .0704317 19Southern Asia .2586207 .3392857 -.080665 .0861338 34Arab Cultures 0 0.0357143 -.0357143 .024584 2Eastern Europe .0689655 .0714286 -.0024631 .048281 8Sub-Sahara Africa .0517241 0.0178571 .0350877 .0346308 4Others 0 0.0178571 -.0178571 .0175438 1
Note: ∗ p− value < 0.1, ∗∗ p− value < 0.05, ∗∗∗ p− value < 0.01

INTELLIGENCE AND PERSONALITY IN REPEATED INTERACTIONS A-57
Table A.46. Comparing Variables across C-split Sessions
Differences between the means of the main variablesVariable Low C High C Differences Std. Dev. NAge 20.36667 21.82258 -1.455914** .6692754 122Female .65 .5322581 .1177419 .0891571 122Openness 3.275 3.7 -.425*** .1171683 122Extraversion 3.172917 3.247984 -.0750672 .1327237 122Agreeableness 3.531481 3.806452 -.2749702*** .1048788 122Neuroticism 3.28125 2.810484 .4707661*** .1416807 122Raven 18.55 17.54839 1.001613 .6517364 122Risk Aversion 5.683333 5.322581 .3607527 .372067 122
Testing equal means for all above variables rejects null of equal means: p− value = 0.0002
Conscientiousness 3.25 4.05578 -.8057796*** .058155 122
Final Profit 5722.533 5917.871 -195.3376 201.202 122Periods 137.8333 158.3226 -20.48925*** 3.390004 122Profit per Period 41.58246 37.07793 4.504527*** .7755027 122
Culture Representation across C SessionsCulture Groupings Proportion in Proportion in Difference Std. Dev. Total
Low C High C in SampleAnglo Cultures .1 .1612903 -.0612903 .0613839 16Germanic Europe noneLatin Europe .0333333 .0322581 .0010753 .0325167 4Confucian Asia .1833333 .1612903 .022043 .0689006 21Southern Asia .55 .3709677 .1790323** .0895124 56Arab Cultures 0 0.016129 -.016129 .01633978 1Eastern Europe .1 .2096774 -.1096774* .065401 19Sub-Sahara Africa .016667 0.016129 .0005376 .0231869 2Others .016667 0.0322581 -.0155914 .0282437 3
Note: ∗ p− value < 0.1, ∗∗ p− value < 0.05, ∗∗∗ p− value < 0.01

A-58 EUGENIO PROTO, ALDO RUSTICHINI, AND ANDIS SOFIANOS
Table A.47. Comparing Variables across IQ-split BoSC Sessions
Differences between the means of the main variablesVariable Low IQ High IQ Differences Std. Dev. NAge 20.76923 20.38462 .3846154 .5830494 104Female .6346154 .6346154 0 .0953587 104Openness 3.521154 3.601923 -.0807692 .1179842 104Conscientiousness 3.630342 3.235043 .3952991*** .1376939 104Extraversion 3.201923 3.134615 .0673077 .1447452 104Agreeableness 3.688034 3.638889 .0491453 .120359 104Neuroticism 3.125 3.137019 -.0120192 .1511667 104Risk Aversion 5.307692 5.826923 -.5192308 .349811 104
Testing equal means for all above variables fails to reject null of equal means: p− value = 0.1727
Raven 13.92308 20.03846 -6.115385*** .5047345 104
Final Profit 4069.308 5513.308 -1444*** 159.2891 104Periods 122.3077 147.4615 -25.15385*** 3.30341 104Profit per Period 32.92109 37.53997 -4.618882*** .7993098 104
Culture Representation across IQ SessionsCulture Groupings Proportion in Proportion in Difference Std. Dev. Total
Low IQ High IQ in SampleAnglo Cultures .2692308 .3846154 -.1153846 .0921882 34Germanic Europe .019208 .0576923 -.0384615 .0378917 4Latin Europe .0384615 .0192308 .0192308 .0330902 3Confucian Asia .2307692 .0192308 .2115385*** .0620524 13Southern Asia .2884615 .4423077 -.15384622 .0941341 38Arab Cultures .0384615 0 .0384615 .0269285 2Eastern Europe .0769231 .0384615 .0384615 .0460154 6Sub-Sahara Africa .0192308 0 .0192308 .0192308 1Others .0192308 0.0384615 -.0192308 .0330902 3
Note: ∗ p− value < 0.1, ∗∗ p− value < 0.05, ∗∗∗ p− value < 0.01
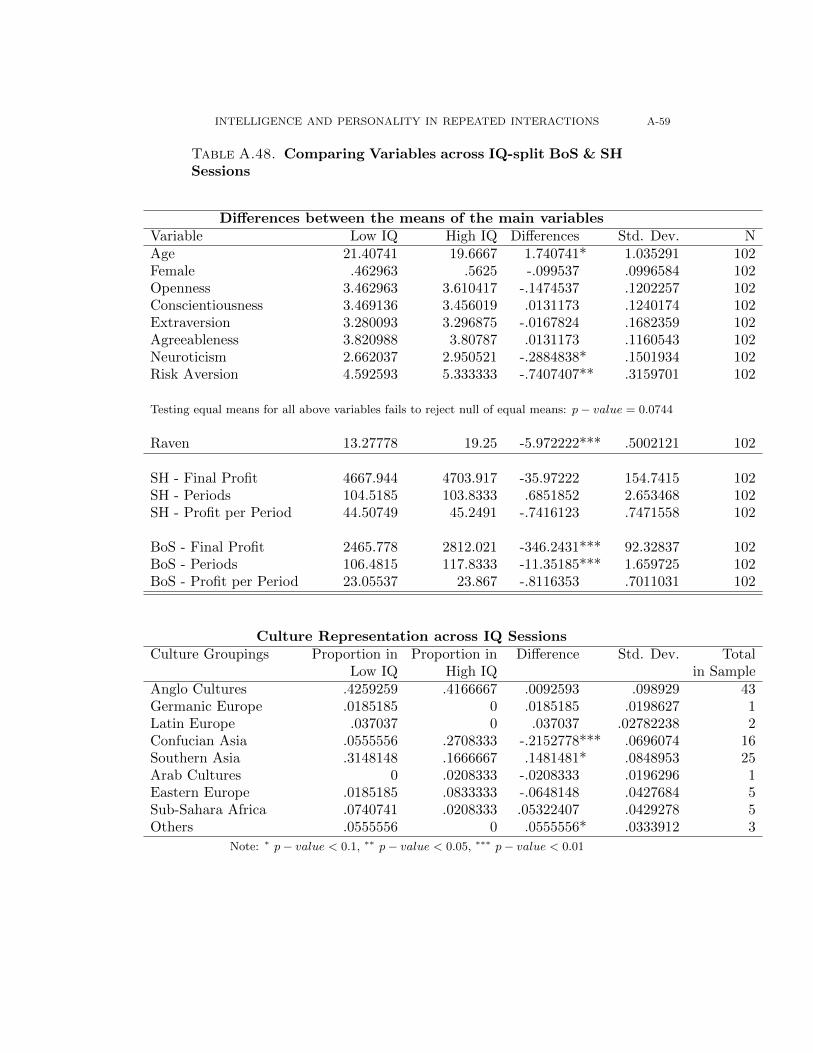
INTELLIGENCE AND PERSONALITY IN REPEATED INTERACTIONS A-59
Table A.48. Comparing Variables across IQ-split BoS & SHSessions
Differences between the means of the main variablesVariable Low IQ High IQ Differences Std. Dev. NAge 21.40741 19.6667 1.740741* 1.035291 102Female .462963 .5625 -.099537 .0996584 102Openness 3.462963 3.610417 -.1474537 .1202257 102Conscientiousness 3.469136 3.456019 .0131173 .1240174 102Extraversion 3.280093 3.296875 -.0167824 .1682359 102Agreeableness 3.820988 3.80787 .0131173 .1160543 102Neuroticism 2.662037 2.950521 -.2884838* .1501934 102Risk Aversion 4.592593 5.333333 -.7407407** .3159701 102
Testing equal means for all above variables fails to reject null of equal means: p− value = 0.0744
Raven 13.27778 19.25 -5.972222*** .5002121 102
SH - Final Profit 4667.944 4703.917 -35.97222 154.7415 102SH - Periods 104.5185 103.8333 .6851852 2.653468 102SH - Profit per Period 44.50749 45.2491 -.7416123 .7471558 102
BoS - Final Profit 2465.778 2812.021 -346.2431*** 92.32837 102BoS - Periods 106.4815 117.8333 -11.35185*** 1.659725 102BoS - Profit per Period 23.05537 23.867 -.8116353 .7011031 102
Culture Representation across IQ SessionsCulture Groupings Proportion in Proportion in Difference Std. Dev. Total
Low IQ High IQ in SampleAnglo Cultures .4259259 .4166667 .0092593 .098929 43Germanic Europe .0185185 0 .0185185 .0198627 1Latin Europe .037037 0 .037037 .02782238 2Confucian Asia .0555556 .2708333 -.2152778*** .0696074 16Southern Asia .3148148 .1666667 .1481481* .0848953 25Arab Cultures 0 .0208333 -.0208333 .0196296 1Eastern Europe .0185185 .0833333 -.0648148 .0427684 5Sub-Sahara Africa .0740741 .0208333 .05322407 .0429278 5Others .0555556 0 .0555556* .0333912 3
Note: ∗ p− value < 0.1, ∗∗ p− value < 0.05, ∗∗∗ p− value < 0.01

A-60 EUGENIO PROTO, ALDO RUSTICHINI, AND ANDIS SOFIANOS
Appendix F. PD: results per sessions
F.1. IQ-Split treatments. The panel A of figure A.6 shows that the same pattern
is replicated in each pair of contiguous sessions with high continuation probability.
In sessions 3 and 4 (top right-hand panel) the divergence is less significant. This
is due in part to the fact that in session 3 a particularly slow subject prevented
the group from playing a sufficiently large number of repeated games. However, the
dashed blue line in the figure, representing the trend estimate, shows that divergence
was starting to take place in a way consistent with the other sessions.
The panel B of figure A.6 refer to the sessions with low continuation probability
and shows that that cooperation always decline from about 50% in the low IQ
sessions, but the high IQ sessions we have mixed results. In two sessions (sessions 3
and 7) cooperations seem to increase, and in one case (session 7) it reaches almost
full cooperation. In the other 2 high IQ sessions (sessions 1 and 5) cooperation
decline in a similar way than in the sessions with the low IQ subjects.
In figure A.7 we report the cooperation rates in two sessions where we informed
the subjects their own Raven scores and the session average Raven score, also in
this case the cooperation rates in the two groups follow a similar pattern. This data
has not been included in the analysis in the main text.
F.2. Combined treatments. Figure A.8 shows that a similar pattern is replicated
in almost all 8 sessions. We can observe an increasing trend in all but 1 session, and
a trendline for the high IQ almost always above the one for the low IQ.
F.3. C-Split treatments. The panel A of Figure A.9 presents the cooperation
rates by sessions in the low-C and high-C treatments. The low-C sessions feature
a high level of cooperation, especially toward the end, where in 3 cases cooperation
is almost 100% and only in one case (session 2) it is just below 80%. In the high-C
sessions cooperation is generally lower and in session 5 it is very low, below 40%
at the end. We found instructive to present the session aggregated by treatment
as in figure A.10. Here we see that while the low-C sessions tend to have a similar
behaviour starting around 50% cooperation rates and going up (top right panel),
in the high-C sessions (top left panel) session 5 follows a different patten oscillating
around 40% rates. Accordingly, in figure 13 we only aggregated more homogeneous
the high-C sessions and presented session 5 on its own.
F.4. A-Split treatments. The panel B of Figure A.9 presents the cooperation
rates by sessions in the low-A and high-A treatments. The high-A sessions feature a
pattern of cooperation not very different from the low-A sessions. The only difference

INTELLIGENCE AND PERSONALITY IN REPEATED INTERACTIONS A-61
is represented by the session 7 (high-A session), where cooperation collapsed at the
beginning and remained at a low level throughout the entire session.
As before, we found instructive to present the session aggregated by treatment
as in figure A.10, from where we can notice that session 7 (the continuous blue
line in the left bottom panel). Accordingly, in figure 15 we only aggregated more
homogeneous the high-C sessions and presented session 7 on its own.
Appendix G. BoSC, BoS and SH: results per sessions
Figure A.11 shows that a similar pattern is replicated in each pair of contiguous
sessions. We observe that the trend-line of the compromise outcome among the high
IQ is almost always above the one in the low IQ with a non converging pattern, apart
from session 7, where the low IQ seem to eventually achieve the same rates than the
high IQ.
Finally in A.12 and A.13, we report the pattern of cooperation per sessions in
the BOS IQ-Spilt and SH IQ-Split treatments. In both we can observe a similar
behaviour across the different IQ groups.

A-62 EUGENIO PROTO, ALDO RUSTICHINI, AND ANDIS SOFIANOS
Figure A.6. PD in IQ-Split sessions: Average cooperationper supergame in all different sessions The red lines in eachpanel represent the average cooperation per period among all sub-jects of the corresponding low IQ session and the blue lines repre-sent the average (over pairs of subjects) cooperation per supergameamong all subjects of the corresponding high IQ session. The straightdashed lines represent the linear trend.
Panel A: High continuation probability (Delta=0.75)
Panel B: Low continuation probability (Delta=0.50)
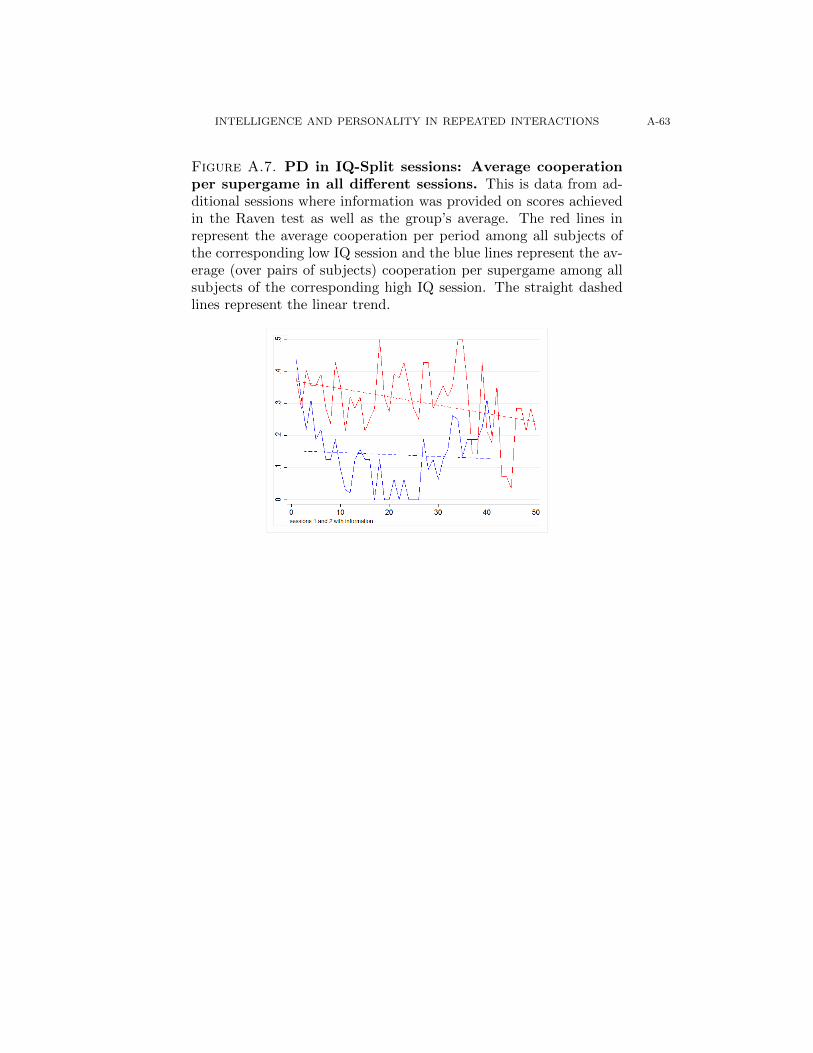
INTELLIGENCE AND PERSONALITY IN REPEATED INTERACTIONS A-63
Figure A.7. PD in IQ-Split sessions: Average cooperationper supergame in all different sessions. This is data from ad-ditional sessions where information was provided on scores achievedin the Raven test as well as the group’s average. The red lines inrepresent the average cooperation per period among all subjects ofthe corresponding low IQ session and the blue lines represent the av-erage (over pairs of subjects) cooperation per supergame among allsubjects of the corresponding high IQ session. The straight dashedlines represent the linear trend.
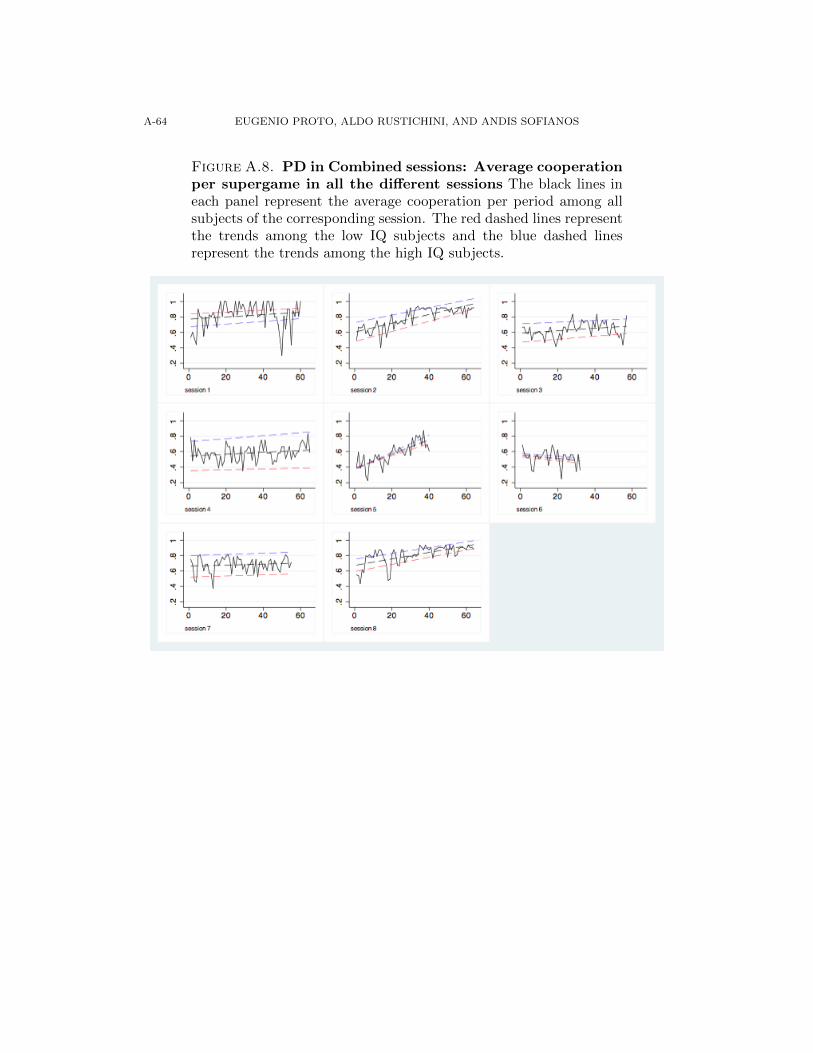
A-64 EUGENIO PROTO, ALDO RUSTICHINI, AND ANDIS SOFIANOS
Figure A.8. PD in Combined sessions: Average cooperationper supergame in all the different sessions The black lines ineach panel represent the average cooperation per period among allsubjects of the corresponding session. The red dashed lines representthe trends among the low IQ subjects and the blue dashed linesrepresent the trends among the high IQ subjects.
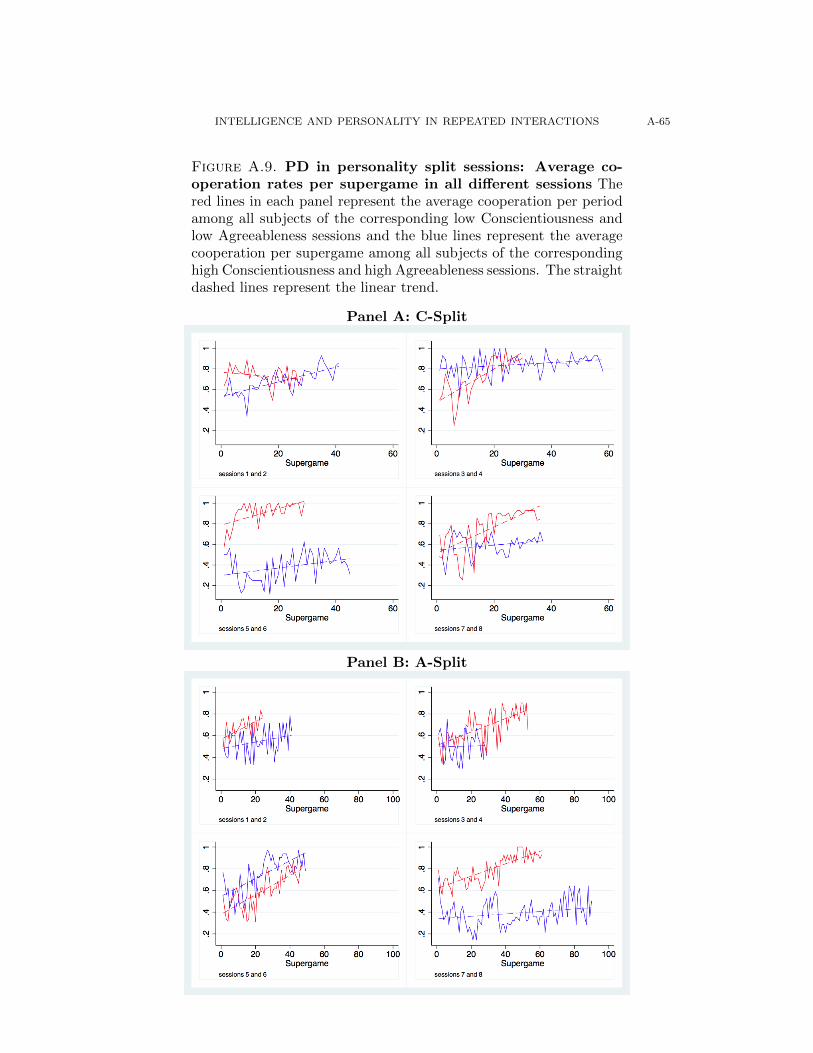
INTELLIGENCE AND PERSONALITY IN REPEATED INTERACTIONS A-65
Figure A.9. PD in personality split sessions: Average co-operation rates per supergame in all different sessions Thered lines in each panel represent the average cooperation per periodamong all subjects of the corresponding low Conscientiousness andlow Agreeableness sessions and the blue lines represent the averagecooperation per supergame among all subjects of the correspondinghigh Conscientiousness and high Agreeableness sessions. The straightdashed lines represent the linear trend.
Panel A: C-Split
Panel B: A-Split
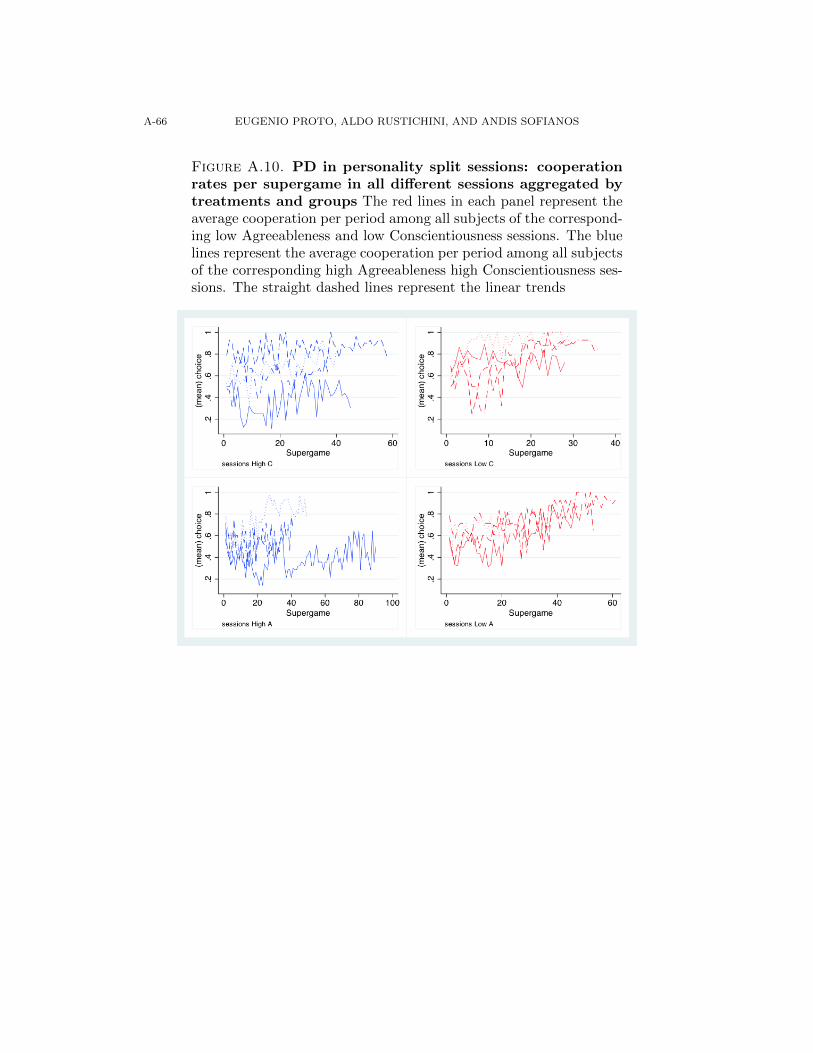
A-66 EUGENIO PROTO, ALDO RUSTICHINI, AND ANDIS SOFIANOS
Figure A.10. PD in personality split sessions: cooperationrates per supergame in all different sessions aggregated bytreatments and groups The red lines in each panel represent theaverage cooperation per period among all subjects of the correspond-ing low Agreeableness and low Conscientiousness sessions. The bluelines represent the average cooperation per period among all subjectsof the corresponding high Agreeableness high Conscientiousness ses-sions. The straight dashed lines represent the linear trends
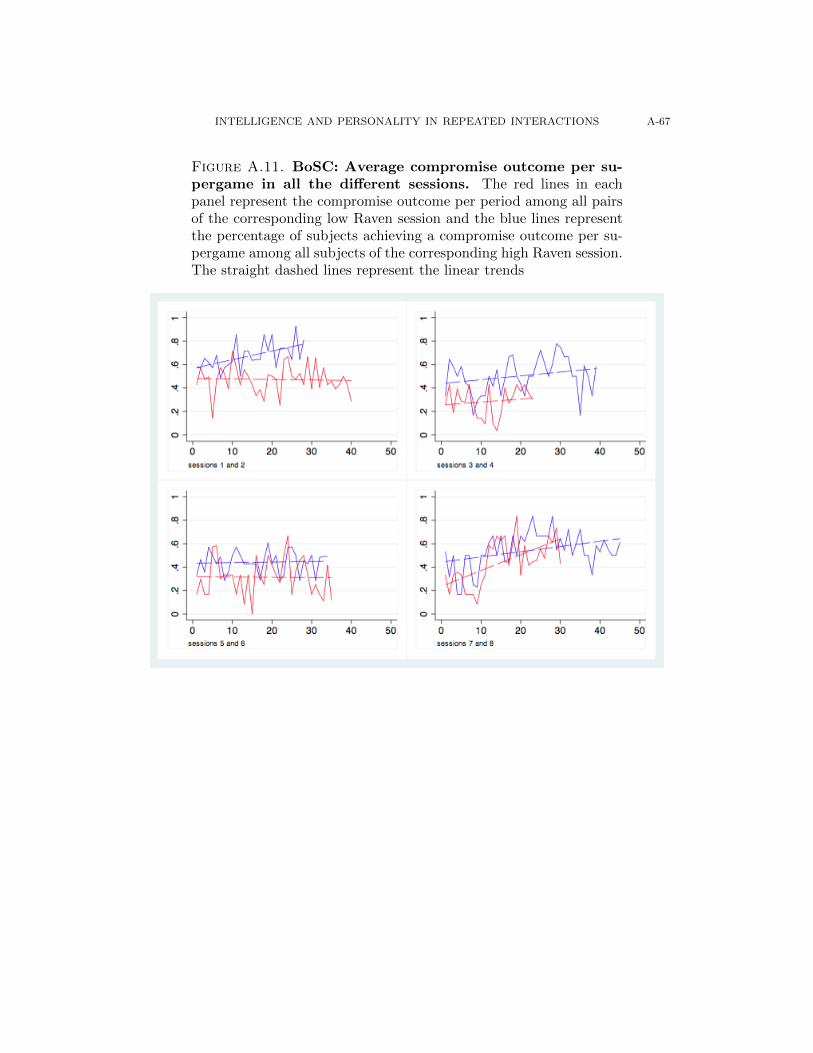
INTELLIGENCE AND PERSONALITY IN REPEATED INTERACTIONS A-67
Figure A.11. BoSC: Average compromise outcome per su-pergame in all the different sessions. The red lines in eachpanel represent the compromise outcome per period among all pairsof the corresponding low Raven session and the blue lines representthe percentage of subjects achieving a compromise outcome per su-pergame among all subjects of the corresponding high Raven session.The straight dashed lines represent the linear trends

A-68 EUGENIO PROTO, ALDO RUSTICHINI, AND ANDIS SOFIANOS
Figure A.12. Average coordination per supergame in all thedifferent sessions of the BoS. The red lines in each panel repre-sent the average coordination outcome per period among all pairsof the corresponding low Raven session and the blue lines representthe average cooperation per period among all subjects of the corre-sponding high Raven session.
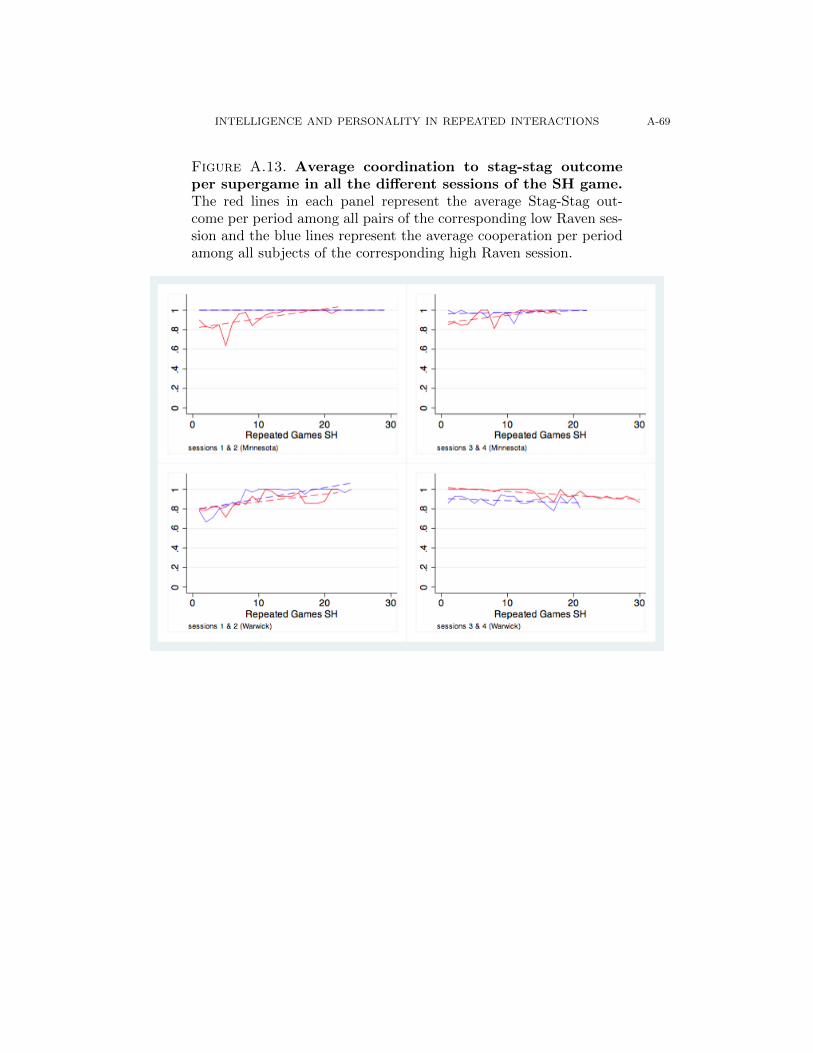
INTELLIGENCE AND PERSONALITY IN REPEATED INTERACTIONS A-69
Figure A.13. Average coordination to stag-stag outcomeper supergame in all the different sessions of the SH game.The red lines in each panel represent the average Stag-Stag out-come per period among all pairs of the corresponding low Raven ses-sion and the blue lines represent the average cooperation per periodamong all subjects of the corresponding high Raven session.

A-70 EUGENIO PROTO, ALDO RUSTICHINI, AND ANDIS SOFIANOS
Appendix H. Additional Analysis
Table A.49. SH: Effects of IQ, Personality, other charac-teristics on stag choices and payoffs. In columns 1 and 2, thedependent variable is average stag choice in all periods; in column3, the dependent variable is average payoff per interaction. OLSestimator; IQ, personality traits and risk aversion are normalised be-tween 0 and 1. Standard errors in brackets; ∗ p − value < 0.1, ∗∗
p− value < 0.05, ∗∗∗ p− value < 0.01
Stag Choice Stag Choice Payoff
All All Allb/se b/se b/se
IQ –0.0030 –0.0049 –1.1041
(0.0620) (0.0717) (2.1645)
Conscientiousness 0.1370 3.6528(0.0834) (2.5169)
Agreeableness 0.1472* 3.2153
(0.0809) (2.4423)Openness –0.1272* –3.5369
(0.0719) (2.1688)
Extraversion 0.0285 1.8740(0.0692) (2.0865)
Neuroticism 0.1570** 4.0834*
(0.0687) (2.0735)Risk Aversion 0.0241 2.4633
(0.0807) (2.4349)Female –0.0006 0.0380
(0.0279) (0.8406)
Age 0.0043 0.0974(0.0028) (0.0849)
# Subjects –0.0008 –0.0024 –0.1576
(0.0052) (0.0056) (0.1689)Av. Round in Supergame –0.0172 –0.0069 –0.2664
(0.0150) (0.0162) (0.4883)
Minnesota 0.0401 0.1005** 2.7324**(0.0249) (0.0432) (1.3038)
Culture Fixed-Effect No Yes Yes
r2 0.037 0.204 0.222N 102 101 101
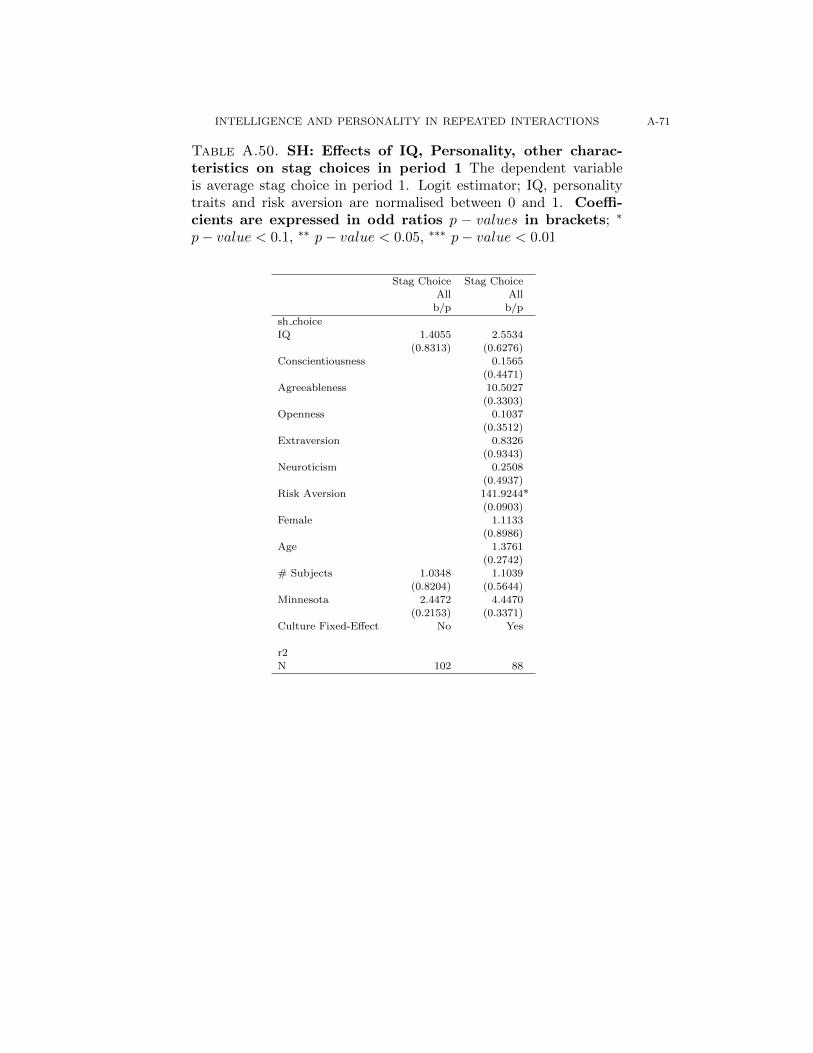
INTELLIGENCE AND PERSONALITY IN REPEATED INTERACTIONS A-71
Table A.50. SH: Effects of IQ, Personality, other charac-teristics on stag choices in period 1 The dependent variableis average stag choice in period 1. Logit estimator; IQ, personalitytraits and risk aversion are normalised between 0 and 1. Coeffi-cients are expressed in odd ratios p − values in brackets; ∗
p− value < 0.1, ∗∗ p− value < 0.05, ∗∗∗ p− value < 0.01
Stag Choice Stag Choice
All Allb/p b/p
sh choice
IQ 1.4055 2.5534
(0.8313) (0.6276)Conscientiousness 0.1565
(0.4471)
Agreeableness 10.5027(0.3303)
Openness 0.1037
(0.3512)Extraversion 0.8326
(0.9343)
Neuroticism 0.2508(0.4937)
Risk Aversion 141.9244*(0.0903)
Female 1.1133
(0.8986)Age 1.3761
(0.2742)
# Subjects 1.0348 1.1039(0.8204) (0.5644)
Minnesota 2.4472 4.4470
(0.2153) (0.3371)Culture Fixed-Effect No Yes
r2N 102 88
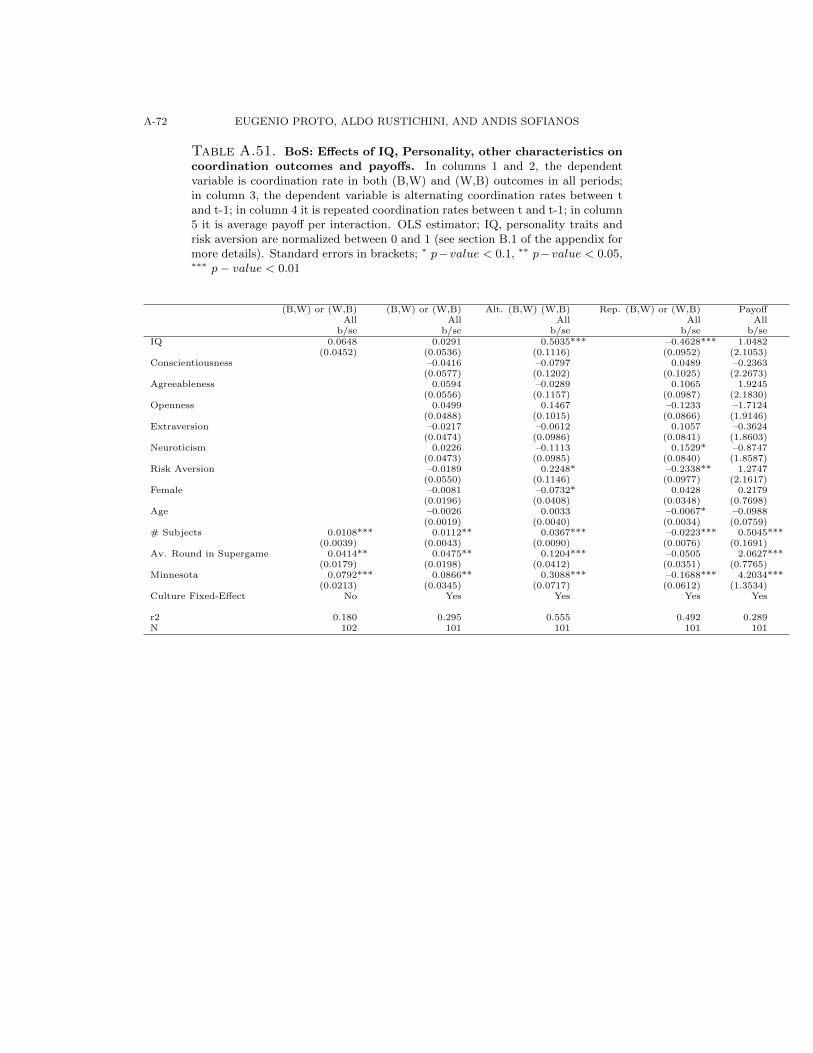
A-72 EUGENIO PROTO, ALDO RUSTICHINI, AND ANDIS SOFIANOS
Table A.51. BoS: Effects of IQ, Personality, other characteristics oncoordination outcomes and payoffs. In columns 1 and 2, the dependentvariable is coordination rate in both (B,W) and (W,B) outcomes in all periods;in column 3, the dependent variable is alternating coordination rates between tand t-1; in column 4 it is repeated coordination rates between t and t-1; in column5 it is average payoff per interaction. OLS estimator; IQ, personality traits andrisk aversion are normalized between 0 and 1 (see section B.1 of the appendix formore details). Standard errors in brackets; ∗ p−value < 0.1, ∗∗ p−value < 0.05,∗∗∗ p− value < 0.01
(B,W) or (W,B) (B,W) or (W,B) Alt. (B,W) (W,B) Rep. (B,W) or (W,B) PayoffAll All All All All
b/se b/se b/se b/se b/seIQ 0.0648 0.0291 0.5035*** –0.4628*** 1.0482
(0.0452) (0.0536) (0.1116) (0.0952) (2.1053)Conscientiousness –0.0416 –0.0797 0.0489 –0.2363
(0.0577) (0.1202) (0.1025) (2.2673)Agreeableness 0.0594 –0.0289 0.1065 1.9245
(0.0556) (0.1157) (0.0987) (2.1830)Openness 0.0499 0.1467 –0.1233 –1.7124
(0.0488) (0.1015) (0.0866) (1.9146)Extraversion –0.0217 –0.0612 0.1057 –0.3624
(0.0474) (0.0986) (0.0841) (1.8603)Neuroticism 0.0226 –0.1113 0.1529* –0.8747
(0.0473) (0.0985) (0.0840) (1.8587)Risk Aversion –0.0189 0.2248* –0.2338** 1.2747
(0.0550) (0.1146) (0.0977) (2.1617)Female –0.0081 –0.0732* 0.0428 0.2179
(0.0196) (0.0408) (0.0348) (0.7698)Age –0.0026 0.0033 –0.0067* –0.0988
(0.0019) (0.0040) (0.0034) (0.0759)# Subjects 0.0108*** 0.0112** 0.0367*** –0.0223*** 0.5045***
(0.0039) (0.0043) (0.0090) (0.0076) (0.1691)Av. Round in Supergame 0.0414** 0.0475** 0.1204*** –0.0505 2.0627***
(0.0179) (0.0198) (0.0412) (0.0351) (0.7765)Minnesota 0.0792*** 0.0866** 0.3088*** –0.1688*** 4.2034***
(0.0213) (0.0345) (0.0717) (0.0612) (1.3534)Culture Fixed-Effect No Yes Yes Yes Yes
r2 0.180 0.295 0.555 0.492 0.289N 102 101 101 101 101

INTELLIGENCE AND PERSONALITY IN REPEATED INTERACTIONS A-73
Table
A.52.
Pri
ncip
al
Facto
rsfr
om
the
Con
scie
nti
ou
sness
qu
est
ion
san
dfa
cets
Th
efa
ctor
anal
ysi
sh
asb
een
per
form
edon
all24
qu
esti
ons
rela
ted
toth
ed
iffer
ent
face
tsof
the
trai
tC
onsc
ienti
ousn
ess,
inth
eIP
IPqu
esti
onn
aire
.T
he
nu
mb
ers
rep
rese
nt
the
coeffi
cien
tsfo
rea
chsu
rvey
item
.T
he
(-)
afte
rth
en
ame
ofth
efa
cet
ind
icat
esre
vers
esc
orin
g.
Facto
rexpla
inin
gcoop
era
tion
Vari
able
Quest
ions
Facets
Facto
r2Facto
r3Facto
r40.1
6936
r30r
Jum
pin
toth
ings
wit
hout
thin
kin
gC
AU
TIO
USN
ESS
(-)
-0.0
9827
-0.3
1706
0.0
6403
0.1
1172
r60r
Make
rash
decis
ions
CA
UT
IOU
SN
ESS
(-)
-0.1
2437
-0.2
0113
-0.0
3344
0.1
0417
r95
Know
how
toget
thin
gs
done
SE
LF
-EF
FIC
AC
Y(+
)0.0
7478
0.0
7065
-0.0
9043
0.1
0015
r115r
Have
diffi
cult
yst
art
ing
task
sSE
LF
-DIS
CIP
LIN
E(-
)0.0
0406
0.0
6284
-0.1
526
0.0
9789
r120r
Act
wit
hout
thin
kin
gC
AU
TIO
USN
ESS
(-)
-0.0
7915
-0.1
6409
0.0
6176
0.0
9332
r90r
Rush
into
thin
gs
CA
UT
IOU
SN
ESS
(-)
-0.1
2886
-0.1
7079
0.0
7351
0.0
929
r20
Work
hard
AC
HIE
VE
ME
NT
-ST
RIV
ING
(+)
0.1
2668
0.0
1694
-0.1
1319
0.0
8838
r55
Carr
yout
my
pla
ns
SE
LF
-DIS
CIP
LIN
E(+
)0.1
4733
0.0
6219
-0.0
0873
0.0
8474
r70r
Leave
am
ess
inm
yro
om
OR
DE
RL
INE
SS
(-)
-0.1
8113
0.2
5731
0.0
5986
0.0
7732
r50
Do
more
than
what’
sexp
ecte
dof
me
AC
HIE
VE
ME
NT
-ST
RIV
ING
(+)
0.0
8397
0.0
7651
-0.1
0318
0.0
7667
r65
Handle
task
ssm
ooth
lySE
LF
-EF
FIC
AC
Y0.0
8759
0.0
4807
0.0
2386
0.0
7027
r40r
Oft
en
forg
et
toput
thin
gs
back
inth
eir
pro
per
pla
ce
OR
DE
RL
INE
SS
-0.2
0061
0.2
2215
0.0
8396
0.0
6834
r80r
Do
just
enough
work
toget
by
AC
HIE
VE
ME
NT
-ST
RIV
ING
0.0
022
0.0
2772
-0.1
9374
0.0
6518
r25
Am
alw
ays
pre
pare
dSE
LF
-DIS
CIP
LIN
E0.0
0164
0.0
2987
-0.1
1166
0.0
6321
r5B
reak
my
pro
mis
es
DU
TIF
UL
NE
SS
0.1
3357
0.0
6436
-0.0
5748
0.0
57
r105r
Bre
ak
my
pro
mis
es
DU
TIF
UL
NE
SS
0.1
0305
0.0
2848
0.2
4978
0.0
5611
r85r
Com
ple
teta
sks
success
fully
SE
LF
-EF
FIC
AC
Y-0
.00676
0.0
0904
-0.0
2999
0.0
5423
r35
Excel
inw
hat
Ido
SE
LF
-EF
FIC
AC
Y0.0
8825
0.0
1806
-0.0
927
0.0
5423
r110r
Put
litt
leti
me
and
eff
ort
into
my
work
AC
HIE
VE
ME
NT
-ST
RIV
ING
0.0
2617
0.0
1698
-0.0
9782
0.0
539
r100r
Have
diffi
cult
yst
art
ing
task
sSE
LF
-DIS
CIP
LIN
E-0
.15508
0.1
6244
0.1
7962
0.0
4996
r15
Keep
my
pro
mis
es
DU
TIF
UL
NE
SS
0.2
2442
0.0
2705
0.3
9991
0.0
4371
r45
Tell
the
truth
DU
TIF
UL
NE
SS
0.0
7279
-0.0
0321
0.1
8759
0.0
2807
r75r
Bre
ak
rule
sD
UT
IFU
LN
ESS
-0.0
2934
-0.1
1463
0.0
4997
0.0
2477
r10
Lik
eto
tidy
up
OR
DE
RL
INE
SS
-0.0
8737
0.2
0324
0.0
206
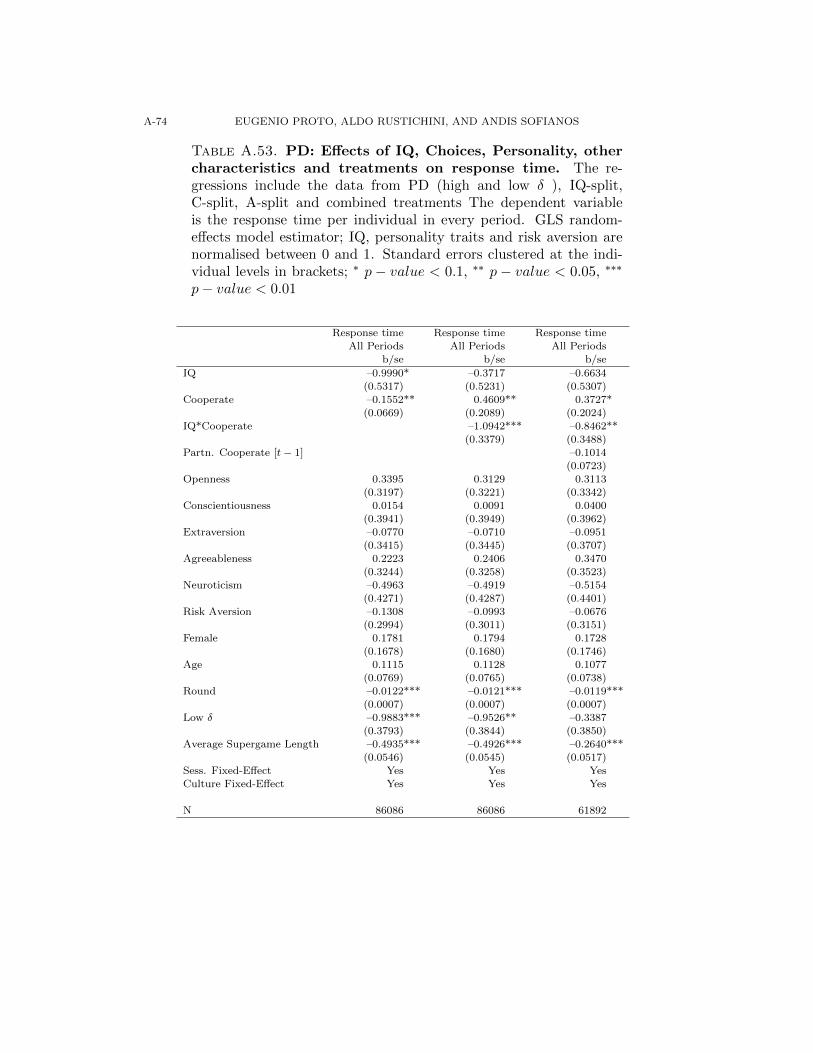
A-74 EUGENIO PROTO, ALDO RUSTICHINI, AND ANDIS SOFIANOS
Table A.53. PD: Effects of IQ, Choices, Personality, othercharacteristics and treatments on response time. The re-gressions include the data from PD (high and low δ ), IQ-split,C-split, A-split and combined treatments The dependent variableis the response time per individual in every period. GLS random-effects model estimator; IQ, personality traits and risk aversion arenormalised between 0 and 1. Standard errors clustered at the indi-vidual levels in brackets; ∗ p − value < 0.1, ∗∗ p − value < 0.05, ∗∗∗
p− value < 0.01
Response time Response time Response time
All Periods All Periods All Periods
b/se b/se b/se
IQ –0.9990* –0.3717 –0.6634(0.5317) (0.5231) (0.5307)
Cooperate –0.1552** 0.4609** 0.3727*
(0.0669) (0.2089) (0.2024)IQ*Cooperate –1.0942*** –0.8462**
(0.3379) (0.3488)
Partn. Cooperate [t− 1] –0.1014(0.0723)
Openness 0.3395 0.3129 0.3113
(0.3197) (0.3221) (0.3342)Conscientiousness 0.0154 0.0091 0.0400
(0.3941) (0.3949) (0.3962)
Extraversion –0.0770 –0.0710 –0.0951(0.3415) (0.3445) (0.3707)
Agreeableness 0.2223 0.2406 0.3470(0.3244) (0.3258) (0.3523)
Neuroticism –0.4963 –0.4919 –0.5154
(0.4271) (0.4287) (0.4401)Risk Aversion –0.1308 –0.0993 –0.0676
(0.2994) (0.3011) (0.3151)
Female 0.1781 0.1794 0.1728(0.1678) (0.1680) (0.1746)
Age 0.1115 0.1128 0.1077
(0.0769) (0.0765) (0.0738)Round –0.0122*** –0.0121*** –0.0119***
(0.0007) (0.0007) (0.0007)
Low δ –0.9883*** –0.9526** –0.3387(0.3793) (0.3844) (0.3850)
Average Supergame Length –0.4935*** –0.4926*** –0.2640***(0.0546) (0.0545) (0.0517)
Sess. Fixed-Effect Yes Yes Yes
Culture Fixed-Effect Yes Yes Yes
N 86086 86086 61892
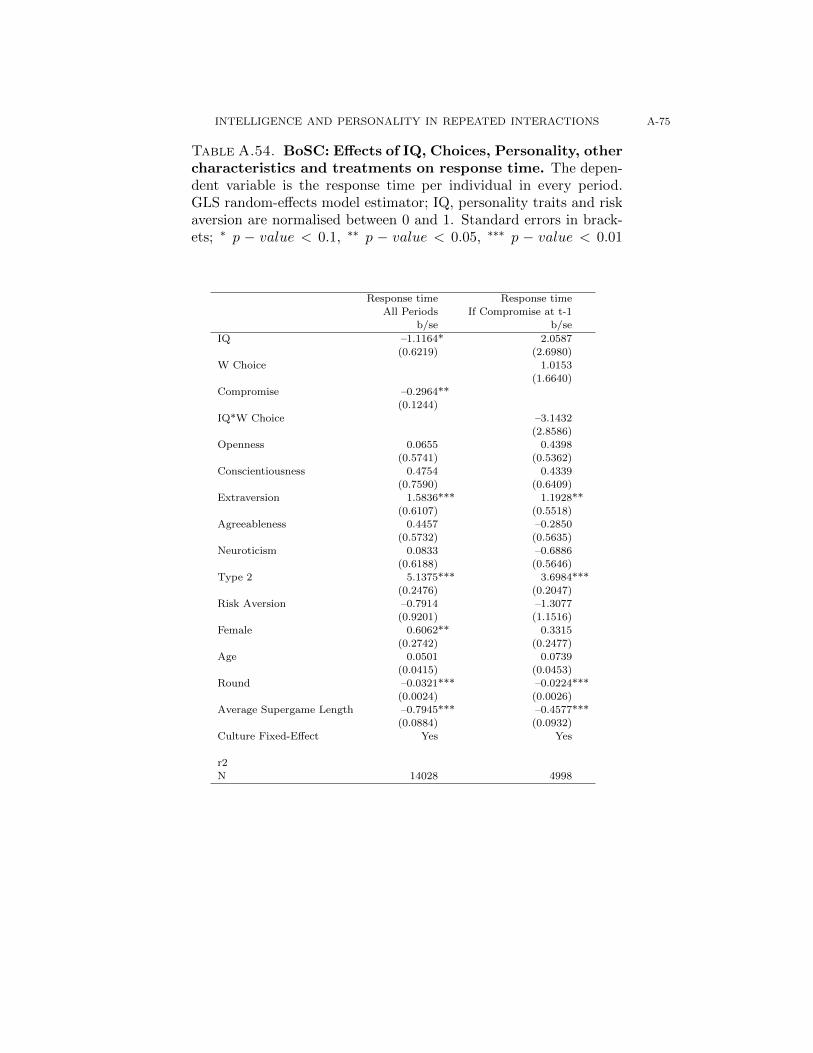
INTELLIGENCE AND PERSONALITY IN REPEATED INTERACTIONS A-75
Table A.54. BoSC: Effects of IQ, Choices, Personality, othercharacteristics and treatments on response time. The depen-dent variable is the response time per individual in every period.GLS random-effects model estimator; IQ, personality traits and riskaversion are normalised between 0 and 1. Standard errors in brack-ets; ∗ p − value < 0.1, ∗∗ p − value < 0.05, ∗∗∗ p − value < 0.01
Response time Response time
All Periods If Compromise at t-1
b/se b/se
IQ –1.1164* 2.0587
(0.6219) (2.6980)W Choice 1.0153
(1.6640)Compromise –0.2964**
(0.1244)
IQ*W Choice –3.1432(2.8586)
Openness 0.0655 0.4398
(0.5741) (0.5362)Conscientiousness 0.4754 0.4339
(0.7590) (0.6409)
Extraversion 1.5836*** 1.1928**(0.6107) (0.5518)
Agreeableness 0.4457 –0.2850
(0.5732) (0.5635)Neuroticism 0.0833 –0.6886
(0.6188) (0.5646)
Type 2 5.1375*** 3.6984***(0.2476) (0.2047)
Risk Aversion –0.7914 –1.3077(0.9201) (1.1516)
Female 0.6062** 0.3315
(0.2742) (0.2477)Age 0.0501 0.0739
(0.0415) (0.0453)
Round –0.0321*** –0.0224***(0.0024) (0.0026)
Average Supergame Length –0.7945*** –0.4577***
(0.0884) (0.0932)Culture Fixed-Effect Yes Yes
r2N 14028 4998

A-76 EUGENIO PROTO, ALDO RUSTICHINI, AND ANDIS SOFIANOS
Figure A.14. PD: Response Time in the different treat-ments by Personality groups and choice C denotes the Co-operation choice, D Defection. The bands represent 95% confidenceintervals.

INTELLIGENCE AND PERSONALITY IN REPEATED INTERACTIONS A-77
TableA.55.
Ind
ivid
ual
stra
tegie
sin
the
diff
ere
nt
IQse
ssio
ns
inth
ela
st5,
firs
t5
an
dla
test
5S
Gs
of
equ
ivale
nt
exp
eri
en
ce
(PD
wit
hH
igh
Conti
nu
ati
on
Pro
bab
ilit
y).
Th
eeq
uiv
ale
nt
exp
erie
nce
SG
sw
ere
iden
tifi
edby
fin
din
gth
ela
st5
SG
sth
atw
ould
incl
ud
eal
lse
ssio
ns
consi
der
edac
ross
the
trea
tmen
tth
us
ensu
rin
gsi
mil
arex
per
ience
inte
rms
ofga
me
len
gth
.E
ach
coeffi
cien
tre
pre
sents
the
pro
bab
ilit
yes
tim
ated
usi
ng
ML
ofth
eco
rres
pon
din
gst
rate
gy.
Std
erro
ris
rep
orte
din
bra
cket
s.G
amm
ais
the
erro
rco
effici
ent
that
ises
tim
ated
for
the
choi
cefu
nct
ion
use
din
the
ML
and
bet
ais
the
pro
bab
ilit
yes
tim
ated
that
the
choi
ceby
asu
bje
ctis
equ
alto
wh
atth
est
rate
gyp
resc
rib
es.†
Tes
tseq
ual
ity
to0
usi
ng
the
Wal
dte
st:∗p−values<
0.1,∗∗p−values<
0.0
5∗∗
,p−values<
0.01∗∗∗
IQSes
sion
Hig
hL
owH
igh
Low
Hig
hL
owR
epea
ted
Gam
esL
ast
5L
ast
5F
irst
5F
irst
5E
quiv
.E
xp
erie
nce
Equiv
.E
xp
erie
nce
Str
ate
gy
Alw
ays
Coop
erate
0.0
886
0.0
267
00.0
793
0.0
441
0.0
754
(0.1
059)
(0.0
542)
(0.0
187)
(0.0
626)
(0.0
670)
(0.0
604)
Alw
ays
Def
ect
0.0
417
0.4
434***
0.3
880***
0.3
651***
0.2
121***
0.4
270***
(0.0
353)
(0.1
027)
(0.0
909)
(0.0
836)
(0.0
814)
(0.0
983)
Gri
maft
er1
D0.3
704**
0.0
807
0.3
899***
0.2
109**
0.2
440
0.2
091**
(0.1
458)
(0.0
618)
(0.1
120)
(0.1
026)
(0.1
686)
(0.0
881)
Tit
for
Tat
(Cfirs
t)0.2
976**
0.4
492***
0.2
221**
0.3
132***
0.4
998***
0.2
885***
(0.1
417)
(0.0
807)
(0.1
048)
(0.0
964)
(0.1
436)
(0.0
963)
Win
Sta
yL
ose
Shif
t0.0
701
00
0.0
315
00
(0.1
295)
(0.0
267)
(0.0
372)
(0.0
404)
(0.0
043)
(0.0
157)
Tit
For
Tat
(aft
erD
CC
)††
0.1
315
00
00
0G
am
ma
0.3
249***
0.4
154***
0.5
402***
0.5
813***
0.3
137***
0.4
204***
(0.0
764)
(0.0
378)
(0.0
487)
(0.0
682)
(0.0
360)
(0.0
433)
bet
a0.9
56
0.9
17
0.8
64
0.8
48
0.9
60
0.9
15
Aver
age
Rounds
4.8
35.1
32.2
83.6
03.4
45.2
9N
.Sub
ject
s48
64
66
64
66
64
Obse
rvati
ons
1,0
90
1,6
76
966
1,2
88
1,2
04
1,4
60
†W
hen
bet
ais
close
to1/2,
choic
esare
esse
nti
aly
random
and
when
itis
close
to1
then
choic
esare
alm
ost
per
fect
lypre
dic
ted.
††T
itfo
rT
at
(aft
erD
CC
)st
ands
for
the
Tit
for
Tat
stra
tegy
that
punis
hes
aft
er1
def
ecti
on
but
only
retu
rns
toco
op
erati
on
aft
erobse
rvin
gco
op
erati
on
twic
efr
om
the
part
ner
.
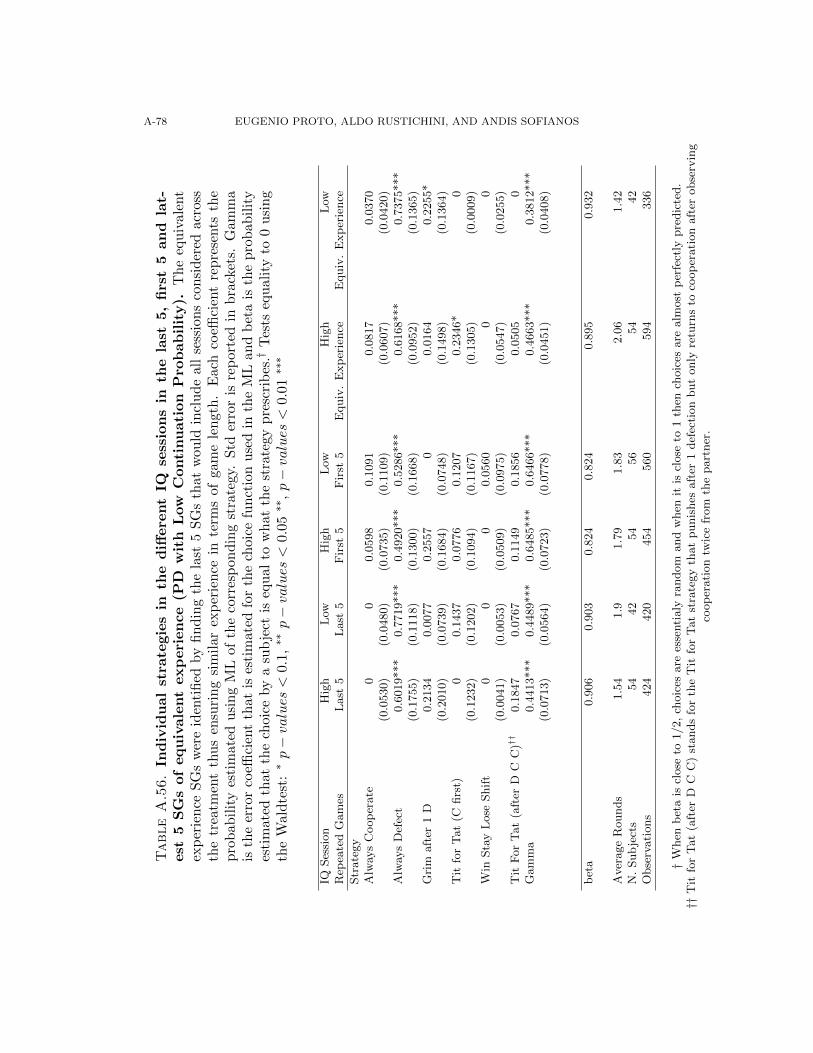
A-78 EUGENIO PROTO, ALDO RUSTICHINI, AND ANDIS SOFIANOS
Table
A.56.
Ind
ivid
ual
stra
tegie
sin
the
diff
ere
nt
IQse
ssio
ns
inth
ela
st5,
firs
t5
an
dla
t-est
5S
Gs
of
equ
ivale
nt
exp
eri
en
ce
(PD
wit
hL
ow
Conti
nu
ati
on
Pro
bab
ilit
y).
Th
eeq
uiv
alen
tex
per
ien
ceS
Gs
wer
eid
enti
fied
by
fin
din
gth
ela
st5
SG
sth
atw
ould
incl
ud
eal
lse
ssio
ns
consi
der
edac
ross
the
trea
tmen
tth
us
ensu
rin
gsi
mil
arex
per
ience
inte
rms
ofga
me
len
gth
.E
ach
coeffi
cien
tre
pre
sents
the
pro
bab
ilit
yes
tim
ated
usi
ng
ML
ofth
eco
rres
pon
din
gst
rate
gy.
Std
erro
ris
rep
orte
din
bra
cket
s.G
amm
ais
the
erro
rco
effici
ent
that
ises
tim
ated
for
the
choi
cefu
nct
ion
use
din
the
ML
and
bet
ais
the
pro
bab
ilit
yes
tim
ated
that
the
choi
ceby
asu
bje
ctis
equ
alto
wh
atth
est
rate
gyp
resc
rib
es.†
Tes
tseq
ual
ity
to0
usi
ng
the
Wal
dte
st:∗p−values<
0.1,∗∗p−values<
0.0
5∗∗
,p−values<
0.01∗∗∗
IQSes
sion
Hig
hL
owH
igh
Low
Hig
hL
owR
epea
ted
Gam
esL
ast
5L
ast
5F
irst
5F
irst
5E
quiv
.E
xp
erie
nce
Equiv
.E
xp
erie
nce
Str
ate
gy
Alw
ays
Coop
erate
00
0.0
598
0.1
091
0.0
817
0.0
370
(0.0
530)
(0.0
480)
(0.0
735)
(0.1
109)
(0.0
607)
(0.0
420)
Alw
ays
Def
ect
0.6
019***
0.7
719***
0.4
920***
0.5
286***
0.6
168***
0.7
375***
(0.1
755)
(0.1
118)
(0.1
300)
(0.1
668)
(0.0
952)
(0.1
365)
Gri
maft
er1
D0.2
134
0.0
077
0.2
557
00.0
164
0.2
255*
(0.2
010)
(0.0
739)
(0.1
684)
(0.0
748)
(0.1
498)
(0.1
364)
Tit
for
Tat
(Cfirs
t)0
0.1
437
0.0
776
0.1
207
0.2
346*
0(0
.1232)
(0.1
202)
(0.1
094)
(0.1
167)
(0.1
305)
(0.0
009)
Win
Sta
yL
ose
Shif
t0
00
0.0
560
00
(0.0
041)
(0.0
053)
(0.0
509)
(0.0
975)
(0.0
547)
(0.0
255)
Tit
For
Tat
(aft
erD
CC
)††
0.1
847
0.0
767
0.1
149
0.1
856
0.0
505
0G
am
ma
0.4
413***
0.4
489***
0.6
485***
0.6
466***
0.4
663***
0.3
812***
(0.0
713)
(0.0
564)
(0.0
723)
(0.0
778)
(0.0
451)
(0.0
408)
bet
a0.9
06
0.9
03
0.8
24
0.8
24
0.8
95
0.9
32
Aver
age
Rounds
1.5
41.9
1.7
91.8
32.0
61.4
2N
.Sub
ject
s54
42
54
56
54
42
Obse
rvati
ons
424
420
454
560
594
336
†W
hen
bet
ais
close
to1/2,
choic
esare
esse
nti
aly
random
and
when
itis
close
to1
then
choic
esare
alm
ost
per
fect
lypre
dic
ted.
††T
itfo
rT
at
(aft
erD
CC
)st
ands
for
the
Tit
for
Tat
stra
tegy
that
punis
hes
aft
er1
def
ecti
on
but
only
retu
rns
toco
op
erati
on
aft
erobse
rvin
gco
op
erati
on
twic
efr
om
the
part
ner
.

INTELLIGENCE AND PERSONALITY IN REPEATED INTERACTIONS A-79
TableA.57.
Ind
ivid
ual
stra
tegie
sin
the
diff
ere
nt
IQp
art
itio
ns
inth
ela
st5,
firs
t5
an
dla
test
5S
Gs
of
equ
ivale
nt
exp
eri
en
ce
(PD
Com
bin
ed
).T
he
equ
ival
ent
exp
erie
nce
SG
sw
ere
iden
tifi
edby
fin
din
gth
ela
st5
SG
sth
atw
ould
incl
ud
eal
lse
ssio
ns
con
sid
ered
acro
ssth
etr
eatm
ent
thu
sen
suri
ng
sim
ilar
exp
erie
nce
inte
rms
ofga
me
len
gth
.E
ach
coeffi
cien
tre
pre
sents
the
pro
bab
ilit
yes
tim
ated
usi
ng
ML
ofth
eco
rres
pon
din
gst
rate
gy.
Std
erro
ris
rep
orte
din
bra
cket
s.G
amm
ais
the
erro
rco
effici
ent
that
ises
tim
ate
dfo
rth
ech
oice
fun
ctio
nu
sed
inth
eM
Lan
db
eta
isth
ep
rob
abilit
yes
tim
ated
that
the
choi
ceby
asu
bje
ctis
equ
alto
wh
atth
est
rate
gyp
resc
rib
es.†
Tes
tseq
ual
ity
to0
usi
ng
the
Wal
dte
st:∗p−values<
0.1,∗∗
p−values<
0.0
5∗∗
,p−values<
0.01∗∗∗
IQP
art
itio
nH
igh
Low
Hig
hL
owH
igh
Low
Rep
eate
dG
am
esL
ast
5L
ast
5F
irst
5F
irst
5E
quiv
.E
xp
erie
nce
Equiv
.E
xp
erie
nce
Str
ate
gy
Alw
ays
Coop
erate
0.0
544
0.1
026
0.0
138
0.0
502
0.0
385
0(0
.0465)
(0.0
778)
(0.0
512)
(0.0
577)
(0.0
806)
(0.0
301)
Alw
ays
Def
ect
0.0
755
0.2
353***
0.1
896***
0.3
337***
0.0
942
0.2
897***
(0.0
628)
(0.0
782)
(0.0
699)
(0.0
685)
(0.0
632)
(0.0
826)
Gri
maft
er1
D0.3
337
0.4
015***
0.2
145**
0.2
412**
0.0
957
0.3
029**
(0.2
897)
(0.1
301)
(0.0
855)
(0.1
025)
(0.1
584)
(0.1
274)
Tit
for
Tat
(Cfirs
t)0.3
115*
0.1
859
0.5
822***
0.2
404**
0.5
773**
0.3
097**
(0.1
699)
(0.1
495)
(0.0
913)
(0.1
077)
(0.2
239)
(0.1
473)
Win
Sta
yL
ose
Shif
t0
00
00
0(0
.0000)
(0.0
277)
(0.0
020)
(0.0
074)
(0.0
017)
(0.0
042)
Tit
For
Tat
(aft
erD
CC
)††
0.2
249
0.0
748
00.1
345
0.1
944
0.0
977
Gam
ma
0.2
713***
0.3
719***
0.5
059***
0.6
397***
0.3
007***
0.3
978***
(0.0
350)
(0.0
521)
(0.0
478)
(0.0
768)
(0.0
510)
(0.0
406)
bet
a0.9
76
0.9
36
0.8
78
0.8
27
0.9
65
0.9
25
Aver
age
Rounds
6.2
16.2
54.1
44.1
64.7
44.8
4N
.Sub
ject
s53
57
53
57
53
57
Obse
rvati
ons
1,3
66
1,4
80
1,3
67
1,4
73
1,0
36
1,1
28
†W
hen
bet
ais
close
to1/2,
choic
esare
esse
nti
aly
random
and
when
itis
close
to1
then
choic
esare
alm
ost
per
fect
lypre
dic
ted.
††T
itfo
rT
at
(aft
erD
CC
)st
ands
for
the
Tit
for
Tat
stra
tegy
that
punis
hes
aft
er1
def
ecti
on
but
only
retu
rns
toco
op
erati
on
aft
erobse
rvin
gco
op
erati
on
twic
efr
om
the
part
ner
.
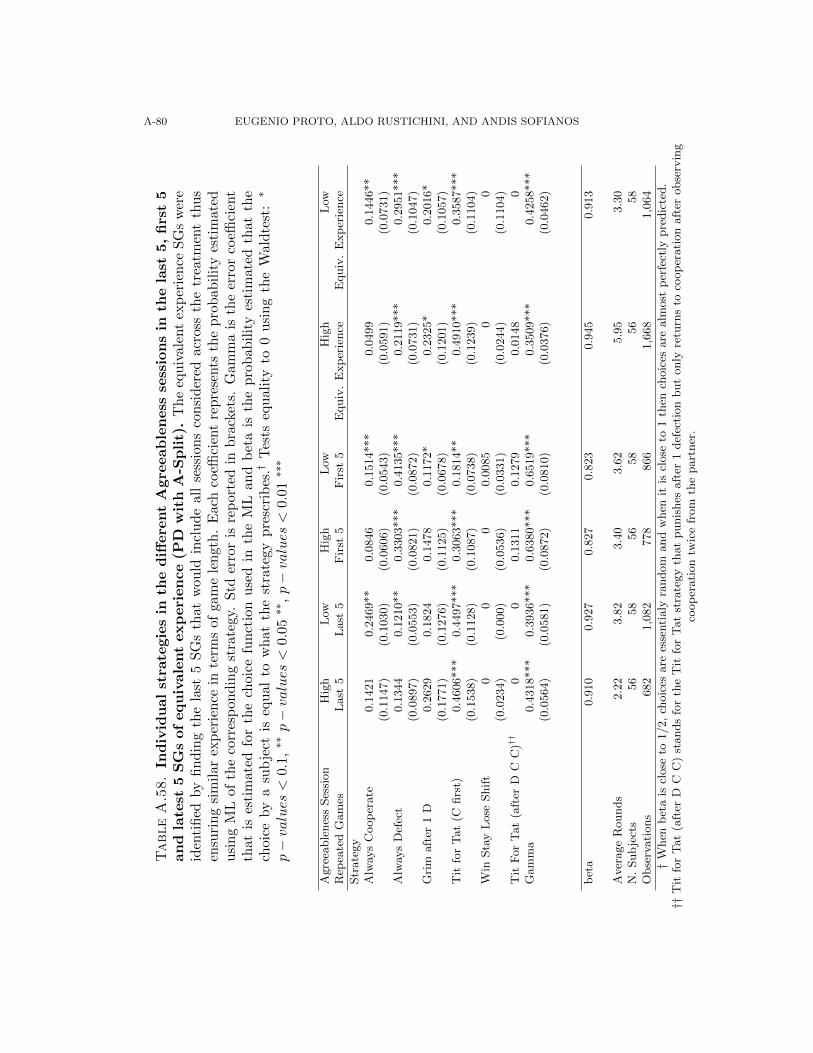
A-80 EUGENIO PROTO, ALDO RUSTICHINI, AND ANDIS SOFIANOS
TableA.58.
Ind
ivid
ual
stra
tegie
sin
the
diff
ere
nt
Agre
eab
len
ess
sess
ion
sin
the
last
5,
firs
t5
an
dla
test
5S
Gs
of
equ
ivale
nt
exp
eri
en
ce
(PD
wit
hA
-Sp
lit)
.T
he
equ
ival
ent
exp
erie
nce
SG
sw
ere
iden
tifi
edby
fin
din
gth
ela
st5
SG
sth
atw
ould
incl
ud
eal
lse
ssio
ns
con
sid
ered
acro
ssth
etr
eatm
ent
thus
ensu
rin
gsi
mil
arex
per
ien
cein
term
sof
gam
ele
ngt
h.
Eac
hco
effici
ent
rep
rese
nts
the
pro
bab
ilit
yes
tim
ated
usi
ng
ML
ofth
eco
rres
pon
din
gst
rate
gy.
Std
erro
ris
rep
orte
din
bra
cket
s.G
amm
ais
the
erro
rco
effici
ent
that
ises
tim
ated
for
the
choi
cefu
nct
ion
use
din
the
ML
and
bet
ais
the
pro
bab
ilit
yes
tim
ated
that
the
choi
ceby
asu
bje
ctis
equ
alto
wh
atth
est
rate
gyp
resc
rib
es.†
Tes
tseq
ual
ity
to0
usi
ng
the
Wal
dte
st:∗
p−values<
0.1
,∗∗p−values<
0.0
5∗∗
,p−values<
0.0
1∗∗∗
Agre
eable
nes
sSes
sion
Hig
hL
owH
igh
Low
Hig
hL
owR
epea
ted
Gam
esL
ast
5L
ast
5F
irst
5F
irst
5E
quiv
.E
xp
erie
nce
Equiv
.E
xp
erie
nce
Str
ate
gy
Alw
ays
Coop
erate
0.1
421
0.2
469**
0.0
846
0.1
514***
0.0
499
0.1
446**
(0.1
147)
(0.1
030)
(0.0
606)
(0.0
543)
(0.0
591)
(0.0
731)
Alw
ays
Def
ect
0.1
344
0.1
210**
0.3
303***
0.4
135***
0.2
119***
0.2
951***
(0.0
897)
(0.0
553)
(0.0
821)
(0.0
872)
(0.0
731)
(0.1
047)
Gri
maft
er1
D0.2
629
0.1
824
0.1
478
0.1
172*
0.2
325*
0.2
016*
(0.1
771)
(0.1
276)
(0.1
125)
(0.0
678)
(0.1
201)
(0.1
057)
Tit
for
Tat
(Cfirs
t)0.4
606***
0.4
497***
0.3
063***
0.1
814**
0.4
910***
0.3
587***
(0.1
538)
(0.1
128)
(0.1
087)
(0.0
738)
(0.1
239)
(0.1
104)
Win
Sta
yL
ose
Shif
t0
00
0.0
085
00
(0.0
234)
(0.0
00)
(0.0
536)
(0.0
331)
(0.0
244)
(0.1
104)
Tit
For
Tat
(aft
erD
CC
)††
00
0.1
311
0.1
279
0.0
148
0G
am
ma
0.4
318***
0.3
936***
0.6
380***
0.6
519***
0.3
509***
0.4
258***
(0.0
564)
(0.0
581)
(0.0
872)
(0.0
810)
(0.0
376)
(0.0
462)
bet
a0.9
10
0.9
27
0.8
27
0.8
23
0.9
45
0.9
13
Aver
age
Rounds
2.2
23.8
23.4
03.6
25.9
53.3
0N
.Sub
ject
s56
58
56
58
56
58
Obse
rvati
ons
682
1,0
82
778
866
1,6
68
1,0
64
†W
hen
bet
ais
close
to1/2,
choic
esare
esse
nti
aly
random
and
when
itis
close
to1
then
choic
esare
alm
ost
per
fect
lypre
dic
ted.
††T
itfo
rT
at
(aft
erD
CC
)st
ands
for
the
Tit
for
Tat
stra
tegy
that
punis
hes
aft
er1
def
ecti
on
but
only
retu
rns
toco
op
erati
on
aft
erobse
rvin
gco
op
erati
on
twic
efr
om
the
part
ner
.

INTELLIGENCE AND PERSONALITY IN REPEATED INTERACTIONS A-81
TableA.59.
Ind
ivid
ualst
rate
gie
sin
the
diff
ere
nt
Con
scie
nti
ou
sness
sess
ion
sin
the
last
5,fi
rst
5an
dla
test
5S
Gs
of
equ
ivale
nt
exp
eri
en
ce
(PD
wit
hC
-sp
lit)
.T
he
equ
ival
ent
exp
erie
nce
SG
sw
ere
iden
tifi
edby
fin
din
gth
ela
st5
SG
sth
atw
ould
incl
ud
eal
lse
ssio
ns
con
sid
ered
acro
ssth
etr
eatm
ent
thu
sen
suri
ng
sim
ilar
exp
erie
nce
inte
rms
ofga
me
len
gth
.E
ach
coeffi
cien
tre
pre
sents
the
pro
bab
ilit
yes
tim
ated
usi
ng
ML
ofth
eco
rres
pon
din
gst
rate
gy.
Std
erro
ris
rep
orte
din
bra
cket
s.G
amm
ais
the
erro
rco
effici
ent
that
ises
tim
ated
for
the
choi
cefu
nct
ion
use
din
the
ML
and
bet
ais
the
pro
bab
ilit
yes
tim
ated
that
the
choi
ceby
asu
bje
ctis
equ
alto
wh
atth
est
rate
gyp
resc
rib
es.†
Tes
tseq
ual
ity
to0
usi
ng
the
Wal
dte
st:∗
p−values<
0.1
,∗∗p−values<
0.0
5∗∗
,p−values<
0.0
1∗∗∗
Consc
ienti
ousn
ess
Ses
sion
Hig
hL
owH
igh
Low
Hig
hL
owR
epea
ted
Gam
esL
ast
5L
ast
5F
irst
5F
irst
5E
quiv
.E
xp
erie
nce
Equiv
.E
xp
erie
nce
Str
ate
gy
Alw
ays
Coop
erate
0.1
726*
0.1
572
0.0
883
0.0
236
0.0
701
0.1
184
(0.1
022)
(0.1
263)
(0.0
709)
(0.0
697)
(0.0
606)
(0.1
018)
Alw
ays
Def
ect
0.2
048**
0.0
500
0.3
108***
0.1
215*
0.2
293***
0.0
500
(0.0
808)
(0.0
364)
(0.0
990)
(0.0
687)
(0.0
787)
(0.0
356)
Gri
maft
er1
D0.0
960
0.3
110
0.0
886
0.3
358**
0.1
523*
0.4
216*
(0.0
944)
(0.2
350)
(0.0
990)
(0.1
401)
(0.0
874)
(0.2
197)
Tit
for
Tat
(Cfirs
t)0.4
138***
0.1
241
0.3
561***
0.4
409***
0.5
112***
0.2
371
(0.1
270)
(0.1
752)
(0.1
206)
(0.1
190)
(0.1
174)
(0.2
132)
Win
Sta
yL
ose
Shif
t0.0
211
0.0
146
00.0
782
00.0
246
(0.0
368)
(0.0
530)
(0.0
529)
(0.0
843)
(0.0
049)
(0.0
687)
Tit
For
Tat
(aft
erD
CC
)††
0.0
918
0.3
430*
0.1
562
00.0
371
0.1
482
Gam
ma
0.3
872***
0.3
060***
0.5
574***
0.5
298***
0.4
210***
0.2
817***
(0.0
400)
(0.0
448)
(0.0
539)
(0.1
024)
(0.0
396)
(0.0
380)
bet
a0.9
30
0.9
63
0.8
57
0.8
68
0.9
15
0.9
72
Aver
age
Rounds
4.7
85.9
05.1
44.9
33.9
64.8
8N
.Sub
ject
s62
60
62
60
62
60
Obse
rvati
ons
1,4
60
1,8
08
980
1,1
90
1,4
76
1,4
62
†W
hen
bet
ais
close
to1/2,
choic
esare
esse
nti
aly
random
and
when
itis
close
to1
then
choic
esare
alm
ost
per
fect
lypre
dic
ted.
††T
itfo
rT
at
(aft
erD
CC
)st
ands
for
the
Tit
for
Tat
stra
tegy
that
punis
hes
aft
er1
def
ecti
on
but
only
retu
rns
toco
op
erati
on
aft
erobse
rvin
gco
op
erati
on
twic
efr
om
the
part
ner
.

A-82 EUGENIO PROTO, ALDO RUSTICHINI, AND ANDIS SOFIANOS
TableA.60.
Ind
ivid
ual
stra
tegie
sin
the
diff
ere
nt
IQse
ssio
ns
inth
ela
st5,
firs
t5
an
dla
test
5S
Gs
of
equ
ivale
nt
exp
eri
en
ce
(SH
).T
he
equ
ival
ent
exp
erie
nce
SG
sw
ere
iden
tifi
edby
fin
din
gth
ela
st5
SG
sth
atw
ould
incl
ud
eal
lse
ssio
ns
con
sid
ered
acro
ssth
etr
eatm
ent
thu
sen
suri
ng
sim
ilar
exp
erie
nce
inte
rms
ofga
me
len
gth
.E
ach
coeffi
cien
tre
pre
sents
the
pro
bab
ilit
yes
tim
ated
usi
ng
ML
ofth
eco
rres
pon
din
gst
rate
gy.
Std
erro
ris
rep
orte
din
bra
cket
s.G
amm
ais
the
erro
rco
effici
ent
that
ises
tim
ated
for
the
choic
efu
nct
ion
use
din
the
ML
and
bet
ais
the
pro
bab
ilit
yes
tim
ated
that
the
choi
ceby
asu
bje
ctis
equ
alto
wh
at
the
stra
tegy
pre
scri
bes
.†T
ests
equ
alit
yto
0u
sin
gth
eW
ald
test
:∗p−values<
0.1
,∗∗p−values<
0.05
∗∗,p−values<
0.01∗∗∗
IQSes
sion
Hig
hL
owH
igh
Low
Hig
hL
owR
epea
ted
Gam
esL
ast
5L
ast
5F
irst
5F
irst
5E
quiv
.E
xp
erie
nce
Equiv
.E
xp
erie
nce
Str
ate
gy
Alw
ays
Sta
g0.1
749
0.3
742*
0.5
550***
0.3
502***
0.4
786*
0.5
720***
(0.2
130)
(0.2
232)
(0.1
685)
(0.1
295)
(0.2
565)
(0.2
012)
Gri
maft
er1
Hare
0.4
780
0.4
868**
0.1
537
0.2
396*
0.2
640
0.4
010**
(0.3
064)
(0.2
467)
(0.1
503)
(0.1
382)
(0.1
998)
(0.1
834)
Tit
for
Tat
(Sta
gfirs
t)0.3
320
0.1
239
0.2
609*
0.3
396**
0.2
423
0(0
.2604)
(0.1
784)
(0.1
486)
(0.1
430)
(0.1
723)
(0.1
806)
Alw
ays
Hare
0.0
152
0.0
152
0.0
303
0.0
706
0.0
151
0.0
270
Gam
ma
0.2
401***
0.2
492***
0.3
231***
0.3
385***
0.2
558***
0.2
526***
(0.0
640)
(0.0
337)
(0.0
389)
(0.0
468)
(0.0
576)
(0.0
462)
bet
a0.9
85
0.9
82
0.9
57
0.9
50
0.9
80
0.9
81
Aver
age
Rounds
3.7
23.5
33.5
36.1
44.2
44.2
4N
.Sub
ject
s66
66
66
66
66
66
Obse
rvati
ons
1,2
48
1,5
26
1,2
48
1,9
20
1,5
34
1,1
92
†W
hen
bet
ais
close
to1/2,
choic
esare
esse
nti
aly
random
and
when
itis
close
to1
then
choic
esare
alm
ost
per
fect
lypre
dic
ted.
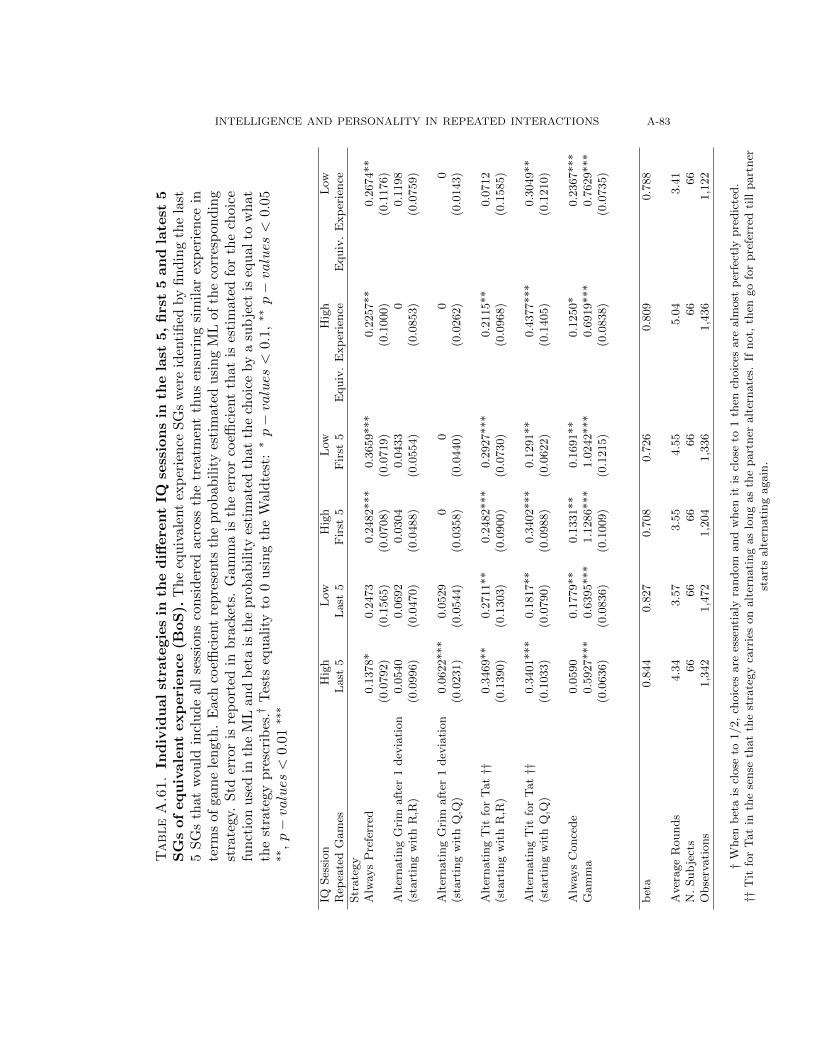
INTELLIGENCE AND PERSONALITY IN REPEATED INTERACTIONS A-83
TableA.61.
Ind
ivid
ual
stra
tegie
sin
the
diff
ere
nt
IQse
ssio
ns
inth
ela
st5,
firs
t5
an
dla
test
5S
Gs
of
equ
ivale
nt
exp
eri
en
ce
(BoS
).T
he
equ
ival
ent
exp
erie
nce
SG
sw
ere
iden
tifi
edby
find
ing
the
last
5S
Gs
that
wou
ldin
clu
de
all
sess
ion
sco
nsi
der
edac
ross
the
trea
tmen
tth
us
ensu
rin
gsi
mil
arex
per
ien
cein
term
sof
gam
ele
ngt
h.
Eac
hco
effici
ent
rep
rese
nts
the
pro
bab
ilit
yes
tim
ated
usi
ng
ML
ofth
eco
rres
pon
din
gst
rate
gy.
Std
erro
ris
rep
orte
din
bra
cket
s.G
amm
ais
the
erro
rco
effici
ent
that
ises
tim
ated
for
the
choic
efu
nct
ion
use
din
the
ML
and
bet
ais
the
pro
bab
ilit
yes
tim
ated
that
the
choi
ceby
asu
bje
ctis
equ
alto
wh
at
the
stra
tegy
pre
scri
bes
.†T
ests
equ
alit
yto
0u
sin
gth
eW
ald
test
:∗p−values<
0.1
,∗∗p−values<
0.05
∗∗,p−values<
0.01∗∗∗
IQSes
sion
Hig
hL
owH
igh
Low
Hig
hL
owR
epea
ted
Gam
esL
ast
5L
ast
5F
irst
5F
irst
5E
quiv
.E
xp
erie
nce
Equiv
.E
xp
erie
nce
Str
ate
gy
Alw
ays
Pre
ferr
ed0.1
378*
0.2
473
0.2
482***
0.3
659***
0.2
257**
0.2
674**
(0.0
792)
(0.1
565)
(0.0
708)
(0.0
719)
(0.1
000)
(0.1
176)
Alt
ernati
ng
Gri
maft
er1
dev
iati
on
0.0
540
0.0
692
0.0
304
0.0
433
00.1
198
(sta
rtin
gw
ith
R,R
)(0
.0996)
(0.0
470)
(0.0
488)
(0.0
554)
(0.0
853)
(0.0
759)
Alt
ernati
ng
Gri
maft
er1
dev
iati
on
0.0
622***
0.0
529
00
00
(sta
rtin
gw
ith
Q,Q
)(0
.0231)
(0.0
544)
(0.0
358)
(0.0
440)
(0.0
262)
(0.0
143)
Alt
ernati
ng
Tit
for
Tat††
0.3
469**
0.2
711**
0.2
482***
0.2
927***
0.2
115**
0.0
712
(sta
rtin
gw
ith
R,R
)(0
.1390)
(0.1
303)
(0.0
900)
(0.0
730)
(0.0
968)
(0.1
585)
Alt
ernati
ng
Tit
for
Tat††
0.3
401***
0.1
817**
0.3
402***
0.1
291**
0.4
377***
0.3
049**
(sta
rtin
gw
ith
Q,Q
)(0
.1033)
(0.0
790)
(0.0
988)
(0.0
622)
(0.1
405)
(0.1
210)
Alw
ays
Conce
de
0.0
590
0.1
779**
0.1
331**
0.1
691**
0.1
250*
0.2
367***
Gam
ma
0.5
927***
0.6
395***
1.1
286***
1.0
242***
0.6
919***
0.7
629***
(0.0
636)
(0.0
836)
(0.1
009)
(0.1
215)
(0.0
838)
(0.0
735)
bet
a0.8
44
0.8
27
0.7
08
0.7
26
0.8
09
0.7
88
Aver
age
Rounds
4.3
43.5
73.5
54.5
55.0
43.4
1N
.Sub
ject
s66
66
66
66
66
66
Obse
rvati
ons
1,3
42
1,4
72
1,2
04
1,3
36
1,4
36
1,1
22
†W
hen
bet
ais
close
to1/2,
choic
esare
esse
nti
aly
random
and
when
itis
close
to1
then
choic
esare
alm
ost
per
fect
lypre
dic
ted.
††T
itfo
rT
at
inth
ese
nse
that
the
stra
tegy
carr
ies
on
alt
ernati
ng
as
long
as
the
part
ner
alt
ernate
s.If
not,
then
go
for
pre
ferr
edti
llpart
ner
start
salt
ernati
ng
again
.

A-84 EUGENIO PROTO, ALDO RUSTICHINI, AND ANDIS SOFIANOS
TableA.62.
Ind
ivid
ual
stra
tegie
sin
the
diff
ere
nt
IQse
ssio
ns
inth
ela
st5,
firs
t5
an
dla
test
5S
Gs
of
equ
ivale
nt
exp
eri
en
ce
(BoS
C).
Th
eeq
uiv
alen
tex
per
ien
ceSG
sw
ere
iden
tifi
edby
fin
din
gth
ela
st5
SG
sth
atw
ould
incl
ud
eal
lse
ssio
ns
con
sid
ered
acro
ssth
etr
eatm
ent
thu
sen
suri
ng
sim
ilar
exp
erie
nce
inte
rms
ofga
me
len
gth
.E
ach
coeffi
cien
tre
pre
sents
the
pro
bab
ilit
yes
tim
ated
usi
ng
ML
ofth
eco
rres
pon
din
gst
rate
gy.
Std
erro
ris
rep
orte
din
bra
cket
s.G
amm
ais
the
erro
rco
effici
ent
that
ises
tim
ated
for
the
choic
efu
nct
ion
use
din
the
ML
and
bet
ais
the
pro
bab
ilit
yes
tim
ated
that
the
choi
ceby
asu
bje
ctis
equ
alto
wh
at
the
stra
tegy
pre
scri
bes
.†T
ests
equ
alit
yto
0u
sin
gth
eW
ald
test
:∗p−values<
0.1
,∗∗p−values<
0.05
∗∗,p−values<
0.01∗∗∗
IQS
essi
on
Hig
hL
ow
Hig
hL
ow
Hig
hL
ow
Rep
eate
dG
am
esL
ast
5L
ast
5F
irst
5F
irst
5E
qu
iv.
Exp
erie
nce
Equ
iv.
Exp
erie
nce
Str
ate
gy
Alw
ays
Pre
ferr
ed0.1
162**
0.3
267***
0.2
853***
0.2
673***
0.1
282**
0.2
732***
(0.0
499)
(0.0
622)
(0.0
685)
(0.0
704)
(0.0
622)
(0.0
681)
Com
pro
mis
eG
rim
aft
er1
dev
iati
on
0.0
976
0.0
519**
0.1
092*
0.0
811
0.3
191**
0.1
570*
(0.1
512)
(0.0
208)
(0.0
602)
(0.0
981)
(0.1
235)
(0.0
856)
Tit
for
Tat
(Com
pro
mis
efi
rst)
0.4
702***
0.4
850***
0.1
643
0.2
887***
0.2
332**
0.3
386***
(0.1
210)
(0.0
644)
(0.1
175)
(0.0
767)
(0.1
138)
(0.0
911)
Alt
ern
ati
ng
Gri
maft
er1
dev
iati
on
0.0
182
00
00
0.0
191
(sta
rtin
gw
ith
R,R
)(0
.0174)
(0.0
427)
(0.0
273)
(0.0
682)
(0.0
207)
(0.0
396)
Alt
ern
ati
ng
Gri
maft
er1
dev
iati
on
00
00
00
(sta
rtin
gw
ith
Q,Q
)(0
.0469)
(0.0
357)
(0.0
262)
(0.0
332)
(0.0
177)
(0.0
145)
Alt
ern
ati
ng
Tit
for
Tat††
00
0.0
948***
00
0(s
tart
ing
wit
hR
,R)
(0)
(0.0
414)
(0.0
143)
(0.0
268)
(0.0
618)
(0.0
318)
Alt
ern
ati
ng
Tit
for
Tat††
00.0
063
0.0
153
00.0
356
0(s
tart
ing
wit
hQ
,Q)
(0.0
904)
(0.0
213)
(0.0
157)
(0.0
287)
(0.0
460)
(0.0
232)
Alw
ays
Con
ced
e0.2
977***
0.1
301**
0.3
311***
0.3
630***
0.2
838**
0.2
121***
Gam
ma
0.5
191***
0.6
093***
0.7
266***
0.9
693***
0.5
004***
0.5
604***
(0.0
691)
(0.0
590)
(0.0
551)
(0.1
434)
(0.0
897)
(0.0
635)
bet
a0.8
73
0.8
38
0.7
98
0.7
37
0.8
81
0.8
56
Aver
age
Rou
nd
s4.7
04.4
33.9
84.3
65.4
63.9
4N
.S
ub
ject
s52
52
52
52
52
52
Ob
serv
ati
on
s1,2
94
1,2
14
1,0
68
1,1
06
1,0
26
1,1
56
†W
hen
bet
ais
close
to1/2,
choic
esare
esse
nti
aly
random
and
when
itis
close
to1
then
choic
esare
alm
ost
per
fect
lypre
dic
ted.
††T
itfo
rT
at
inth
ese
nse
that
the
stra
tegy
carr
ies
on
alt
ernati
ng
as
long
as
the
part
ner
alt
ernate
s.If
not,
then
go
for
pre
ferr
edti
llpart
ner
start
salt
ernati
ng
again
.
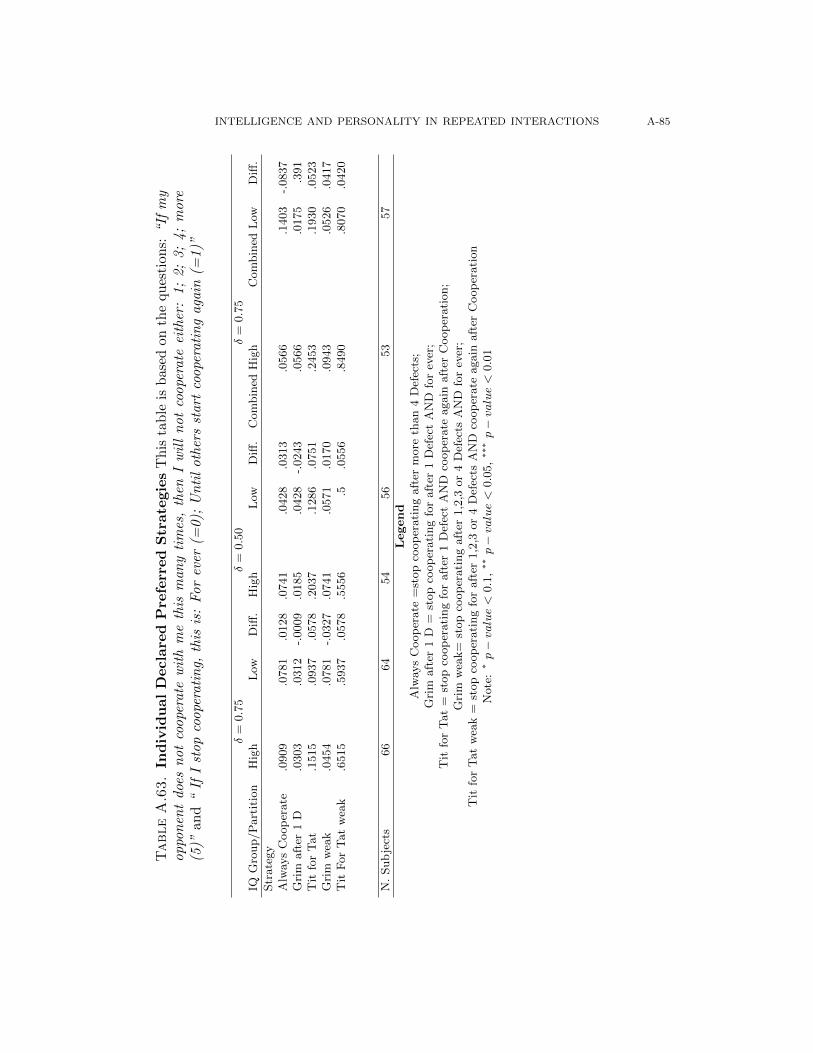
INTELLIGENCE AND PERSONALITY IN REPEATED INTERACTIONS A-85
TableA.63.
Ind
ivid
ual
Decla
red
Pre
ferr
ed
Str
ate
gie
sT
his
tab
leis
bas
edon
the
qu
esti
ons:
“If
my
oppo
nen
tdoe
sn
ot
coope
rate
wit
hm
eth
ism
an
yti
mes
,th
enI
wil
ln
ot
coope
rate
eith
er:
1;
2;
3;
4;
more
(5)”
and
“If
Ist
op
coope
rati
ng,
this
is:
For
ever
(=0);
Un
til
oth
ers
start
coope
rati
ng
aga
in(=
1)”
δ=
0.7
5δ
=0.5
0δ
=0.7
5IQ
Gro
up/P
art
itio
nH
igh
Low
Diff
.H
igh
Low
Diff
.C
om
bin
edH
igh
Com
bin
edL
owD
iff.
Str
ate
gy
Alw
ays
Coop
erate
.0909
.0781
.0128
.0741
.0428
.0313
.0566
.1403
-.0837
Gri
maft
er1
D.0
303
.0312
-.0009
.0185
.0428
-.0243
.0566
.0175
.391
Tit
for
Tat
.1515
.0937
.0578
.2037
.1286
.0751
.2453
.1930
.0523
Gri
mw
eak
.0454
.0781
-.0327
.0741
.0571
.0170
.0943
.0526
.0417
Tit
For
Tat
wea
k.6
515
.5937
.0578
.5556
.5.0
556
.8490
.8070
.0420
N.
Sub
ject
s66
64
54
56
53
57
Legend
Alw
ays
Coop
erate
=st
op
coop
erati
ng
aft
erm
ore
than
4D
efec
ts;
Gri
maft
er1
D=
stop
coop
erati
ng
for
aft
er1
Def
ect
AN
Dfo
rev
er;
Tit
for
Tat
=st
op
coop
erati
ng
for
aft
er1
Def
ect
AN
Dco
op
erate
again
aft
erC
oop
erati
on;
Gri
mw
eak=
stop
coop
erati
ng
aft
er1,2
,3or
4D
efec
tsA
ND
for
ever
;T
itfo
rT
at
wea
k=
stop
coop
erati
ng
for
aft
er1,2
,3or
4D
efec
tsA
ND
coop
erate
again
aft
erC
oop
erati
on
Note
:∗p−value<
0.1
,∗∗p−value<
0.0
5,∗∗∗p−value<
0.0
1

A-86 EUGENIO PROTO, ALDO RUSTICHINI, AND ANDIS SOFIANOS
(Eugenio Proto) Department of Economics, University of Warwick,
E-mail address: [email protected]
(Aldo Rustichini) Department of Economics, University of Minnesota, 1925 4th Street
South 4-101, Hanson Hall, Hanson Hall, Minneapolis, MN, 55455
E-mail address: [email protected]
(Andis Sofianos) Department of Economics, University of Warwick,
E-mail address: [email protected]