Embed Size (px)
Citation preview
Integration of System Dynamics and ActionResearch with Application to Higher Education
Quality Management
by
Benedict Oyo2005/HD18/4003U
BSc/Ed., MSc. Computer Science (Mak)
A Dissertation Submitted to the School of Graduate Studies in Partial Fulfillmentfor the Award of the Degree of Doctor of Philosophy in Information Systems
of Makerere University
November,2010
Declaration
I, Benedict Oyo, have solely taken an initiative to carry out this study, I hereby declare that the
work is my own and original except where references have been made. It is to the best of my
knowledge that this study has never been submitted.
Candidate:
............................................. Date...............
Benedict Oyo
Approval:
This research has been submitted for examination with the approval of:
Supervisors:
..................................................... Date...............
Dr. Ddembe Williams,
PhD System Dynamics /Computer Science,
Department of Information Systems,
Faculty of Computing and Information Technology,
Makerere University, Kampala, Uganda.
.................................................... Date...............
Prof. Dr. Erik Barendsen
Institute for Computing and Information Sciences,
Radboud University Nijmegen.
Acknowledgement
I am grateful to the Nuffic Project at the Faculty of Computing and IT and Gulu University for the
Financial support that enabled me undertake this research. In the same vein, I wish to thank the
Dean Faculty of Computing and IT Prof. Venansius Baryamureeba for considering me worthy of
both CIT and Nuffic scholarships.
I wish to acknowledge the efforts of Dr. Ddembe and Erik, my diligent supervisors for their com-
mitment and guidance in the research and write up of this thesis. I would also like to thank Dr.
Joseph Sewanyana and Dr. Patrick Ogao who read and provided useful comments against which
the final version of this thesis was written.
I wish to acknowledge the academic and social interactions from the 2005 PhD intake at CIT for
the encouragement and competition that has resulted into this pleasing outcome.
Special thanks go to my brothers for persistently calling me Professor, a title which is indeed my
aspiration.
Finally, I am indebted to my wife Clare for her driving philosophy that when PhD research fails,
the researcher looses less than the beneficiaries of the intended contribution.
May God bless you all.
ii
Publications
During the course of this research, several publications in journals, book chapters and conference
proceedings were made. A summary of these publications are listed below:
Journals
i. Oyo, B., Williams, D., & Barendsen, E. (To appear). A System Dynamics Decision Support
Tool for University Quality Management in Uganda.International Journal of Simulation
and Gaming.
ii. Oyo, B., & Williams, D. (2009). Re-Conceptualisation of Higher Education Quality Man-
agement Problems using Feedback Systems Thinking.International Journal of Management
in Education, 3 (3/4), 220-233.
Book Chapters
i. Oyo, B., & Williams, D. (2006). An exploration of the factors that determine higher educa-
tion quality. In J. Aisbett, J.M. Kizza & D. Patel (Eds.),Special Topics in Computing and
ICT Research: Strengthening the role of ICT in Development. Kampala: Fountain Publish-
ers, Vol. 2.
ii. Oyo, B., Williams, D., & Barendsen, E. (2008). Impact of funded research on university
quality. In J.M, Kizza, J., Aisbett, V., Mbarika, D., Patel & F., Tushabe (Eds.),Special Topics
in Computing and ICT Research: ICT for Sustainable Development. Kampala: Fountain
Publishers, Vol 4.
Conference Proceedings
i. Oyo, B., Williams, D., & Barendsen, E. (2007, February).A preliminary model for aca-
demic quality management in higher education. Paper Presented at the 2007 International
Conference in Computer Science and Informatics, February 5-7 2007, School of Computing
& Informatics, University of Nairobi, Kenya.
iii
ii. Oyo, B., Williams, D., & Barendsen, E. (2008, July). A System Dynamics Tool for Fund-
ing and Quality Policy Analysis in Higher Education. Paper presented at the 2008 System
Dynamics Conference, July 20-24 2008, Athens Greece, ISBN 978-1-935056-01-0.
iii. Oyo, B., Williams, D., & Barendsen, E. (2009, January).Integrating Action Research and
System Dynamics: Towards a Generic Process Design for Participative Modeling. Paper
presented at the 2009 Hawaii International Conference on System Sciences, ISBN 978-0-
7695-3450-3, ISSN 1530-1605. IEEE Computer Society.
iv. Oyo, B. (2009, July).Re-Conceptualization of Participative Modeling Process Design Effec-
tiveness and Outcomes. Proceedings of the 27th System Dynamics Conference, July 26-30,
Albuquerque, New Mexico, ISBN 978-1-935056-02-7.
iv
Contents
Declaration . . . . . . . . . . . . . . . . . . . . . . . . . . . . . . . . . . . . . . . . . i
Acknowledgement . . . . . . . . . . . . . . . . . . . . . . . . . . . . . . . . . . . . . ii
Publications . . . . . . . . . . . . . . . . . . . . . . . . . . . . . . . . . . . . . . . . . iii
List of Acronyms . . . . . . . . . . . . . . . . . . . . . . . . . . . . . . . . . . . . . . xv
Abstract . . . . . . . . . . . . . . . . . . . . . . . . . . . . . . . . . . . . . . . . . . . xvi
1 INTRODUCTION 1
1.1 Background . . . . . . . . . . . . . . . . . . . . . . . . . . . . . . . . . . . . . . 3
1.1.1 The Higher Education Quality Management Case . . . . . . . . . . . . . . 5
1.2 Problem Statement . . . . . . . . . . . . . . . . . . . . . . . . . . . . . . . . . . 8
1.3 Aims and Objectives . . . . . . . . . . . . . . . . . . . . . . . . . . . . . . . . . 8
1.3.1 Specific Objectives . . . . . . . . . . . . . . . . . . . . . . . . . . . . . . 9
1.4 Research Questions . . . . . . . . . . . . . . . . . . . . . . . . . . . . . . . . . . 9
1.5 Dynamic Hypothesis . . . . . . . . . . . . . . . . . . . . . . . . . . . . . . . . . 10
1.6 Scope . . . . . . . . . . . . . . . . . . . . . . . . . . . . . . . . . . . . . . . . . 12
v
1.7 Justification of the Research . . . . . . . . . . . . . . . . . . . . . . . . . . . . . 13
1.8 Theoretical Terms Used . . . . . . . . . . . . . . . . . . . . . . . . . . . . . . . . 14
1.9 Thesis Organisation . . . . . . . . . . . . . . . . . . . . . . . . . . . . . . . . . . 16
2 LITERATURE REVIEW 17
2.1 Introduction . . . . . . . . . . . . . . . . . . . . . . . . . . . . . . . . . . . . . . 17
2.2 Trends in HE Quality Management Research . . . . . . . . . . . . . . . . . . . . 17
2.2.1 Quality Perceptions . . . . . . . . . . . . . . . . . . . . . . . . . . . . . . 18
2.2.2 Excellence Models . . . . . . . . . . . . . . . . . . . . . . . . . . . . . . 20
2.2.3 Quality Management Frameworks . . . . . . . . . . . . . . . . . . . . . . 25
2.3 Current Approaches to Quality Management in HE . . . . . . . . . . . . . . . . . 29
2.3.1 System Dynamics Modelling . . . . . . . . . . . . . . . . . . . . . . . . . 29
2.3.2 Data Mining . . . . . . . . . . . . . . . . . . . . . . . . . . . . . . . . . 34
2.3.3 Analytic Hierarchy Process . . . . . . . . . . . . . . . . . . . . . . . . . . 34
2.3.4 Goal Programming . . . . . . . . . . . . . . . . . . . . . . . . . . . . . . 35
2.3.5 Hierarchical Linear Modelling . . . . . . . . . . . . . . . . . . . . . . . . 36
2.3.6 Balanced Scorecard . . . . . . . . . . . . . . . . . . . . . . . . . . . . . . 37
2.3.7 Participatory Action Research and System Dynamics . . . . . . . . . . . . 41
2.4 The State-of-Practice of Higher Education Quality Management Tools . . . . . . . 48
2.4.1 UNIGAME . . . . . . . . . . . . . . . . . . . . . . . . . . . . . . . . . . 49
vi
2.4.2 Quality Measurement System (QMS2000) . . . . . . . . . . . . . . . . . . 50
2.5 Critique of Causes of Problems in HE Quality Management . . . . . . . . . . . . . 51
2.6 Conclusion . . . . . . . . . . . . . . . . . . . . . . . . . . . . . . . . . . . . . . 52
3 Methodology 53
3.1 Introduction . . . . . . . . . . . . . . . . . . . . . . . . . . . . . . . . . . . . . . 53
3.2 Philosophical and Theoretical Foundations . . . . . . . . . . . . . . . . . . . . . . 53
3.2.1 Philosophical Underpinnings . . . . . . . . . . . . . . . . . . . . . . . . . 53
3.2.2 Theoretical Underpinning . . . . . . . . . . . . . . . . . . . . . . . . . . 58
3.3 Evaluation of the Current Methods . . . . . . . . . . . . . . . . . . . . . . . . . . 61
3.4 Proposed Methodology . . . . . . . . . . . . . . . . . . . . . . . . . . . . . . . . 63
3.4.1 The SyDPAR Modelling Architecture . . . . . . . . . . . . . . . . . . . . 64
3.5 Field Studies . . . . . . . . . . . . . . . . . . . . . . . . . . . . . . . . . . . . . 68
3.5.1 Stakeholders . . . . . . . . . . . . . . . . . . . . . . . . . . . . . . . . . 68
3.5.2 Data Collection . . . . . . . . . . . . . . . . . . . . . . . . . . . . . . . . 68
3.6 Conclusion . . . . . . . . . . . . . . . . . . . . . . . . . . . . . . . . . . . . . . 71
4 Research Issues and Field Study Findings 72
4.1 Introduction . . . . . . . . . . . . . . . . . . . . . . . . . . . . . . . . . . . . . . 72
4.2 Research Issues . . . . . . . . . . . . . . . . . . . . . . . . . . . . . . . . . . . . 72
4.2.1 The Conceptual HE Quality Management System Structure . . . . . . . . 73
vii
4.3 Field Study Findings . . . . . . . . . . . . . . . . . . . . . . . . . . . . . . . . . 76
4.3.1 Nature of HE Quality Problems . . . . . . . . . . . . . . . . . . . . . . . 76
4.3.2 Research Publication Trends in HE . . . . . . . . . . . . . . . . . . . . . 78
4.4 Conclusion . . . . . . . . . . . . . . . . . . . . . . . . . . . . . . . . . . . . . . 79
5 Application of SyDPAR to HE Quality Management 81
5.1 Introduction . . . . . . . . . . . . . . . . . . . . . . . . . . . . . . . . . . . . . . 81
5.2 Quality Management System Overview . . . . . . . . . . . . . . . . . . . . . . . 81
5.2.1 Scope of the Model . . . . . . . . . . . . . . . . . . . . . . . . . . . . . . 81
5.2.2 Assumptions . . . . . . . . . . . . . . . . . . . . . . . . . . . . . . . . . 82
5.2.3 Audience, Purpose and Use . . . . . . . . . . . . . . . . . . . . . . . . . 83
5.2.4 Time Horizon . . . . . . . . . . . . . . . . . . . . . . . . . . . . . . . . . 84
5.3 Model Development . . . . . . . . . . . . . . . . . . . . . . . . . . . . . . . . . 84
5.3.1 Dynamic Patterns in HE Quality . . . . . . . . . . . . . . . . . . . . . . . 87
5.3.2 Model Control Statements . . . . . . . . . . . . . . . . . . . . . . . . . . 89
5.4 Model Structure . . . . . . . . . . . . . . . . . . . . . . . . . . . . . . . . . . . . 90
5.4.1 Stocks and Flows Diagrams . . . . . . . . . . . . . . . . . . . . . . . . . 90
5.5 Model Calibration . . . . . . . . . . . . . . . . . . . . . . . . . . . . . . . . . . . 101
5.6 Model Validation . . . . . . . . . . . . . . . . . . . . . . . . . . . . . . . . . . . 102
5.6.1 Structural Validation . . . . . . . . . . . . . . . . . . . . . . . . . . . . . 103
viii
5.6.2 Behavioural Validation . . . . . . . . . . . . . . . . . . . . . . . . . . . . 106
5.7 Evaluation of QMT09 . . . . . . . . . . . . . . . . . . . . . . . . . . . . . . . . . 109
5.7.1 Policy Analysis . . . . . . . . . . . . . . . . . . . . . . . . . . . . . . . . 110
5.7.2 Analysis QMT09 versus IUCEA Quality Checklists . . . . . . . . . . . . . 116
5.8 Validation of SyDPAR . . . . . . . . . . . . . . . . . . . . . . . . . . . . . . . . 118
5.8.1 Analysis of SyDPAR by Theoretical Research Aims . . . . . . . . . . . . 119
5.9 Conclusion . . . . . . . . . . . . . . . . . . . . . . . . . . . . . . . . . . . . . . 120
6 Discussions and Conclusions 121
6.1 Introduction . . . . . . . . . . . . . . . . . . . . . . . . . . . . . . . . . . . . . . 121
6.2 Discussion of Findings . . . . . . . . . . . . . . . . . . . . . . . . . . . . . . . . 121
6.2.1 Nature of Quality Problems . . . . . . . . . . . . . . . . . . . . . . . . . 122
6.2.2 Measurement of Quality . . . . . . . . . . . . . . . . . . . . . . . . . . . 123
6.2.3 Research Questions Analysis . . . . . . . . . . . . . . . . . . . . . . . . . 124
6.2.4 Policy Directions for HE Quality Management . . . . . . . . . . . . . . . 126
6.3 Conclusions . . . . . . . . . . . . . . . . . . . . . . . . . . . . . . . . . . . . . . 127
6.3.1 Overall Conclusions . . . . . . . . . . . . . . . . . . . . . . . . . . . . . 127
6.3.2 Summary of Contributions . . . . . . . . . . . . . . . . . . . . . . . . . . 127
6.3.3 Contributions by Research Objectives Analysis . . . . . . . . . . . . . . . 131
6.4 Limitations . . . . . . . . . . . . . . . . . . . . . . . . . . . . . . . . . . . . . . 132
ix

6.5 Future Research . . . . . . . . . . . . . . . . . . . . . . . . . . . . . . . . . . . . 132
6.5.1 Challenges and Directions of use of SyDPAR . . . . . . . . . . . . . . . . 132
6.5.2 Further Testing and Refinement of QMT09 . . . . . . . . . . . . . . . . . 133
x
List of Figures
1.1 Dynamic Hypothesis for Academic Quality Management in HE . . . . . . . . . . 11
1.2 Main Parameter Relationship Types . . . . . . . . . . . . . . . . . . . . . . . . . 12
2.1 The EFQM Excellence Model (Source: Umashankar and Dutta, 2007) . . . . . . . 22
2.2 Baldrige Education Criteria for Performance Excellence Framework: A Systems
Perspective (Source: NIST, 2004) . . . . . . . . . . . . . . . . . . . . . . . . . . 23
2.3 A Three-Dimensional perspective of TQM (Source: Lau and Anderson, 1998) . . . 24
2.4 Comprehensive Framework for HE Quality Management(Source: Csizmadia, 2006) 25
2.5 Mapping of the Education Criteria onto the Performance Management Perspec-
tives (Source: Shawyun, 2006) . . . . . . . . . . . . . . . . . . . . . . . . . . . . 27
2.6 Steps in System Dynamics Model Building (Source: Zagonel, 2002) . . . . . . . . 33
2.7 The Practice Perspective of Action Research (Adapted from: Cronholm and Gold-
kuhl, 2004) . . . . . . . . . . . . . . . . . . . . . . . . . . . . . . . . . . . . . . 39
2.8 The Action Research Cycle(Source: Baskerville, 1999) . . . . . . . . . . . . . . . 40
2.9 Global sector diagram for UNIGAME (Barlas and Diker, 2000) . . . . . . . . . . . 50
2.10 Quality assurance framework at the University of Louisville (Welsh and Dey, 2002) 51
xi
3.1 The Conceptual SyDPAR’s Modelling Architecture . . . . . . . . . . . . . . . . . 65
4.1 Conceptual HE Quality Management System Structure . . . . . . . . . . . . . . . 74
4.2 Publications by Selected Ugandan Universities . . . . . . . . . . . . . . . . . . . 78
4.3 Distribution of Academic Staff by Qualification in Ugandan Tertiary Institutions
(Source: NCHE, 2006) . . . . . . . . . . . . . . . . . . . . . . . . . . . . . . . . 79
5.1 The Preliminary Model . . . . . . . . . . . . . . . . . . . . . . . . . . . . . . . . 85
5.2 Research and Publications Sector’s Influence Diagram . . . . . . . . . . . . . . . 86
5.3 Dynamic Behaviour for Reference Modes . . . . . . . . . . . . . . . . . . . . . . 88
5.4 Basic Model Symbols . . . . . . . . . . . . . . . . . . . . . . . . . . . . . . . . . 90
5.5 Finance and Strategic Planning Sector . . . . . . . . . . . . . . . . . . . . . . . . 92
5.6 Research and Publications’ Stock and Flows . . . . . . . . . . . . . . . . . . . . . 94
5.7 Students Sector’s Stock and Flows . . . . . . . . . . . . . . . . . . . . . . . . . . 95
5.8 A Representative Stock and Flows for Government Sector . . . . . . . . . . . . . 96
5.9 Educational Resources Sector’s Stock and Flows . . . . . . . . . . . . . . . . . . 97
5.10 Academic Staff Sector’s Stock and Flows . . . . . . . . . . . . . . . . . . . . . . 98
5.11 Teaching and Learning Sector’s Stock and Flows . . . . . . . . . . . . . . . . . . 99
5.12 Example of Calibrated Behaviours . . . . . . . . . . . . . . . . . . . . . . . . . . 102
5.13 A structure for the growth of research and development in a university (Source:
Vahdatzad and Mojtahedzadeh, 2000) . . . . . . . . . . . . . . . . . . . . . . . . 104
5.14 Actual Students Enrolment and Selectivity Trends . . . . . . . . . . . . . . . . . . 107
xii
5.15 Staff Establishment Trends . . . . . . . . . . . . . . . . . . . . . . . . . . . . . . 108
5.16 Trends of Available Funds . . . . . . . . . . . . . . . . . . . . . . . . . . . . . . 109
5.17 The User Interface for QMT09 . . . . . . . . . . . . . . . . . . . . . . . . . . . . 110
5.18 Dynamic behaviour of the main institutional quality indicators . . . . . . . . . . . 111
5.19 An estimation of quality of students’ outcomes . . . . . . . . . . . . . . . . . . . 113
5.20 Available income and expenditure dynamics . . . . . . . . . . . . . . . . . . . . . 114
5.21 Dynamics of staff capacity indicator and its basic dependencies . . . . . . . . . . . 115
5.22 The Validated SyDPAR Modelling Architecture . . . . . . . . . . . . . . . . . . . 119
6.1 Classification of Intervention Approaches in Higher Education Quality Issues . . . 122
xiii
List of Tables
2.1 Decision support systems/models for quality issues in higher education . . . . . . . 49
3.1 Comparison of the Quality Management Approaches using Design Science Frame-
work . . . . . . . . . . . . . . . . . . . . . . . . . . . . . . . . . . . . . . . . . . 63
3.2 Interview distribution: purpose and target universities . . . . . . . . . . . . . . . . 70
3.3 Survey distribution: sample size and percentage response . . . . . . . . . . . . . . 70
4.1 Interview responses analysis by universities . . . . . . . . . . . . . . . . . . . . . 77
4.2 Public and Private Universities expenditure (NCHE, 2006) . . . . . . . . . . . . . 80
5.1 Parameters and Assigned Values for Sectors . . . . . . . . . . . . . . . . . . . . . 105
5.2 Comparative Analysis of QMT09’s scope versus IUCEA Quality Checklists . . . . 117
5.3 Analysis of SyDPAR process design by theoretical research aims . . . . . . . . . . 120
6.1 Analysis of client involvement in modelling . . . . . . . . . . . . . . . . . . . . . 125
6.2 Analysis of research objectives, descriptive approach and outcomes . . . . . . . . 131
xiv
LIST OF ACRONYMS
AR Action Research
AHP Analytic Hierarchy Process
BSC Balanced Score Card
DSS Decision Support System
ENQA European Association for Quality Assurance in Higher Education
EURASE European Association of Institutions in Higher Education
GP Goal Programming
GMB Group Model Building
HE Higher Education
HEQC Higher Education Quality Committee
HLM Hierarchical Linear Modelling
IS Information Systems
IUCEA Inter University Council for East Africa
MCDM Multi-Criteria Decision Making
PAR Participatory Action Research
SD System Dynamics
SyDPAR System Dynamics and Participatory Action Research
SPC Statistical Process Control
QMS Quality Management System
QMT09 Quality Management Tool 2009
UML Unified Modeling Language
UNESCO United Nations Educational, Scientific and Cultural Organisation
Abstract
Quality management has become a central concern for managers of higher education institutions
(HEIs) as it is arguably the cornerstone of success and eventual survival of these institutions. Pre-
vious research in higher educational quality, however, have mixed characteristics. In some cases,
focussing on a narrow scope such as academic staff quality tantamount to addressing the main chal-
lenge (Vinnik and Scholl, 2005). Others have suggested that quality is too subtle to be measured
meaningfully (Srikanthan and Dalrymple, 2007; Grandzol, 2005; Parker, 2002), while others claim
that good policies on quality improvement in higher education are often not based on systematic
engagement with simulation experiments but on use of intuition and experience (Grandzol, 2005;
Barnabe, 2004). This thesis extends this discussion further by developing simulation models for
institutional and program quality analysis that demystify these claims.
In adopting the system dynamics (SD) modelling and simulation technique in this research, atten-
tion to the modelling process was highly regarded. This follows insight formulated from many
scholars in the field of SD that the modelling process is often more important than the resulting
model (GroBler and Milling, 2009; Forrester, 1998). Hence, the integration of SD and participa-
tory action research (PAR) in this thesis is meant to increase modelling process outcomes through
a more rigorous modelling design architecture. The emerging integrated approach, also, referred
to as SyDPAR was evaluated against rigour and relevance criteria for information systems method-
ologies, making the SyDPAR approach not only an original aspect but a useful outcome.
The SyDPAR approach recognises the contributions as well as benefits of clients/practitioners
in participative modelling using three cycles, namely: problem articulation, modelling proficiency,
and solution refinement. In addition, it provides a general modelling framework that extends partic-
ipative modelling outcomes beyond the prevalent individual, group, and organisational outcomes,
culminating into contributions to the SD knowledge base and system change by modellers and
clients respectively. Fundamental to this thesis is the application of SyDPAR to higher educa-
tion quality management problem area, leading to the development of a “quality management tool
2009” (QMT09). This tool is validated and verified using standard system dynamics tests and three
sets of quality checklists.
Specifically, the contributions of this research and the thesis may be classified into four aspects: 1)
xvi

provision of guidelines for evaluation of participative modelling design effectiveness, 2) theoretical
validation of the SyDPAR research process, 3) development of SyDPAR as a generic participative
modelling design, and 4) development of decision support tool for higher education quality man-
agement. In terms of scientific rigour and relevance, the first two can be aptly categorised as
theoretical and the rest practice oriented. Consequently, the dual imperatives of solving a real
world problem while contributing to the knowledge base adopted by the researcher is fulfilled.
xvii
Chapter 1
INTRODUCTION
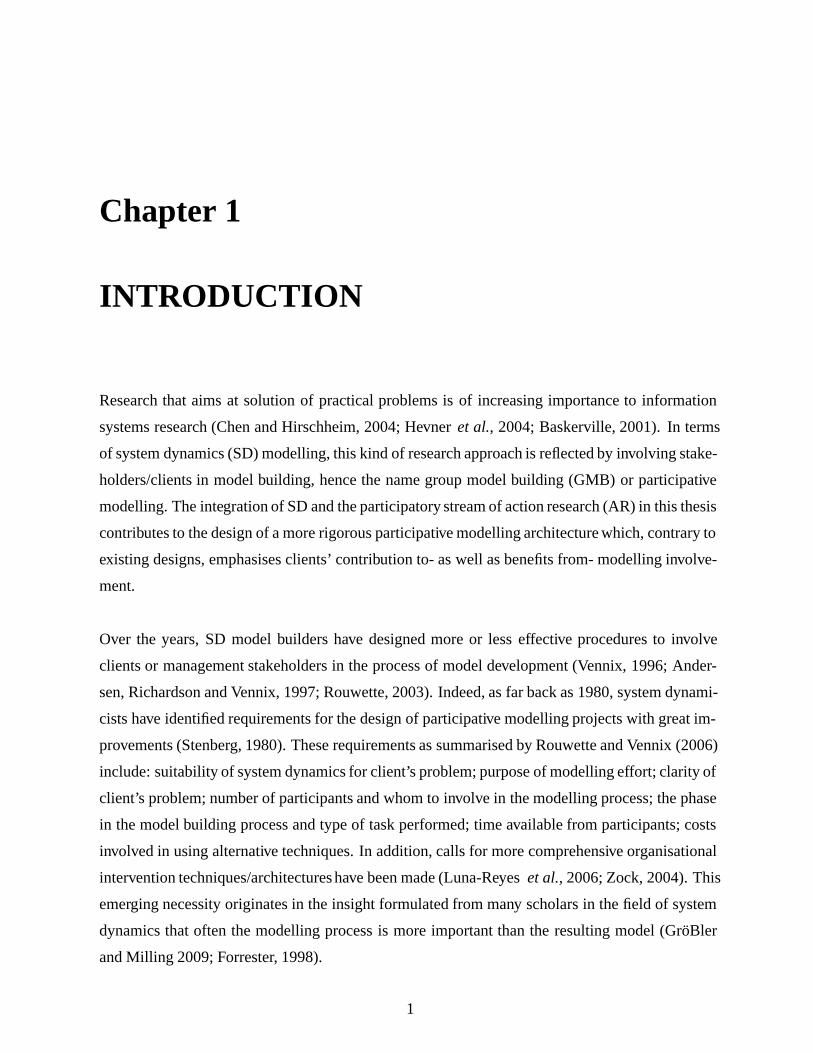
Research that aims at solution of practical problems is of increasing importance to information
systems research (Chen and Hirschheim, 2004; Hevneret al., 2004; Baskerville, 2001). In terms
of system dynamics (SD) modelling, this kind of research approach is reflected by involving stake-
holders/clients in model building, hence the name group model building (GMB) or participative
modelling. The integration of SD and the participatory stream of action research (AR) in this thesis
contributes to the design of a more rigorous participative modelling architecture which, contrary to
existing designs, emphasises clients’ contribution to- as well as benefits from- modelling involve-
ment.
Over the years, SD model builders have designed more or less effective procedures to involve
clients or management stakeholders in the process of model development (Vennix, 1996; Ander-
sen, Richardson and Vennix, 1997; Rouwette, 2003). Indeed, as far back as 1980, system dynami-
cists have identified requirements for the design of participative modelling projects with great im-
provements (Stenberg, 1980). These requirements as summarised by Rouwette and Vennix (2006)
include: suitability of system dynamics for client’s problem; purpose of modelling effort; clarity of
client’s problem; number of participants and whom to involve in the modelling process; the phase
in the model building process and type of task performed; time available from participants; costs
involved in using alternative techniques. In addition, calls for more comprehensive organisational
intervention techniques/architectureshave been made (Luna-Reyeset al.,2006; Zock, 2004). This
emerging necessity originates in the insight formulated from many scholars in the field of system
dynamics that often the modelling process is more important than the resulting model (GroBler
and Milling 2009; Forrester, 1998).
1
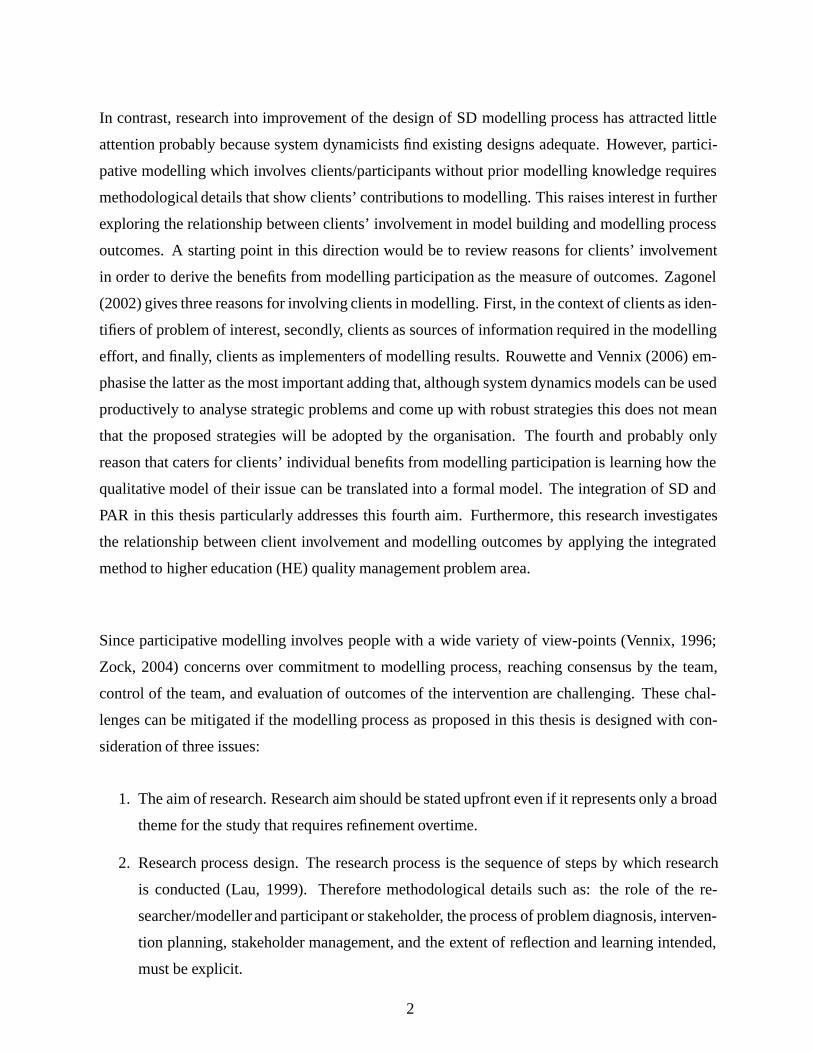
In contrast, research into improvement of the design of SD modelling process has attracted little
attention probably because system dynamicists find existing designs adequate. However, partici-
pative modelling which involves clients/participants without prior modelling knowledge requires
methodological details that show clients’ contributions to modelling. This raises interest in further
exploring the relationship between clients’ involvement in model building and modelling process
outcomes. A starting point in this direction would be to review reasons for clients’ involvement
in order to derive the benefits from modelling participation as the measure of outcomes. Zagonel
(2002) gives three reasons for involving clients in modelling. First, in the context of clients as iden-
tifiers of problem of interest, secondly, clients as sources of information required in the modelling
effort, and finally, clients as implementers of modelling results. Rouwette and Vennix (2006) em-
phasise the latter as the most important adding that, although system dynamics models can be used
productively to analyse strategic problems and come up with robust strategies this does not mean
that the proposed strategies will be adopted by the organisation. The fourth and probably only
reason that caters for clients’ individual benefits from modelling participation is learning how the
qualitative model of their issue can be translated into a formal model. The integration of SD and
PAR in this thesis particularly addresses this fourth aim. Furthermore, this research investigates
the relationship between client involvement and modelling outcomes by applying the integrated
method to higher education (HE) quality management problem area.
Since participative modelling involves people with a wide variety of view-points (Vennix, 1996;
Zock, 2004) concerns over commitment to modelling process, reaching consensus by the team,
control of the team, and evaluation of outcomes of the intervention are challenging. These chal-
lenges can be mitigated if the modelling process as proposed in this thesis is designed with con-
sideration of three issues:
1. The aim of research. Research aim should be stated upfront even if it represents only a broad
theme for the study that requires refinement overtime.
2. Research process design. The research process is the sequence of steps by which research
is conducted (Lau, 1999). Therefore methodological details such as: the role of the re-
searcher/modellerand participant or stakeholder, the process of problem diagnosis, interven-
tion planning, stakeholder management, and the extent of reflection and learning intended,
must be explicit.
2
3. Criteria of evaluation of research impact. Two level evaluations may be needed in participa-
tive modelling: first, on the basis of research aim and secondly, on basis of intended learning
by the participants and modellers.
1.1 Background
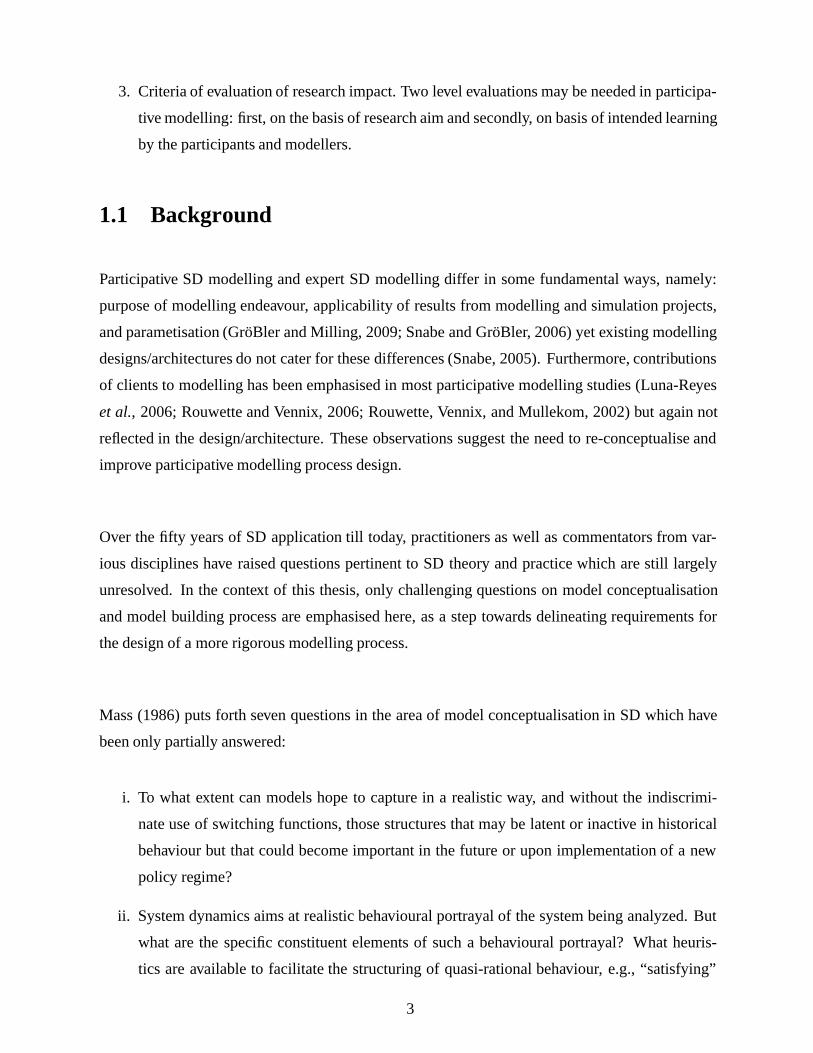
Participative SD modelling and expert SD modelling differ in some fundamental ways, namely:
purpose of modelling endeavour, applicability of results from modelling and simulation projects,
and parametisation (GroBler and Milling, 2009; Snabe and GroBler, 2006) yet existing modelling
designs/architectures do not cater for these differences (Snabe, 2005). Furthermore, contributions
of clients to modelling has been emphasised in most participative modelling studies (Luna-Reyes
et al., 2006; Rouwette and Vennix, 2006; Rouwette, Vennix, and Mullekom, 2002) but again not
reflected in the design/architecture. These observations suggest the need to re-conceptualise and
improve participative modelling process design.
Over the fifty years of SD application till today, practitioners as well as commentators from var-
ious disciplines have raised questions pertinent to SD theory and practice which are still largely
unresolved. In the context of this thesis, only challenging questions on model conceptualisation
and model building process are emphasised here, as a step towards delineating requirements for
the design of a more rigorous modelling process.
Mass (1986) puts forth seven questions in the area of model conceptualisation in SD which have
been only partially answered:
i. To what extent can models hope to capture in a realistic way, and without the indiscrimi-
nate use of switching functions, those structures that may be latent or inactive in historical
behaviour but that could become important in the future or upon implementation of a new
policy regime?
ii. System dynamics aims at realistic behavioural portrayal of the system being analyzed. But
what are the specific constituent elements of such a behavioural portrayal? What heuris-
tics are available to facilitate the structuring of quasi-rational behaviour, e.g., “satisfying”
3
behaviour?
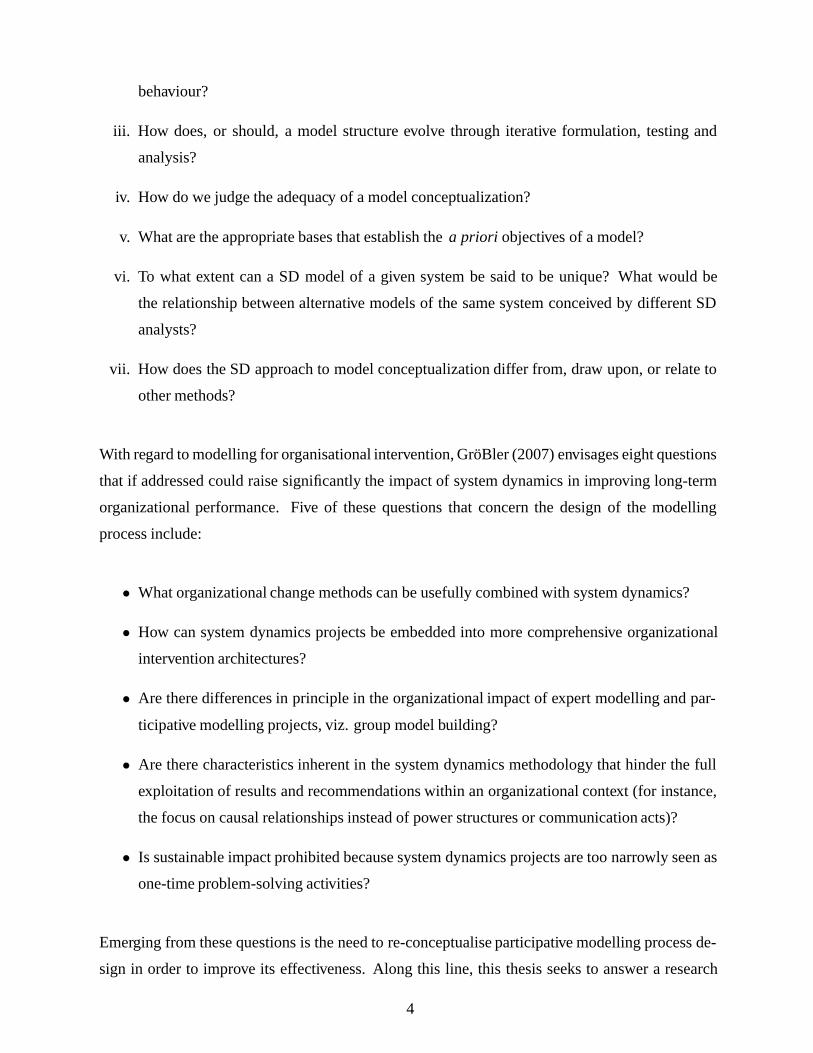
iii. How does, or should, a model structure evolve through iterative formulation, testing and
analysis?
iv. How do we judge the adequacy of a model conceptualization?
v. What are the appropriate bases that establish thea priori objectives of a model?
vi. To what extent can a SD model of a given system be said to be unique? What would be
the relationship between alternative models of the same system conceived by different SD
analysts?
vii. How does the SD approach to model conceptualization differ from, draw upon, or relate to
other methods?
With regard to modelling for organisational intervention, GroBler (2007) envisages eight questions
that if addressed could raise significantly the impact of system dynamics in improving long-term
organizational performance. Five of these questions that concern the design of the modelling
process include:
• What organizational change methods can be usefully combined with system dynamics?
• How can system dynamics projects be embedded into more comprehensive organizational
intervention architectures?
• Are there differences in principle in the organizational impact of expert modelling and par-
ticipative modelling projects, viz. group model building?
• Are there characteristics inherent in the system dynamics methodology that hinder the full
exploitation of results and recommendations within an organizational context (for instance,
the focus on causal relationships instead of power structures or communication acts)?
• Is sustainable impact prohibited because system dynamics projects are too narrowly seen as
one-time problem-solving activities?
Emerging from these questions is the need to re-conceptualise participative modelling process de-
sign in order to improve its effectiveness. Along this line, this thesis seeks to answer a research
4
question at the interface of modelling design and outcomes in a manner that subsumes some of the
preceeding questions. Details about this and other research questions investigated in this thesis are
given in section 1.4.
In order to contribute to the design of a more rigorous participative modelling architecture this
research integrates insights from action planning and action learning with the prevalent procedures
for client involvement in participative modelling, culminating into an integrated approach also re-
ferred to as SyDPAR (from SD and PAR). A rigorous design implies the modelling architecture
capable of producing strong results by emphasising the contributions of all parties (modellers and
clients) involved in model building. In the context of SyDPAR, this is achieved through iterations
in three cycles, namely: problem articulation, modelling proficiency, and solution refinement, as
explicitly discussed in chaper 3. The relevance of SyDPAR is tested on HE quality management
problem area, as a method suitable for solving un-structured, non-linear and dynamically complex
problems in an environment of multiple stakeholders’ views. More specifically, SyDPAR supports
triangulation of hard scientific data with the existing knowledge of practitioners, such that the
knowledge of general systems theory of the researchers/modellers intersect with practical theory
of practitioners during the research process.
1.1.1 The Higher Education Quality Management Case
Researchers now regard quality as the single most important factor for long-term success and sur-
vival of HEIs (Umashankar and Dutta, 2007; Williams and Van Dyke, 2007; World Bank, 2000).
At the same time, HE is perceived as a highly complex system, which is embedded within the
broader cultural, political, and economic context. Each interdependent component of the HE qual-
ity system influences the other components in often unforeseeable and unpredictable ways. Hence,
the quality of teaching, students’ outcomes and research may be as much determined by factors
external to the system as to those directly within the control of education planners and managers
(Srikanthan and Dalrymple, 2007). New methods may be required to address the current quality
management challenges only if they provide a guiding framework for realistic quality problem
conceptualisation against which an intervention can be made. Such a framework should be an-
chored on problematic data as is the case with reference modes in system dynamics. With regard
to this research, the latter insight served as a starting point.
5
Sources of Problems in Higher Education Quality Management Applications
Several Decision Support Systems for HE quality management issues are currently available with
differentiated focus and capabilities. These have been developed using approaches and technolo-
gies such as: data warehousing (Vinnik and Scholl, 2005; Welsh and Dey, 2002), system dynamics
(Barlas and Diker, 2000; Kennedy, 2002), hierarchical linear modelling (Try and Grogaard, 2003),
multi-criteria decision making (Ho et al., 2006), goal programming (Ho, Higson and Dey, 2007),
analytic hierarchy process (Badri and Abdulla, 2004; Grandzol, 2005), and data mining (Maltzet
al., 2007).
Specifically, the focus of these systems have been on various aspects of quality management in-
cluding: strategic management (Barlars and Diker, 2000); performance assessment and outcomes
assessment (Deniz and Ersan, 2001); quality measurement (Welsh and Dey, 2002); resource man-
agement (Vinnik and Scholl, 2005); and enrolment management (Maltz et al., 2007). However,
other areas have not received as much attention. Little is known about quality improvement ver-
sus enrolment management, except for suggestions that institutions should integrate their quality
improvement and enrolment management efforts with their mission, role and strategic directions
(Schray, 2006; Welsh and Dey, 2002; Tavenas, 2004; Csizmadia, 2006). In other cases the prob-
lem scope is signifantly reduced to suit its method, for instance Vinnik and Scholl (2005) develop
a Decision Support System (DSS) for managing student enrolment with available resources, but
only focus on teaching staff resource, claiming that staff availability is by far the most crucial re-
source constraint, expensive and hardly adjustable in the short-term compared to other resources
involved, such as facilities, budget, appliances, materials etc.
Srikanthan and Dalrymple (2007, p.186) suggest that a holistic model for quality management
would be well served, “if one could develop an implementation methodology by only systemically
monitoring quality improvement”. This however, would fall short of realisation in environments
where demand and supply of education equilibrium is unattainable. For example, economic chal-
lenges especially in the developing countries have resulted into higher priority on higher education
provision over quality improvement strategies.
Generally, funding requirements for research development, staff development, curriculum devel-
opment, teaching resources, etc, exist in all HEIs. Ideally, actual allocation of funds should be
6
based on funding demands, but this is usually not the case especially when income is insufficient.
As such percentage rationing is used in favour of higher priority funding item. Consequently, at-
tempting to increase percentage allocations to one item creates an equivalent percentage decrease
on another or several other items combined, leading to no lasting solution. On the other hand, each
item has a different scale of effect on quality, and therefore, effecting correct changes for desired
outcomes is challenging. This study aims to address this challenge through adoption of the inte-
grated research design in conceptualising, representing, and analysing policy directions for quality
improvements while taking into consideration the inherent complexity and feedbacks within the
quality system structure.
From the systemic perspective, the sources of HE quality problems can be generally considered to
arise from:
1. The complexity of quality management problems, rendering their integration difficult and
hence their cumulative effect may be inconsistent or highly varied. This arises from the
nature of the factors that influence quality, transcending the qualitative-to-quantitative land-
scape (Barnab´e, 2004; William and Van Dyke, 2007), i.e, some are qualitative in nature,
while others are quantitative, and the rest are of the qualitative/quantitative mixed type.
2. The dynamics of quality management itself. This is challenging because HE changes are
continuously unfolding, non-linear, full of unforeseen contingencies, and revised strategies
(Parker, 2002; Kennedy, 2002). Huitemaet al. (2002) use the term, “external dynamics”
in higher education quality to explain the scenario whereby, tackling one problem (e.g.,
students’ capacity) exposes another (e.g. teaching quality).
3. Complexity of feedbacks in quality issues leading to adoption of methods that delineate a set
of quality problems facets as more worthy of attention than others rather than all conceivable
facets of quality problems.
4. The diverse perception of quality problems by different stakeholders leading to claims that
render research on quality less attractive such as “quality is difficult to measure” (Parker,
2002; Srikanthan and Dalrymple, 2007); good policies on quality are based on personal
knowledge rather than simulation experiments (Grandzol, 2005; Barnab´e, 2004).
HE quality management problems are thus inherently non-linear, un-structured, and dynamic.
Consistent decision-making over such problem characteristics requires an approach that transends
7
the qualitative-to-quantitative continuum. Existing methods address the facets of quality problems
rather selectively, raising doubts as to whether any methods exist which address all conceivable
facets of quality problems. Indeed, the facets of quality problems are linked with ontoepistemo-
logical dispositions, no single method (or no set of methods emanating from a single theoreti-
cal position) can address all facets of quality satisfactorily. On the other hand, system dynamics
modelling has been increasingly used to develop both quantitative and qualitative models for the
analysis of policy and managerial issues. By involving HE stakeholders in the modelling process
using the SyDPAR architecture, this research demonstrates greater outcomes and insights from
modelling right from problem definition, through system description, model equations develop-
ments, system simulation, to evaluation of alternative policies and choice of a better policy for
implementation.
1.2 Problem Statement
The need to develop new innovative ways of increasing clients’ involvement in modelling has
been underscored by leading participative SD researchers (Rouwette and Hoppenbrouwers, 2008;
Schwaninger and Grosser, 2008; Luna-Reyeset al., 2006; Rouwette and Vennix, 2006; Scholl,
2004). This has been attributed to the abstract SD modelling architectures that do not explic-
itly reflect clients’ contribution to modelling, neither their benefits from involvement in modelling
(Scholl, 2004; Schwaninger and Grosser, 2008).
In order to contribute to the design of a more client centred participative modelling architecture,
this research integrates insights from action planning and action learning with the prevalent proce-
dures for client involvement in participative modelling. The relevance of the integrated approach
is tested on HE quality management problem area, as a method suitable for solving un-structured,
non-linear and dynamically complex problems in an environment of multiple stakeholders’ views.
1.3 Aims and Objectives
This thesis integrates SD and PAR. A method produced in this way should be able to improve the
participative modelling outcomes by increasing clients’ involvement in modelling (Scholl, 2004).
Thus, the aim of this research is to develop a more rigorous participative modelling architecture.
8
Rigorous in the sense that it produces strong results while maximising the contributions of both
clients and modellers as well as their benefits from modelling involvement. The relevance of the
new architecture in solving complex practical problems is tested on HE quality problem area.
1.3.1 Specific Objectives
The research aim is addressed through the following specific objectives:
i. Investigate the benefits of integration of SD and PAR.
ii. Develop a rigorous participative modelling process architecture by integrating SD and PAR.
iii. Develop an SD simulation model for HE quality management using the integrated approach.
iv. Validate the model using the standard SD tests and benchmarked quality checklists.
v. Validate the integrated approach as a method for solving complex dynamic problems in
participatory settings.
1.4 Research Questions
Given the comprehensive nature of HE quality concerns and the multi-disciplinary character of this
research, three complementary research questions are investigated. The first, addresses method-
ological issues in participative modelling using insights from integration of SD and PAR. The
others provide empirical test for the assumptions in the first question.
i. How might SD and PAR integration be useful in designing more rigorous participative mod-
elling projects?
ii. What factors influence HE quality and how are they related?
iii. What higher education quality management problems should be addressed by future DSS?
With these as our heuristic point of departure, this research accomplished two complementary
outputs: 1) a rigorous design for participative modelling referred to as SyDPAR; 2) a quality
9
management tool referred to as QMT09 as a landmark model against which future DSS on HE
quality issues can be built.
1.5 Dynamic Hypothesis
A dynamic hypothesis is a theory about how structure and decision policies generate the observed
behaviour (Oliva, 2003). This theory is conveyed by a model in which the causal link between
structure (captured in terms of equations and parameters) and the simulated behavioural output
arise from interaction of the equations and initial conditions. In presenting the dynamic hypothesis
in this research, the problem of quality volatility in higher education is explained by a complex
relationship involving but not restricted to: resources dynamics (planned resources versus actual
resources), funding, quality of staff, quality of research, and quality of teaching. This relationship
is represented in Figure 1.1 as a simplified theory for enquiry into HE quality improvement issues.
As shown in Figure 1.1, seven dominant feedback loops can be identified. Four of these loops
are reinforcing loops and the rest balancing loops. A feedback loop is called positive, as indicated
by Ri (i = 1, 2, -,-), if it contains an even number of negative causal links. Similarly, a feedback
loop is called negative, as indicated by Bi, if it contains an odd number of negative causal links.
Furthermore, a positive or reinforcing feedback loop, reinforces change with even more change
whereas a negative or balancing feedback loop seeks a goal, i.e., if the current level of the variable
of interest is above the goal, then the loop structure pushes its value down, while if the current
level is below the goal, the loop structure pushes its value up.
10
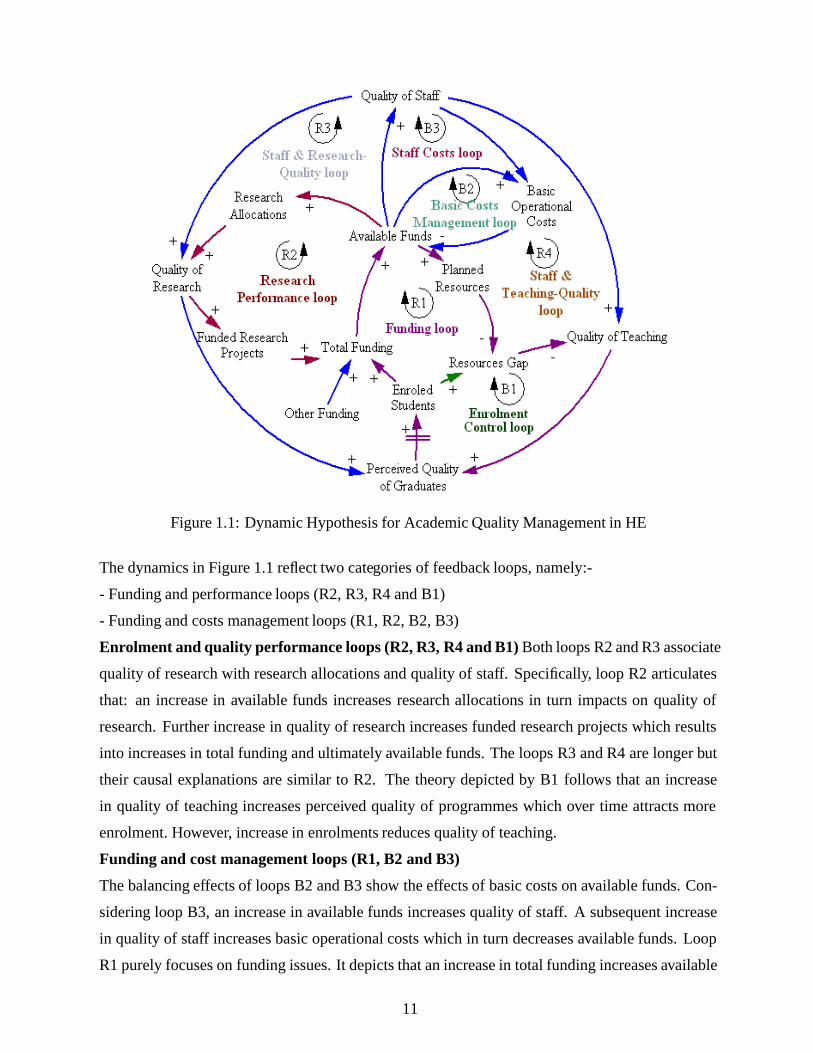
Figure 1.1: Dynamic Hypothesis for Academic Quality Management in HE
The dynamics in Figure 1.1 reflect two categories of feedback loops, namely:-
- Funding and performance loops (R2, R3, R4 and B1)
- Funding and costs management loops (R1, R2, B2, B3)
Enrolment and quality performance loops (R2, R3, R4 and B1)Both loops R2 and R3 associate
quality of research with research allocations and quality of staff. Specifically, loop R2 articulates
that: an increase in available funds increases research allocations in turn impacts on quality of
research. Further increase in quality of research increases funded research projects which results
into increases in total funding and ultimately available funds. The loops R3 and R4 are longer but
their causal explanations are similar to R2. The theory depicted by B1 follows that an increase
in quality of teaching increases perceived quality of programmes which over time attracts more
enrolment. However, increase in enrolments reduces quality of teaching.
Funding and cost management loops (R1, B2 and B3)
The balancing effects of loops B2 and B3 show the effects of basic costs on available funds. Con-
sidering loop B3, an increase in available funds increases quality of staff. A subsequent increase
in quality of staff increases basic operational costs which in turn decreases available funds. Loop
R1 purely focuses on funding issues. It depicts that an increase in total funding increases available
11
funds (after some cost deductions). Subsequently an increase in available funds over time increases
enrolled students and when more students are enrolled then more total funding is achieved.
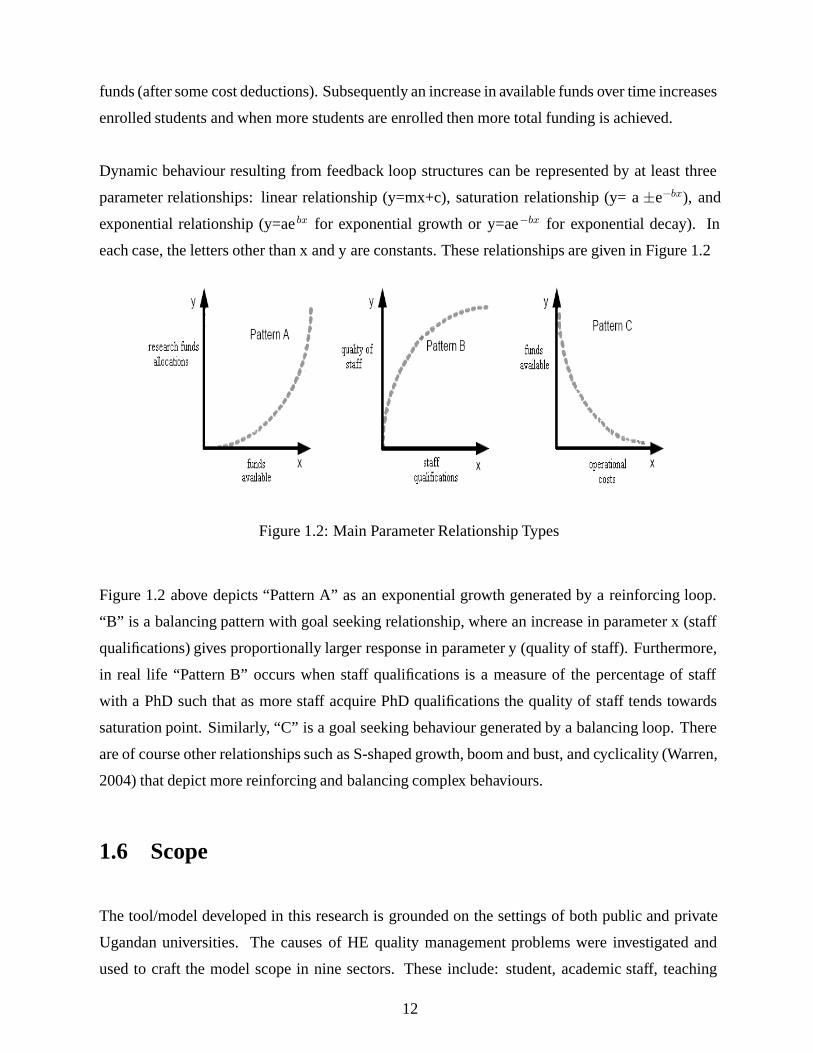
Dynamic behaviour resulting from feedback loop structures can be represented by at least three
parameter relationships: linear relationship (y=mx+c), saturation relationship (y= a±e−bx), and
exponential relationship (y=aebx for exponential growth or y=ae−bx for exponential decay). In
each case, the letters other than x and y are constants. These relationships are given in Figure 1.2
Figure 1.2: Main Parameter Relationship Types
Figure 1.2 above depicts “Pattern A” as an exponential growth generated by a reinforcing loop.
“B” is a balancing pattern with goal seeking relationship, where an increase in parameter x (staff
qualifications) gives proportionally larger response in parameter y (quality of staff). Furthermore,
in real life “Pattern B” occurs when staff qualifications is a measure of the percentage of staff
with a PhD such that as more staff acquire PhD qualifications the quality of staff tends towards
saturation point. Similarly, “C” is a goal seeking behaviour generated by a balancing loop. There
are of course other relationships such as S-shaped growth, boom and bust, and cyclicality (Warren,
2004) that depict more reinforcing and balancing complex behaviours.
1.6 Scope
The tool/model developed in this research is grounded on the settings of both public and private
Ugandan universities. The causes of HE quality management problems were investigated and
used to craft the model scope in nine sectors. These include: student, academic staff, teaching
12
and learning, research and publication, finance and budgeting, educational resources, government,
community, and institutional quality standards. Data for model validation and calibration were
mainly obtained from Makerere University through participative engagement with stakeholders
coordinated by the quality assurance directorate. Supplementary parameter verification data was
collected from four leading Ugandan universities, including: the two oldest public universities
(Makerere University and Mbarara University of Science and Technology) and two private univer-
sities (Uganda Christian University and Uganda Martyrs University).
1.7 Justification of the Research
In justifying this research, this thesis argues from three perspectives: importance of the problem;
appropriateness of the methodology; and the research contribution.
First, the challenge involved in modelling quality is in defining the problem space (problem mod-
elled) then mapping it with the solution space (model of the problem). This is confirmed by Parker
(2002) who recognises that “university change will be continuously unfolding, nonlinear, dynamic
process full of unforeseen contingencies, modified pathways and revised strategies”. In this line,
this thesis integrates SD and PAR on the premise of theoretical work that places SD and PAR in
the context of complementary methods, such as that described by Scholl (2004), needs to be fol-
lowed up by empirical research that puts underlying assumptions to the test. Since, as noted by
Sengeet al. (2000), “ideally, any model for management in any organisation can only succeed, if it
represents the shared values of the stakeholders” (p.162-3), this integration facilitates participation
of HE stakeholders and most importantly the decision makers throughout model development pro-
cess. In doing so, this thesis maintains that, the hybrid approach (SyDPAR) improves the model
conceptualisation process, translating into correct stock and flow diagrams, justifiable simulations,
and ultimately ownership of the model by the decision makers or stakeholders (model users).
Second, the appropriateness of the methodology is grounded on three principles: the salience
of issues studied, application of available knowledge and production of strong results by ensuring
relevance of the solution to a specific environment. These principles are core to the integrated
approach (SyDPAR) adopted in this research, as they are respectively addressed through: problem
articulation cycle, modelling proficiency cycle, and solution refinement cycle. These cycles are
explicitly discussed in chapter 3.
13
Thirdly, the overall contributions of this research are two fold: 1) methodological synthesis built
upon the positivist and interpretivist tradition for solving complex dynamic problems in participa-
tory settings through the integration of SD and PAR leading to the SyDPAR approach, and 2) appli-
cation of SyDPAR in developing a decision support tool for higher education quality management,
also referred to as “Quality Management Tool 2009 (QMT09)”. The details of the contributions
are given in chapter 6.
1.8 Theoretical Terms Used
The research uses terminology familiar to researchers and others involved in the study of decision
support systems for quality management. Therefore, to put this research in context, the theoretical
terms used are briefly described in this section. Since a term that is correctly defined renders it
functional within a specific enquiry, the five terms here discussed are drawn from the title of this
research.
Integration
The usefulness of integration of research methods in information systems (IS) research has been
due to the complexity of phenomena which requires information from a great number of perspec-
tives. Thus, some IS researchers maintain that the complexity of the majority of social interven-
tions requires the use of a wide spectrum of qualitative and quantitative methods (Robey, 1996;
Hevneret al., 2004). The term integration in the context of this research broadly implies the com-
bination of two methods, namely: SD and PAR. These approaches are envisaged to significantly
inform each other as there is a great degree of similarity and overlap between them (Scholl, 2004).
Action Research
Action research (AR) is fundamentally a change-oriented approach in which the central assump-
tion is that complex social processes can best be studied by introducing change into these processes
and observing their effects (Baskerville, 2001). AR is arguably useful in bridging theory with prac-
tice, and hence allowing one to solve real-world problems while contributing to the generation of
new knowledge (Lau, 1999). AR therefore offers the means of effecting change and generating
knowledge about the change simultaneously. A notable stream of AR that involves direct partici-
pation of practitioners in a dynamic research process, while evaluating the effects of actions with
regard to improving practice is PAR. Succinctly, Whyte (1991) defines PAR as research which
involves all relevant parties in actively examining together current action (which they experience
as problematic) in order to change and improve it.
14
System Dynamics
System dynamics (SD) is a computer-aided approach for analysing and solving complex problems
through policy design and analysis. The problems addressed by SD are based on the premise that
the structure of a system, that is, the way essential system components are connected, generates its
behaviour (Sterman, 2000). If dynamic behaviour arises from feedback within the system, finding
effective policy interventions requires understanding system structure. Once a model is built, it
can be used to simulate the effect of proposed actions on the problem and the system as a whole.
As Forrester (1994) notes, this kind of tool is necessary because, while people are good at observ-
ing the local structure of a system, they are not good at predicting how complex, interdependent
systems will behave.
Higher Education
The term higher education in this study is restricted to education at degree level and above.
This definition specifically excludes education at diploma level because of decreasing interest in
diploma studies by the educational stakeholders (e.g. students, employers of graduates, govern-
ment) at least in Ugandan case. Therefore, higher education courses are those leading to the award
of a Bachelor’s degree, post-graduate certificate, post-graduate diploma, Master’s degree or Doc-
toral degree.
Quality Management
Quality management has been defined in various perspectives. From the industrial practice, ISO
9000 defines quality management as the “aspect of overall management function that determines
and implements the quality policy, i.e., intentions and directions of the organisation”. Similarly,
Welsh and Dey (2002) define quality management from a technological perspective as a technol-
ogy based approach for generating and formatting information for performance assessment that
leads to improvement of quality. These two definitions present quality management concept as a
means to an end and not the end itself. In the context of higher education, quality management
is defined as the quality processes (control, assurance and improvement) by which an institution
discharges its corporate responsibility for articulating, maintaining and enhancing academic stan-
dards of those activities for which it is responsible (HEQC, 1995).
Adding to these different but related facets of quality managementconcept, this research introduces
a ‘benchmark’ perspective of quality management as the process/means by which an institution en-
sures that its core functions: education provision, research, and outreach services are satisfactory.
Integration of System Dynamics and Action Research with Application to Higher Education
Quality Management
This research comprises two complementary components: 1) the integration of system dynam-
15
ics and action research as a generic approach for participative modelling and 2) the development
of a computer simulation model for higher education quality management using the integrated
approach. While there is no panacea to complex and multi-faceted challenges of improving edu-
cational quality, this thesis’s title suggests that the integrated approach developed and successfully
applied in this research, provides a singular opportunity for management of quality of higher edu-
cation system.
1.9 Thesis Organisation
The rest of the thesis comprises of five chapters.
Chapter Two performs a critical literature review by identifying the existing intervention ap-
proaches and their suitability to specific quality management challenges/problems. The depth of
intervention approaches’ analysis goes beyond mere review; thus it also attempts classify the na-
ture of quality management problem against corresponding methodology.
Chapter Three outlines the research approach, starting with the the philosophical and theoretical
foundations while pointing out the ontological and epistemological assumptions. Thereafter, the
current approaches to quality management are evaluated. Subsequently, chapter three provides the
methodology for this research.
Chapter Four presents the guiding conceptual framework and the resulting field research design
including results of the field study.
Chapter Fiveaddresses the application of the proposed SyDPAR approach to HE quality manage-
ment. Specifically, chapter five discusses the model development including scope, assumptions,
audience, structure, calibration, and validation.
Chapter Six discusses the findings, conclusions and limitations of this research. The areas for
future research are also suggested in this chapter.
16
Chapter 2
LITERATURE REVIEW
2.1 Introduction
This chapter presents the literature review, analysis, and classification of HE quality management
systems’ research. With exception of the concluding section, the rest of the sections present the
literature review in four main categories: 1. trends in HE quality management research in section
2.2; 2. approaches to HE quality management in section 2.3; 3. systems and technologies used
in HE quality management in section 2.4, and 4. critical analysis of the causes of problems in
HE quality management in section 2.5. Since the integration of SD and PAR is core to this thesis,
SyDPAR is presented as one of the approaches for HE quality management including its theoretical
basis and relevance.
2.2 Trends in HE Quality Management Research
The trends implied in this section include: perceptions of quality, the excellence models that have
been adopted in HE quality studies, and the HE quality management frameworks as basis for the
conceptual framework proposed in this research.
17
2.2.1 Quality Perceptions
Defining quality of higher education has proved to be a challenging task. Cheng (2003) suggests
that education quality is a rather vague and controversial concept. At the broadest level, education
quality can be viewed as a set of elements that constitute the input, process and output of the ed-
ucation system, and provides services that completely satisfy both internal and external strategic
constituencies by meeting their explicit and implicit expectations (Cheng, 2003). If higher edu-
cation is viewed as a system, then any quality management program must therefore assess inputs,
process and outputs.
Contextual Perspective
Lindsay (1992) maintains that indeed, the notion of quality in higher education has no agreed
technical meaning and its use usually involves a heavy contextual overlay of some political or
educational position. For example, references to the quality of research, students’ supervision,
assessment, student intake, academic programs, teaching and learning, and program designs are
not uncommon. Any attempt to define or attach meaning to the term is largely ignored and one
is left to assume that it is ’high’ quality that is being referred to as opposed to ’good’ or ’poor’
quality.
Stakeholders Perspective
From the stakeholders perspective, Harvey and Green (1993) highlight the importance and value
of considering quality from a variety of stakeholder perspectives. The different HE stakeholders,
i.e., government, quality agencies, universities, individual academics, students, employers, parents
and the society, have the potential to think about quality in different ways. Similarly, five aspects
of quality, including: exception, perfection, fitness for purpose, value for money, and transforma-
tion, are attributed to stakeholders perspective (Harvey and Green, 1993). Watty (2003) further
elaborates on these aspects as follows:
• Exception: distinctive, embodied in excellence, passing a minimum set of standards;
• Perfection: zero defects, getting things right the first time (focus on process as opposed to
18
inputs and outputs);
• Fitness for purpose: relates quality to a purpose, defined by the provider;
• Value for money: a focus on efficiency and effectiveness, measuring outputs against inputs.
A populist notion of quality (government);
• Transformation: a qualitative change; education is about doing something to the student as
opposed to something for the consumer. Transformation includes concepts of enhancing and
empowering: democratisation of the process, not just outcomes.
These aspects with exception of perfection have been generally accepted as a matrix for quality
analysis. The key issue is the ability of the quality concept to facilitate the perspectives of a range
of stakeholders who have differing conceptions of higher education. The concern is that there will
be a direct relationship between the conception of higher education being taken, the definition of
quality being used and the performance indicators chosen to measure quality. The challenge is to
overcome these concerns and produce a performance evaluation framework that permits the equal
expression of legitimate voices, though they may conflict or compete in some ways (Tam, 2001).
Furthermore, Tam notes that these voices posses their own fully flaged imperatives of quality such
as:
• Stakeholders’ Driven Imperatives - the constituents of whom are students, parents, alumnus,
employment market leading to the strategic and customer focus;
• Regulatory Driven Imperatives the constituents of whom are the government, and other
academic institutions of higher learning leading to the curriculum, teaching, learning and
research, and students development focus, and benchmarking;
• University Driven Imperatives the constituents of whom are the administrators, the support
and service units, the faculty and personnel’s focus.
Whether contextual or stakeholders perspective, HE in general aims to ensure quality of all its
activities. Notably, the contextual view of quality of HE in terms of performance in research, stu-
dents’ supervision and assessment, teaching and learning, are all sustained by resources (students,
staff, and finances). Similarly, the view of quality of education as a measure of satisfaction of its
19
stakeholders is also underpinned by resources. Accordingly, Csizmadia’s (2006) input-throughput-
output model for HE quality is well served given that resources correspond with inputs, perfor-
mances issues are throughputs and satisfaction issues as outputs. Therefore, quality should not be
independently positioned in a contextual or stakeholders perspective but a combination of these.
2.2.2 Excellence Models
Excellence models emphasize the perfection aspect of quality, i.e., zero defects, getting things
right the first time or focus on process as opposed to inputs and outputs. From the performance
assessment literature, Conti (2003, as cited by Shawyun, 2006) identifies 5 key “excellence and
improvement” models as:
1. ISO 9000 Standards
2. EFQM Excellence Model
3. Malcolm Baldridge Model
4. Deming Application Prize Model
5. Other TQM models, proposed by other organizations, authors, consultants specially conceived
for organizational improvement.
Conti (2002) contends that models 2, 3 and 4 can be used for excellence recognition, “level of
quality” recognition and organization improvement, whereas model 1 can be used for conformity
and performance assessment. In a more recent study, Csizmadia (2006, p.72) cautions that the
simplistic application of models from industry such as these excellence models in HE is unlikely
to improve quality. With exception of the Deming Prize Model as its equivalence for educational
issues are not yet well developed, a brief discussion on rest is given next.
ISO 9000 Standards
ISO 9000 is the generic reference for a family of standards on quality management. It comprises
five parts, three of which are more relevant to education quality. These include: ISO 9000:2000,
which covers quality management and quality assurance standards; ISO 9001:2000, which is the
actual specification for a quality management system; and ISO 9004:2000, which is designed as
a guide for those organisations that want further improvement of their quality system. Worthy of
mention is that ISO 9001 is the only standard in these series for certification the other two are for
20
guidance. Without going into details of each, only the more general standard (ISO 9000:2000) is
discussed here.
ISO 9000:2000 provides four requirements for quality management systems of organizations:
(1) Quality management system - defines general and documentation requirements of this standard
(2) Management responsibility - defines management commitment, customer focus, quality policy,
planning, responsibility, authority, and communication, and management review
(3) Resource management - deals with all resources within the organization in order to improve
the quality. This section covers provision of resources, human resources, infrastructure of the or-
ganization and work environment.
(4) Product realization - defines planning, customer related processes, design and development,
production and service provision, and control of measuring and monitoring devices.
While it may be logical to assert that ISO 9000 does nothing to ensure actual quality of products or
services, but its registration merely indicates a ’system’ which fulfills the often vague requirements
of the standard, it has on the other hand, been estimated that only 30% of all applicants pass the
on-site audit on the first attempt (Coppola, 1994). A valid limitation of ISO 9000 standard is the
lack of self-assessment strategy which is considered important by most excellence models.
EFQM
The success of the Baldrige Model (USA) and the Deming prize (Japan) encouraged the forma-
tion of the European Foundation for Quality Management (EFQM) in 1988. The EFQM excellence
model was introduced in 1991 with the European Quality Award being awarded for the first time in
1992. Although EFQM represents different organisational areas, it has over the years been mainly
implemented by industrial organizations. These organizations have currently built up much expe-
rience in the issues to be addressed when aiming for successful implementation of the model. Till
now it has been used in various industries such as schools, hospitals, police and public organiza-
tions (EFQM, 2002; Umashankar and Dutta, 2007).
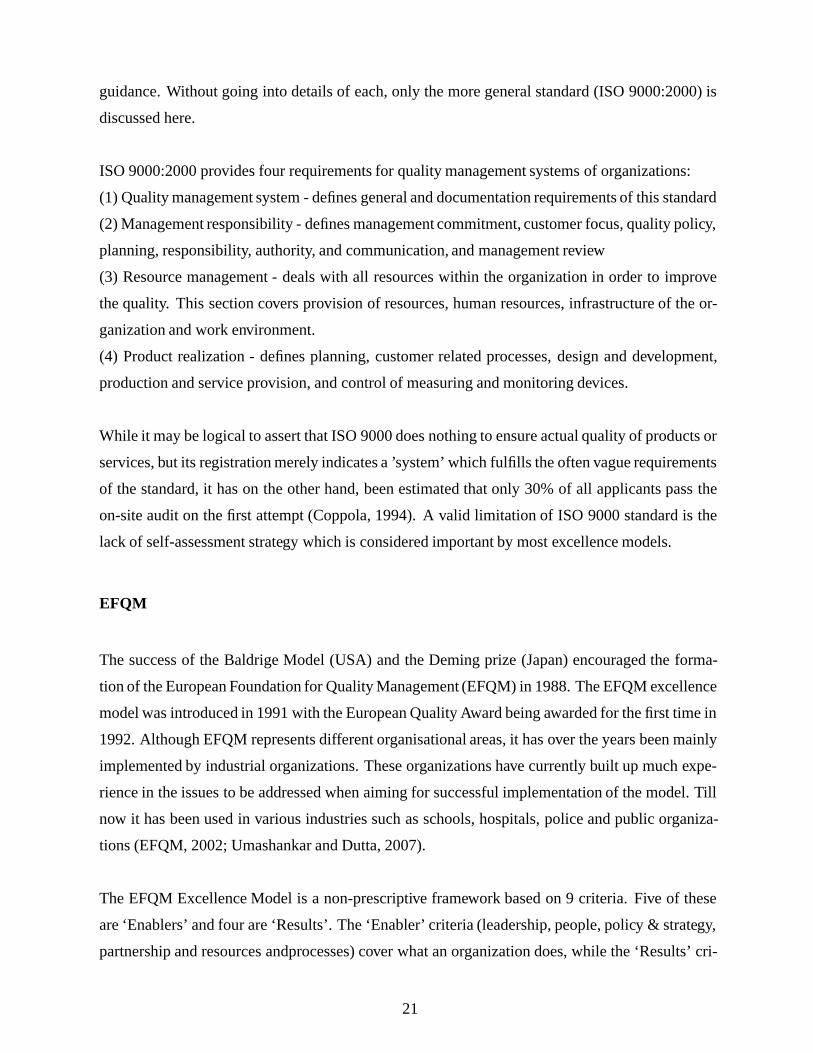
The EFQM Excellence Model is a non-prescriptive framework based on 9 criteria. Five of these
are ‘Enablers’ and four are ‘Results’. The ‘Enabler’ criteria (leadership, people, policy & strategy,
partnership and resources andprocesses) cover what an organization does, while the ‘Results’ cri-
21
teria (people results, customer results, impact on society results and business results) cover what
an organization achieves. ‘Results’ are caused by ‘Enablers’ and ‘Enablers’ are improved using
feedback from ‘Results’. This is depicted by the arrows in EFQM Model as presented in Figure 2.1.
Figure 2.1: The EFQM Excellence Model (Source: Umashankar and Dutta, 2007)
The Model recognizes that there are many approaches to achieving sustainable excellence in all
aspects of performance, basing on the premise that: excellent results with respect to performance,
customers, people and society are achieved through leadership driving policy and strategy, that is
delivered through people, partnerships and resources, and processes (EFQM, 2002; Umashankar
and Dutta, 2007). Therefore, it may be assumed that the excellence of a higher education insti-
tution will depend primarily upon the processes that take place within its scope (namely teach-
ing/learning, research, and financial management) and the results that, through the processes, it is
able to achieve.
Malcolm Baldridge Model
Just like the other excellence models, the Malcolm Baldridge Model has been used in various
sectors such as manufacturing industries, health care, companies, government agencies, education
organisations, and others. Specific to the education sector, the 2004 Education Criteria for Perfor-
mance Excellence was developed (NIST, 2004). This concept of excellence is used in NIST (2004)
because: (1) it places the major focus on teaching and learning strategies; (2) it poses similar types
of challenges for all organizations regardless of resources and incoming student preparation and
abilities; (3) it is most likely to stimulate learning-related research and to offer a means to dissem-
inate the results of such research; and (4) it offers the potential to create an expanding body of
22
knowledge of successful teaching and learning practices in the widest range of organizations.
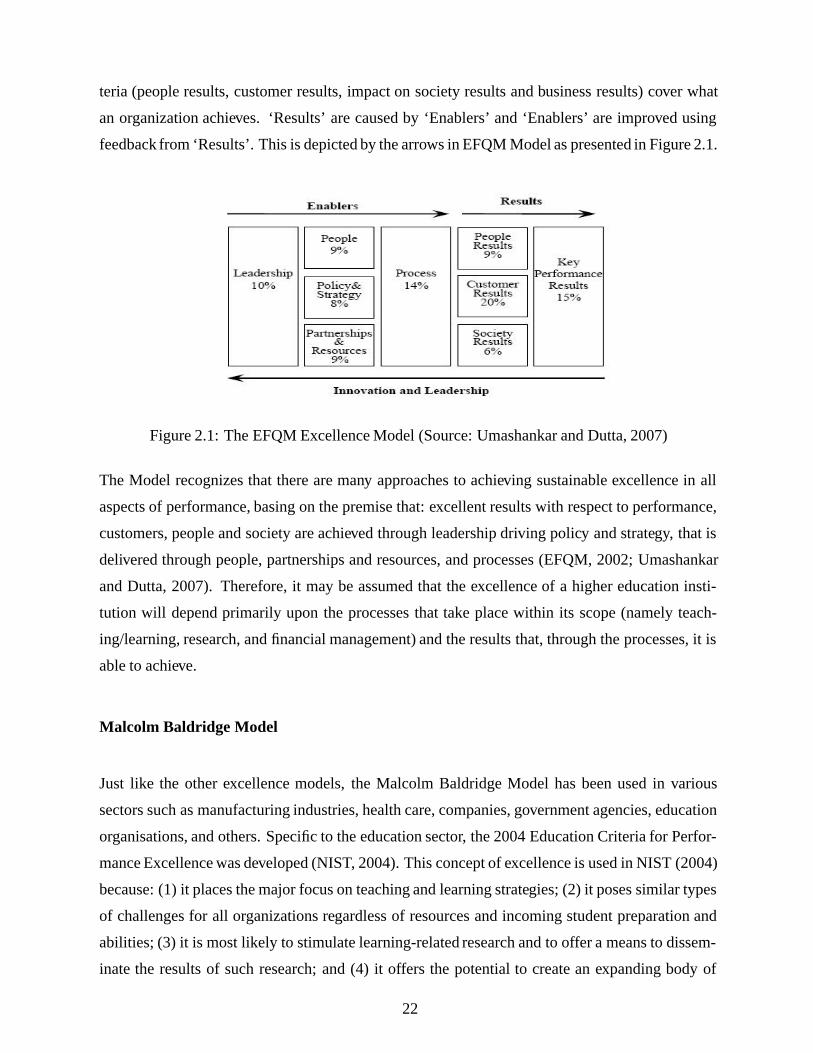
The Baldrige Criteria provide a systems perspective for managing your organization and its key
processes to achieve performance excellence. The core values and concepts embodied in the seven
Baldrige categories, include: a) Leadership, b) Strategic Planning, c) Student, Stakeholder, and
Market Focus, d) Measurement, Analysis, and Knowledge Management, e) Faculty and Staff Fo-
cus, f) Process Management, g) Organizational Performance Results. These are illustrated in the
Baldrige framework in Figure 2.2.
Figure 2.2: Baldrige Education Criteria for Performance Excellence Framework: A Systems Per-spective (Source: NIST, 2004)
A systems perspective includes the senior leaders’ focus on strategic directions and on students
and stakeholders. It means that the senior leaders monitor, respond to, and manage performance
based on organizational results. A systems perspective also includes using measures, indicators,
and organizational knowledge to build key strategies. It means linking these strategies with key
processes and aligning resources to improve overall performance and satisfy students and stake-
holders. Thus, a systems perspective means managing the whole organization, as well as its com-
ponents, to achieve success. For example, the organizational performance category focuses on
areas such as: (1) student learning results, (2) student- and stakeholder-focused results, (3) bud-
getary, financial, and market results, (4) faculty and staff results, (5) organizational effectiveness
results, including key, internal operational performance measures, and (6) governance and social
responsibility results.
23
TQM
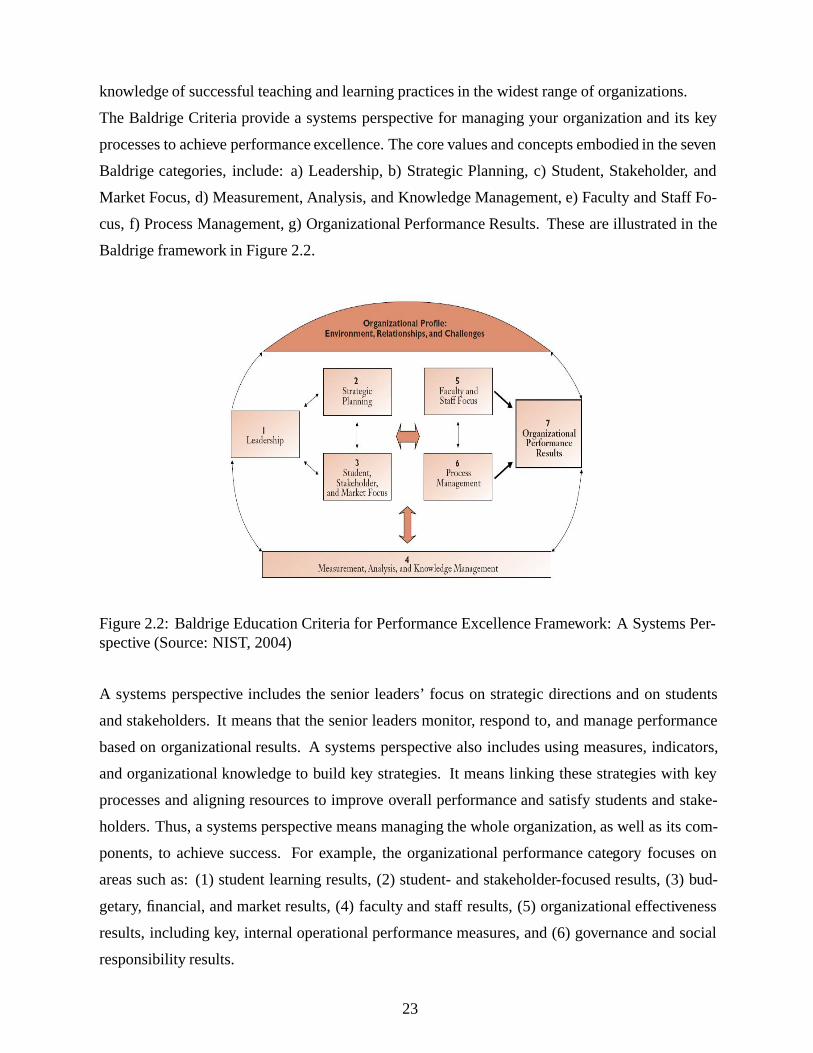
The TQM ‘movement’ has been very broad and covered many approaches and models, hence, it is
not possible to describetheTQM approach (Csizmadia, 2006). Following a review of literature on
excellence models, Csizmadia (2006) reports that quality: 1) is directed at customer satisfaction, 2)
should meet set requirements, 3) applies to every product (physical product, information product
and service product), 4) is a profitable long-term investment, 5) requires changing an organization’s
culture, 6) requires top management leadership, 7) is everybody’s job, 8) equates to “good business
practice and system”, 9) requires a focus on people, 10) is achieved through process improvement,
11) is improvement is forever and 12) is a fundamental long-term goal of the organization. In order
to traverse these perspectives, the development of a seamless “total”, “quality” and “management”
big picture integration that identifies the cause-effect system to measure and manage the quality of
the institution was inevitable. Figure 2.3 gives one of such TQM frameworks.
Figure 2.3: A Three-Dimensional perspective of TQM (Source: Lau and Anderson, 1998)
The TQM model as depicted in Figure 2.3 emphasises: the identification and improvement of
critical processes, satisfaction of stakeholders’ needs, data gathering and analysis, improvement of
24
the work environment, contact and communication among staff in different but related functions,
increased knowledge of what the organisations are about, and prevention of mistakes and errors
to minimise costs rather than being dependent on inspection activity and corrective actions. The
latter emphasis may not be feasible in highly complex systems like HE.
2.2.3 Quality Management Frameworks
A number of quality management frameworks have been proposed in the literature. Only the recent
ones are discussed here as these largely extend the previous ones.
The Comprehensive Quality Management Framework
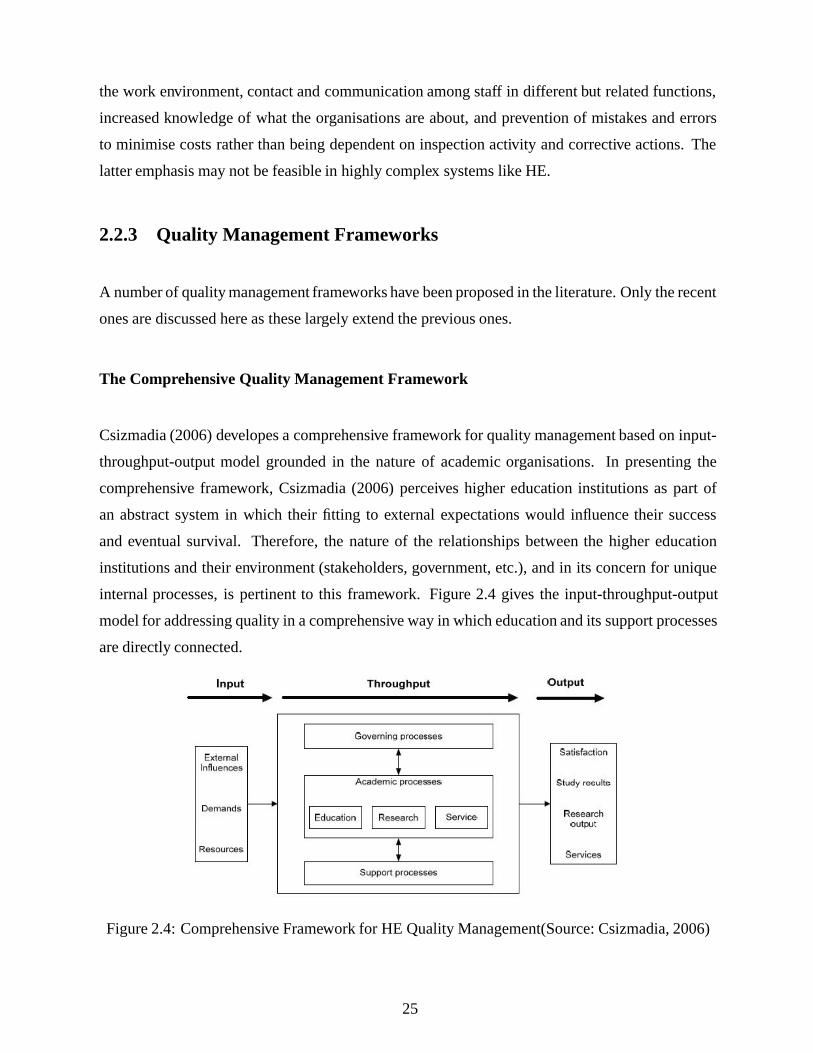
Csizmadia (2006) developes a comprehensive framework for quality management based on input-
throughput-output model grounded in the nature of academic organisations. In presenting the
comprehensive framework, Csizmadia (2006) perceives higher education institutions as part of
an abstract system in which their fitting to external expectations would influence their success
and eventual survival. Therefore, the nature of the relationships between the higher education
institutions and their environment (stakeholders, government, etc.), and in its concern for unique
internal processes, is pertinent to this framework. Figure 2.4 gives the input-throughput-output
model for addressing quality in a comprehensive way in which education and its support processes
are directly connected.
Figure 2.4: Comprehensive Framework for HE Quality Management(Source: Csizmadia, 2006)
25
As depicted in Figure 2.4, the inputs include: external influences (e.g., governmental expectations,
requirements of accreditationagencies), demands (expectations of students, academics, employers,
alumni, and the society), and resources (students, staff, and financial). The complete discussion on
the comprehensive framework can be found in Csizmadia’s (2006) PhD thesis. However, its rele-
vance to this thesis is in explicitly showing the systemic nature of HE in which both its environment
and its unique internal processes influence its outcomes and hence quality. More specifically, the
conceptual framework developed and presented in this thesis (Figure 4.1) extends elements of the
comprehensive framework into a systems structure with multiple feedbacks.
The Holistic Implementation Framework for Quality Management System
van Waveren (2004) proposes an implementation framework for a quality management system
based on the 1S0 9000:2000 series of quality management system standards. that can be utilised
by an academic department to standardise on quality requirements and the management of these
requirements. The framework is arguably applicable to an academic department incorporating both
academic, service and support functions.
The main reasons for this decision to focus on IS0 9000:2000 according to van Waveren (2004)
are three fold:
• There is a large overlap in quality management activities and requirements between the dif-
ferent business excellence models and the IS0 9000:2000 series of standards;
• The IS0 9000:2000 series is an internationally recognised standard and is a process based
standard, developed for a wide range of organisational types.
• The IS0 9000:2000 series, embraces all activities in an organisation that serve the satisfaction
of customers.
In consideration of the above, to be able to implement an appropriate quality management system
(QMS) in the academic department, a three dimensional implementation framework is envisaged.
The framework encompasses the mapping of a QMS requirements on the core and supporting
processes while considering all the different stakeholders and customers of each process step. The
conceptual representation of the framework is not given in this section, however, the insights from
it, namely, quality management systems requirements have been adapted (not adopted) in this
research in understanding general elements that constitute any quality management system.
26
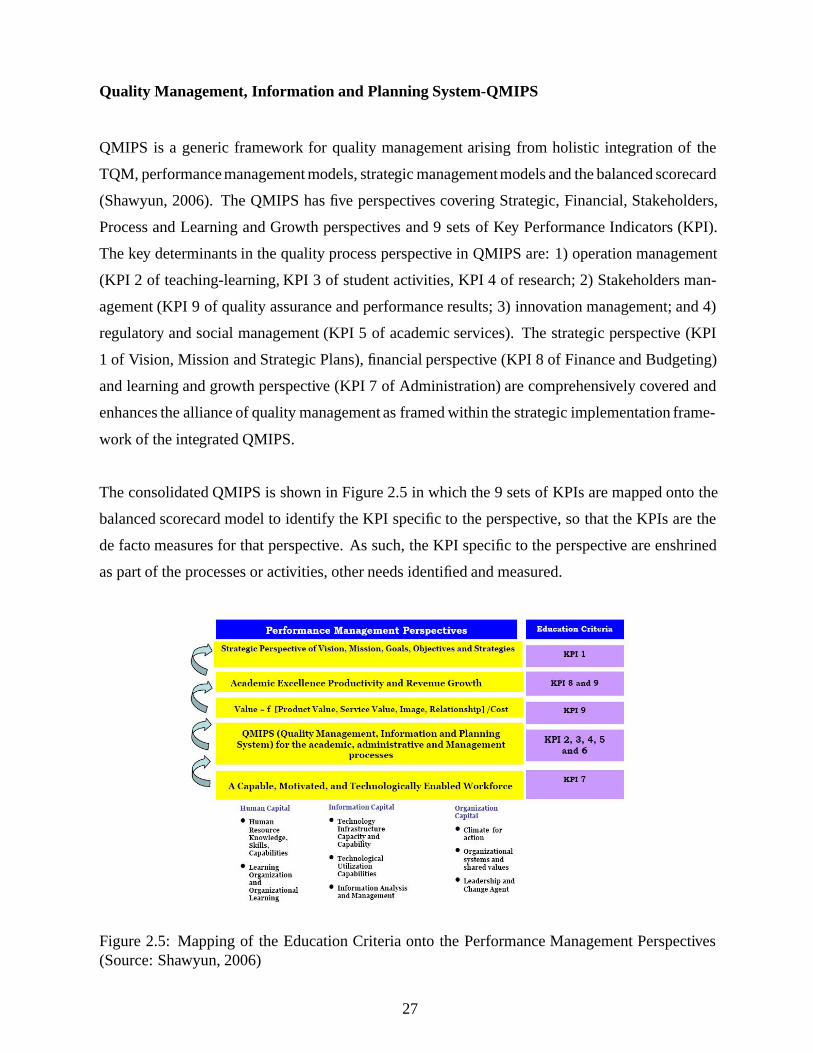
Quality Management, Information and Planning System-QMIPS
QMIPS is a generic framework for quality management arising from holistic integration of the
TQM, performancemanagement models, strategic managementmodels and the balanced scorecard
(Shawyun, 2006). The QMIPS has five perspectives covering Strategic, Financial, Stakeholders,
Process and Learning and Growth perspectives and 9 sets of Key Performance Indicators (KPI).
The key determinants in the quality process perspective in QMIPS are: 1) operation management
(KPI 2 of teaching-learning, KPI 3 of student activities, KPI 4 of research; 2) Stakeholders man-
agement (KPI 9 of quality assurance and performance results; 3) innovation management; and 4)
regulatory and social management (KPI 5 of academic services). The strategic perspective (KPI
1 of Vision, Mission and Strategic Plans), financial perspective (KPI 8 of Finance and Budgeting)
and learning and growth perspective (KPI 7 of Administration) are comprehensively covered and
enhances the alliance of quality management as framed within the strategic implementation frame-
work of the integrated QMIPS.
The consolidated QMIPS is shown in Figure 2.5 in which the 9 sets of KPIs are mapped onto the
balanced scorecard model to identify the KPI specific to the perspective, so that the KPIs are the
de facto measures for that perspective. As such, the KPI specific to the perspective are enshrined
as part of the processes or activities, other needs identified and measured.
Figure 2.5: Mapping of the Education Criteria onto the Performance Management Perspectives(Source: Shawyun, 2006)
27
The entire scope of QMIPS in terms of its five perspectives and 9 sets of KPI provide a robust and
generic model that incorporates quality management issues from a system’s perspective and hence
core to the development of quality management conceptual framework in this thesis. In addition,
the human capital, information capital, and organisation capital provide insight into the focus of
quality management frameworks.
Generic Model for Quality Management in Education-QME
Srikanthan and Dalrymple (2007) note that it is difficult to apply quality management models to
teaching and learning, because the quality management models are measurement focussed yet the
core processes of learning are too subtle to be measured meaningfully. Nevertheless, Srikanthan
and Dalrymple (2007) suggest specific issues of consideration for models of quality management
as follows:
• The product control is crucial for quality management: teaching in higher education is too
varied in its products, site delivered, delivery modes, processes and personnel to be con-
trolled;
• Customer focus is the key tenet of quality management models: in higher education the
identificationof the customers is a critical problem. The customers can variously be students,
employers, government etc;
• Managerial responsibility for quality;
• The empowerment of staff for quality improvement;
• Setting of standards that reflect customer requirements; and
• Avoidance of error and minimising variation.
Given the above perspectives, Srikanthan and Dalrymple (2007) maintain that a generic model for
quality in higher education would have to be more complex, to address service and pedagogical
aspects of quality uniquely. In such a composite model, quality management addressing the service
28
areas, should be meshed seamlessly with the model addressing the core areas of teaching and
learning. Such a synthesis is presented as the key features of a generic model addressing the
QualityManagement in Education (QME), including:
• a clear focus on “transformation” of the learners;
• a synergistic collaboration at the learning interface; and
• there is a clear role for commitment at all levels supported by senior management.
The insight from QME suggests that educational programmes should be continually designed and
redesigned based on stakeholder needs as well as organisational knowledge and expertise. As such,
the process of development of quality management tools are as important as the ensuing tools. We
discuss this further in section 5.3.
2.3 Current Approaches to Quality Management in HE
Various approaches have been used in HE quality research. The prominent ones include: statis-
tical analyses (e.g., Abdullah, 2006), multi-criteria decision making (analytic hierarchy process
(AHP), e.g., Grandzol, 2005 and goal programming (GP), e.g., Ho et al., 2006), data management
(data warehousing and data mining, e.g., Maltz et al., 2007; Vinnik and Scholl, 2005), system dy-
namics modelling and simulation (Barlas and Diker, 2000), hierarchical linear modelling (Try and
Grogaard, 2003), and participatory action research (Fletcher and Zuber-Skerritt, 2008). Discussing
these approaches according to the nature of HE problems solved as in the following sections, is
well suited for facilitating the understanding necessaty for comparative analysis of their effective-
ness.
2.3.1 System Dynamics Modelling
System dynamics is a computer based modelling approach for analysing and solving complex
problems through policy design and analysis. The problems addressed by SD are based on the
premise that the structure of a system, that is, the way essential system components are connected,
generates its behavior (Sterman, 2000). If dynamic behaviour arises from feedback within the
29
system, finding effective policy interventions requires understanding system structure. Once a
model is built, it can be used to simulate the effect of proposed actions on the problem and the
system as a whole. As Forrester (1998) notes, this kind of tool (SD model) is necessary because,
while people are good at observing the local structure of a system, they are not good at predicting
how complex, interdependent systems will behave.
Kennedy (2002) provides a comprehensive taxonomy of publications describing various system
dynamics models on higher education issues. These include topics such as: external forces, corpo-
rate governance, planning, resources and budgeting, human resource management, teaching qual-
ity, teaching practice, micro worlds, and enrolment demand. Without intention to ignite debate
on qualitative versus quantitative system dynamics models, starting with Kennedy’s taxonomy, it
seems necessary to further categorise these publications into quantitative (involving simulations)
and qualitative system dynamics. Doing so clarifies on previous trends of research as the basis for
further work.
The potential value of SD modelling in addressing higher education quality issues is in its ability
to:
• Model feedbacks or interactive views in dynamic systems like higher education
• Incorporate non-linear relationships inherent in higher educational quality issues
• Address complexity situations while experimenting their behaviour over time
• Accommodate soft factors such as effectiveness of students projects supervision, staff com-
petence, quality of staff, quality of research, and quality of teaching that underpin higher
education quality issues
• Model time delays that underpin certain policies on quality, e.g., time to recruit new staff,
durations of study programmes, staff on training, executing research projects, and investment
in new students capacity.
Features of SD Methodology
Six features of SD have been identified by Schwaniger (2006). These are further discussed here.
30
• Focus on feedback-driven, mainly internally generated dynamics: The systems modelled are
networks of closed loops of information. However, they are not limited to the representation
of ’closed systems’, in that (a) flows can originate from outside the systems boundaries, (b)
exogenous factors or systems can be incorporated into any model as parameters or special
modules and (c) new information can be accommodated via changes to a model.
• High degree of operationality: SD relies on formal modelling. This fosters disciplined think-
ing; assumptions underlying equations and quantifications to be clarified. Feedback loops
and delays are visualized and formalized; therewith the causal logic inherent in a model is
made more transparent and better discussable than in most other methodologies. Also, the
achievable level of realism is higher than, for example, in econometric models.
• Far-reaching possibilities for the combination of qualitative and quantitative aspects of mod-
elling and simulation: The focus is not on point-precise prediction, but on the generation of
insights into the patterns of behaviour generated by the systems under study.
• High level of generality and scale robustness: The representation of dynamical systems in
terms of stocks and flows is a generic form, which is adequate for an enormous spectrum of
potential applications. This spectrum is both broad as to the potential subjects under study,
and deep as to the possible degrees of resolution and detail.
• Availability of powerful application software: The packages (Stella/Ithink, Powersim, VEN-
SIM and MyStrategy) are easy to handle and give access to a high variety of mathematical
functions. Part of this applications array offers optimization procedures and validation tools.
Also, some support for collaborative modelling and the communication with databases is
provided.
• Potential synergies: Combination with many other tools and methodologies is possible, both
conceptually and technically.
Given the diversity of SD strengths, an equivalent application area of SD as already highlighted
exists. The emerging trend of mixing other methods with SD further confirm the superiority of
SD features. Examples of the latter include: dynamic synthesis methodology- involving case
study and SD (Williams, 2002, 2004), soft system dynamics methodology- involving soft sys-
tems methodology and SD (Paucar-Caceres and Rodriguez-Ulloawe, 2007), managing from clar-
ity (Ritchie-Dunham and Rabbino, 2001), group model building- modelling with clients (Ven-
31
nix, 1996, 1999; Andersenet al., 2007), action research-SD integration (Scholl, 2004), collab-
orative systems modelling-GMB integration (Rouwette and Hoppenbrouwers, 2008), object role
modelling-SD integration (Tulinayoet al.,2008).
The SD Intervention Process
SD is a systemic approach based on feedback thinking or rational cause-effect relationships. Ac-
cording to Forrester (1998), SD modelling can be effective because it builds on the reliable part of
our understanding of systems while compensating for the unreliable part. The modelling process
separates consideration of underlying assumptions (structure, policies, and parameters) from the
implied behavior and contrary to its advantage, SD models have little impact unless they change
the way people perceive a situation. Forrester (1998) further argues that, a model must help to
organise information in a more understandable way by linking the past to the present and showing
how present conditions arose, then extending the present into persuasive alternative futures under
a variety of scenarios determined by policy alternatives.
Since its inception, SD has emphasized the importance of clarity of purpose for any interven-
tion, i.e., a defined problem, issue or undesirable behaviour to be corrected (Forrester, 1961). The
problem behaviour is usually described in a reference mode, and the purpose of the intervention
is to identify how structure and decision policies generate the identified reference mode so that
solutions can be generated and implemented. SD practitioners build and depend on formal simula-
tion models to overcome the cognitive limitations to grasp the detailed complexity of the problem
situation, and to make reliable behavioural inferences. Generation of problem solutions relies on
using these models for policy testing (Forrester, 1961), and what-if scenarios.
Regardless of the intervention situation, the main steps of modelling process itself remain the same.
Accross the literature, stages (or steps) of model development in SD range from four to seven. As
a matter of preference, seven steps given by Zagonel (2002) as shown in Figure 2.6 is discussed
here.
32
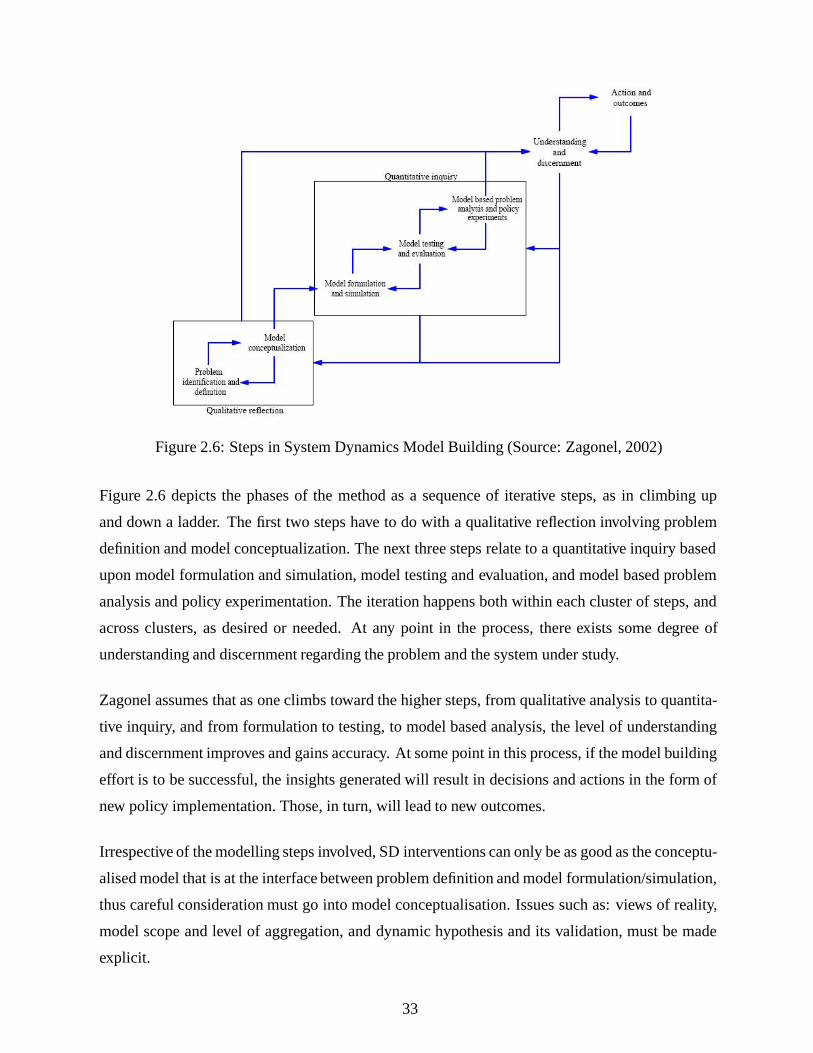
Figure 2.6: Steps in System Dynamics Model Building (Source: Zagonel, 2002)
Figure 2.6 depicts the phases of the method as a sequence of iterative steps, as in climbing up
and down a ladder. The first two steps have to do with a qualitative reflection involving problem
definition and model conceptualization. The next three steps relate to a quantitative inquiry based
upon model formulation and simulation, model testing and evaluation, and model based problem
analysis and policy experimentation. The iteration happens both within each cluster of steps, and
across clusters, as desired or needed. At any point in the process, there exists some degree of
understanding and discernment regarding the problem and the system under study.
Zagonel assumes that as one climbs toward the higher steps, from qualitative analysis to quantita-
tive inquiry, and from formulation to testing, to model based analysis, the level of understanding
and discernment improves and gains accuracy. At some point in this process, if the model building
effort is to be successful, the insights generated will result in decisions and actions in the form of
new policy implementation. Those, in turn, will lead to new outcomes.
Irrespective of the modelling steps involved, SD interventions can only be as good as the conceptu-
alised model that is at the interface between problem definition and model formulation/simulation,
thus careful consideration must go into model conceptualisation. Issues such as: views of reality,
model scope and level of aggregation, and dynamic hypothesis and its validation, must be made
explicit.
33
2.3.2 Data Mining
Data mining is the process of identifying valid, novel, potentially useful, and ultimately compre-
hensible understandable patterns or models in data to make crucial business decisions (Kuonen,
2004). In a similar perspective, Rubenking (2001) defines data mining as the process of automati-
cally extracting useful information and relationships from immense quantities of data, while Luan
(2001) explains that data mining doesnt involve looking for specific information, neither does it
require starting from a question or a hypothesis, but data mining simply seeks patterns that are
already present in the data.
The relevance of data mining field of study is in bridging the gap between information and the
knowledge that ensues. In real life, data leads to information, which then leads to knowledge,
which in turn leads to decisions then action. The biggest challenge therein according to Kuonen
(2004) is how to get from data to knowledge. The solution is data mining, least “you drawn in in-
formation and remain starved of knowledge”. With data mining, Kuonen (2004) adds, companies
can analyze customers’ past behaviours in order to make strategic decisions about the future.
Recent applications of data mining in HE focus generally on enrolment management, while ad-
dressing topics such as: admission yields (Maltzet al., 2007), student retention and degree com-
pletion time (Denizet al.,2002). Specifically, the questions explored include: discovering which
inquiries are most likely to turn into actual applications; predicting enrollment to specific courses
to help determine a programs success rate; identifying and targeting students who are at risk of at-
trition; and achieving and maintaining optimum graduation rates, recruitment, and retention rates.
2.3.3 Analytic Hierarchy Process
The analytic hierarchy process (AHP) has been applied as a multiple attribute decision making
technique to several decision problems in HE since its inception by Saaty in 1980. AHP is espe-
cially suitable for complex decisions which involve the comparison of decision elements which
are difficult to quantify. It is based on the assumption that when faced with a complex decision the
natural human reaction is to cluster the decision elements according to their common characteris-
tics. It involves building a hierarchy (Ranking) of decision elements and then making comparisons
between each possible pair in each cluster (as a matrix). This gives a weighting for each element
34
within a cluster (or level of the hierarchy) and also a consistency ratio (useful for checking the
consistency of the data). In short, the AHP consists of three main operations including hierarchy
construction, priority analysis, and consistency verification (Andersonet al.,2005 as cited by Ho
et al.,2006).
AHP has been applied to several decision problems in HE as a multiple attribute decision making
techniques including: resource allocation (Hoet al.,2006), budget allocations (Arbel, 1983), fac-
ulty promotions and section process (Grandzol, 2005). A complete review on use of AHP in HE
decision areas can be found in Grandzol (2005) and Hoet al. (2006). In the context of this thesis,
AHP is useful in setting priorities for budget allocations prior to running the simulations so that
real-life decisions on allocation of funds are depicted in the simulations.
2.3.4 Goal Programming
Goal programming (GP) is a special extension of linear programming. This method is regarded
as the most practical multi-objective decision-making (MODM) technique, since it is frequently
used to solve the higher education decision problems (Hoet al., 2006). GP takes multiple goals
with varying priorities into consideration at the same time and therefore differs from conventional
linear programming method where the objective function is undimensional (either maximize prof-
its/effectiveness or minimise costs/sacrifices). The goals as well as their priority level (i.e. P1;
P2; . . . ; Pn) are identified by the decision makers such that P1> P2> P3>.... Pn. The goals
with a higher priority level are considered first. Once they have been satisfied with no further
improvement, the next most important goals are then considered.
In GP, instead of trying to maximise or minimise the objective criterion directly, the deviations be-
tween goals and what can be achieved within a given set of constraints are to be minimised. Hence
deviational variables take a new significance in GP, as they are represented in two dimensions,
i.e., both positive and negative deviations from each goal. The objective function then becomes
minimisation of these deviations based on preemptive priority attached to them. The value of a GP
therefore is a solution of problems involving multiple, conflicting goals according to defined pri-
ority structure. The general GP model for whichZ is the objective function can be mathematically
expressed as:
Minimize Z =∑m
i=1 (d+i + d−
i )
35
subject to Ax- Id+ + Id− = b, for x, d+, d−≥ 0,
wherem goals are expressed by anm component column vectorb (b1, b2, .....bn ), A is anm x n ma-
trix which expresses the relationship between goals and subgoals,x represents variables involved
in the subgoals (x1, x2, .....xn ), d+ and d− arem component vectors for variables representing
deviations from goals andI is identity matrix inm dimensions. The decision maker must analyse
each one of them goals considered in the model bearing in mind that for each goal, there are three
possible alternatives of incorporating deviation variables in the objective function, as shown in the
following:
1. if over-achievement of a goal is regarded as unsatisfactory, then only d+ is included in the
objective function; or
2. if under-achievement of a goal is regarded as unsatisfactory, then only d− i is included in the
objective function; or
3. if both over- and under-achievement of a goal are not desirable, then both d+ and d− are
included in the objective function.
In summary, after formulating a GP model for a particular decision problem, commercial packages
like LINDO and CPLEX can be used to solve the model to optimality. In cases where the model
only consists of two decision variables, even the simple graphical method can be adopted (Ho et al.,
2006). In the context of this thesis, the graphical GP concepts provided insights on development
of a predictive sub-model for estimating the optimal student numbers.
2.3.5 Hierarchical Linear Modelling
Hierarchical Linear Modelling (HLM) is a technique for modelling multilevel data when observa-
tions at lower levels are nested within observations at higher level. The relevance of HLM in higher
education quality research is in generating a hierarchy of structured data in order to improve the
insights from analysis. Hwang (2002) emphasises that the use of massive large-scale secondary
data in higher education research, without consideration of the inherent hierarchical data struc-
tures involved may lead to inaccurate or misleading conclusions. He backs up this argument with
a satisfaction survey of 1,187 students in which the multilevel modelling adopted revealed the dif-
ference in satisfaction rating by the different student clusters. Other applications of HLM in higher
36
education quality studies can be found in: DeMars (2002) in the study of programme effective-
ness in universities; Try and Grogaard (2003) in measuring the relationship between resources and
outcomes in Norwaygian higher education.
2.3.6 Balanced Scorecard
Traditionally, most organizations look into their corporate performance by reviewing their financial
aspects. However, financial measures alone are not a balanced view of the critical success factors
of any organisation, mainly because financial measurements tend to measure the past, without strict
consideration as to why it has happened. Against this background, Kaplan and Norton (1996) de-
veloped the Balanced Scorecard (BSC) in the early 1990s. In their view, “the BSC translates an
organization’s mission and strategy into a comprehensive set of performance measures and pro-
vides the framework for strategic measurement and management”.
The BSC according to Umashankar and Dutta (2007) is based on four key perspectives:
i. Financial goals - How will we look to our stakeholders?
ii. Customer perspective - How must we look to our customers?
iii. Internal processes - What internal processes must we excel at?
iv. Learning and growth - How can the organization learn and improve?
These perspectives provide an inter-connected view necessary for quality management studies.
Balanced Scorecard Applications in Higher Education
It is evident from the literature that the BSC has been widely adopted in the business sector but
less in the education sector. Nevertheless, Umashankar and Dutta (2007) in their presentation of
a BSC model for Indian higher education programs/institutions, call for the adoption BSC in edu-
cational institutions for reinforcement of the importance of managing rather than just monitoring
performance. Papenhausen and Einstein (2006) lay out a comprehensive and content-specific BSC
37
for a business school as a whole. In addition, they suggest that in an environment that demands
increasing accountability from business schools, the BSC offers a promising and valuable tool for
implementing a strategic performance management system. In the context of this research, the four
perspectives of BSC (financial goals, customer focus, internal processes, and learning and growth)
provided insight to the understanding of the main factors that influence HE quality.
Participatory Action Research
The dual aim of the PAR approach is to address a problem or a problem situation and to develop
practical and theoretical generalisations/learning (Lau, 1999). The PAR approach supports the ar-
gument that when theory and practice are interconnected, then solving real world problems while
contributing to new knowledge can be achieved concurrently. This is possible because PAR in-
volves practitioners as both subjects and co-researchers. In the same spirit, Kock and Lau (2001)
explicitly note: “whatever the case, the IS action researcher serves two different ‘masters’, namely
the research client and the research community as a whole. The needs of these two masters are
usually entirely different and sometimes conflict with each other”, and therefore, PAR should have
little distinction between the two parties by offering the potential of reducing the conflict of ‘serv-
ing two masters’.
The increased practitioner participation is a major distinguishing characteristic in PAR but at the
same time raises contention of who is in charge of the research. By adopting the practice perspec-
tive of AR (Cronholm and Goldkuhl, 2004) in PAR (see Figure 2.7), the authority of researchers
and practitioners are clear. As depicted by Figure 2.7, the researcher is always “in charge” of the
theoretical research practice while the business practitioners are “in charge” of the regular busi-
ness practice. In the business change practice/empirical research practice, the researchers are “in
charge” of the empirical data collection part and the business practitioners are “in charge” of the
business changes.
38
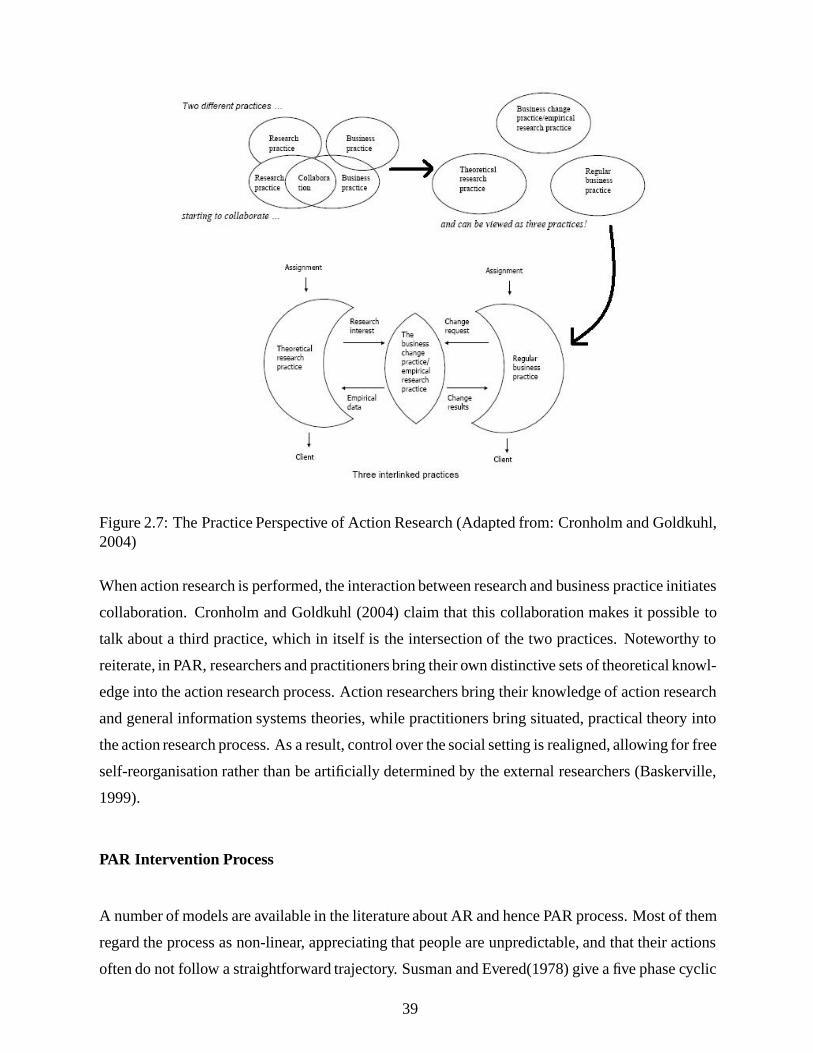
Figure 2.7: The Practice Perspective of Action Research (Adapted from: Cronholm and Goldkuhl,2004)
When action research is performed, the interaction between research and business practice initiates
collaboration. Cronholm and Goldkuhl (2004) claim that this collaboration makes it possible to
talk about a third practice, which in itself is the intersection of the two practices. Noteworthy to
reiterate, in PAR, researchers and practitioners bring their own distinctive sets of theoretical knowl-
edge into the action research process. Action researchers bring their knowledge of action research
and general information systems theories, while practitioners bring situated, practical theory into
the action research process. As a result, control over the social setting is realigned, allowing for free
self-reorganisation rather than be artificially determined by the external researchers (Baskerville,
1999).
PAR Intervention Process
A number of models are available in the literature about AR and hence PAR process. Most of them
regard the process as non-linear, appreciating that people are unpredictable, and that their actions
often do not follow a straightforward trajectory. Susman and Evered(1978) give a five phase cyclic
39
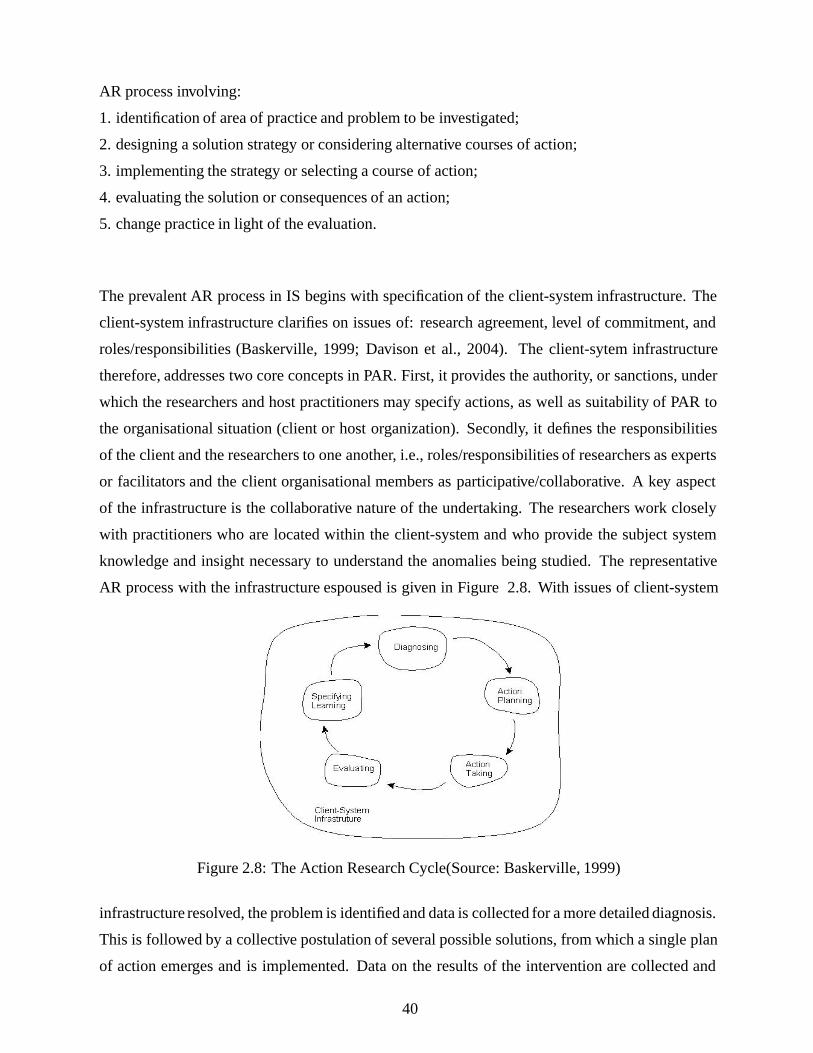
AR process involving:
1. identification of area of practice and problem to be investigated;
2. designing a solution strategy or considering alternative courses of action;
3. implementing the strategy or selecting a course of action;
4. evaluating the solution or consequences of an action;
5. change practice in light of the evaluation.
The prevalent AR process in IS begins with specification of the client-system infrastructure. The
client-system infrastructure clarifies on issues of: research agreement, level of commitment, and
roles/responsibilities (Baskerville, 1999; Davison et al., 2004). The client-sytem infrastructure
therefore, addresses two core concepts in PAR. First, it provides the authority, or sanctions, under
which the researchers and host practitioners may specify actions, as well as suitability of PAR to
the organisational situation (client or host organization). Secondly, it defines the responsibilities
of the client and the researchers to one another, i.e., roles/responsibilities of researchers as experts
or facilitators and the client organisational members as participative/collaborative. A key aspect
of the infrastructure is the collaborative nature of the undertaking. The researchers work closely
with practitioners who are located within the client-system and who provide the subject system
knowledge and insight necessary to understand the anomalies being studied. The representative
AR process with the infrastructure espoused is given in Figure 2.8. With issues of client-system
Figure 2.8: The Action Research Cycle(Source: Baskerville, 1999)
infrastructure resolved, the problem is identified and data is collected for a more detailed diagnosis.
This is followed by a collective postulation of several possible solutions, from which a single plan
of action emerges and is implemented. Data on the results of the intervention are collected and
40
analyzed, and the findings are interpreted in light of how successful the action has been. At this
point, the problem is re-assessed and the process begins another cycle. This process continues until
the problem is resolved.
Ultimately, the AR cycle when adopted in PAR intervention can be repeated depending outcomes
of step 5. It is thus possible to imagine a series of cycles (spiral of cycles), where one issue forms
the basis of another and, as one question is addressed, the answer to it generates new questions
(Baskerville, 1999; Davison et al., 2004; Scholl, 2004).
2.3.7 Participatory Action Research and System Dynamics
The field of IS is enhrently multi-methodological. As such a wide variety of ontological as-
sumptions and epistemological principles are acceptable, but the norm is to distinguish between
positivist and interpretative positions. HE quality management problems have both a strong so-
cial/qualitative and quantitative inclination, yet available intervention methods are either qualita-
tive or Mathematical (quantitative). To resolve this conflict, this research adopts both the pre-
dominantly qualitative (PAR) and predominantly quantitative (SD) approaches. By using these
approaches in an integrated environment, this research concurs with other researchers who ac-
knowledge and advocate for methodological complementarism (Scholl, 2004; Schwaninger, 2006;
Rouwette and Hoppenbrouwers, 2008; Tulinayo et al., 2008). More specifically, Schwaninger
(2006) has succinctly argued that there is a potential complementarity between different methods,
and, one may add methods, models, even if they come from distinct paradigms.
The rest of the analysis is organised under four themes: a) common grounds and differences be-
tween SD and PAR; b) limitations of SD and PAR; c) providing the case for the integration; and d)
discussing the outcome of the integration.
a) common grounds and differences between SD and PAR
i) Similarities
The similarities given here are largely extracted from Scholl (2004), recogonising the cyclic nature
of both PAR and SD research processes as already discussed.
41
1. Both research approaches start with the statement of a problem, in which the problem is
diagnosed or posed and theoretically embedded in a context of existing knowledge.
2. Desired outcomes are formulated following successful problem diagnosis with emphasis on
improvement of situation in PAR, and reference modes in SD.
3. While action is planned and taken within an organizational setting in PAR, in the SD cycle
a dynamic hypothesis on the basis of a conceptualized feedback structure is developed, and
then a model is formulated and tested. Policy formulations and recommendation for action
and change complete the SD cycle.
4. The evaluation in the SD cycle pertains to identifying high leverage points in the model,
e.g., for changing the dominant feedback loops by redesigning the stock and flow struc-
ture, changing the flow and quality of information available at key decision points, or fun-
damentally reinventing the decision processes. Similarly, the evaluation of AR intervention
takes the form of learning through reflection, involving collaborative reflection on outcomes,
project success descriptions, and implications for theory and practice.
ii) Differences
Two main differences between SD and PAR can be identified, these include:
• As opposed to the PAR cycle, the action of applying recommended policy changes and,
hence, the ultimate test of the SD models utility in practice, are not included in the SD cycle
(Scholl, 2004).
• From the basic foundation context, PAR is anchored on subjective epistemology while SD
is associated with moderately objective epistemology.
b) Limitations of SD and PAR
i) Limitations of SD
Althogh SD is growing at an impressive exponential rate due to its unique ability to represent the
real world and accept the complexity, nonlinearity, and feedback loop structures that are inherent
42
in social and physical systems, the method faces several difficult steps in moving from problem
to solution hamper system dynamics. First, and probably most elusive as reported by Forrester
(1994), little guidance exists for converting a real-life situation into a simulation model, adding
that at later stages, many SD projects have fallen short of their potential because of failure to gain
the understanding and support necessary for implementation. He suggests that systems thinking
and soft operations research may help organize and guide group processes that must occur when
system dynamics interfaces with people in the actual systems.
Checkland (1981, pp. 138) argues that hard systems thinking and soft systems thinking as two
quite different ways of undertaking an inquiry using systems principles and further demonstrates
that in hard systems thinking of which SD may be appropriately placed, there is a desired state,
S1, and a present state S0, and alternative ways of getting from S0 to S1. ‘Problem solving’,
according to this view consists of defining S0 and S1 and selecting the best means of reducing the
difference between them. Checkland (1981)concludes that hard methodologies are goal-centred or
goal-oriented in that they assume that there is clear agreement among stakeholders over the goal
state S1 and that the current state S0 is also known. Lane and Oliva (1998) recognise this significant
weakness and argue that the use of mathematically based techniques in planning movement from
S0 to S1 should be augmented with ‘soft methodologies’ so that the nature of the two states can be
investigated.
Apart from the limitations of SD as a method, the phenomenon of SD models on organisational
issues having low impact despite passing validity tests has been the hallmark of involvement of
practitioners in modelling or group model building - GMB (Rouwette and Hoppenbrouwers, 2008;
Rouwetteet al.,2002). At the same time, GMB also faces the same challenge, namely, the prac-
titioner commitment to action and change beyond the intervention is sometimes weak (Scholl,
2004). In other words, though the SD researcher may perceive the emerged model as a correct and
flawless representation of the “real world” according to accepted external criteria, and even though
the practitioners confirm a high degree of learning and insights gained, no change action is taken,
and the intervention leads to no further consequences (Scholl, 2004).
i) Limitations of PAR
As with all research methods, AR is not without its valid limitations. The limitations of AR and
hence PAR as contained in Rose’s (2000) PhD thesis include:
43
• goal dilemmas between the practical problems at hand and the research endeavour;
• value dilemmas between roles as consultant and researcher, such as clients belief in quick
actions (quick wins) versus researchers belief in careful abstract reflection before action;
• difficulties establishing rigour and objectivity according to conventional positivist natural
science traditions;
• pre-occupationwith organizational problem solving at the expense of transferable theoretical
understandings;
• lack of epistemological clarity in theory testing and development.
iii) Complementarity Overcomes Limitations
Even though SD and PAR belong to two different research continnums, they have a strong common
denominator. The strength of SD as a theory building approach complements PAR’s weakness in
theory development. An SD model is a theory of the problem which is specifically represented
as a dynamic hypothesis. Goal dilemmas in PAR are overcome in SD as the fundamental aim of
SD is solving a specific problem or rather “model a problem, not a system”. Whereas both SD
and PAR consider problem diagnosis as their first phase, the gap between practical problems and
research endeavour arises in PAR and not SD because standard measures of model validation and
verification exist in SD methodology to ensure that the problem modelled and model of problem
are the same.
In contrast, the limitations of SD can be mitigated by integrating PAR concepts into SD. In par-
ticular, the issue of low model impact (no action taken) even when practitioners are involved, can
be overcome through increased practitioners’ involvement in the modelling process. ‘Action’ re-
sults from practitioners’ commitment to act which is preceded by ownership of and involvement
in the process (Scholl, 2004). In other words understanding the modelling process by practitioners
in regard to their contribution to modelling and benefits from involvement leads to action. This
has been found worthwhile in PAR’s three practices where practitioners’ participation is increased
through clearly defining roles and contributions of practitioners and researchers (Cronholm and
Goldkuhl, 2004). In this context, this thesis maintains that including insights from PAR into SD
could usefully strengthen the modelling process design by addressing issues that increase prac-
44
titioners’ understanding of modelling process and reasons for their involvement as well as their
responsibilities, as subsequently discussed.
c) The Case for Integration of SD and PAR
By all measures, the question as to whether SD and PAR can benefit from each other when com-
bined has been meticulously addressed by Scholl (2004). In order to extend this idea, the theoreti-
cal basis for this integration and practical benefits are further explored henceforth.
i)Theoretical Basis
Although Eden (1990, p. 91) remarks that “when different methods reflect different ‘theories-in-
use’, it is unlikely that they will sit happily together in practice”, SD which is largely positivist has
learnt from the interpretivist tradition following limitations in which positivist modellers have built
‘objective’ models of an organisational issue which remained unused by organisational managers
(Schwaninger and Grosser, 2008; GroBler, 2007). In fact, lately bridges are being built between the
positivist and the interpretivist paradigms through SD integration with other qualitative methods,
e.g, SD and case study (Williams, 2002, 2004), SD and soft systems methodology (Paucar-Caceres
and Rodriguez-Ulloawe, 2007), SD and AR (Scholl, 2004), collaborative systems modelling and
GMB (Rouwette and Hoppenbrouwers, 2008), and object role modelling and SD (Tulinayo et al.,
2008).
Following an analysis of trends in model building designs, Schwaninger and Grosser (2008) envis-
age the emergence new age modelling for which the roles of modellers and model users converge
and models are developed at conversational pace. This is particularly achieved in SyDPAR’s “so-
lution refinement cycle” as discussed in chapter 3.
The integration of SD and PAR is meant to usefully extend/improve the participative SD inter-
vention process by emphasising clients contributions to modelling and benefits from modelling
involvement. The criterion for success is therefore the extent to which the integrated design pro-
vides answers to the following design questions:
45
• Can the modelling process design effectively balance the goals of fundamental modelling
understanding with consideration of usefulness of the resulting models?
• How should participative modelling be rigorously designed?
• How does modelling design influence outcomes?
• What is the significance of inclusion of clients’ contributions to- and benefits from- mod-
elling in the actual design?
The answers to these questions can be deduced from the subsequent discussion on model building
process versus participant involvement as well as from analysis of SyDPAR effectiveness in chapter
3 (section 3.4).
ii) Model Building Process versus Participant Involvement
The system dynamics modelling process in general involves four to seven phases. Luna-Reyes
and Andersen (2003) have made a conceptual summary of these processes across five selected
representatives of the classical literature into four iterative phases. These include: 1) problem defi-
nition and system conceptualisation, 2) model formulation, 3) model testing, 4) policy formulation
and model use. Snabe and GroBler (2006) add that these phases are concordant with participa-
tive modelling. However, the rationale in integrating PAR concepts into SD is in extending the
SD modelling process to ensure contributions of clients/stakeholders in model development are
reflected in the modelling design itself. As such, the methodological details are clearly articu-
lated, making it easier for modellers and participants to represent the external policy environment
investigated while contributing to the knowledge base. In addition, the integrated design should
ensure that the modelling process outcomes provide benchmarks for which intended learning by
participants are evaluated. Since in participative modelling intervention, the modeller serves two
different “masters”, namely; the solution beneficiaries or clients and the research community as a
whole, the integrated modelling architectureshould provide a platform for achieving this dual goal.
The phases of model building that are supported by direct client involvement in participative sys-
tem dynamics modelling have been explicitly discussed by Rouwette (2003). This thesis extends
Rouwette’s (2003) discussion by proposing that client participation in modelling can be enhanced
through detailed modelling architecture/design in which the purpose and benefits of modelling are
46
tied to the phases of modelling process and not as a final outcome of modelling. Doing so facili-
tates the clients to realisation that the final model may ensue from a number of iterative modules
(evolving models) and so does modelling proficiency. This view is supported by Scholl (2004)
who, through exploring the benefits of integrating PAR and SD concluded that practitioners or
clients can benefit in various ways from SD researchers as peers in the project team, in the sense
that: “practitioners would learn from SD researchers how to express aspects of the problem in feed-
back structures and modelling terms. The SD researchers would be “sounding boards” rather than
expert facilitators. As modelling proficiency among practitioners increases, the SD researcher’s
educator role decreases, and the project progresses towards action planning and action taking. The
SD model would not act as an embodiment of an overarching and imposed theoretical framework
but naturally evolve with the skills and the insights from action planning and action taking. Rather
than being perceived as intended correct representations of the “real-world” problem, the evolving
models would likewise play the role of sounding boards with great utility for learning and insight”.
Forrester (1994, p.253) notes that defining the problem and conceptualising the system is not only
the most critical part of the modelling process, it is also the most difficult one. Indeed failure
to define the problem may lead to what Luna-Reyes and Andersen (2003) call the “gap between
problem modelled and the model of the problem”. While these challenges are arguably overcome
in participative modelling (Vennix, 1996; Zagonel, 2002; Luna-Reyes, 2006) on the premise that
problem owners in this case clients are involved in modelling, the other issues in managing client
groups, e.g., group facilitation skills and attitudes, overlapping client schedules and hence low
commitment, may prevent active involvement of clients throughout the modelling process. By es-
pousing the problem articulation cycle and modelling proficiency cycle in the current modelling
process design (refer to part d, following), the management of clients is approached through em-
phasis that both modellers and clients are contributors as well as apprentices, i.e., in the problem
articulation cycle, clients are mainly contributors while modellers are more of apprentices, yet the
reverse is depicted in the modelling proficiency cycle.
d) Outcome of the Integration: SyDPAR
The SyDPAR approach is a modelling process design resulting from the integration SD and PAR.
The case for this integration was the need for a comprehensive participative modelling design
where activities and outcomes of each phase reflect purpose and benefits of both modellers and
47
clients/participants involved in participative modelling. The six phases of SyDPAR design com-
prise of a new phase called action planning, derived from PAR process against which the emphasis
of clients’ contribution in participative modelling is articulated. The interplay of the six phases
during modelling results into three cycles namely; problem articulation (PA) cycle, modelling pro-
ficiency (MP) cycle, and solution refinement (SR) cycle, all of which address the diversity and
legitimacy of contributions by all parties involved in modelling.
The design of modelling as a series of iterative steps with process outcomes arising from cy-
cles of ‘PA’, ‘MP’, and ‘SR’ as opposed to the prevalent designs in which modelling evolves as a
series of iterative steps (Richardson and Pugh, 1981; Sterman, 2000; Zagonel, 2002; Luna-Reyes
and Andersen, 2003) is necessary since the former affirmatively shows that roles of clients and
modellers vary as modelling progresses from one cycle to another. In practice, modellers maintain
the role of facilitators throughout these cycles except for “PA” cycle where they double as appren-
tices of the problem situation. On the other hand, client roles and reasons for client involvement
in a modelling project are more or less the same. The three reasons for client involvement, i.e.,
identification of the problem, providers of information, and implementers of modelling results, are
catered for in the “PA” and “SR” cycles. A fourth and probably only reason that caters for client’s
individual benefit from modelling participation is addressed in the “MP” cycle for which clients
are perceived as apprentices of model development under guidance of modellers.
2.4 The State-of-Practice of Higher Education Quality Man-agement Tools
The use of DSS in academic decision-making date as far back as the 1960’s (Levine, 1968). This
section focuses on the recent ones (2000 to 2009) as reviewed from the literature. Table 2.1 gives
a summary analysis of existing decision support systems/tools, their development approach and
focus in this time frame.
With reference to the focus of this thesis as delineated by quality and enrolment management,
and following from Table 2.1, three DSS, namely UNIGAME, QMS2000, and QMT09 are further
elaborated.
48
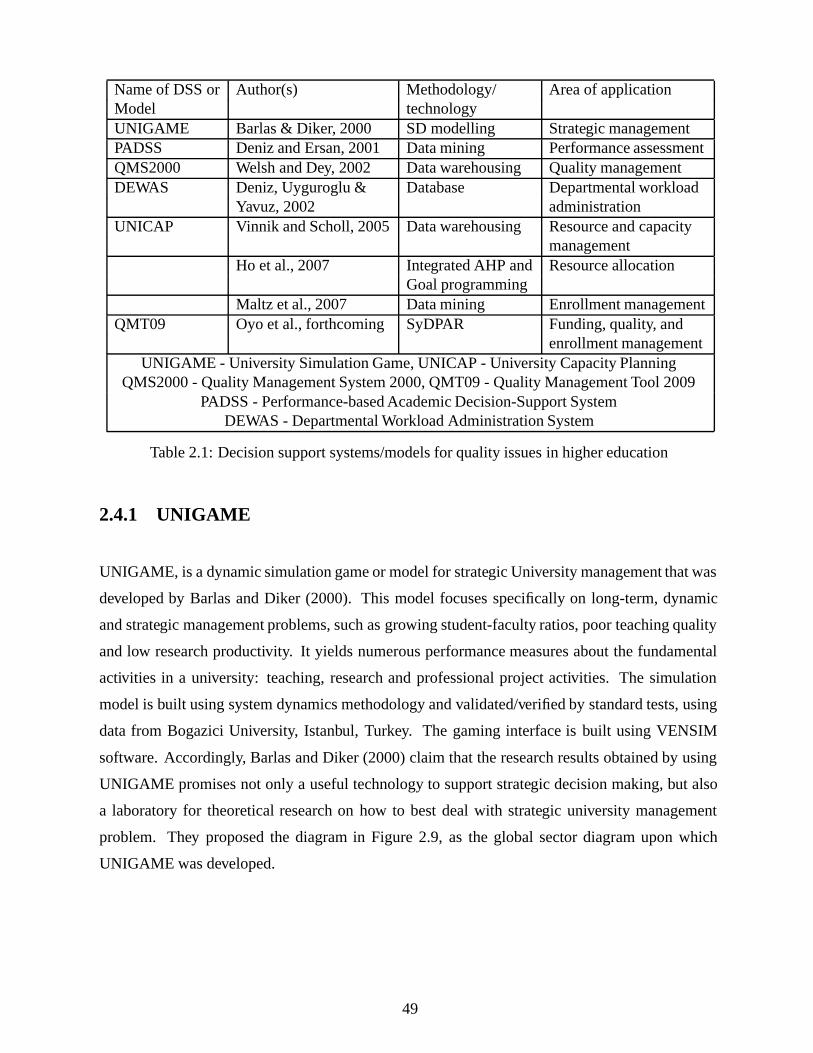
Name of DSS or Author(s) Methodology/ Area of applicationModel technologyUNIGAME Barlas & Diker, 2000 SD modelling Strategic managementPADSS Deniz and Ersan, 2001 Data mining Performance assessmentQMS2000 Welsh and Dey, 2002 Data warehousing Quality managementDEWAS Deniz, Uyguroglu & Database Departmental workload
Yavuz, 2002 administrationUNICAP Vinnik and Scholl, 2005 Data warehousing Resource and capacity
managementHo et al., 2007 Integrated AHP and Resource allocation
Goal programmingMaltz et al., 2007 Data mining Enrollment management
QMT09 Oyo et al., forthcoming SyDPAR Funding, quality, andenrollment management
UNIGAME - University Simulation Game, UNICAP - University Capacity PlanningQMS2000 - Quality Management System 2000, QMT09 - Quality Management Tool 2009
PADSS - Performance-based Academic Decision-Support SystemDEWAS - Departmental Workload Administration System
Table 2.1: Decision support systems/models for quality issues in higher education
2.4.1 UNIGAME
UNIGAME, is a dynamic simulation game or model for strategic University management that was
developed by Barlas and Diker (2000). This model focuses specifically on long-term, dynamic
and strategic management problems, such as growing student-faculty ratios, poor teaching quality
and low research productivity. It yields numerous performance measures about the fundamental
activities in a university: teaching, research and professional project activities. The simulation
model is built using system dynamics methodology and validated/verified by standard tests, using
data from Bogazici University, Istanbul, Turkey. The gaming interface is built using VENSIM
software. Accordingly, Barlas and Diker (2000) claim that the research results obtained by using
UNIGAME promises not only a useful technology to support strategic decision making, but also
a laboratory for theoretical research on how to best deal with strategic university management
problem. They proposed the diagram in Figure 2.9, as the global sector diagram upon which
UNIGAME was developed.
49
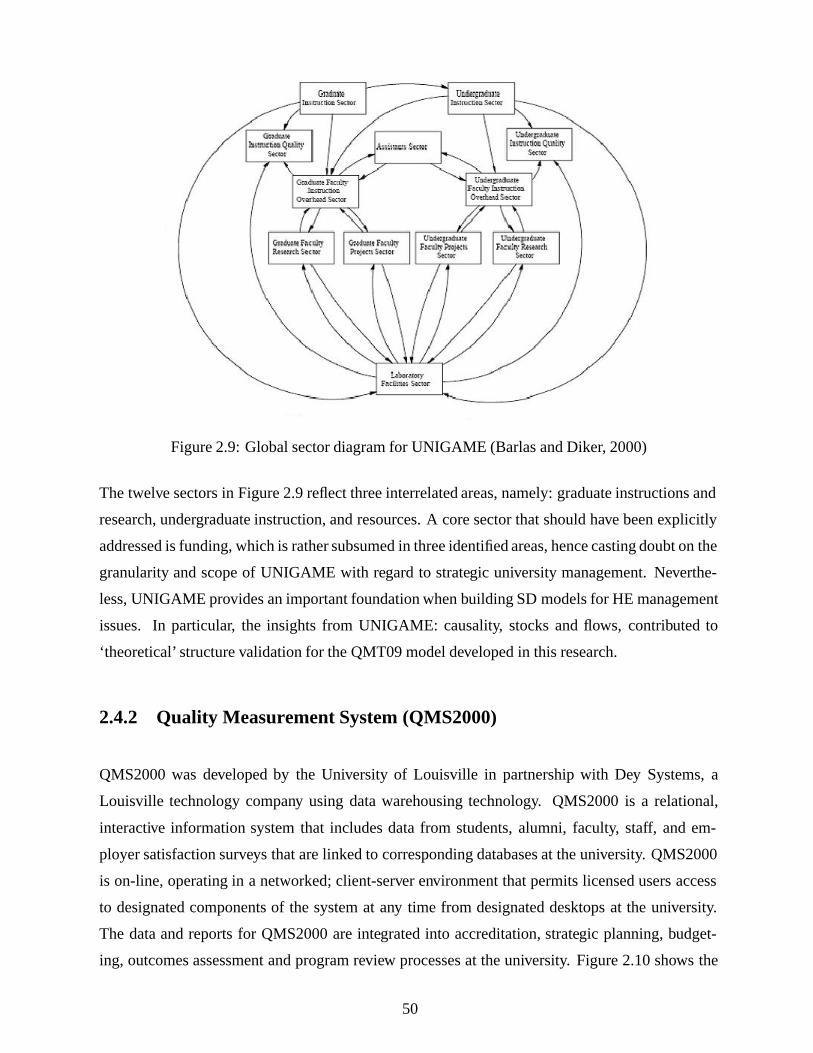
Figure 2.9: Global sector diagram for UNIGAME (Barlas and Diker, 2000)
The twelve sectors in Figure 2.9 reflect three interrelated areas, namely: graduate instructions and
research, undergraduate instruction, and resources. A core sector that should have been explicitly
addressed is funding, which is rather subsumed in three identified areas, hence casting doubt on the
granularity and scope of UNIGAME with regard to strategic university management. Neverthe-
less, UNIGAME provides an important foundation when building SD models for HE management
issues. In particular, the insights from UNIGAME: causality, stocks and flows, contributed to
‘theoretical’ structure validation for the QMT09 model developed in this research.
2.4.2 Quality Measurement System (QMS2000)
QMS2000 was developed by the University of Louisville in partnership with Dey Systems, a
Louisville technology company using data warehousing technology. QMS2000 is a relational,
interactive information system that includes data from students, alumni, faculty, staff, and em-
ployer satisfaction surveys that are linked to corresponding databases at the university. QMS2000
is on-line, operating in a networked; client-server environment that permits licensed users access
to designated components of the system at any time from designated desktops at the university.
The data and reports for QMS2000 are integrated into accreditation, strategic planning, budget-
ing, outcomes assessment and program review processes at the university. Figure 2.10 shows the
50
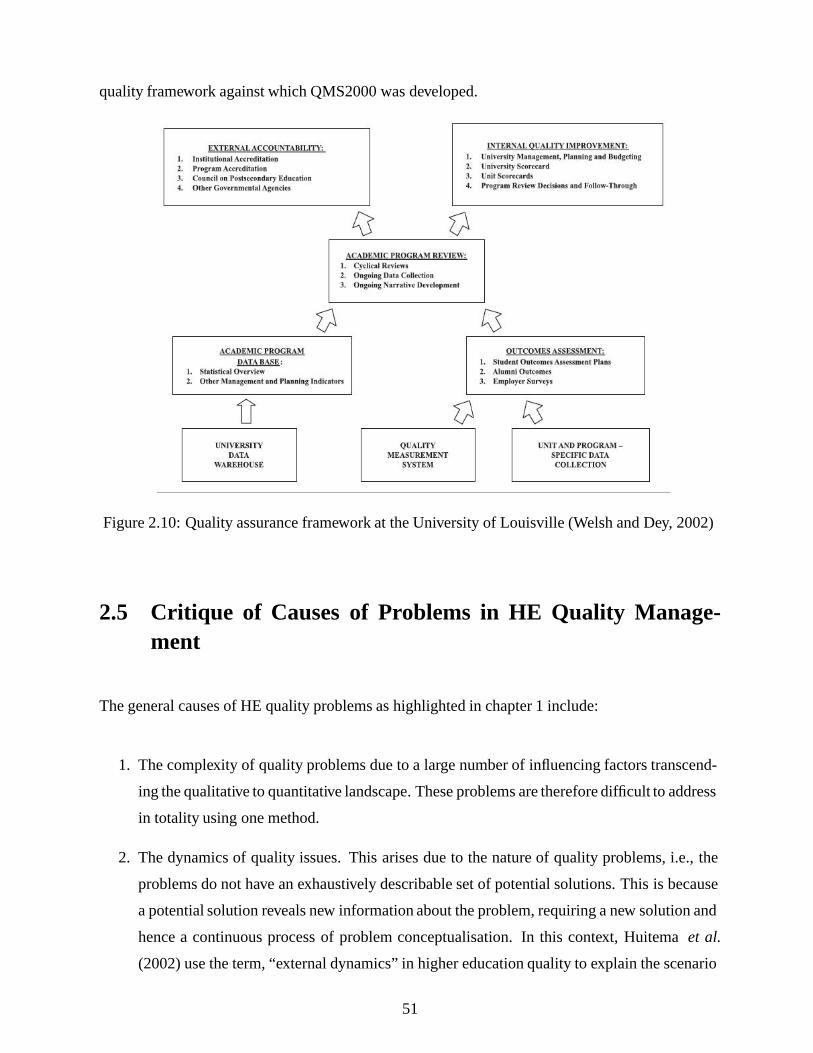
quality framework against which QMS2000 was developed.
Figure 2.10: Quality assurance framework at the University of Louisville (Welsh and Dey, 2002)
2.5 Critique of Causes of Problems in HE Quality Manage-ment
The general causes of HE quality problems as highlighted in chapter 1 include:
1. The complexity of quality problems due to a large number of influencing factors transcend-
ing the qualitative to quantitative landscape. These problems are therefore difficult to address
in totality using one method.
2. The dynamics of quality issues. This arises due to the nature of quality problems, i.e., the
problems do not have an exhaustively describable set of potential solutions. This is because
a potential solution reveals new information about the problem, requiring a new solution and
hence a continuous process of problem conceptualisation. In this context, Huitemaet al.
(2002) use the term, “external dynamics” in higher education quality to explain the scenario
51
whereby, tackling one problem (e.g., increasing students’ capacity) exposes another (e.g.
teaching quality).
3. Complexity of feedbacks in quality issues leading to adoption of methods that delineate a set
of quality problems facets as more worthy of attention than others rather than all conceivable
facets of quality problems.
4. The diverse perceptions of quality problems by different stakeholders leading to claims that
render research on quality less attractive such as “quality is difficult to measure” (Parker,
2002; Srikanthan and Dalrymple, 2007); good policies on quality are based on personal
knowledge rather than simulation experiments (Grandzol, 2005; Barnab´e, 2004).
In light of these causes, the use of multiple feedbacks is inevitable when addressing HE problems.
This way, the aim of feedbacks is depicted by two fundamental outputs: a representative problem
structure and a conceptual framework showing all the conceivable influencing factors as feedback
loops. Such a representation takes care of the qualitative and quantitative facets of quality simulta-
neously, demystifying the notion that a set of quality problems facets as more worthy of attention
than others.
2.6 Conclusion
The primary strength of this review is the comprehensive, yet focused, literature search as demon-
strated by the five dimensions covered. First, trends in quality management research including
perceptions of quality and existing excellence models were meticulously discussed. Secondly, the
HE quality management frameworks were explored, delineating gaps that should be addressed.
Third, the current approaches for quality management were discussed, highlighting the need to
extension through integration of SD and PAR. Fourth, the technologies used in developing qual-
ity management DSS were highlighted and lastly a critique of causes of problems in HE quality
management was made as basis for the proposed methodology in the next chapter.
52
Chapter 3
Methodology
3.1 Introduction
This chapter presents the research approach adopted. First, the philosophical and theoretical foun-
dations are discussed, and then, the current approaches/methods for HE quality management are
compared using a matrix developed from Design Science Framework. Following this comparison,
methodological gaps are delineated and a method is proposed and discussed. Subsequently, a field
study design is presented. Finally, the chapter ends with a conclusion.
3.2 Philosophical and Theoretical Foundations
3.2.1 Philosophical Underpinnings
A critical consideration of any research is the underlying assumptions guiding its research design.
These assumptions provide a coherent philosophical and methodological system for the conduct of
scientific research including a commensurate theory of validation (Chen and Hirschheim, 2004).
The most pertinent philosophical assumptions are those that relate to paradigms. A paradigm may
be regarded as a set of basic philosophical assumptions about the nature of the world (ontology),
how we can understand it (epistemology), and how we can improve our understanding of the world
(methodology). A paradigm therefore represents shared philosophical understandings, terminol-
ogy, rules and research approaches adopted by a particular community that continuously evolve as
53
they are negotiated and debated within the communities (Morgan, 2007).
Orlikowski and Baroudi (1991) suggest three underlying paradigms: positivist, interpretive, and
critical thinking as guiding Information Systems (IS) research.
• Positivist investigations seek to explain and predict by looking for regularities and causal
relationships between variables. They are primarily concerned with formulation of hypothe-
ses, not how a phenomenon occurred, and are often associated with quantitative analysis for
testing the hypotheses. IS research methodology is dominated by this stance. Laboratory ex-
periments, numerical methods or mathematicalmodelling, and survey methods are examples
of positivist methods.
• Interpretivist studies seek a deeper understanding of phenomena within its context, which
may be used to inform other contexts. They acknowledge multiple interpretations of the
world and the inevitable influence of the researcher. This view has been relatively espoused
in IS research, see, Myers and Avison (2002), Nandhakumar and Avison (1999).
• Critical thinking approaches are interventions orientated and associated with participant and
action research, with clear objectives to change practice and make social critique. Criti-
cal thinking researchers assume that social reality is intrinsically constituted and that it is
produced and reproduced by people. The emancipatory action research is a representative
critical thinking method.
One of the realities in studying HE quality systems resides in the fact that they are characterised
by both hard and soft issues. As such the positivist and/or interpretive perspectives may not be
as much informative as the combination of these perspectives. For this reason, this research is
informed by the systems paradigm, which has specifically been used when dealing with hard and
soft research issues. When dealing with problems in a complex organisational world such as HE
quality, mathematical methods that operate at a high level of abstraction may not be entirely use-
ful, since these models are forced to analyse a narrow slice of reality, as that is the only way to
construct a model suitable for mathematical analysis. In contrast, the foundations of the system
paradigm is to grasp reality in so far as possible, not just a thin slice of it. The systems paradigm
is largely concerned with the whole picture, the emergent properties and other relationships be-
tween parts of the whole (Lane and Oliva, 1998). The earliest adoption of the systems perspective
54
resulted from the realisation that scientific methodologies sometimes failed because they did not
take into account the interactions which take place when a problem involves multiple stakeholders
with independent views of the system.
There are two main ways of viewing a system, the soft systems approach and hard systems ap-
proach. Hard systems approaches involve computer simulations, e.g., system dynamics, and the
techniques used in operations research. Hard systems look at the “how?” meaning, how to best
achieve and test the selected option of development and analysis. Hard systems approaches are
useful for problems that can justifiably be quantified. However, they cannot easily take into ac-
count unquantifiable variables (opinions, culture, politics, etc) for which soft systems approaches
are applicable. Furthermore, Checkland (1981) maintains that problem solving may involve choos-
ing alternative ways to move a present state S0 to a desired state, S1. The hard systems thinking
perspective involves defining S0 and S1 and selecting the best means of reducing the difference
between them. However, as the complexity of the problem solved increases, the certainty with
which these states are defined diminishes.
From a synthesis of discussions on the systems philosophical perspectives by Checkland (1981),
Ackoff (1999), and Lane and Oliva (1998), this research deduced that the development of a de-
cision support tool for quality management in an action oriented environment of higher educa-
tion could not be done without engaging HE management with the needed domain knowledge or
mental models. The research therefore adopted the SD philosophy of modelling with clients or
simply group model building (GMB) which addresses problems involving multiple stakeholders
with independent views of the system, where there is strong inter-personal disagreement in the
client group regarding the problem and/or regarding policies that govern system behaviour (Ven-
nix, 1999; Zagonel, 2002).
System Dynamics is yet another lens of conducting multi-disciplinary research involving both
‘hard’ and ‘soft’ systems in complex environments. It has been used to perform research into IS,
organisational, and social phenomena (Forrester, 1961; Luna-Reyes and Anderson, 2003; Warren,
2004; Rouwette and Vennix, 2006). Such wide scope is possible because SD though mainly quan-
titative, traverses the qualitative approach.
In advancing the SD paradigm debate, Meadows (1989) asserts that “the SD paradigm assumes
that the world is composed of closed, feedback-dominated, non-linear, time delayed systems and
55
thus the method must be most applicable to systems that do indeed possess these characteristics.
In general, such systems will be characterized by distinctive dynamic patterns, long time horizons,
and broad interdisciplinary boundaries”. In other words, certain ontological and epistemologi-
cal principles underpin formal modelling leading to realistic representation and simulation of the
system.
Ontological Principles
The basic ontological assumptions of SD is found in Meadows (1989): “that things are intercon-
nected in complex patterns, that the world is made up of rates, levels and feedback loops, that
information flows are intrinsically different from physical flows, that nonlinearities and delays are
important elements in systems, (and) that behaviour arises out of system structure”. In an earlier
proposition, Forrester (1961, p.60) argues that, “all constants and variables of a system dynam-
ics model can and should be counterparts of corresponding quantities and concepts in the actual
system”. Other ontological propositions such as: system dynamics modelling as representation
of reality versus modelling as a tool for negotiating a social order (Zagonel, 2002), support the
adoption of more moderate views, namely that systems, stocks, flows, and so on, may sometimes
really exist, and may sometimes be interesting devises to structure, describe and make sense of
perceptions of complex real-world issues in the world around us.
Considering that SD models are rational structures that generate a formal behaviour which must fit
the empirical behaviour of the system being modeled, for a model to be accepted as valid, in the
first place, it is necessary that the hypotheses used to build the model should be compatible with
available scientific or heuristic knowledge. Secondly, these hypotheses should be captured ade-
quately with the representational tools of SD language, and all this information must be processed
properly to obtain conclusions that will fit the empirical behaviour. These propositions have direct
epistemological equivalences. This is the subject of next discussion.
Epistemological Principles
SD inquiry stems from an epistemology that is built around the centrality of mental models as
cognitive schemes or structures (Forrester, 1970). Due to the ‘bounded rationality’ concept, i.e.,
limitations in memory and cognitive skills when humans attempt to infer the dynamics of mental
56
models involving feedback, humans fail to work out the consequences of their assumptions in a
complete and logical way. In consequence, decisions that are made daily are incomplete ‘mental
simulation’ of very complex ideas about social systems (Lane and Oliva, 1998). Indeed, as For-
rester (1970, p. 213) puts it, “the human mind is not adapted to sensing correctly the consequences
of a mental model”. However, such dilemma can be resolved by using a modelling framework that
coincides with that of the real system such that there can be a natural flow of real-world informa-
tion into the model. As such, the level-rate-feedback structure in system dynamics is indeed the
fundamental and universal structure of real social and physical systems (Forrester, 1994).
Vazquez, Liz, and Aracil (1996) suggest three main kinds of knowledge involved in SD model
building:
- Structural knowledge: this sometimes comes from the available theoretical knowledge, and
is expressed with the help of scientific concepts. The only source of structural knowledge
is the mental models which subjects/experts have about the system to be modelled. Hence,
structural knowledge is expressed only in intuitive terms and in ordinary language (Forrester,
1998).
- Quantitative knowledge: this is reflected in reference modes, temporal series, empirical be-
haviours as well as knowledge concerning the initial conditions in which the real system is
placed. In other words, the empirical knowledge that is available with regard to the varia-
tions of the relevant magnitudes of the system over time and the particular values of these
magnitudes in a given situation.
- Operational knowledge: the specific SD skills and practical knowledge that the modeller
uses when integrating the other two kinds of knowledge in order to represent the SD model.
The SD model simulates the dynamic behaviour of the modelled system and assumes that
it contains a certain structure. It is intended that the SD model will be able to guide policy
actions of the real system.
Vazquez et al. (1996) claim that it is essential to have these three kinds of knowledge coherently
included in the SD models, since, while empirical behaviours give the quantitative data and an-
chor in reality, mental models give information which is not so much quantitative but structural.
Therefore, mental models can be said to be strongly interactive and to have a very rich and relevant
representational content regarding the system structure.
57
3.2.2 Theoretical Underpinning
A theory is a coherent descriptive structure and explanation of observed or experienced phenomena
(Lane, 1999). It is a structured, explanatory, abstract and coherent set of interconnected statements
about a reality (Schwaninger and Grosser, 2008). The purpose of theory in applied disciplines is
therefore to explain the meaning, nature and challenges of a phenomenon, often experienced but
not explained in the world in which we live so that we may use that knowledge and understanding
to act in more informed and effective ways (Lynham, 2002).
Lane (1999) suggests using different theories and concepts that relate to the specific problem to be
solved. In the same line, Robey (1996) argues...theoretical foundations for research and specific
research methods are justified by research aims or purposes. They should not be chosen because
they conform to a dominant paradigm or because the researcher believes in their intrinsic values.
Rather, theories and methods are justified on pragmatic grounds as appropriate tools for accom-
plishing research aims.
Given the dual goal and multi-disciplinary nature of this research as highlighted in chapter 1, no
single theoretical foundation would be suitable, yet at the same time it would be absurd to claim
that the research is not informed by any theory. Hence, two theories were arguably found relevant:
a technology driven theory for guiding SD model building and validation (critical rationalist theory
of science), and organizational decision choice theory for guiding decision making on HE quality
issues (Garbage Can Model of Organizational Choice). Whereas the complementarity of these
theories have not been researched, they soundly underlie the two sides of the current research.
Critical Rationalist Theory of Science
SD modelling is often colloquially referred to as ‘theory building’ approach (Schwaninger and
Grosser, 2008; Kopainsky and Luna-Reyes, 2008). The knowledge of SD model building in this
research is underpinned by the critical rationalist theory of science (Popper, 2002). According
to this theory, a hypothesis is tested and if falsified, then it is refuted. If, however, the attempt
of falsification is not successful, then it can be temporarily maintained. The critical rationalist
stance adopted is consistent with Schwaninger and Grosser (2008, p.450) proposition that “theory
building in the human and social sciences is not primarily meant to be an exercise of underpin-
58
ning hypothesis, nor anything like ‘proving’ their truth. It is a process by which assumptions and
systems of hypotheses, are specified, and then are submitted to tests. These tests are essentially
endeavours of falsification”.
SD simulation models generally embody propositions that are empirically testable. These include
underlying mathematical equations, formal structures and behavioural assumptions. These tests
enable researchers to check how well their assumptions match available data about the overall
system behaviour (Lakatos, 1974). In the spirit of the critical rationalist theory of science, model
calibration and model validation tests are reported in section 5.5 and section 5.6 respectively.
Garbage Can Model of Organisational Choice
The Garbage Can Model of Organisational Choice (GCM) is a description of an organisational
decision process involving: participants, choice opportunities, solutions and problems. The or-
ganization is seen as a container where the members involved in the decision process interact
to generate decisions. Within the broadly defined field of organization theory Fioretti and Lomi
(2008) maintain that the best example of thinking about organisational decision processes is rep-
resented by the GCM as originally proposed in 1972 .
According to the theory, garbage can-like decision situations are induced by the simultaneous
presence of three factors. The first factor is problematic preferences, a term that Cohen, March and
Olsen (1972) introduced to capture the general tendency of decision-makers to discover their pref-
erences through action rather than acting on the basis of pre-defined and unchanging preferences.
Second, unclear technology: organisation processes are not understood by its members, operates
on the basis of simple trial-and-error procedures, and learns from the accidents of past experience.
Third, fluid participation: participants vary in the amount of time and effort they devote to different
domains; involvement varies from one time to another. As a result, the boundaries of the organ-
isation are uncertain and changing; the audiences and decision makers for any particular kind of
choice change capriciously.
Cohen et al. (1972) define an organisation as a collection of choices looking for problems, is-
sues and feelings looking for decision situations in which they might be aired, solutions looking
for issues to which they might be the answer, and decision-makers looking for work. To under-
59
stand processes within organisations, one can view a choice opportunity as a garbage can into
which various kinds of problems and solutions are dumped by participants as they are generated.
The mix of garbage in a single can depends on the mix of cans available, on the labels attached
to the alternative cans, on what garbage is currently being produced, and on the speed with which
garbage is collected and removed from the scene.
Garbage Can-like Decision Processes in HE
The relevance of the GCM is demonstrated by the considerable research that it has inspired, a large
section of which falls under higher education organisations. In the seminal work, Cohen et al.
(1972) emphasize that one class of organisation which faces decision situations involving unclear
goals, unclear technology, and fluid participants is the modern college or university. A decision in
GCM is the result of several relatively independent streams within an organisation, namely: prob-
lems, solutions, participants, and choice opportunities. In other studies, through Martin’s (1980,
as cited by Fioretti and Lomi, 2008) work on psychological research process, the GCM became
influential in psychology.
The existing work under the GCM umbrella is supported by the basic idea that GCM does en-
able choices to be made and problems resolved, even when the organisation is plagued with goal
ambiguity and conflict, with poorly understood problems that wander in and out of the system,
with a variable environment, and with decision makers who may have other things on their mind
(Fioretti and Lomi, 2008; Cohen et al., 1972). Therefore, management choices, e.g., quality im-
provement policies, implemented as a result of computer simulations may be justified provided
organisational structures associated with such simulations represent a real HE system. Most impor-
tantly, involving practitioners in building decision support models leads to consensus over decision
policies arising (Rouwette and Venix, 2006; Rouwette et al., 2002; Zagonel, 2002). This seems to
be the point of convergence between GCM and participative SD modelling’s underlying principles.
Within organisation theory the garbage can model represents a pioneering attempt to view organi-
sations as decentralised systems with a relatively complicated interplay in generation of problems,
engagement of personnel in the production of solutions, and the resulting opportunities for choice.
The modelling and simulation process presented in this thesis implies - for example - that the
participants involved in modelling contibute to - and benefit - from modelling at varying degrees.
This is particularly visible as modelling proceeds from problem identification cycle to modelling
proficiency. In this respect, the design of the modelling process and the resulting model itself are
60
fully consistent with the spirit of the GCM.
3.3 Evaluation of the Current Methods
A method according to March and Smith (1995) is a set of steps or guidelines used to perfom
a task. HE quality management encompasses a very large number of decisions in the areas of:
students’ entry qualifications, teaching quality, staff quality, staff retention, students’ projects su-
pervision and assessments, curriculum reviews, resource allocation, policy execution, and funding
and budgeting, to consider the major ones. A combination of these presents a complex challenge
that may not be resolved by one method. In fact, previous methods (refer to chapter 2, section 2.3)
have generally been successful in addressing a narrow scope of quality management challenges.
The evaluation of current methods therefore constitutes an important part of this chapter.
Evaluation of methods according to March and Smith (1995) concerns “operationality (the ability
to perform the intended task), efficiency, generality and ease of use”. In light of this, the design
science framework which emphasises rigour and relevance of interventions (March and Smith,
1995; Hevneret al., 2004) is adopted in this research for evaluating the effectiveness of existing
methods in addressing HE quality management problems.
The Design Science Framework
Hevneret al. (2004) present their information systems research framework: the design science
framework, for addressing novel organisational problems. In this framework, IS research is in-
fluenced by the “Environment of use” (people, organizations, and technology), as well as by a
“Knowledge Base of theoretical components” consisting of “Foundations” and “Methodologies”.
To build IS relevant to an environment, applicable knowledge from the Knowledge Base must be
applied in the building of artifacts that are part of the IS. These artifacts, put to use, must then
be evaluated according to the utility criterion of how well they meet the business needs of the
users. If the intervention has proven to be successful, the knowledge that a particular founda-
tional/methodological component was useful in the design of an artifact in a particular context
can be added to the knowledge base. In the view of Hevneret al. (2004), by focussing on the
relations between behavioral and design processes as informed by both the environment and the
knowledge base, the design science framework can help researchers develop new representations
of IS problems, solutions, and solution processes. This research therefore finds Hevneret al.’s
61
(2004) framework suitable for evaluation of current methods for HE quality management parttic-
ularly because it provides checks and balances on how knowledge is generated, used, tested, and
modified in the course of IS research project. This is possible by focussing on the central theme in
the research process, including: artefact development, evaluation techniques, methodology (data
analysis and validation), technology, roles and characteristics of people, and organisational struc-
ture and processes.
Application of Design Science Framework in Evaluating the Current Methods
Inspired by the previous discussion of the design science framework, seven methods are compared
using the design research strategy as given in Table 3.1.
62
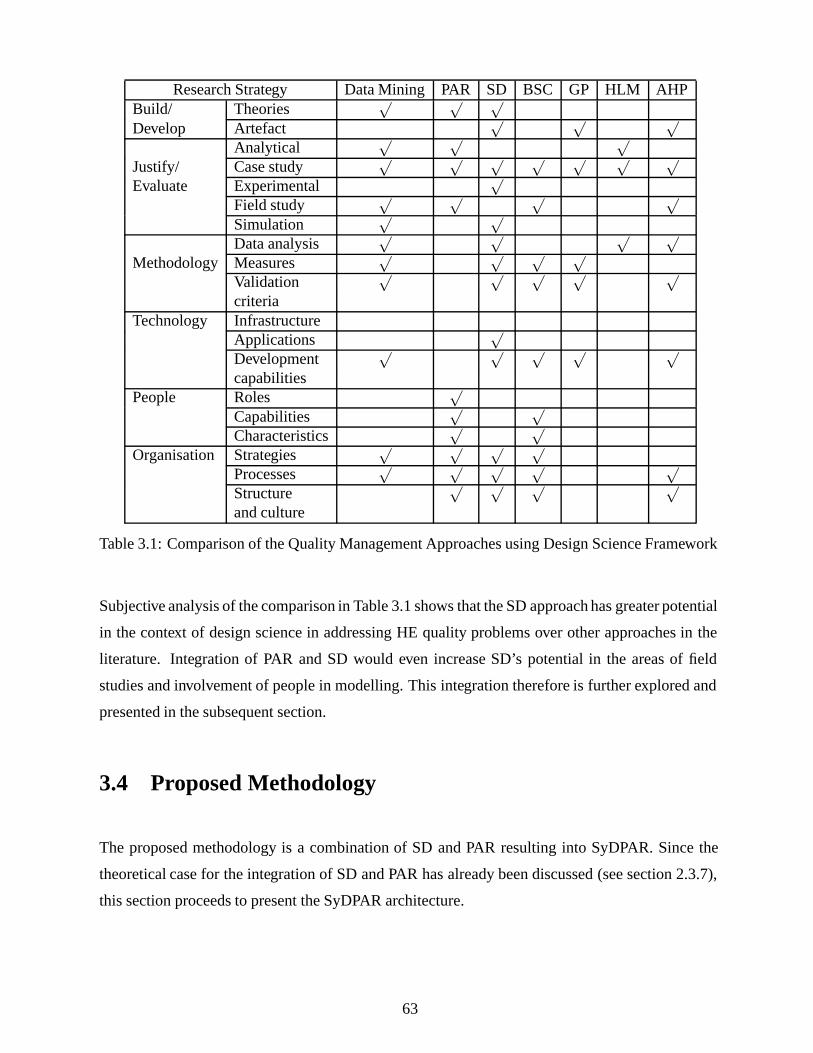
Research Strategy Data Mining PAR SD BSC GP HLM AHPBuild/ Theories
√ √ √
Develop Artefact√ √ √
Analytical√ √ √
Justify/ Case study√ √ √ √ √ √ √
Evaluate Experimental√
Field study√ √ √ √
Simulation√ √
Data analysis√ √ √ √
Methodology Measures√ √ √ √
Validation√ √ √ √ √
criteriaTechnology Infrastructure
Applications√
Development√ √ √ √ √
capabilitiesPeople Roles
√
Capabilities√ √
Characteristics√ √
Organisation Strategies√ √ √ √
Processes√ √ √ √ √
Structure√ √ √ √
and culture
Table 3.1: Comparison of the Quality Management Approaches using Design Science Framework
Subjective analysis of the comparison in Table 3.1 shows that the SD approach has greater potential
in the context of design science in addressing HE quality problems over other approaches in the
literature. Integration of PAR and SD would even increase SD’s potential in the areas of field
studies and involvement of people in modelling. This integration therefore is further explored and
presented in the subsequent section.
3.4 Proposed Methodology
The proposed methodology is a combination of SD and PAR resulting into SyDPAR. Since the
theoretical case for the integration of SD and PAR has already been discussed (see section 2.3.7),
this section proceeds to present the SyDPAR architecture.
63
3.4.1 The SyDPAR Modelling Architecture
The process of building system dynamics models ranges from linear iterative phases to the circular
phases. However, while all these process designs are well known and explicit to system dynamics
modellers, they are not comprehensive for participative SD modelling involving clients/practitioners
without prior modelling knowledge. While the six phases of SyDPAR’s architecture are compa-
rable with those of the prevalent SD literature except for the action planning phase, the difference
this phase makes by emphasising clients’ contributions and benefits from modelling involvement
is indisputably significant and useful. In this respect, the interplay of SyDPAR’s six phases dur-
ing modelling results into three cycles namely; problem articulation cycle, modelling proficiency
cycle, and solution refinement cycle, all of which address the diversity and legitimacy of contribu-
tions by both modellers and clients.
The SyDPAR’s architecture is underpinned by the following characteristics:
• Explicit outcome(s) for every phase
• Evaluation at every phase as basis for advancement to the next phase
• Explicit cycles/loops during modelling. The dynamics of mandatory and optional steps dur-
ing modelling results into these loops.
• Differential roles of the team are tied both to every phase and to the individual member of
the team such that control over the team and respective stages is concurrent
• Modelling exercise ends with implementation of recommended policies
Therefore, prior to modelling intervention, the team comprising of modellers and practitioners/participants
must clearly understand the modelling process. In other words, the modeller’s prime task as a fa-
cilitator and process coach is to ensure that the modelling process is not only followed during the
intervention, but understood by the team right from the start. This task is simplified by SyDPAR’s
architecture in Figure 3.1.
64
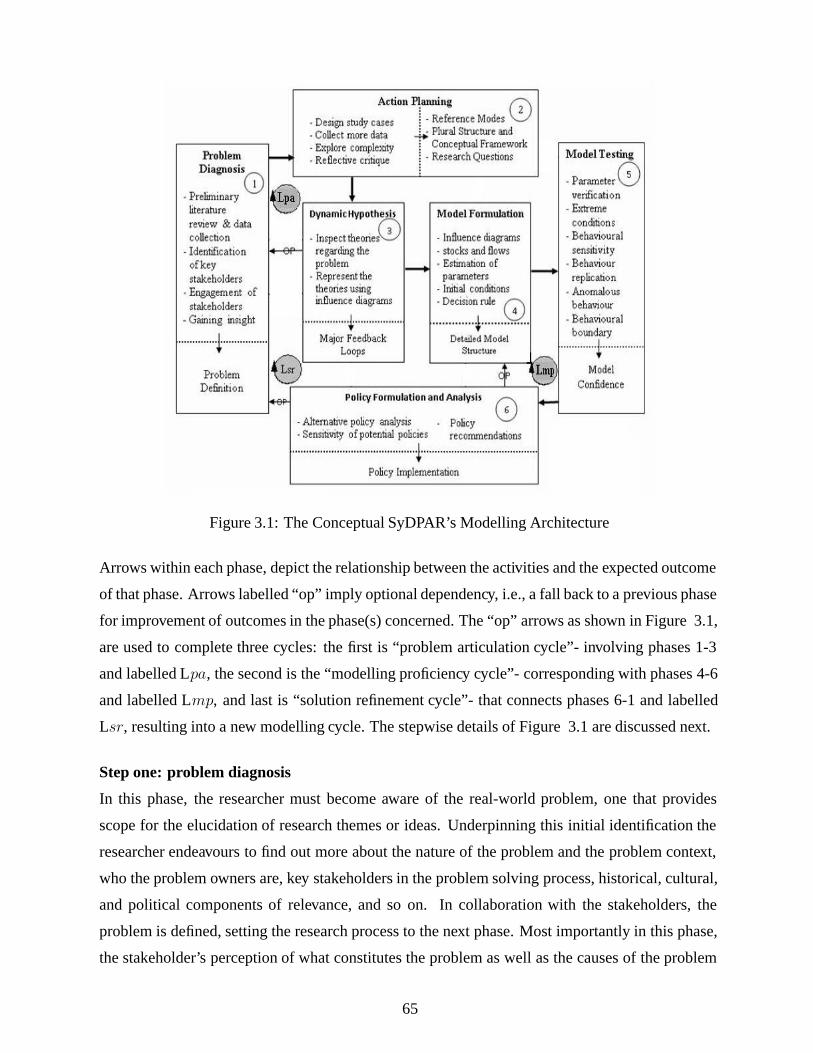
Figure 3.1: The Conceptual SyDPAR’s Modelling Architecture
Arrows within each phase, depict the relationship between the activities and the expected outcome
of that phase. Arrows labelled “op” imply optional dependency, i.e., a fall back to a previous phase
for improvement of outcomes in the phase(s) concerned. The “op” arrows as shown in Figure 3.1,
are used to complete three cycles: the first is “problem articulation cycle”- involving phases 1-3
and labelled Lpa, the second is the “modelling proficiency cycle”- corresponding with phases 4-6
and labelled Lmp, and last is “solution refinement cycle”- that connects phases 6-1 and labelled
Lsr, resulting into a new modelling cycle. The stepwise details of Figure 3.1 are discussed next.
Step one: problem diagnosis
In this phase, the researcher must become aware of the real-world problem, one that provides
scope for the elucidation of research themes or ideas. Underpinning this initial identification the
researcher endeavours to find out more about the nature of the problem and the problem context,
who the problem owners are, key stakeholders in the problem solving process, historical, cultural,
and political components of relevance, and so on. In collaboration with the stakeholders, the
problem is defined, setting the research process to the next phase. Most importantly in this phase,
the stakeholder’s perception of what constitutes the problem as well as the causes of the problem
65
is asserted.
GOAL: ensure that problem is defined more accurately and thoroughly bearing in mind that a
problem well stated is more or less a problem half solved. In addition, phase one explicitly connects
to the second phase since the setting of research objectives and framing the intervention in phase
two cannot be done independent of problem formulation.
Step two: action planning
In this phase, the research team develops a problem solving strategy after designing study cases,
collecting more data, and exploring problem complexity. The outcomes from this stage are ref-
erence modes, research questions and detailed documentation of research process (or system de-
scription) also known as “plural structure”, and the conceptual framework. In developing/refining
research objectives, consensus is sought on the basis of all parties (modellers and participants)
accepting the legitimacy of the other’s contributions. Only then will the action planned or rather
specific objectives of the intervention encompass both the modelling exercise and how competency
levels of participants in dealing with their practical problems should be addressed.
GOAL: develop a detailed system/model boundary. Specify criteria for evaluating results of mod-
elling exercise including benefits or changes in mental models of participants involved.
Step three: dynamic hypothesis
This phase together with the first two phases constitute the problem articulation cycle: for example,
identification of problem stakeholders and problem definition in step one, leads to the design of
study cases, eliciting of reference modes, and the model conceptual framework in step two, which
underpins the development of dynamic hypothesis in step three. Depending on the nature of the
problem, rather than move to step four from step three, a fall back to step one, hence the prob-
lem articulation cycle, may be preferred until consensus is reached on the problem to solve. The
messier the problem, the higher the iterations of problem articulation cycle. The keyword “articu-
lation” is aptly used to imply that: a complete diagnosed problem relies on stakeholder-provided
data on the problem (reference modes) and the research team’s ability to represent the problem
structurally (dynamic hypothesis).
GOAL: show the sections of the system’s structure or major feedback loops that are responsible
for dynamic behaviour of the whole system.
Step four: model formulation
The insights from step three and step two are used in model formulation in this phase. The outcome
66
of this phase therefore, is a detailed model structure. The model structure comprises of influence
diagrams that capture relationships between different elements of the system, and stocks and flows
diagram for quantitative representation of these relationships. The actual model building is ac-
complished in this phase and hence stakeholders’ contributions are minimal but their involvement
is relevant, and must be considered a priori (cf., second step). In order to reconcile scepticism
regarding capacity of rational reasoning and learning in human beings when dealing with com-
plex systems (Sterman, 2002) with claims that model building concepts can be easily grasped by
stakeholders without prior related skills (Luna-Reyeset al.,2006), “modelling proficiency cycle”
is envisaged. In this case, a module that is easier to follow by un-experienced stakeholders is built,
tested and simulated in the first iteration, then a larger model is developed in the second iteration,
and process repeated until the final model is built.
GOAL: detailed model is built and adopted by the modelling team. It is certainly crucial that
communication between the researcher(s) and the stakeholders is maximised so that stakeholders
maintain a good momentum to sail through the last stages of modelling.
Step five: model testing
Model testing does not require technical knowledge of SD provided the stakeholders are encour-
aged to learn new but simple validation concepts. Both model structure and model behaviour tests
are done in this stage in comparison with reference modes in stage 2. Success in testing of the
model creates confidence in the model.
GOAL: analyse simulation results against reference data as basis of gaining confidence in the
model built.
Step six: policy formulation and analysis
Phase 6 requires more emphasis by stakeholders especially those at the forefront of policy imple-
mentation. Although the researcher monitors policy analysis stage, actual policy changes in real
life are effected by the stakeholders. If satisfactory outcomes are realised in this stage then the
modelling process is considered successful otherwise, the research team refocus on the problem,
amend the action plan and make additional changes to the problem context in a new modelling
cycle also referred to as solution refinement cycle.
GOAL: policy implementation including a continuous evaluation of whether the need for further
policy changes is still existent.
67
3.5 Field Studies
This research follows a participative modelling design. Performing a field study in such a design
defeats the very foundation of participative modelling for which clients/participants provide data
and information needed for model building. The field studies were nevertheless necessary partic-
ularly in generating data for facilitating better understanding of the problem which culminated in
a preliminary model. The preliminary model was then refined into the final model also referred
to as ‘QMT09’ through a series of iterations of participative engagement with HE management
stakeholders .
3.5.1 Stakeholders
The history of HEIs from their traditional perception as “ivory towers”, namely elite institutions
characterised by complete and undisputed intellectual and behavioural autonomy, to the current
perception as customer-oriented and revenue-seeking enterprises, has created a range of stake-
holders. The broad HE stakeholders therefore include: academics, government, labour market,
alumini, students, parents, and accreditation agencies. In the context of this research, three stake-
holders categories are considered:
a) Senior academic staff from two oldest Ugandan public and two oldest private universities as
experts on HE quality problematic issues
b) Selected senior academic/managementstaff of Makerere University as participants in model
building
c) Quality Assurance departments of Makarere University and the Inter-University Council for
East Africa as users of QMT09
3.5.2 Data Collection
Stakeholders or clients are involved in participative modelling for three main reasons: as iden-
tifiers of problem of interest, as sources of information required in the modelling effort, and as
implementers of modelling results. Although the involvement of stakeholders in itself guarantees
68
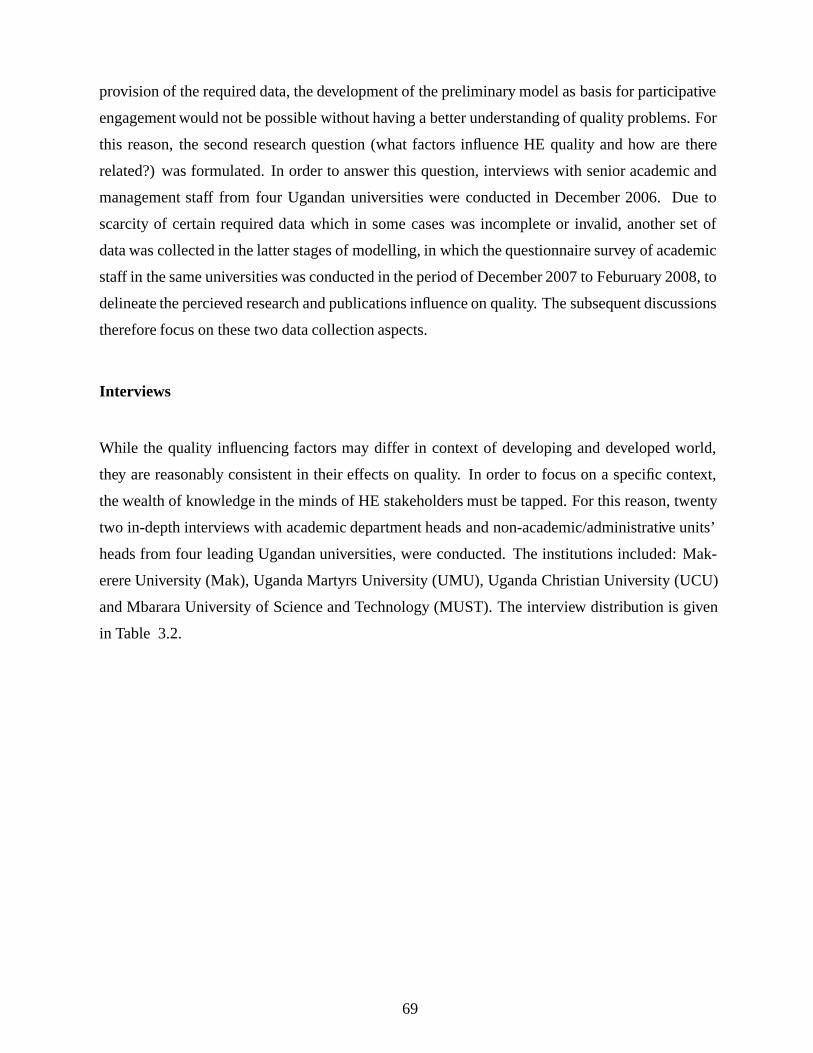
provision of the required data, the development of the preliminary model as basis for participative
engagement would not be possible without having a better understanding of quality problems. For
this reason, the second research question (what factors influence HE quality and how are there
related?) was formulated. In order to answer this question, interviews with senior academic and
management staff from four Ugandan universities were conducted in December 2006. Due to
scarcity of certain required data which in some cases was incomplete or invalid, another set of
data was collected in the latter stages of modelling, in which the questionnaire survey of academic
staff in the same universities was conducted in the period of December 2007 to Feburuary 2008, to
delineate the percieved research and publications influence on quality. The subsequent discussions
therefore focus on these two data collection aspects.
Interviews
While the quality influencing factors may differ in context of developing and developed world,
they are reasonably consistent in their effects on quality. In order to focus on a specific context,
the wealth of knowledge in the minds of HE stakeholders must be tapped. For this reason, twenty
two in-depth interviews with academic department heads and non-academic/administrative units’
heads from four leading Ugandan universities, were conducted. The institutions included: Mak-
erere University (Mak), Uganda Martyrs University (UMU), Uganda Christian University (UCU)
and Mbarara University of Science and Technology (MUST). The interview distribution is given
in Table 3.2.
69
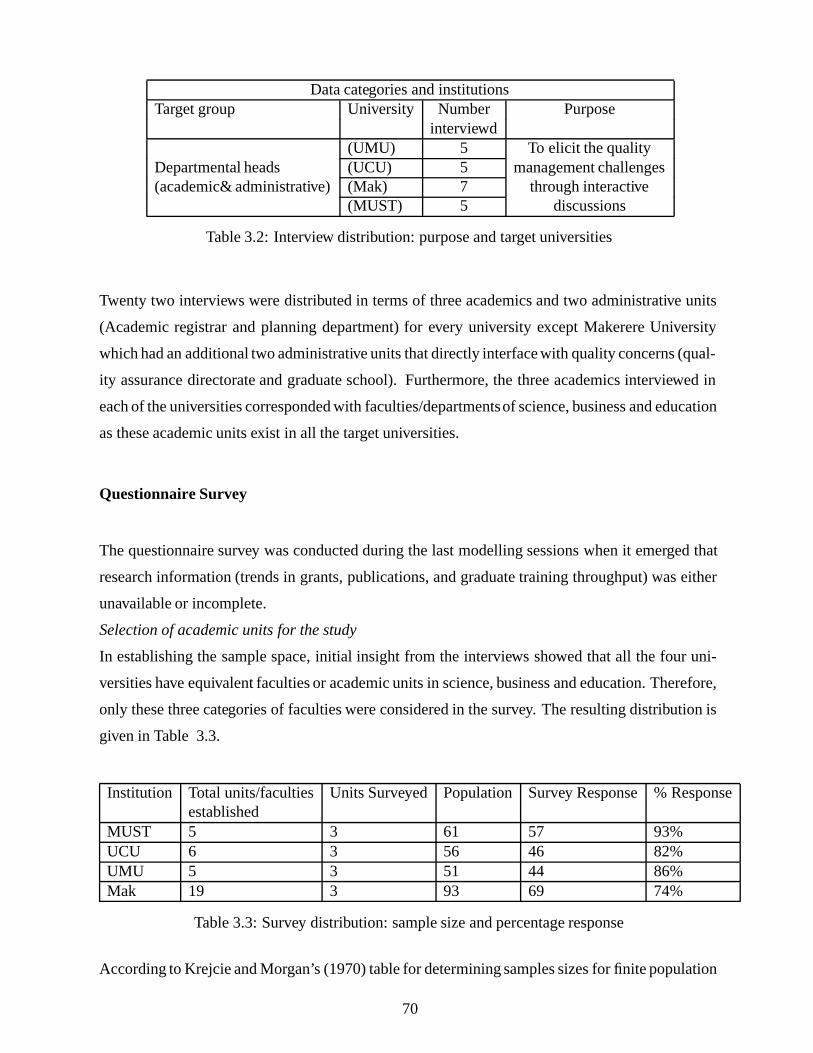
Data categories and institutionsTarget group University Number Purpose
interviewd(UMU) 5 To elicit the quality
Departmental heads (UCU) 5 management challenges(academic& administrative) (Mak) 7 through interactive
(MUST) 5 discussions
Table 3.2: Interview distribution: purpose and target universities
Twenty two interviews were distributed in terms of three academics and two administrative units
(Academic registrar and planning department) for every university except Makerere University
which had an additional two administrative units that directly interface with quality concerns (qual-
ity assurance directorate and graduate school). Furthermore, the three academics interviewed in
each of the universities corresponded with faculties/departmentsof science, business and education
as these academic units exist in all the target universities.
Questionnaire Survey
The questionnaire survey was conducted during the last modelling sessions when it emerged that
research information (trends in grants, publications, and graduate training throughput) was either
unavailable or incomplete.
Selection of academic units for the study
In establishing the sample space, initial insight from the interviews showed that all the four uni-
versities have equivalent faculties or academic units in science, business and education. Therefore,
only these three categories of faculties were considered in the survey. The resulting distribution is
given in Table 3.3.
Institution Total units/faculties Units Surveyed Population Survey Response% Responseestablished
MUST 5 3 61 57 93%UCU 6 3 56 46 82%UMU 5 3 51 44 86%Mak 19 3 93 69 74%
Table 3.3: Survey distribution: sample size and percentage response
According to Krejcie and Morgan’s (1970) table for determining samples sizes for finite population
70
(refer to appendix D), the percentage responses in Table 3.3 are justified.
3.6 Conclusion
The need for client centred participative modelling design is core to this research. This has been
addressed by the SyDPAR solution process presented in this chapter. A field study design has
also been presented in this chapter as a necessary step in discovering HE quality problems prior to
engaging HE stakeholders in participative model building. What remains is applying SyDPAR in
actual model developement. This is explicitly treated in chapter 5.
71
Chapter 4
Research Issues and Field Study Findings
4.1 Introduction
This chapter presents the research issues including the conceptual HE quality management system
structure and findings from the field study. First, the research issues underpinning HE quality
problem area are discussed in section 4.2. This is followed by a presentation of the findings of the
field study in section 4.3. Finally, a concluding discussion is given.
4.2 Research Issues
An application for quality management in this research denotes a system dynamics simulation
model for institutional and program quality analysis. The recent studies have shown that quality
management is an extremely important topic in HE research (Telford and Masson, 2005; Csizma-
dia, 2006; Shawyun, 2006; Umashankar and Dutta, 2007) and at the same time, have pointed out
areas that still need to be addressed. In particular, research on quality improvement amidst other
dynamics in education settings, such as: rising enrolment, funding inadequacy, low staff qualifi-
cations, low research productivity, resources and infrastructure constraints, has been characterised
by narrow scope, disguised in some cases as addressing the main challenges (Hoet al., 2006;
Temponi, 2005; Vinnik and Scholl, 2005), rather than the entire spectrum of challenges. As such,
these studies have not succeeded in providing lasting solution to quality improvement concerns.
In addition, available studies on enrolment are silent on the relationship between enrolment and
72
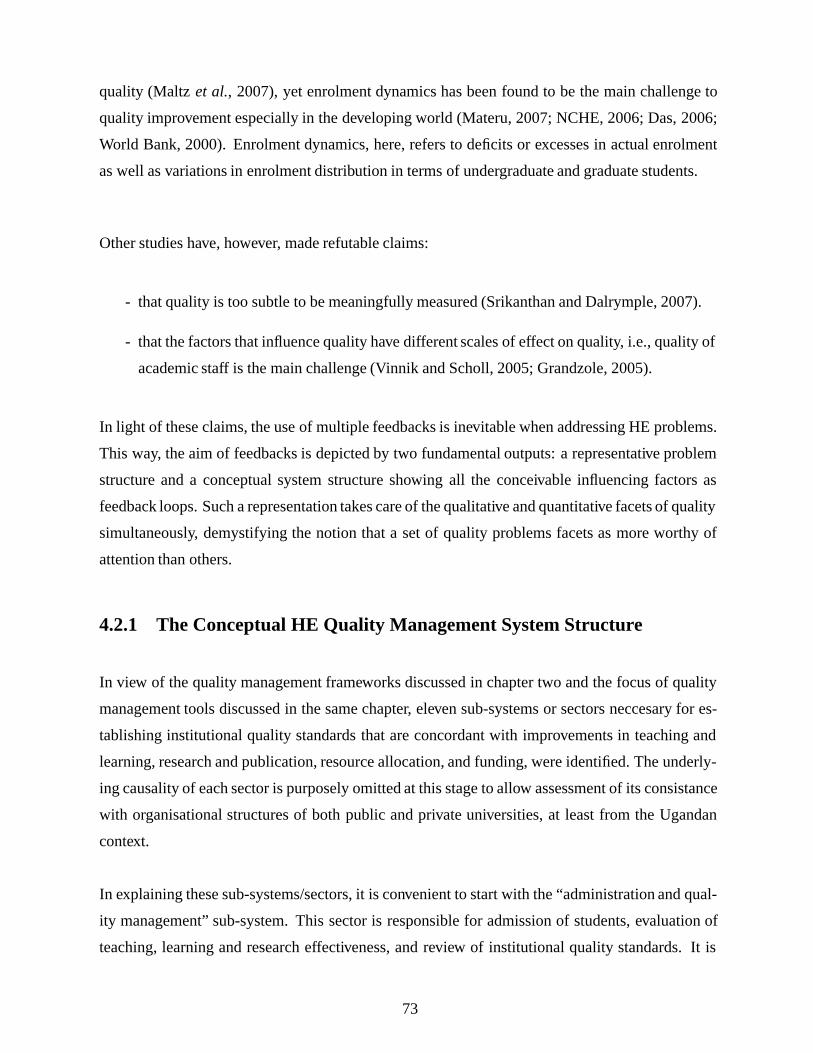
quality (Maltz et al., 2007), yet enrolment dynamics has been found to be the main challenge to
quality improvement especially in the developing world (Materu, 2007; NCHE, 2006; Das, 2006;
World Bank, 2000). Enrolment dynamics, here, refers to deficits or excesses in actual enrolment
as well as variations in enrolment distribution in terms of undergraduate and graduate students.
Other studies have, however, made refutable claims:
- that quality is too subtle to be meaningfully measured (Srikanthan and Dalrymple, 2007).
- that the factors that influence quality have different scales of effect on quality, i.e., quality of
academic staff is the main challenge (Vinnik and Scholl, 2005; Grandzole, 2005).
In light of these claims, the use of multiple feedbacks is inevitable when addressing HE problems.
This way, the aim of feedbacks is depicted by two fundamental outputs: a representative problem
structure and a conceptual system structure showing all the conceivable influencing factors as
feedback loops. Such a representation takes care of the qualitative and quantitative facets of quality
simultaneously, demystifying the notion that a set of quality problems facets as more worthy of
attention than others.
4.2.1 The Conceptual HE Quality Management System Structure
In view of the quality management frameworks discussed in chapter two and the focus of quality
management tools discussed in the same chapter, eleven sub-systems or sectors neccesary for es-
tablishing institutional quality standards that are concordant with improvements in teaching and
learning, research and publication, resource allocation, and funding, were identified. The underly-
ing causality of each sector is purposely omitted at this stage to allow assessment of its consistance
with organisational structures of both public and private universities, at least from the Ugandan
context.
In explaining these sub-systems/sectors, it is convenient to start with the “administration and qual-
ity management” sub-system. This sector is responsible for admission of students, evaluation of
teaching, learning and research effectiveness, and review of institutional quality standards. It is
73
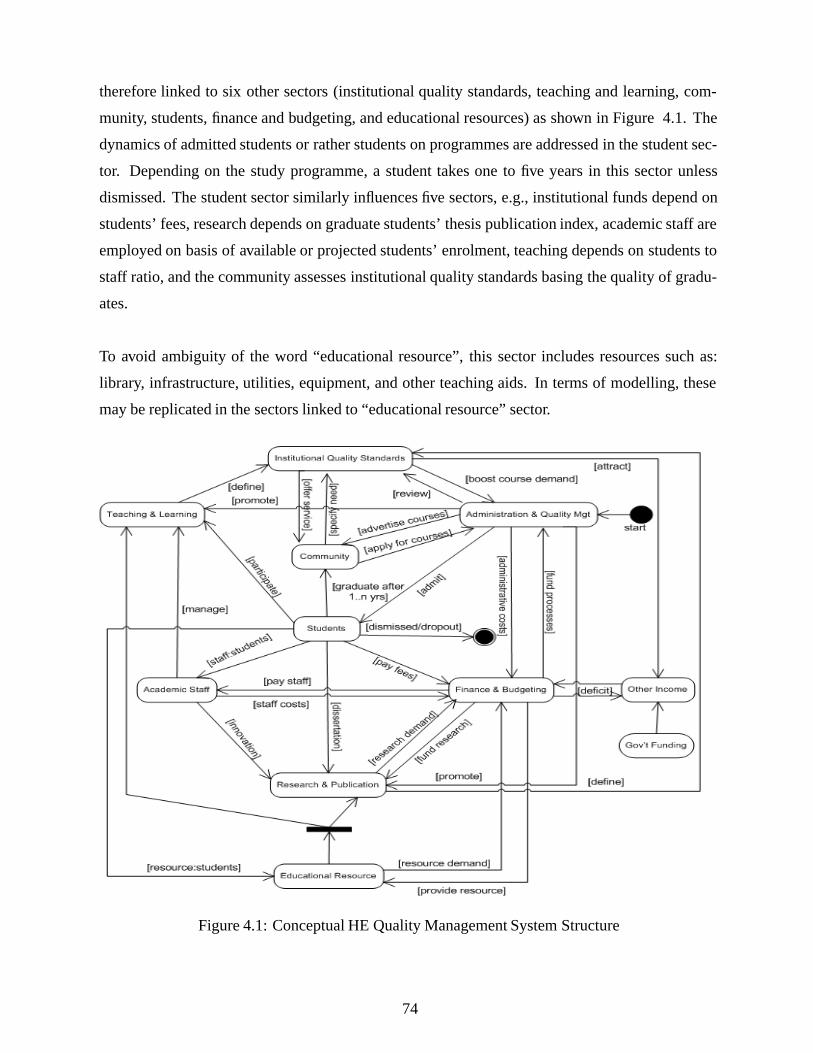
therefore linked to six other sectors (institutional quality standards, teaching and learning, com-
munity, students, finance and budgeting, and educational resources) as shown in Figure 4.1. The
dynamics of admitted students or rather students on programmes are addressed in the student sec-
tor. Depending on the study programme, a student takes one to five years in this sector unless
dismissed. The student sector similarly influences five sectors, e.g., institutional funds depend on
students’ fees, research depends on graduate students’ thesis publication index, academic staff are
employed on basis of available or projected students’ enrolment, teaching depends on students to
staff ratio, and the community assesses institutional quality standards basing the quality of gradu-
ates.
To avoid ambiguity of the word “educational resource”, this sector includes resources such as:
library, infrastructure, utilities, equipment, and other teaching aids. In terms of modelling, these
may be replicated in the sectors linked to “educational resource” sector.
Figure 4.1: Conceptual HE Quality Management System Structure
74
The appropriateness of these sub-systems or sectors lies in the feedback loops representing real
life academic evironment. To a system dynamicist, Figure 4.1 is a good starting point to collect
necessary data and develop reference modes, explore causality in form of causal loop diagrams
(CLDs) for each sector, then develop stock and flows diagrams and finally perform simulation
experiments. These steps are discussed in the next chapter.
Granularity and Scope of the HE Quality Management System Structure
Each sector in Figure 4.1 implies its own unique set of factors that influence higher education
quality. The overall effect on quality is achieved both by accurancy of causality and mathematical
representation of this causality. To achieve a comprehensive system structure, the identification of
the sub-systems as well as their integration into the overall system is important, thus eliminating
blind spots and other weaknesses that would result from ignoring parts that form the whole. Ulti-
mately, the features of the framework in Figure 4.1 in addressing quality management in higher
education can be summarised by the following points:
• A clear focus on designing a quality management system, taking into consideration all the
sub-systems;
• Replication of the relationships between the sub-systems as they exist in a higher education
institutional setting;
• A clear emphasis on the role of funding on quality, including mechanisms of funding sus-
tainability outside tuition fees collection;
• Consideration of the interests of various stakeholders including students, academic staff,
institutional managers, government and the community;
• The effectiveness of teaching/learning is dependent on teachers (qualifications, teaching
load, experience), learners (prior knowledge, motivation) and academic environment (class
size, staff to student ratios, and teaching resources);
• Graduate training is necessary for increasing research publications throughput;
• The class of undergraduate degree reflects quality of undergraduates;
75
• The focus is on quality of an academic unit since within the same institution, different aca-
demic units can have different quality of outcomes;
• Required educational resources are acquired based on established demands thereby provid-
ing means of determing resource gaps;
• Informationsystems are necessary in supporting the different quality managementprocesses;
• Quality problem representation transcends a mere feedback system by demonstrating higher
education as a system with multiple feedback structures.
4.3 Field Study Findings
The findings presented in this section originate from the interviews and questionnaire survey de-
scribed in chapter 3.
4.3.1 Nature of HE Quality Problems
In eliciting problems in HE quality management, the academics and administrative heads were
asked to explain the existing problems with appropriate examples. As a means of validating the re-
sponses, only problems mentioned by at least two respondents have been considered. The analysis
in Table 4.1 shows the depth of problems as experienced by the universities.
76
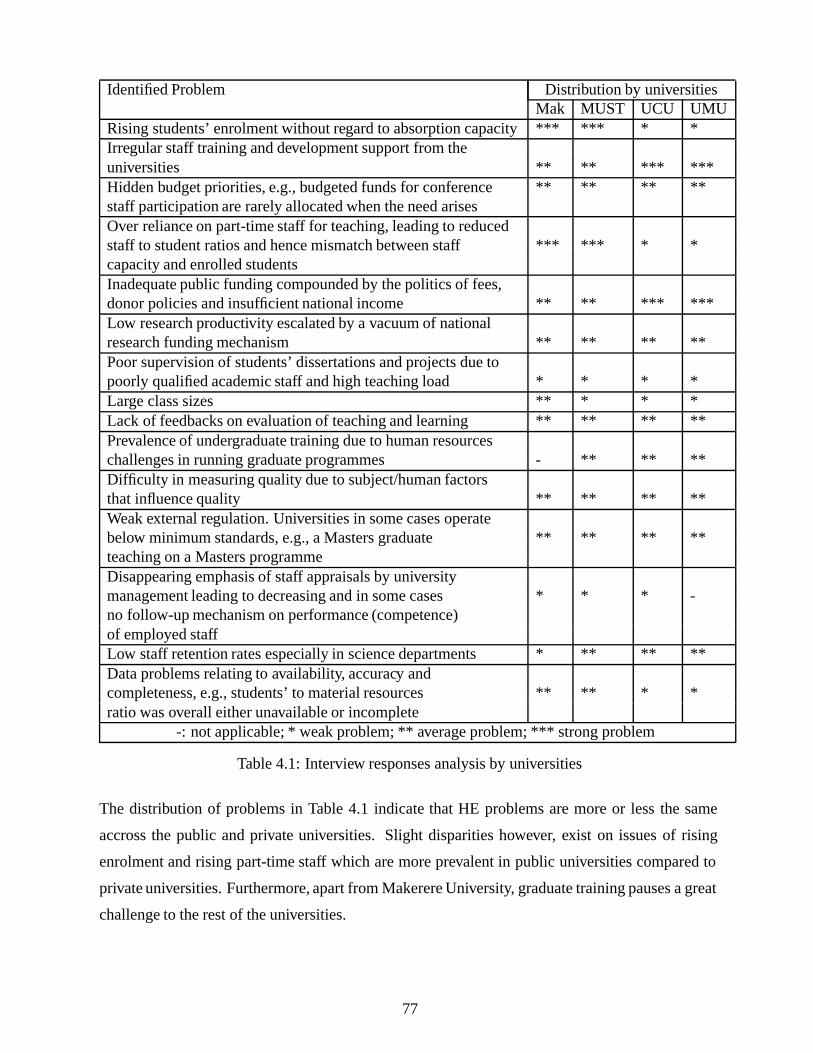
Identified Problem Distribution by universitiesMak MUST UCU UMU
Rising students’ enrolment without regard to absorption capacity*** *** * *Irregular staff training and development support from theuniversities ** ** *** ***Hidden budget priorities, e.g., budgeted funds for conference ** ** ** **staff participation are rarely allocated when the need arisesOver reliance on part-time staff for teaching, leading to reducedstaff to student ratios and hence mismatch between staff *** *** * *capacity and enrolled studentsInadequate public funding compounded by the politics of fees,donor policies and insufficient national income ** ** *** ***Low research productivity escalated by a vacuum of nationalresearch funding mechanism ** ** ** **Poor supervision of students’ dissertations and projects due topoorly qualified academic staff and high teaching load * * * *Large class sizes ** * * *Lack of feedbacks on evaluation of teaching and learning ** ** ** **Prevalence of undergraduate training due to human resourceschallenges in running graduate programmes - ** ** **Difficulty in measuring quality due to subject/human factorsthat influence quality ** ** ** **Weak external regulation. Universities in some cases operatebelow minimum standards, e.g., a Masters graduate ** ** ** **teaching on a Masters programmeDisappearing emphasis of staff appraisals by universitymanagement leading to decreasing and in some cases * * * -no follow-up mechanism on performance (competence)of employed staffLow staff retention rates especially in science departments * ** ** **Data problems relating to availability, accuracy andcompleteness, e.g., students’ to material resources ** ** * *ratio was overall either unavailable or incomplete
-: not applicable; * weak problem; ** average problem; *** strong problem
Table 4.1: Interview responses analysis by universities
The distribution of problems in Table 4.1 indicate that HE problems are more or less the same
accross the public and private universities. Slight disparities however, exist on issues of rising
enrolment and rising part-time staff which are more prevalent in public universities compared to
private universities. Furthermore, apart from Makerere University, graduate training pauses a great
challenge to the rest of the universities.
77
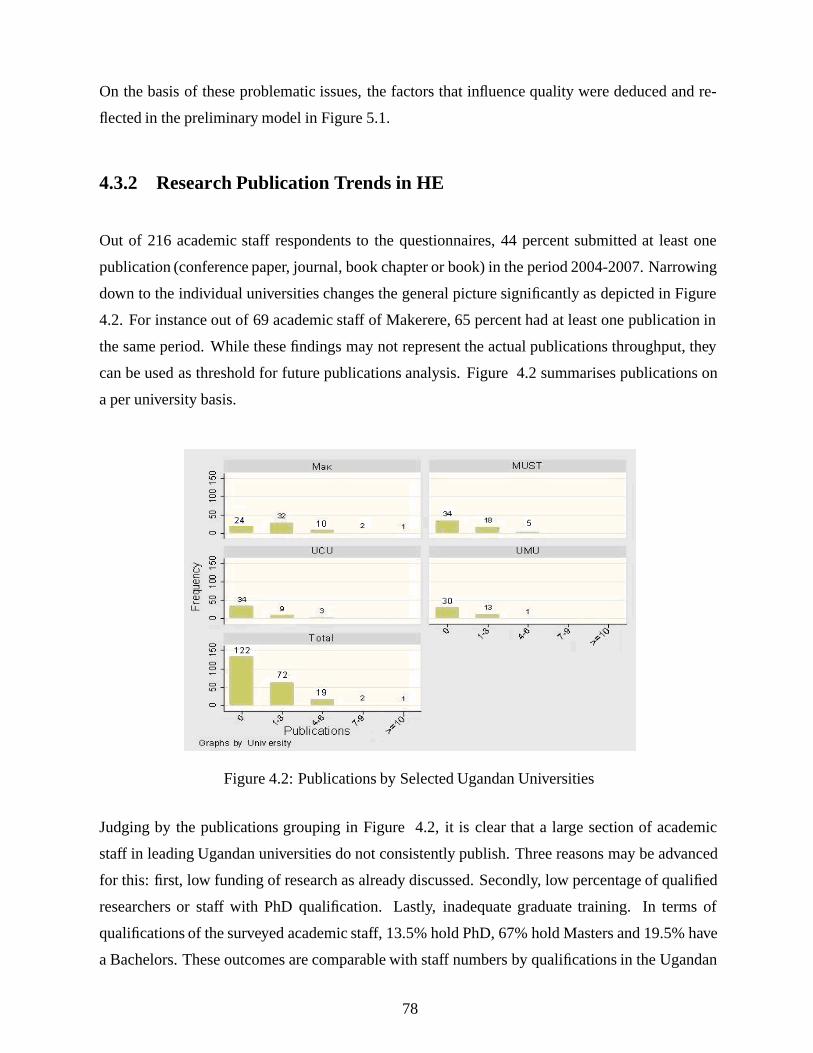
On the basis of these problematic issues, the factors that influence quality were deduced and re-
flected in the preliminary model in Figure 5.1.
4.3.2 Research Publication Trends in HE
Out of 216 academic staff respondents to the questionnaires, 44 percent submitted at least one
publication (conference paper, journal, book chapter or book) in the period 2004-2007. Narrowing
down to the individual universities changes the general picture significantly as depicted in Figure
4.2. For instance out of 69 academic staff of Makerere, 65 percent had at least one publication in
the same period. While these findings may not represent the actual publications throughput, they
can be used as threshold for future publications analysis. Figure 4.2 summarises publications on
a per university basis.
Figure 4.2: Publications by Selected Ugandan Universities
Judging by the publications grouping in Figure 4.2, it is clear that a large section of academic
staff in leading Ugandan universities do not consistently publish. Three reasons may be advanced
for this: first, low funding of research as already discussed. Secondly, low percentage of qualified
researchers or staff with PhD qualification. Lastly, inadequate graduate training. In terms of
qualifications of the surveyed academic staff, 13.5% hold PhD, 67% hold Masters and 19.5% have
a Bachelors. These outcomes are comparable with staff numbers by qualifications in the Ugandan
78
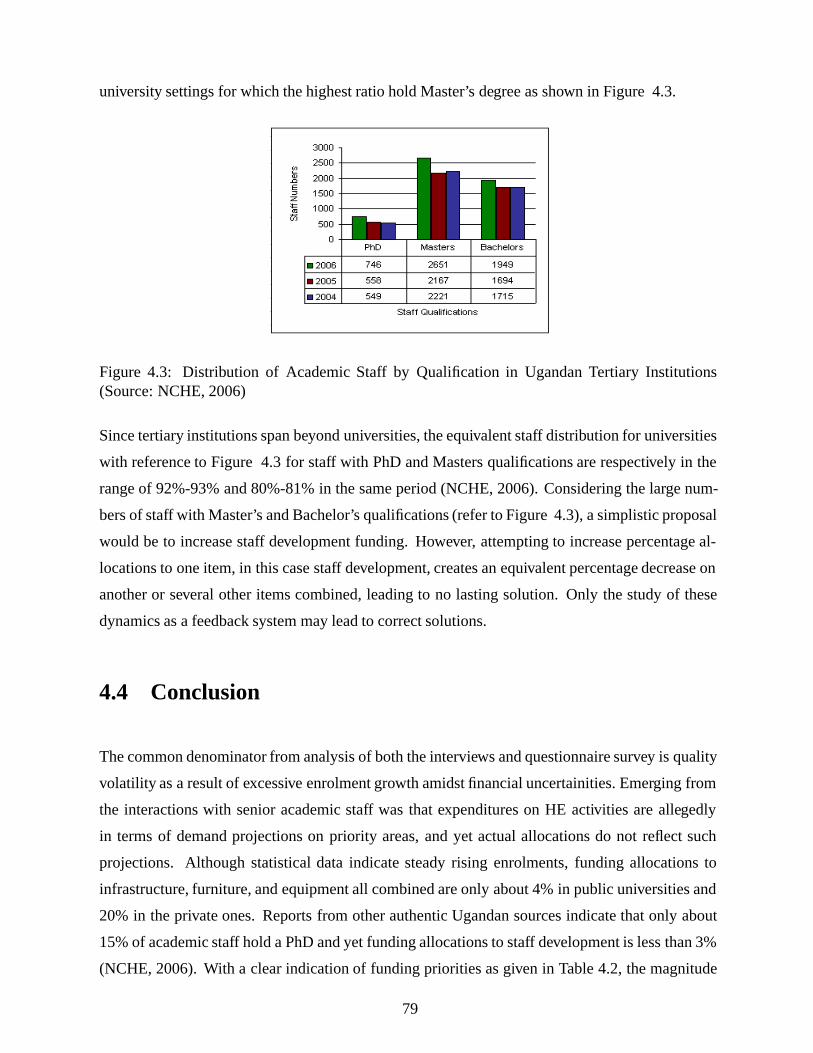
university settings for which the highest ratio hold Master’s degree as shown in Figure 4.3.
Figure 4.3: Distribution of Academic Staff by Qualification in Ugandan Tertiary Institutions(Source: NCHE, 2006)
Since tertiary institutions span beyond universities, the equivalent staff distribution for universities
with reference to Figure 4.3 for staff with PhD and Masters qualifications are respectively in the
range of 92%-93% and 80%-81% in the same period (NCHE, 2006). Considering the large num-
bers of staff with Master’s and Bachelor’s qualifications (refer to Figure 4.3), a simplistic proposal
would be to increase staff development funding. However, attempting to increase percentage al-
locations to one item, in this case staff development, creates an equivalent percentage decrease on
another or several other items combined, leading to no lasting solution. Only the study of these
dynamics as a feedback system may lead to correct solutions.
4.4 Conclusion
The common denominator from analysis of both the interviews and questionnaire survey is quality
volatility as a result of excessive enrolment growth amidst financial uncertainities. Emerging from
the interactions with senior academic staff was that expenditures on HE activities are allegedly
in terms of demand projections on priority areas, and yet actual allocations do not reflect such
projections. Although statistical data indicate steady rising enrolments, funding allocations to
infrastructure, furniture, and equipment all combined are only about 4% in public universities and
20% in the private ones. Reports from other authentic Ugandan sources indicate that only about
15% of academic staff hold a PhD and yet funding allocations to staff development is less than 3%
(NCHE, 2006). With a clear indication of funding priorities as given in Table 4.2, the magnitude
79
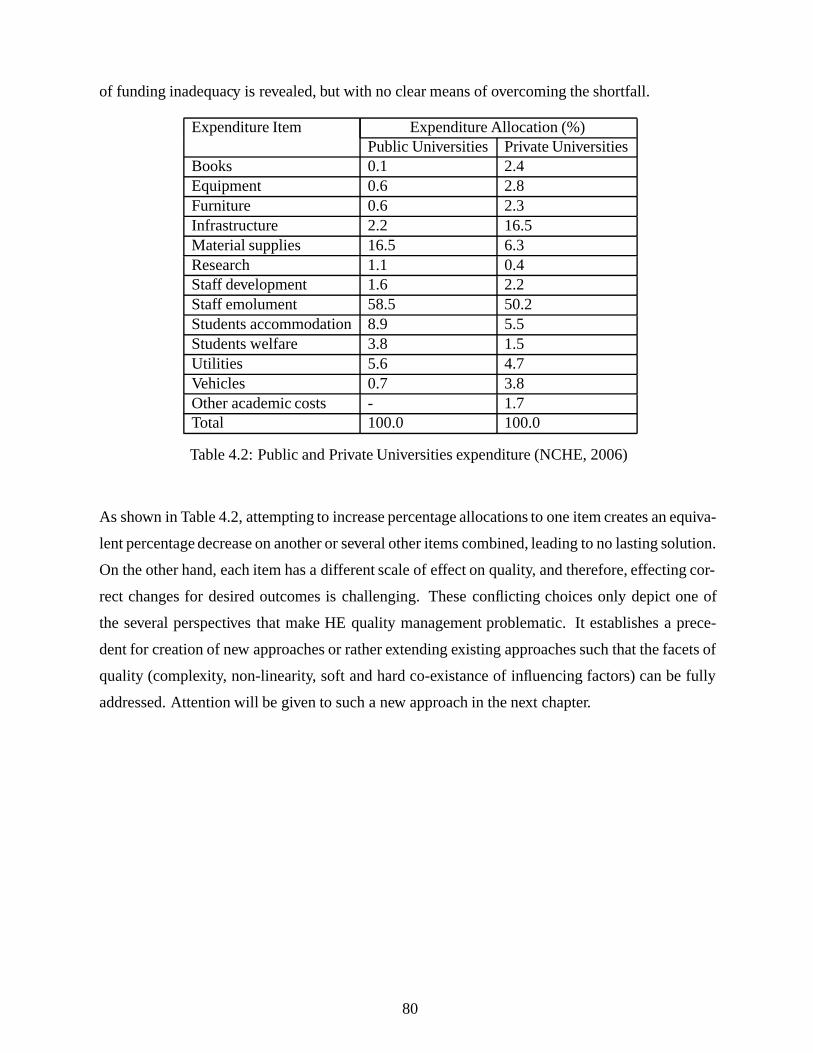
of funding inadequacy is revealed, but with no clear means of overcoming the shortfall.
Expenditure Item Expenditure Allocation (%)Public Universities Private Universities
Books 0.1 2.4Equipment 0.6 2.8Furniture 0.6 2.3Infrastructure 2.2 16.5Material supplies 16.5 6.3Research 1.1 0.4Staff development 1.6 2.2Staff emolument 58.5 50.2Students accommodation8.9 5.5Students welfare 3.8 1.5Utilities 5.6 4.7Vehicles 0.7 3.8Other academic costs - 1.7Total 100.0 100.0
Table 4.2: Public and Private Universities expenditure (NCHE, 2006)
As shown in Table 4.2, attempting to increase percentage allocations to one item creates an equiva-
lent percentage decrease on another or several other items combined, leading to no lasting solution.
On the other hand, each item has a different scale of effect on quality, and therefore, effecting cor-
rect changes for desired outcomes is challenging. These conflicting choices only depict one of
the several perspectives that make HE quality management problematic. It establishes a prece-
dent for creation of new approaches or rather extending existing approaches such that the facets of
quality (complexity, non-linearity, soft and hard co-existance of influencing factors) can be fully
addressed. Attention will be given to such a new approach in the next chapter.
80
Chapter 5
Application of SyDPAR to HE QualityManagement
5.1 Introduction
This chapter presents the details of the research process by adopting the SyDPAR methodological
framework proposed in chapter 3. The claimed effectiveness of the SyDPAR solution process is
further justified in this chapter by discussing the modeling process outcomes. In order to achieve
this objective, this chapter is organised as follows: first, the model’s design is given, starting with
underpinning research questions. Thereafter, stepwise model development process and outcomes
following the SyDPAR solution process (refer to Figure 3.1) is presented, followed by the di-
cussions on the simulation results from the quality management tool (QMT09) developed. These
discussions are extended to include model validation (structural and behavioural validation). The
chapter closes with an analysis of the effectiveness of QMT09 in light of the three Inter-University
Council of East Africa (IUCEA)’s quality checklists.
5.2 Quality Management System Overview
5.2.1 Scope of the Model
The model developed in this research is grounded on the settings of both public and private Ugan-
dan universities . It is established that an academic unit or faculty’s functions are generally defined
81
by the following characteristics:
• Offering both undergraduate and graduate programmes, but in a manner that the graduate
programmes are dynamically initiated when the desired ratios of staff with PhD are achieved;
• Generating income from internal activities like short courses training, consultancy and/or
hire of premises on addition to tuition from students;
• Prospecting for funding to support staff training and research projects execution;
• Having full-timeacademic staff in the categories of teaching assistants to professors, whereby,
subsequent full time staff recruitment ratios, follow a pattern that depends on graduate stu-
dents’ graduation rates;
• Operating under a fixed strategically planned students capacity but with provisions for growth
or fall in actual capacity depending on the dynamics of the factors that influence capacity
growth;
5.2.2 Assumptions
The model developed is underpinned by the following assumptions:
1. A minimum number of publication(s) is mandatory for graduate/research students (Masters
and PhD) prior to their graduation. According to Badri and Abdulla (2004), a PhD or Mas-
ter’s thesis publication index is an indication of student’s outcomes quality . A publication
is a journal or its equivalent;
2. Research allocation is less than 10% of the total tuition from student (cf. Table 4.2). Since
research is one of the core activities, this percentage is insufficient. Therefore research only
thrieves when supported by other channels;
3. Faculty’s academic staff with a PhD qualification together with research students constitute
research groups. Every research group in turn manages at least one research project over
a defined period of time, and the maximum number of research groups within a faculty
depends on existing areas of specialisation;
82
4. A retake stock contains students who fail to graduate according to the stipulated study pro-
gram durations. As a conveyor, this stock holds students for an extra period of one year;
5. The attrition at admission is 21% for graduate students and 14% for undergraduate students.
(cf. the 2006 QA report for Makerere University);
6. Part-time staff are recruited when teaching hours exceed the total load of full-time staff.
Other assumptions are subsumed in the discussion of stokes and flows in the later sections of this
chapter.
5.2.3 Audience, Purpose and Use
The model developed has general relevance to decision making on quality issues in HEIs. This
withstanding the fact that there is a great variation in HEIs both between countries and within any
country. Further still, a variation in quality practices and outcomes exist within academic units
of the same institution. To maintain relevance of the model to these different but related levels
or audiences, the appropriate parameter values must be run in the model. In this respect, three
audiences have been identified as fitting within the framework of the model developed.
1. An institution’s QA Department seeking internal quality analysis of its academic units.
A comparative analysis of simulation results for different scenarios e.g. academic units with
undergraduate training only, those without other internal sources of income, those with small
numbers of private students, those without external donor support, those with high student
to staff ratios, etcetera would reveal unique performance outcomes as behavioural trends for
different academic units of the same institution.
2. External QA agencies seeking institutional quality analysis of its member institutions.
At this level, the QA agency uses its standard parameters for generating a base run against
which actual parameter values from its member institutions are compared and improvement
strategies tested.
3. Academics and senior management staff seeking to evaluate the effectiveness of contraver-
sial policies that affect institutional and program quality.
83
5.2.4 Time Horizon
The selection of a time horizon depends on the problem solved. In selecting the simulation time
in this research, the period 2000 to 2012 was chosen on two grounds. First, because the historical
data was available in the period 2000-2007 and thus a further projection for 5years was deemed
concordat with strategic planning time frame of most instituitional quality assurance departments.
Secondly, policies and structures within HE settings may change due to external forces in the HE
environment and hence shorter simulation time horizon produces a more realistic projection of the
system modelled.
5.3 Model Development
The model development process followed the SyDPAR architecture. The core modelling team (the
researcher and his supervisor) interacted with the client team (stakeholders described in section
3.5.1) in several group model-building sessions. Before the first session, the perceived problem
had been crafted as a preliminary model following interview results presented in chapter four as
well as literature review, and guided by the conceptual framework in Figure 4.1. In the first ses-
sion therefore, the preliminary model was discussed and historical data required for modelling
sought. In the second session, the group efforts were devoted to establishing reference modes for
six variables basing on historical data for the past eight years. These included: -Admission selec-
tivity, enrolment numbers, graduation rates, staff distribution including qualifications, funding for
all categories (public, private, and donor), rate of growth of universities in Uganda. This data was
harmonised with data from NCHE and reference modes in Figure 5.3 sketched. Conceptualisation
of the dynamic hypothesis was the main activity of the third session.
The fourth and subsequent sessions centered on enrichment of the preliminary model. The prelimi-
nary model as a set of influence diagrams emerging from the conceptual framework (see Figure 4.1)
is henceforth given in Figure 5.1.
84
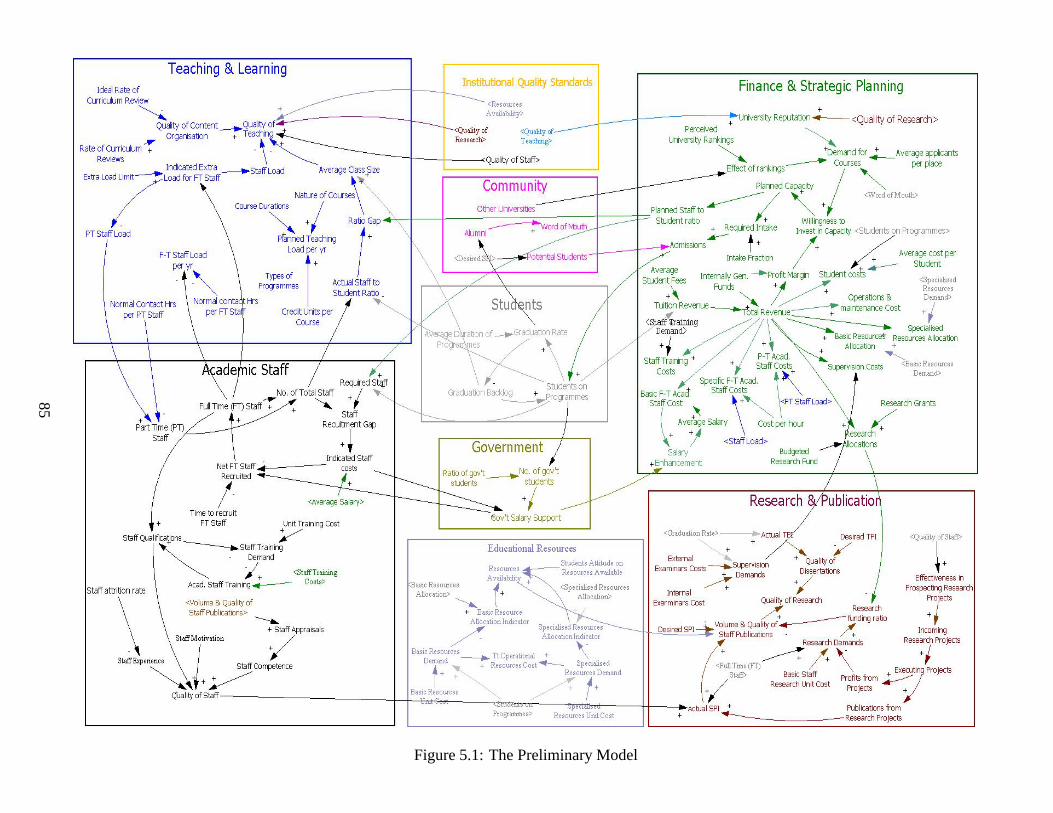
Figure5.1: ThePreliminaryModel
85
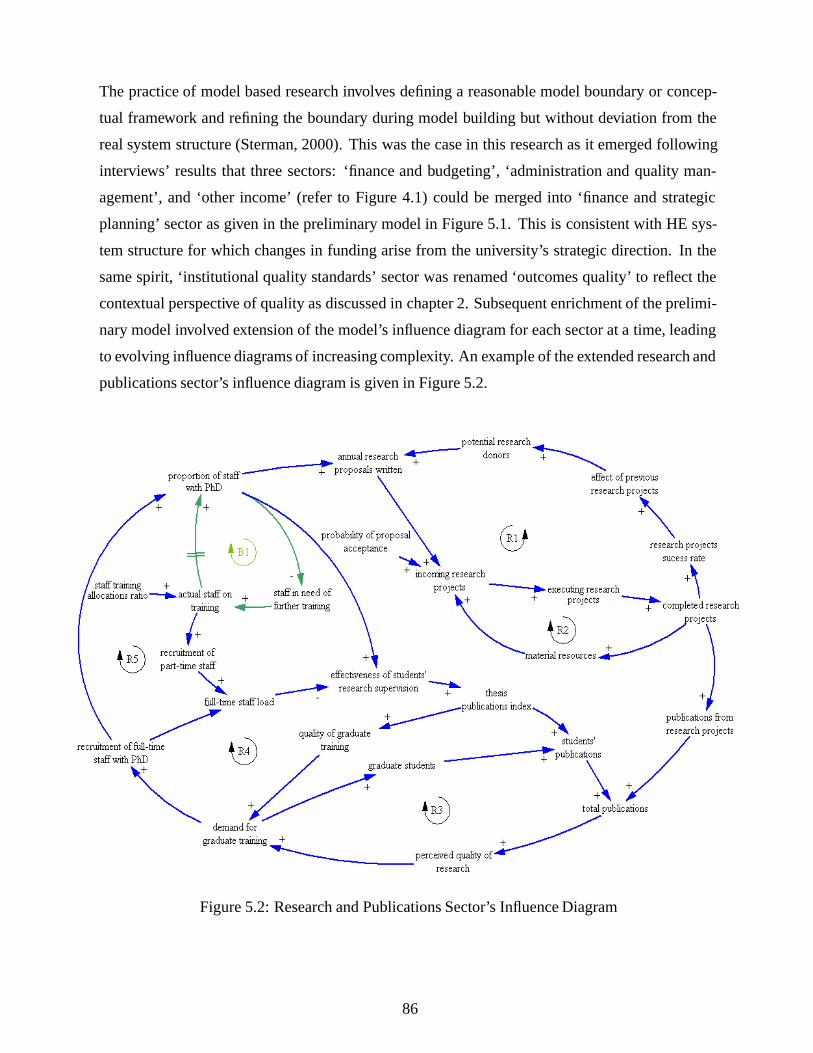
The practice of model based research involves defining a reasonable model boundary or concep-
tual framework and refining the boundary during model building but without deviation from the
real system structure (Sterman, 2000). This was the case in this research as it emerged following
interviews’ results that three sectors: ‘finance and budgeting’, ‘administration and quality man-
agement’, and ‘other income’ (refer to Figure 4.1) could be merged into ‘finance and strategic
planning’ sector as given in the preliminary model in Figure 5.1. This is consistent with HE sys-
tem structure for which changes in funding arise from the university’s strategic direction. In the
same spirit, ‘institutional quality standards’ sector was renamed ‘outcomes quality’ to reflect the
contextual perspective of quality as discussed in chapter 2. Subsequent enrichment of the prelimi-
nary model involved extension of the model’s influence diagram for each sector at a time, leading
to evolving influence diagrams of increasing complexity. An example of the extended research and
publications sector’s influence diagram is given in Figure 5.2.
Figure 5.2: Research and Publications Sector’s Influence Diagram
86
At least six feedback loops can be identified in Figure 5.2. Each of these loops represents a cause-
effect perspective of the research productivity problem space. In this respect, the reinforcing loop
R1 shows the process of research projects executed from inception through completion and the
effects of research projects success rate. Similarly, R2 depicts effects of material resources gained
from previous executed research on future research prospecting. Loop R3 delineates the effects of
graduate training on perceived quality of research and subsequently demand for graduate training.
Loop R4 depicts the influence of staff recruitment on staff load, students’ supervision effectiveness
which in turn affects students’ thesis publication index, total publications, perceived quality of re-
search and ultimately demand for graduate training. Last but not least, loop R5, also the longest
loop can be similarly explained.
The transition from the enriched influence diagrams to the stocks and flows diagrams was done
with less clients’/stakeholders participation as the mathematical formulations and additional com-
plexity given the size of the model was beyond the expertise and/or commitment of most of the
stakeholders. This observation is consistent with ‘fluid participation’ concept of the garbage can
model. The stakeholders were however, re-engaged in evaluating the simulation results. In these
evaluation sessions, stakeholders were ‘walked through’ the simulation results in detail in order
to ensure both the model’s face validity and the acceptance of the simulations by the stakeholders
was a deductive exercise. Furthermore, quality checklists from Inter University Council for East
Africa were used as benchmarks for evaluating the relevance of the model in addressing specific
quality issues. Results of this evaluation are presented in section 5.7.2.
5.3.1 Dynamic Patterns in HE Quality
System dynamics emphasises the importance of clarity of purpose for any intervention, i.e., a
defined problem, issue or undesirable behaviour to be corrected (Forrester, 1961). The problem
behaviour is usually described in a reference mode, and the purpose of the intervention is to iden-
tify how the structure and decision policies generate the identified reference mode so that solutions
can be generated and implemented.
Real data on problematic issues in the Ugandan universities was used to construct graphs of his-
torical behaviour or reference modes. At national level, data was obtained from National Council
for Higher Education reports on HE delivery (NCHE, 2006; Kasozi, 2006, 2003). Additional data
87
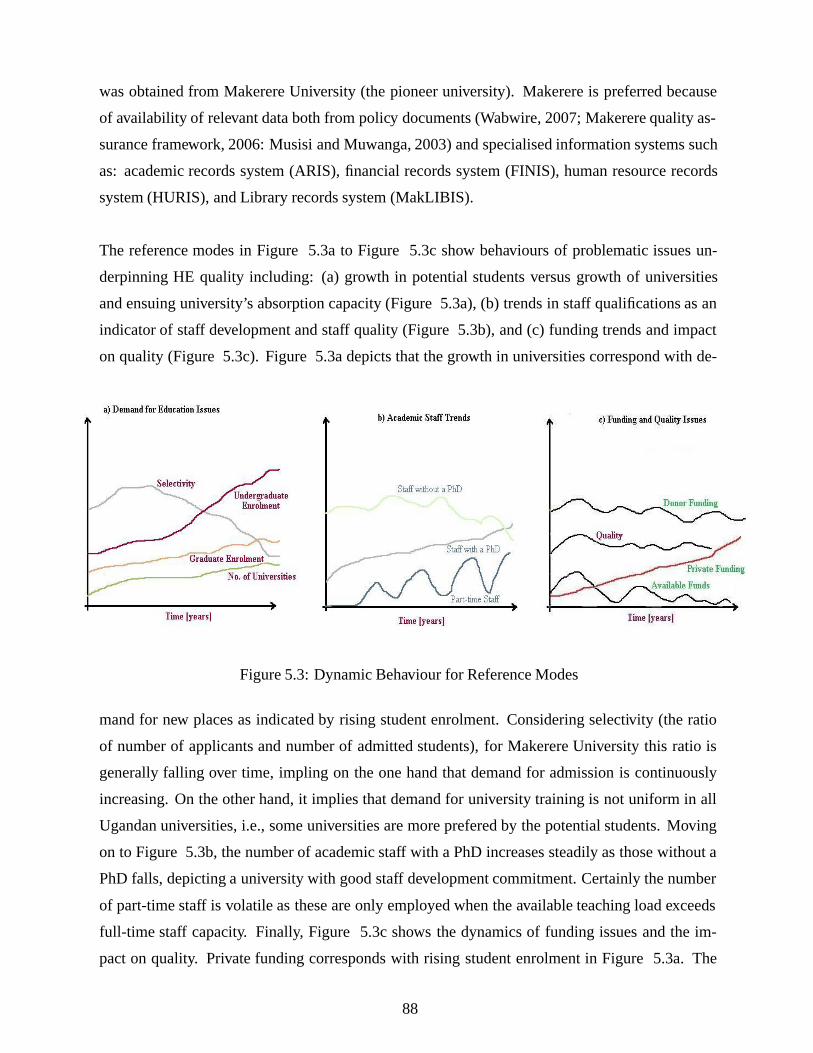
was obtained from Makerere University (the pioneer university). Makerere is preferred because
of availability of relevant data both from policy documents (Wabwire, 2007; Makerere quality as-
surance framework, 2006: Musisi and Muwanga, 2003) and specialised information systems such
as: academic records system (ARIS), financial records system (FINIS), human resource records
system (HURIS), and Library records system (MakLIBIS).
The reference modes in Figure 5.3a to Figure 5.3c show behaviours of problematic issues un-
derpinning HE quality including: (a) growth in potential students versus growth of universities
and ensuing university’s absorption capacity (Figure 5.3a), (b) trends in staff qualifications as an
indicator of staff development and staff quality (Figure 5.3b), and (c) funding trends and impact
on quality (Figure 5.3c). Figure 5.3a depicts that the growth in universities correspond with de-
Figure 5.3: Dynamic Behaviour for Reference Modes
mand for new places as indicated by rising student enrolment. Considering selectivity (the ratio
of number of applicants and number of admitted students), for Makerere University this ratio is
generally falling over time, impling on the one hand that demand for admission is continuously
increasing. On the other hand, it implies that demand for university training is not uniform in all
Ugandan universities, i.e., some universities are more prefered by the potential students. Moving
on to Figure 5.3b, the number of academic staff with a PhD increases steadily as those without a
PhD falls, depicting a university with good staff development commitment. Certainly the number
of part-time staff is volatile as these are only employed when the available teaching load exceeds
full-time staff capacity. Finally, Figure 5.3c shows the dynamics of funding issues and the im-
pact on quality. Private funding corresponds with rising student enrolment in Figure 5.3a. The
88
available funds depicts the existing balance after the normal university’s expenditures.
5.3.2 Model Control Statements
Prior to performing simulation experiments, some pointers of acceptable modelling standards must
be considered. These generally constitute the model control statements. The following control
statements were used in the development of the model:
• Units check - The built-in units feature was used to check all equations for consistency of
units, i.e, to make sure the left and right side of all equations have the same units. Checking
models for dimensional consistency before running the simulation is the basic validation
test.
• Naming variables - A general element naming convention has been proposed by Ventana,
the makers of Vensim Modelling Software. The first letter of Stock names are capitalized,
constants are all capitals, and names of all other variables, including flows are all lower case.
The word ”rate” is reserved for flows.
• Stock values - These cannot be negative and thus were set to have a minimum value of
zero. The only model elements with direct connections to stocks are flows. No constants or
auxiliary variables were directly entered in the stock equation, except for the initial values
of the stock.
• Flow connections - A flow only increases or decreases a stock; it cannot be used as a source
of information in a model as it cannot be measured. A flow unattached to a stock serves no
purpose in the model, as it does not affect anything.
• Constants embedded in equations - Constants were explicitly modelled as individual ele-
ments and not embedded in equations. This facilitates future changes without changing any
equations in the model.
89
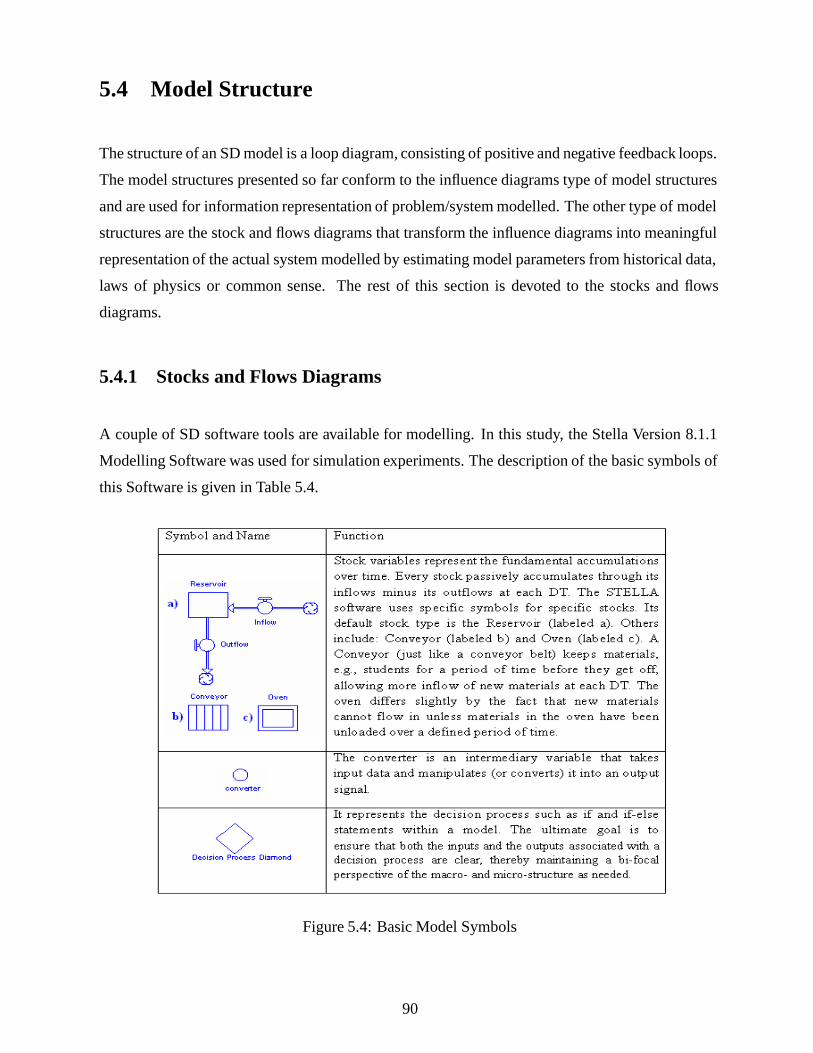
5.4 Model Structure
The structure of an SD model is a loop diagram, consisting of positive and negative feedback loops.
The model structures presented so far conform to the influence diagrams type of model structures
and are used for information representation of problem/system modelled. The other type of model
structures are the stock and flows diagrams that transform the influence diagrams into meaningful
representation of the actual system modelled by estimating model parameters from historical data,
laws of physics or common sense. The rest of this section is devoted to the stocks and flows
diagrams.
5.4.1 Stocks and Flows Diagrams
A couple of SD software tools are available for modelling. In this study, the Stella Version 8.1.1
Modelling Software was used for simulation experiments. The description of the basic symbols of
this Software is given in Table 5.4.
Figure 5.4: Basic Model Symbols
90
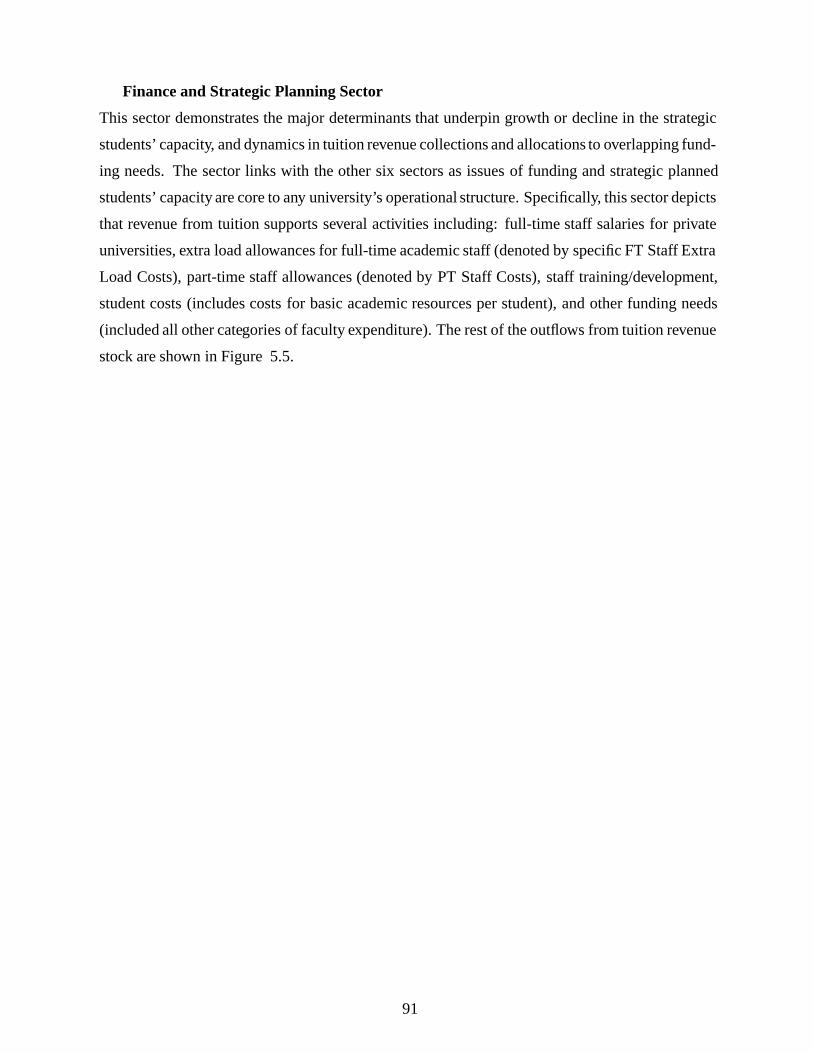
Finance and Strategic Planning Sector
This sector demonstrates the major determinants that underpin growth or decline in the strategic
students’ capacity, and dynamics in tuition revenue collections and allocations to overlapping fund-
ing needs. The sector links with the other six sectors as issues of funding and strategic planned
students’ capacity are core to any university’s operational structure. Specifically, this sector depicts
that revenue from tuition supports several activities including: full-time staff salaries for private
universities, extra load allowances for full-time academic staff (denoted by specific FT Staff Extra
Load Costs), part-time staff allowances (denoted by PT Staff Costs), staff training/development,
student costs (includes costs for basic academic resources per student), and other funding needs
(included all other categories of faculty expenditure). The rest of the outflows from tuition revenue
stock are shown in Figure 5.5.
91
Figure 5.5: Finance and Strategic Planning Sector
Since full-time staff salaries in public universities are not paid from tuition revenue, and for the
sake of keeping the tool generic so that it is applicable to both public and private universities, the
“nature of university constant” is used to switch between these cases. This constant is modelled as
‘on’ and ‘off’ or ‘[0]’ (for public universities) and ‘[1]’ (for private universities) when determining
the full-time staffs salary allocation out-flow (denoted by FT staff salary allocation).
92

Research and Publications Sector
Generally, research indicators include: staff publications, PhD completions, PhD thesis publication
index and Masters Thesis publication index, research income, prestigious awards, and research-
based infrastructure (Williams and Van Dyke, 2007; Badri and Abdulla, 2004; Kennedy and Clare,
1999). These indicators are modelled with regard to their influence on quality and quantity of re-
search.
In terms of research quantity, the main indicators are “stocks” for PhD completions, faculty pub-
lications, research resources capacity or research based income. Conversely, quality relates to
publications per PhD and Masters Thesis (Badri and Abdulla, 2004), and publications per faculty
staff (Williams and Van Dyke, 2007). Besides these quantitative measures, universities have an
obligation to do the research necessary to identify their legitimate strengths and distinctive advan-
tages for reputation purposes. Furthermore and as indicated in Figure 5.6, “research students’
publications” stock is accumulated by “students’ publications” rate. This rate is obtained as the
product of “indicated publications per thesis” and “research students’ graduation rate”.
IP=M(SCP,RA) ∗ UQP (Eq. 5.1)
Where
IP= indicated publications per thesis
M= mean
SCP= staff commitment to supervision
RA= resource availability
UQP= upper quartile publications per thesis
The upper quartile publications are determined from historical publications trends of research
students. It is assumed that a university sets a minimum number of publications (journal or its
equivalent) as graduation requirements for the research degrees. Following from equation Eq. 5.1
and since upper quartile publications are considered as “ideal publications per thesis” (refer to
Figure 5.6), indicated publications per thesis equals ideal publications per thesis. Furthermore,
“expected students’ publications” is derived from ideal publications per thesis, and subsequently
“quality of students’ thesis” computed as the ratio between “research students’ publications” and
“expected students’ publications”. Similar arguments are used to determine staff publications in-
dicator in Figure 5.6. In the same line, SPI is an acronym for staff publications index. Regarding
SPI, a publication can be a research book, journal, book chapter, or a refereed conference paper.
93
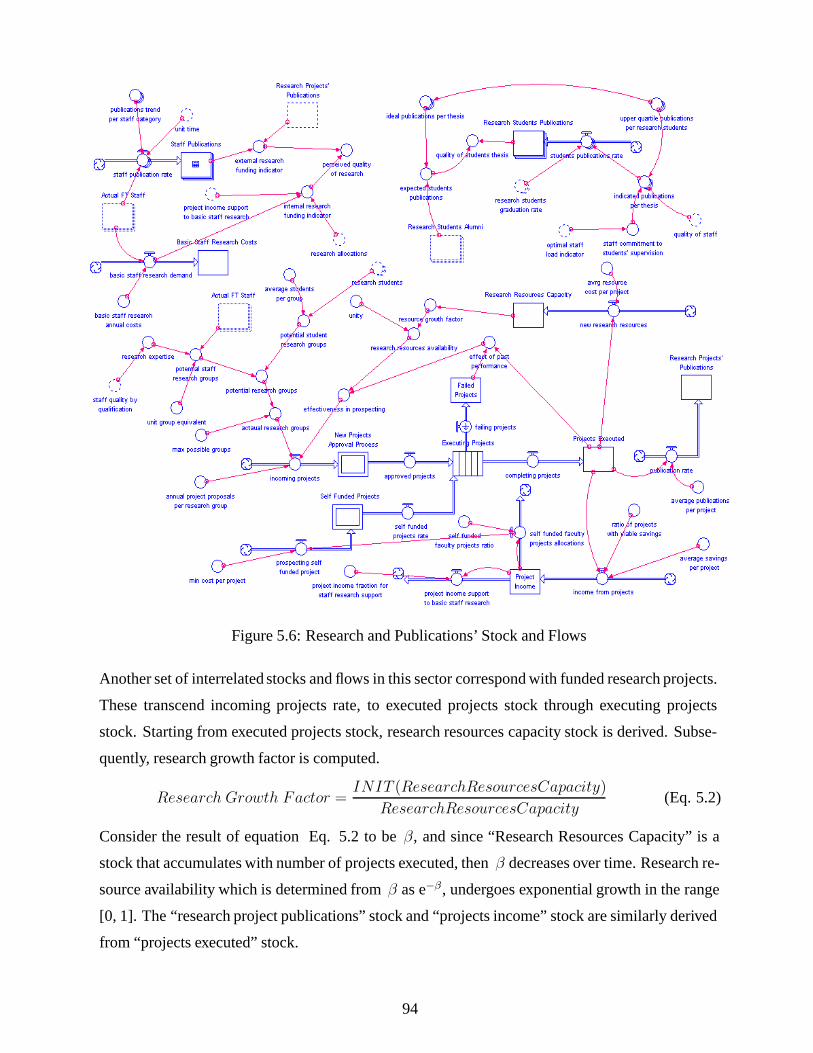
Figure 5.6: Research and Publications’ Stock and Flows
Another set of interrelated stocks and flows in this sector correspond with funded research projects.
These transcend incoming projects rate, to executed projects stock through executing projects
stock. Starting from executed projects stock, research resources capacity stock is derived. Subse-
quently, research growth factor is computed.
Research Growth Factor =INIT (ResearchResourcesCapacity)
ResearchResourcesCapacity(Eq. 5.2)
Consider the result of equation Eq. 5.2 to beβ, and since “Research Resources Capacity” is a
stock that accumulates with number of projects executed, thenβ decreases over time. Research re-
source availability which is determined fromβ as e−β, undergoes exponential growth in the range
[0, 1]. The “research project publications” stock and “projects income” stock are similarly derived
from “projects executed” stock.
94
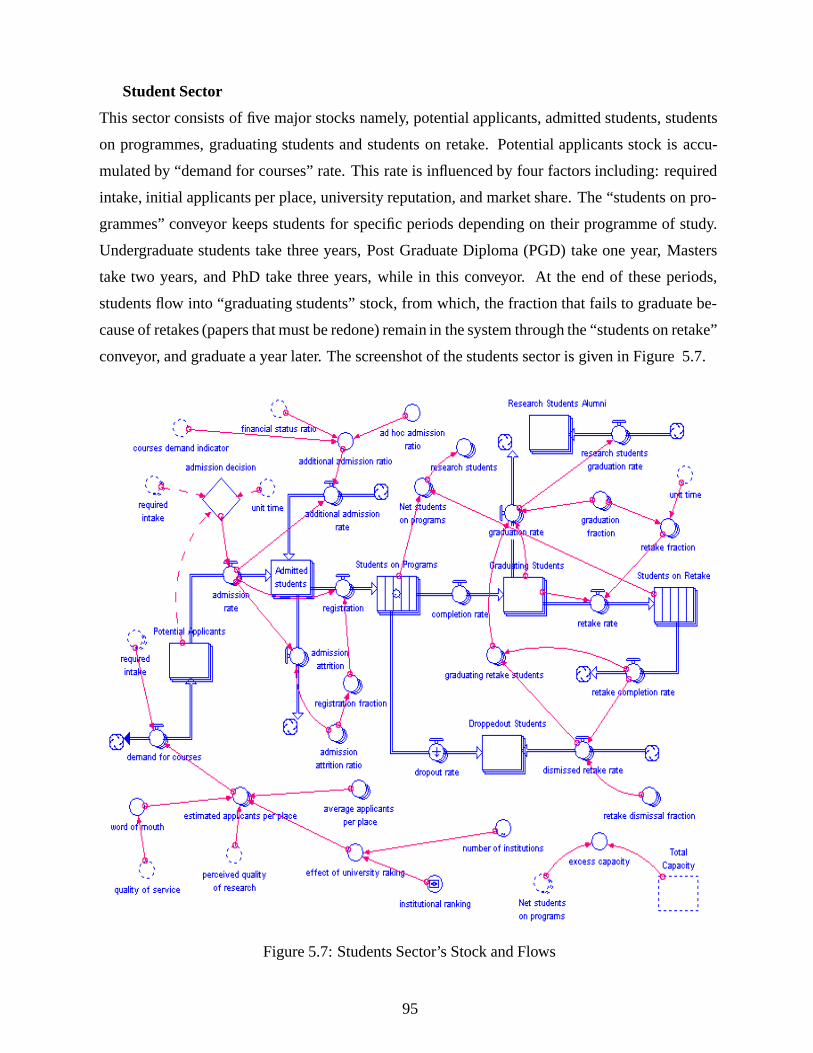
Student Sector
This sector consists of five major stocks namely, potential applicants, admitted students, students
on programmes, graduating students and students on retake. Potential applicants stock is accu-
mulated by “demand for courses” rate. This rate is influenced by four factors including: required
intake, initial applicants per place, university reputation, and market share. The “students on pro-
grammes” conveyor keeps students for specific periods depending on their programme of study.
Undergraduate students take three years, Post Graduate Diploma (PGD) take one year, Masters
take two years, and PhD take three years, while in this conveyor. At the end of these periods,
students flow into “graduating students” stock, from which, the fraction that fails to graduate be-
cause of retakes (papers that must be redone) remain in the system through the “students on retake”
conveyor, and graduate a year later. The screenshot of the students sector is given in Figure 5.7.
Figure 5.7: Students Sector’s Stock and Flows
95
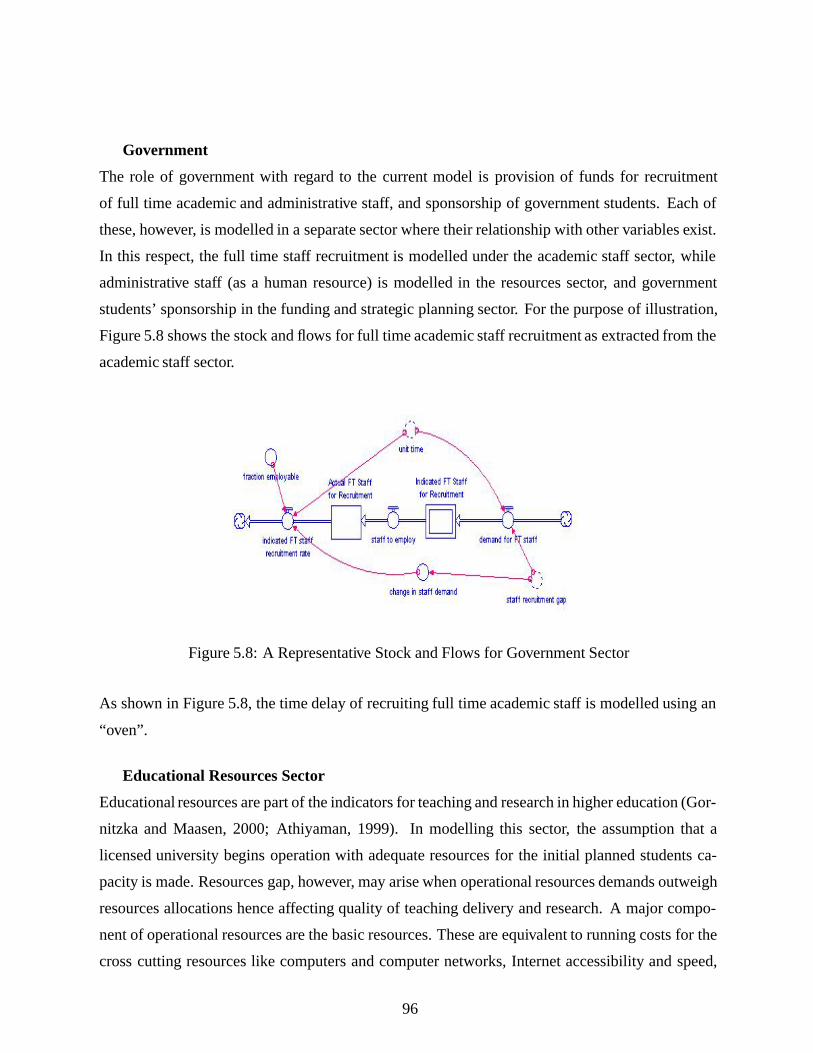
Government
The role of government with regard to the current model is provision of funds for recruitment
of full time academic and administrative staff, and sponsorship of government students. Each of
these, however, is modelled in a separate sector where their relationship with other variables exist.
In this respect, the full time staff recruitment is modelled under the academic staff sector, while
administrative staff (as a human resource) is modelled in the resources sector, and government
students’ sponsorship in the funding and strategic planning sector. For the purpose of illustration,
Figure 5.8 shows the stock and flows for full time academic staff recruitment as extracted from the
academic staff sector.
Figure 5.8: A Representative Stock and Flows for Government Sector
As shown in Figure 5.8, the time delay of recruiting full time academic staff is modelled using an
“oven”.
Educational Resources Sector
Educational resources are part of the indicators for teaching and research in higher education (Gor-
nitzka and Maasen, 2000; Athiyaman, 1999). In modelling this sector, the assumption that a
licensed university begins operation with adequate resources for the initial planned students ca-
pacity is made. Resources gap, however, may arise when operational resources demands outweigh
resources allocations hence affecting quality of teaching delivery and research. A major compo-
nent of operational resources are the basic resources. These are equivalent to running costs for the
cross cutting resources like computers and computer networks, Internet accessibility and speed,
96
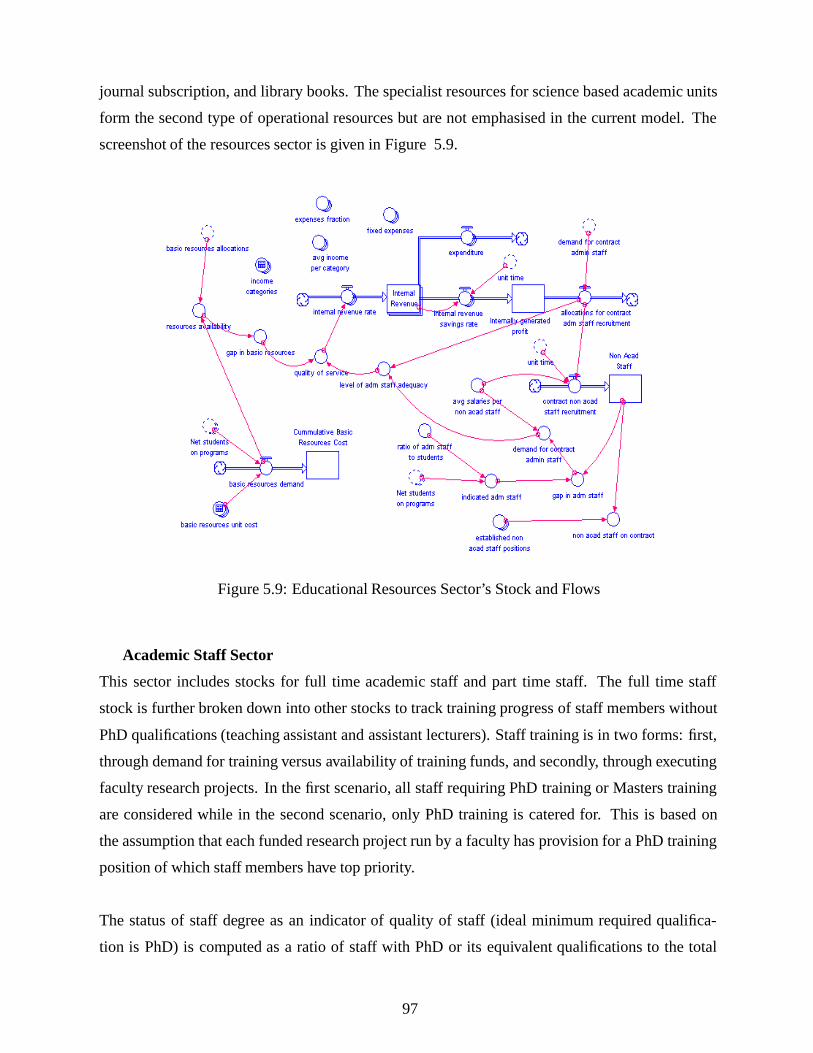
journal subscription, and library books. The specialist resources for science based academic units
form the second type of operational resources but are not emphasised in the current model. The
screenshot of the resources sector is given in Figure 5.9.
Figure 5.9: Educational Resources Sector’s Stock and Flows
Academic Staff Sector
This sector includes stocks for full time academic staff and part time staff. The full time staff
stock is further broken down into other stocks to track training progress of staff members without
PhD qualifications (teaching assistant and assistant lecturers). Staff training is in two forms: first,
through demand for training versus availability of training funds, and secondly, through executing
faculty research projects. In the first scenario, all staff requiring PhD training or Masters training
are considered while in the second scenario, only PhD training is catered for. This is based on
the assumption that each funded research project run by a faculty has provision for a PhD training
position of which staff members have top priority.
The status of staff degree as an indicator of quality of staff (ideal minimum required qualifica-
tion is PhD) is computed as a ratio of staff with PhD or its equivalent qualifications to the total
97
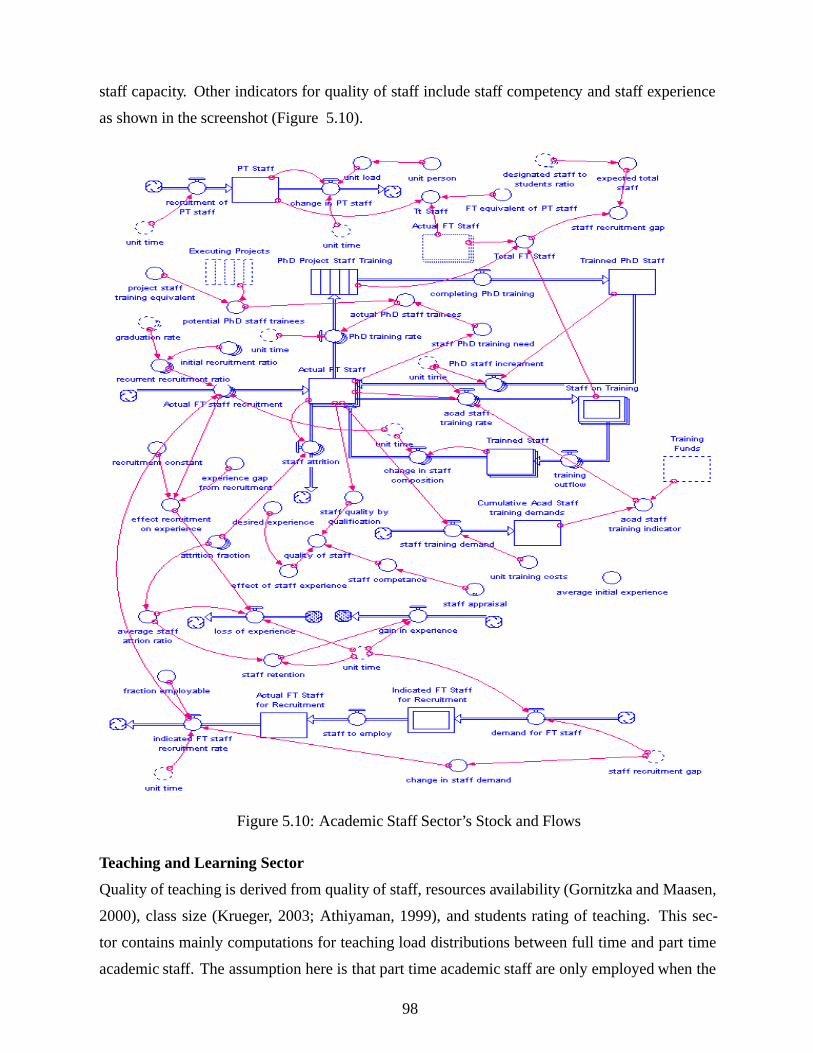
staff capacity. Other indicators for quality of staff include staff competency and staff experience
as shown in the screenshot (Figure 5.10).
Figure 5.10: Academic Staff Sector’s Stock and Flows
Teaching and Learning Sector
Quality of teaching is derived from quality of staff, resources availability (Gornitzka and Maasen,
2000), class size (Krueger, 2003; Athiyaman, 1999), and students rating of teaching. This sec-
tor contains mainly computations for teaching load distributions between full time and part time
academic staff. The assumption here is that part time academic staff are only employed when the
98
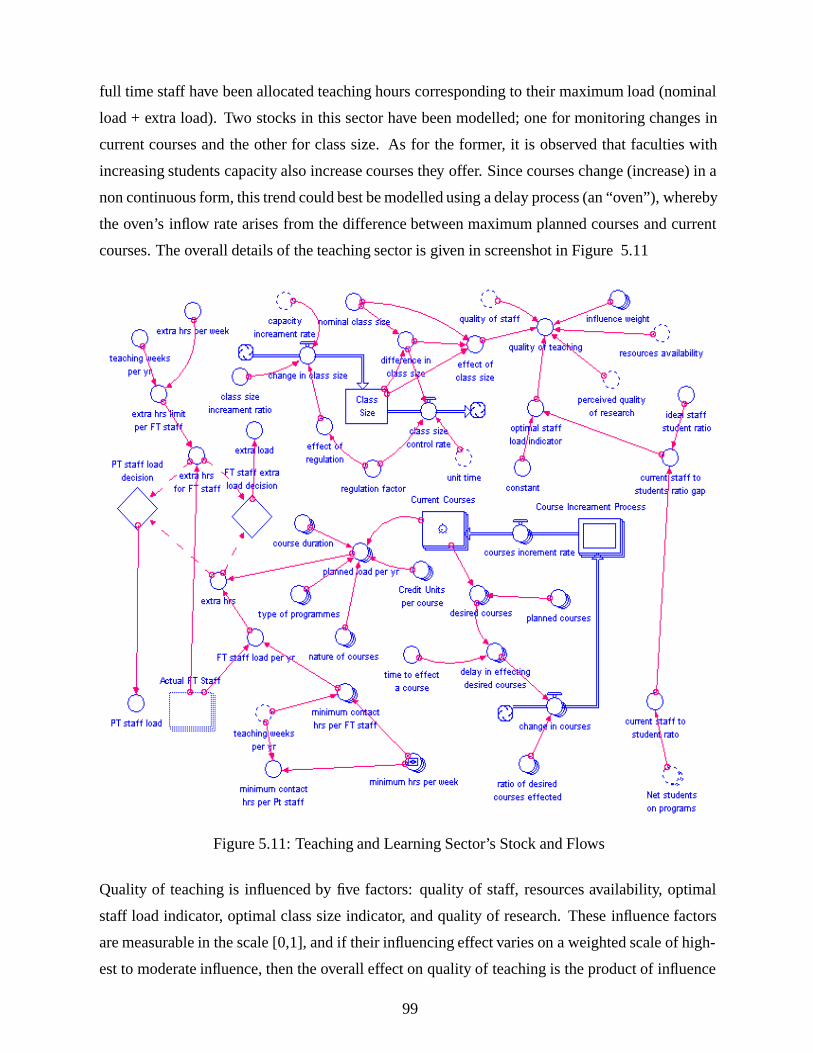
full time staff have been allocated teaching hours corresponding to their maximum load (nominal
load + extra load). Two stocks in this sector have been modelled; one for monitoring changes in
current courses and the other for class size. As for the former, it is observed that faculties with
increasing students capacity also increase courses they offer. Since courses change (increase) in a
non continuous form, this trend could best be modelled using a delay process (an “oven”), whereby
the oven’s inflow rate arises from the difference between maximum planned courses and current
courses. The overall details of the teaching sector is given in screenshot in Figure 5.11
Figure 5.11: Teaching and Learning Sector’s Stock and Flows
Quality of teaching is influenced by five factors: quality of staff, resources availability, optimal
staff load indicator, optimal class size indicator, and quality of research. These influence factors
are measurable in the scale [0,1], and if their influencing effect varies on a weighted scale of high-
est to moderate influence, then the overall effect on quality of teaching is the product of influence
99
factor value and its influence weight divided by sum of influence weight. If the quality of teaching
is denoted by (say) QT ij; for which Fi is the influence factor and Wj the influence weight; then
QT ij is given by:
QT ij =
∑ni,j=1 FiWj∑n
j=1 Wj(Eq. 5.3)
In the interest of clarity, the ‘optimal staff load indicator’ is the ideal staff load arising from staff
to students ratio dynamics. Since part-time staff are employed on the basis of available teaching
load and not the designated staff to students ratio, the overall staff to students’ ratio decreases as
part-time staff increases in response to increasing student enrolment amidst the delay in full-time
staff recruitment. Letσ be the ‘designated staff to students ratio’ andµ the current staff to students’
ratio gap, then ‘optimal staff load indicator’(Lso) is given by:
Lso = e−10µ (Eq. 5.4)
For 0≤ |µ| ≤ σ. Therefore, the output values from equation Eq. 5.4 lie in the range [0, 1].
Community Sector
The community sector investigates the effect of university ranking and alumni survey or ‘word
of mouth’ on demand for university training. Due to data deficiencies on alumni surveys, word of
mouth effect is estimated from level of generation of other income, e.g., from: short courses, hire of
premises, services to the private sector, and consultancy. As just noted, the variables corresponding
to the community sector affect demand for courses which in turn affects students’ admission rate.
These variables are thus modelled in the students sector. What is interesting to discuss at this point
is the equation for ‘effect of university ranking’ variable. In this respect, the effect of university
ranking (Re) for which r is the university rank, is given in equation Eq. 5.4.
Re =u + 1 − r
u(Eq. 5.5)
For u = number of universities andr= (1, 2, .......,u). The value forr is assigned by the decision
maker since the Ugandan universities ranking are not yet available.
100
Institutional Quality Standards Sector
The contextual perspective of quality as discussed in section 2.2 is used in defining variables for
institutional quality standards sector. These include: quality of research, quality of staff, quality
of teaching, quality of undergraduate and graduate students’ achievements, resources availability,
and availability of funds. Each of these variables is modelled in a primary sector and replicated in
this sector for the purpose of representing the fundamental outcomes of the model as a whole. Just
as for the community sector as described in the previous sub-section, there is no need to discuss
these variables again here.
5.5 Model Calibration
Oliva (2003) defines model calibration as the process of estimating the model parameters to ob-
tain a match between observed and simulated behaviour. Calibration explicitly attempts to link
structure to behaviour, making it a more stringent test for a dynamic hypothesis. As such, a cal-
ibration test increases confidence in the dynamic hypothesis as the observed behaviour justifies
the structure. Conversely, if the structure fails to match the observed behaviour, then the dynamic
hypothesis can be rejected. The dynamic hypothesis in this research is presented in chapter 1 -
Figure 1.1 and the inferred parameter relationships are subsequently shown in Figure 1.2. For ease
of comparison, Figure 5.12 shows the parameter relationships overlying the simulated behaviours.
101
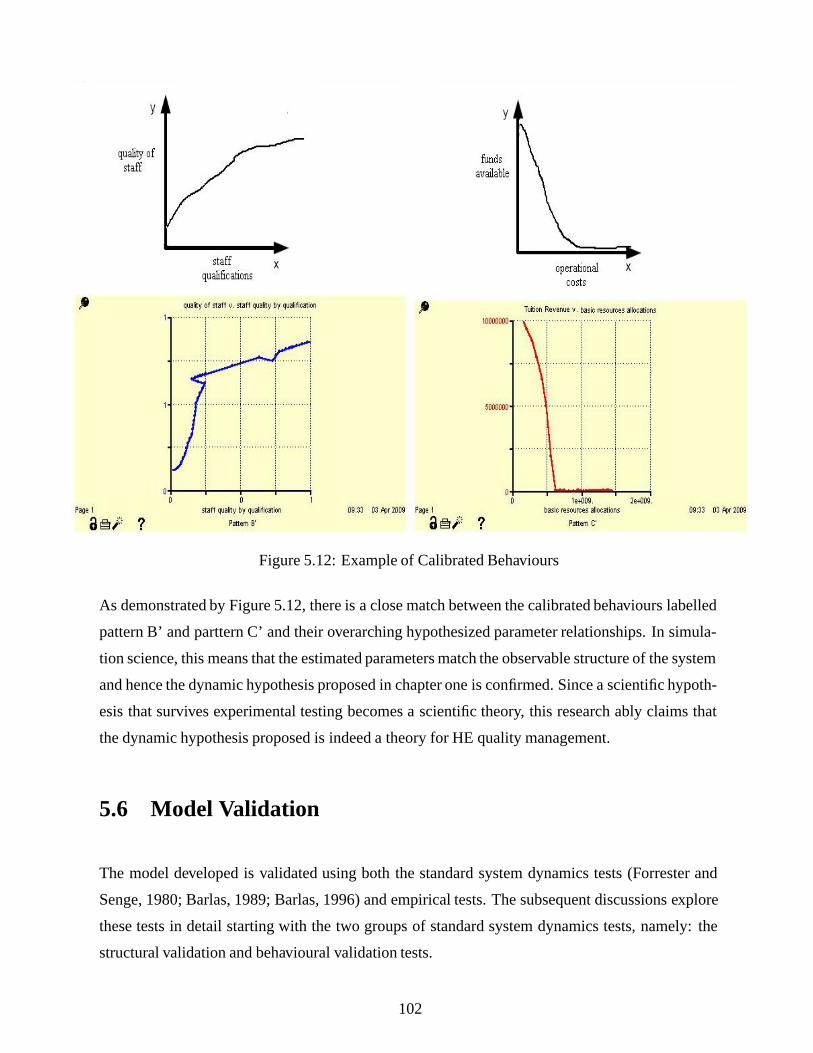
Figure 5.12: Example of Calibrated Behaviours
As demonstrated by Figure 5.12, there is a close match between the calibrated behaviours labelled
pattern B’ and parttern C’ and their overarching hypothesized parameter relationships. In simula-
tion science, this means that the estimated parameters match the observable structure of the system
and hence the dynamic hypothesis proposed in chapter one is confirmed. Since a scientific hypoth-
esis that survives experimental testing becomes a scientific theory, this research ably claims that
the dynamic hypothesis proposed is indeed a theory for HE quality management.
5.6 Model Validation
The model developed is validated using both the standard system dynamics tests (Forrester and
Senge, 1980; Barlas, 1989; Barlas, 1996) and empirical tests. The subsequent discussions explore
these tests in detail starting with the two groups of standard system dynamics tests, namely: the
structural validation and behavioural validation tests.
102
5.6.1 Structural Validation
Structure tests assess the validity of the model structure by comparison with knowledge about the
real system. It involves taking each relationship (mathematical equations inclusive) and comparing
it with available knowledge about the real system. The inclusion of the stakeholders’ team in the
modelling phase was a procedural measure for improving the validity of the model. Indeed, induc-
tive validation of propositions about causal relationships and assumptions about parameter values
was possible through team engagement. The structure tests performed in this research include:
structure and parameter confirmation, extreme conditions, boundary adequacy, and dimensional
consistency.
Structure Confirmation
The structure confirmation test is of fundamental importance in the overall validation process as
it tests whether the model structure is consistent with relevant descriptive knowledge of the sys-
tem being modeled. Since model building in this research was participative, shared understanding
of factors that influence quality emerged from discussions starting with the preliminary model as
already discussed in section 5.3. In these discussions, sketches were drawn by hand on white-
board before transformed into computer causal loop diagram (such as Figure 5.2 in section 5.3).
These procedures were important in establishing the credibility of the model structure as well as a
feeling of ownership of the model among the participants (cf. Rouwette and Vennix, 2006; Ven-
nix, 1996). Other functional relationships were drawn from the literature whereby in some cases,
the whole structure was adopted while in other cases only structural formation was adopted. In
fact, the stock and flows of research and publications sector was build by extending Vahdatzad
and Mojtahedzadeh’s (2000) structure in Figure 5.13 in line with the sector’s influence diagram
(Figure 5.2).
103
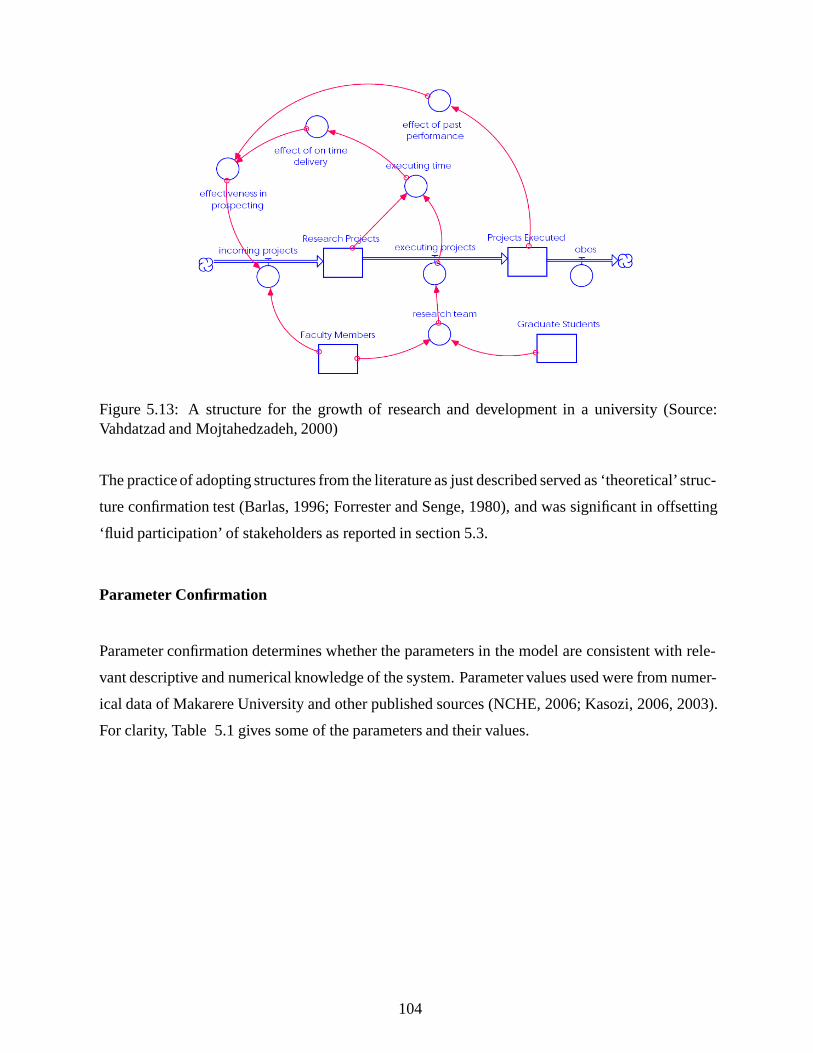
Figure 5.13: A structure for the growth of research and development in a university (Source:Vahdatzad and Mojtahedzadeh, 2000)
The practice of adopting structures from the literature as just described served as ‘theoretical’struc-
ture confirmation test (Barlas, 1996; Forrester and Senge, 1980), and was significant in offsetting
‘fluid participation’ of stakeholders as reported in section 5.3.
Parameter Confirmation
Parameter confirmation determines whether the parameters in the model are consistent with rele-
vant descriptive and numerical knowledge of the system. Parameter values used were from numer-
ical data of Makarere University and other published sources (NCHE, 2006; Kasozi, 2006, 2003).
For clarity, Table 5.1 gives some of the parameters and their values.
104
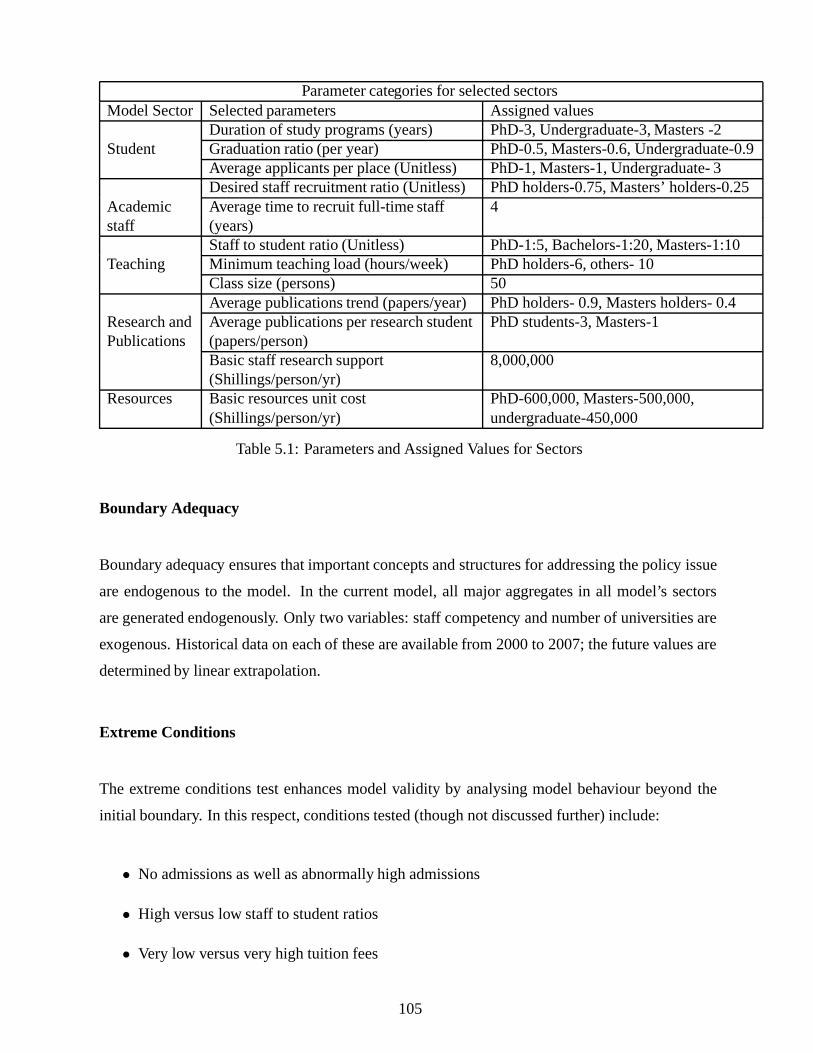
Parameter categories for selected sectorsModel Sector Selected parameters Assigned values
Duration of study programs (years) PhD-3, Undergraduate-3, Masters -2Student Graduation ratio (per year) PhD-0.5, Masters-0.6, Undergraduate-0.9
Average applicants per place (Unitless) PhD-1, Masters-1, Undergraduate- 3Desired staff recruitment ratio (Unitless) PhD holders-0.75, Masters’ holders-0.25
Academic Average time to recruit full-time staff 4staff (years)
Staff to student ratio (Unitless) PhD-1:5, Bachelors-1:20, Masters-1:10Teaching Minimum teaching load (hours/week) PhD holders-6, others- 10
Class size (persons) 50Average publications trend (papers/year)PhD holders- 0.9, Masters holders- 0.4
Research and Average publications per research studentPhD students-3, Masters-1Publications (papers/person)
Basic staff research support 8,000,000(Shillings/person/yr)
Resources Basic resources unit cost PhD-600,000, Masters-500,000,(Shillings/person/yr) undergraduate-450,000
Table 5.1: Parameters and Assigned Values for Sectors
Boundary Adequacy
Boundary adequacy ensures that important concepts and structures for addressing the policy issue
are endogenous to the model. In the current model, all major aggregates in all model’s sectors
are generated endogenously. Only two variables: staff competency and number of universities are
exogenous. Historical data on each of these are available from 2000 to 2007; the future values are
determined by linear extrapolation.
Extreme Conditions
The extreme conditions test enhances model validity by analysing model behaviour beyond the
initial boundary. In this respect, conditions tested (though not discussed further) include:
• No admissions as well as abnormally high admissions
• High versus low staff to student ratios
• Very low versus very high tuition fees
105
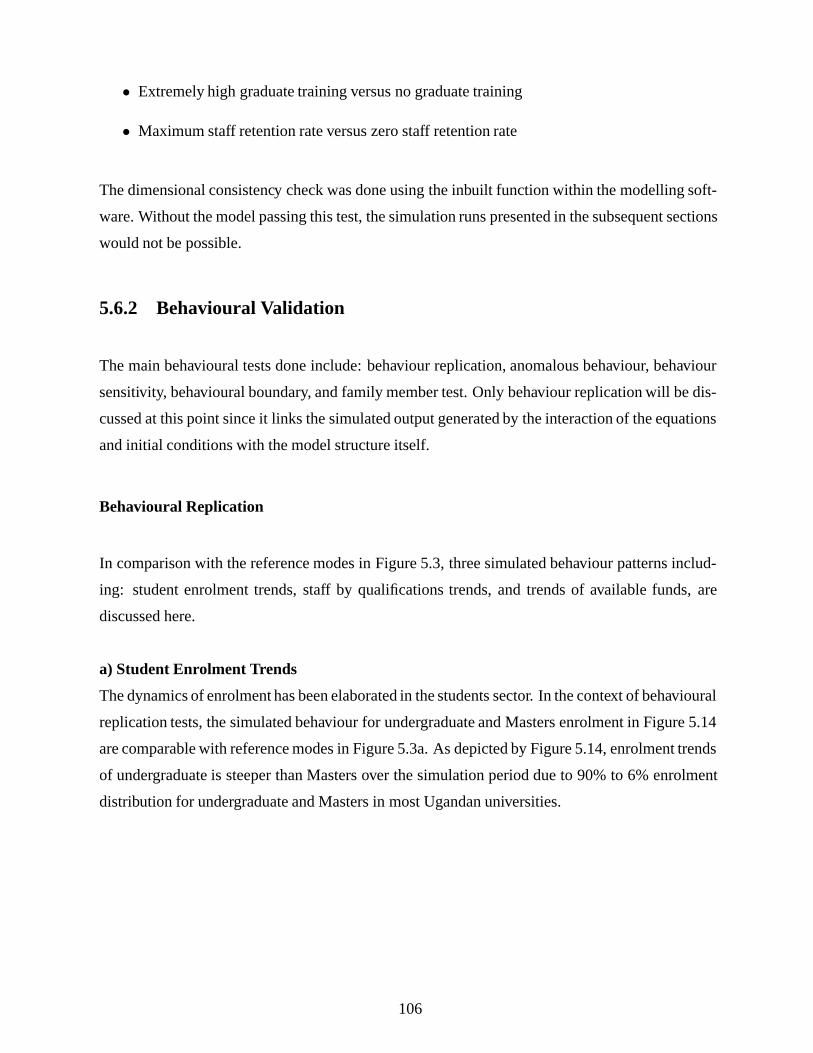
• Extremely high graduate training versus no graduate training
• Maximum staff retention rate versus zero staff retention rate
The dimensional consistency check was done using the inbuilt function within the modelling soft-
ware. Without the model passing this test, the simulation runs presented in the subsequent sections
would not be possible.
5.6.2 Behavioural Validation
The main behavioural tests done include: behaviour replication, anomalous behaviour, behaviour
sensitivity, behavioural boundary, and family member test. Only behaviour replication will be dis-
cussed at this point since it links the simulated output generated by the interaction of the equations
and initial conditions with the model structure itself.
Behavioural Replication
In comparison with the reference modes in Figure 5.3, three simulated behaviour patterns includ-
ing: student enrolment trends, staff by qualifications trends, and trends of available funds, are
discussed here.
a) Student Enrolment Trends
The dynamics of enrolment has been elaborated in the students sector. In the context of behavioural
replication tests, the simulated behaviour for undergraduate and Masters enrolment in Figure 5.14
are comparable with reference modes in Figure 5.3a. As depicted by Figure 5.14, enrolment trends
of undergraduate is steeper than Masters over the simulation period due to 90% to 6% enrolment
distribution for undergraduate and Masters in most Ugandan universities.
106
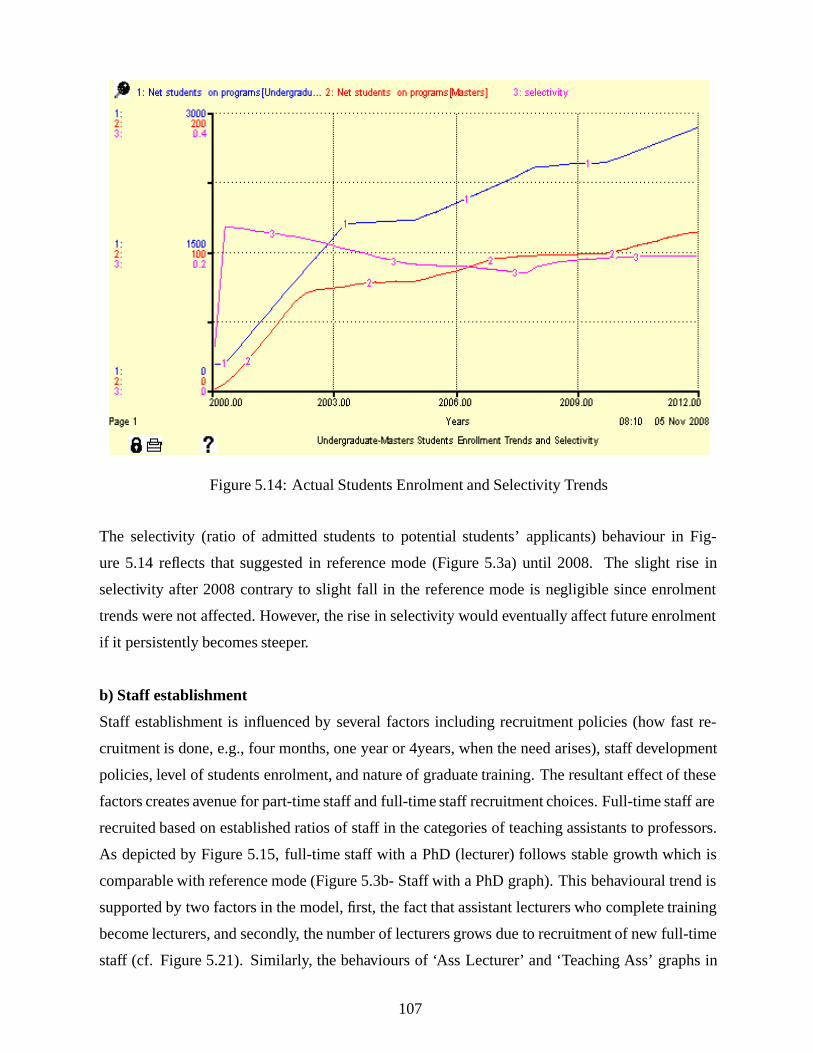
Figure 5.14: Actual Students Enrolment and Selectivity Trends
The selectivity (ratio of admitted students to potential students’ applicants) behaviour in Fig-
ure 5.14 reflects that suggested in reference mode (Figure 5.3a) until 2008. The slight rise in
selectivity after 2008 contrary to slight fall in the reference mode is negligible since enrolment
trends were not affected. However, the rise in selectivity would eventually affect future enrolment
if it persistently becomes steeper.
b) Staff establishment
Staff establishment is influenced by several factors including recruitment policies (how fast re-
cruitment is done, e.g., four months, one year or 4years, when the need arises), staff development
policies, level of students enrolment, and nature of graduate training. The resultant effect of these
factors creates avenue for part-time staff and full-time staff recruitment choices. Full-time staff are
recruited based on established ratios of staff in the categories of teaching assistants to professors.
As depicted by Figure 5.15, full-time staff with a PhD (lecturer) follows stable growth which is
comparable with reference mode (Figure 5.3b- Staff with a PhD graph). This behavioural trend is
supported by two factors in the model, first, the fact that assistant lecturers who complete training
become lecturers, and secondly, the number of lecturers grows due to recruitment of new full-time
staff (cf. Figure 5.21). Similarly, the behaviours of ‘Ass Lecturer’ and ‘Teaching Ass’ graphs in
107
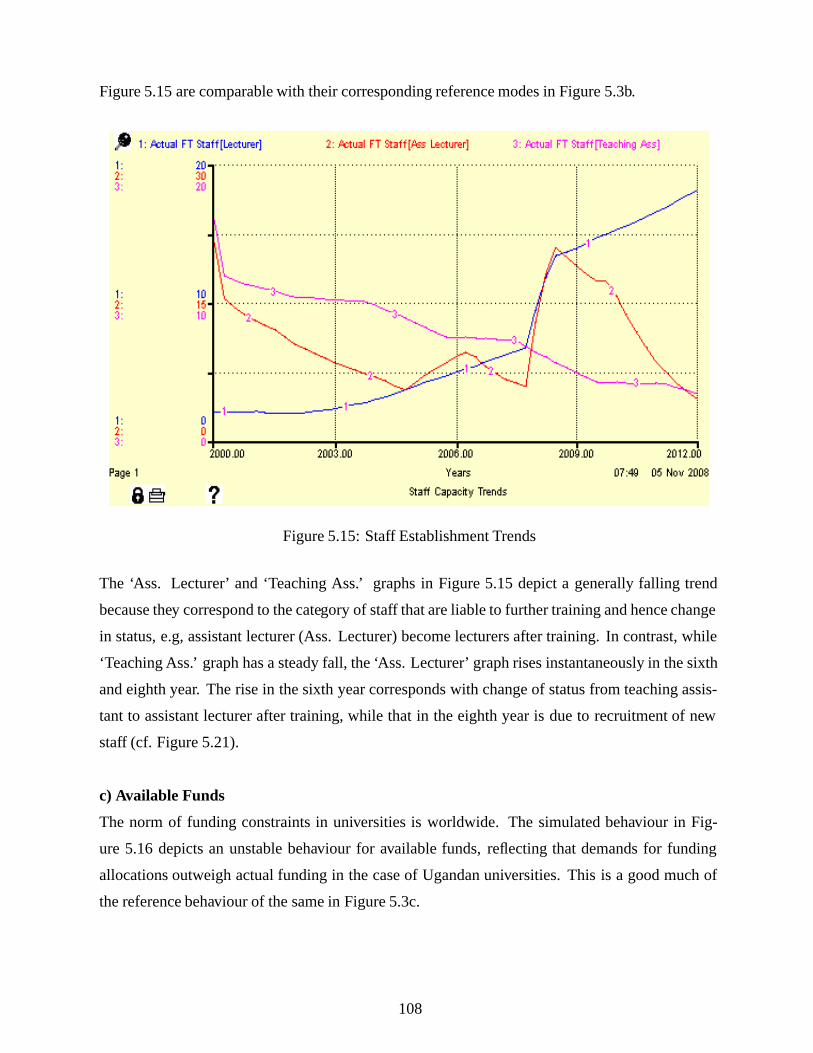
Figure 5.15 are comparable with their corresponding reference modes in Figure 5.3b.
Figure 5.15: Staff Establishment Trends
The ‘Ass. Lecturer’ and ‘Teaching Ass.’ graphs in Figure 5.15 depict a generally falling trend
because they correspond to the category of staff that are liable to further training and hence change
in status, e.g, assistant lecturer (Ass. Lecturer) become lecturers after training. In contrast, while
‘Teaching Ass.’ graph has a steady fall, the ‘Ass. Lecturer’ graph rises instantaneously in the sixth
and eighth year. The rise in the sixth year corresponds with change of status from teaching assis-
tant to assistant lecturer after training, while that in the eighth year is due to recruitment of new
staff (cf. Figure 5.21).
c) Available Funds
The norm of funding constraints in universities is worldwide. The simulated behaviour in Fig-
ure 5.16 depicts an unstable behaviour for available funds, reflecting that demands for funding
allocations outweigh actual funding in the case of Ugandan universities. This is a good much of
the reference behaviour of the same in Figure 5.3c.
108
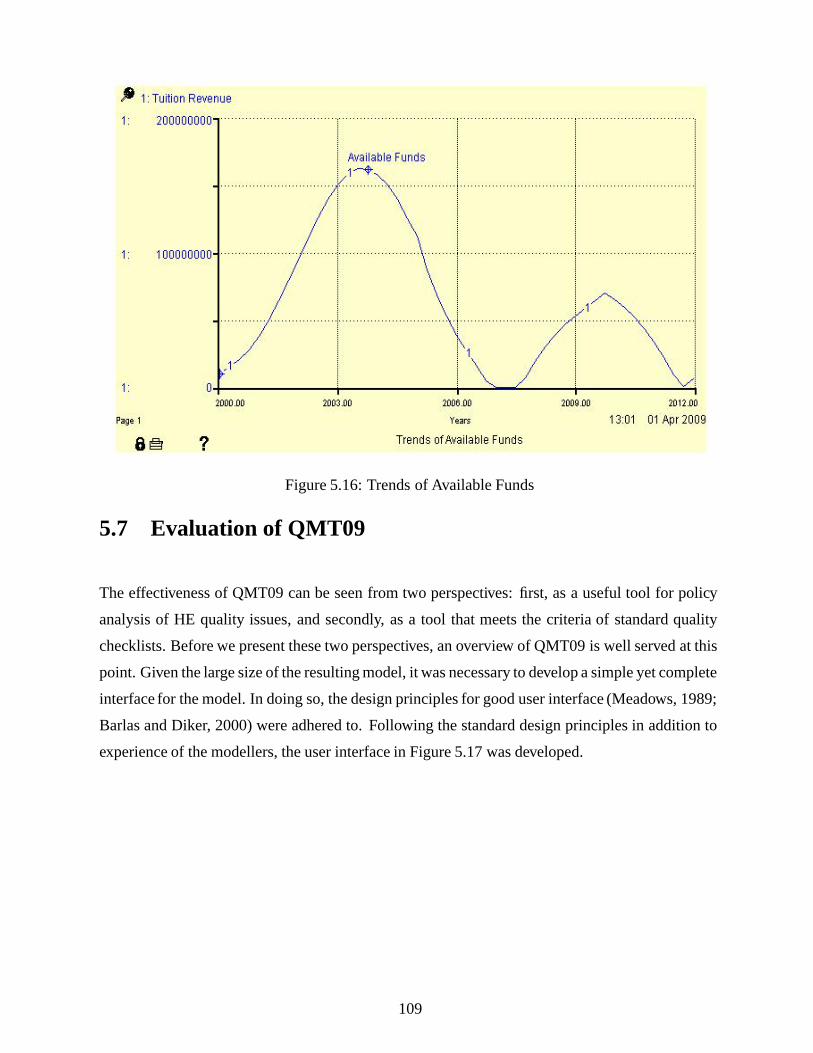
Figure 5.16: Trends of Available Funds
5.7 Evaluation of QMT09
The effectiveness of QMT09 can be seen from two perspectives: first, as a useful tool for policy
analysis of HE quality issues, and secondly, as a tool that meets the criteria of standard quality
checklists. Before we present these two perspectives, an overview of QMT09 is well served at this
point. Given the large size of the resulting model, it was necessary to develop a simple yet complete
interface for the model. In doing so, the design principles for good user interface (Meadows, 1989;
Barlas and Diker, 2000) were adhered to. Following the standard design principles in addition to
experience of the modellers, the user interface in Figure 5.17 was developed.
109
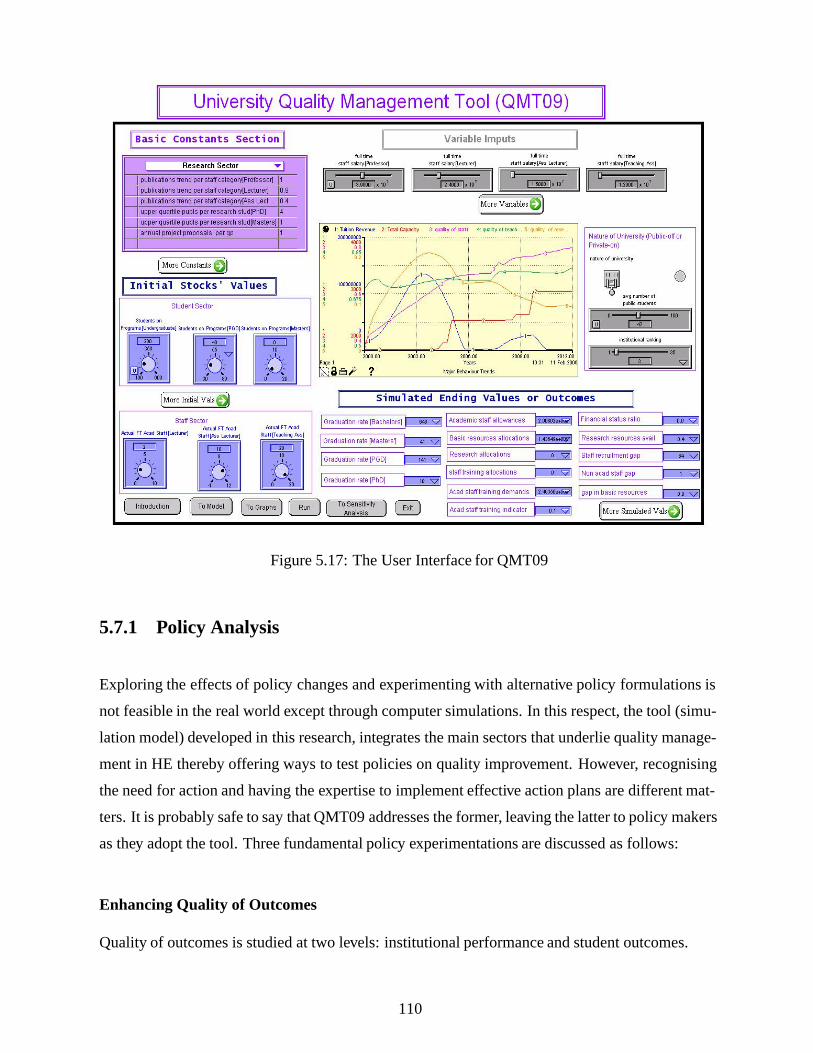
Figure 5.17: The User Interface for QMT09
5.7.1 Policy Analysis
Exploring the effects of policy changes and experimenting with alternative policy formulations is
not feasible in the real world except through computer simulations. In this respect, the tool (simu-
lation model) developed in this research, integrates the main sectors that underlie quality manage-
ment in HE thereby offering ways to test policies on quality improvement. However, recognising
the need for action and having the expertise to implement effective action plans are different mat-
ters. It is probably safe to say that QMT09 addresses the former, leaving the latter to policy makers
as they adopt the tool. Three fundamental policy experimentations are discussed as follows:
Enhancing Quality of Outcomes
Quality of outcomes is studied at two levels: institutional performance and student outcomes.
110
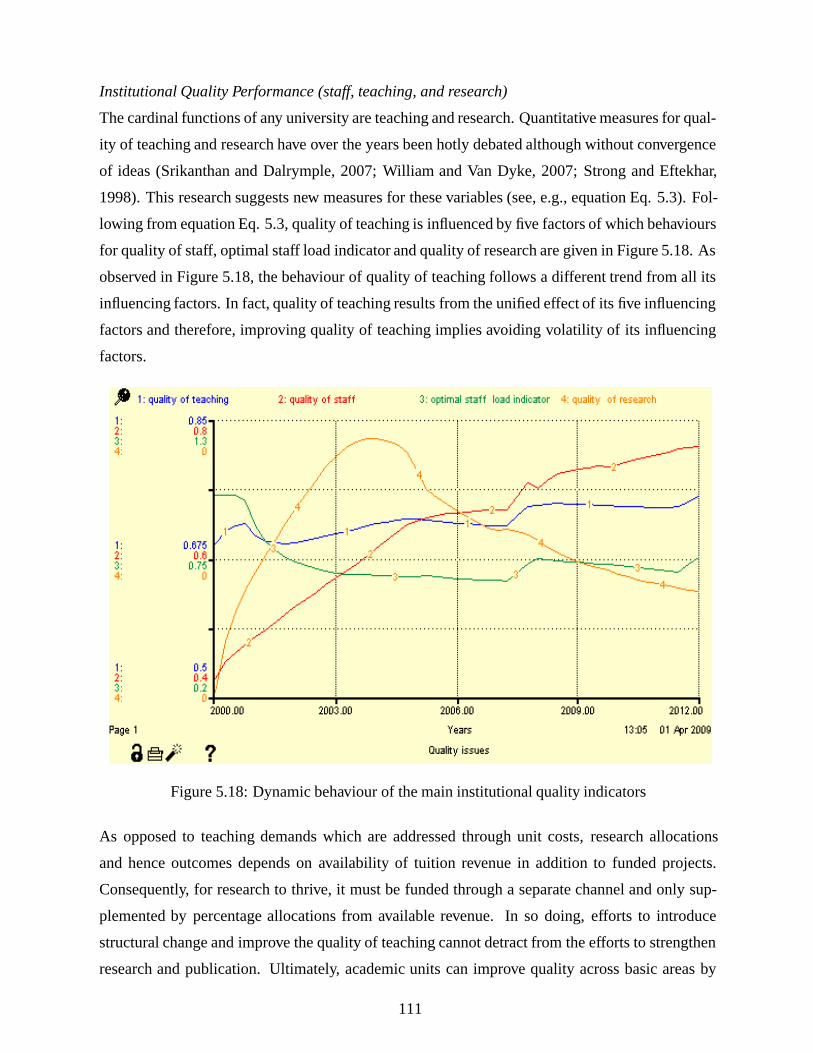
Institutional Quality Performance (staff, teaching, and research)
The cardinal functions of any university are teaching and research. Quantitative measures for qual-
ity of teaching and research have over the years been hotly debated although without convergence
of ideas (Srikanthan and Dalrymple, 2007; William and Van Dyke, 2007; Strong and Eftekhar,
1998). This research suggests new measures for these variables (see, e.g., equation Eq. 5.3). Fol-
lowing from equation Eq. 5.3, quality of teaching is influenced by five factors of which behaviours
for quality of staff, optimal staff load indicator and quality of research are given in Figure 5.18. As
observed in Figure 5.18, the behaviour of quality of teaching follows a different trend from all its
influencing factors. In fact, quality of teaching results from the unified effect of its five influencing
factors and therefore, improving quality of teaching implies avoiding volatility of its influencing
factors.
Figure 5.18: Dynamic behaviour of the main institutional quality indicators
As opposed to teaching demands which are addressed through unit costs, research allocations
and hence outcomes depends on availability of tuition revenue in addition to funded projects.
Consequently, for research to thrive, it must be funded through a separate channel and only sup-
plemented by percentage allocations from available revenue. In so doing, efforts to introduce
structural change and improve the quality of teaching cannot detract from the efforts to strengthen
research and publication. Ultimately, academic units can improve quality across basic areas by
111
seeking optimal behaviour. The soundness of model equations as reflected by logical behaviour
outcomes in Figure 5.18 provide confidence that model parameters can be dynamically varied to
produce required optimal behaviour.
Quality of Students Outcomes
Quantifying students outcomes has equally previously been attempted but with less consensus.
This research contributes to this debate by exploring quality of students’ outcomes in the cate-
gories of graduate and undergraduate outcomes. In this regard, graduate quality is approximated
from students’ thesis publications index (Badri and Abdulla), while undergraduate quality is ob-
tained as the product of ‘observed undergraduate quality’ (say Qu) and unified effect of quality
of research, quality of teaching, and resources availability. Qu is computed from the available
percentage grading of undergraduate scores as follows:
Qu = Pu(1 + Pp) +Pl
1 + Pl(Eq. 5.6)
Where:
Qu is the indicated quality of undergraduate
Pu is percentage of students with first class and second upper degree
Pl is percentage of students with second lower degree
Pp is percentage of students with pass degree
The simulation behaviour of students’ outcomes are given in Figure 5.19 next page.
112
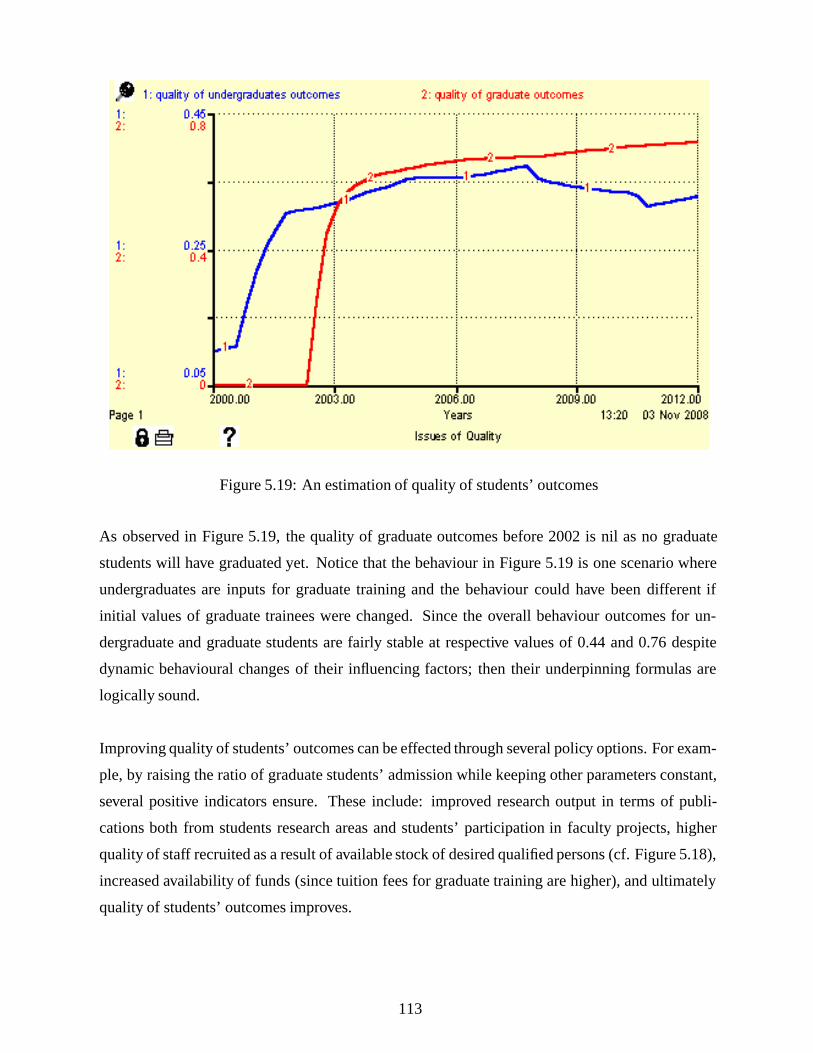
Figure 5.19: An estimation of quality of students’ outcomes
As observed in Figure 5.19, the quality of graduate outcomes before 2002 is nil as no graduate
students will have graduated yet. Notice that the behaviour in Figure 5.19 is one scenario where
undergraduates are inputs for graduate training and the behaviour could have been different if
initial values of graduate trainees were changed. Since the overall behaviour outcomes for un-
dergraduate and graduate students are fairly stable at respective values of 0.44 and 0.76 despite
dynamic behavioural changes of their influencing factors; then their underpinning formulas are
logically sound.
Improving quality of students’ outcomes can be effected through several policy options. For exam-
ple, by raising the ratio of graduate students’ admission while keeping other parameters constant,
several positive indicators ensure. These include: improved research output in terms of publi-
cations both from students research areas and students’ participation in faculty projects, higher
quality of staff recruited as a result of available stock of desired qualified persons (cf. Figure 5.18),
increased availability of funds (since tuition fees for graduate training are higher), and ultimately
quality of students’ outcomes improves.
113
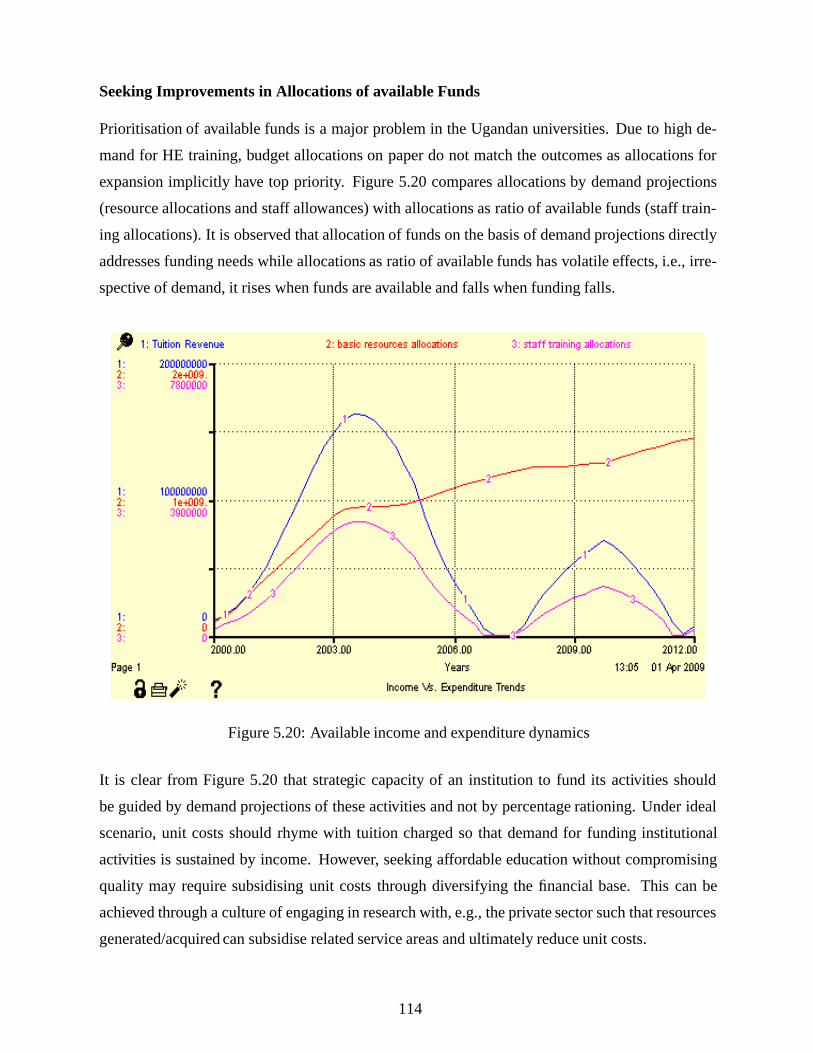
Seeking Improvements in Allocations of available Funds
Prioritisation of available funds is a major problem in the Ugandan universities. Due to high de-
mand for HE training, budget allocations on paper do not match the outcomes as allocations for
expansion implicitly have top priority. Figure 5.20 compares allocations by demand projections
(resource allocations and staff allowances) with allocations as ratio of available funds (staff train-
ing allocations). It is observed that allocation of funds on the basis of demand projections directly
addresses funding needs while allocations as ratio of available funds has volatile effects, i.e., irre-
spective of demand, it rises when funds are available and falls when funding falls.
Figure 5.20: Available income and expenditure dynamics
It is clear from Figure 5.20 that strategic capacity of an institution to fund its activities should
be guided by demand projections of these activities and not by percentage rationing. Under ideal
scenario, unit costs should rhyme with tuition charged so that demand for funding institutional
activities is sustained by income. However, seeking affordable education without compromising
quality may require subsidising unit costs through diversifying the financial base. This can be
achieved through a culture of engaging in research with, e.g., the private sector such that resources
generated/acquired can subsidise related service areas and ultimately reduce unit costs.
114
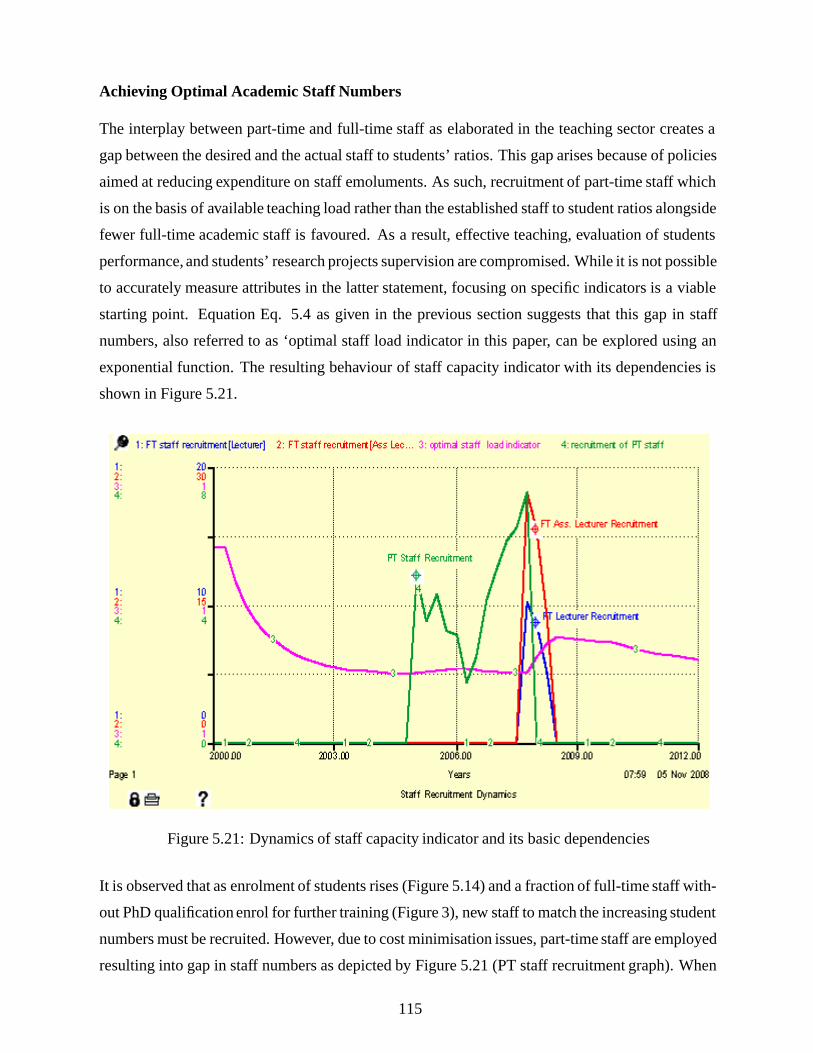
Achieving Optimal Academic Staff Numbers
The interplay between part-time and full-time staff as elaborated in the teaching sector creates a
gap between the desired and the actual staff to students’ ratios. This gap arises because of policies
aimed at reducing expenditure on staff emoluments. As such, recruitment of part-time staff which
is on the basis of available teaching load rather than the established staff to student ratios alongside
fewer full-time academic staff is favoured. As a result, effective teaching, evaluation of students
performance, and students’ research projects supervision are compromised. While it is not possible
to accurately measure attributes in the latter statement, focusing on specific indicators is a viable
starting point. Equation Eq. 5.4 as given in the previous section suggests that this gap in staff
numbers, also referred to as ‘optimal staff load indicator in this paper, can be explored using an
exponential function. The resulting behaviour of staff capacity indicator with its dependencies is
shown in Figure 5.21.
Figure 5.21: Dynamics of staff capacity indicator and its basic dependencies
It is observed that as enrolment of students rises (Figure 5.14) and a fraction of full-time staff with-
out PhD qualification enrol for further training (Figure 3), new staff to match the increasing student
numbers must be recruited. However, due to cost minimisation issues, part-time staff are employed
resulting into gap in staff numbers as depicted by Figure 5.21 (PT staff recruitment graph). When
115
new full-time academic staff are employed in the eighth year, subsequently part-time staff recruit-
ment becomes zero and staff capacity indicator rises. The slight fall in staff capacity indicator after
2009 is due to further staff development (Figure 5.15) leading to overloading of available full-time
staff, in this case without recruitment of part-time staff.
As just articulated, if ‘optimal staff load indicator’ is a good measure for optimal staff numbers
given available students’ capacity, then paying attention to its dynamics enhances quality of service
provision (teaching, students’ assessment and projects supervision) by a universitys academic unit.
Although recruiting full-time staff boosts ’optimal staff load indicator’ and should yield optimal
academic staff capacity, this only applies when the recruited staff all hold at least a PhD. On the
other hand, if a fraction of the recruited full-time staff lack the minimum qualification of a PhD,
subsequent pursuit for further training definitely lowers full-time staff numbers rendering optimal
staff capacity unattainable even at ideal budgeted allocations.
5.7.2 Analysis QMT09 versus IUCEA Quality Checklists
The Inter-University Coucil for East Africa (IUCEA) has developed check lists for quality in three
main stream HE quality areas, namely: quality of a program (IUCEA, 2008: Vol.1), quality of
an institution (IUCEA, 2008: Vol.3), quality of internal quality assurance system (IUCEA, 2008:
Vol.4). By contrasting QMT09 scope against these streams as contained in Table 5.2, it is observed
that QMT09 satisfies all the three IUCEA check lists for quality. As such QMT09 is useable as a
tool for: program quality analysis, institutional quality analysis as well as internal quality assurance
system analysis. The quality checklists in ‘bold’ in Table 5.2 depict factors in the institutional
quality quecklist that replicate in quality of program and internal quality assurance system contexts.
Detailed discussions on the actual model variables in the third column are avoided at this point as
the same is given in the early sections of this chapter (e.g., Table 5.1).
116
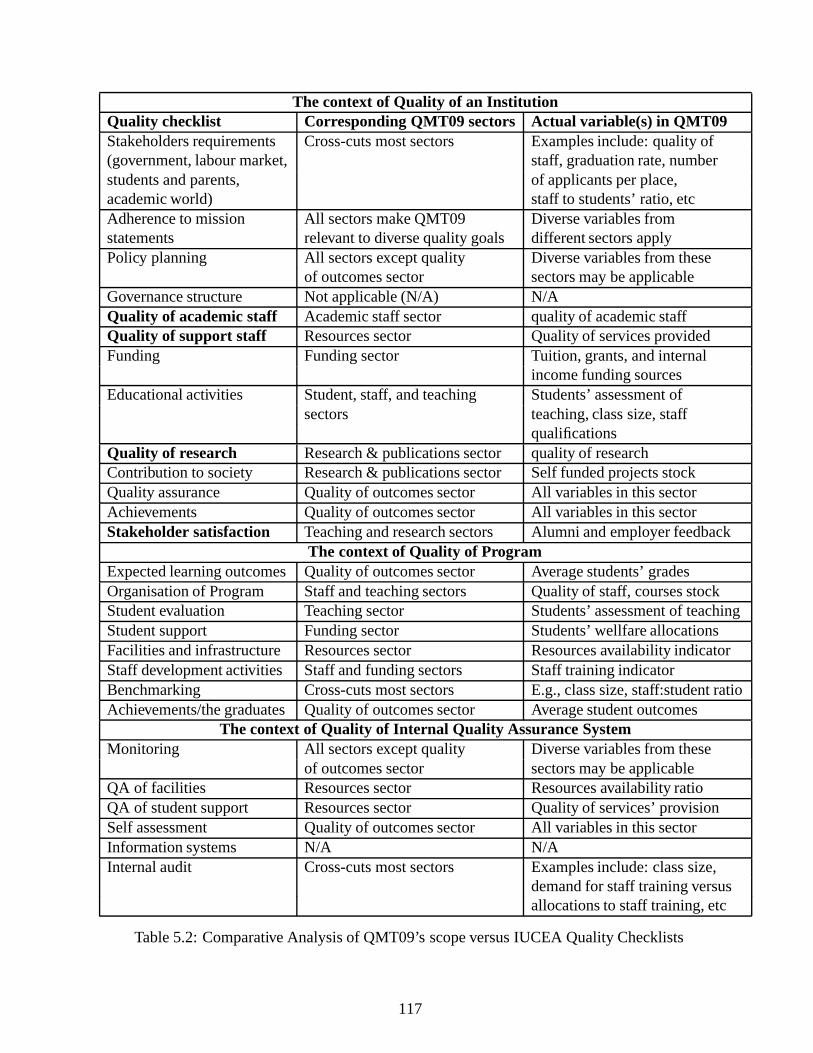
The context of Quality of an InstitutionQuality checklist Corresponding QMT09 sectors Actual variable(s) in QMT09Stakeholders requirements Cross-cuts most sectors Examples include: quality of(government, labour market, staff, graduation rate, numberstudents and parents, of applicants per place,academic world) staff to students’ ratio, etcAdherence to mission All sectors make QMT09 Diverse variables fromstatements relevant to diverse quality goals different sectors applyPolicy planning All sectors except quality Diverse variables from these
of outcomes sector sectors may be applicableGovernance structure Not applicable (N/A) N/AQuality of academic staff Academic staff sector quality of academic staffQuality of support staff Resources sector Quality of services providedFunding Funding sector Tuition, grants, and internal
income funding sourcesEducational activities Student, staff, and teaching Students’ assessment of
sectors teaching, class size, staffqualifications
Quality of research Research & publications sector quality of researchContribution to society Research & publications sector Self funded projects stockQuality assurance Quality of outcomes sector All variables in this sectorAchievements Quality of outcomes sector All variables in this sectorStakeholder satisfaction Teaching and research sectors Alumni and employer feedback
The context of Quality of ProgramExpected learning outcomesQuality of outcomes sector Average students’ gradesOrganisation of Program Staff and teaching sectors Quality of staff, courses stockStudent evaluation Teaching sector Students’ assessment of teachingStudent support Funding sector Students’ wellfare allocationsFacilities and infrastructure Resources sector Resources availability indicatorStaff development activities Staff and funding sectors Staff training indicatorBenchmarking Cross-cuts most sectors E.g., class size, staff:student ratioAchievements/the graduatesQuality of outcomes sector Average student outcomes
The context of Quality of Internal Quality Assurance SystemMonitoring All sectors except quality Diverse variables from these
of outcomes sector sectors may be applicableQA of facilities Resources sector Resources availability ratioQA of student support Resources sector Quality of services’ provisionSelf assessment Quality of outcomes sector All variables in this sectorInformation systems N/A N/AInternal audit Cross-cuts most sectors Examples include: class size,
demand for staff training versusallocations to staff training, etc
Table 5.2: Comparative Analysis of QMT09’s scope versus IUCEA Quality Checklists
117
Judging by the overall presentation in Table 5.2, the effectiveness of QMT09 in addressing the three
higher education quality contexts is further confirmed. It seems therefore, safe to state that QMT09
is not only a tool for testing quality improvement policies but also a theoretical framework for
establishing structural boundaries on specific higher education quality concerns. This is because
QMT09 is based on both data and theoretical statements about HE quality causal processes over
time as identified by the stakeholders.
5.8 Validation of SyDPAR
The effectiveness of SyDPAR as an approach for solving dynamically complex problems has been
tested through its application to the HE problem area. Most importantly, involving HE man-
agers/stakeholders in the model building process was a vital element in confirming the hypothesis
that SyDPAR is a client centred participative modelling approach. Indeed, the three reasons for
client involvement which include: identification of problems, provision of information, and imple-
mentation of model results, are catered for in the “PA” and “SR” cycles. A fourth and probably
only reason that caters for client’s individual benefit from modelling participation is addressed in
the “MP” cycle for which clients are perceived as apprentices of model development under guid-
ance of modellers, i.e., clients learn how the qualitative model of their issue can be translated into
a formal model. In addition, emerging from the stakeholders engagement was the need to include
“information flow” in the architecture since the outcomes of an earlier phase influences several
later phases, and not only the immediate sequenced phase. This is depicted by information flow
arrows in the enriched conceptual SyDPAR architecture as shown in Figure 5.22.
118
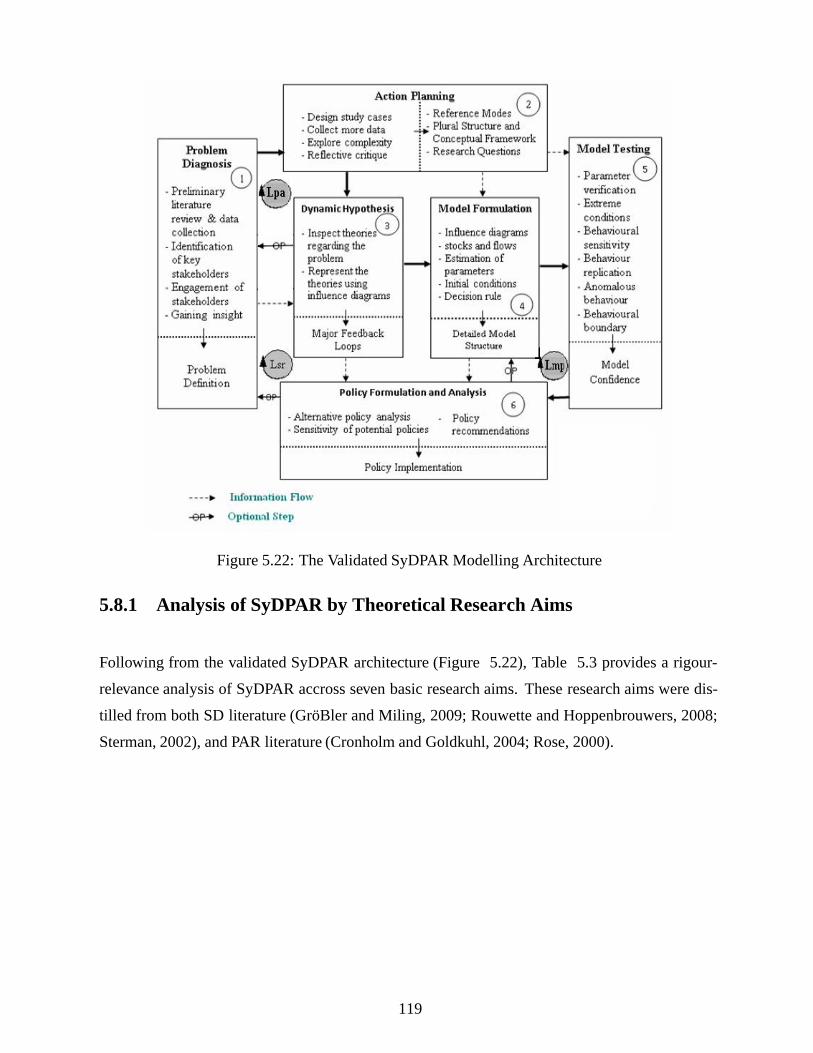
Figure 5.22: The Validated SyDPAR Modelling Architecture
5.8.1 Analysis of SyDPAR by Theoretical Research Aims
Following from the validated SyDPAR architecture (Figure 5.22), Table 5.3 provides a rigour-
relevance analysis of SyDPAR accross seven basic research aims. These research aims were dis-
tilled from both SD literature (GroBler and Miling, 2009; Rouwette and Hoppenbrouwers, 2008;
Sterman, 2002), and PAR literature (Cronholm and Goldkuhl, 2004; Rose, 2000).
119
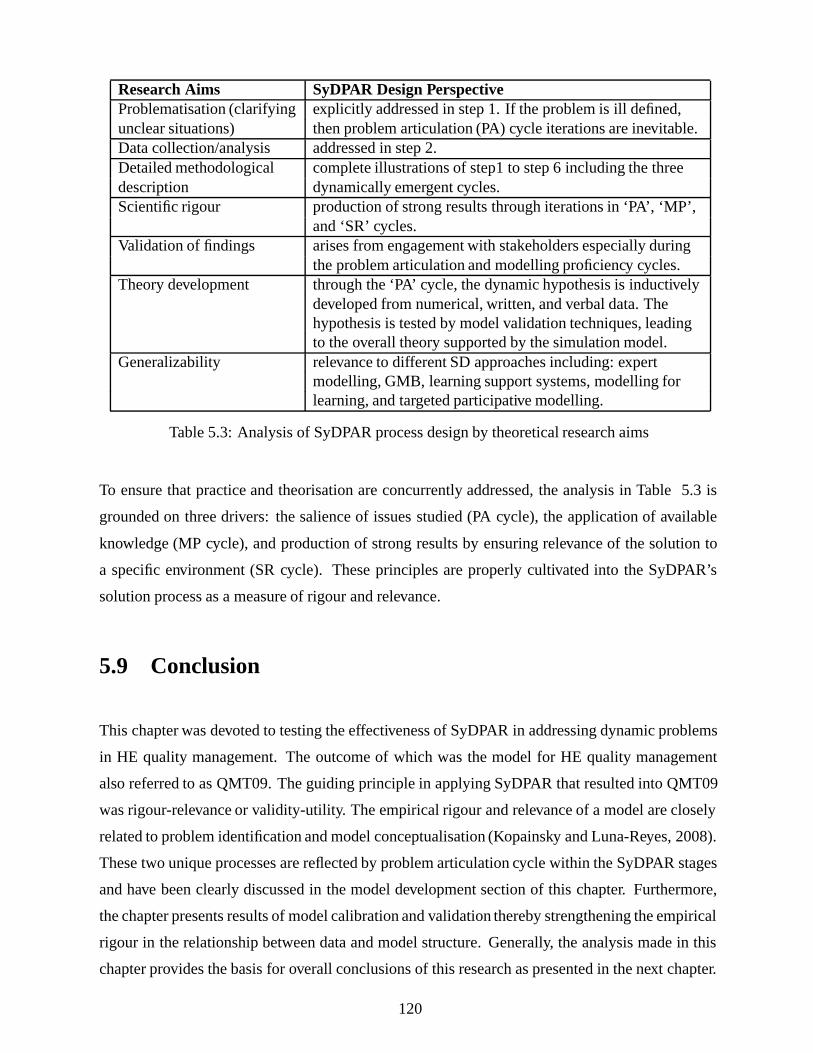
Research Aims SyDPAR Design PerspectiveProblematisation (clarifying explicitly addressed in step 1. If the problem is ill defined,unclear situations) then problem articulation (PA) cycle iterations are inevitable.Data collection/analysis addressed in step 2.Detailed methodological complete illustrations of step1 to step 6 including the threedescription dynamically emergent cycles.Scientific rigour production of strong results through iterations in ‘PA’, ‘MP’,
and ‘SR’ cycles.Validation of findings arises from engagement with stakeholders especially during
the problem articulation and modelling proficiency cycles.Theory development through the ‘PA’ cycle, the dynamic hypothesis is inductively
developed from numerical, written, and verbal data. Thehypothesis is tested by model validation techniques, leadingto the overall theory supported by the simulation model.
Generalizability relevance to different SD approaches including: expertmodelling, GMB, learning support systems, modelling forlearning, and targeted participative modelling.
Table 5.3: Analysis of SyDPAR process design by theoretical research aims
To ensure that practice and theorisation are concurrently addressed, the analysis in Table 5.3 is
grounded on three drivers: the salience of issues studied (PA cycle), the application of available
knowledge (MP cycle), and production of strong results by ensuring relevance of the solution to
a specific environment (SR cycle). These principles are properly cultivated into the SyDPAR’s
solution process as a measure of rigour and relevance.
5.9 Conclusion
This chapter was devoted to testing the effectiveness of SyDPAR in addressing dynamic problems
in HE quality management. The outcome of which was the model for HE quality management
also referred to as QMT09. The guiding principle in applying SyDPAR that resulted into QMT09
was rigour-relevance or validity-utility. The empirical rigour and relevance of a model are closely
related to problem identification and model conceptualisation (Kopainsky and Luna-Reyes, 2008).
These two unique processes are reflected by problem articulation cycle within the SyDPAR stages
and have been clearly discussed in the model development section of this chapter. Furthermore,
the chapter presents results of model calibration and validation thereby strengthening the empirical
rigour in the relationship between data and model structure. Generally, the analysis made in this
chapter provides the basis for overall conclusions of this research as presented in the next chapter.
120
Chapter 6
Discussions and Conclusions
6.1 Introduction
This chapter presents the conclusions reached by the study at the end of the research cycle. This
is presented first by giving the overall conclusions, then discussing contributions made by this re-
search to the theory and practice of systems dynamics and higher education quality management
systems. Further, the contributions in accordance with the the research objectives are presented.
The chapter closes by presenting avenues for further research resulting from the findings and lim-
itations of this study.
6.2 Discussion of Findings
This research started by highlighting the refutable claims in the recent previous research, including:
- That the factors that influence quality have different scales of effect on quality, e.g., quality
of academic staff is the main challenge (Vinnik and Scholl, 2005)
- That quality is too subtle to be meaningfully measured (Srikanthan and Dalrymple, 2007)
The findings of this research are more or less new positions on these claims, as are subsequently
highlighted. In addition, the research questions are examined in greater depth and then policy
directions on HE quality issues are finally discussed.
121
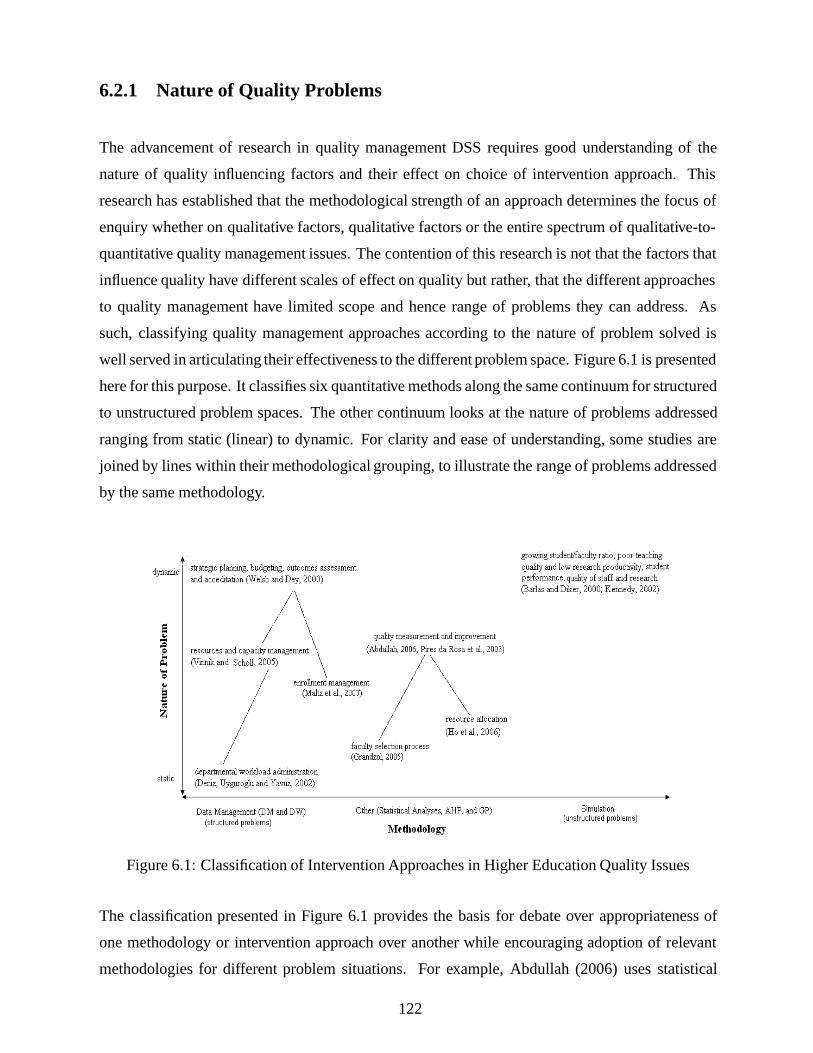
6.2.1 Nature of Quality Problems
The advancement of research in quality management DSS requires good understanding of the
nature of quality influencing factors and their effect on choice of intervention approach. This
research has established that the methodological strength of an approach determines the focus of
enquiry whether on qualitative factors, qualitative factors or the entire spectrum of qualitative-to-
quantitative quality management issues. The contention of this research is not that the factors that
influence quality have different scales of effect on quality but rather, that the different approaches
to quality management have limited scope and hence range of problems they can address. As
such, classifying quality management approaches according to the nature of problem solved is
well served in articulating their effectiveness to the different problem space. Figure 6.1 is presented
here for this purpose. It classifies six quantitative methods along the same continuum for structured
to unstructured problem spaces. The other continuum looks at the nature of problems addressed
ranging from static (linear) to dynamic. For clarity and ease of understanding, some studies are
joined by lines within their methodological grouping, to illustrate the range of problems addressed
by the same methodology.
Figure 6.1: Classification of Intervention Approaches in Higher Education Quality Issues
The classification presented in Figure 6.1 provides the basis for debate over appropriateness of
one methodology or intervention approach over another while encouraging adoption of relevant
methodologies for different problem situations. For example, Abdullah (2006) uses statistical
122
analysis to provide empirical evidence by comparing relative efficacy of three measurement in-
struments of service quality: the HEdPERF (Higher Education-Performance) scale, SERVPERF
(Service Performance) and the moderating scale of HEdPERF-SERVPERF (Higher Education-
Performance and Service Performance) scale within the higher education setting. Abdullah as-
sesses the relative strengths and weaknesses of each instrument in order to determine the best
measurement capabilities in terms of unidimensionality, and subsequently modified HEdPERF.
Comparative tests of the unidimensionality of the scales were conducted using goodness-of-fit
indices from factor analysis to see if the one-factor model fit. Overall tests as highlighted by Ab-
dullah (2006) indicate that the modified HEdPERF scale was superior to the SERVPERF and to
the combined HEdPERF-SERVPERF scales in terms of: reliable estimations, greater criterion and
construct validity, greater explained variance and better model fit. On the other hand, Grandzol
(2005) uses AHP for setting priorities and selecting alternatives in recruiting faculty staff. Grand-
zol reiterates that hiring the wrong person may lead to dysfunctional departments, dissatisfied
students, and, eventually, repeat efforts. In comparison, the latter fits its lower placement in Fig-
ure 6.1 compared to the former given its focus on the linear problem of faculty selection process.
Figure 6.1 clearly demonstrates that the simulation method or rather system dynamics modelling
and simulation is useful in addressing dynamic and unstructured problem characteristics. Thus
the contribution of this research partly is reflected in the design of participatory system dynamics
modelling whereby the roles of clients or participants as contributors to modelling are reflected in
the design itself.
6.2.2 Measurement of Quality
The qualitative and quantitative facets of quality have escalated mixed positions on whether quality
can be meaningfully measured or not. This thesis is based on the view that quality can be measured.
Certainly, the quantitative facets of quality are measurable in objective terms while the qualitative
ones can only be represented by mathematical logic derived from data. The literature is not silent
on quality measurement either. Al-Turki and Duffuaa (2003) suggest performance measures for
academic departments in relation to teaching quality, research quality, and student outcomes qual-
ity. Vinnik and Scholl (2005) on their part, develop a mathematical formular for analysing the
effects of resources on staff quality. Other researches have used a combination of statistical and
123
mathematical approaches to measure different quality issues (Try and Grogaard, 2003; Hoet al.,
2006; Grandzol, 2005). Another category of researchers have relied on the vast volumes of data in
HEIs to develop data warehouse from which decisions on quality issues are made (Welsh and Dey,
2002; Deniz and Ersan, 2001; Denizet al.,2002; Maltz, 2007).
The SD modelling approach adopted in this research is underpinned by differential equations and
the task was to represent the quality system structure as rates of change that are supported by SD
tools. While this was achieved as supported by the stocks and flows in chapter 5, measures for
other factors were made using: data imported from Excel (e.g., appraisal data to establish staff
competence), “if-then” statements e.g., for allocation of funds based on established demands and
availability of funds, pulse function e.g., for periodic recruitment of new staff when needed basing
on staff to students’ ratio, and other mathematical formulae as shown in Appendix A.
By all standards, when it comes to measurements, no research can avoid mathematical repre-
sentation and data inference. The degree of accurancy with which these measurements are made
depends on the understanding of the software used by the researchers. A further enriching fea-
ture of SD tools is the ability to represent mental models of the stakeholders. This has even been
strengthened by methods of analysing qualitative data in SD by Luna-Reyes aand Andersen (2003).
As for the design of this research, a preliminary model was first developed following the first
field study. The subsequent engagement with HE management stakeholders in participative mod-
elling sessions meant that data in support of the qualitative facets of quality was aggresively sought.
The second field study during the later stages of modelling further provided data needed to ensure
that measurements of the model variables were consistent with the educational settings. All these
strategies culminated into model equations part of which have been elaborated in chapter 5 and the
rest given in Appendix A.
6.2.3 Research Questions Analysis
The three research questions addressed in this thesis sought better methodological guidelines for
involving clients and stakeholders and requirements of future DSS in dealing with quality prob-
lems. The analysis in chapters three to five implicitly provide answers to these questions. More
specifically, the first question is partially answered in chapter 2, section 2.3.7 and chapter 3, section
124
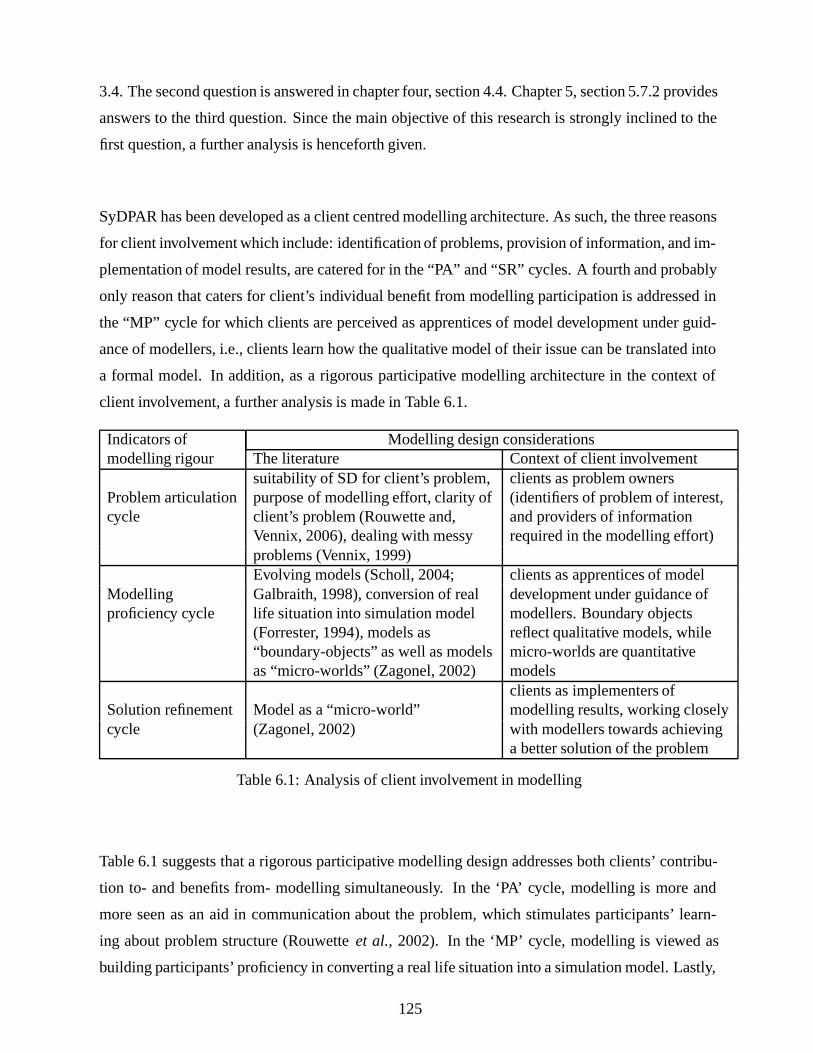
3.4. The second question is answered in chapter four, section 4.4. Chapter 5, section 5.7.2 provides
answers to the third question. Since the main objective of this research is strongly inclined to the
first question, a further analysis is henceforth given.
SyDPAR has been developed as a client centred modelling architecture. As such, the three reasons
for client involvement which include: identification of problems, provision of information, and im-
plementation of model results, are catered for in the “PA” and “SR” cycles. A fourth and probably
only reason that caters for client’s individual benefit from modelling participation is addressed in
the “MP” cycle for which clients are perceived as apprentices of model development under guid-
ance of modellers, i.e., clients learn how the qualitative model of their issue can be translated into
a formal model. In addition, as a rigorous participative modelling architecture in the context of
client involvement, a further analysis is made in Table 6.1.
Indicators of Modelling design considerationsmodelling rigour The literature Context of client involvement
suitability of SD for client’s problem, clients as problem ownersProblem articulation purpose of modelling effort, clarity of (identifiers of problem of interest,cycle client’s problem (Rouwette and, and providers of information
Vennix, 2006), dealing with messy required in the modelling effort)problems (Vennix, 1999)Evolving models (Scholl, 2004; clients as apprentices of model
Modelling Galbraith, 1998), conversion of real development under guidance ofproficiency cycle life situation into simulation model modellers. Boundary objects
(Forrester, 1994), models as reflect qualitative models, while“boundary-objects” as well as modelsmicro-worlds are quantitativeas “micro-worlds” (Zagonel, 2002) models
clients as implementers ofSolution refinement Model as a “micro-world” modelling results, working closelycycle (Zagonel, 2002) with modellers towards achieving
a better solution of the problem
Table 6.1: Analysis of client involvement in modelling
Table 6.1 suggests that a rigorous participative modelling design addresses both clients’ contribu-
tion to- and benefits from- modelling simultaneously. In the ‘PA’ cycle, modelling is more and
more seen as an aid in communication about the problem, which stimulates participants’ learn-
ing about problem structure (Rouwetteet al., 2002). In the ‘MP’ cycle, modelling is viewed as
building participants’ proficiency in converting a real life situation into a simulation model. Lastly,
125
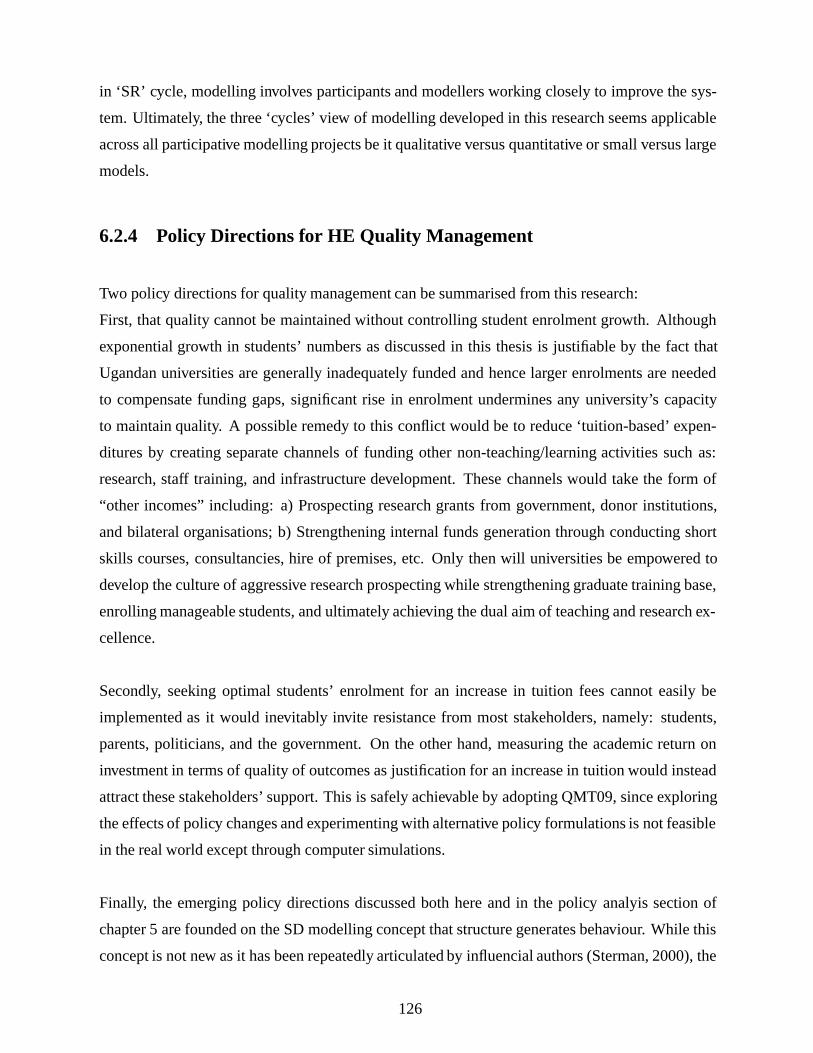
in ‘SR’ cycle, modelling involves participants and modellers working closely to improve the sys-
tem. Ultimately, the three ‘cycles’ view of modelling developed in this research seems applicable
across all participative modelling projects be it qualitative versus quantitative or small versus large
models.
6.2.4 Policy Directions for HE Quality Management
Two policy directions for quality management can be summarised from this research:
First, that quality cannot be maintained without controlling student enrolment growth. Although
exponential growth in students’ numbers as discussed in this thesis is justifiable by the fact that
Ugandan universities are generally inadequately funded and hence larger enrolments are needed
to compensate funding gaps, significant rise in enrolment undermines any university’s capacity
to maintain quality. A possible remedy to this conflict would be to reduce ‘tuition-based’ expen-
ditures by creating separate channels of funding other non-teaching/learning activities such as:
research, staff training, and infrastructure development. These channels would take the form of
“other incomes” including: a) Prospecting research grants from government, donor institutions,
and bilateral organisations; b) Strengthening internal funds generation through conducting short
skills courses, consultancies, hire of premises, etc. Only then will universities be empowered to
develop the culture of aggressive research prospecting while strengthening graduate training base,
enrolling manageable students, and ultimately achieving the dual aim of teaching and research ex-
cellence.
Secondly, seeking optimal students’ enrolment for an increase in tuition fees cannot easily be
implemented as it would inevitably invite resistance from most stakeholders, namely: students,
parents, politicians, and the government. On the other hand, measuring the academic return on
investment in terms of quality of outcomes as justification for an increase in tuition would instead
attract these stakeholders’ support. This is safely achievable by adopting QMT09, since exploring
the effects of policy changes and experimenting with alternative policy formulations is not feasible
in the real world except through computer simulations.
Finally, the emerging policy directions discussed both here and in the policy analyis section of
chapter 5 are founded on the SD modelling concept that structure generates behaviour. While this
concept is not new as it has been repeatedly articulated by influencial authors (Sterman, 2000), the
126
model developed in this research goes further by tapping into the power of participative modelling
procedures of developing large models. In this respect, the procedure allowed for realistic and
sufficient representation of a real HE quality management system, in which the constituent vari-
ables and their functional relationships, including the underlying assumptions, were formalized
and hence made transparent.
6.3 Conclusions
6.3.1 Overall Conclusions
The research aimed to integrate SD and PAR in order to design more rigorous participative mod-
elling projects by emphasising clients’ contributions to modelling and benefits from modelling
involvement in the modelling architecture itself. A decision support tool for HE quality manage-
ment was subsequently developed as the measure of relevance of this integration. As such, two
outstanding outcomes were achieved: 1) the integrated participative modelling approach, also re-
ferred to as SyDPAR; and 2)the decision support tool for HE quality management underpinned by
feedbacks and differential equations, also referred to as QMT09.
6.3.2 Summary of Contributions
As described in chapter one, this research originates in observation that existing DSS on HE quality
issues emphasise specific aspects of quality rather than the entire facets of quality problems. The
main cause of this bias was found to be linked to the nature of quality itself (complex, dynamic,
non-linear), and the inadequacy of most existing methods to provide equal means of addressing
the qualitative and quantitative facets of quality including the human elements involved. There-
fore, the problem addressed in this research had a dual character: practical (dealing with complex,
dynamic, non-linear issues) and theoretical (lack of methodological guidelines for solving quality
problems without compromising problem scope).
By adopting the SyDPAR approach, this research has aimed to address both theoretical and practi-
cal aspects of the reiterated problem. Consequently, the research has made contributions to theory
and practice of participative modelling as well as higher education quality management systems
127
research.
Contributions to Theory
1. Re-conceptualisation of Participative Modelling Design Effectiveness. Research into im-
provement of the design of system dynamics modelling process has attracted little attention proba-
bly because system dynamicists find existing designs adequate. However, participative modelling
which involves clients/practitioners without prior modelling knowledge requires methodological
details that show how a real-life situation translates into a simulation model. By providing a
generic process design for participative modelling this research extends the view of participative
modelling into that where practioners’ contributions to- and benefits from- modelling involvement
are reflected in the modelling process design itself. Furthermore, the changing roles of both the
expert modeller and the practitioner or clients during modelling reflect the symbiotic dependence
between these roles that accounts for the overall sucess of any participative modelling project. This
contribution is detailed in section 2.3.7 and section 6.2.3
2. Feedback Systems Thinking for HE Quality Problem Representation. As presented in
chapter one, higher education institutions’ quality management related problems are rooted in the
underlying dynamics, complexity and non-linearity of the system structure in educational settings.
An attempt to address these problems before understanding their causes has often led to no lasting
solution. Feedback systems thinking, however, has not yet been placed in main stream methods for
HE quality studies as depicted in part by scarcity of publications using this approach in the HE body
of literature. This study has gone beyond the typical state-of-the-art review and has placed feed-
back systems thinking among methods for HE quality problem conceptualisation/representation.
This placement has provided insight into the rationale and relevance of feedbacks in HE quality
research. This contribution is detailed in section 2.5
3. Theoretical Validation of SyDPAR. The Design Science IS research framework has been
used to assess the rigour and relevance of SyDPAR as a participative modelling process tool, the
analysis of which is contained in Table 5.3. Specifically, rigour results from reflection within the
modelling design itself, the practioners’ contributions to- and benefits from- involvement in a mod-
elling project . This is highly linked to the view that participative modelling progresses through
cycles of ‘problem articulation’, ‘modelling profficiency’, and ‘solution refinement’. On the other
128
hand, relevance seeks to evaluate the usefulness of SyDPAR in addressing complex problems. The
results presented in this research attest to this usefulness. More specifically, this contribution is
detailed in section 5.8.
Contributions to Practice
1. Generic Participative Modelling Design. The development of the SyDPAR as a participative
modelling design has made a contribution towards the perceived lack of methodological guidilines
for showing how a problem translates into a model while simultaneously emphasising practitioners
contributions in modelling. By using this design, a practitioner/client possessing only the neces-
sary domain knowledge finds his/her contribution reflected in the modelling process itself. In
addition, the design gives activities and outcomes of every process thereby encouraging transition
to the last stages on basis of explicit and acceptable outcomes of the previous phases. Ultimately,
the cycles espoused in this process design demonstrates that new designs can achieve modelling of
a thoroughness and usefulness far in excess of typical models found in academic publications.
SyDPAR occupies a niche defined by the answers it provides to the following modelling design
questions:
• Can the modelling process design effectively balance the goals of fundamental modelling
understanding with consideration of usefulness of the resulting models?
• How should participative modelling be rigorously designed?
• How does modelling design influence outcomes?
• What is the significance of inclusion of clients’ contributions to- and benefits from- mod-
elling in the actual design?
This contribution is detailed in section 3.4.
2. Decision Support Tool for Higher Education Quality Management. Quality management
is the core higher education research since it encompasses the overall quality concerns (assurance
129
and improvement). As a result, most studies have narrowed the scope, in some cases disguising as
addressing important concepts rather than the entire spectrum of possibilities. The tool developed
in this thesis attempts to address quality in its wider scope of quality concerns. In doing so, the
contribution of this thesis is provision of a general theory of HE quality management system that
integrates funding, enrolment and quality using feedbacks and validated in a simulation model un-
derpinned by differential equations.
More visibly, the significnce of QMT09 is defined by the questions it addresses including:
• How can quality of staff, teaching, research and students’ achievements be improved?
• What are the effects of increased tuition?
• What is the relationship between research throughput and learning achievements?
• When is it appropriate to increase graduate training?
• How does quality of admitted students affect quality of students achievements?
• How does the differences in admission rates and graduation rates affect the quality of insti-
tutional outcomes
• How do students and resources (academic staff, computers, books, lecture space, laborato-
ries) ratios influence learning achievements?
• What is the relationship between the factors that underlie optimal students enrolment?
• How do student grades translate into quality of students outcomes?
• Can decreased teaching be substituted by an increase in infrastructure and other academic
resources?
This contribution is detailed in section 5.3.
130
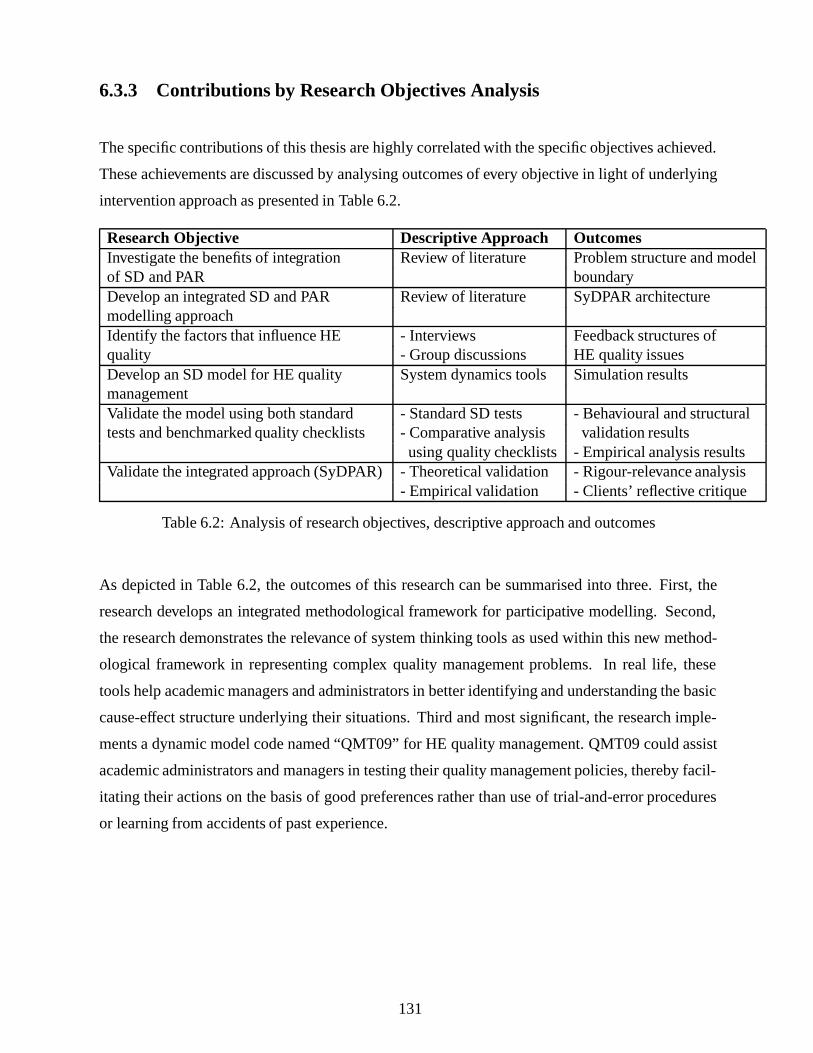
6.3.3 Contributions by Research Objectives Analysis
The specific contributions of this thesis are highly correlated with the specific objectives achieved.
These achievements are discussed by analysing outcomes of every objective in light of underlying
intervention approach as presented in Table 6.2.
Research Objective Descriptive Approach OutcomesInvestigate the benefits of integration Review of literature Problem structure and modelof SD and PAR boundaryDevelop an integrated SD and PAR Review of literature SyDPAR architecturemodelling approachIdentify the factors that influence HE - Interviews Feedback structures ofquality - Group discussions HE quality issuesDevelop an SD model for HE quality System dynamics tools Simulation resultsmanagementValidate the model using both standard - Standard SD tests - Behavioural and structuraltests and benchmarked quality checklists - Comparative analysis validation results
using quality checklists - Empirical analysis resultsValidate the integrated approach (SyDPAR)- Theoretical validation - Rigour-relevance analysis
- Empirical validation - Clients’ reflective critique
Table 6.2: Analysis of research objectives, descriptive approach and outcomes
As depicted in Table 6.2, the outcomes of this research can be summarised into three. First, the
research develops an integrated methodological framework for participative modelling. Second,
the research demonstrates the relevance of system thinking tools as used within this new method-
ological framework in representing complex quality management problems. In real life, these
tools help academic managers and administrators in better identifying and understanding the basic
cause-effect structure underlying their situations. Third and most significant, the research imple-
ments a dynamic model code named “QMT09” for HE quality management. QMT09 could assist
academic administrators and managers in testing their quality management policies, thereby facil-
itating their actions on the basis of good preferences rather than use of trial-and-error procedures
or learning from accidents of past experience.
131
6.4 Limitations
The tool presented in this thesis (QMT09) addresses the general HE quality management chal-
lenges in the Ugandan context in particular and the developing countries in general. The main
limitation of this tool is exclusion of pre-higher education data and post higher education data
which are important influencing factors on HE quality issues. The minimal or lack of emphasis of
these boundary factors were inevitable due to the unavailabiliy of supporting data for meaningful
inclusion.
6.5 Future Research
In light of the outcomes of this thesis, future research is required in two areas: i) extension of
the application of SyDPAR to other participative modelling research projects and ii) further test-
ing/refinement of QMT09.
6.5.1 Challenges and Directions of use of SyDPAR
The use of SyDPAR as a generic process design for participative modelling faces challenges that
are also reflected in requirements for modelling design effectiveness. The three reasons for clients’
involvement in participative modelling: clients as identifiers of problems of interest, clients as
sources of information required in the modelling effort, and clients as implementers of modelling
results, pause new challenges to participative modelling design. They espouse the view of clients’
as contributors to modelling as well as beneficiaries from modelling involvement. These realities
should be included in the modelling design. Thus, more model building projects using the SyD-
PAR strategy are needed in order to prove its usefulness and emphasize and refine the choices
available to model builders for specific types of models (large vs. small or qualitative vs. quan-
titative). This study has provided a generic design for participative modelling, thus, the existing
knowledge encapsulated in this and other areas subsumed by participative modelling can be reused
and customised towards the creation of a formal methodology for participative system dynamics
modelling.
132
6.5.2 Further Testing and Refinement of QMT09
The quality management tool (QMT09) developed in this study proves the feasibility of system
dynamics modelling in addressing quality management concerns. However, the tool is by no
means complete in addressing the entire quality management challenges. Further refinement can
be achieved by its application to a significant number of higher education quality case studies. This
may lead to changes in the focus of the tool and to the addition and/or modification of structure
elements and selection of new policies to test. The tool in its current form emphasises institutional
quality and programme quality issues but without consideration of all the factors involved (refer to
Table 5.2 for details). Therefore extending its scope to accomodate the latter would be well served.
Equally important would be to explore the effect of pre-university training on quality of university
training as this was not included in the current tool/model given the lack of supporting data.
133
References
1. Abdullah, F. (2006). Measuring service quality in higher education: Three instruments com-
pared.International Journal of Research and Method in Education, 29(1), 7189.
2. Al-Turki, U.M., & Duffuaa, S. (2003). Performance measures for academic departments.
International Journal of Educational Management, 17(7), 330-38.
3. Andersen D.F., & Richardson G.P. (1997). Scripts for group model building.System Dy-
namics Review, 13(2), 107-129.
4. Andersen, D.F., Richardson, G.P. & Vennix, J.A.M. (1997). Group model building: adding
more science to the craft.System Dynamics Review, 13, 187-201.
5. Andersen, D.F., Vennix, JAM, Richardson, G.P., & Rouwette, EAJA. (2007). Group Model
Building: Problem Structuring, Policy Simulation and Decision Support.Journal of the
Operational Research Society, 58(5): 691-694.
6. Athiyaman, A. (1999). Linking student satisfaction and service quality perceptions: the case
of university education.European Journal of Marketing, 31 (7), 528-540.
7. Badri, M.A., & Abdulla, M.H. (2004). Awards of excellence in institutions of higher educa-
tion: an AHP approach.International Journal of Educational Management, 18 (4), 224-42.
8. Barlas, Y. (1996). Formal aspects of model validity and validation in system dynamics.
System Dynamics Review, 12 (3), 183-210.
9. Barlas, Y. (1989). Multiple tests for validations of system dynamics type of simulation
models. European Journalof Operational Research, 42 (1), 59-87.
10. Barlas, Y., & Diker, V.G. (2000). A Dynamic Simulation Game for Strategic University.
Simulation and Gaming, 31(3).
11. Barnab´e, F. (2004, July).From Ivory Towers to Learning Organizations: the Role of System
Dynamics in the ”Managerialization” of Academic Institutions. Paper presented at the 2004
International Conference of the System Dynamics Society, July 25-29, Oxford, England,
UK.
12. Baskerville, R. L. (1999). Investigating Information Systems with Action Research.Com-
munications of the Association for Information Systems Research, 2, 1-32.
134
13. Baskerville, R. (2001). Conducting Action Research: High Risk and High Reward in Theory
and Practice. In Trauth, E.M.(Ed.),Qualitative Research in IS: Issues and Trends, Idea
Group Publishing, Hershey, PA.
14. Checkland, P.B. (1981).Systems Thinking, Systems Practice. Chichester: John Wiley and
Sons
15. Chen, W., & Hirschheim, R. (2004). A paradigmatic and methodological examination of
information systems research from 1991 to 2001.Information Systems Journal, 14(3), 197-
235.
16. Cheng, Y.C. (2003). Quality assurance in education: internal, interface, and future.Quality
Assurance in Education, 11(4), 202-213
17. Cohen, M.D., March, J.G, & Olsen, J.P. (1972). A Garbage Can Model of Organizational
Choice,Administrative Science Quarterly, 17(1), 1-25.
18. Conti, T. (2002, June).A Road Map Through the Fogs of Quality and Organizational As-
sessment, The 7th World Congress for Total Quality Management, Verona.
19. Coppola, A. (1994). ISO 9000.Selected Topics in Assurance Related Technologies (START),
1(1).
20. Coyle, R.G. (2000). Qualitative and Quantitative Modelling in System Dynamics: Some
Research Questions.System Dynamics Review16(3), 225-244.
21. Cronholm, J. & Gronlund, A. (2004). The three cycles of Action Research.Accounting,
Organizations and Society, Vol. 29, pp. 135-166.
22. Csizmadia, T.G. (2006).Quality Management in Hungarian Higher Education. PhD Thesis,
University of Twente, CHEPS/UT Publishers, ISBN 90-365-2420-2.
23. Das, K. (2006). Sustainability of Higher Education in Developing Countries under Free
Market Regime.International Journal of Private Higher Education
24. Demars, C.E. (2002, June).Modeling Student Outcomes in a General Education Course
with Hierarchical Linear Models. Paper presented at the 42nd AIR (Association of Inst.
Research) Forum, June 2-5, Ontario, Canada.
135
25. Deniz, D. Z., & Ersan, I. (2001, July).Using an Academic DSS for Student, Course and
Program Assessment. Paper presented at the 2001 International Conference on Engineering
Education (ICEE’02), Oslo, Norway.
26. Deniz, D.Z., Uyguroglu, M., & Yavuz, H. (2002, July).Departmental Workload Adminis-
tration Using Group Forecasting in Universities. Paper presented at the 2002 International
Conference on Engineering Education (ICEE’02), Manchester, UK.
27. Eden, C., & Radford, J. (1990).Tackling strategic problems: the role of group decision
supportLondon: Sage
28. EFQM (2002). Self-Assessment Guidelines for European Foundation for Quality Manage-
ment, Brussels, Available at: http:/www.EFQM.org. (accessed 28th June 2008).
29. European Association for Quality Assurance in Higher Education. (2005).Standards and
guidelines for quality assurance in the European Higher Education Area. Helsinki: Euro-
pean Commission.
30. Fioretti, G. & Lomi, A. (2008). The garbage can model of organizational choice: An agent-
based reconstruction,Simulation Modelling Practice and Theory, 16, 192 - 217.
31. Fletcher, M.A., & Zuber-Skerritt, O. (2008). Professional Development through Action Re-
search: Case Examples in South African Higher Education.Syst Pract Act Res, 21, 73-96
32. Forrester, J.W. (1998).Designing the Future, (D-4726). Retrived May 21, 2005, from
http://sysdyn.clexchange.org/people/jay-forrester.html (Accessed May 2005)
33. Forrester, J.W. (1994). System Dynamics, System Thinking, and Soft OR.System Dynamics
Review, 10(2-3), 245-256
34. Forrester, J.W., & Senge, P.M. (1980). Tests for building confidence in system dynamics
models. In A.A. Legasto, J.W. Forrester & J.M. Lyneis (Eds.),System Dynamics. TIMS
Studies in the Management Sciences(pp 209-228). New York: North-Holland.
35. Forrester, J.W. (1970). Counterintuitive behavior of social systems. Collected Papers of Jay
W. Forrester. Wright- Allen Press, Cambridge, MA, pp. 21l-244.
36. Forrester, J.W. (1961).Industrial Dynamics. Portland, Oregon: Productivity Press.
136
37. Galbraith, P.L. (1998). System dynamics and university management.System Dynamics
Review, 14(1), 6984.
38. Gornitzka, A., & Maasen, P. (2000). The Economy, Higher Education, and European inte-
gration: an Introduction.Higher Education Policy, 13, 217-223
39. Grandzol, J.R. (2005). Improving the Faculty Selection Process in Higher Education: A
Case for the Analytic Hierarchy Process.Association for Institutional Research, Vol.6.
40. GroBler, A. (2007). System dynamics projects that failed to make an impact.System Dy-
namics Review, 23, 437-452.
41. GroBler, A., and Milling, P.M. (2009, July). Inductive and Deductive System Dynamics
Modelling. Proceedings of the 27th System Dynamics Conference, July 26-30, Albuquerque,
New Mexico.
42. Harvey, L. & Green, D. (1993). Defining Quality.Assessment & Evaluation in Higher
Education, 18, 9-34.
43. Hevner, A.R., March, S.T., Park, J. & Ram, S. (2004). Design science in information systems
research.MIS Quarterly, 28(1), 75-105
44. HEQC, (1995).Managing for Quality, Stories and Strategies. London: HEQC
45. Haberman, B., Lev, E. & Langley, D. (2003, June).Action Research as a Tool for Promoting
Teacher Awareness of Students’ Conceptual Understanding. Paper presented at the 2003
Innovation and Technology in Computer Science Education (ITiCSE’03) Conference, June
30-July 2, Thessaloniki, Greece
46. Higher Education Quality Council, (1995).Graduate Standards Programme Interim Report.
London: HEQC
47. Ho, W., Dey, K.P., & Higson, H.E. (2006). Multiple criteria decision-making techniques in
higher education.International Journal of Educational Management, 20(5), 319-337.
48. Ho, W., Higson, H.E., & Dey, P.K. (2007). An integrated multiple criteria decision making
approach for resource allocation in higher education.International Journal of Innovation
and Learning, 4(5), 471-486.
137
49. Huitema, D., Jeliazkova, M., & Westerheijden, D.F. (2002). Phases, levels and circles in
policy development: the cases of higher education and environmental quality assurance.
Higher Education Policy, 15, 197-215
50. Hwang, D. (2002, February).A Hierarchical Linear Modeling Approach to Higher Educa-
tion Research: The Influences of Student and Institutional Characteristics. Paper presented
at the Annual Meeting of the Southwest Educational Research Association, February 14-16,
Austin, TX,.
51. Ingram, H., Teare, R., Scheuing, E., & Armistead, C. (1997). A systems model for effective
teamwork.TQM Magazine, 9(2), 118-127.
52. IUCEA (2008).Handbook for Quality Assurance in Higher Education: Guidelines for self
assessment at program level(Vol.1). Kampala: IUCEA.
53. IUCEA (2008).Handbook for Quality Assurance in Higher Education: Guidelines for self
assessment at institutional level(Vol.3). Kampala: IUCEA.
54. IUCEA (2008).Handbook for Quality Assurance in Higher Education: The implementation
of quality assurance(Vol.4). Kampala: IUCEA.
55. Jeliazkova, M., & Westerheijden, D.F. (2002). Systemic adaptation to a changing envi-
ronment: Towards a next generation of quality assurance models.Higher Education, 44,
433-448.
56. Kaplan, R.S., & Norton, D.P. (1996).The Balanced Scorecard: Translating Strategy into
Action, Harvard Business School Press, Cambridge, MA.
57. Kasozi, A.B.K. (2003).University Education in Uganda: Challenges and Opportunities for
Reform. Kampala: Fountain Publishers.
58. Kasozi, A.B.K. (2006, June).A proposed quality assurance framework for institutions of
higher learning in Uganda. Paper presented at a Seminar on quality assurance in tertiary
education, Servres, France, 3-5 June.
59. Kennedy, M., & Clare, C. (1999, July).Some Issues in Building System Dynamics Models for
improving the Resource Management Process in Higher Education. Paper presented at the
1999 International System Dynamics Conference, July 30-23, in Wellington, New Zealand.
138
60. Kennedy, M. (2002, July).An Extended Taxonomy of System Dynamics Models of Higher
Education. Paper presented at the 2002 International Conference of the System Dynamics
Society, July 28- August 1, Palermo, Italy.
61. Kopainsky, B., & Luna-Reyes, L.F. (2008). Closing the Loop: Promoting Synergies with
Other Theory Building Approaches to Improve System Dynamics Practice.Systems Re-
search and Behavioral Science, 25, 471-486
62. Krueger, A.B. (2003). Economic Considerations and Class Size.The Economic Journal,
113, 34-63.
63. Lakatos, I. (1974). Falsification and the methodology of scientific research programmes.
In: Lakatos, I., Musgrave, A. (Eds.), Criticism and the Growth of Knowledge. Cambridge
University Press, Cambridge, pp. 191196.
64. Lane, D.C., & Oliva, R. (1998). The greater whole: Towards a synthesis of system dynamics
and soft systems methodology.European journal of operations research, 107(1), 214-235.
65. Lane D.C. (1999). Social theory and system dynamics practice.European Journal of Oper-
ations Research, 113, 501522.
66. Lau, F. (1999). Toward a framework for action research in information systems studies.
Information Technology and People, Vol. 12, pp. 148-175.
67. Lau RSM & Anderson, C.A. (1998). A Three-Dimensional perspective of TQM.Interna-
tional Journal of quality and Reliability Management, 15(1).
68. Levine, J.B. (1968).Application of the CAMPUS simulation models to the major planning
decisions of a large university. Proceedings of the second conference on Applications of
simulations, New York, United States, 317-328.
69. Lindsay, A.W. (1992). Concepts of Quality in Higher Education.Journal of Tertiary Educa-
tion Administration, 14(2), pp 153-163.
70. Luna-Reyes, L.P, Martinez-Moyano, I.J., Pardo, T.A., Cresswell, A.M., Andersen, D.F. and
Richardson, G.P. (2006). Anatomy of group model-building intervention: building dynamic
theory from case study research.System Dynamics Review, 22, 291-320.
71. Luna-Reyes, F.P., & Andersen, D.F. (2003). Collecting and Analyzing Qualitative Data for
System Dynamics: Methods and Models.System Dynamics Review, 19(4), 271-296
139
72. Lynham S.A. (2002). The general method of theory building research in applied disciplines.
Advances in Developing Human Resources4(3), 221241.
73. Makerere University Quality Assurance Framework, 2006.
74. Maltz, E.N., Murphy, K.E., & Michael, L.H. (2007). Decision support for university enroll-
ment management: Implementation and experience.Decision Support Systems, 44, 106123
75. March, S.T., & Smith, G.F. (1995). Design and Natural Science Research on Information
Technology.Decision Support Systems15(4), 251-266.
76. Martinez I.J, & Richardson G.P. (2001, July).Best practices in system dynamics modelling.
Proceedings of the 19th International Conference of System Dynamics society, Atlanta,
Georgia.
77. Mass N.J. (1986). Methods of conceptualization.System Dynamics Review, 2: 76-80.
78. Materu, P. (2007).Higher education quality assurance in Sub-Saharan Africa : status, chal-
lenges,opportunities and promising practices. Washington D.C.: The World Bank, ISBN
978-0-8213-7272-2.
79. Meadows, D. (1989). Gaming to Implement System Dynamics Models. In P., Milling
& E.O.K., Zahn (Eds.),Computer-Based Management of Complex Systems, Springer Ver-
lag:Berlin
80. Morgan, D.L. (2007). Paradigms Lost and Pragmatism Regained Methodological Implica-
tions of Combining Qualitative and Quantitative Methods,Journal of Mixed Methods Re-
search, 1(1), 48-76.
81. Musisi, N.B., & Muwanga, N.K. (2003).Makerere University in Transition 19932000: Op-
portunities & Challenges. Kampala: Fountain Publishers.
82. Myers, M., & Avison, D. (2002). An introduction to qualitative research in information
systems. In M. Myers & D. Avison (Eds.), Qualitative research in information systems,
London: SAGE.
83. Nandhakumar, J., & Avison, D. (1999). The fiction of methodological development: a field
study of information systems.Information Technology & People, 12(2), 176-191.
140
84. NCHE: National Council for Higher Education (2006).The State of Higher Education and
Training in Uganda. Kampala: NCHE.
85. NIST (2004).Education Criteria for Performance Excellence. Malcolm Baldridge National
Quality Program. National Institute of Standards and Technology-United States. Retrieved
November 16, 2008, from http://www.quality.nist.gov/PDFfiles/2004EducationCriteria.pdf
86. Orlikowski, W.J., & Baroudi, J.J. (1991). Studying Information Technology in Organiza-
tions: Research Approaches and Assumptions,Information Systems Research, 2, 1-28.
87. Papenhausen, C., & Einstein, W. (2006). Insights from the Balanced Scorecard: Implement-
ing the Balanced Scorecard at a college of business.Measuring Business Excellence, 10 (3),
15-22.
88. Paucar-Caceres, A., & Rodriguez-Ulloa, R. (2007). An application of Soft Systems Dynam-
ics Methodology (SSDM).Journal of the Operational Research Society, 58, 701-713
89. Parker, L.D. (2002). It’s been a pleasure doing business with you: a strategic analysis and
critique of university change management.Critical Perspective on Accounting, 13(5-6),
603-619.
90. Popper, K.R. (2002).The Logic of Scientific Discovery. London: Routledge
91. Richardson, G.P., & Pugh,A.L (1981).Introduction to System Dynamics Modeling with
DYNAMO. Productivity Press: Cambridge, MA.
92. Ritchie-Dunham, J.L., & Rabbino, H.T. (2001).Managing from Clarity. Ideintifying, align-
ing and leveraging strategic resources. New York: John Wiley & Sons.
93. Robey, D. (1996). Diversity in information systems research: Threat, promise, and respon-
sibility. Information Systems Research, 7(4), 400-408.
94. Rouwette, E.A.J.A, Vennix, J.A.M., & Mullekom, T.v. (2002). Group model effectiveness:
A review of assessment studies.System Dynamics Review, 18, 5-45.
95. Rouwette, E.A.J.A. (2003).Group Model Building as Mutual Persuasion. PhD Dissertation,
Radboud University Nijmegen, Nijmegen: Wolf Legal Publishers.
96. Rouwette, E.A.J.A. & Vennix, J.A.M (2006). System Dynamics and Organisational Inter-
ventions.Systems Research and Behavioral Science, 23, 51-466
141
97. Rouwette, E. A. J. A., & Hoppenbrouwers, S. (2008, July).Collaborative systems modeling
and group model building: a useful combination?Paper presented at the 2008 System
Dynamics Conference, July 20-24 2008, Athens Greece, ISBN 978-0-935056-01-0.
98. Rwashana, A.S. (2008).An Application of System Dynamics Modelling to Immunization
Policy Analysis. Un published PhD Thesis, Makerere University.
99. Schray, V. (2006).Assuring quality in higher education: Recommendations for improving
accreditation. Issue paper released by Secretary of Education’s Commission on the future
of higher education, Washington DC: U.S. Department of Education.
100. Scholl, H.J. (2004, January).Action Research and System Dynamics: Can they benefit from
each other?, Paper presented at the 2004 Hawaiian Internal Conference on System Sciences,
Waikoloa, Hawaii,
101. Schwaninger, M. & Grosser, S. (2008). System Dynamics as Model-Based Theory Building.
Systems Research and Behavioral Science, 25, 447-465
102. Senge, P.M., Cambron-McCabe, N., Lucas, T., Smith, B.J., Dutton, J., & Kleiner, A. (2000).
Schools that Learn. London: Nicholas Brealey.
103. Shawyun, T. (2006). Quality Assurance and Strategic Implementation in educational insti-
tutions: A Holistic Alliance?ASAIHL-THAILAND Journal, 11(2),420-435
104. Snabe, B. & GroBler, A. (2006). System Dynamics Modelling for Strategy Implementation-
Concept and Case Study.Systems Research and Behavioral Science, 23(4), 467-481.
105. Srikanthan, G., & Dalrymple, J.F. (2007). A conceptual overview of a holistic model for
quality in higher education.International Journal of Educational Management, 21(3), 173-
193.
106. Stenberg, L. (1980). A modeling procedure for public policy. In J. Randers (ed.).Elements
of the System Dynamics Method. Cambridge, MA: Productivity Press: 292-312.
107. Sterman, J.D. (2000).Business Dynamics. Systems Thinking and Modeling for a Complex
World. Irwin McGraw-Hill.
108. Sterman J.D. (2002). All models are wrong: reflections on becoming a systems scientist.
System Dynamics Review18(4), 501531.
142
109. Strong D.R. & Eftekhar, N. (1998). Dynamic Modeling of a Learning Process. Retrieved
November 19, 2006, from http://www.ijee.dit.ie/articles/999995/article.htm.
110. Schwaninger, M. (2006). The evolution of organizational cybernetics.Scientiae Mathemat-
icae Japonicae, 64(2), 405420.
111. Tam, M. (2001). Measuring quality and performance in higher education.Quality in Higher
Education, 7(1), 47-54.
112. Telford, R., & Masson, R. (2005). The congruence of quality values in higher education.
Quality Assurance in Education, 13(2), 107-119
113. Tavenas, F. (2004).Quality assurance: A reference system for indicators and evaluation
procedures. EUA report, Retrieved June 6, 2006, from http://www.eua.be.
114. Temponi, C. (2005). Continuous improvement framework: implications for academia.Qual-
ity Assurance in Education, 13(1), 17-36
115. Tulinayo, P.F, Hoppenbrouwers, S.J.B.A., and Proper, H.A.E. (2008). Integrating System
Dynamics with Object-Role Modeling. IFIP International Federation for Information Pro-
cessing, in Stirna, J. and A. Persson (Eds.): PoEM, LNBIP 15: 77-85
116. Try, S. & Grogaard, J.B. (2003).Measuring the Relationship Between Resources and Out-
comes in Higher Education in Norway. NIFU skriftserie nr. 27/2003, ISSN 08708-4572.
117. Umashankar, V., & Dutta, K. (2007). Balanced scorecards in managing higher education in-
stitutions: an Indian perspective.International Journal of Educational Management, 21(1),
54-67.
118. UNESCO Report (2002). Global Forum for quality assurance in higher education. Retrieved
June 16, 2006, from www.unesco.org/education/studyingabroad/highlights/globalforum main.shtml.
119. Vahdatzad, M.A., & Mojtahedzadeh, M.T. (2000, August).Some issues in the strategic
management in a fast growing academic Institution: The case of University of Yazd. Paper
presented at 18th International Conference of the System Dynamics Society, August 6 - 10,
Bergen, Norway.
120. Van Waveren, C.C. (2004).An implementation framework for a quality management sys-
tem in an academic department at a tertiary educational institution, Proceedings of the 7th
143
Africon conference in Africa, 15-17 September 2004, Gaborone, Botswana. ISBN 0-7803-
8605-1.
121. Vazquez, M., Liz, M., & Aracil, J. (1996). Knowledge and reality: some conceptual issues
in the system dynamics modelling,System Dynamics Review, 12(1), 21-37.
122. Vennix, J.A.M (1996).Group model building: facilitating team learning using system dy-
namics. Chichester, New York: J. Wiley
123. Vennix, J.A.M (1999). Group model-building: Tackling messy problems.System Dynamics
Review, 15, 379-401.
124. Vinnik, S., & Scholl, M.H. (2005, July). it UNICAP: Efficient Decision Support for Aca-
demic Resource and Capacity Management. Paper presented at the 2005 TED Conference
on e-Government (TCGOV2005), Bozen-Bolzano, Italy.
125. Wabwire, W.J.K. (2007). Makerere University: Towards 2017 Strategic Choices. A Policy
Report for Makerere University.
126. Warren, K. (2004). Why Has Feedback Systems Thinking Struggled to Influence Strategy
and Policy Formulation? Suggestive Evidence, Explanations and Solutions.Systems Re-
search and Behavioral Science, 21, 331-347
127. Watty, K. (2003). When will Academics Learn about Quality?Quality in Higher Education,
9(3).
128. Welsh, J.F., & Dey, S. (2002). Quality measurement and quality assurance in higher educa-
tion. Quality Assurance in Education, 10(1), 17-25
129. Whyte, W.F. (1991).Participatory Action Research. Sage Publications: Newbury Park,
California.
130. Williams, R. & Van Dyke, N. (2007). Measuring the international standing of universities
with an application to Australian universities,Higher Education, 53, 819841.
131. Williams, D. (2004, April). Dynamic Synthesis Methodology. A Theoretical Framework
for research in The Requirements Process Modelling and Analysis. Paper presented at the
2004 European Conference on Research Methods for Business and Management Studies,
Cambridge, UK, 467-490. ISBN: 0-9540488-3-0.
144
132. Williams, D. (2003, July).Challenges of System Dynamics to Deliver Requirements Engi-
neering Projects: faster, better and cheaper. Paper presented at the 2003 System Dynamics
Conference, July 20 - 24, New York.
133. Williams, D. (2002). An Application of System Dynamics to Requirements Engineering
Process Modelling. Un published PhD, London South Bank University
134. World Bank Task Force on Higher Education and Society (2000).Higher Education in
Developing Countries: Peril and Promise. Naylor Design, Inc: Washington DC
135. Zagonel, A.A. (2002, July).Model conceptualization in group model building: A review
of the literature exploring the tension between representing reality and negotiating a social
order. Paper presented at the 2002 International System Dynamics Conference, Palermo,
Italy.
136. Zock, A. (2004).A critical review of the use of system dynamics for organizational consulta-
tion projects. Paper presented at the 2004 International Conference of the System Dynamics
Society, Oxford, UK.
145
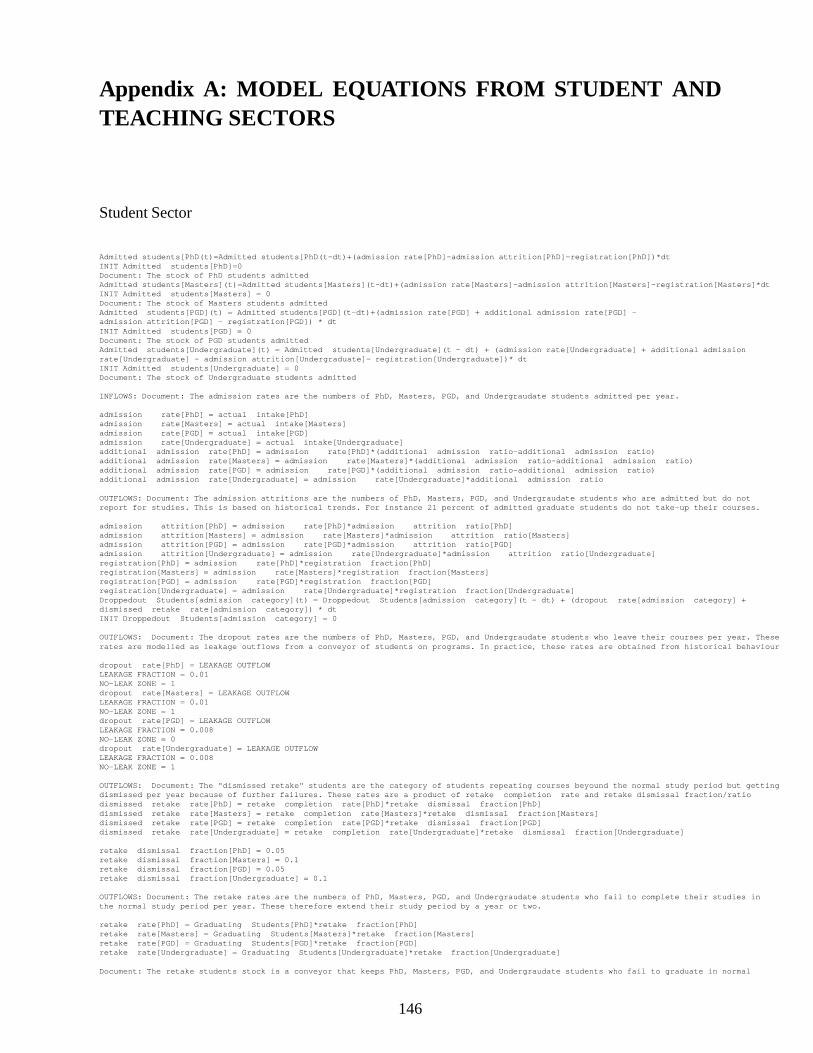
Appendix A: MODEL EQUATIONS FROM STUDENT ANDTEACHING SECTORS
Student Sector
Admitted students[PhD(t)=Admitted students[PhD(t-dt)+(admission rate[PhD]-admission attrition[PhD]-registration[PhD])*dtINIT Admitted students[PhD]=0Document: The stock of PhD students admittedAdmitted students[Masters](t)=Admitted students[Masters](t-dt)+(admission rate[Masters]-admission attrition[Masters]-registration[Masters]*dtINIT Admitted students[Masters] = 0Document: The stock of Masters students admittedAdmitted students[PGD](t) = Admitted students[PGD](t-dt)+(admission rate[PGD] + additional admission rate[PGD] -admission attrition[PGD] - registration[PGD]) * dtINIT Admitted students[PGD] = 0Document: The stock of PGD students admittedAdmitted students[Undergraduate](t) = Admitted students[Undergraduate](t - dt) + (admission rate[Undergraduate] + additional admissionrate[Undergraduate] - admission attrition[Undergraduate]- registration[Undergraduate])* dtINIT Admitted students[Undergraduate] = 0Document: The stock of Undergraduate students admitted
INFLOWS: Document: The admission rates are the numbers of PhD, Masters, PGD, and Undergraudate students admitted per year.
admission rate[PhD] = actual intake[PhD]admission rate[Masters] = actual intake[Masters]admission rate[PGD] = actual intake[PGD]admission rate[Undergraduate] = actual intake[Undergraduate]additional admission rate[PhD] = admission rate[PhD]*(additional admission ratio-additional admission ratio)additional admission rate[Masters] = admission rate[Masters]*(additional admission ratio-additional admission ratio)additional admission rate[PGD] = admission rate[PGD]*(additional admission ratio-additional admission ratio)additional admission rate[Undergraduate] = admission rate[Undergraduate]*additional admission ratio
OUTFLOWS: Document: The admission attritions are the numbers of PhD, Masters, PGD, and Undergraudate students who are admitted but do notreport for studies. This is based on historical trends. For instance 21 percent of admitted graduate students do not take-up their courses.
admission attrition[PhD] = admission rate[PhD]*admission attrition ratio[PhD]admission attrition[Masters] = admission rate[Masters]*admission attrition ratio[Masters]admission attrition[PGD] = admission rate[PGD]*admission attrition ratio[PGD]admission attrition[Undergraduate] = admission rate[Undergraduate]*admission attrition ratio[Undergraduate]registration[PhD] = admission rate[PhD]*registration fraction[PhD]registration[Masters] = admission rate[Masters]*registration fraction[Masters]registration[PGD] = admission rate[PGD]*registration fraction[PGD]registration[Undergraduate] = admission rate[Undergraduate]*registration fraction[Undergraduate]Droppedout Students[admission category](t) = Droppedout Students[admission category](t - dt) + (dropout rate[admission category] +dismissed retake rate[admission category]) * dtINIT Droppedout Students[admission category] = 0
OUTFLOWS: Document: The dropout rates are the numbers of PhD, Masters, PGD, and Undergraudate students who leave their courses per year. Theserates are modelled as leakage outflows from a conveyor of students on programs. In practice, these rates are obtained from historical behaviour
dropout rate[PhD] = LEAKAGE OUTFLOWLEAKAGE FRACTION = 0.01NO-LEAK ZONE = 1dropout rate[Masters] = LEAKAGE OUTFLOWLEAKAGE FRACTION = 0.01NO-LEAK ZONE = 1dropout rate[PGD] = LEAKAGE OUTFLOWLEAKAGE FRACTION = 0.008NO-LEAK ZONE = 0dropout rate[Undergraduate] = LEAKAGE OUTFLOWLEAKAGE FRACTION = 0.008NO-LEAK ZONE = 1
OUTFLOWS: Document: The "dismissed retake" students are the category of students repeating courses beyound the normal study period but gettingdismissed per year because of further failures. These rates are a product of retake completion rate and retake dismissal fraction/ratiodismissed retake rate[PhD] = retake completion rate[PhD]*retake dismissal fraction[PhD]dismissed retake rate[Masters] = retake completion rate[Masters]*retake dismissal fraction[Masters]dismissed retake rate[PGD] = retake completion rate[PGD]*retake dismissal fraction[PGD]dismissed retake rate[Undergraduate] = retake completion rate[Undergraduate]*retake dismissal fraction[Undergraduate]
retake dismissal fraction[PhD] = 0.05retake dismissal fraction[Masters] = 0.1retake dismissal fraction[PGD] = 0.05retake dismissal fraction[Undergraduate] = 0.1
OUTFLOWS: Document: The retake rates are the numbers of PhD, Masters, PGD, and Undergraudate students who fail to complete their studies inthe normal study period per year. These therefore extend their study period by a year or two.
retake rate[PhD] = Graduating Students[PhD]*retake fraction[PhD]retake rate[Masters] = Graduating Students[Masters]*retake fraction[Masters]retake rate[PGD] = Graduating Students[PGD]*retake fraction[PGD]retake rate[Undergraduate] = Graduating Students[Undergraduate]*retake fraction[Undergraduate]
Document: The retake students stock is a conveyor that keeps PhD, Masters, PGD, and Undergraudate students who fail to graduate in normal
146
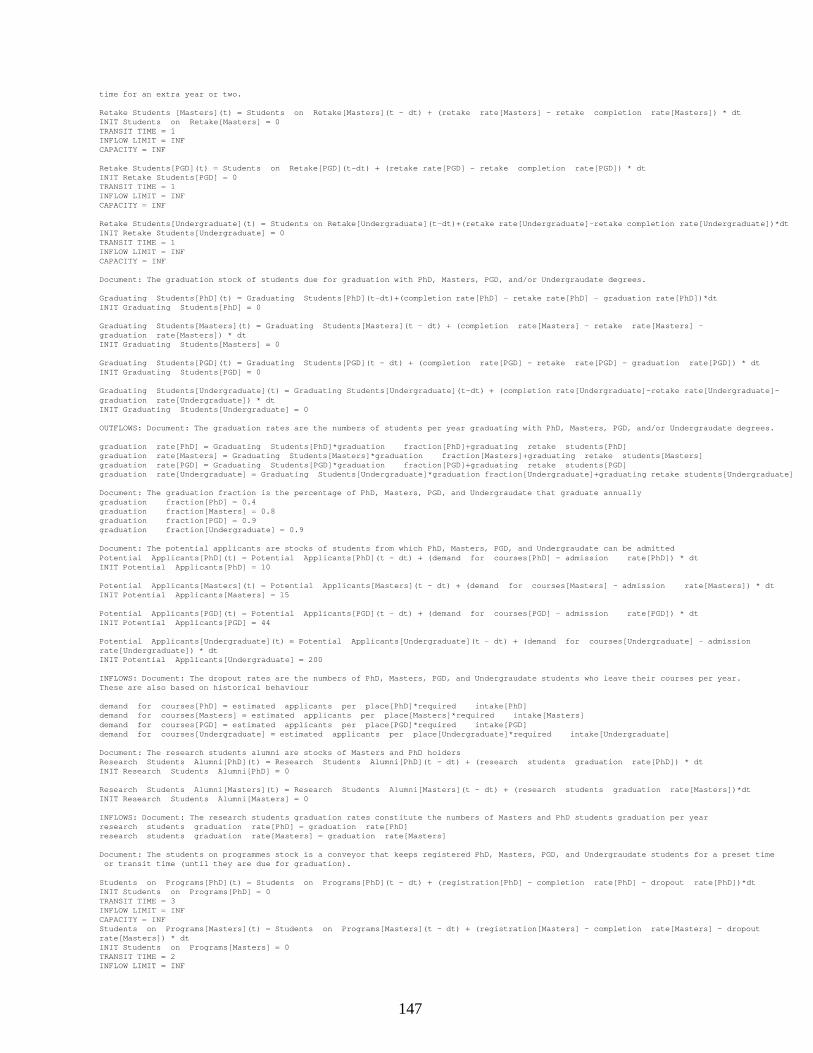
time for an extra year or two.
Retake Students [Masters](t) = Students on Retake[Masters](t - dt) + (retake rate[Masters] - retake completion rate[Masters]) * dtINIT Students on Retake[Masters] = 0TRANSIT TIME = 1INFLOW LIMIT = INFCAPACITY = INF
Retake Students[PGD](t) = Students on Retake[PGD](t-dt) + (retake rate[PGD] - retake completion rate[PGD]) * dtINIT Retake Students[PGD] = 0TRANSIT TIME = 1INFLOW LIMIT = INFCAPACITY = INF
Retake Students[Undergraduate](t) = Students on Retake[Undergraduate](t-dt)+(retake rate[Undergraduate]-retake completion rate[Undergraduate])*dtINIT Retake Students[Undergraduate] = 0TRANSIT TIME = 1INFLOW LIMIT = INFCAPACITY = INF
Document: The graduation stock of students due for graduation with PhD, Masters, PGD, and/or Undergraudate degrees.
Graduating Students[PhD](t) = Graduating Students[PhD](t-dt)+(completion rate[PhD] - retake rate[PhD] - graduation rate[PhD])*dtINIT Graduating Students[PhD] = 0
Graduating Students[Masters](t) = Graduating Students[Masters](t - dt) + (completion rate[Masters] - retake rate[Masters] -graduation rate[Masters]) * dtINIT Graduating Students[Masters] = 0
Graduating Students[PGD](t) = Graduating Students[PGD](t - dt) + (completion rate[PGD] - retake rate[PGD] - graduation rate[PGD]) * dtINIT Graduating Students[PGD] = 0
Graduating Students[Undergraduate](t) = Graduating Students[Undergraduate](t-dt) + (completion rate[Undergraduate]-retake rate[Undergraduate]-graduation rate[Undergraduate]) * dtINIT Graduating Students[Undergraduate] = 0
OUTFLOWS: Document: The graduation rates are the numbers of students per year graduating with PhD, Masters, PGD, and/or Undergraudate degrees.
graduation rate[PhD] = Graduating Students[PhD]*graduation fraction[PhD]+graduating retake students[PhD]graduation rate[Masters] = Graduating Students[Masters]*graduation fraction[Masters]+graduating retake students[Masters]graduation rate[PGD] = Graduating Students[PGD]*graduation fraction[PGD]+graduating retake students[PGD]graduation rate[Undergraduate] = Graduating Students[Undergraduate]*graduation fraction[Undergraduate]+graduating retake students[Undergraduate]
Document: The graduation fraction is the percentage of PhD, Masters, PGD, and Undergraudate that graduate annuallygraduation fraction[PhD] = 0.4graduation fraction[Masters] = 0.8graduation fraction[PGD] = 0.9graduation fraction[Undergraduate] = 0.9
Document: The potential applicants are stocks of students from which PhD, Masters, PGD, and Undergraudate can be admittedPotential Applicants[PhD](t) = Potential Applicants[PhD](t - dt) + (demand for courses[PhD] - admission rate[PhD]) * dtINIT Potential Applicants[PhD] = 10
Potential Applicants[Masters](t) = Potential Applicants[Masters](t - dt) + (demand for courses[Masters] - admission rate[Masters]) * dtINIT Potential Applicants[Masters] = 15
Potential Applicants[PGD](t) = Potential Applicants[PGD](t - dt) + (demand for courses[PGD] - admission rate[PGD]) * dtINIT Potential Applicants[PGD] = 44
Potential Applicants[Undergraduate](t) = Potential Applicants[Undergraduate](t - dt) + (demand for courses[Undergraduate] - admissionrate[Undergraduate]) * dtINIT Potential Applicants[Undergraduate] = 200
INFLOWS: Document: The dropout rates are the numbers of PhD, Masters, PGD, and Undergraudate students who leave their courses per year.These are also based on historical behaviour
demand for courses[PhD] = estimated applicants per place[PhD]*required intake[PhD]demand for courses[Masters] = estimated applicants per place[Masters]*required intake[Masters]demand for courses[PGD] = estimated applicants per place[PGD]*required intake[PGD]demand for courses[Undergraduate] = estimated applicants per place[Undergraduate]*required intake[Undergraduate]
Document: The research students alumni are stocks of Masters and PhD holdersResearch Students Alumni[PhD](t) = Research Students Alumni[PhD](t - dt) + (research students graduation rate[PhD]) * dtINIT Research Students Alumni[PhD] = 0
Research Students Alumni[Masters](t) = Research Students Alumni[Masters](t - dt) + (research students graduation rate[Masters])*dtINIT Research Students Alumni[Masters] = 0
INFLOWS: Document: The research students graduation rates constitute the numbers of Masters and PhD students graduation per yearresearch students graduation rate[PhD] = graduation rate[PhD]research students graduation rate[Masters] = graduation rate[Masters]
Document: The students on programmes stock is a conveyor that keeps registered PhD, Masters, PGD, and Undergraudate students for a preset timeor transit time (until they are due for graduation).
Students on Programs[PhD](t) = Students on Programs[PhD](t - dt) + (registration[PhD] - completion rate[PhD] - dropout rate[PhD])*dtINIT Students on Programs[PhD] = 0TRANSIT TIME = 3INFLOW LIMIT = INFCAPACITY = INFStudents on Programs[Masters](t) = Students on Programs[Masters](t - dt) + (registration[Masters] - completion rate[Masters] - dropoutrate[Masters]) * dtINIT Students on Programs[Masters] = 0TRANSIT TIME = 2INFLOW LIMIT = INF
147
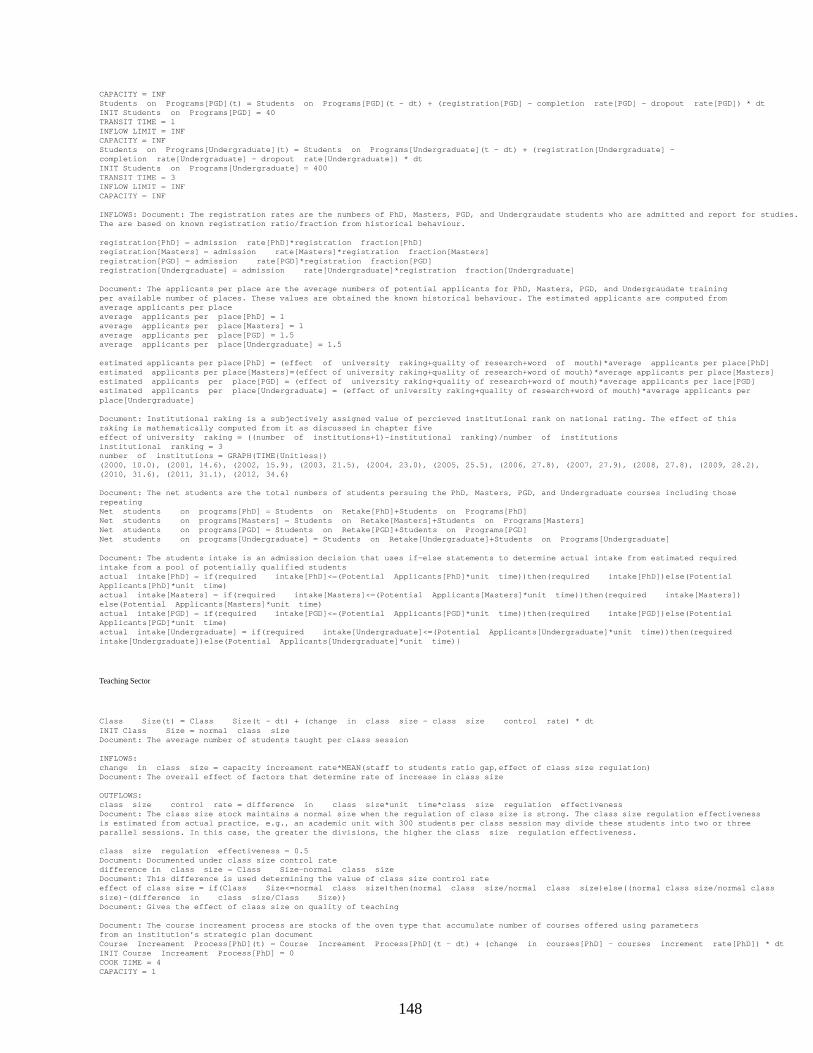
CAPACITY = INFStudents on Programs[PGD](t) = Students on Programs[PGD](t - dt) + (registration[PGD] - completion rate[PGD] - dropout rate[PGD]) * dtINIT Students on Programs[PGD] = 40TRANSIT TIME = 1INFLOW LIMIT = INFCAPACITY = INFStudents on Programs[Undergraduate](t) = Students on Programs[Undergraduate](t - dt) + (registration[Undergraduate] -completion rate[Undergraduate] - dropout rate[Undergraduate]) * dtINIT Students on Programs[Undergraduate] = 400TRANSIT TIME = 3INFLOW LIMIT = INFCAPACITY = INF
INFLOWS: Document: The registration rates are the numbers of PhD, Masters, PGD, and Undergraudate students who are admitted and report for studies.The are based on known registration ratio/fraction from historical behaviour.
registration[PhD] = admission rate[PhD]*registration fraction[PhD]registration[Masters] = admission rate[Masters]*registration fraction[Masters]registration[PGD] = admission rate[PGD]*registration fraction[PGD]registration[Undergraduate] = admission rate[Undergraduate]*registration fraction[Undergraduate]
Document: The applicants per place are the average numbers of potential applicants for PhD, Masters, PGD, and Undergraudate trainingper available number of places. These values are obtained the known historical behaviour. The estimated applicants are computed fromaverage applicants per placeaverage applicants per place[PhD] = 1average applicants per place[Masters] = 1average applicants per place[PGD] = 1.5average applicants per place[Undergraduate] = 1.5
estimated applicants per place[PhD] = (effect of university raking+quality of research+word of mouth)*average applicants per place[PhD]estimated applicants per place[Masters]=(effect of university raking+quality of research+word of mouth)*average applicants per place[Masters]estimated applicants per place[PGD] = (effect of university raking+quality of research+word of mouth)*average applicants per lace[PGD]estimated applicants per place[Undergraduate] = (effect of university raking+quality of research+word of mouth)*average applicants perplace[Undergraduate]
Document: Institutional raking is a subjectively assigned value of percieved institutional rank on national rating. The effect of thisraking is mathematically computed from it as discussed in chapter fiveeffect of university raking = ((number of institutions+1)-institutional ranking)/number of institutionsinstitutional ranking = 3number of institutions = GRAPH(TIME{Unitless})(2000, 10.0), (2001, 14.6), (2002, 15.9), (2003, 21.5), (2004, 23.0), (2005, 25.5), (2006, 27.8), (2007, 27.9), (2008, 27.8), (2009, 28.2),(2010, 31.6), (2011, 31.1), (2012, 34.6)
Document: The net students are the total numbers of students persuing the PhD, Masters, PGD, and Undergraduate courses including thoserepeatingNet students on programs[PhD] = Students on Retake[PhD]+Students on Programs[PhD]Net students on programs[Masters] = Students on Retake[Masters]+Students on Programs[Masters]Net students on programs[PGD] = Students on Retake[PGD]+Students on Programs[PGD]Net students on programs[Undergraduate] = Students on Retake[Undergraduate]+Students on Programs[Undergraduate]
Document: The students intake is an admission decision that uses if-else statements to determine actual intake from estimated requiredintake from a pool of potentially qualified studentsactual intake[PhD] = if(required intake[PhD]<=(Potential Applicants[PhD]*unit time))then(required intake[PhD])else(PotentialApplicants[PhD]*unit time)actual intake[Masters] = if(required intake[Masters]<=(Potential Applicants[Masters]*unit time))then(required intake[Masters])else(Potential Applicants[Masters]*unit time)actual intake[PGD] = if(required intake[PGD]<=(Potential Applicants[PGD]*unit time))then(required intake[PGD])else(PotentialApplicants[PGD]*unit time)actual intake[Undergraduate] = if(required intake[Undergraduate]<=(Potential Applicants[Undergraduate]*unit time))then(requiredintake[Undergraduate])else(Potential Applicants[Undergraduate]*unit time)}
Teaching Sector
Class Size(t) = Class Size(t - dt) + (change in class size - class size control rate) * dtINIT Class Size = normal class sizeDocument: The average number of students taught per class session
INFLOWS:change in class size = capacity increament rate*MEAN(staff to students ratio gap,effect of class size regulation)Document: The overall effect of factors that determine rate of increase in class size
OUTFLOWS:class size control rate = difference in class size*unit time*class size regulation effectivenessDocument: The class size stock maintains a normal size when the regulation of class size is strong. The class size regulation effectivenessis estimated from actual practice, e.g., an academic unit with 300 students per class session may divide these students into two or threeparallel sessions. In this case, the greater the divisions, the higher the class size regulation effectiveness.
class size regulation effectiveness = 0.5Document: Documented under class size control ratedifference in class size = Class Size-normal class sizeDocument: This difference is used determining the value of class size control rateeffect of class size = if(Class Size<=normal class size)then(normal class size/normal class size)else((normal class size/normal classsize)-(difference in class size/Class Size))Document: Gives the effect of class size on quality of teaching
Document: The course increament process are stocks of the oven type that accumulate number of courses offered using parametersfrom an institution’s strategic plan documentCourse Increament Process[PhD](t) = Course Increament Process[PhD](t - dt) + (change in courses[PhD] - courses increment rate[PhD]) * dtINIT Course Increament Process[PhD] = 0COOK TIME = 4CAPACITY = 1
148
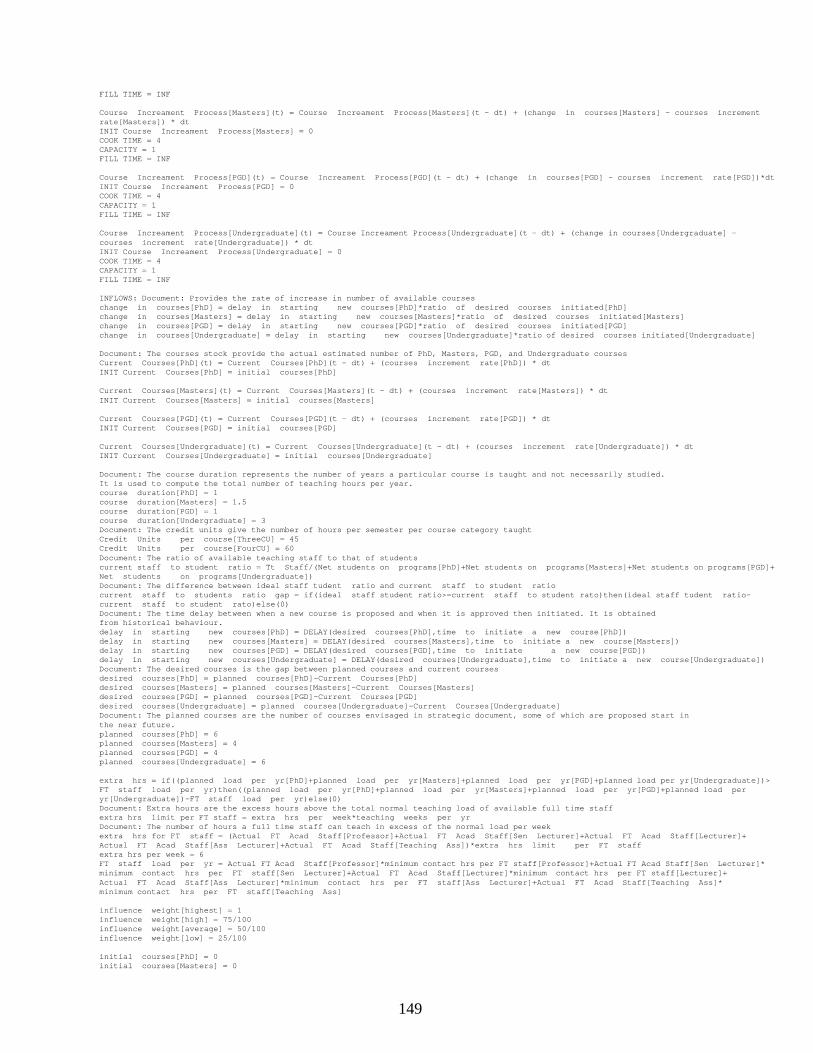
FILL TIME = INF
Course Increament Process[Masters](t) = Course Increament Process[Masters](t - dt) + (change in courses[Masters] - courses incrementrate[Masters]) * dtINIT Course Increament Process[Masters] = 0COOK TIME = 4CAPACITY = 1FILL TIME = INF
Course Increament Process[PGD](t) = Course Increament Process[PGD](t - dt) + (change in courses[PGD] - courses increment rate[PGD])*dtINIT Course Increament Process[PGD] = 0COOK TIME = 4CAPACITY = 1FILL TIME = INF
Course Increament Process[Undergraduate](t) = Course Increament Process[Undergraduate](t - dt) + (change in courses[Undergraduate] -courses increment rate[Undergraduate]) * dtINIT Course Increament Process[Undergraduate] = 0COOKTIME = 4CAPACITY = 1FILL TIME = INF
INFLOWS: Document: Provides the rate of increase in number of available courseschange in courses[PhD] = delay in starting new courses[PhD]*ratio of desired courses initiated[PhD]change in courses[Masters] = delay in starting new courses[Masters]*ratio of desired courses initiated[Masters]change in courses[PGD] = delay in starting new courses[PGD]*ratio of desired courses initiated[PGD]change in courses[Undergraduate] = delay in starting new courses[Undergraduate]*ratio of desired courses initiated[Undergraduate]
Document: The courses stock provide the actual estimated number of PhD, Masters, PGD, and Undergraduate coursesCurrent Courses[PhD](t) = Current Courses[PhD](t - dt) + (courses increment rate[PhD]) * dtINIT Current Courses[PhD] = initial courses[PhD]
Current Courses[Masters](t) = Current Courses[Masters](t - dt) + (courses increment rate[Masters]) * dtINIT Current Courses[Masters] = initial courses[Masters]
Current Courses[PGD](t) = Current Courses[PGD](t - dt) + (courses increment rate[PGD]) * dtINIT Current Courses[PGD] = initial courses[PGD]
Current Courses[Undergraduate](t) = Current Courses[Undergraduate](t - dt) + (courses increment rate[Undergraduate]) * dtINIT Current Courses[Undergraduate] = initial courses[Undergraduate]
Document: The course duration represents the number of years a particular course is taught and not necessarily studied.It is used to compute the total number of teaching hours per year.course duration[PhD] = 1course duration[Masters] = 1.5course duration[PGD] = 1course duration[Undergraduate] = 3Document: The credit units give the number of hours per semester per course category taughtCredit Units per course[ThreeCU] = 45Credit Units per course[FourCU] = 60Document: The ratio of available teaching staff to that of studentscurrent staff to student ratio = Tt Staff/(Net students on programs[PhD]+Net students on programs[Masters]+Net students on programs[PGD]+Net students on programs[Undergraduate])Document: The difference between ideal staff tudent ratio and current staff to student ratiocurrent staff to students ratio gap = if(ideal staff student ratio>=current staff to student rato)then(ideal staff tudent ratio-current staff to student rato)else(0)Document: The time delay between when a new course is proposed and when it is approved then initiated. It is obtainedfrom historical behaviour.delay in starting new courses[PhD] = DELAY(desired courses[PhD],time to initiate a new course[PhD])delay in starting new courses[Masters] = DELAY(desired courses[Masters],time to initiate a new course[Masters])delay in starting new courses[PGD] = DELAY(desired courses[PGD],time to initiate a new course[PGD])delay in starting new courses[Undergraduate] = DELAY(desired courses[Undergraduate],time to initiate a new course[Undergraduate])Document: The desired courses is the gap between planned courses and current coursesdesired courses[PhD] = planned courses[PhD]-Current Courses[PhD]desired courses[Masters] = planned courses[Masters]-Current Courses[Masters]desired courses[PGD] = planned courses[PGD]-Current Courses[PGD]desired courses[Undergraduate] = planned courses[Undergraduate]-Current Courses[Undergraduate]Document: The planned courses are the number of courses envisaged in strategic document, some of which are proposed start inthe near future.planned courses[PhD] = 6planned courses[Masters] = 4planned courses[PGD] = 4planned courses[Undergraduate] = 6
extra hrs = if((planned load per yr[PhD]+planned load per yr[Masters]+planned load per yr[PGD]+planned load per yr[Undergraduate])>FT staff load per yr)then((planned load per yr[PhD]+planned load per yr[Masters]+planned load per yr[PGD]+planned load peryr[Undergraduate])-FT staff load per yr)else(0)Document: Extra hours are the excess hours above the total normal teaching load of available full time staffextra hrs limit per FT staff = extra hrs per week*teaching weeks per yrDocument: The number of hours a full time staff can teach in excess of the normal load per weekextra hrs for FT staff = (Actual FT Acad Staff[Professor]+Actual FT Acad Staff[Sen Lecturer]+Actual FT Acad Staff[Lecturer]+Actual FT Acad Staff[Ass Lecturer]+Actual FT Acad Staff[Teaching Ass])*extra hrs limit per FT staffextra hrs per week = 6FT staff load per yr = Actual FT Acad Staff[Professor]*minimum contact hrs per FT staff[Professor]+Actual FT Acad Staff[Sen Lecturer]*minimum contact hrs per FT staff[Sen Lecturer]+Actual FT Acad Staff[Lecturer]*minimum contact hrs per FT staff[Lecturer]+Actual FT Acad Staff[Ass Lecturer]*minimum contact hrs per FT staff[Ass Lecturer]+Actual FT Acad Staff[Teaching Ass]*minimum contact hrs per FT staff[Teaching Ass]
influence weight[highest] = 1influence weight[high] = 75/100influence weight[average] = 50/100influence weight[low] = 25/100
initial courses[PhD] = 0initial courses[Masters] = 0
149
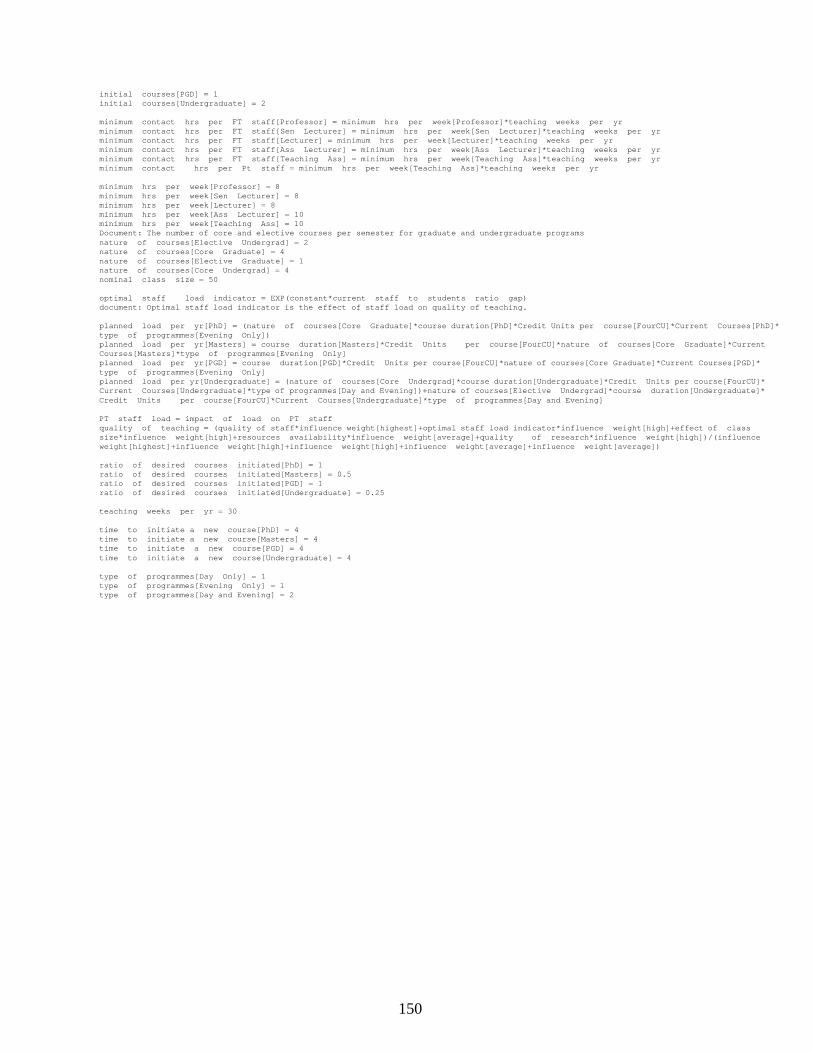
initial courses[PGD] = 1initial courses[Undergraduate] = 2
minimum contact hrs per FT staff[Professor] = minimum hrs per week[Professor]*teaching weeks per yrminimum contact hrs per FT staff[Sen Lecturer] = minimum hrs per week[Sen Lecturer]*teaching weeks per yrminimum contact hrs per FT staff[Lecturer] = minimum hrs per week[Lecturer]*teaching weeks per yrminimum contact hrs per FT staff[Ass Lecturer] = minimum hrs per week[Ass Lecturer]*teaching weeks per yrminimum contact hrs per FT staff[Teaching Ass] = minimum hrs per week[Teaching Ass]*teaching weeks per yrminimum contact hrs per Pt staff = minimum hrs per week[Teaching Ass]*teaching weeks per yr
minimum hrs per week[Professor] = 8minimum hrs per week[Sen Lecturer] = 8minimum hrs per week[Lecturer] = 8minimum hrs per week[Ass Lecturer] = 10minimum hrs per week[Teaching Ass] = 10Document: The number of core and elective courses per semester for graduate and undergraduate programsnature of courses[Elective Undergrad] = 2nature of courses[Core Graduate] = 4nature of courses[Elective Graduate] = 1nature of courses[Core Undergrad] = 4nominal class size = 50
optimal staff load indicator = EXP(constant*current staff to students ratio gap)document: Optimal staff load indicator is the effect of staff load on quality of teaching.
planned load per yr[PhD] = (nature of courses[Core Graduate]*course duration[PhD]*Credit Units per course[FourCU]*Current Courses[PhD]*type of programmes[Evening Only])planned load per yr[Masters] = course duration[Masters]*Credit Units per course[FourCU]*nature of courses[Core Graduate]*CurrentCourses[Masters]*type of programmes[Evening Only]planned load per yr[PGD] = course duration[PGD]*Credit Units per course[FourCU]*nature of courses[Core Graduate]*Current Courses[PGD]*type of programmes[Evening Only]planned load per yr[Undergraduate] = (nature of courses[Core Undergrad]*course duration[Undergraduate]*Credit Units per course[FourCU]*Current Courses[Undergraduate]*type of programmes[Day and Evening])+nature of courses[Elective Undergrad]*course duration[Undergraduate]*Credit Units per course[FourCU]*Current Courses[Undergraduate]*type of programmes[Day and Evening]
PT staff load = impact of load on PT staffquality of teaching = (quality of staff*influence weight[highest]+optimal staff load indicator*influence weight[high]+effect of classsize*influence weight[high]+resources availability*influence weight[average]+quality of research*influence weight[high])/(influenceweight[highest]+influence weight[high]+influence weight[high]+influence weight[average]+influence weight[average])
ratio of desired courses initiated[PhD] = 1ratio of desired courses initiated[Masters] = 0.5ratio of desired courses initiated[PGD] = 1ratio of desired courses initiated[Undergraduate] = 0.25
teaching weeks per yr = 30
time to initiate a new course[PhD] = 4time to initiate a new course[Masters] = 4time to initiate a new course[PGD] = 4time to initiate a new course[Undergraduate] = 4
type of programmes[Day Only] = 1type of programmes[Evening Only] = 1type of programmes[Day and Evening] = 2
150
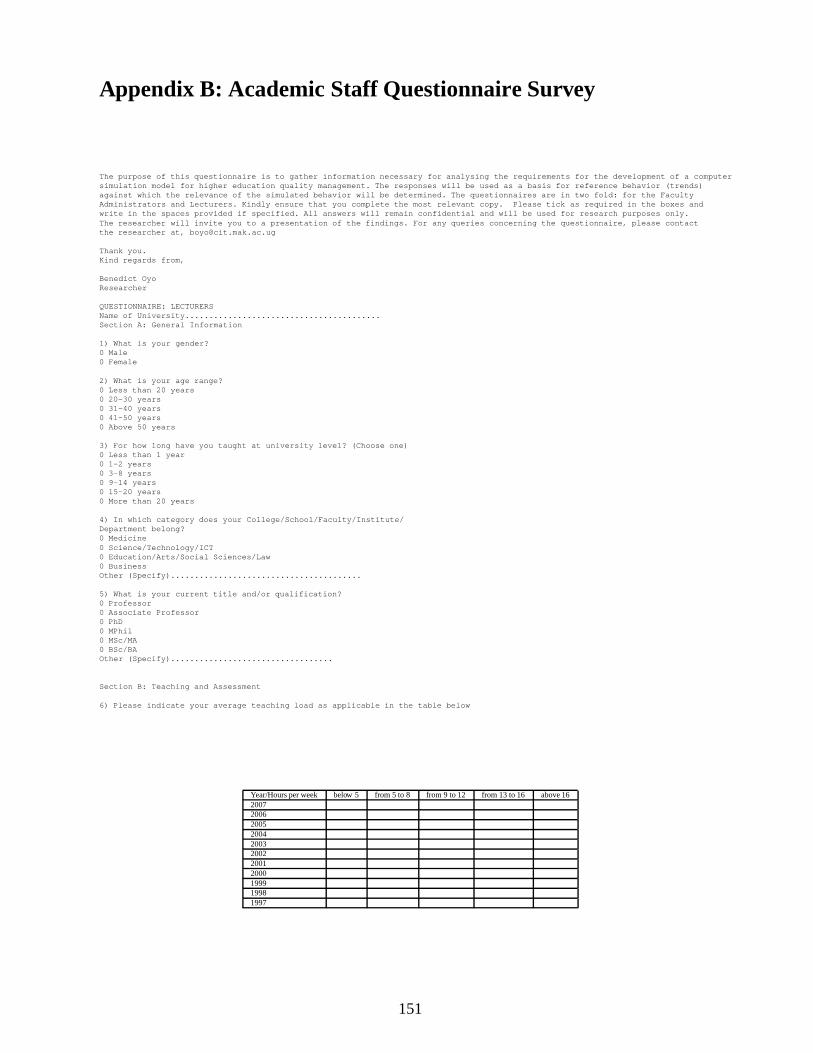
Appendix B: Academic Staff Questionnaire Survey
The purpose of this questionnaire is to gather information necessary for analysing the requirements for the development of a computersimulation model for higher education quality management. The responses will be used as a basis for reference behavior (trends)against which the relevance of the simulated behavior will be determined. The questionnaires are in two fold: for the FacultyAdministrators and Lecturers. Kindly ensure that you complete the most relevant copy. Please tick as required in the boxes andwrite in the spaces provided if specified. All answers will remain confidential and will be used for research purposes only.The researcher will invite you to a presentation of the findings. For any queries concerning the questionnaire, please contactthe researcher at, [email protected]
Thank you.Kind regards from,
Benedict OyoResearcher
QUESTIONNAIRE: LECTURERSName of University.........................................Section A: General Information
1) What is your gender?0 Male0 Female
2) What is your age range?0 Less than 20 years0 20-30 years0 31-40 years0 41-50 years0 Above 50 years
3) For how long have you taught at university level? (Choose one)0 Less than 1 year0 1-2 years0 3-8 years0 9-14 years0 15-20 years0 More than 20 years
4) In which category does your College/School/Faculty/Institute/Department belong?0 Medicine0 Science/Technology/ICT0 Education/Arts/Social Sciences/Law0 BusinessOther (Specify)........................................
5) What is your current title and/or qualification?0 Professor0 Associate Professor0 PhD0 MPhil0 MSc/MA0 BSc/BAOther (Specify)..................................
Section B: Teaching and Assessment
6) Please indicate your average teaching load as applicable in the table below
Year/Hours per week below 5 from 5 to 8 from 9 to 12 from 13 to 16 above 1620072006200520042003200220012000199919981997
151
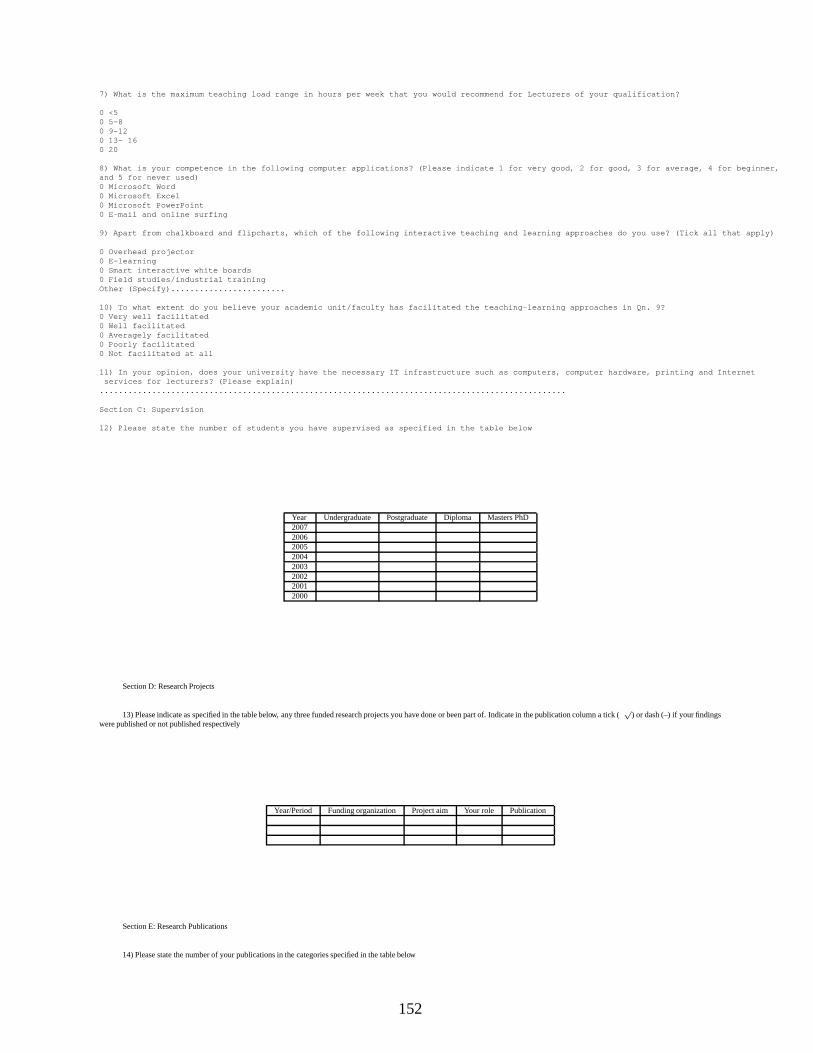
7) What is the maximum teaching load range in hours per week that you would recommend for Lecturers of your qualification?
0 <50 5-80 9-120 13- 160 20
8) What is your competence in the following computer applications? (Please indicate 1 for very good, 2 for good, 3 for average, 4 for beginner,and 5 for never used)0 Microsoft Word0 Microsoft Excel0 Microsoft PowerPoint0 E-mail and online surfing
9) Apart from chalkboard and flipcharts, which of the following interactive teaching and learning approaches do you use? (Tick all that apply)
0 Overhead projector0 E-learning0 Smart interactive white boards0 Field studies/industrial trainingOther (Specify)........................
10) To what extent do you believe your academic unit/faculty has facilitated the teaching-learning approaches in Qn. 9?0 Very well facilitated0 Well facilitated0 Averagely facilitated0 Poorly facilitated0 Not facilitated at all
11) In your opinion, does your university have the necessary IT infrastructure such as computers, computer hardware, printing and Internetservices for lecturers? (Please explain)
..................................................................................................
Section C: Supervision
12) Please state the number of students you have supervised as specified in the table below
Year Undergraduate Postgraduate Diploma Masters PhD20072006200520042003200220012000
Section D: Research Projects
13) Please indicate as specified in the table below, any three funded research projects you have done or been part of. Indicate in the publication column a tick (√
) or dash (–) if your findingswere published or not published respectively
Year/Period Funding organization Project aim Your role Publication
Section E: Research Publications
14) Please state the number of your publications in the categories specified in the table below
152
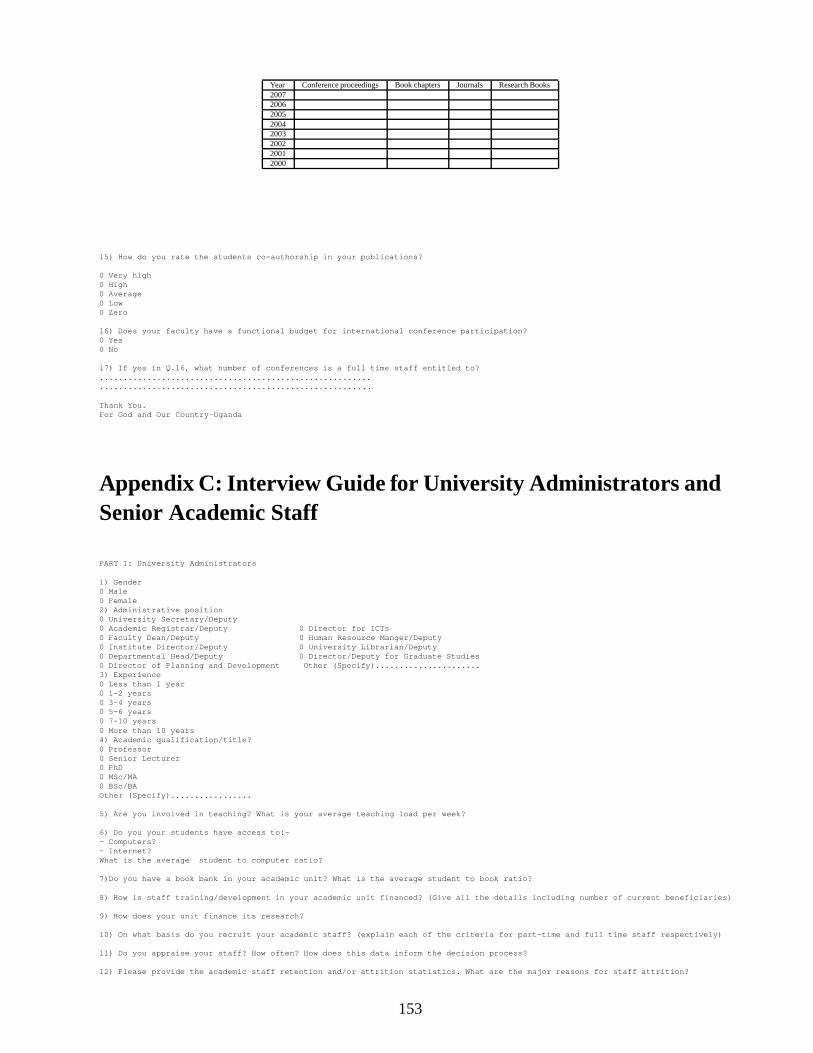
Year Conference proceedings Book chapters Journals Research Books20072006200520042003200220012000
15) How do you rate the students co-authorship in your publications?
0 Very high0 High0 Average0 Low0 Zero
16) Does your faculty have a functional budget for international conference participation?0 Yes0 No
17) If yes in Q.16, what number of conferences is a full time staff entitled to?................................................................................................................ ..
Thank You.For God and Our Country-Uganda
Appendix C: Interview Guide for University Administrators andSenior Academic Staff
PART I: University Administrators
1) Gender0 Male0 Female2) Administrative position0 University Secretary/Deputy0 Academic Registrar/Deputy 0 Director for ICTs0 Faculty Dean/Deputy 0 Human Resource Manger/Deputy0 Institute Director/Deputy 0 University Librarian/Deputy0 Departmental Head/Deputy 0 Director/Deputy for Graduate Studies0 Director of Planning and Development Other (Specify)......................3) Experience0 Less than 1 year0 1-2 years0 3-4 years0 5-6 years0 7-10 years0 More than 10 years4) Academic qualification/title?0 Professor0 Senior Lecturer0 PhD0 MSc/MA0 BSc/BAOther (Specify).................
5) Are you involved in teaching? What is your average teaching load per week?
6) Do you your students have access to:-- Computers?- Internet?What is the average student to computer ratio?
7)Do you have a book bank in your academic unit? What is the average student to book ratio?
8) How is staff training/development in your academic unit financed? (Give all the details including number of current beneficiaries)
9) How does your unit finance its research?
10) On what basis do you recruit your academic staff? (explain each of the criteria for part-time and full time staff respectively)
11) Do you appraise your staff? How often? How does this data inform the decision process?
12) Please provide the academic staff retention and/or attrition statistics. What are the major reasons for staff attrition?
153
13) Do your students rate their lecturers? How do you utilize this data?
14) How are students’ innovations monitored and/or supported?
15) Please provide statistics on students’ admission trends, enrolment, graduation rates, and average class sizes
....................................................................Thank You..............................................................
PART II: Senior Academic Staff
1) Gender0 Male0 Female2) Administrative position0 Vice/Deputy Chancellor 0 University Secretary/Deputy0 Academic Registrar/Deputy 0 Bursar/Deputy0 Faculty Dean/Deputy 0 Human Resource Manger/Deputy0 Institute Director/Deputy 0 University Librarian/Deputy0 Departmental Head/Deputy 0 Director/Deputy for Graduate Studies0 Director of Planning and Development0 Director for ICTs Other (Specify)......................3) Experience0 Less than 1 year0 1-2 years0 3-4 years0 5-6 years0 7-10 years0 More than 10 years4) Academic qualification/title?0 Professor0 Senior Lecturer0 PhD0 MSc/MA0 BSc/BAOther (Specify).................
5) What is your teaching load per week?
6) On average, how many students per year do you supervise at:Undergraduate .......Post Grad Diploma......Masters ...........PhD ............
7) A part from teaching private students if this is already applicable, how else does the academic unit you belong to generate funds?
8) Does your academic unit have research groups? How is research financed?
9) What kind of teaching resources does your unit have? Do you think these resources are satisfactory? (explain)
10) On average what is the class size in your unit?
11) Do you provide graduate training? What categories of graduate courses do you offer?
12) What is the publications throughput for your graduate students?
13) What is the distribution of staff by qualifications in the unit you belong to?
14) How are staff allowances (teaching/extra load, marking and supersion) paid? (explain whether and why they are prompt or delayed)
15) How often do you review the curriculum?
16) Explain the process of starting a new course, including the time delays involved from proposal stage to actual initiation
....................................................................Thank You..............................................................
154
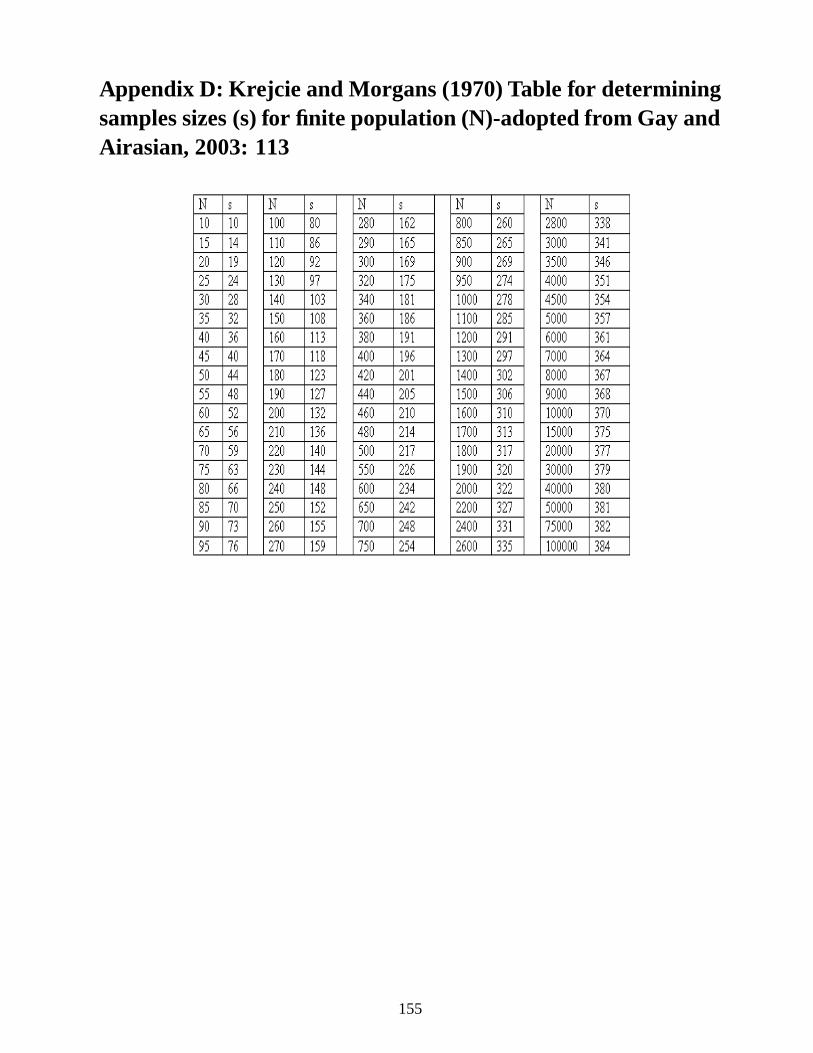
Appendix D: Krejcie and Morgans (1970) Table for determiningsamples sizes (s) for finite population (N)-adopted from Gay andAirasian, 2003: 113
155