Embed Size (px)
Citation preview

Abstract—This paper examines the possible incorporation of
solar and wind power in the East Malaysia power grid. Possible sites for solar and wind power generations are considered. Results from the simulation of the renewables integrated with the existing power grid, keeping in view problems like synchronization and faults, are given. It is proposed to replace the centralized supervisory and data acquisition system (SCADA) by a distributed Internet based network. This network runs on MultiprotocolLabel Switching (MPLS) topologyand core and edge routers are connected with Local Area Networks (LAN) at points of generation and distribution connected by fiber optics cables to form a Wide Area Network (WAN). Some results from the simulation of the communication network are given.
Index Terms—Renewables, MPLS, power grid, simulation, solar and wind power.
I. INTRODUCTION The prime minister of Malaysia, Dato' Sri Haji
Mohammad Najib bin Tun Haji Abdul Razak recently called for a comprehensive energy settlement in which he envisioned clean energy as an area of growth [1]. Borneo Island and Sarawak in particular should be able to reduce dependence on fossil fuels as clean energy is a downward cost curve. Sarawak has a hybrid power system incorporating hydroelectric and fossil fuel power generation. We propose addition of solar and wind power generators to this system.
Solar electrical power generation can be classified under two categories – photovoltaic (PV) and solar thermal. Theoretically, solar energy is considered to be capable of meeting the entire global energy demand [2]. In this paper, only PV is considered.
According to International Energy Agency [3], the global wind power capacity was 238GW while that for PV was 57 GW at the end of 2011. Wind turbines, are divided into two categories – Horizontal Axis Wind Turbine (HAWT) and Vertical Axis Wind turbine (VAWT) [4]. In this paper only HAWT is considered.
There is increasing interest in connecting power grids of neighbouring countries to enable power trading for meeting demand fluctuations. Accordingly, Sarawak Energy has proposed a Borneo-wide grid connecting Sarawak, Sabah,
Manuscript received July 13, 2013; revised August 17, 2013. S. S. Maaji, D. F. S. Khan, M. K. Haldar, and M. Tabassum are with the
Faculty of Engineering, Computing and Science, Swinburne University of Technology, Sarawak Campus, Jalan Simpang Tiga, Kuching 93350, Sarawak, Malaysia(e-mail: [email protected]).
P. Karunakaran is with Power Industry, 19 Greenwood Park Phase 4, 9th Mile Penrissen Road, 93250 Kuching, Sarawak, Malaysia (e-mail: [email protected]).
West Kalimantan, Indonesia, and Brunei. Fig. 1 [4] shows the plan where the solid line shows the existing grid in Sarawak and dotted lines indicate the extension of this grid to form the Borneo-wide grid.
The object of this paper is to study the proposed Borneo-wide grid incorporating solar and wind power plants in Sarawak. Suitable locations for these plants are first identified. The existing fossil and hydro power plants are considered. PSCAD [5] is used to simulate the entire grid. Models for different power plants are first reviewed for this simulation.
As the grid gets more complex and integrated, better data acquisition and control systems are needed to control load flow and minimize power outages. Power outages usually initiate from a small area and propagate over larger areas causing cascaded power failure. Considering this as well as the distributed power generation from renewables, an Internet based distributed data acquisition and control network is proposed. The network is simulated with OPNET [6]. Finally, some results for the simulation of the integrated power system and the communication network are given.
II. CHOICE OF SITE FOR SOLAR PLANT While the potential for PVs have been widely discussed for
parts of the world, such as the United States, Europe, the Middle East and the Pacific [7], South East Asia appears to have been largely ignored. According to Mekhilefet al [8], the average solar radiation in East Malaysia is more than 16 mJ/m2 perday. Limbang, Sarawak with average solar radiation of 17mJ/m2 per day [9] is considered to be the choice of sites for PV in this paper.
III. CHOICE OF SITE FOR WIND POWER PLANT
Based on the data reported by Jakhrani et al.[9]Sarawak may be considered to be a low wind resource area. However the data collected is mainly from the populated area with high resistance and low wind efficiency as stated by the author. Monthly wind power density data reported by Jakhrani et al is shown in Fig. 2.
Based on Fig. 2, Bintulu with wind power density of about 3.9W/m2 is identified to have the highest wind power density in the entire region.
Bintulu is not far from the sea. Greater wind speeds are available offshore as wind speeds are greater on open water than on land and exhibit less shear and turbulence [10].Moreover offshore farms are more environmental friendly. Hence offshore wind farm in the coast of Bintulu is considered in this paper.
Integration of Solar and Wind Power to a Borneo-Wide Power Grid
Salim S. Maaji, Duaa Fatima S. Khan, Manas K. Haldar, Mujahid Tabassum, and Prashobh Karunakaran
International Journal of Environmental Science and Development, Vol. 4, No. 6, December 2013
681DOI: 10.7763/IJESD.2013.V4.438

Fig. 1. Sarawak Energy’s development plan
Fig. 2. Monthly wind energy density in Sarawak
TABLE I: ESTIMATED OUTPUT POWER IN OFFSHORE BINTULU. Wind Speed (m/s) Output Power (W)
1 116.11
2 928.90
3 3135.06
4 7431.25
5 14514.16
6 25080.47
7 39826.85
8 59449.99
9 84646.57
10 116113.26
Table I above gives the estimated output power in the cost
of Bintuluper wind turbine, calculated using the following equation [11-12] P ρπR V C θ, λ (1)
where, represents the power of the wind absorbed by the machine, R is the radius of the rotor blade (m) ρ is the wind density (Kg/m3), is the wind speed (m/s) at a certain height,
is the power coefficient and it is a function of the pitch angle of the blades θ (deg) and λ which is tip speed ration. is determined from the following equations (2) , - - (3) . . (4) 0.5 0.022 5.6 . (5)
IV. INTEGRATED POWER SYSTEM Simulation The single line diagram for the integrated system is shown
in Fig. 3. Electrical buses are numbered from 1 to 13 for easy reference and alphabets are used to represent sub-stations as shown in Table II. Dotted lines are used to represent non- existing solar and wind power plants. High Voltage DC (HVDC) links are used at the borders of Sarawak, to transport electricity to Sabah, Brunei, and Kalimantan i.e., bus 1, 6 and 13 respectively. This connection enables bi-directional power transmission between the countries [13]-[14]. It also allows asynchronous interconnections and protects the system from cascaded ac-systems outages, due to the problems that might be initiated across the border. Bus 3 and bus 7 connect wind farm and photovoltaic arrays to the power grid. HVDC transmission lines are also used to carry the wind farm energy collected from coast of Bintulu to Simalajau substation (E).
International Journal of Environmental Science and Development, Vol. 4, No. 6, December 2013
682

Fig. 3. Single line diagram of the power system incorporating solar and wind
energy plants
The remaining part of the grid consists of 500Kv three phase transmission linesand 275Kv also HVAC from A to 1, 5 to D and J to K. Grid distances calculated using Google map are shown in Table II.
TABLE II:GRID DISTANCES CALCULATED USING GOOGLE MAP No. Bus No./ Subst. Name Bus No. /Subst. Name Distance (Km)
i. 1 (Sabah Load) A (Lawas) 23.819
ii. 3 A 76.820
iii. 3 B (Limbang) 95.436
iv. 3 C (Bunat) 145.126
v. C D (Tudan) 94.687
vi. D 6 (Brunei Load) 80.153
vii. E (Simalajau) F (Murum junction) 110.407
viii. E G (Tada) 201.496
ix. G H (Balingian) 77.727
x. G I (Tondong) 324.544
xi. I J (Matang) 25.563
xii. J K (Mombong) 23.803
xiii. K 13 (Kalimantan Load) 128.200
A. Solar Generation Model Different methods of grid connected Photovoltaic Cells
PVC have been proposed in many papers. In this paper a centralized inverter that connects PV modules in series and/or parallel [15] is used due to lower cost of power conditioning and high conversion efficiency of the inverter. Accordingly, the PVC module simulated in PSCAD consists of several strings of PV modules connected in parallel, with each string consisting of a number of PV modules connected in series.
A single inverter is used. The model is shown in Fig. 4. 25°is used as a reference temperature and average solar radiation of 17mJ/m2corresponding to Limbang data. The entire PV plant represents the PV connection with central inverter. To account for the effect of shading, central controls are used to increase or reduce the temperature and solar radiation.
Fig. 4. Grid connected PVC model
B. Wind Generation Model A three blade wind turbine is considered. In the wind
generator model of PSCAD, a slider is used to control the pitch and wind speed. The wind source energy is then transferred to the wind turbine which provides mechanical torque to rotate the generator shaft which generates electricity at voltage rating of 11kV.For the modeling of wind turbine in PSCAD, wind source component is used to model the wind speed, using (ES) as input representing wind speed in m/s and (Vw) as an output connected to the wind turbine, output of the wind turbine (Tm) is then connected to the synchronous generator. A Governor is used to control the pitch angle.
Fig. 5. Model of the windturbine
For 11kv AC voltage generated is transported to the grid
by AC/DC and DC/AC conversion with a HVDC line between the converters. This concept is adopted from [12].A 6-pulse Graetz converter bridge is used as an inverter or rectifier. Overvoltage protection using single input level comparator is also connected at both sides to protect the rectifier in case of over-voltage. The complete model is shown in Fig. 5.
C. Hydro Generation Model It is estimated that80,000MW of electricity could be
generated from 155 dams sites identified in Sarawak. However, only 51 out of 155 dam sites with combined installed capacity amounting to 20,000MW can be developed without flooding. Hydropower is expected to meet 70% of the demand in future [16].
The hydro power generation model used for simulation is shown in Fig. 6.
International Journal of Environmental Science and Development, Vol. 4, No. 6, December 2013
683
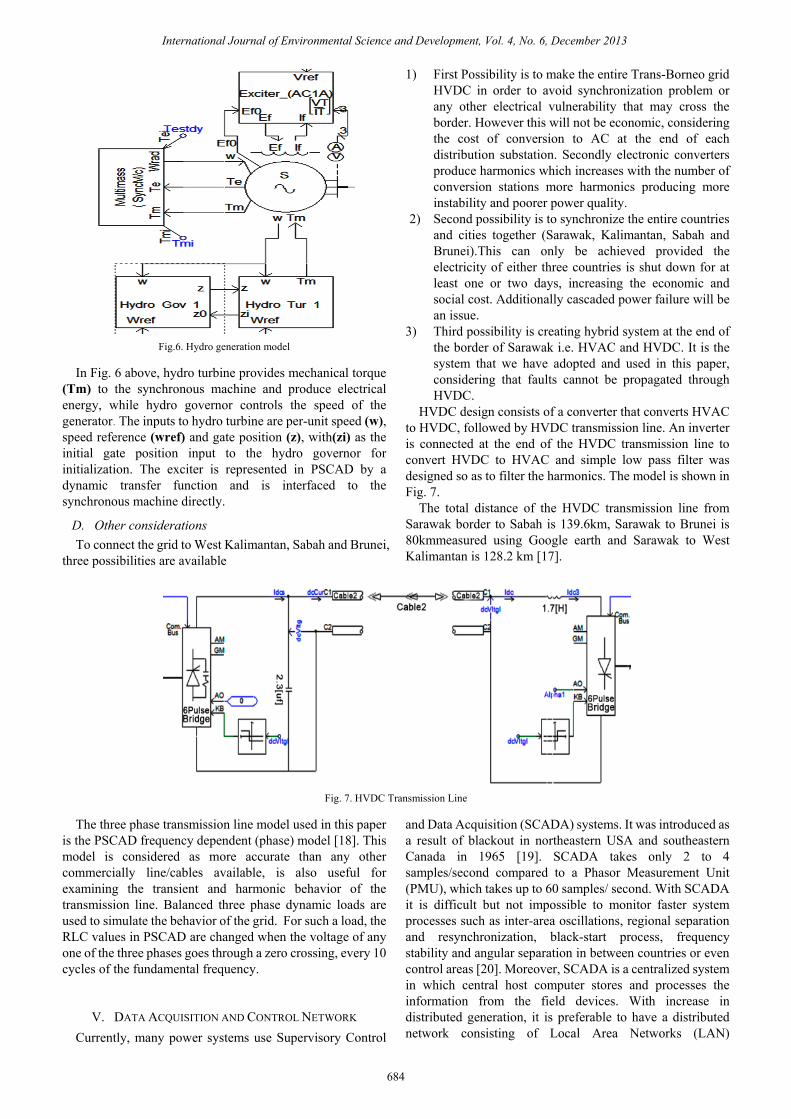
Fig.6. Hydro generation model
In Fig. 6 above, hydro turbine provides mechanical torque
(Tm) to the synchronous machine and produce electrical energy, while hydro governor controls the speed of the generator. The inputs to hydro turbine are per-unit speed (w), speed reference (wref) and gate position (z), with(zi) as the initial gate position input to the hydro governor for initialization. The exciter is represented in PSCAD by a dynamic transfer function and is interfaced to the synchronous machine directly.
D. Other considerations To connect the grid to West Kalimantan, Sabah and Brunei,
three possibilities are available
1) First Possibility is to make the entire Trans-Borneo grid HVDC in order to avoid synchronization problem or any other electrical vulnerability that may cross the border. However this will not be economic, considering the cost of conversion to AC at the end of each distribution substation. Secondly electronic converters produce harmonics which increases with the number of conversion stations more harmonics producing more instability and poorer power quality.
2) Second possibility is to synchronize the entire countries and cities together (Sarawak, Kalimantan, Sabah and Brunei).This can only be achieved provided the electricity of either three countries is shut down for at least one or two days, increasing the economic and social cost. Additionally cascaded power failure will be an issue.
3) Third possibility is creating hybrid system at the end of the border of Sarawak i.e. HVAC and HVDC. It is the system that we have adopted and used in this paper, considering that faults cannot be propagated through HVDC.
HVDC design consists of a converter that converts HVAC to HVDC, followed by HVDC transmission line. An inverter is connected at the end of the HVDC transmission line to convert HVDC to HVAC and simple low pass filter was designed so as to filter the harmonics. The model is shown in Fig. 7.
The total distance of the HVDC transmission line from Sarawak border to Sabah is 139.6km, Sarawak to Brunei is 80kmmeasured using Google earth and Sarawak to West Kalimantan is 128.2 km [17].
Fig. 7. HVDC Transmission Line
The three phase transmission line model used in this paper
is the PSCAD frequency dependent (phase) model [18]. This model is considered as more accurate than any other commercially line/cables available, is also useful for examining the transient and harmonic behavior of the transmission line. Balanced three phase dynamic loads are used to simulate the behavior of the grid. For such a load, the RLC values in PSCAD are changed when the voltage of any one of the three phases goes through a zero crossing, every 10 cycles of the fundamental frequency.
V. DATA ACQUISITION AND CONTROL NETWORK Currently, many power systems use Supervisory Control
and Data Acquisition (SCADA) systems. It was introduced as a result of blackout in northeastern USA and southeastern Canada in 1965 [19]. SCADA takes only 2 to 4 samples/second compared to a Phasor Measurement Unit (PMU), which takes up to 60 samples/ second. With SCADA it is difficult but not impossible to monitor faster system processes such as inter-area oscillations, regional separation and resynchronization, black-start process, frequency stability and angular separation in between countries or even control areas [20]. Moreover, SCADA is a centralized system in which central host computer stores and processes the information from the field devices. With increase in distributed generation, it is preferable to have a distributed network consisting of Local Area Networks (LAN)
International Journal of Environmental Science and Development, Vol. 4, No. 6, December 2013
684

embedded in a Wide Area Network (WAN). Such an Internet based network [21] is proposed with the LANS connected by fiber optic cables. Detailed description of the network is reported elsewhere [22].
VI. COMMUNICATION SYSTEM MODEL Fig. 8 above shows the proposed Internet based WAN in
Sarawak. Multiprotocol Label Switching (MPLS) has been proposed as the WAN topology as it provides high performance packet control and forwarding mechanism. It has now become an important technology for efficiently operating and managing IP networks because of its superior capabilities in providing Traffic Engineering (TE) and Virtual Private Network (VPN) services. One of the greatest benefit of an MPLS Networks is its ability to provide fast rerouting in less than 50ms time, by using shortest path label mechanism.
Fig. 8. Power grid Internet network in Sarawak
Fig. 9. BintuluWind Farm Subnet
Fig. 9 above shows the typical structure of eight connected wind turbines at the coast of Bintulu. The Solar subnet, placed in Limbang, consists of a PMU and four sensors to detect fluctuations in wind speed, temperature, humidity and irradiance. The four sensors simulated as computer components are connected to an Ethernet switch, which was connected to the Label Edge Router (LER) of the PV Plant, PVP lant LER, as shown in Fig. 10.
PVP lant LER was configured with MPLS & static Label Switched Patch (LSP) was established between PVP lant LER and the LER of the State Dispatch Center (SDC), SDC_LER. The SDC_LER was connected to a Phasor Data Concentrator (PDC) simulated as a server component, Wide
Area Monitoring (WAM) server. The four sensor nodes were arranged in a tree topology. The PMU was directly connected to the PVP lant LER. The Physical Layer used Ethernet 1000BaseX series cable as the transmission link with a data rate of 1Gbps. The Link Layer’s protocol was Ethernet. Transport Control Protocol/ Internet Protocol (TCP/IP)was used for the Network layer, and Open Shortest Path First(OSPF) was used as the routing protocol. The applications chosen for the Application Layer for the four sensor nodes were (medium load): database access and load file transfer. The application for the PMU was customized so that it would send 30 packets/ sec, with each packet being 76bytes in size, conforming to the IEEE C37.118 standard.
Fig. 10. LimbangPVplant subnet
VII. SIMULATION RESULTS
A. Power System Simulation Results Fig. 11 and Fig. 12 representthe output of the grid
connected PV Array; in DC, and the same output after it is converted to AC. Fig. 13 is the output of the wind turbine.
Fig. 11. DC output of the grid connect PV
Fig. 12. AC output of the grid connect PV
International Journal of Environmental Science and Development, Vol. 4, No. 6, December 2013
685

Fig. 13. Output of the wind turbine
To check that an AC fault is not transmitted through HVDC transmission line used at the Sarawak border, the HVDC line was replaced by HVAC. A fault was initiated at Kalimantan at 0.25second of the simulation, using timed fault logic component to control the state of the fault and duration. The output is shown in Fig. 14 and Fig. 15 below.
Fig. 14. Logic fault initiated on the grid using HVAC
Fig. 15. Sabah load voltage using HVAC
Voltagemeasurement at Sabah was taken, and distortion is
observed at exactly 0.25 second of the simulation as shown in Fig. 15 above the fault was propagated using HVAC.
Fig. 16. Logic fault initiated on the grid using HVDC
Fig. 17. Output voltage of Sabah using HVDC
HVDC was then replaced by HVDC and a fault was
initiated at Kalimantan as shown in Fig. 16. A voltage measurement at Sabah was again taken. The fault was not propagated to the other side of the grid; it stayed within the border of Sarawak. This is shown in Fig. 17 above.
B. Telecommunication Simulation Results It is observed that the addition of Wind Farm did not affect
the End to End (ETE) delays of the seven PMU – SDC pairs, as shown in Table III below. Thus it increased the TCP delay of the WAM server from 0.023922 seconds to 0.02415 seconds.
TABLE III: ETE DELAY (SEC) OF THE EIGHT WIND TURBINES Source– Destination Pair ETE Delays (seconds)
WT_2 (192.0.54.1/24) – WAM 0.023200
WT_1 (192.0.54.2/24) – WAM 0.023500
WT_8 (192.0.54.3/24) – WAM 0.023250
WT_7(192.0.54.4/24) – WAM 0.023300
WT_6 (192.0.54.5/24) – WAM 0.024215
WT_5 (192.0.54.6/24) – WAM 0.024108
WT_4 (192.0.54.7/24) – WAM 0.024156
WT_3 (192.0.54.7/24) – WAM 0.024131 TABLEIV: ETE DELAY (SEC) OF THE FOUR SENSOR NODES AND PMU IN PV
PLANT SUBNET Source – Destination Pair ETE Delays (seconds)
PMU (192.0.57.2/24) – WAM 0.027609
Humidity(192.0.56.2/24) – WAM 0.027001
Temperature(192.0.56.3/24) – WAM 0.02741
Wind Speed(192.0.56.4/24) – WAM 0.027432
Global Irradiance (192.0.56.10/24) – WAM 0.027000
The LSP delay from the PVPlant_LER to the SDC_LER
was found to be 0.02066 seconds. The ETE delays between the WAM server (192.0.27.2/24) and four sensor nodes and the PV plant PMU were observed as in Table IV above. After the addition of the PV subnet in the Sarawak grid communication network, the TCP delay of the WAM server was observed to be 0.0249 seconds.
VIII. CONCLUSION In this paper, we have proposed solar and wind power
plants connected to the existing grid. A distributed IP based network is proposed for data acquisition and control. Satisfactory results are obtained from simulation of the
International Journal of Environmental Science and Development, Vol. 4, No. 6, December 2013
686

power grid and the communication system. In future, the two systems will be connected through power measurement units and circuit breakers and a combined simulation will be carried out to examine data acquisition characteristics and power system control.
REFERENCES [1] S. U. Ariff, “Najib calls for comprehensive energy settlement in Asia,”
The Borneo Post, pp. B1, June 11, 2013, [2] B. J. M de Vries., D. P., van Vuuren, and M. M. Hoogwijk,
“Renewable Energy sources: Their global potential for the first-half of the 21st century at a global level: An integrated approach,” Energy Policy, vol. 35, pp. 2590-2610, 2007.
[3] International Energy Agency. [Online]. Available: http://www.iea.org/aboutus/faqs/renewableenergy/
[4] Sarawak Energy 2013. Generation Portfolio, Sarawak Energy. [Online]. Available: http://www.sarawakenergy.com.my/index.php/about-us/what-we-do/generation-portfolio
[5] PSCAD®/EMTDC™ PSCAD X4, version 4.5, Manitoba HVDC Research Centre, 2013.
[6] OPNET™ ITGuru/Academic edition, version 9.1, Build 2000 [7] S. D. R. Timilsina, L. Kurdgelashvili, and P. A. Narbel, “A review of
solar energy: markets, economics and policies,” Yiorld Bank Policy Research Working Paper 5845, October 2, 2011
[8] S. Mekhilef, A. Safari, W. E. S. Mustaffa, R. Saidur, R. Omara, and M. A. A. Youni, “Solar energy in Malaysia: Current state and prospects,” Renewable and Sustainable Energy Reviews, vol. 16, pp. 3860396, 2012.
[9] A. Q. Jakhrani1, A. K. Othman1, A. R. H. Rigit1 and S.R . Samo, “Assessment of Solar and Wind Energy Resources at Five Typical Locations in Sarawak,” Journal of Energy and Environment, vol. 4, no. 1, pp. 1-6.
[10] J. F. Manwell and J. G. McGowan, Wind Energy Explained,A Jhon Wiley and Sons, Ltd, ALR, USA, 2009.
[11] L. E. Chaar, L. A.Lamont, and N. Elzein, “Wind energy technology — Industrial update,” in Power and Energy Society General Meeting, IEEE, pp. 1-5, 2011.
[12] Wind Turbine Applications Technical Paper, MANITOBA HVDC ResearchCentre Inc, pp. 19-22, 2006.
[13] N. Mohan, T. M. Undeland, and W. P. Robbins, Power electronics, converters applications, and design, John Wiley &Sons Inc., United State of America, 2003.
[14] H. Wangand M. A. Redfern, “The advantages and disadvantages of using HVDC to interconnect AC networks,” UPEC2010, 31st Aug-3rd Sept, 2010.
[15] R. Carbone, “Grid-connected photovoltaic systems with energy storage,” in Proc. International Conf. Clean Electrical Power, 2009, pp. 760-767.
[16] D. L. H. Aik, “Long-Term Hydropower Development in Sarawak,”in Proc.AnnuConf. British Hydropower Association, 2010, pp. 12 -13.
[17] Trans Borneo Power Grid: Sarawak to West Kalimantan Link (Malaysia Section), Asian Development Bank 2011, pp. 1-4.
[18] Applications of PSCAD® / EMTDC, Manitoba HVDC Research Centre Inc.Manitoba HVDC Research Centre Inc., pp. 108.
[19] D. E. Bakken, A. Bose, C. H. Hauser, D. E.Whitehead, and G. C. Zweigle, “Smart Generation and Transmission With Coherent, Real-Time Data,” in Proc. of the IEEE, vol. 99, no. 6, pp. 928-951, 2011.
[20] Communication Technologies Inc. National Communications System(ed NC System), Chantilly, Virginia, 2004, pp. 4.
[21] Why IP Is the Right Foundation for the Smart Grid. (2010). CISCO. [Online]. Available: http://www.cisco.com/web/strategy/docs/energy/c11-581079_wp.pdf]
[22] S. S. Maaji, D. F. S. Khan, M. Tabassum, M. K. Haldar, and P. Karunakaran, “Preliminary studies on a proposed trans-Borneo smart grid,” in Proc. Conf. World Hybrid Technologies and Energy, Kuching, Sarawak, Malaysia, October, 2013.
Salim S. Maaji is a final year, Electrical and Electronics Engineering student at Swinburne University of Technology Sarawak Campus. He is a student member IEEE and also student member Engineers Australia. His current research interests include renewable energy and sustainability, smart grid and power electronics.
Duaa Fatima is an undergraduate student undertaking the course Telecommunication and Networking engineering at Swinburne University of Technology, Kuching, Sarawak, Malaysia, 2014. She completed the Cisco Networking Academy Programat Swinburne University of Technology, Kuching, Sarawak, Malaysia, 2011. She is a member of the IEEE Smart Grid community and Cisco Academy Connection.
Manas K. Haldar obtained his PhD from the University of Cambridge, UK. After working with the surface acoustic wave research group at Oxford, UK, he joined the Electrical and Computer Engineering Department of the National University of Singapore where he retired as Associate Professor. He has been an Associate Professor at the Swinburne University of Technology, Sarawak Campus since July, 2006. His current research interests
are in RF filters, semiconductor lasers, electronic voting, renewable energy and smart grid.
Mujahid Tabassum has completed Master in Computer Networks Engineering from Halmstad University Sweden in 2009. Currently, he is a lecturer at Swinburne University of Technology, Sarawak campus. His research interests are in Computer Networks, Wireless Communication, Wireless SensorNetworks, VoIP and AI.
PrashobhKarunakaran obtained his BSc. and MSc. From South Dakota State University, USA and PhD from University Malaysia Sarawak. He now owns a technical electrical engineering school focused on enabling students to pass the government Chargeman and Wireman certification. He has spent a total of seven years in the power industry two years in the civil construction industry and another 14 years in the computer hard disk industry. His interests are in
electric power and automation with the aim of merging the best of both technologies.
International Journal of Environmental Science and Development, Vol. 4, No. 6, December 2013
687