Embed Size (px)
Citation preview
Integration of miRNA and mRNA expression with DNA copynumber of Ewing sarcoma cell lines
Ilari Scheinin
Amsterdam April 26, 2011
Master’s thesis
UNIVERSITY OF HELSINKIDepartment of Biosciences


to my dear friend Laura,who opened my eyes
Faculty of Biological and Environmental Sciences Department of Biosciences
Ilari Scheinin
Integration of miRNA and mRNA expression with DNA copy number of Ewing sarcoma cell lines
Biotechnology, specialization track of Bioinformatics and Systems Biology
Master’s thesis April 26, 2011 64 pages (77 with appendices)
Ewing sarcoma, microarray profiling, aCGH, mRNA, miRNA, copy number, bioinformatics
Viikki Campus Library
Ewingin sarkooma on aggressiivinen ja erilaistumaton luu- ja pehmytkudossyöpä. Se vaivaa pääasi-assa lapsia, nuoria ja nuoria aikuisia, ja on hieman yleisempi miehillä. Sen tunnusmerkki on kro-mosomien 11 ja 22 välillä tapahtuva uudelleenjärjestäytyminen, jonka tuloksena on EWSR1-FLI1fuusiogeenin tuottama transkriptiofaktori.
Tämän tutkielman tarkotuksena on tunnistaa Ewingin sarkoomalle tärkeitä kohdegeeniehdokkaitakäyttäen kolmea erityyppistä mikrosiruaineistoa. Array comparative genomic hybridization -teknologialla mitataan DNA:n kopiolukua, ja sen analysointi mahdollistaa yleisten kromo-somipoikkeavuuksien tunnistamisen. mRNA- and miRNA-siruja käytetään proteiineja tuottavienja miRNA-geenien ilmentymisen mittaamiseen, ja niiden tulokset yhdistetään kopiolukuaineistoon.Kromosomipoikkavuudet tyypillisesti sisältävät myös sivullisia geenejä varsinaisten syöpä- ja kasvu-rajoitegeenien lisäksi, ja yhdistäminen ilmentymisaineistoon mahdollistaa varsinaisten kohdegeenientunnistamisen. Myös miRNA:iden ja niiden ennustettujen kohde-mRNA:iden välinen korrelaatiomitataan määrittämään transkription jälkeisen säätelyn vaikutusta mRNA:iden tasoille.
Yleisimmät kopiolukumonistumat tunnistettiin kromosomeista 8, 1q ja X. Häviämät olivatyleisimpiä raidassa 9p21.3, jonka kohdalla havaitiin myös katkoskohtien rikastuma muuhun genomiinverrattuna. Kopiolukumuutoksilla 9p21.3:ssa havaittiin olevan tilastollisesti merkitsevä vaikutusMTAP:n ilmentymiseen, mutta ei CDKN2A:n, joka on tunnettu kasvurajoitegeeni samassa ko-htaa genomia. MTAP:n ilmentyminen oli myös alhaisempaa Ewing sarkooma -solulinjoissa kuinmesenkymaalisissa kantasoluissa. Kohonnutta ilmentymistä kopiolukumuutoksista johtuen ja ver-rokkinäytteen suhteen havaitiin geeneissä DCAF7, ENO2, MTCP1 ja STK40.
miRNA-geenien ilmentymistä verrattiin Ewingin sarkooma -solulinjojen ja mesenkymaalisten kan-tasolujen välillä. 21:n miRNA:n ilmentymisen havaitiin olevan koholla ja 32:n alhaisempi kuin ver-tailunäytteissä. Alhaisempi ilmentyminen havaitiin myös miR-145:n kohdalla, kuten on aikaisem-minkin havaittu Ewingin sarkooman kohdalla. Fuusiogeeni EWSR1-FLI1 vaimentaa miR-145:nilmentymistä, jonka yksi kohdegeeni taas on FLI1, synnyttäen näin vastavuoroisesti vaimentavanpalautesilmukan.
Sen lisäksi että STK40:n ilmentyminen oli Ewing sarkooma -solulinjoissa koholla mesenkymaalisiinkantasoluihin nähden, ja että monistumien havaittiin nostaneen STK40:n ilmentymistä, sen havait-tiin myös olevan kohdegeeni neljälle miRNA:lle, joiden ilmentyminen oli alentunut. SLCO5A1:nhavaittiin olevan ainoa koholla oleva geeni usein monistuneella alueella kromosomissa 8. Alueoli monistunut yli 90 %:ssa solulinjoista, yleisyyden myös ollessa vierekkäisiä alueita korkeampi.Tämän lisäksi SLCO5A1 on kohdegeeni kolmelle miRNA:lle, joiden ilmentyminen oli alentunutmesenkymaalisiin kantasoluin verrattuna.
Tiedekunta — Fakultet — Faculty Laitos — Institution — Department
Tekijä — Författare — Author
Työn nimi — Arbetets titel — Title
Oppiaine — Läroämne — Subject
Työn laji — Arbetets art — Level Aika — Datum — Month and year Sivumäärä — Sidoantal — Number of pages
Tiivistelmä — Referat — Abstract
Avainsanat — Nyckelord — Keywords
Säilytyspaikka — Förvaringsställe — Where deposited
Muita tietoja — övriga uppgifter — Additional information
HELSINGIN YLIOPISTO — HELSINGFORS UNIVERSITET — UNIVERSITY OF HELSINKI
Faculty of Biological and Environmental Sciences Department of Biosciences
Ilari Scheinin
Integration of miRNA and mRNA expression with DNA copy number of Ewing sarcoma cell lines
Biotechnology, specialization track of Bioinformatics and Systems Biology
Master’s thesis April 26, 2011 64 pages (77 with appendices)
Ewing sarcoma, microarray profiling, aCGH, mRNA, miRNA, copy number, bioinformatics
Viikki Campus Library
Ewing sarcoma is an aggressive and poorly differentiated malignancy of bone and soft tissue. Itprimarily affects children, adolescents, and young adults, with a slight male predominance. It ischaracterized by a translocation between chromosomes 11 and 22 resulting in the EWSR1-FLI1fusion transcription factor.
The aim of this study is to identify putative Ewing sarcoma target genes through an integrativeanalysis of three microarray data sets. Array comparative genomic hybridization is used to measurechanges in DNA copy number, and analyzed to detect common chromosomal aberrations. mRNAand miRNA microarrays are used to measure expression of protein-coding and miRNA genes, andthese results integrated with the copy number data. Chromosomal aberrations typically containalso bystanders in addition to the driving tumor suppressor and oncogenes, and integration withexpression helps to identify the true targets. Correlation between expression of miRNAs and theirpredicted target mRNAs is also evaluated to assess the results of post-transcriptional miRNAregulation on mRNA levels.
The highest frequencies of copy number gains were identified in chromosome 8, 1q, and X. Losseswere most frequent in 9p21.3, which also showed an enrichment of copy number breakpoints relativeto the rest of the genome. Copy number losses in 9p21.3 were found have a statistically significanteffect on the expression of MTAP, but not on CDKN2A, which is a known tumor-suppressor inthe same locus. MTAP was also down-regulated in the Ewing sarcoma cell lines compared tomesenchymal stem cells. Genes exhibiting elevated expression in association with copy numbergains and up-regulation compared to the reference samples included DCAF7, ENO2, MTCP1, andSTK40.
Differentially expressed miRNAs were detected by comparing Ewing sarcoma cell lines againstmesenchymal stem cells. 21 up-regulated and 32 down-regulated miRNAs were identified, includingmiR-145, which has been previously linked to Ewing sarcoma. The EWSR1-FLI1 fusion generepresses miR-145, which in turn targets FLI1 forming a mutually repressive feedback loop.
In addition higher expression linked to copy number gains and compared to mesenchymal stemcells, STK40 was also found to be a target of four different miRNAs that were all down-regulatedin Ewing sarcoma cell lines compared to the reference samples. SLCO5A1 was identified as theonly up-regulated gene within a frequently gained region in chromosome 8. This region was gainedin over 90 % of the cell lines, and also with a higher frequency than the neighboring regions. Inaddition, SLCO5A1 was found to be a target of three miRNAs that were down-regulated comparedto the mesenchymal stem cells.
Tiedekunta — Fakultet — Faculty Laitos — Institution — Department
Tekijä — Författare — Author
Työn nimi — Arbetets titel — Title
Oppiaine — Läroämne — Subject
Työn laji — Arbetets art — Level Aika — Datum — Month and year Sivumäärä — Sidoantal — Number of pages
Tiivistelmä — Referat — Abstract
Avainsanat — Nyckelord — Keywords
Säilytyspaikka — Förvaringsställe — Where deposited
Muita tietoja — övriga uppgifter — Additional information
HELSINGIN YLIOPISTO — HELSINGFORS UNIVERSITET — UNIVERSITY OF HELSINKI
vi
Contents
Tiivistelmä iv
Abstract v
Contents vi
Abbreviations viii
1 Introduction 1
1.1 Cancer in general . . . . . . . . . . . . . . . . . . . . . . . . . . . . . 1
1.2 Ewing sarcoma . . . . . . . . . . . . . . . . . . . . . . . . . . . . . . 2
1.2.1 Clinical characteristics . . . . . . . . . . . . . . . . . . . . . . 2
1.2.2 Common translocations . . . . . . . . . . . . . . . . . . . . . 5
1.2.3 Other genomic alterations . . . . . . . . . . . . . . . . . . . . 9
1.2.4 Cell of origin . . . . . . . . . . . . . . . . . . . . . . . . . . . 10
1.3 Microarray technology . . . . . . . . . . . . . . . . . . . . . . . . . . 12
1.3.1 Comparative genomic hybridization and DNA copy number . 12
1.3.2 mRNA expression arrays and transcription . . . . . . . . . . . 15
1.3.3 miRNA expression arrays and post-transcriptional regulation . 15
2 Materials and Methods 17
2.1 Materials . . . . . . . . . . . . . . . . . . . . . . . . . . . . . . . . . 17
2.1.1 Ewing sarcoma cell lines . . . . . . . . . . . . . . . . . . . . . 17
2.1.2 Reference samples . . . . . . . . . . . . . . . . . . . . . . . . . 18
2.2 Methods . . . . . . . . . . . . . . . . . . . . . . . . . . . . . . . . . . 18
2.2.1 Identifying gains and losses from aCGH data . . . . . . . . . . 19
2.2.2 Detecting differentially expressed mRNAs . . . . . . . . . . . 20
2.2.3 Detecting differentially expressed miRNAs . . . . . . . . . . . 21
2.2.4 Identifying copy-number-induced expression changes . . . . . . 22
2.2.5 Evaluating effect of miRNA expression on mRNA levels . . . . 22
3 Results 23
3.1 Copy number aberrations . . . . . . . . . . . . . . . . . . . . . . . . . 23
3.2 Differentially expressed mRNAs . . . . . . . . . . . . . . . . . . . . . 26
vii
3.3 Differentially expressed miRNAs . . . . . . . . . . . . . . . . . . . . . 27
3.4 Effect of DNA copy number on miRNA expression . . . . . . . . . . . 27
3.5 Effect of DNA copy number on mRNA expression . . . . . . . . . . . 29
3.6 Effect of miRNA expression on mRNA levels . . . . . . . . . . . . . . 35
4 Discussion 37
Acknowledgements 47
References 48
Appendices 65
List of Figures
3.1 Copy number regions . . . . . . . . . . . . . . . . . . . . . . . . . . . 24
3.2 aCGH and miRNA heatmaps . . . . . . . . . . . . . . . . . . . . . . 28
3.3 Differential miRNA expression induced by copy number aberrations . 29
3.4 aCGH and mRNA heatmaps . . . . . . . . . . . . . . . . . . . . . . . 31
3.5 Differential mRNA expression induced by copy number aberrations . 33
A.1 aCGH profiles of individual cell lines . . . . . . . . . . . . . . . . . . 66
A.2 aCGH and miRNA expression profiles of individual cell lines . . . . . 68
A.3 aCGH and mRNA expression profiles of individual cell lines . . . . . 71
List of Tables
1.1 Translocations in Ewing sarcoma . . . . . . . . . . . . . . . . . . . . 7
2.1 Ewing sarcoma cell lines . . . . . . . . . . . . . . . . . . . . . . . . . 17
3.1 Most common copy number aberrations by absolute frequencies . . . 25
3.2 Differentially expressed miRNAs and their aberration frequencies . . 30
3.3 mRNAs with copy-number-induced expression changes . . . . . . . . 32
3.4 Most common copy number aberrations by relative frequencies anddifferentially expressed genes . . . . . . . . . . . . . . . . . . . . . . . 35
A.1 All copy number regions . . . . . . . . . . . . . . . . . . . . . . . . . 74
viii
Abbreviations
aCGH array CGHAMP adenosine monophosphateBAC bacterial artificial chromosome/clonecAMP cyclic AMPCanGEM Cancer GEnome Mine databasecDNA complementary DNACGH comparative genomic hybridizationCNV copy number variationCV coefficient of variation = standard deviation / meanDNA deoxyribonucleic acidETS E-twenty six / E26 transformation specific transcription factor familyFISH fluorescent in situ hybridizationFET FUS, EWSR1, TAF15FLI1 Friend leukemia virus integration 1 transcription factorGEO Gene Expression Omnibus databasehMSC human MSCLOH loss of heterozygosityMAPK mitogen-activated protein kinasemiRNA micro RNAmMSC murine MSCMPC mesenchymal progenitor cellMSC mesenchymal stem cellMSS mesomelia-synostoses syndromeNF-κB nuclear factor kappa-light-chain-enhancer of activated B cellsRNA ribonucleic acidRNAi RNA interferenceSCID severe combined immunodeficiencysiRNA small interfering RNASRBCT small round blue cell tumorUDP uniparental disomyUTR untranslated region
1
1 Introduction
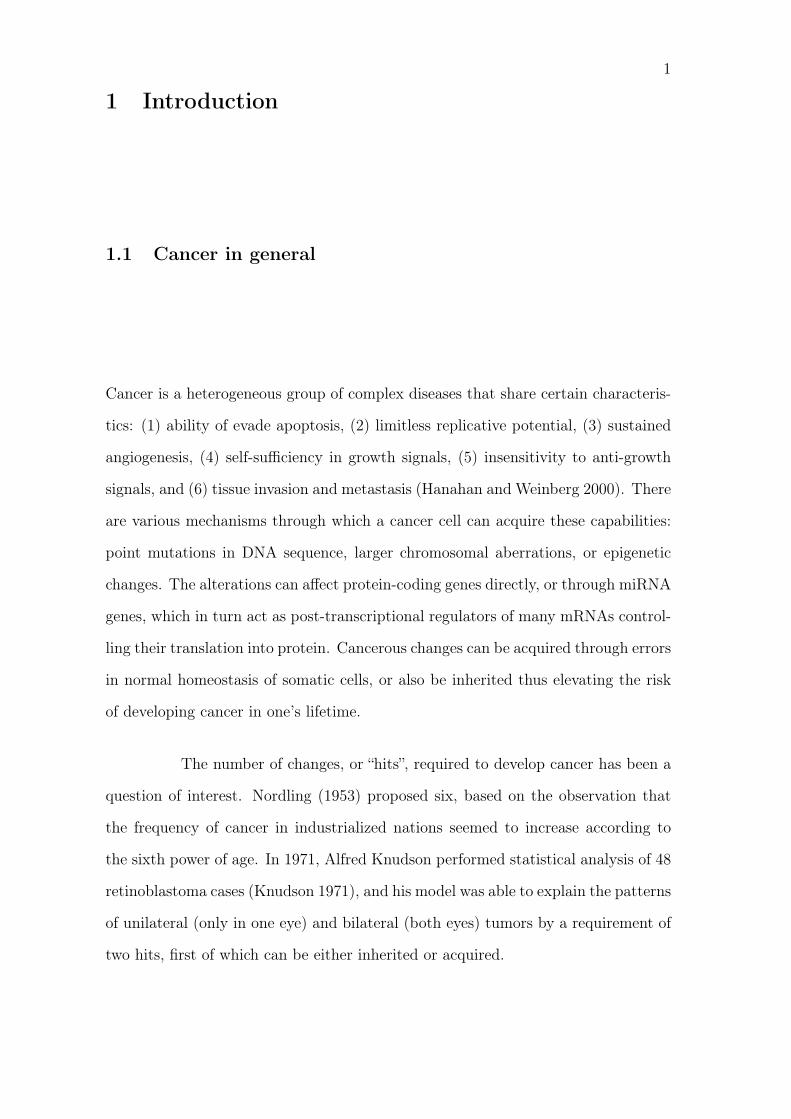
1.1 Cancer in general
Cancer is a heterogeneous group of complex diseases that share certain characteris-
tics: (1) ability of evade apoptosis, (2) limitless replicative potential, (3) sustained
angiogenesis, (4) self-sufficiency in growth signals, (5) insensitivity to anti-growth
signals, and (6) tissue invasion and metastasis (Hanahan and Weinberg 2000). There
are various mechanisms through which a cancer cell can acquire these capabilities:
point mutations in DNA sequence, larger chromosomal aberrations, or epigenetic
changes. The alterations can affect protein-coding genes directly, or through miRNA
genes, which in turn act as post-transcriptional regulators of many mRNAs control-
ling their translation into protein. Cancerous changes can be acquired through errors
in normal homeostasis of somatic cells, or also be inherited thus elevating the risk
of developing cancer in one’s lifetime.
The number of changes, or “hits”, required to develop cancer has been a
question of interest. Nordling (1953) proposed six, based on the observation that
the frequency of cancer in industrialized nations seemed to increase according to
the sixth power of age. In 1971, Alfred Knudson performed statistical analysis of 48
retinoblastoma cases (Knudson 1971), and his model was able to explain the patterns
of unilateral (only in one eye) and bilateral (both eyes) tumors by a requirement of
two hits, first of which can be either inherited or acquired.
2
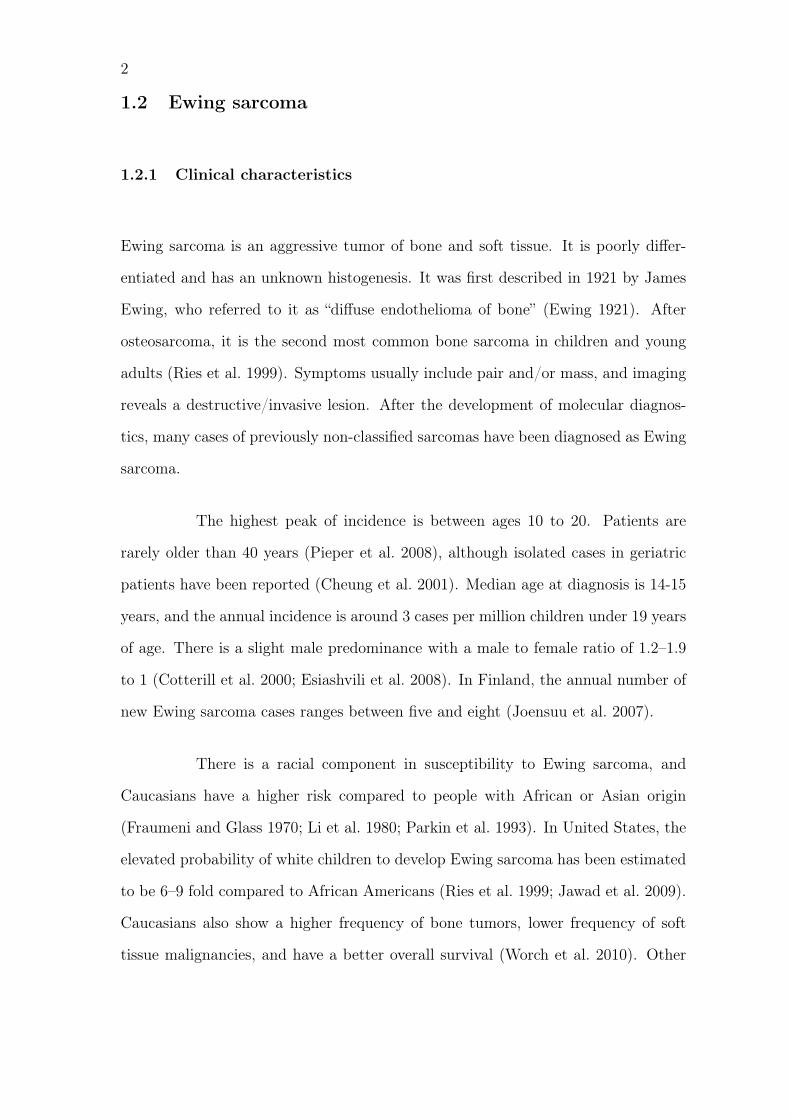
1.2 Ewing sarcoma
1.2.1 Clinical characteristics
Ewing sarcoma is an aggressive tumor of bone and soft tissue. It is poorly differ-
entiated and has an unknown histogenesis. It was first described in 1921 by James
Ewing, who referred to it as “diffuse endothelioma of bone” (Ewing 1921). After
osteosarcoma, it is the second most common bone sarcoma in children and young
adults (Ries et al. 1999). Symptoms usually include pair and/or mass, and imaging
reveals a destructive/invasive lesion. After the development of molecular diagnos-
tics, many cases of previously non-classified sarcomas have been diagnosed as Ewing
sarcoma.
The highest peak of incidence is between ages 10 to 20. Patients are
rarely older than 40 years (Pieper et al. 2008), although isolated cases in geriatric
patients have been reported (Cheung et al. 2001). Median age at diagnosis is 14-15
years, and the annual incidence is around 3 cases per million children under 19 years
of age. There is a slight male predominance with a male to female ratio of 1.2–1.9
to 1 (Cotterill et al. 2000; Esiashvili et al. 2008). In Finland, the annual number of
new Ewing sarcoma cases ranges between five and eight (Joensuu et al. 2007).
There is a racial component in susceptibility to Ewing sarcoma, and
Caucasians have a higher risk compared to people with African or Asian origin
(Fraumeni and Glass 1970; Li et al. 1980; Parkin et al. 1993). In United States, the
elevated probability of white children to develop Ewing sarcoma has been estimated
to be 6–9 fold compared to African Americans (Ries et al. 1999; Jawad et al. 2009).
Caucasians also show a higher frequency of bone tumors, lower frequency of soft
tissue malignancies, and have a better overall survival (Worch et al. 2010). Other
3
common bone tumors, such as osteosarcoma, show relatively equal racial distribu-
tions.
Primary tumors occur most frequently (over 50 %) in the long bones
of lower and upper extremities, or axially in pelvis, chest wall or spine (Cotterill
et al. 2000). In the extremities, the location is more often in the mid section of the
bone (diaphysis) than in the ends (epiphysis). In addition to bones, Ewing sarcoma
can also affect soft tissue, such as kidneys, uterus, or skin. Despite these spatial
tendencies, any bone or extra-skeletal tissue may be affected. Primary tumors in
bone are more frequent in children and adolescents, while soft tissue is increasingly
affected in adults.
At the time of diagnosis, about 25 % of patients have clinically evident
metastases (Cotterill et al. 2000; Esiashvili et al. 2008). They occur most frequently
in lung, bone, or bone marrow through hematogenous spread. However, 20–30 %
of patients diagnosed with a localized tumor actually have micrometastases, which
are undetectable by current routine procedures (Pfleiderer et al. 1995; West et al.
1997).
Other tumor types closely related to Ewing sarcoma include periperiph-
eral primitive neuroectodermal tumor (PNET), peripheral neuroepithelioma, and
Askin’s tumor. PNET shows neural differentiation, and Askin’s tumor is localized
in the chest wall. All of these tumors are treated in similar fashion on the basis of
their clinical presentation (e.g. metastasized or localized) rather than their histo-
logical subtype. This group of cancers is sometimes referred to as Ewing sarcoma
family of tumors (ESFT), Ewing sarcoma/PNET, or simply Ewing sarcoma, which
is the term used throughout this thesis.
Histologically Ewing sarcoma belongs to small round blue cell tumors
4
(SRBCTs), which also include desmoplastic small round cell tumor, hepatoblas-
toma, neuroblastoma, medulloblastoma, retinoblastoma, rhabdomyosarcoma, small-
cell lymphoma, and Wilm’s tumor. These tumors are more typically observed in chil-
dren than adults, and are all poorly differentiated (Lessnick et al. 2009). The best
known immunohistochemical hallmark of Ewing sarcoma is the cell surface antigen
CD99, which is expressed in over 90 % of the cases (Kovar et al. 1990; Fellinger et al.
1991; Perlman et al. 1994). However, it does not exclusively distinguish Ewing sar-
coma from other SRBCTs, or from other solid tumors, as heterogeneous positivity for
CD99 is detected in a variety of tumors, including chondrosarcomas, lymphomas,
neuroblatomas, osteoblastomas and sarcomas, rhabdomyosarcomas, and synovial
sarcomas (Fellinger et al. 1991; Scotlandi et al. 1996; Lucas et al. 2001). CD99 is a
32 kD glycoprotein coded by the MIC2 gene, and is normally expressed in T cells
(Gelin et al. 1989) and B cells (Dworzak et al. 1999). Other immunohistochemical
markers that are variably expressed in Ewing sarcoma include FLI1 (Folpe et al.
2000), vimentin (Lucas et al. 2001), and cytokeratin (Collini et al. 2001),
Advances in multidisciplinary treatments have increased survival of Ewing
sarcoma patients significantly. According to the US-based Surveillance, Epidemiology,
and End Results (SEER) Program, 5-year survival has increased from 44 % to 68
% for localized disease after the 1970s. About 25 % of patients are diagnosed with
metastases, and their 5-year survival has increased from 16 % to 39 % (Esiashvili
et al. 2008). Compared to bone and bone marrow, pulmonary metastases have a
slighly more faborable outcome. Long-term survival is about 50 % for localized and
<20 % for disseminated disease (Paulussen et al. 2008). More than 30 % of patients
relapse, which is often fatal. The time from initial diagnosis to first recurrence is
a good predictor for survival in these cases. A recurrence within the first 2 years
corresponded with only 7 % 5-year survival, whereas later incidents had a more fa-
vorable outcome at 30 % (Leavey et al. 2008). Overall, the absence of metastases at
5
the time of diagnosis (Terrier et al. 1996), small tumor volume (<200 ml) (Paulussen
et al. 2001), good response to chemotherapy (Picci et al. 1997; Wunder et al. 1998),
primary tumor site other than pelvis (Craft et al. 1997), and young age (Grier et al.
2003; Paulussen et al. 2008; Granowetter et al. 2009) have been shown to correlate
with better clinical outcome.
Depending on the location and extent of the tumor, local treatment of
Ewing sarcoma can consist of surgery, radiation therapy, or both. Systemic ther-
apy was introduced in the 1970s and given to patients before and after surgery as
neoadjuvant and adjuvant chemotherapy. The aim is to eliminate tumor cells and
micrometastases throughout the body. Chemotherapy typically consists of a com-
bination of different chemotherapeutic agents, e.g., doxorubicin, cyclophosphamide,
ifosfamide, etoposide, and vincristine. (Thacker et al. 2005). While aggressive treat-
ment does improve outcome, it can have serious side effects. These can include e.g.
bacterial infections, pain, malnutrition, stomatitis, hair loss, nausea, and vomiting.
It also elevates the risk of developing secondary malignancies, such as leukemias and
solid tumors like radiation-induced osteosarcomas (Bacci et al. 2005; Navid et al.
2008). Identifying low-risk cases to avoid unnecessary treatment would therefore be
beneficial for these patients.
1.2.2 Common translocations
A hallmark of Ewing sarcoma is a gene fusion between members of the FET and ETS
gene families, most commonly between EWSR1 and FLI1. The FET family consists
of FUS (fused in sarcoma; also known as TLS, translocated in liposarcoma), EWSR1
(Ewing sarcoma breakpoint region 1) and TAF15 (TATA-binding protein-associated
factor 15). These proteins are expressed ubiquitously in cell cycle through all tissues,
6
are predominantly nuclear, and have roles in transcription and RNA processing and
splicing. They contain an RNA-binding motif and interact with the RNA polymerase
II (Tan and Manley 2009). ETS (E-twenty six or E26 transformation specific) is
a gene family consisting of roughly 30 tissue-specific transcription factors. They
contain a highly conserved helix-turn-helix DNA-binding motif, and comprise of
both transcriptional activators and inhibitors (Sharrocks 2001).
The first observations of non-random translocations between chromo-
somes 11 and 22 in Ewing sarcoma were made in the 1980s (Aurias et al. 1984;
Turc-Carel et al. 1984, 1988). The exact partners involved in this gene fusion
were identified as EWSR1 (Ewing sarcoma breakpoint region 1) and FLI1 (Friend
leukemia virus integration 1) roughly a decade later (Delattre et al. 1992). This was
the first fusion gene to be characterized at the molecular level in sarcomas. The
EWSR1 gene is located in 22q12.2 and supplies the fusion gene with a strong pro-
moter containing a transactivation domain, while FLI1 (11q24.3) provides a DNA
binding domain giving target specificity for transcriptional activation and repression
(May et al. 1993a). The fusion gene functions as a transcription factor and enables
Ewing sarcoma tumorigenesis (May et al. 1993b).
The most common fusion between EWSR1-FLI1 is known as type 1, and
joins EWSR1 exons 1–7 with FLI1 exons 6–9. It is not transcribed as actively
and has been shown to be associated with better survival than other EWSR1-FLI1
variants (de Alava et al. 1998). The second most common fusion is type 2, which
also includes exon 5 of FLI1. At least 18 different types of in-frame fusions between
EWSR1 and FLI1 are known. In some cases the fusion is out of frame, but restored
through splicing.
In addition to FLI1, EWSR1 has also been shown to fuse with other
7
members of the ETS gene family. These include ERG (Zucman et al. 1993), ETV1
(Jeon et al. 1995), ETV4 (Kaneko et al. 1996), FEV (Peter et al. 1997), and ZNF278
(Mastrangelo et al. 2000). Alternatively, fusions involving the FUS gene have also
been described, including FUS-ERG (Shing et al. 2003) and FUS-FEV (Ng et al.
2007). All fusion genes function as transcription factors, and despite structural
differences, all seem to similarly induce cellular transformation and accelerate tu-
morigenesis without significant differences in clinical phenotypes (Ginsberg et al.
1999; Thompson et al. 1999). However, the rarity of the infrequent fusions make it
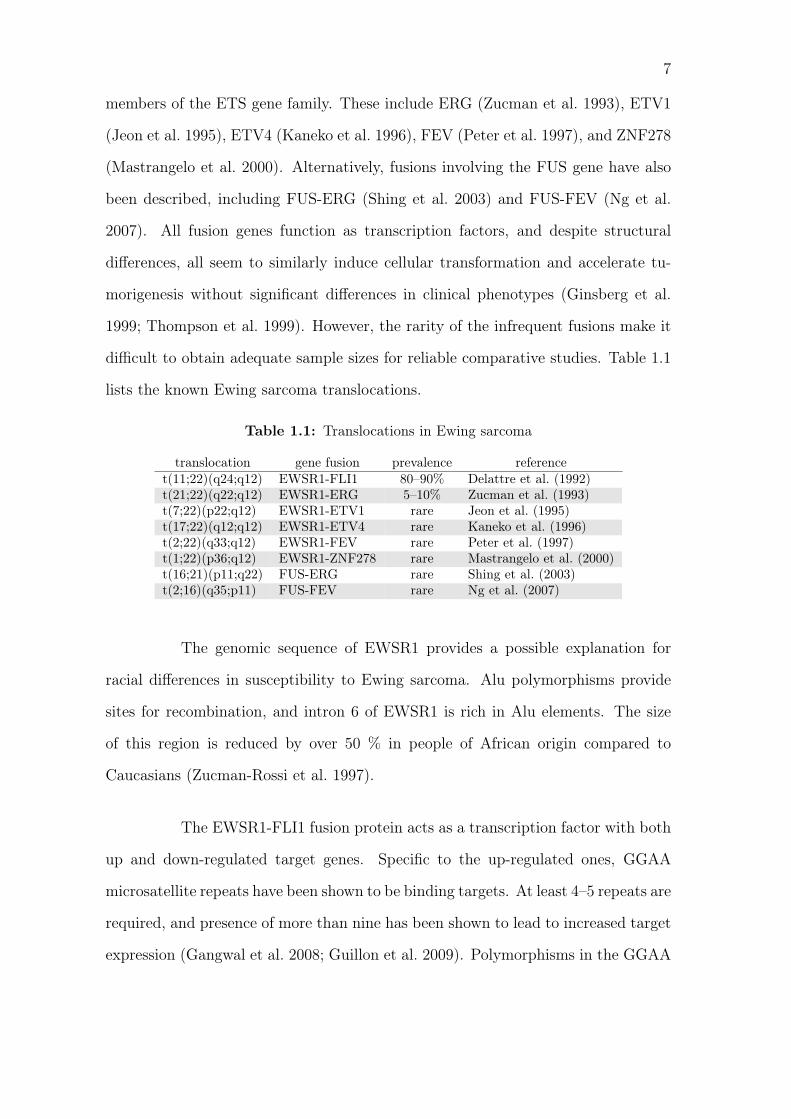
difficult to obtain adequate sample sizes for reliable comparative studies. Table 1.1
lists the known Ewing sarcoma translocations.
Table 1.1: Translocations in Ewing sarcoma
translocation gene fusion prevalence referencet(11;22)(q24;q12) EWSR1-FLI1 80–90% Delattre et al. (1992)t(21;22)(q22;q12) EWSR1-ERG 5–10% Zucman et al. (1993)t(7;22)(p22;q12) EWSR1-ETV1 rare Jeon et al. (1995)t(17;22)(q12;q12) EWSR1-ETV4 rare Kaneko et al. (1996)t(2;22)(q33;q12) EWSR1-FEV rare Peter et al. (1997)t(1;22)(p36;q12) EWSR1-ZNF278 rare Mastrangelo et al. (2000)t(16;21)(p11;q22) FUS-ERG rare Shing et al. (2003)t(2;16)(q35;p11) FUS-FEV rare Ng et al. (2007)
The genomic sequence of EWSR1 provides a possible explanation for
racial differences in susceptibility to Ewing sarcoma. Alu polymorphisms provide
sites for recombination, and intron 6 of EWSR1 is rich in Alu elements. The size
of this region is reduced by over 50 % in people of African origin compared to
Caucasians (Zucman-Rossi et al. 1997).
The EWSR1-FLI1 fusion protein acts as a transcription factor with both
up and down-regulated target genes. Specific to the up-regulated ones, GGAA
microsatellite repeats have been shown to be binding targets. At least 4–5 repeats are
required, and presence of more than nine has been shown to lead to increased target
expression (Gangwal et al. 2008; Guillon et al. 2009). Polymorphisms in the GGAA
8
microsatellite loci could be another factor in susceptibility between individuals from
different ethnic groups (Gangwal and Lessnick 2008). The ability to bind GGAA
repeats is shared between many ETS gene family members, but the capability to
activate their transcription seems to be specific only to fusion products (Gangwal
et al. 2010).
Genes induced by the fusion product mainly belong to cell cycle regula-
tion, proliferation, and response to DNA damage, while repressed ones are associ-
ated with differentiation and cell communication (Kauer et al. 2009). One critical
up-regulated target is NR0B1 (nuclear receptor subfamily 0, group B, member 1),
which has been shown to be required for optimal transformation (Kinsey et al. 2006).
NR0B1 is a co-repressor protein that directly interacts with EWSR1-Fli1 to regu-
late transcription, and this protein-protein interaction is crucial for development of
Ewing sarcoma, as mutations in NR0B1 disrupting the interaction directly block
oncogenic transformation (Kinsey et al. 2009). Other targets found to be required
for optimal transformation are NKX2-2 (NK2 homeobox 2) (Smith et al. 2006), and
EZH2 (enhancer of zeste homolog 2) (Richter et al. 2009). Ewing sarcoma is de-
pendent on IGF-1 (insulin-like growth factor-1) for tumor growth and survival, and
this gene is also one of the up-regulated targets of the EWSR1-FLI1 fusion (Cironi
et al. 2008). One direct down-regulated target is TGF-βR2 (transforming growth
factor-beta receptor type II) (Hahm et al. 1999; Im et al. 2000).
Being the hallmark of Ewing sarcoma, these fusion genes are an interest-
ing focus for targeted therapies. These fusions lead to abnormal DNA and protein
sequences, that can only be found in the tumor cells and not elsewhere in the body.
Knocking out expression of the EWSR1-FLI1 fusion gene using antisense oligonu-
cleotides has been shown to dramatically inhibit tumor growth both in cell lines
and mouse models (Kovar et al. 1996; Tanaka et al. 1997; Hu-Lieskovan et al. 2005).
9
The result is a decrease in cell proliferation and increased apoptosis. However, ther-
apeutic applications are yet to reach clinical use. The fusion protein has proven
to be difficult to study in vitro, because of poor solubility, difficulties in biochem-
ical purification, and presence of unstructured regions. This has lead Uren and
Toretsky (2005) to describe the EWSR-FLI1 fusion as “the perfect target without a
therapeutic agent”.
1.2.3 Other genomic alterations
In addition to the characteristic gene fusions, secondary genetic changes are detected
in about 80 % of Ewing sarcomas at the time of diagnosis (Zielenska et al. 2001;
Roberts et al. 2008). The most common copy number aberrations are gains of 1q,
8 and 12, and losses of 9p21.3 and 16q. Most of these changes have been associated
with unfavorable clinical outcome, including the gain of 1q (Hattinger et al. 2002),
deletion of 1p36 (Hattinger et al. 1999), loss of 9p21.3 (Huang et al. 2005), and loss
of 16q (Hattinger et al. 2002). An unbalanced translocation between chromosomes 1
and 16 has been observed in about 10 % of cases, resulting in a derivate chromosome
16, and subsequent gain of 1q and loss of 16q. It has been associated with poor
survival (Douglass et al. 1990; Hattinger et al. 2002).
Adverse effects on prognosis have also been described for an increase in
the overall number of copy number aberrations (Sandberg and Bridge 2000; Zielenska
et al. 2001), and for mutations in TP53, especially when combined with a deletion
of the CDKN2A (cyclin-dependent kinase inhibitor 2A) gene (de Alava et al. 2000;
Huang et al. 2005). Even though mutations affecting the tumor suppressor gene
TP53 at 17p31.1 are one of the most common genetic alterations in sporadic cancers
(Nigro et al. 1989), they are relatively rare in Ewing sarcoma (Patiño-García and
10
Sierrasesúmaga 1997; Tsuchiya et al. 2000; López-Guerrero et al. 2001; Huang et al.
2005).
1.2.4 Cell of origin
The exact cell type where Ewing sarcoma originates from has been under debate.
Among proposed alternatives are endothelial, hematopoietic and neuronal cells. One
of the challenges in identifying the cell of origin is the relative toxicity of the EWSR1-
FLI1 fusion gene for a variety of cell types. Recent studies have suggested that the
most probable origin is mesenchymal stem cells (MSC), also known as mesenchymal
progenitor cells (MPC). These multipotent cells are capable of differentiating along
a variety of lineages and have the capacity for self renewal. MSCs can differentiate
along osteogenic, lipogenic, or adipogenic lineages, and the potential differentiated
cell types include osteoblasts, chondrocytes, adipocytes, myocytes, neurons, hepa-
tocytes, and pancreatic islet cells.
By using a retroviral expression vector, Riggi et al. (2005) introduced
the EWSR1-FLI1 fusion gene into murine MPCs and were able to induce Ewing
sarcoma-like tumors in SCID (severe combined immunodeficiency) mice. In addition
to demonstrating the potential of MPCs to be the originating cell type of Ewing
sarcoma, this also suggests that at least under immunocompromised conditions, the
EWSR1-FLI1 fusion might be sufficient for tumor formation. Similar results were
also obtained by Castillero-Trejo et al. (2005). In a further study, Riggi et al. (2008)
introduced the EWSR1-FLI1 fusion gene into human MSCs, which resulted in a
gene expression signature strikingly similar to that of Ewing sarcoma. However,
these cells failed to induce tumors in a mouse xenograft model, suggesting that
other transforming steps are also required. Another indication in this direction is
11
the observation that introduction of the EWSR1-FLI1 fusion gene into mouse bone
marrow compartment resulted in leukemia, not Ewing sarcoma-like tumors (Torchia
et al. 2007).
Kauer et al. (2009) studied five Ewing sarcoma cell lines with EWSR1-
FLI1 expression silenced using RNA interference (RNAi) and compared the mRNA
expression signatures against a collection of 80 normal tissues (Su et al. 2004). The
highest correlation was observed with fetal lung fibroblasts, suggesting mesenchy-
mal origin of Ewing sarcoma. An analogous approach was used by Potikyan et al.
(2008), who made a similar comparison against the Celsius database (Day et al.
2007). This study identified IMR-90, a fetal fibroblast cell line, as a close match in
terms of Affymetrix expression signatures. Also a third investigation using RNAi
showed that the expression profiles of three EWSR1-FLI1-silenced Ewing sarcoma
cell lines converge towards that of MSCs (Tirode et al. 2007). Furthermore, when
treated with the appropriate conditions, these cells were able to differentiate along
adipogenic, chondrogenic and osteocytic lineages, suggesting restoration of a MSC-
like phenotype.
Although there is evidence suggesting mesenchymal stem cells to be the
originating cell type of Ewing sarcomas, some uncertainty still remains. For example,
the observation of Ewing sarcoma-like tumors upon introduction of the EWSR1-
FLI1 fusion into murine MPCs (Riggi et al. 2005) has been questioned by Kovar
and Bernard (2006). The interpretation of these tumors being similar to Ewing
sarcoma was based on the presence of CD99 on the cell surface. Among humans,
this antigen is a diagnostic hallmark of Ewing sarcoma, being present on more than
90% of the cases. A CD99 orthologue has been described in mice (Bixel et al. 2004),
but bears similarities to the human gene mostly in its transmembrane region (Park
et al. 2005). The antibody used to detect CD99 was O13 (Signet Laboratories,
12
Dedham, MA), which binds to the DGEN motif between residues 49 and 64 of
human CD99 (Banting et al. 1989), a motif completely lacking from the murine
gene. It therefore remains open whether the detected signal is derived from other
proteins. The authors also point out that even after knocking down expression of
EWSR1-FLI1, CD99 expression remains high in Ewing sarcoma cells. A precursor
already expressing CD99 could therefore be expected, which is not the case for the
mouse MPCs and the O13 antibody.
Even as uncertainty remains about the histogenesis of Ewing sarcoma,
multiple pieces of evidence point towards mesenchymal stem cells as the cell of
origin, and they are currently considered as the most probable alternative among
the scientific community.
1.3 Microarray technology
1.3.1 Comparative genomic hybridization and DNA copy number
Each DNA locus of a diploid species, such as humans, is usually present in a normal
copy number of two. One allele being inherited from the mother, and the other from
the father. However, cancers frequently exhibit copy number aberrations. Portions
of the genome can show homozygous (both copies) or heterozygous (one copy) dele-
tions, gains of one or more copies, or higher-level amplifications. The field of cytoge-
netics has traditionally measured these copy number changes through comparative
genomic hybridization (CGH). In this technology, tumor and reference DNAs are
labeled with different fluorescent dyes, and hybridized to metaphase chromosomes
fixed on a glass slide. The two samples compete with each other to hybridize to
DNA sequences present on the glass, and the amount of fluorescent signal therefore
13
represents the relative abundance of DNA from specific loci. The main drawback of
conventional CGH is its low resolution, as aberrations smaller than 5-10 Mb cannot
be detected (Forozan et al. 1997).
The advent of array comparative genomic hybridization (aCGH) replaced
the metaphase spreads with DNA sequences attached to a solid medium (Kallioniemi
et al. 1992), and allowed more accurate detection of copy number aberrations (Pinkel
et al. 1998). For these arrays, various sources of DNA have been used: BACs (bac-
terial artificial chromosomes/clones), cDNA (complementary DNA), and oligonu-
cleotides (Ylstra et al. 2006). BAC arrays (Solinas-Toldo et al. 1997) produce clear
results, but their resolution is limited to ∼ 1 Mb, because of the large size of the
clones. cDNA probes have noisier signals, but increased resolution, and perhaps
more importantly, allow mRNA expression measurements using the same array plat-
form (Pollack et al. 1999). The latest development is the use of oligonucleotides,
which can be either spotted on the array or synthesized in situ (Brennan et al. 2004;
Carvalho et al. 2004). As the technology has matured, the number of oligonucleotide
probes on the array has increased from tens of thousands to hundreds of thousands
and even millions.
The majority of aCGH array platforms are two-channel arrays, such as
those manufactured by Agilent Technologies (Santa Clara, CA, USA). DNA from
test and reference samples are labeled with different fluorescent dyes and hybridized
to the array. Additionally, single nucleotide polymorphism (SNP) microarrays,
which were initially designed for genotyping purposes, are now also adopted for
copy number analysis (Bignell et al. 2004; Zhao et al. 2005). While Agilent arrays
use 60-mer oligonucleotides, SNP arrays have shorter 25-mer probes. SNP arrays
have lower sensitivity and specificity, but their main advantage is that they enable
the study of copy number neutral loss of heterozygosity (LOH) due to uniparental
14
disomy (UPD) (Cowell and Lo 2009; Tuna et al. 2009). They can also provide better
detection of copy number aberrations in gene-poor areas (Greshock et al. 2007).
In addition to cancer, aCGH arrays are used to study congenital disor-
ders, and also copy number variations (CNVs) in healthy populations. Both small
and large-scale CNVs are widespread and common, and present an important source
of genetic variation in the human genome (Sebat et al. 2004; Tuzun et al. 2005; Redon
et al. 2006). They can contribute to disease susceptibility and might have a role in
cancer etiology (Zhang et al. 2009; Shlien and Malkin 2010).
While different approaches to analysis of aCGH microarray data exist,
they generally involve the following phases, either as separate steps or fused together:
(1) Segmentation divides the normalized log2 ratios into non-overlapping segments,
that most likely share a common copy number. (2) Calling assigns discrete copy
numbers to the segments. While some algorithms are able to distinguish homozy-
gous and heterozygous deletions from each other, and also gains and higher-level
amplifications, others divide the data simply into gains, losses, and normal copy
number. (3) An optional, but often performed step is also to identify regions with
aberrations that are shared across different samples. At the moment there is no clear
consensus in the aCGH community regarding which stage of data should be used
for more downstream analysis, such as integration with expression. But compared
to normalized or segmented log2 ratios, use of calls does have the benefit of a clear
biological meaning (van Wieringen et al. 2007). In this study, segmentation was per-
formed using DNAcopy (Venkatraman and Olshen 2007) and calling with CGHcall
(van de Wiel et al. 2007), which fits the segmented values into a probabilistic model
to obtain the discrete copy number calls. Along these calls, the algorithm also re-
turns the probabilities with which the calls were made. While going from continuous
log2 ratios to discrete, hard calls loses information and hence lowers the statistical
15
power, the call probabilities (or “soft calls”) retain much of this information. Using
them for downstream analysis steps can therefore yield improved results compared
to the hard calls (van Wieringen and van de Wiel 2009), while still maintaining the
added interpretability of gains and losses compared to continuous log2 ratios.
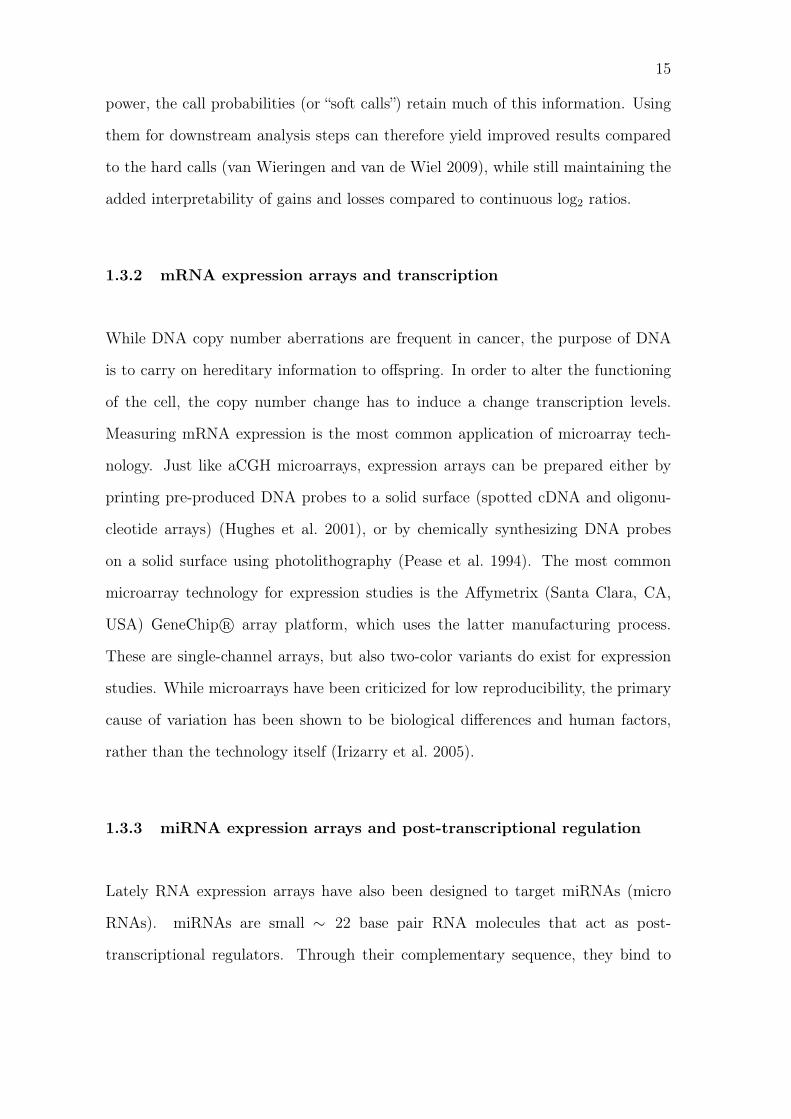
1.3.2 mRNA expression arrays and transcription
While DNA copy number aberrations are frequent in cancer, the purpose of DNA
is to carry on hereditary information to offspring. In order to alter the functioning
of the cell, the copy number change has to induce a change transcription levels.
Measuring mRNA expression is the most common application of microarray tech-
nology. Just like aCGH microarrays, expression arrays can be prepared either by
printing pre-produced DNA probes to a solid surface (spotted cDNA and oligonu-
cleotide arrays) (Hughes et al. 2001), or by chemically synthesizing DNA probes
on a solid surface using photolithography (Pease et al. 1994). The most common
microarray technology for expression studies is the Affymetrix (Santa Clara, CA,
USA) GeneChip R© array platform, which uses the latter manufacturing process.
These are single-channel arrays, but also two-color variants do exist for expression
studies. While microarrays have been criticized for low reproducibility, the primary
cause of variation has been shown to be biological differences and human factors,
rather than the technology itself (Irizarry et al. 2005).
1.3.3 miRNA expression arrays and post-transcriptional regulation
Lately RNA expression arrays have also been designed to target miRNAs (micro
RNAs). miRNAs are small ∼ 22 base pair RNA molecules that act as post-
transcriptional regulators. Through their complementary sequence, they bind to

16
mRNAs molecules, usually resulting in degradation and/or blockage of transla-
tion, although up-regulation has also been described (Vasudevan et al. 2007). The
most popular microarray platform is Agilent miRNA arrays, which contain 60-mer
oligonucleotide probes and use a single-channel design.
17
2 Materials and Methods
2.1 Materials
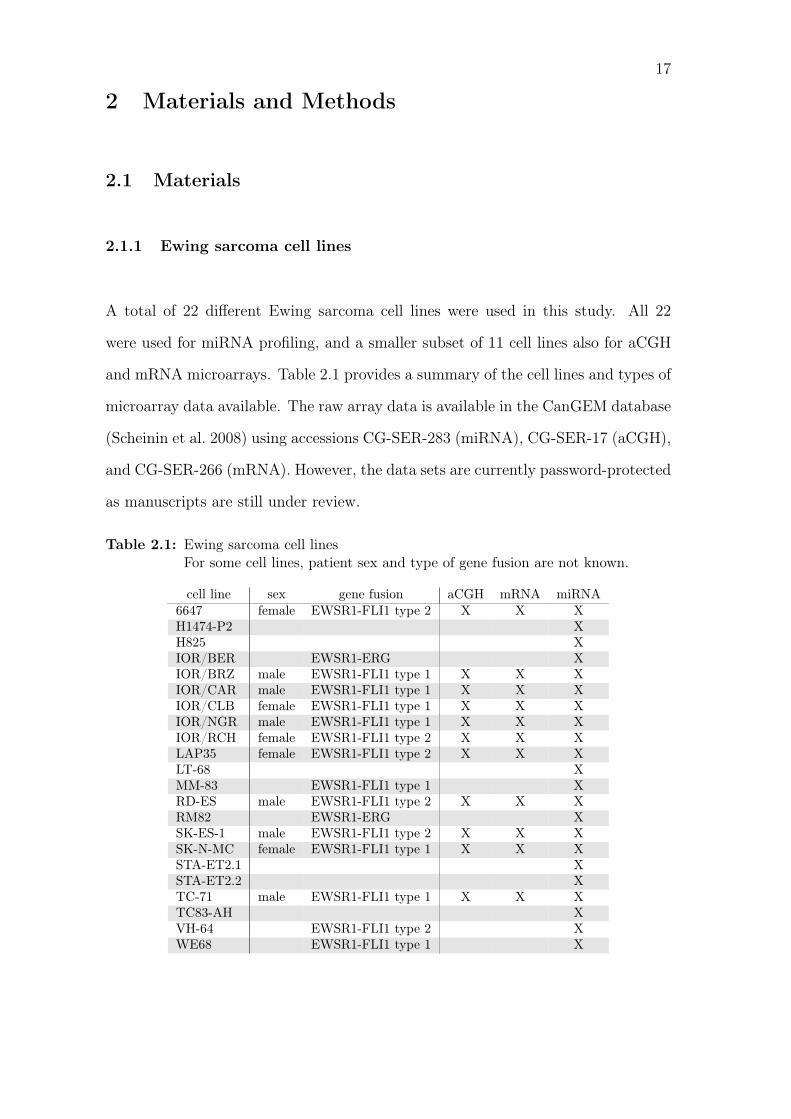
2.1.1 Ewing sarcoma cell lines
A total of 22 different Ewing sarcoma cell lines were used in this study. All 22
were used for miRNA profiling, and a smaller subset of 11 cell lines also for aCGH
and mRNA microarrays. Table 2.1 provides a summary of the cell lines and types of
microarray data available. The raw array data is available in the CanGEM database
(Scheinin et al. 2008) using accessions CG-SER-283 (miRNA), CG-SER-17 (aCGH),
and CG-SER-266 (mRNA). However, the data sets are currently password-protected
as manuscripts are still under review.
Table 2.1: Ewing sarcoma cell linesFor some cell lines, patient sex and type of gene fusion are not known.
cell line sex gene fusion aCGH mRNA miRNA6647 female EWSR1-FLI1 type 2 X X XH1474-P2 XH825 XIOR/BER EWSR1-ERG XIOR/BRZ male EWSR1-FLI1 type 1 X X XIOR/CAR male EWSR1-FLI1 type 1 X X XIOR/CLB female EWSR1-FLI1 type 1 X X XIOR/NGR male EWSR1-FLI1 type 1 X X XIOR/RCH female EWSR1-FLI1 type 2 X X XLAP35 female EWSR1-FLI1 type 2 X X XLT-68 XMM-83 EWSR1-FLI1 type 1 XRD-ES male EWSR1-FLI1 type 2 X X XRM82 EWSR1-ERG XSK-ES-1 male EWSR1-FLI1 type 2 X X XSK-N-MC female EWSR1-FLI1 type 1 X X XSTA-ET2.1 XSTA-ET2.2 XTC-71 male EWSR1-FLI1 type 1 X X XTC83-AH XVH-64 EWSR1-FLI1 type 2 XWE68 EWSR1-FLI1 type 1 X
18
2.1.2 Reference samples
For aCGH, blood samples were obtained from Blood Service, Red Cross, Finland to
be used as a normal reference. For sex-matched hybridizations, separate male and
female references were used and they consisted of pooled blood samples from four
individuals.
Two mesenchymal stem cells specimens were used as the normal reference
for miRNA screening, and the microarrays were performed in our own laboratory
along with the Ewing sarcoma cell line samples.
For the mRNA expression set, no reference data was available. Gene
Expression Omnibus (GEO) database (Barrett et al. 2009) was queried for mesenchy-
mal stem cell data measured with the same Affymetrix U133A Plus 2.0 microarray
platform as the Ewing sarcoma cell lines. Series GSE7888 (Tanabe et al. 2008),
which consists of 23 hMSC specimens derived from bone marrow, was downloaded
and used as a reference.
2.2 Methods
As this thesis is focused on the downstream bioinformatic analyses and not on
the generation of the microarray data, steps from DNA/RNA extraction to image
analysis of the scanned arrays are not described. aCGH profiling was performed
using the Human Genome CGH 44B oligo microarrays (Agilent Technologies, Santa
Clara, CA, USA) as described by Savola et al. (2007). For mRNA expression,
Affymetrix Human Genome U133 Plus 2.0 oligonucleotide arrays (Affymetrix, Santa
Clara, CA, USA) were used as previously described for Ewing sarcoma patient
19
samples (Savola et al. 2009). Agilent miRNA V3 microarays were used to measure
miRNA expression.
The data analysis was performed with Chipster (Kallio et al. Submitted,
http://chipster.csc.fi/), which is a microarray analysis software developed by
CSC (Espoo, Finland). Chipster provides a user-friendly graphical user interface for
running tools written using the R statistical programming language (R Development
Core Team 2009). Most of the functionality is provided with packages from the
Bioconductor project (Gentleman et al. 2004). For aCGH analysis methods, the
functionality was not previously available in Chipster, but has been implemented
as a part ot this thesis work. Unless stated otherwise, all algorithms were run with
default parameters, and p-values adjusted using the Benjamini-Hochberg method
(Benjamini and Hochberg 1995).
2.2.1 Identifying gains and losses from aCGH data
For the aCGH data set, normexp background-correction was performed with an off-
set of 50, which has been shown to perform well with two-color arrays (Ritchie et al.
2007), and normalization was carried out using loess (Smyth and Speed 2003). A
wavy pattern that is typically observed with aCGH profiles (Marioni et al. 2007) was
removed using the NoWaves package (van de Wiel et al. 2009) and a calibration data
set measured with the same array platform from clinical genetics samples (Siggberg
et al. 2010). Log2 ratios were then segmented with DNAcopy (Venkatraman and
Olshen 2007) and called using CGHcall (van de Wiel et al. 2007) to identify gains
and losses.
Common aberrations shared between samples were identified using CGHregions
(van de Wiel and van Wieringen 2007), which compresses regions of adjacent array
20
elements into single data points when they are shared between almost all of the
samples.
Loss and gain frequencies were calculated for each region, and converted
from absolute to relative frequencies as follows: For each region, the mean loss (gain)
frequency of the two adjacent regions was subtracted from the frequency of losses
(gains) for this region. For the very first (last) region of every chromosome, only
the frequency of the next (previous) one was used.
For each region, the percent overlap with reported copy number varia-
tions (CNVs) from the Database of Genomic Variants (Zhang et al. 2006) was also
calculated.
To be able to inspect aberration frequencies of individual genes, the
aCGH data was also converted from probe to gene-based as previously described
(Scheinin et al. 2008). Briefly, the full list of human genes was downloaded from
Ensembl 59 database (Flicek et al. 2011). For each gene, it was first checked whether
there were probes on the array that overlap with the position of the gene. If yes,
these probe(s) were used to derive the copy number call for this particular gene. If
no, the last probe preceding and first one tailing the gene were used. If more than
50 % of the probes in question showed an aberration, that particular call was chosen
for the gene. Otherwise the copy number of the gene was called as a normal.
2.2.2 Detecting differentially expressed mRNAs
The Affymetrix GeneChip R© data of 11 Ewing cell lines and 23 mesenchymal stem
cell reference samples (GSE7888) were normalized using the gcRMA algorithm (Wu
et al. 2004).
21
Differentially expressed probe sets were identified with an empirical Bayes
method (Smyth 2004) with a p-value cutoff of 0.05 and fold-change of at least two-
fold.
As gcRMA normalization is performed across-arrays for the entire data
set, and there can be a technological differences between the cell line data generated
in our own laboratory and the data set downloaded from GEO, the 11 Ewing sar-
coma cell lines were also normalized separately without the reference samples from
GSE7888. This separately normalized data set was used for integrative analyses
with the aCGH miRNA data sets. Before integration, 75% of probe sets with the
lowest coefficient of variation (CV = standard deviation / mean) were filtered out.
2.2.3 Detecting differentially expressed miRNAs
Different ways of preprocessing Agilent miRNA have been compared by López-
Romero et al. (2010), and the approach resulting in the lowest variability between
biological replicates was used here. Briefly, background-correction was not per-
formed, replicate probes were averaged by taking the median, log2 transformed
intensities were normalized using quantile normalization, and finally, the RMA al-
gorithm (Irizarry et al. 2003) was used to summarize multiple probes that hybridize
to the same miRNA into a single expression value. As most of the miRNAs are not
expected to be differentially expressed, 75% with the lowest coefficient of variation
were filtered out.
Differentially expressed miRNAs were identified using an empirical Bayes
method (Smyth 2004). The p-value threshold was set to 0.05 and a two-fold change
was also required.
22
2.2.4 Identifying copy-number-induced expression changes
The effect of copy number changes on (miRNA or mRNA) expression was evaluated
with the intCNGEan algorithm (van Wieringen and van de Wiel 2009). First, only
those samples were selected that had both types of microarray data available. Then
the two data sets were matched so that for each expression probe (or probe set),
the closest aCGH probe was selected to represent its DNA copy number. Next, for
each probe a choice was made on whether to perform a two-group test between “loss
vs. no-loss (normal or gain)” or “no-gain (loss or normal) vs. gain”. The choice
was based on whether more losses or gains were observed for that particular aCGH
probe. Finally, a permutation-based non-parametric test was used to evaluate the
statistical significance of expression changes between the two groups.
2.2.5 Evaluating effect of miRNA expression on mRNA levels
To evaluate effects of miRNA expression on mRNA levels, predicted miRNA target
genes were downloaded from PicTar (Krek et al. 2005) and TargetScan databases
(Lewis et al. 2005). An intersection was taken between the two lists to only ac-
cept predictions present in both. Filtered miRNA and mRNA data sets were then
paired with the target predictions and Kendall correlation coefficients and p-values
calculated between each miRNA-target pair.
23
3 Results
A saved session for the Chipster analysis software can be downloaded from the
following URL: http://ilari.scheinin.fi/progradu.cs
3.1 Copy number aberrations
After preprocessing, the aCGH data was segmented and called to identify copy
number aberrations. Overall, more gains than losses were detected, with the most
frequent gains located in chromosomes 8, 1q and X, and most frequent losses in 9p,
16q and 17p. Copy number profiles of individual samples are shown in Figure A.1
on page 67.
After calling, the dimensionality of the data was reduced by identifying
common regions. As the exact breakpoints around driving cancer genes vary slightly
from one sample to another, a loss of 1% of information was allowed to focus on
biologically relevant results. This yielded a total of 284 regions. The most frequent
losses and gains (over 50 % of the samples) are listed in Table 3.1, and all regions
are listed in Table A.1 on page 74.
As copy number aberrations generally cover bystander genes in addition
to the cancerous ones, gain and loss frequencies were also transformed from abso-
lute to relative frequencies by subtracting from each region’s frequency the mean
frequency of the two adjacent regions. This allows better identification of regions
containing the true driving genes from ones that show relatively high aberration
frequencies based on their proximity to a region with a driving gene. Table 3.4 on
page 35 lists regions with the highest relative aberration frequencies (at least 10 %),
24
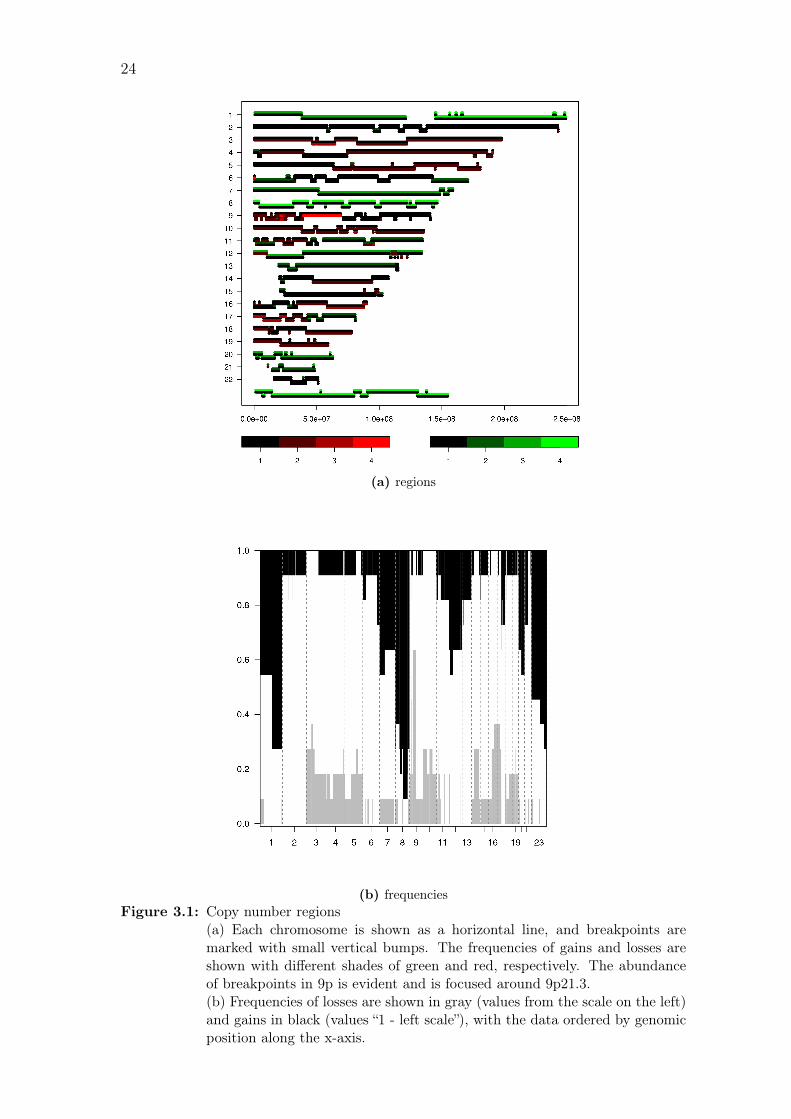
(a) regions
(b) frequenciesFigure 3.1: Copy number regions
(a) Each chromosome is shown as a horizontal line, and breakpoints aremarked with small vertical bumps. The frequencies of gains and losses areshown with different shades of green and red, respectively. The abundanceof breakpoints in 9p is evident and is focused around 9p21.3.(b) Frequencies of losses are shown in gray (values from the scale on the left)and gains in black (values “1 - left scale”), with the data ordered by genomicposition along the x-axis.
25
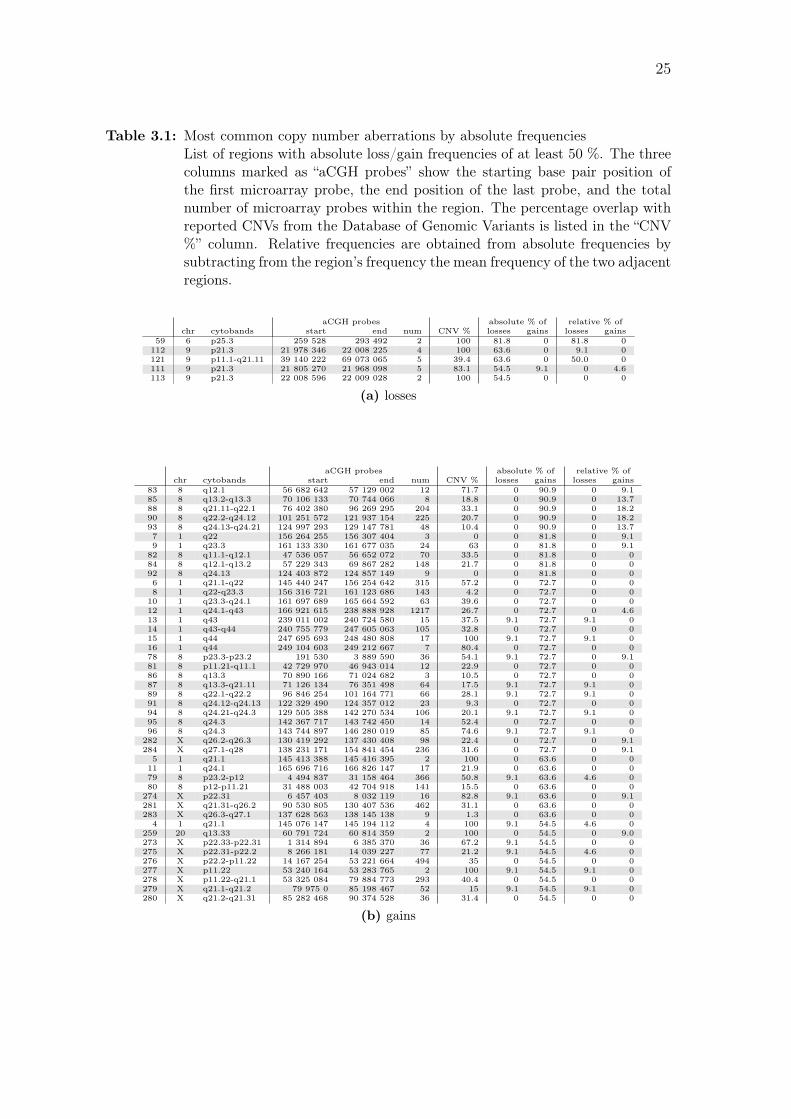
Table 3.1: Most common copy number aberrations by absolute frequenciesList of regions with absolute loss/gain frequencies of at least 50 %. The threecolumns marked as “aCGH probes” show the starting base pair position ofthe first microarray probe, the end position of the last probe, and the totalnumber of microarray probes within the region. The percentage overlap withreported CNVs from the Database of Genomic Variants is listed in the “CNV%” column. Relative frequencies are obtained from absolute frequencies bysubtracting from the region’s frequency the mean frequency of the two adjacentregions.
aCGH probes absolute % of relative % ofchr cytobands start end num CNV % losses gains losses gains
59 6 p25.3 259 528 293 492 2 100 81.8 0 81.8 0112 9 p21.3 21 978 346 22 008 225 4 100 63.6 0 9.1 0121 9 p11.1-q21.11 39 140 222 69 073 065 5 39.4 63.6 0 50.0 0111 9 p21.3 21 805 270 21 968 098 5 83.1 54.5 9.1 0 4.6113 9 p21.3 22 008 596 22 009 028 2 100 54.5 0 0 0
(a) losses
aCGH probes absolute % of relative % ofchr cytobands start end num CNV % losses gains losses gains
83 8 q12.1 56 682 642 57 129 002 12 71.7 0 90.9 0 9.185 8 q13.2-q13.3 70 106 133 70 744 066 8 18.8 0 90.9 0 13.788 8 q21.11-q22.1 76 402 380 96 269 295 204 33.1 0 90.9 0 18.290 8 q22.2-q24.12 101 251 572 121 937 154 225 20.7 0 90.9 0 18.293 8 q24.13-q24.21 124 997 293 129 147 781 48 10.4 0 90.9 0 13.77 1 q22 156 264 255 156 307 404 3 0 0 81.8 0 9.19 1 q23.3 161 133 330 161 677 035 24 63 0 81.8 0 9.182 8 q11.1-q12.1 47 536 057 56 652 072 70 33.5 0 81.8 0 084 8 q12.1-q13.2 57 229 343 69 867 282 148 21.7 0 81.8 0 092 8 q24.13 124 403 872 124 857 149 9 0 0 81.8 0 06 1 q21.1-q22 145 440 247 156 254 642 315 57.2 0 72.7 0 08 1 q22-q23.3 156 316 721 161 123 686 143 4.2 0 72.7 0 010 1 q23.3-q24.1 161 697 689 165 664 592 63 39.6 0 72.7 0 012 1 q24.1-q43 166 921 615 238 888 928 1217 26.7 0 72.7 0 4.613 1 q43 239 011 002 240 724 580 15 37.5 9.1 72.7 9.1 014 1 q43-q44 240 755 779 247 605 063 105 32.8 0 72.7 0 015 1 q44 247 695 693 248 480 808 17 100 9.1 72.7 9.1 016 1 q44 249 104 603 249 212 667 7 80.4 0 72.7 0 078 8 p23.3-p23.2 191 530 3 889 590 36 54.1 9.1 72.7 0 9.181 8 p11.21-q11.1 42 729 970 46 943 014 12 22.9 0 72.7 0 086 8 q13.3 70 890 166 71 024 682 3 10.5 0 72.7 0 087 8 q13.3-q21.11 71 126 134 76 351 498 64 17.5 9.1 72.7 9.1 089 8 q22.1-q22.2 96 846 254 101 164 771 66 28.1 9.1 72.7 9.1 091 8 q24.12-q24.13 122 329 490 124 357 012 23 9.3 0 72.7 0 094 8 q24.21-q24.3 129 505 388 142 270 534 106 20.1 9.1 72.7 9.1 095 8 q24.3 142 367 717 143 742 450 14 52.4 0 72.7 0 096 8 q24.3 143 744 897 146 280 019 85 74.6 9.1 72.7 9.1 0282 X q26.2-q26.3 130 419 292 137 430 408 98 22.4 0 72.7 0 9.1284 X q27.1-q28 138 231 171 154 841 454 236 31.6 0 72.7 0 9.15 1 q21.1 145 413 388 145 416 395 2 100 0 63.6 0 011 1 q24.1 165 696 716 166 826 147 17 21.9 0 63.6 0 079 8 p23.2-p12 4 494 837 31 158 464 366 50.8 9.1 63.6 4.6 080 8 p12-p11.21 31 488 003 42 704 918 141 15.5 0 63.6 0 0274 X p22.31 6 457 403 8 032 119 16 82.8 9.1 63.6 0 9.1281 X q21.31-q26.2 90 530 805 130 407 536 462 31.1 0 63.6 0 0283 X q26.3-q27.1 137 628 563 138 145 138 9 1.3 0 63.6 0 04 1 q21.1 145 076 147 145 194 112 4 100 9.1 54.5 4.6 0
259 20 q13.33 60 791 724 60 814 359 2 100 0 54.5 0 9.0273 X p22.33-p22.31 1 314 894 6 385 370 36 67.2 9.1 54.5 0 0275 X p22.31-p22.2 8 266 181 14 039 227 77 21.2 9.1 54.5 4.6 0276 X p22.2-p11.22 14 167 254 53 221 664 494 35 0 54.5 0 0277 X p11.22 53 240 164 53 283 765 2 100 9.1 54.5 9.1 0278 X p11.22-q21.1 53 325 084 79 884 773 293 40.4 0 54.5 0 0279 X q21.1-q21.2 79 975 0 85 198 467 52 15 9.1 54.5 9.1 0280 X q21.2-q21.31 85 282 468 90 374 528 36 31.4 0 54.5 0 0
(b) gains
26
together with the number of differentially expressed mRNAs and miRNAs within
these regions.
The probe-based aCGH data was also converted to gene-based to be able
to assess aberration frequencies of individual genes. The full list of 49 733 genes from
Ensembl version 59 (Flicek et al. 2011) can be found from the saved Chipster session.
3.2 Differentially expressed mRNAs
As no Affymetrix expression measurements of mesenchymal stem cells were avail-
able from our own laboratory, an external and previously published data set was
used. Series GSE7888 (Tanabe et al. 2008) was retrieved from the Gene Expression
Omnibus database (Barrett et al. 2009). After normalizing the 11 Ewing sarcoma
cell lines together with the 23 reference samples, a total of 14 903 differentially ex-
pressed probe sets (corresponding to 8 366 genes) were detected. Instead of choosing
more stringent cutoffs for p-values (0.05) and fold change (at least two-fold) to ob-
tain a more manageable list of differentially expressed mRNAs, these more tolerant
values were chosen because external reference samples were used. As this results in
increased technical bias between the two data sets, use of strict criteria could miss
the more interesting biological differences while returning only technical ones. For
this reason, the long list of differentially expressed mRNAs was selected to not to be
used on its own, but instead to be integrated with DNA copy number results from
the aCGH data set and as predicted targets of miRNAs.
27
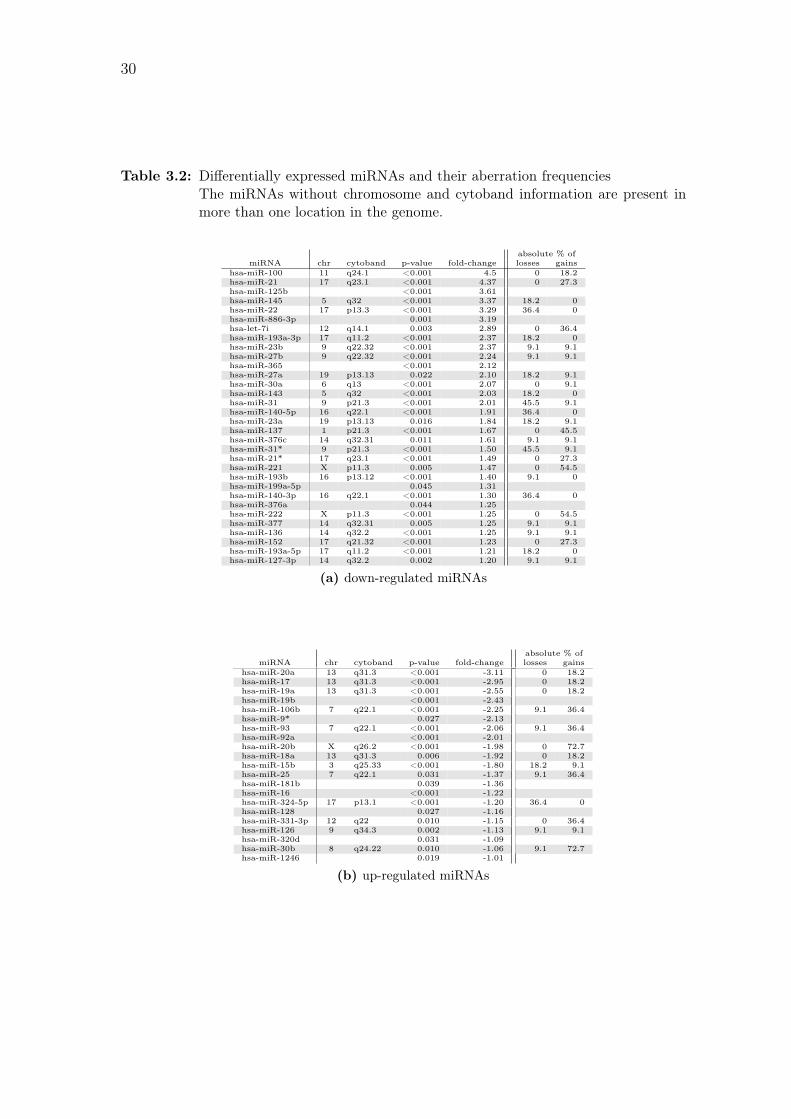
3.3 Differentially expressed miRNAs
miRNAs differentially expressed in the 22 Ewing sarcoma cell lines compared to the
two reference samples were detected with empirical Bayes. Selecting miRNAs with
a p-value smaller than 0.05 and an at least two-fold change in expression resulted
in 32 down-regulated and 21 up-regulated miRNAs, which are listed in Table 3.2.
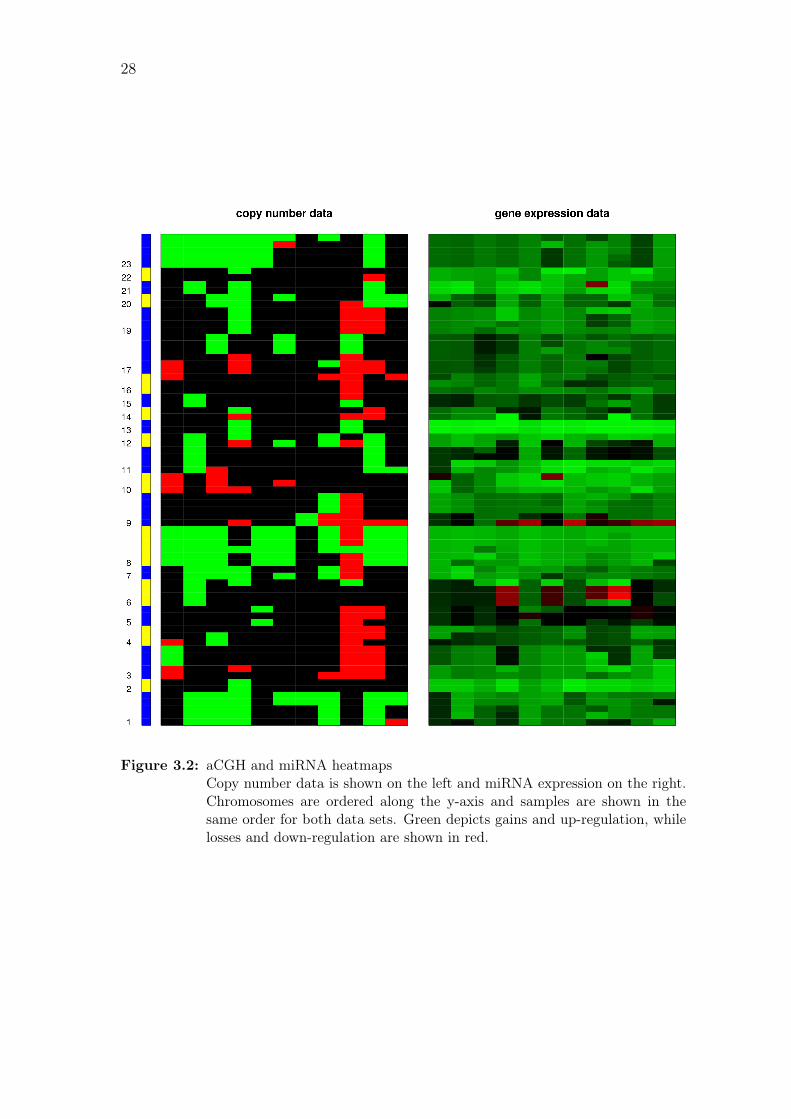
3.4 Effect of DNA copy number on miRNA expression
To evaluate the effect of changes in DNA copy number to miRNA expression, an
integrated analysis was performed for the Agilent aCGH and miRNA expression
data sets. Figure 3.2 shows heatmaps of the data sets after each expression probe
has been paired with the closest aCGH probe to represent its copy number, and
individual samples are shown in Figure A.2 on page 70.
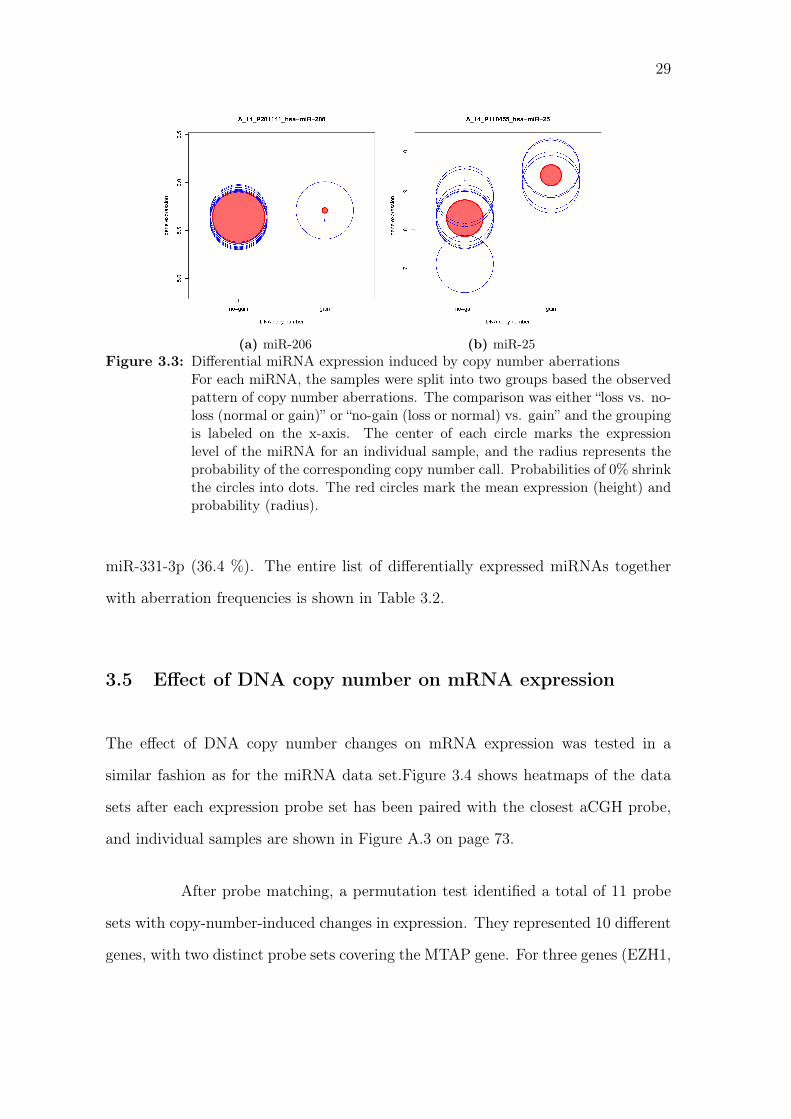
After probe matching, a permutation-based non-parametric test was per-
formed to measure the significance of copy-number-induced expression changes.
After multiple testing correction, all p-values were larger than 0.05. The two small-
est ones were for miR-206 (p-value 0.114) and miR-25 (0.133), and their expression
is plotted in Figure 3.3.
In addition to the systematic testing for copy-number-induced expres-
sion changes, the list of differentially expressed miRNAs was also annotated with
aberration frequencies for the miRNA loci. Down-regulated miRNAs that also show
elevated frequencies of losses include miR-31 and miR-31b (45.5%), and miR-22,
miR-140-5p and miR-140-3p (36.4 %). Up-regulation and frequent gains can be
seen with miR-20b and miR-30b (72.7 %), and miR-106b, miR-93, miR-25 and
28
Figure 3.2: aCGH and miRNA heatmapsCopy number data is shown on the left and miRNA expression on the right.Chromosomes are ordered along the y-axis and samples are shown in thesame order for both data sets. Green depicts gains and up-regulation, whilelosses and down-regulation are shown in red.
29
(a) miR-206 (b) miR-25Figure 3.3: Differential miRNA expression induced by copy number aberrations
For each miRNA, the samples were split into two groups based the observedpattern of copy number aberrations. The comparison was either “loss vs. no-loss (normal or gain)” or “no-gain (loss or normal) vs. gain” and the groupingis labeled on the x-axis. The center of each circle marks the expressionlevel of the miRNA for an individual sample, and the radius represents theprobability of the corresponding copy number call. Probabilities of 0% shrinkthe circles into dots. The red circles mark the mean expression (height) andprobability (radius).
miR-331-3p (36.4 %). The entire list of differentially expressed miRNAs together
with aberration frequencies is shown in Table 3.2.
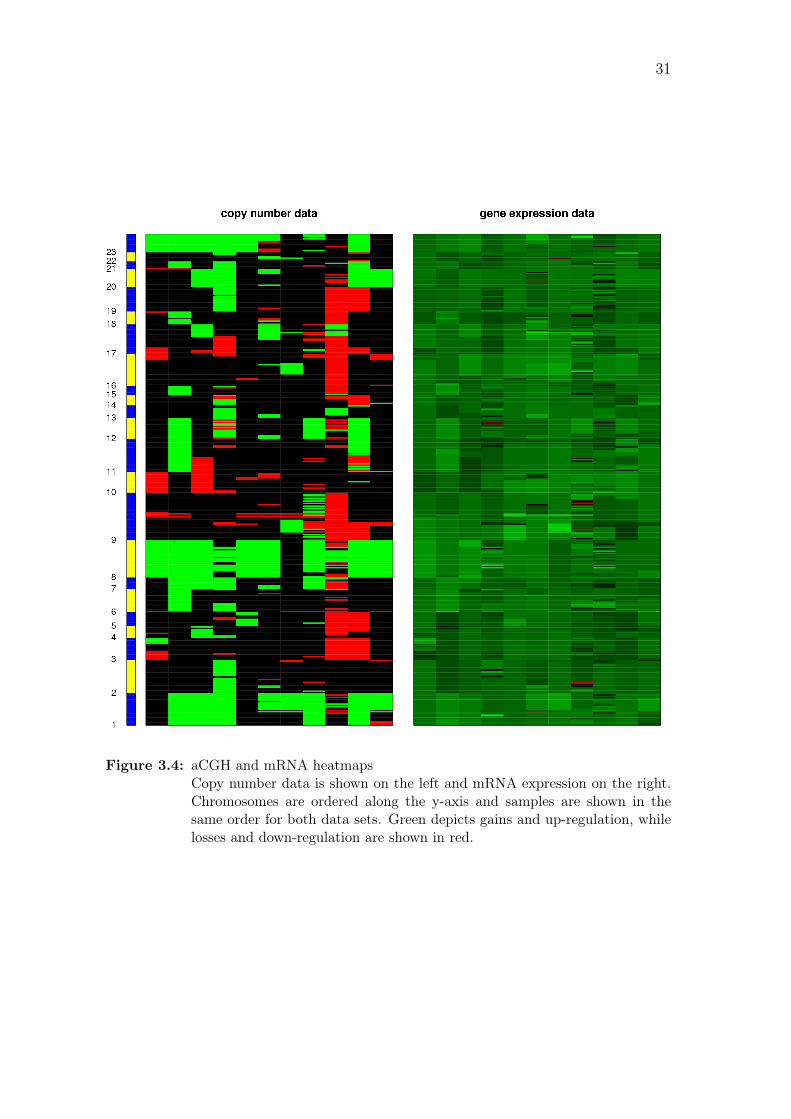
3.5 Effect of DNA copy number on mRNA expression
The effect of DNA copy number changes on mRNA expression was tested in a
similar fashion as for the miRNA data set.Figure 3.4 shows heatmaps of the data
sets after each expression probe set has been paired with the closest aCGH probe,
and individual samples are shown in Figure A.3 on page 73.
After probe matching, a permutation test identified a total of 11 probe
sets with copy-number-induced changes in expression. They represented 10 different
genes, with two distinct probe sets covering the MTAP gene. For three genes (EZH1,
30
Table 3.2: Differentially expressed miRNAs and their aberration frequenciesThe miRNAs without chromosome and cytoband information are present inmore than one location in the genome.
absolute % ofmiRNA chr cytoband p-value fold-change losses gains
hsa-miR-100 11 q24.1 <0.001 4.5 0 18.2hsa-miR-21 17 q23.1 <0.001 4.37 0 27.3hsa-miR-125b <0.001 3.61hsa-miR-145 5 q32 <0.001 3.37 18.2 0hsa-miR-22 17 p13.3 <0.001 3.29 36.4 0hsa-miR-886-3p 0.001 3.19hsa-let-7i 12 q14.1 0.003 2.89 0 36.4hsa-miR-193a-3p 17 q11.2 <0.001 2.37 18.2 0hsa-miR-23b 9 q22.32 <0.001 2.37 9.1 9.1hsa-miR-27b 9 q22.32 <0.001 2.24 9.1 9.1hsa-miR-365 <0.001 2.12hsa-miR-27a 19 p13.13 0.022 2.10 18.2 9.1hsa-miR-30a 6 q13 <0.001 2.07 0 9.1hsa-miR-143 5 q32 <0.001 2.03 18.2 0hsa-miR-31 9 p21.3 <0.001 2.01 45.5 9.1hsa-miR-140-5p 16 q22.1 <0.001 1.91 36.4 0hsa-miR-23a 19 p13.13 0.016 1.84 18.2 9.1hsa-miR-137 1 p21.3 <0.001 1.67 0 45.5hsa-miR-376c 14 q32.31 0.011 1.61 9.1 9.1hsa-miR-31* 9 p21.3 <0.001 1.50 45.5 9.1hsa-miR-21* 17 q23.1 <0.001 1.49 0 27.3hsa-miR-221 X p11.3 0.005 1.47 0 54.5hsa-miR-193b 16 p13.12 <0.001 1.40 9.1 0hsa-miR-199a-5p 0.045 1.31hsa-miR-140-3p 16 q22.1 <0.001 1.30 36.4 0hsa-miR-376a 0.044 1.25hsa-miR-222 X p11.3 <0.001 1.25 0 54.5hsa-miR-377 14 q32.31 0.005 1.25 9.1 9.1hsa-miR-136 14 q32.2 <0.001 1.25 9.1 9.1hsa-miR-152 17 q21.32 <0.001 1.23 0 27.3hsa-miR-193a-5p 17 q11.2 <0.001 1.21 18.2 0hsa-miR-127-3p 14 q32.2 0.002 1.20 9.1 9.1
(a) down-regulated miRNAs
absolute % ofmiRNA chr cytoband p-value fold-change losses gains
hsa-miR-20a 13 q31.3 <0.001 -3.11 0 18.2hsa-miR-17 13 q31.3 <0.001 -2.95 0 18.2hsa-miR-19a 13 q31.3 <0.001 -2.55 0 18.2hsa-miR-19b <0.001 -2.43hsa-miR-106b 7 q22.1 <0.001 -2.25 9.1 36.4hsa-miR-9* 0.027 -2.13hsa-miR-93 7 q22.1 <0.001 -2.06 9.1 36.4hsa-miR-92a <0.001 -2.01hsa-miR-20b X q26.2 <0.001 -1.98 0 72.7hsa-miR-18a 13 q31.3 0.006 -1.92 0 18.2hsa-miR-15b 3 q25.33 <0.001 -1.80 18.2 9.1hsa-miR-25 7 q22.1 0.031 -1.37 9.1 36.4hsa-miR-181b 0.039 -1.36hsa-miR-16 <0.001 -1.22hsa-miR-324-5p 17 p13.1 <0.001 -1.20 36.4 0hsa-miR-128 0.027 -1.16hsa-miR-331-3p 12 q22 0.010 -1.15 0 36.4hsa-miR-126 9 q34.3 0.002 -1.13 9.1 9.1hsa-miR-320d 0.031 -1.09hsa-miR-30b 8 q24.22 0.010 -1.06 9.1 72.7hsa-miR-1246 0.019 -1.01
(b) up-regulated miRNAs
31
Figure 3.4: aCGH and mRNA heatmapsCopy number data is shown on the left and mRNA expression on the right.Chromosomes are ordered along the y-axis and samples are shown in thesame order for both data sets. Green depicts gains and up-regulation, whilelosses and down-regulation are shown in red.
32
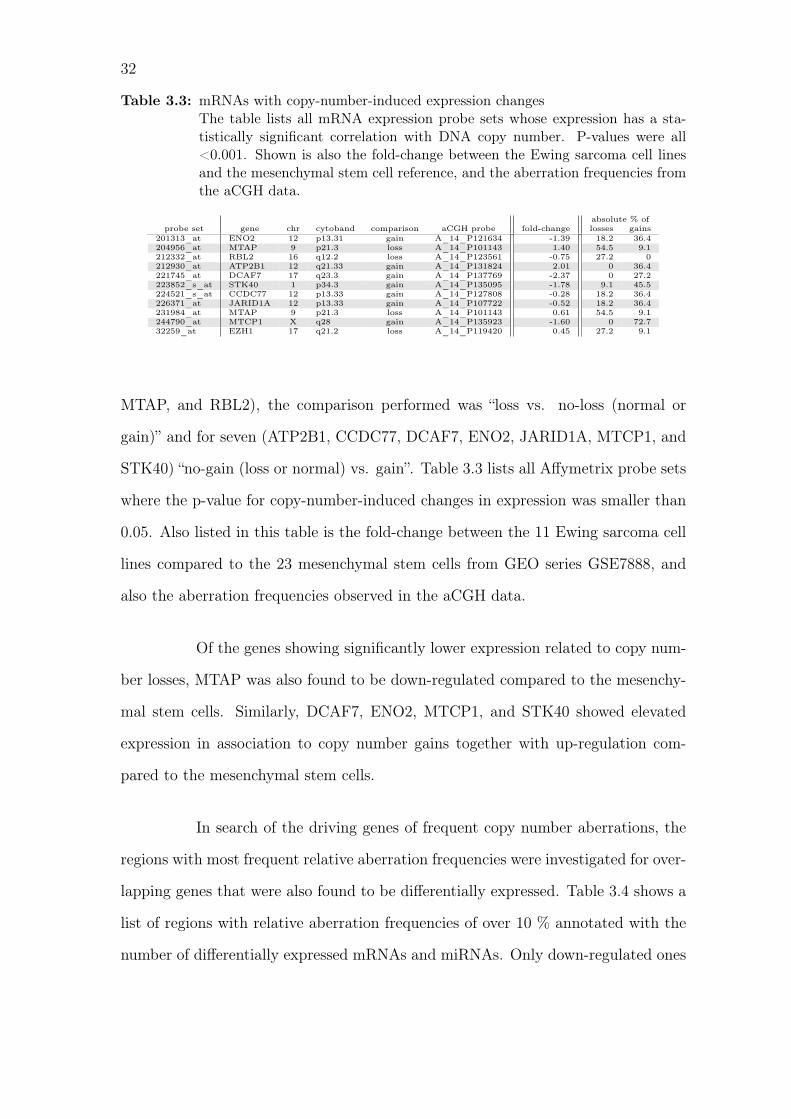
Table 3.3: mRNAs with copy-number-induced expression changesThe table lists all mRNA expression probe sets whose expression has a sta-tistically significant correlation with DNA copy number. P-values were all<0.001. Shown is also the fold-change between the Ewing sarcoma cell linesand the mesenchymal stem cell reference, and the aberration frequencies fromthe aCGH data.
absolute % ofprobe set gene chr cytoband comparison aCGH probe fold-change losses gains
201313_at ENO2 12 p13.31 gain A_14_P121634 -1.39 18.2 36.4204956_at MTAP 9 p21.3 loss A_14_P101143 1.40 54.5 9.1212332_at RBL2 16 q12.2 loss A_14_P123561 -0.75 27.2 0212930_at ATP2B1 12 q21.33 gain A_14_P131824 2.01 0 36.4221745_at DCAF7 17 q23.3 gain A_14_P137769 -2.37 0 27.2223852_s_at STK40 1 p34.3 gain A_14_P135095 -1.78 9.1 45.5224521_s_at CCDC77 12 p13.33 gain A_14_P127808 -0.28 18.2 36.4226371_at JARID1A 12 p13.33 gain A_14_P107722 -0.52 18.2 36.4231984_at MTAP 9 p21.3 loss A_14_P101143 0.61 54.5 9.1244790_at MTCP1 X q28 gain A_14_P135923 -1.60 0 72.732259_at EZH1 17 q21.2 loss A_14_P119420 0.45 27.2 9.1
MTAP, and RBL2), the comparison performed was “loss vs. no-loss (normal or
gain)” and for seven (ATP2B1, CCDC77, DCAF7, ENO2, JARID1A, MTCP1, and
STK40) “no-gain (loss or normal) vs. gain”. Table 3.3 lists all Affymetrix probe sets
where the p-value for copy-number-induced changes in expression was smaller than
0.05. Also listed in this table is the fold-change between the 11 Ewing sarcoma cell
lines compared to the 23 mesenchymal stem cells from GEO series GSE7888, and
also the aberration frequencies observed in the aCGH data.
Of the genes showing significantly lower expression related to copy num-
ber losses, MTAP was also found to be down-regulated compared to the mesenchy-
mal stem cells. Similarly, DCAF7, ENO2, MTCP1, and STK40 showed elevated
expression in association to copy number gains together with up-regulation com-
pared to the mesenchymal stem cells.
In search of the driving genes of frequent copy number aberrations, the
regions with most frequent relative aberration frequencies were investigated for over-
lapping genes that were also found to be differentially expressed. Table 3.4 shows a
list of regions with relative aberration frequencies of over 10 % annotated with the
number of differentially expressed mRNAs and miRNAs. Only down-regulated ones
33
(a) STK40 (b) MTAP
(c) MTAP (d) JARID1A
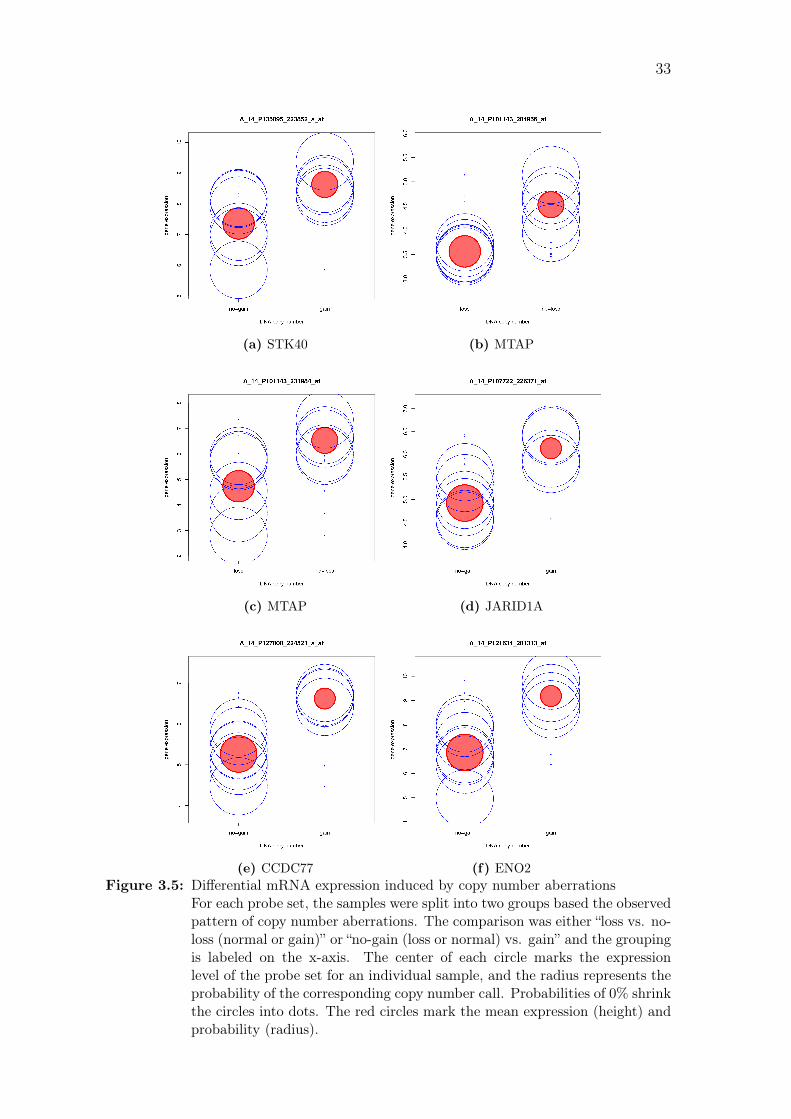
(e) CCDC77 (f) ENO2Figure 3.5: Differential mRNA expression induced by copy number aberrations
For each probe set, the samples were split into two groups based the observedpattern of copy number aberrations. The comparison was either “loss vs. no-loss (normal or gain)” or “no-gain (loss or normal) vs. gain” and the groupingis labeled on the x-axis. The center of each circle marks the expressionlevel of the probe set for an individual sample, and the radius represents theprobability of the corresponding copy number call. Probabilities of 0% shrinkthe circles into dots. The red circles mark the mean expression (height) andprobability (radius).
34
(g) ATP2B1 (h) RBL2
(i) EZH1 (j) DCAF7
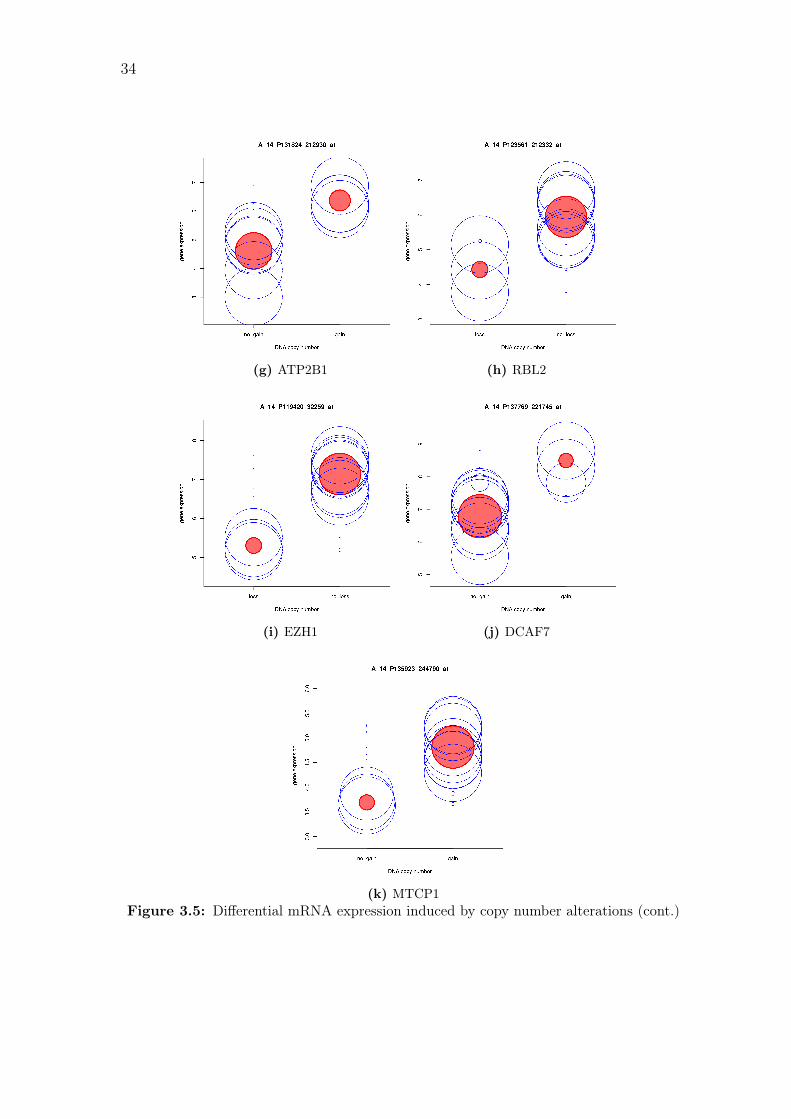
(k) MTCP1Figure 3.5: Differential mRNA expression induced by copy number alterations (cont.)
35
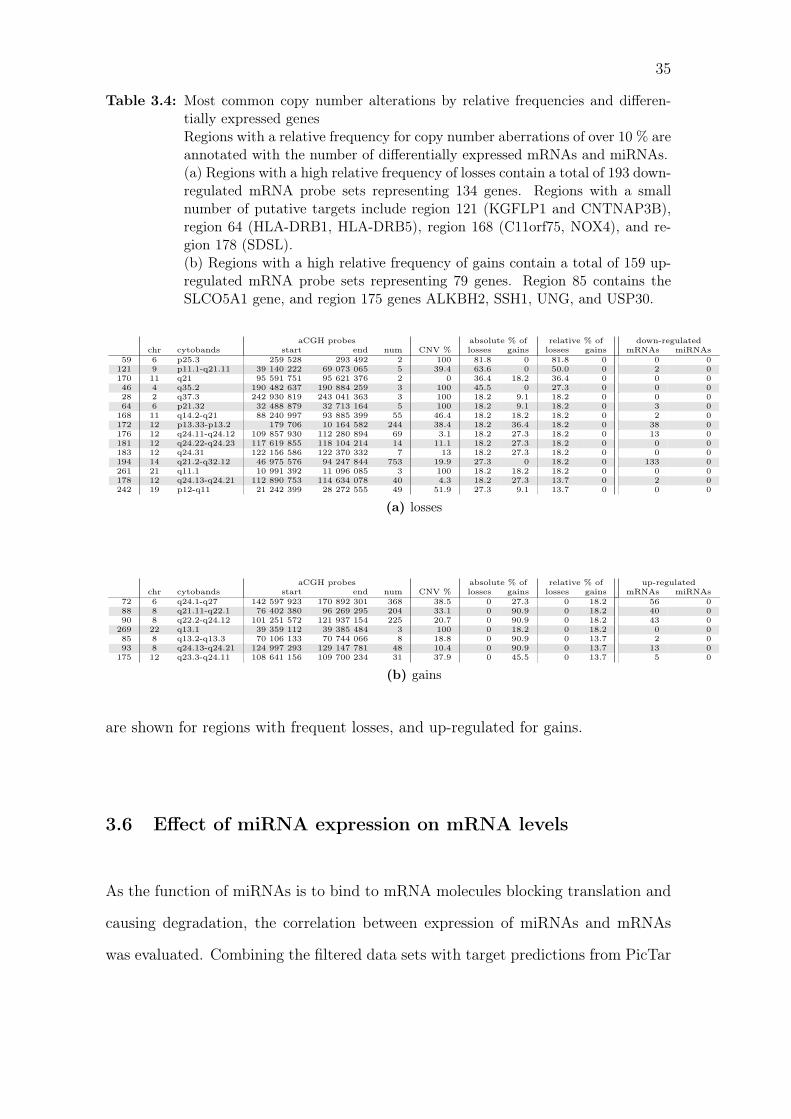
Table 3.4: Most common copy number alterations by relative frequencies and differen-tially expressed genesRegions with a relative frequency for copy number aberrations of over 10 % areannotated with the number of differentially expressed mRNAs and miRNAs.(a) Regions with a high relative frequency of losses contain a total of 193 down-regulated mRNA probe sets representing 134 genes. Regions with a smallnumber of putative targets include region 121 (KGFLP1 and CNTNAP3B),region 64 (HLA-DRB1, HLA-DRB5), region 168 (C11orf75, NOX4), and re-gion 178 (SDSL).(b) Regions with a high relative frequency of gains contain a total of 159 up-regulated mRNA probe sets representing 79 genes. Region 85 contains theSLCO5A1 gene, and region 175 genes ALKBH2, SSH1, UNG, and USP30.
aCGH probes absolute % of relative % of down-regulatedchr cytobands start end num CNV % losses gains losses gains mRNAs miRNAs
59 6 p25.3 259 528 293 492 2 100 81.8 0 81.8 0 0 0121 9 p11.1-q21.11 39 140 222 69 073 065 5 39.4 63.6 0 50.0 0 2 0170 11 q21 95 591 751 95 621 376 2 0 36.4 18.2 36.4 0 0 046 4 q35.2 190 482 637 190 884 259 3 100 45.5 0 27.3 0 0 028 2 q37.3 242 930 819 243 041 363 3 100 18.2 9.1 18.2 0 0 064 6 p21.32 32 488 879 32 713 164 5 100 18.2 9.1 18.2 0 3 0168 11 q14.2-q21 88 240 997 93 885 399 55 46.4 18.2 18.2 18.2 0 2 0172 12 p13.33-p13.2 179 706 10 164 582 244 38.4 18.2 36.4 18.2 0 38 0176 12 q24.11-q24.12 109 857 930 112 280 894 69 3.1 18.2 27.3 18.2 0 13 0181 12 q24.22-q24.23 117 619 855 118 104 214 14 11.1 18.2 27.3 18.2 0 0 0183 12 q24.31 122 156 586 122 370 332 7 13 18.2 27.3 18.2 0 0 0194 14 q21.2-q32.12 46 975 576 94 247 844 753 19.9 27.3 0 18.2 0 133 0261 21 q11.1 10 991 392 11 096 085 3 100 18.2 18.2 18.2 0 0 0178 12 q24.13-q24.21 112 890 753 114 634 078 40 4.3 18.2 27.3 13.7 0 2 0242 19 p12-q11 21 242 399 28 272 555 49 51.9 27.3 9.1 13.7 0 0 0
(a) losses
aCGH probes absolute % of relative % of up-regulatedchr cytobands start end num CNV % losses gains losses gains mRNAs miRNAs
72 6 q24.1-q27 142 597 923 170 892 301 368 38.5 0 27.3 0 18.2 56 088 8 q21.11-q22.1 76 402 380 96 269 295 204 33.1 0 90.9 0 18.2 40 090 8 q22.2-q24.12 101 251 572 121 937 154 225 20.7 0 90.9 0 18.2 43 0269 22 q13.1 39 359 112 39 385 484 3 100 0 18.2 0 18.2 0 085 8 q13.2-q13.3 70 106 133 70 744 066 8 18.8 0 90.9 0 13.7 2 093 8 q24.13-q24.21 124 997 293 129 147 781 48 10.4 0 90.9 0 13.7 13 0175 12 q23.3-q24.11 108 641 156 109 700 234 31 37.9 0 45.5 0 13.7 5 0
(b) gains
are shown for regions with frequent losses, and up-regulated for gains.
3.6 Effect of miRNA expression on mRNA levels
As the function of miRNAs is to bind to mRNA molecules blocking translation and
causing degradation, the correlation between expression of miRNAs and mRNAs
was evaluated. Combining the filtered data sets with target predictions from PicTar
36
(Krek et al. 2005) and TargetScan databases (Lewis et al. 2005) resulted in a total
of 12 169 miRNA-mRNA pairs. After correcting for multiple testing, the lowest
p-value was 0.167 observed with the pair of miR-22 and FBN2 (Kendall tau rank
correlation coefficient τ = −0.891). The rest of the p-values were all larger than 0.5.
In search of the putative driving oncogenes and tumor suppressors behind
the frequent copy number aberrations, the lists of genes in the regions showing high
relative aberration frequencies were intersected with miRNA-mRNA pairing data.
Of the 134 down-regulated genes found in regions with over 10 % relative frequency
of losses, five were found to be targets of at least three miRNAs that are up-regulated
compared to the mesenchymal stem cells. These include BTBD7 (targeted by six
up-regulated miRNAs), SMOC1 (6), FOXJ2 (4), FRMD6 (4), and SLC2A3 (3).
Similarly, of the 79 up-regulated genes in frequently gained (in terms
of relative frequency) regions, three were targets of at least three down-regulated
miRNAs: QKI (target of seven down-regulated miRNAs), PKIA (4), and SLCO5A1
(3).
Finally, when pairing miRNA-mRNA target pairing with those mRNA
expression probe sets whose expression was found to have a statistically significant
effect from DNA copy number changes, the STK40 was found to be a target of 4
down-regulated miRNAs: miR-21, miR-27a, let-7i, and miR-27b.
37
4 Discussion
An integrative analysis of microarray data from Ewing sarcoma cell lines has been
performed. aCGH, miRNA, and mRNA data sets have been analyzed individually
and also through integrative approaches. The most frequent copy number aberra-
tions have been identified, as have differentially expressed miRNAs compared to
mesenchymal stem cell specimens. For mRNA expression, no reference sample data
was available from our own laboratory, so an external data set was used. Due to large
differences, differentially expressed mRNAs were not identified per se, but instead
this information was used to complement other approaches. Integrative analyses
were performed to identify copy -number-induced miRNA and mRNA expression,
and also to measure correlation between expression of miRNAs and their predicted
target genes.
One factor significantly limiting the feasibility of genomics approach to
the data analysis is the small sample size. miRNA measurements consisted of 22
Ewing sarcoma cell lines and two mesenchymal stem cell reference samples, but
aCGH and mRNA data sets both contained only 11 cell lines. Increasing the sample
size could dramatically improve the results of the analyses.
Analysis of the Agilent aCGH data set identified aberrations in DNA
copy number, and all detected regions are listed in Table A.1 on page 74. Those
showing gains or losses in more than 50 % of the samples have been listed in Table
3.1 on page 25. The most frequent losses were in 6p25.3 (81.8 %), three regions (111–
113, frequencies between 63.6 % and 54.5 %) in 9p, and around the centromere of
chromosome 9 (63.6 %). Because pericentromeric regions contain highly repetitive
sequences, their mapping is more difficult and they are generally poorly targeted by
aCGH microarrays (Horvath et al. 2000). Therefore copy number changes around
38
centromeres (and telomeres) should be evaluated with caution. The region in 6p25.3
is entirely within CNVs reported in the Database of Genomic Variants (Zhang et al.
2006), and contains no genes found to be down-regulated. It therefore more likely
represents normal copy number variation in the human population than a cancerous
aberration. Losses in 9p are known to be common in many cancers including Ewing
sarcoma, and the loss of the CDKN2A gene has been linked with poor survival
(Huang et al. 2005). This gene has also been shown to be affected by microdeletions
small enough to be missed using FISH (fluorescent in situ hybridization) (Savola
et al. 2007). CDKN2A is located in the reverse strand of chromosome 9 and is
contained within regions 111 (lost in 54.5 %) and 112 (63.6 %) in this analysis. The
adjacent tumor suppressor gene CDKN2B is overlaps regions 112 and 113 (54.5 %).
The most frequent gains were in chromosome 8 (up to 90.9 %), 1q (81.8
%), X (72.7 %), and one isolated region in 20q13.33 (54.5 %). However, the last one is
completely overlapping with reported CNVs, and contains no differentially expressed
genes, so it is arising most likely simply because of normal copy number variation.
Trisomy of chromome 8 and gains in 1q are both frequent in Ewing sarcoma, and
although more rare, trisomy of X has also been reported (Patiño-García et al. 1999).
An interesting observation is also the relatively large number of distinct
regions (40) in chromosome 9. Dividing the number of regions with the base pair
length covered by the probes on the Agilent 44K microarray (from the start of first
probe to the end of the last probe in the same chromosome) results in 0.28 regions
per megabase of genomic sequence. The mean value across all chromosomes is 0.11
regions / Mb. Other breakpoint-rich chromosomes are 17 (0.20 regions / Mb) and 20
(0.19), while chromosomes 3 and 2 show relatively few distinct regions (0.04 and 0.05,
respectively). In chromosome 9, the breakpoints are concentrated especially on the
9p21.3 cytogenetic band, which is split into 10 different regions (1.75 regions / Mb).
39
The observed copy number changes in this cytoband are mostly losses with the
frequency varying between 18.2 % and 63.6 %.
As copy number aberrations around driving genes typically cover areas
much larger than just the target gene, aberration frequencies were also converted
to relative frequencies by subtracting from the frequency of each region the mean
frequency of its neighbors. This identifies regions that have higher aberration fre-
quencies than their surrounding areas. Table 3.4 on page 35 lists regions with highest
relative aberration frequencies. Interestingly, while in general more gains than losses
were observed, there are 15 regions of losses and 7 regions of gains with frequen-
cies higher than 10 %. Losses therefore appear to be smaller and their boundaries
more precisely located than for gains. This could be a result of differences between
functional consequences of gains of oncogenes vs. losses of tumor-suppressors.
Identified by both high absolute and relative loss frequencies are regions
59 (6p25.3) and 121 (9p11.1–q21.11). The first one contains no differentially ex-
pressed genes, and is likely only a CNV, while the later one contains the centromere,
which makes the finding suspicious. The two down-regulated genes in this region are
KGFLP1 (keratinocyte growth factor-like protein 1) and CNTNAP3B (contactin as-
sociated protein-like 3B). Regions with high absolute and relative frequency of gains
include regions 85 (8q13.2–q13.3), 88 (8q21.11–q22.1), 90 (8q22.2–q24.12), and 93
(8q24.13–q24.21). Region 85 only contains one up-regulated gene (SLCO5A1, solute
carrier organic anion transporter family member 5A1), while the other three contain
a total of 96 up-regulated Affymetrix probe sets.
Differentially expressed probe sets were identified by comparing our Ewing
sarcoma cell line data with an external reference data set downloaded from the GEO
database. GSE7888 consists of 23 mesenchymal stem cell samples. As the reference
40
data comes from a different laboratory, and is likely to contain bias in addition to
the real biological differences, the list of differentially expressed mRNAs was only
used in conjunction with the aCGH or miRNA data sets.
Integration of aCGH and expression data helps to identify the driv-
ing targets behind copy number aberrations, and the effect of copy number on
mRNA expression was tested using a genomics approach. A permutation-based
non-parametric test was used to identify Affymetrix probe sets whose expression
had been significantly altered by copy number changes. Of the resulting 10 genes,
MTAP was lost in 54.5 % of the samples and also down-regulated compared to
the mesenchymal reference samples. Four genes were associated with gains and
up-regulation: DCAF7, ENO2, MTCP1, and STK40.
MTAP (methylthioadenosine phosphorylase) is located in 9p21.3 and
overlaps with the CDKN2A gene. Deletions in this locus are common in a wide
variety of cancers, but they are often attributed solely to CDKN2A while the loss
of MTAP is regarded as a byproduct. However, it has been shown that mice with a
null MTAP allele develop T-cell lymphomas demonstrating that MTAP has in inde-
pendent tumor suppressor function unrelated to CDKN2A (Kadariya et al. 2009).
Also, while the aberration patterns for these two genes are identical in our data,
the expression of CDKN2A was not found to be altered by copy number in a statis-
tically significant level, although it was slightly lower among cell lines exhibiting a
loss. Losses of MTAP have been previously described in Ewing sarcoma, but only
in the context of combined deletion of MTAP and CDKN2A (Brownhill et al. 2007).
DCAF7 (DDB1 and CUL4 associated factor 7) has been shown to acti-
vate stem cell-related gene expression leading to an increase in cancer stem cells in
luminal B breast cancer (Sircoulomb et al. 2011). It has also been shown to partic-
41
ipate in craniofacial development of the zebrafish and is required for the formation
of the equivalent of the upper jaw, the palatoquadrate (Nissen et al. 2006). ENO2
(enolase 2) is a hypoxia-induced gene, which has been linked to multiple cancers,
including prostatic small-cell neuroendocrine carcinoma (Clegg et al. 2003), gastric
cancer (Arao et al. 2006), and renal cell carcinoma (Teng et al. 2011). MTCP1
(mature T-cell proliferation 1) was identified in 1993 as the first candidate gene po-
tentially involved in the leukemogenic process of mature T cell proliferations (Stern
et al. 1993). It has also been shown to modify T-cell homeostasis before leukemo-
genesis in transgenic mice (Joiner et al. 2007).
STK40 (serine/threonine kinase 40), which is also known as SHIK (SINK-
homologous serine/threonine-protein kinase), has been shown to inhibit TNF-triggered
(tumor necrosis factor) NF-κB activation, and also to inhibit p53-mediated tran-
scription in a dose-dependent manner (Huang et al. 2003). No effect on p53 proteins
levels were observed, but its activity is known to be controlled through various dif-
ferent mechanisms including regulation of transcription or translation, alterations
in protein half-life, post-translational phosphorylation or acetylation, redox modula-
tions, and alterations in its intracellular localization. STK40 has also been shown to
activate the MAPK (mitogen-activated protein kinase) pathway and induce differen-
tiation in mouse embryonic stem cells (Li et al. 2010). Hofmann et al. (2010) showed
that POU3F1 (POU class 3 homeobox 1) was needed for efficient up-regulation of
STK40. POU3F1 (also known as Oct-6) is a member of the octamer transcription
factor family and functions mainly in developmental processes, and also acts as a
co-activator of innate immune responses. POU3F1 is found to be up-regulated in
the Ewing sarcoma cell lines with no losses and a gain in 45.5 % of the samples.
The miRNA comparison of 22 Ewing sarcoma cell lines against two mes-
enchymal stem cell reference samples identified a total of 53 differentially expressed
42
miRNAs. 32 were down-regulated in the cell lines compared to the reference, and
21 were up-regulated. The most frequent losses among the down-regulated miRNAs
were miR-31 and miR-31* in 9p21.3 (lost in 45.5 %), miR-140-3p and miR-140-5p
in 16q22.1 (36.4 %), and miR-22 in 17p13.3 (36.4 %). Most frequent gains are for
miR-30b in 8q24.22 (72.7 %); miR-20b in Xq26.2 (72.7 %); miR-25, miR-93 and
miR-106b in 7q22.1 (36.4 %); and miR-331-3p in 12q22 (36.4 %). However, the
permutation-based non-parametric testing failed to identify statistical significance
in copy-number-induced expression changes of miRNAs. This could mean that other
mechanisms than copy number are more important in miRNA regulation. Also, our
small sample size of 11 cell lines for the integration analyses might be a limiting
factor.
Additional experiments are needed to identify the most important miRNAs
and their functional roles in Ewing sarcoma. The only one described so far is miR-
145, which is located in 5q32 (Riggi et al. 2010). The EWSR1-FLI1 fusion gene
suppresses expression of miR-145, which is found to be down-regulated in this study
with 18.2 % losses and no gains. FLI1 is one of the targets of miR-145, so they form
a mutually repressive feedback loop (Zhang et al. 2011).
As the biological function of miRNAs is post-transcriptional gene regula-
tion, this relationship was assessed by measuring the correlation between expression
of miRNAs and their predicted target mRNAs. However, this approach failed to
identify pairs with statistically significant correlation. The lowest p-value was 0.167
between miR-22 and FBN2 (fibrillin 2). However, compared to the mesenchymal
stem cells, both miR-22 and FBN2 are down-regulated in the Ewing sarcoma cell
lines, which makes the relevance of the observed correlation questionable.
As miRNAs can lead to lowered protein expression either by causing
43
degradation of the mRNA molecules or by simply blocking translation, these al-
ternatives can have different outcomes when measuring such correlations. If only
translation is blocked but the mRNA molecule is not degraded, it can still bind to the
microarray. The exact mechanism depends on the complementarity of the miRNA
and mRNA sequences. Perfect complementarity leads into mRNA degradation,
while incomplete complementarity silences the gene by blocking protein translation.
However, microarray experiments have shown that miRNA expression does lead to
large-scale reductions of mRNA and not only protein levels (Lim et al. 2005).
Interestingly, even though miRNAs act to down-regulate their target
mRNAs, almost half of the pairs tested (5 730 out of 12 169) had a positive correla-
tion coefficient. One possible explanation is that this is a result of other regulatory
mechanisms overriding the effect of miRNAs. For example, the effect of increased
expression induced by a gain in copy number could be larger in magnitude than
can be compensated with increased expression of a miRNA. Even though miRNA-
mRNA pairs with negative correlation are the ones agreeing with our understanding
of miRNA regulation, pairs with positive correlation could provide an interesting
approach to identify processes that have in a way escaped the regulatory control of
the cell.
Our limited sample size probably has to be increased in order to find
significant correlations between miRNA and mRNA target gene expression. In an
attempt to integrate miRNA-mRNA target predictions with the copy number data,
those mRNAs that were found to be differentially expressed and targeted by mul-
tiple differentially expressed miRNAs were identified. The list of down-regulated
mRNAs targeted by at least three up-regulated miRNAs was intersected with the
list of 134 genes found in regions with over 10 % relative frequency of losses. This
identified five genes that show both deletions and down-regulation through multi-
44
ple miRNAs: BTBD7 (targeted by six up-regulated miRNAs), SMOC1 (6), FOXJ2
(4), FRMD6 (4), and SLC2A3 (3). BTBD7 (BTB (POZ) domain containing 7)
promotes epithelial tissue remodeling and formation of branched organs (Onodera
et al. 2010). SMOC1 (SPARC related modular calcium binding 1) inhibits bone
morphogenetic protein signaling downstream of receptor binding and is essential for
post-gastrulation development in xenopus (Thomas et al. 2009). FOXJ2 (forkhead
box J2) is a transcription factor, whose over-expression has been shown to be lethal
(Martín-de Lara et al. 2008). FRMD6 (FERM domain containing 6) links cytoskele-
ton with the plasma membrane, and its localization to plasma membrane is induced
by EGF (epidermal growth factor), which is found to be up-regulated in the Ewing
sarcoma cell lines. SLC2A3 (solute carrier family 2 member 3) is glucose trans-
porter, and rather than being down-regulated like here, its over-expression has been
linked with various carcinomas and melanoma, with a possible role in angiogenesis
(Ayala et al. 2010; Tsukioka et al. 2007; Parente et al. 2008).
The list of up-regulated mRNAs that are targeted by at least three down-
regulated miRNAs was similarly intersected with the list of 79 genes found in areas
of frequent copy number gain (relative frequency more than 10 %). Three genes
were identified: QKI (target of seven down-regulated miRNAs), PKIA (4), and
SLCO5A1 (3). QKI (quaking homolog) is expressed in neural progenitors, but their
expression is down-regulated during neuronal differentiation (Hardy 1998). PKIA
(cAMP-dependent protein kinase inhibitor alpha) is an inhibitor of PKA (protein
kinase A), which is responsible for most of the of functions regulated by cAMP
(cyclic AMP). Its role in disorders is not well described (Van Patten et al. 1987).
SLCO5A1 (solute carrier organic anion transporter family member 5A1) belongs to
the family of organic anion transporters, which transport a variety of amphipathic
organic molecules via an anion exchange mechanism. In the Ewing cell lines it
is up-regulated, but its only reported link to disease phenotypes is an observation
45
of copy number loss. The locus encompassing SLCO5A1 and SULF1 is found to
be deleted in Mesomelia-synostoses syndrome (MSS), which is a rare autosomal-
dominant disorder characterized by mesomelic limb shortening, acral synostoses,
and multiple congenital malformations (Isidor et al. 2010).
The lists of differentially expressed mRNAs targeted by multiple differ-
entially expressed miRNAs were also intersected with the ten genes showing copy-
number-induced expression changes in the permutation-based statistical test. This
identified STK40 as a target of four down-regulated miRNAs in addition to being
gained in 45.4 % of the samples, showing statistically significant increase in expres-
sion due to a change in copy number, and being up-regulated in Ewing sarcoma cell
lines compared to the mesenchymal stem cell reference data set.
Among the known targets of the EWSR1-FLI1 fusion gene expected pat-
terns were observed. Genes known to be required for optimal transformation showed
up-regulation in comparison to the mesenchymal stem cells, and also contained an
elevated frequency of gains. NROB1 had a gain in 54.5 % of samples, and NKX2-2,
EZH2 and IGF-1 in 36.4 %. All these genes were found to be up-regulated compared
to mesenchymal stem cells, and none had any copy number losses. On the other
hand, TGF-βR2 was down-regulated with 27.3 % losses and no gains.
The most interesting putative novel target genes arising from this analysis
are the ones with copy-number-induced expression changes. MTAP is found to be
down-regulated in the Ewing sarcoma cell lines compared to mesenchymal stem cell
reference, and also to exhibit frequent losses that lower its expression. Therefore, it is
possible that MTAP might have a distinct tumor-suppressor function separate from
the CDKN2A gene in the same locus. Putative oncogenes include DCAF7, ENO2,
MTCP1, and STK40, which are all linked with higher expression in association with
46
copy number gains, and also up-regulation compared to mesenchymal stem cells.
Additionally, STK40 is also targeted by four down-regulated miRNAs. Another
gene exhibiting potential perturbations both from copy number and miRNAs is
SLCO5A1. It is a target of three down-regulated miRNAs, is up-regulated compared
to the reference samples, and is located in a region with an absolute and relative
gain frequency of 90.9 % and 13.7 %, respectively.
Future plans regarding the putative target genes include analyses of pub-
lished, external Ewing sarcoma microarray data sets to verify these findings. Also
further validation with immunohistochemistry and/or functional assays is being con-
sidered.
As our understanding of crucial molecular events in the Ewing sarcoma
transformation develops, future improvements in therapy can hopefully one day put
an end to it being a taker of lives of children and young adults in their prime.

47
Acknowledgements
I would like to thank my supervisor, professor Sakari Knuutila, for guidance and
financial support. I would also like to thank the people who performed the mi-
croarray experiments producing the data analyzed in this thesis: Neda Mosakhani
for miRNA, Suvi Savola for aCGH, and Filippo Nardi for the mRNA data set.
Personnel of the Laboratory of Cytomolecular Genetics is also thanked for a pleas-
ant working environment.
For this thesis project I also visited Instituto Ortopedico Rizzoli in Bologna,
Italy. I would like to thank Piero Picci and Katia Scotlandi for this opportunity and
Fumihiko Nakatani and Andrea Grilli for providing clinical data and other informa-
tion regarding the cell lines used in this work.
48
References
Arao T., Yanagihara K., Takigahira M., Takeda M., Koizumi F., Shiratori Y., andNishio K. ZD6474 inhibits tumor growth and intraperitoneal dissemination in ahighly metastatic orthotopic gastric cancer model. Int J Cancer, 118(2):483–9,2006. 41
Aurias A., Rimbaut C., Buffe D., Zucker J. M., and Mazabraud A. Translocationinvolving chromosome 22 in Ewing’s sarcoma. A cytogenetic study of four freshtumors. Cancer Genet Cytogenet, 12(1):21–5, 1984. 6
Ayala F. R. R., Rocha R. M., Carvalho K. C., Carvalho A. L., da Cunha I. W.,Lourenço S. V., and Soares F. A. GLUT1 and GLUT3 as potential prognosticmarkers for Oral Squamous Cell Carcinoma. Molecules, 15(4):2374–87, 2010. 44
Bacci G., Longhi A., Barbieri E., Ferrari S., Mercuri M., Briccoli A., Versari M.,Pignotti E., and Picci P. Second malignancy in 597 patients with Ewing sarcoma ofbone treated at a single institution with adjuvant and neoadjuvant chemotherapybetween 1972 and 1999. J Pediatr Hematol Oncol, 27(10):517–20, 2005. 5
Banting G. S., Pym B., Darling S. M., and Goodfellow P. N. The MIC2 geneproduct: epitope mapping and structural prediction analysis define an integralmembrane protein. Mol Immunol, 26(2):181–8, 1989. 12
Barrett T., Troup D. B., Wilhite S. E., Ledoux P., Rudnev D., Evangelista C., KimI. F., Soboleva A., Tomashevsky M., Marshall K. A., Phillippy K. H., ShermanP. M., Muertter R. N., and Edgar R. NCBI GEO: archive for high-throughputfunctional genomic data. Nucleic Acids Res, 37(Database issue):D885–90, 2009.18, 26
Benjamini Y. and Hochberg Y. Controlling the false discovery rate: a practical andpowerful approach to multiple testing. J Roy Stat Soc Ser B, 57(1):289–300, 1995.19
Bignell G. R., Huang J., Greshock J., Watt S., Butler A., West S., Grigorova M.,Jones K. W., Wei W., Stratton M. R., Futreal P. A., Weber B., Shapero M. H., andWooster R. High-resolution analysis of DNA copy number using oligonucleotidemicroarrays. Genome Res, 14(2):287–95, 2004. 13
Bixel G., Kloep S., Butz S., Petri B., Engelhardt B., and Vestweber D. MouseCD99 participates in T-cell recruitment into inflamed skin. Blood, 104(10):3205–13, 2004. 11
Brennan C., Zhang Y., Leo C., Feng B., Cauwels C., Aguirre A. J., Kim M.,Protopopov A., and Chin L. High-resolution global profiling of genomic alter-ations with long oligonucleotide microarray. Cancer Res, 64(14):4744–8, 2004.13
49
Brownhill S. C., Taylor C., and Burchill S. A. Chromosome 9p21 gene copy numberand prognostic significance of p16 in ESFT. Br J Cancer, 96(12):1914–23, 2007.40
Carvalho B., Ouwerkerk E., Meijer G. A., and Ylstra B. High resolution microarraycomparative genomic hybridisation analysis using spotted oligonucleotides. J ClinPathol, 57(6):644–6, 2004. 13
Castillero-Trejo Y., Eliazer S., Xiang L., Richardson J. A., and Ilaria Jr R. L.Expression of the EWS/FLI-1 oncogene in murine primary bone-derived cellsresults in EWS/FLI-1-dependent, Ewing sarcoma-like tumors. Cancer Res, 65(19):8698–705, 2005. 10
Cheung C. C., Kandel R. A., Bell R. S., Mathews R. E., and Ghazarian D. M.Extraskeletal Ewing sarcoma in a 77-year-old woman. Arch Pathol Lab Med, 125(10):1358–60, 2001. 2
Cironi L., Riggi N., Provero P., Wolf N., Suvà M.-L., Suvà D., Kindler V., andStamenkovic I. IGF1 is a common target gene of Ewing’s sarcoma fusion proteinsin mesenchymal progenitor cells. PLoS One, 3(7):e2634, 2008. 8
Clegg N., Ferguson C., True L. D., Arnold H., Moorman A., Quinn J. E., VessellaR. L., and Nelson P. S. Molecular characterization of prostatic small-cell neuroen-docrine carcinoma. Prostate, 55(1):55–64, 2003. 41
Collini P., Sampietro G., Bertulli R., Casali P. G., Luksch R., Mezzelani A., Sozzi G.,and Pilotti S. Cytokeratin immunoreactivity in 41 cases of ES/PNET confirmedby molecular diagnostic studies. Am J Surg Pathol, 25(2):273–4, 2001. 4
Cotterill S. J., Ahrens S., Paulussen M., Jürgens H. F., Voûte P. A., Gadner H., andCraft A. W. Prognostic factors in Ewing’s tumor of bone: analysis of 975 patientsfrom the European Intergroup Cooperative Ewing’s Sarcoma Study Group. J ClinOncol, 18(17):3108–14, 2000. 2, 3
Cowell J. K. and Lo K. C. Application of oligonucleotides arrays for coincident com-parative genomic hybridization, ploidy status and loss of heterozygosity studiesin human cancers. Methods Mol Biol, 556:47–65, 2009. 14
Craft A. W., Cotterill S. J., Bullimore J. A., and Pearson D. Long-term results fromthe first UKCCSG Ewing’s Tumour Study (ET-1). United Kingdom Children’sCancer Study Group (UKCCSG) and the Medical Research Council Bone SarcomaWorking Party. Eur J Cancer, 33(7):1061–9, 1997. 5
Day A., Carlson M. R. J., Dong J., O’Connor B. D., and Nelson S. F. Celsius: acommunity resource for Affymetrix microarray data. Genome Biol, 8(6):R112,2007. 11
50
de Alava E., Kawai A., Healey J. H., Fligman I., Meyers P. A., Huvos A. G.,Gerald W. L., Jhanwar S. C., Argani P., Antonescu C. R., Pardo-Mindan F. J.,Ginsberg J., Womer R., Lawlor E. R., Wunder J., Andrulis I., Sorensen P. H., BarrF. G., and Ladanyi M. EWS-FLI1 fusion transcript structure is an independentdeterminant of prognosis in Ewing’s sarcoma. J Clin Oncol, 16(4):1248–55, 1998.6
de Alava E., Antonescu C. R., Panizo A., Leung D., Meyers P. A., Huvos A. G.,Pardo-Mindán F. J., Healey J. H., and Ladanyi M. Prognostic impact of P53status in Ewing sarcoma. Cancer, 89(4):783–92, 2000. 9
Delattre O., Zucman J., Plougastel B., Desmaze C., Melot T., Peter M., Kovar H.,Joubert I., de Jong P., and Rouleau G. Gene fusion with an ETS DNA-bindingdomain caused by chromosome translocation in human tumours. Nature, 359(6391):162–5, 1992. 6, 7
Douglass E. C., Rowe S. T., Valentine M., Parham D., Meyer W. H., and ThompsonE. I. A second nonrandom translocation, der(16)t(1;16)(q21;q13), in Ewing sar-coma and peripheral neuroectodermal tumor. Cytogenet Cell Genet, 53(2-3):87–90, 1990. 9
Dworzak M. N., Fritsch G., Fleischer C., Printz D., Fröschl G., BuchingerP., Mann G., and Gadner H. CD99 (MIC2) expression in paediatric B-lineage leukaemia/lymphoma reflects maturation-associated patterns of normalB-lymphopoiesis. Br J Haematol, 105(3):690–5, 1999. 4
Esiashvili N., Goodman M., and Marcus Jr R. B. Changes in incidence and survivalof Ewing sarcoma patients over the past 3 decades: Surveillance Epidemiologyand End Results data. J Pediatr Hematol Oncol, 30(6):425–30, 2008. 2, 3, 4
Ewing J. Diffuse endothelioma of bone. Proc N Y Pathol Soc, 21:17–24, 1921. 2
Fellinger E. J., Garin-Chesa P., Triche T. J., Huvos A. G., and RettigW. J. Immunohistochemical analysis of Ewing’s sarcoma cell surface antigenp30/32MIC2. Am J Pathol, 139(2):317–25, 1991. 4
Flicek P., Amode M. R., Barrell D., Beal K., Brent S., Chen Y., Clapham P.,Coates G., Fairley S., Fitzgerald S., Gordon L., Hendrix M., Hourlier T., JohnsonN., Kähäri A., Keefe D., Keenan S., Kinsella R., Kokocinski F., Kulesha E.,Larsson P., Longden I., McLaren W., Overduin B., Pritchard B., Riat H. S.,Rios D., Ritchie G. R. S., Ruffier M., Schuster M., Sobral D., Spudich G., TangY. A., Trevanion S., Vandrovcova J., Vilella A. J., White S., Wilder S. P., ZadissaA., Zamora J., Aken B. L., Birney E., Cunningham F., Dunham I., Durbin R.,Fernández-Suarez X. M., Herrero J., Hubbard T. J. P., Parker A., Proctor G.,Vogel J., and Searle S. M. J. Ensembl 2011. Nucleic Acids Res, 39(Databaseissue):D800–6, 2011. 20, 26
51
Folpe A. L., Hill C. E., Parham D. M., O’Shea P. A., and Weiss S. W.Immunohistochemical detection of FLI-1 protein expression: a study of 132 roundcell tumors with emphasis on CD99-positive mimics of Ewing’s sarcoma/primitiveneuroectodermal tumor. Am J Surg Pathol, 24(12):1657–62, 2000. 4
Forozan F., Karhu R., Kononen J., Kallioniemi A., and Kallioniemi O. P. Genomescreening by comparative genomic hybridization. Trends Genet, 13(10):405–9,1997. 13
Fraumeni Jr J. F. and Glass A. G. Rarity of Ewing’s sarcoma among U.S. Negrochildren. Lancet, 1(7642):366–7, 1970. 2
Gangwal K. and Lessnick S. L. Microsatellites are EWS/FLI response elements:genomic "junk" is EWS/FLI’s treasure. Cell Cycle, 7(20):3127–32, 2008. 8
Gangwal K., Sankar S., Hollenhorst P. C., Kinsey M., Haroldsen S. C., Shah A. A.,Boucher K. M., Watkins W. S., Jorde L. B., Graves B. J., and Lessnick S. L.Microsatellites as EWS/FLI response elements in Ewing’s sarcoma. Proc NatlAcad Sci U S A, 105(29):10149–54, 2008. 7
Gangwal K., Close D., Enriquez C. A., Hill C. P., and Lessnick S. L. Emergentproperties of EWS/FLI regulation via GGAA microsatellites in Ewing’s sarcoma.Genes Cancer, 1(2):177–187, 2010. 8
Gelin C., Aubrit F., Phalipon A., Raynal B., Cole S., Kaczorek M., and Bernard A.The E2 antigen, a 32 kd glycoprotein involved in T-cell adhesion processes, is theMIC2 gene product. EMBO J, 8(11):3253–9, 1989. 4
Gentleman R. C., Carey V. J., Bates D. M., Bolstad B., Dettling M., Dudoit S.,Ellis B., Gautier L., Ge Y., Gentry J., Hornik K., Hothorn T., Huber W., Iacus S.,Irizarry R., Leisch F., Li C., Maechler M., Rossini A. J., Sawitzki G., Smith C.,Smyth G., Tierney L., Yang J. Y. H., and Zhang J. Bioconductor: open softwaredevelopment for computational biology and bioinformatics. Genome Biol, 5(10):R80, 2004. 19
Ginsberg J. P., de Alava E., Ladanyi M., Wexler L. H., Kovar H., Paulussen M.,Zoubek A., Dockhorn-Dworniczak B., Juergens H., Wunder J. S., Andrulis I. L.,Malik R., Sorensen P. H., Womer R. B., and Barr F. G. EWS-FLI1 and EWS-ERGgene fusions are associated with similar clinical phenotypes in Ewing’s sarcoma.J Clin Oncol, 17(6):1809–14, 1999. 7
Granowetter L., Womer R., Devidas M., Krailo M., Wang C., Bernstein M., MarinaN., Leavey P., Gebhardt M., Healey J., Shamberger R. C., Goorin A., Miser J.,Meyer J., Arndt C. A. S., Sailer S., Marcus K., Perlman E., Dickman P., and GrierH. E. Dose-intensified compared with standard chemotherapy for nonmetastaticEwing sarcoma family of tumors: a Children’s Oncology Group Study. J ClinOncol, 27(15):2536–41, 2009. 5
52
Greshock J., Feng B., Nogueira C., Ivanova E., Perna I., Nathanson K., ProtopopovA., Weber B. L., and Chin L. A comparison of DNA copy number profilingplatforms. Cancer Res, 67(21):10173–80, 2007. 14
Grier H. E., Krailo M. D., Tarbell N. J., Link M. P., Fryer C. J. H., Pritchard D. J.,Gebhardt M. C., Dickman P. S., Perlman E. J., Meyers P. A., Donaldson S. S.,Moore S., Rausen A. R., Vietti T. J., and Miser J. S. Addition of ifosfamide andetoposide to standard chemotherapy for Ewing’s sarcoma and primitive neuroec-todermal tumor of bone. N Engl J Med, 348(8):694–701, 2003. 5
Guillon N., Tirode F., Boeva V., Zynovyev A., Barillot E., and Delattre O. Theoncogenic EWS-FLI1 protein binds in vivo GGAA microsatellite sequences withpotential transcriptional activation function. PLoS One, 4(3):e4932, 2009. 7
Hahm K. B., Cho K., Lee C., Im Y. H., Chang J., Choi S. G., Sorensen P. H.,Thiele C. J., and Kim S. J. Repression of the gene encoding the TGF-beta typeII receptor is a major target of the EWS-FLI1 oncoprotein. Nat Genet, 23(2):222–7, 1999. 8
Hanahan D. and Weinberg R. A. The hallmarks of cancer. Cell, 100(1):57–70, 2000.1
Hardy R. J. QKI expression is regulated during neuron-glial cell fate decisions. JNeurosci Res, 54(1):46–57, 1998. 44
Hattinger C. M., Rumpler S., Strehl S., Ambros I. M., Zoubek A., Pötschger U.,Gadner H., and Ambros P. F. Prognostic impact of deletions at 1p36 and nu-merical aberrations in Ewing tumors. Genes Chromosomes Cancer, 24(3):243–54,1999. 9
Hattinger C. M., Pötschger U., Tarkkanen M., Squire J., Zielenska M., Kiuru-Kuhlefelt S., Kager L., Thorner P., Knuutila S., Niggli F. K., Ambros P. F.,Gadner H., and Betts D. R. Prognostic impact of chromosomal aberrations inEwing tumours. Br J Cancer, 86(11):1763–9, 2002. 9
Hofmann E., Reichart U., Gausterer C., Guelly C., Meijer D., Müller M., and StroblB. Octamer-binding factor 6 (Oct-6/Pou3f1) is induced by interferon and con-tributes to dsRNA-mediated transcriptional responses. BMC Cell Biol, 11:61,2010. 41
Horvath J. E., Schwartz S., and Eichler E. E. The mosaic structure of humanpericentromeric DNA: a strategy for characterizing complex regions of the humangenome. Genome Res, 10(6):839–52, 2000. 37
Hu-Lieskovan S., Heidel J. D., Bartlett D. W., Davis M. E., and Triche T. J.Sequence-specific knockdown of EWS-FLI1 by targeted, nonviral delivery of smallinterfering RNA inhibits tumor growth in a murine model of metastatic Ewing’ssarcoma. Cancer Res, 65(19):8984–92, 2005. 8
53
Huang H.-Y., Illei P. B., Zhao Z., Mazumdar M., Huvos A. G., Healey J. H., WexlerL. H., Gorlick R., Meyers P., and Ladanyi M. Ewing sarcomas with p53 mutationor p16/p14ARF homozygous deletion: a highly lethal subset associated with poorchemoresponse. J Clin Oncol, 23(3):548–58, 2005. 9, 10, 38
Huang J., Teng L., Liu T., Li L., Chen D., Li F., Xu L.-G., Zhai Z., and Shu H.-B.Identification of a novel serine/threonine kinase that inhibits TNF-induced NF-κB activation and p53-induced transcription. Biochem Biophys Res Commun, 309(4):774–8, 2003. 41
Hughes T. R., Mao M., Jones A. R., Burchard J., Marton M. J., Shannon K. W.,Lefkowitz S. M., Ziman M., Schelter J. M., Meyer M. R., Kobayashi S., Davis C.,Dai H., He Y. D., Stephaniants S. B., Cavet G., Walker W. L., West A., Coffey E.,Shoemaker D. D., Stoughton R., Blanchard A. P., Friend S. H., and Linsley P. S.Expression profiling using microarrays fabricated by an ink-jet oligonucleotidesynthesizer. Nat Biotechnol, 19(4):342–7, 2001. 15
Im Y. H., Kim H. T., Lee C., Poulin D., Welford S., Sorensen P. H., Denny C. T.,and Kim S. J. EWS-FLI1, EWS-ERG, and EWS-ETV1 oncoproteins of Ewingtumor family all suppress transcription of transforming growth factor beta typeii receptor gene. Cancer Res, 60(6):1536–40, 2000. 8
Irizarry R. A., Bolstad B. M., Collin F., Cope L. M., Hobbs B., and Speed T. P.Summaries of Affymetrix GeneChip probe level data. Nucleic Acids Res, 31(4):e15, 2003. 21
Irizarry R. A., Warren D., Spencer F., Kim I. F., Biswal S., Frank B. C., GabrielsonE., Garcia J. G. N., Geoghegan J., Germino G., Griffin C., Hilmer S. C., HoffmanE., Jedlicka A. E., Kawasaki E., Martínez-Murillo F., Morsberger L., Lee H.,Petersen D., Quackenbush J., Scott A., Wilson M., Yang Y., Ye S. Q., and Yu W.Multiple-laboratory comparison of microarray platforms. Nat Methods, 2(5):345–50, 2005. 15
Isidor B., Pichon O., Redon R., Day-Salvatore D., Hamel A., Siwicka K. A., Bitner-Glindzicz M., Heymann D., Kjellén L., Kraus C., Leroy J. G., Mortier G. R.,Rauch A., Verloes A., David A., and Le Caignec C. Mesomelia-synostoses syn-drome results from deletion of SULF1 and SLCO5A1 genes at 8q13. Am J HumGenet, 87(1):95–100, 2010. 45
Jawad M. U., Cheung M. C., Min E. S., Schneiderbauer M. M., Koniaris L. G., andScully S. P. Ewing sarcoma demonstrates racial disparities in incidence-relatedand sex-related differences in outcome: an analysis of 1631 cases from the SEERdatabase, 1973-2005. Cancer, 115(15):3526–36, 2009. 2
Jeon I. S., Davis J. N., Braun B. S., Sublett J. E., Roussel M. F., Denny C. T.,and Shapiro D. N. A variant Ewing’s sarcoma translocation (7;22) fuses the EWSgene to the ETS gene ETV1. Oncogene, 10(6):1229–34, 1995. 7

54
Joensuu H., Robers P. J., Lyly T., and Tenhunen M. Syöpätaudit. Duodecim, 2007.2
Joiner M., Le Toriellec E., Despouy G., and Stern M. H. The MTCP1 oncogenemodifies T-cell homeostasis before leukemogenesis in transgenic mice. Leukemia,21(2):362–6, 2007. 41
Kadariya Y., Yin B., Tang B., Shinton S. A., Quinlivan E. P., Hua X., Klein-Szanto A., Al-Saleem T. I., Bassing C. H., Hardy R. R., and Kruger W. D.Mice heterozygous for germ-line mutations in methylthioadenosine phosphorylase(MTAP) die prematurely of T-cell lymphoma. Cancer Res, 69(14):5961–9, 2009.40
Kallioniemi A., Kallioniemi O. P., Sudar D., Rutovitz D., Gray J. W., WaldmanF., and Pinkel D. Comparative genomic hybridization for molecular cytogeneticanalysis of solid tumors. Science, 258(5083):818–821, 1992. 13
Kaneko Y., Yoshida K., Handa M., Toyoda Y., Nishihira H., Tanaka Y., Sasaki Y.,Ishida S., Higashino F., and Fujinaga K. Fusion of an ETS-family gene, EIAF,to EWS by t(17;22)(q12;q12) chromosome translocation in an undifferentiatedsarcoma of infancy. Genes Chromosomes Cancer, 15(2):115–21, 1996. 7
Kauer M., Ban J., Kofler R., Walker B., Davis S., Meltzer P., and Kovar H. Amolecular function map of Ewing’s sarcoma. PLoS One, 4(4):e5415, 2009. 8, 11
Kinsey M., Smith R., and Lessnick S. L. NR0B1 is required for the oncogenicphenotype mediated by EWS/FLI in Ewing’s sarcoma. Mol Cancer Res, 4(11):851–9, 2006. 8
Kinsey M., Smith R., Iyer A. K., McCabe E. R. B., and Lessnick S. L. EWS/FLIand its downstream target NR0B1 interact directly to modulate transcription andoncogenesis in Ewing’s sarcoma. Cancer Res, 69(23):9047–55, 2009. 8
Knudson Jr A. G. Mutation and cancer: statistical study of retinoblastoma. ProcNatl Acad Sci U S A, 68(4):820–3, 1971. 1
Kovar H. and Bernard A. CD99-positive "Ewing’s sarcoma" from mouse-bonemarrow-derived mesenchymal progenitor cells? Cancer Res, 66(19):9786; authorreply 9786, 2006. 11
Kovar H., Dworzak M., Strehl S., Schnell E., Ambros I. M., Ambros P. F., andGadner H. Overexpression of the pseudoautosomal gene MIC2 in Ewing’s sarcomaand peripheral primitive neuroectodermal tumor. Oncogene, 5(7):1067–70, 1990.4
Kovar H., Aryee D. N., Jug G., Henöckl C., Schemper M., Delattre O., Thomas G.,and Gadner H. EWS/FLI-1 antagonists induce growth inhibition of ewing tumorcells in vitro. Cell Growth Differ, 7(4):429–37, 1996. 8
55
Krek A., Grün D., Poy M. N., Wolf R., Rosenberg L., Epstein E. J., MacMenaminP., da Piedade I., Gunsalus K. C., Stoffel M., and Rajewsky N. CombinatorialmicroRNA target predictions. Nat Genet, 37(5):495–500, 2005. 22, 36
Leavey P. J., Mascarenhas L., Marina N., Chen Z., Krailo M., Miser J., BrownK., Tarbell N., Bernstein M. L., Granowetter L., Gebhardt M., Grier H. E., andChildren’s Oncology Group . Prognostic factors for patients with Ewing sarcoma(EWS) at first recurrence following multi-modality therapy: a report from theChildren’s Oncology Group. Pediatr Blood Cancer, 51(3):334–8, 2008. 4
Lessnick S. L., Dei Tos A. P., Sorensen P. H. B., Dileo P., Baker L. H., Ferrari S.,and Hall K. S. Small round cell sarcomas. Semin Oncol, 36(4):338–46, 2009. 4
Lewis B. P., Burge C. B., and Bartel D. P. Conserved seed pairing, often flankedby adenosines, indicates that thousands of human genes are microRNA targets.Cell, 120(1):15–20, 2005. 22, 36
Li F. P., Tu J. T., Liu F. S., and Shiang E. L. Rarity of Ewing’s sarcoma in China.Lancet, 1(8180):1255, 1980. 2
Li L., Sun L., Gao F., Jiang J., Yang Y., Li C., Gu J., Wei Z., Yang A., Lu R., Ma Y.,Tang F., Kwon S. W., Zhao Y., Li J., and Jin Y. Stk40 links the pluripotencyfactor Oct4 to the Erk/MAPK pathway and controls extraembryonic endodermdifferentiation. Proc Natl Acad Sci U S A, 107(4):1402–7, 2010. 41
Lim L. P., Lau N. C., Garrett-Engele P., Grimson A., Schelter J. M., Castle J.,Bartel D. P., Linsley P. S., and Johnson J. M. Microarray analysis shows thatsome microRNAs downregulate large numbers of target mRNAs. Nature, 433(7027):769–73, 2005. 43
López-Guerrero J. A., Pellín A., Noguera R., Carda C., and Llombart-Bosch A.Molecular analysis of the 9p21 locus and p53 genes in Ewing family tumors. LabInvest, 81(6):803–14, 2001. 10
López-Romero P., González M. A., Callejas S., Dopazo A., and Irizarry R. A.Processing of Agilent microRNA array data. BMC Res Notes, 3:18, 2010. 21
Lucas D. R., Bentley G., Dan M. E., Tabaczka P., Poulik J. M., and Mott M. P.Ewing sarcoma vs lymphoblastic lymphoma. A comparative immunohistochemicalstudy. Am J Clin Pathol, 115(1):11–7, 2001. 4
Marioni J. C., Thorne N. P., Valsesia A., Fitzgerald T., Redon R., Fiegler H.,Andrews T. D., Stranger B. E., Lynch A. G., Dermitzakis E. T., Carter N. P.,Tavaré S., and Hurles M. E. Breaking the waves: improved detection of copy num-ber variation from microarray-based comparative genomic hybridization. GenomeBiol, 8(10):R228, 2007. 19
56
Martín-de Lara F., Sánchez-Aparicio P., Arias de la Fuente C., and Rey-Campos J.Biological effects of FoxJ2 over-expression. Transgenic Res, 17(6):1131–41, 2008.44
Mastrangelo T., Modena P., Tornielli S., Bullrich F., Testi M. A., Mezzelani A.,Radice P., Azzarelli A., Pilotti S., Croce C. M., Pierotti M. A., and Sozzi G. Anovel zinc finger gene is fused to EWS in small round cell tumor. Oncogene, 19(33):3799–804, 2000. 7
May W. A., Gishizky M. L., Lessnick S. L., Lunsford L. B., Lewis B. C., DelattreO., Zucman J., Thomas G., and Denny C. T. Ewing sarcoma 11;22 translocationproduces a chimeric transcription factor that requires the DNA-binding domainencoded by FLI1 for transformation. Proc Natl Acad Sci U S A, 90(12):5752–6,1993a. 6
May W. A., Lessnick S. L., Braun B. S., Klemsz M., Lewis B. C., Lunsford L. B.,Hromas R., and Denny C. T. The Ewing’s sarcoma EWS/FLI-1 fusion gene en-codes a more potent transcriptional activator and is a more powerful transforminggene than FLI-1. Mol Cell Biol, 13(12):7393–8, 1993b. 6
Navid F., Billups C., Liu T., Krasin M. J., and Rodriguez-Galindo C. Secondcancers in patients with the Ewing sarcoma family of tumours. Eur J Cancer, 44(7):983–91, 2008. 5
Ng T. L., O’Sullivan M. J., Pallen C. J., Hayes M., Clarkson P. W., WinstanleyM., Sorensen P. H. B., Nielsen T. O., and Horsman D. E. Ewing sarcoma withnovel translocation t(2;16) producing an in-frame fusion of FUS and FEV. J MolDiagn, 9(4):459–63, 2007. 7
Nigro J. M., Baker S. J., Preisinger A. C., Jessup J. M., Hostetter R., Cleary K.,Bigner S. H., Davidson N., Baylin S., and Devilee P. Mutations in the p53 geneoccur in diverse human tumour types. Nature, 342(6250):705–8, 1989. 9
Nissen R. M., Amsterdam A., and Hopkins N. A zebrafish screen for craniofacialmutants identifies wdr68 as a highly conserved gene required for endothelin-1expression. BMC Dev Biol, 6:28, 2006. 41
Nordling C. O. A new theory on cancer-inducing mechanism. Br J Cancer, 7(1):68–72, 1953. 1
Onodera T., Sakai T., Hsu J. C.-f., Matsumoto K., Chiorini J. A., and YamadaK. M. Btbd7 regulates epithelial cell dynamics and branching morphogenesis.Science, 329(5991):562–5, 2010. 44
Parente P., Coli A., Massi G., Mangoni A., Fabrizi M. M., and Bigotti G.Immunohistochemical expression of the glucose transporters Glut-1 and Glut-3 inhuman malignant melanomas and benign melanocytic lesions. J Exp Clin CancerRes, 27:34, 2008. 44
57
Park S. H., Shin Y. K., Suh Y. H., Park W. S., Ban Y. L., Choi H.-S., Park H. J.,and Jung K. C. Rapid divergency of rodent CD99 orthologs: implications for theevolution of the pseudoautosomal region. Gene, 353(2):177–88, 2005. 11
Parkin D. M., Stiller C. A., and Nectoux J. International variations in the incidenceof childhood bone tumours. Int J Cancer, 53(3):371–6, 1993. 2
Patiño-García A. and Sierrasesúmaga L. Analysis of the p16INK4 and TP53 tumorsuppressor genes in bone sarcoma pediatric patients. Cancer Genet Cytogenet, 98(1):50–5, 1997. 9
Patiño-García A., López de Mesa R., de Alava E., and Sierrasesúmaga L. Clinicaland molecular features of Ewing sarcoma in a patient with triple-X syndrome.Cancer Genet Cytogenet, 113(2):188–90, 1999. 38
Paulussen M., Ahrens S., Dunst J., Winkelmann W., Exner G. U., Kotz R., AmannG., Dockhorn-Dworniczak B., Harms D., Müller-Weihrich S., Welte K., KornhuberB., Janka-Schaub G., Göbel U., Treuner J., Voûte P. A., Zoubek A., Gadner H.,and Jürgens H. Localized Ewing tumor of bone: final results of the CooperativeEwing’s Sarcoma Study CESS 86. J Clin Oncol, 19(6):1818–29, 2001. 5
Paulussen M., Craft A. W., Lewis I., Hackshaw A., Douglas C., Dunst J., SchuckA., Winkelmann W., Köhler G., Poremba C., Zoubek A., Ladenstein R., van denBerg H., Hunold A., Cassoni A., Spooner D., Grimer R., Whelan J., McTiernanA., Jürgens H., and European Intergroup Cooperative Ewing’s Sarcoma Study-92. Results of the EICESS-92 Study: two randomized trials of Ewing’s sarcomatreatment–cyclophosphamide compared with ifosfamide in standard-risk patientsand assessment of benefit of etoposide added to standard treatment in high-riskpatients. J Clin Oncol, 26(27):4385–93, 2008. 4, 5
Pease A. C., Solas D., Sullivan E. J., Cronin M. T., Holmes C. P., and Fodor S. P.Light-generated oligonucleotide arrays for rapid DNA sequence analysis. ProcNatl Acad Sci U S A, 91(11):5022–6, 1994. 15
Perlman E. J., Dickman P. S., Askin F. B., Grier H. E., Miser J. S., and LinkM. P. Ewing’s sarcoma–routine diagnostic utilization of mic2 analysis: a pediatriconcology group/children’s cancer group intergroup studyy. Hum Pathol, 25(3):304–7, 1994. 4
Peter M., Couturier J., Pacquement H., Michon J., Thomas G., Magdelenat H., andDelattre O. A new member of the ETS family fused to EWS in Ewing tumors.Oncogene, 14(10):1159–64, 1997. 7
Pfleiderer C., Zoubek A., Gruber B., Kronberger M., Ambros P. F., Lion T., FinkF. M., Gadner H., and Kovar H. Detection of tumour cells in peripheral bloodand bone marrow from ewing tumour patients by RT-PCR. Int J Cancer, 64(2):135–9, 1995. 3
58
Picci P., Böhling T., Bacci G., Ferrari S., Sangiorgi L., Mercuri M., Ruggieri P.,Manfrini M., Ferraro A., Casadei R., Benassi M. S., Mancini A. F., Rosito P.,Cazzola A., Barbieri E., Tienghi A., Brach del Prever A., Comandone A., BacchiniP., and Bertoni F. Chemotherapy-induced tumor necrosis as a prognostic factorin localized Ewing’s sarcoma of the extremities. J Clin Oncol, 15(4):1553–9, 1997.5
Pieper S., Ranft A., Braun-Munzinger G., Jurgens H., Paulussen M., and Dirksen U.Ewing’s tumors over the age of 40: a retrospective analysis of 47 patients treatedaccording to the International Clinical Trials EICESS 92 and EURO-E.W.I.N.G.99. Onkologie, 31(12):657–63, 2008. 2
Pinkel D., Segraves R., Sudar D., Clark S., Poole I., Kowbel D., Collins C., KuoW. L., Chen C., Zhai Y., Dairkee S. H., Ljung B. M., Gray J. W., and AlbertsonD. G. High resolution analysis of DNA copy number variation using comparativegenomic hybridization to microarrays. Nat Genet, 20(2):207–11, 1998. 13
Pollack J. R., Perou C. M., Alizadeh A. A., Eisen M. B., Pergamenschikov A.,Williams C. F., Jeffrey S. S., Botstein D., and Brown P. O. Genome-wide analysisof DNA copy-number changes using cDNA microarrays. Nat Genet, 23(1):41–6,1999. 13
Potikyan G., France K. A., Carlson M. R. J., Dong J., Nelson S. F., and DennyC. T. Genetically defined EWS/FLI1 model system suggests mesenchymal originof Ewing’s family tumors. Lab Invest, 88(12):1291–302, 2008. 11
R Development Core Team . R: A Language and Environment for StatisticalComputing. R Foundation for Statistical Computing, Vienna, Austria, 2009. URLhttp://www.R-project.org. ISBN 3-900051-07-0. 19
Redon R., Ishikawa S., Fitch K. R., Feuk L., Perry G. H., Andrews T. D., FieglerH., Shapero M. H., Carson A. R., Chen W., Cho E. K., Dallaire S., FreemanJ. L., Gonzalez J. R., Gratacos M., Huang J., Kalaitzopoulos D., KomuraD., MacDonald J. R., Marshall C. R., Mei R., Montgomery L., Nishimura K.,Okamura K., Shen F., Somerville M. J., Tchinda J., Valsesia A., Woodwark C.,Yang F., Zhang J., Zerjal T., Zhang J., Armengol L., Conrad D. F., Estivill X.,Tyler-Smith C., Carter N. P., Aburatani H., Lee C., Jones K. W., Scherer S. W.,and Hurles M. E. Global variation in copy number in the human genome. Nature,444(7118):444–454, 2006. 14
Richter G. H. S., Plehm S., Fasan A., Rössler S., Unland R., Bennani-Baiti I. M.,Hotfilder M., Löwel D., von Luettichau I., Mossbrugger I., Quintanilla-MartinezL., Kovar H., Staege M. S., Müller-Tidow C., and Burdach S. EZH2 is a mediatorof EWS/FLI1 driven tumor growth and metastasis blocking endothelial and neuro-ectodermal differentiation. Proc Natl Acad Sci U S A, 106(13):5324–9, 2009. 8
Ries L. A. G., Smith M. A., Gurney J. G., Linet M., Tamra T., Young J. L.,and Bunin (eds.) G. R. Cancer Incidence and Survival among Children and
59
Adolescents: United States SEER Program 1975-1995. National Cancer Institute,SEER Program. NIH Pub. No. 99-4649. Bethesda, MD, 1999. 2
Riggi N., Cironi L., Provero P., Suvà M.-L., Kaloulis K., Garcia-Echeverria C.,Hoffmann F., Trumpp A., and Stamenkovic I. Development of Ewing’s sarcomafrom primary bone marrow-derived mesenchymal progenitor cells. Cancer Res, 65(24):11459–68, 2005. 10, 11
Riggi N., Suvà M.-L., Suvà D., Cironi L., Provero P., Tercier S., Joseph J.-M., StehleJ.-C., Baumer K., Kindler V., and Stamenkovic I. EWS-FLI-1 expression triggersa Ewing’s sarcoma initiation program in primary human mesenchymal stem cells.Cancer Res, 68(7):2176–85, 2008. 10
Riggi N., Suvà M.-L., De Vito C., Provero P., Stehle J.-C., Baumer K., CironiL., Janiszewska M., Petricevic T., Suvà D., Tercier S., Joseph J.-M., Guillou L.,and Stamenkovic I. EWS-FLI-1 modulates miRNA145 and SOX2 expression toinitiate mesenchymal stem cell reprogramming toward ewing sarcoma cancer stemcells. Genes Dev, 24(9):916–32, 2010. 42
Ritchie M. E., Silver J., Oshlack A., Holmes M., Diyagama D., Holloway A., andSmyth G. K. A comparison of background correction methods for two-colourmicroarrays. Bioinformatics, 23(20):2700–7, 2007. 19
Roberts P., Burchill S. A., Brownhill S., Cullinane C. J., Johnston C., GriffithsM. J., McMullan D. J., Bown N. P., Morris S. P., and Lewis I. J. Ploidy andkaryotype complexity are powerful prognostic indicators in the Ewing’s sarcomafamily of tumors: a study by the United Kingdom Cancer Cytogenetics and theChildren’s Cancer and Leukaemia Group. Genes Chromosomes Cancer, 47(3):207–20, 2008. 9
Sandberg A. A. and Bridge J. A. Updates on cytogenetics and molecular geneticsof bone and soft tissue tumors: Ewing sarcoma and peripheral primitive neuroec-todermal tumors. Cancer Genet Cytogenet, 123(1):1–26, 2000. 9
Savola S., Nardi F., Scotlandi K., Picci P., and Knuutila S. Microdeletions in9p21.3 induce false negative results in CDKN2A FISH analysis of Ewing sarcoma.Cytogenet Genome Res, 119(1-2):21–6, 2007. 18, 38
Savola S., Klami A., Tripathi A., Niini T., Serra M., Picci P., Kaski S., ZambelliD., Scotlandi K., and Knuutila S. Combined use of expression and CGH arrayspinpoints novel candidate genes in Ewing sarcoma family of tumors. BMC Cancer,9:17, 2009. 19
Scheinin I., Myllykangas S., Borze I., Bohling T., Knuutila S., and Saharinen J.CanGEM: mining gene copy number changes in cancer. Nucleic Acids Res, 36(Database issue):D830–D835, 2008. 17, 20
60
Scotlandi K., Serra M., Manara M. C., Benini S., Sarti M., Maurici D., Lollini P. L.,Picci P., Bertoni F., and Baldini N. Immunostaining of the p30/32MIC2 antigenand molecular detection of EWS rearrangements for the diagnosis of Ewing’ssarcoma and peripheral neuroectodermal tumor. Hum Pathol, 27(4):408–16, 1996.4
Sebat J., Lakshmi B., Troge J., Alexander J., Young J., Lundin P., Maner S., MassaH., Walker M., Chi M., Navin N., Lucito R., Healy J., Hicks J., Ye K., Reiner A.,Gilliam T. C., Trask B., Patterson N., Zetterberg A., and Wigler M. Large-scalecopy number polymorphism in the human genome. Science, 305(5683):525–528,2004. 14
Sharrocks A. D. The ETS-domain transcription factor family. Nat Rev Mol CellBiol, 2(11):827–37, 2001. 6
Shing D. C., McMullan D. J., Roberts P., Smith K., Chin S.-F., Nicholson J.,Tillman R. M., Ramani P., Cullinane C., and Coleman N. FUS/ERG gene fusionsin Ewing’s tumors. Cancer Res, 63(15):4568–76, 2003. 7
Shlien A. and Malkin D. Copy number variations and cancer susceptibility. CurrOpin Oncol, 22(1):55–63, 2010. 14
Siggberg L., Ala-Mello S., Jaakkola E., Kuusinen E., Schuit R., Kohlhase J., BöhmD., Ignatius J., and Knuutila S. Array CGH in molecular diagnosis of mentalretardation - A study of 150 Finnish patients. Am J Med Genet A, 152A(6):1398–410, 2010. 19
Sircoulomb F., Nicolas N., Ferrari A., Finetti P., Bekhouche I., Rousselet E., LonigroA., Adélaïde J., Baudelet E., Esteyriès S., Wicinski J., Audebert S., Charafe-Jauffret E., Jacquemier J., Lopez M., Borg J.-P., Sotiriou C., Popovici C., BertucciF., Birnbaum D., Chaffanet M., and Ginestier C. ZNF703 gene amplification at8p12 specifies luminal B breast cancer. EMBO Mol Med, 3(3):153–66, 2011. 40
Smith R., Owen L. A., Trem D. J., Wong J. S., Whangbo J. S., Golub T. R., andLessnick S. L. Expression profiling of EWS/FLI identifies NKX2.2 as a criticaltarget gene in Ewing’s sarcoma. Cancer Cell, 9(5):405–16, 2006. 8
Smyth G. K. Linear models and empirical Bayes methods for assessing differentialexpression in microarray experiments. Stat Appl Genet Mol Biol, 3:Article3, 2004.21
Smyth G. K. and Speed T. Normalization of cDNA microarray data. Methods, 31(4):265–273, 2003. 19
Solinas-Toldo S., Lampel S., Stilgenbauer S., Nickolenko J., Benner A., DöhnerH., Cremer T., and Lichter P. Matrix-based comparative genomic hybridization:biochips to screen for genomic imbalances. Genes Chromosomes Cancer, 20(4):399–407, 1997. 13
61
Stern M. H., Soulier J., Rosenzwajg M., Nakahara K., Canki-Klain N., Aurias A.,Sigaux F., and Kirsch I. R. MTCP-1: a novel gene on the human chromosomeXq28 translocated to the T cell receptor alpha/delta locus in mature T cell pro-liferations. Oncogene, 8(9):2475–83, 1993. 41
Su A. I., Wiltshire T., Batalov S., Lapp H., Ching K. A., Block D., Zhang J., SodenR., Hayakawa M., Kreiman G., Cooke M. P., Walker J. R., and Hogenesch J. B.A gene atlas of the mouse and human protein-encoding transcriptomes. Proc NatlAcad Sci U S A, 101(16):6062–6067, 2004. 11
Tan A. Y. and Manley J. L. The TET family of proteins: functions and roles indisease. J Mol Cell Biol, 1(2):82–92, 2009. 6
Tanabe S., Sato Y., Suzuki T., Suzuki K., Nagao T., and Yamaguchi T. Geneexpression profiling of human mesenchymal stem cells for identification of novelmarkers in early- and late-stage cell culture. J Biochem, 144(3):399–408, 2008.18, 26
Tanaka K., Iwakuma T., Harimaya K., Sato H., and Iwamoto Y. EWS-Fli1 anti-sense oligodeoxynucleotide inhibits proliferation of human Ewing’s sarcoma andprimitive neuroectodermal tumor cells. J Clin Invest, 99(2):239–47, 1997. 8
Teng P.-N., Hood B. L., Sun M., Dhir R., and Conrads T. P. Differential proteomicanalysis of renal cell carcinoma tissue interstitial fluid. J Proteome Res, 10(3):1333–42, 2011. 41
Terrier P., Llombart-Bosch A., and Contesso G. Small round blue cell tumors inbone: prognostic factors correlated to Ewing’s sarcoma and neuroectodermal tu-mors. Semin Diagn Pathol, 13(3):250–7, 1996. 5
Thacker M. M., Temple H. T., and Scully S. P. Current treatment for Ewing’ssarcoma. Expert Rev Anticancer Ther, 5(2):319–31, 2005. 5
Thomas J. T., Canelos P., Luyten F. P., and Moos Jr M. Xenopus SMOC-1 in-hibits bone morphogenetic protein signaling downstream of receptor binding andis essential for postgastrulation development in Xenopus. J Biol Chem, 284(28):18994–9005, 2009. 44
Thompson A. D., Teitell M. A., Arvand A., and Denny C. T. Divergent Ewing’ssarcoma EWS/ETS fusions confer a common tumorigenic phenotype on NIH3T3cells. Oncogene, 18(40):5506–13, 1999. 7
Tirode F., Laud-Duval K., Prieur A., Delorme B., Charbord P., and Delattre O.Mesenchymal stem cell features of Ewing tumors. Cancer Cell, 11(5):421–9, 2007.11
Torchia E. C., Boyd K., Rehg J. E., Qu C., and Baker S. J. EWS/FLI-1 inducesrapid onset of myeloid/erythroid leukemia in mice. Mol Cell Biol, 27(22):7918–34,2007. 11
62
Tsuchiya T., Sekine K., Hinohara S., Namiki T., Nobori T., and Kaneko Y. Analysisof the p16INK4, p14ARF, p15, TP53, and MDM2 genes and their prognosticimplications in osteosarcoma and Ewing sarcoma. Cancer Genet Cytogenet, 120(2):91–8, 2000. 10
Tsukioka M., Matsumoto Y., Noriyuki M., Yoshida C., Nobeyama H., Yoshida H.,Yasui T., Sumi T., Honda K.-I., and Ishiko O. Expression of glucose transportersin epithelial ovarian carcinoma: correlation with clinical characteristics and tumorangiogenesis. Oncol Rep, 18(2):361–7, 2007. 44
Tuna M., Knuutila S., and Mills G. B. Uniparental disomy in cancer. Trends MolMed, 15(3):120–8, 2009. 14
Turc-Carel C., Philip I., Berger M. P., Philip T., and Lenoir G. M. Chromosomestudy of Ewing’s sarcoma (ES) cell lines. Consistency of a reciprocal translocationt(11;22)(q24;q12). Cancer Genet Cytogenet, 12(1):1–19, 1984. 6
Turc-Carel C., Aurias A., Mugneret F., Lizard S., Sidaner I., Volk C., Thiery J. P.,Olschwang S., Philip I., and Berger M. P. Chromosomes in Ewing’s sarcoma. I.An evaluation of 85 cases of remarkable consistency of t(11;22)(q24;q12). CancerGenet Cytogenet, 32(2):229–38, 1988. 6
Tuzun E., Sharp A. J., Bailey J. A., Kaul R., Morrison V. A., Pertz L. M., HaugenE., Hayden H., Albertson D., Pinkel D., Olson M. V., and Eichler E. E. Fine-scalestructural variation of the human genome. Nat Genet, 37(7):727–732, 2005. 14
Uren A. and Toretsky J. A. Ewing’s sarcoma oncoprotein EWS-FLI1: the perfecttarget without a therapeutic agent. Future Oncol, 1(4):521–8, 2005. 9
van de Wiel M. A. and van Wieringen W. N. CGHregions: dimension reductionfor array CGH data with minimal information loss. Cancer Informatics, 3:55–63,2007. 19
van de Wiel M. A., Kim K. I., Vosse S. J., van Wieringen W. N., Wilting S. M.,and Ylstra B. CGHcall: calling aberrations for array CGH tumor profiles.Bioinformatics, 23(7):892–894, 2007. 14, 19
van de Wiel M. A., Brosens R., Eilers P. H. C., Kumps C., Meijer G. A., Menten B.,Sistermans E., Speleman F., Timmerman M. E., and Ylstra B. Smoothing wavesin array CGH tumor profiles. Bioinformatics, 25(9):1099–1104, 2009. 19
Van Patten S. M., Heisermann G. J., Cheng H. C., and Walsh D. A. Tyrosinekinase catalyzed phosphorylation and inactivation of the inhibitor protein of thecAMP-dependent protein kinase. J Biol Chem, 262(7):3398–403, 1987. 44
van Wieringen W. N. and van de Wiel M. A. Nonparametric testing for DNA copynumber induced differential mRNA gene expression. Biometrics, 65(1):19–29,2009. 15, 22
63
van Wieringen W. N., van de Wiel M. A., and Ylstra B. Normalized, segmented orcalled aCGH data? Cancer Inform, 3:321–327, 2007. 14
Vasudevan S., Tong Y., and Steitz J. A. Switching from repression to activation:microRNAs can up-regulate translation. Science, 318(5858):1931–4, 2007. 16
Venkatraman E. S. and Olshen A. B. A faster circular binary segmentation algorithmfor the analysis of array CGH data. Bioinformatics, 23(6):657–663, 2007. 14, 19
West D. C., Grier H. E., Swallow M. M., Demetri G. D., Granowetter L., and SklarJ. Detection of circulating tumor cells in patients with Ewing’s sarcoma andperipheral primitive neuroectodermal tumor. J Clin Oncol, 15(2):583–8, 1997. 3
Worch J., Matthay K. K., Neuhaus J., Goldsby R., and DuBois S. G. Ethnic andracial differences in patients with Ewing sarcoma. Cancer, 116(4):983–8, 2010. 2
Wu Z., Irizarry R. A., Gentleman R., Murillo F. M., and Spencer F. A model basedbackground adjustment for oligonucleotide expression arrays. Johns HopkinsUniversity, Dept. of Biostatistics Working Papers, page Working Paper 1, 2004.20
Wunder J. S., Paulian G., Huvos A. G., Heller G., Meyers P. A., and Healey J. H. Thehistological response to chemotherapy as a predictor of the oncological outcomeof operative treatment of Ewing sarcoma. J Bone Joint Surg Am, 80(7):1020–33,1998. 5
Ylstra B., van den Ijssel P., Carvalho B., Brakenhoff R. H., and Meijer G. A. BAC tothe future! or oligonucleotides: a perspective for micro array comparative genomichybridization (array CGH). Nucleic Acids Res, 34(2):445–450, 2006. 13
Zhang F., Gu W., Hurles M. E., and Lupski J. R. Copy number variation in humanhealth, disease, and evolution. Annu Rev Genomics Hum Genet, 10:451–81, 2009.14
Zhang J., Feuk L., Duggan G. E., Khaja R., and Scherer S. W. Developmentof bioinformatics resources for display and analysis of copy number and otherstructural variants in the human genome. Cytogenet Genome Res, 115(3-4):205–14, 2006. 20, 38
Zhang J., Guo H., Zhang H., Wang H., Qian G., Fan X., Hoffman A. R., Hu J.-F.,and Ge S. Putative tumor suppressor miR-145 inhibits colon cancer cell growthby targeting oncogene Friend leukemia virus integration 1 gene. Cancer, 117(1):86–95, 2011. 42
Zhao X., Weir B. A., LaFramboise T., Lin M., Beroukhim R., Garraway L., BeheshtiJ., Lee J. C., Naoki K., Richards W. G., Sugarbaker D., Chen F., Rubin M. A.,Jänne P. A., Girard L., Minna J., Christiani D., Li C., Sellers W. R., and MeyersonM. Homozygous deletions and chromosome amplifications in human lung carci-nomas revealed by single nucleotide polymorphism array analysis. Cancer Res, 65(13):5561–70, 2005. 13

64
Zielenska M., Zhang Z. M., Ng K., Marrano P., Bayani J., Ramirez O. C., SorensenP., Thorner P., Greenberg M., and Squire J. A. Acquisition of secondary structuralchromosomal changes in pediatric Ewing sarcoma is a probable prognostic factorfor tumor response and clinical outcome. Cancer, 91(11):2156–64, 2001. 9
Zucman J., Melot T., Desmaze C., Ghysdael J., Plougastel B., Peter M., ZuckerJ. M., Triche T. J., Sheer D., and Turc-Carel C. Combinatorial generation ofvariable fusion proteins in the Ewing family of tumours. EMBO J, 12(12):4481–7,1993. 7
Zucman-Rossi J., Batzer M. A., Stoneking M., Delattre O., and Thomas G.Interethnic polymorphism of EWS intron 6: genome plasticity mediated by Aluretroposition and recombination. Hum Genet, 99(3):357–63, 1997. 7

65
Appendices
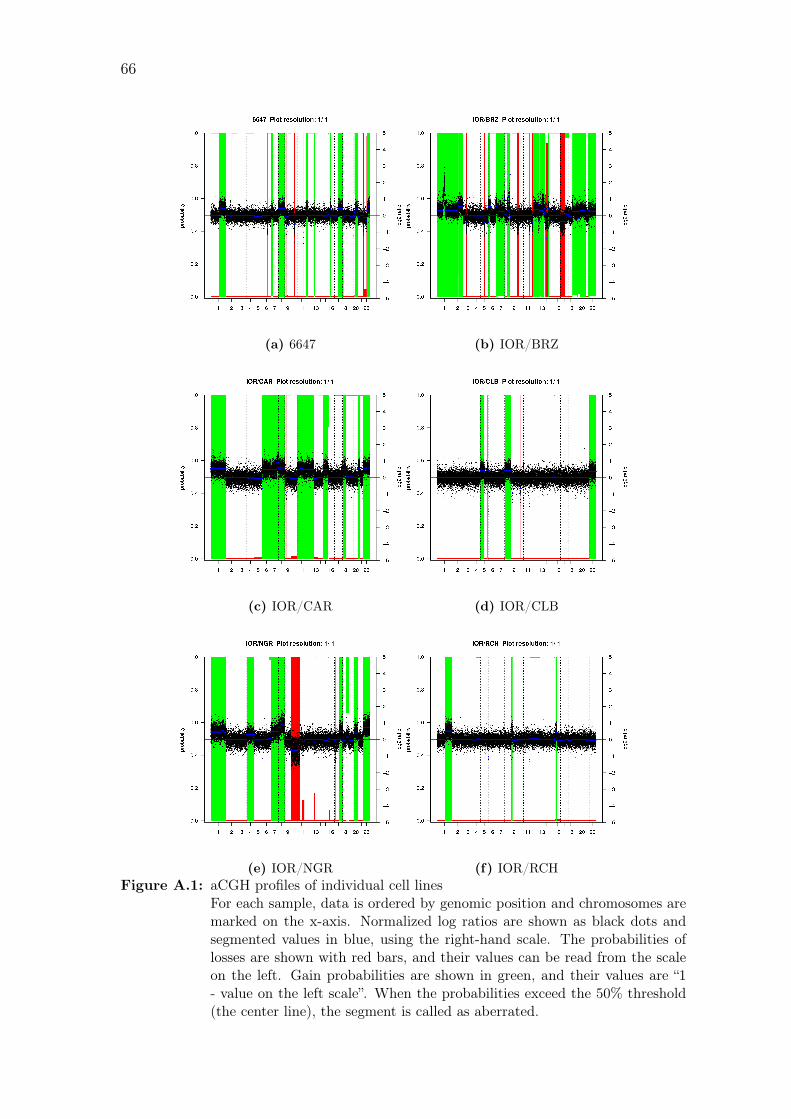
66
(a) 6647 (b) IOR/BRZ
(c) IOR/CAR (d) IOR/CLB
(e) IOR/NGR (f) IOR/RCHFigure A.1: aCGH profiles of individual cell lines
For each sample, data is ordered by genomic position and chromosomes aremarked on the x-axis. Normalized log ratios are shown as black dots andsegmented values in blue, using the right-hand scale. The probabilities oflosses are shown with red bars, and their values can be read from the scaleon the left. Gain probabilities are shown in green, and their values are “1- value on the left scale”. When the probabilities exceed the 50% threshold(the center line), the segment is called as aberrated.
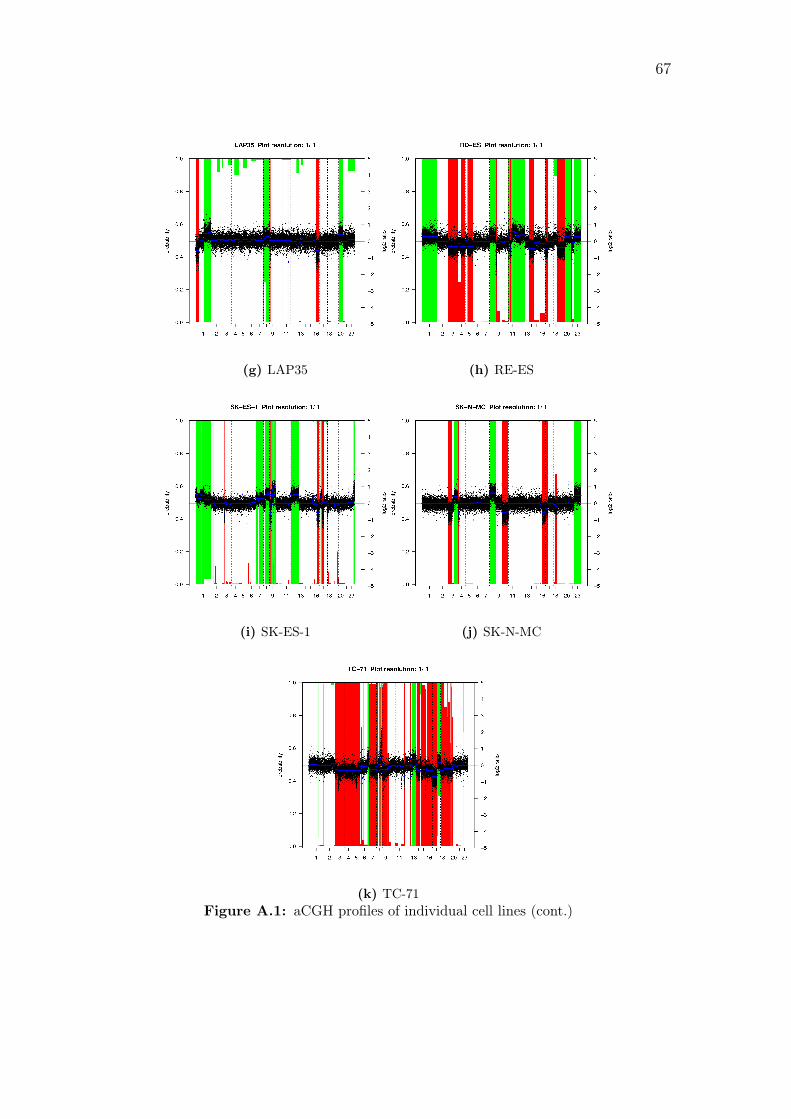
67
(g) LAP35 (h) RE-ES
(i) SK-ES-1 (j) SK-N-MC
(k) TC-71Figure A.1: aCGH profiles of individual cell lines (cont.)
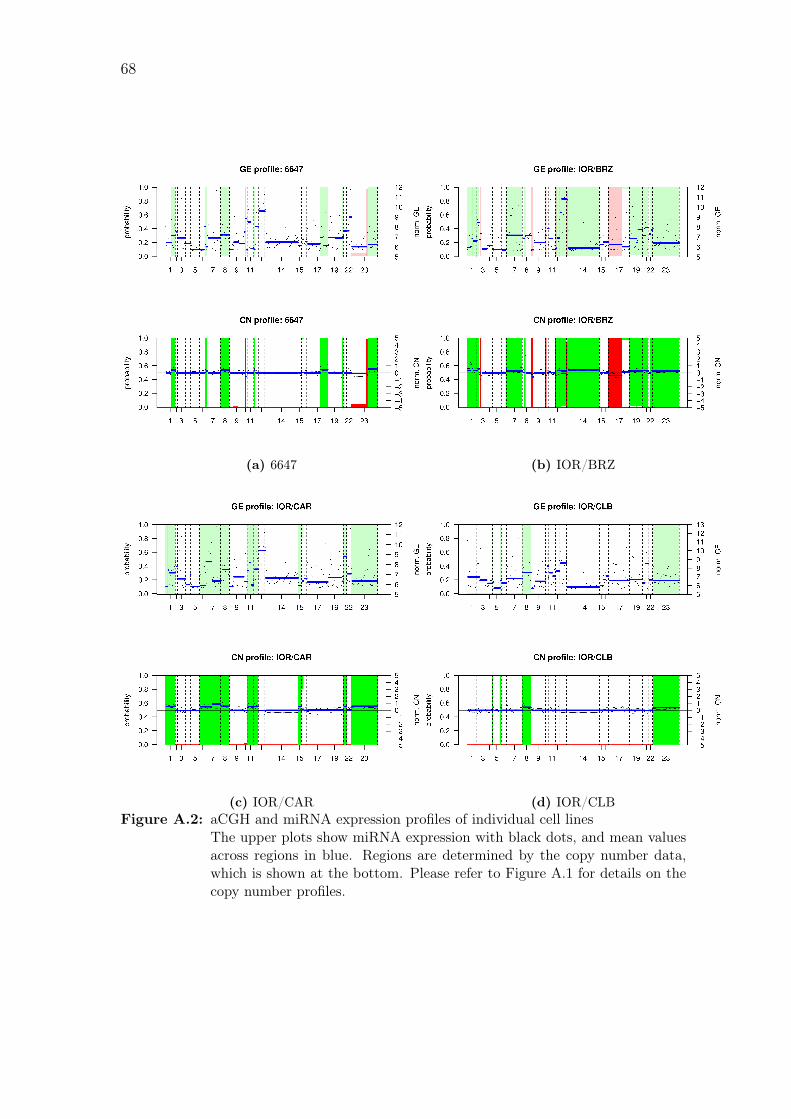
68
(a) 6647 (b) IOR/BRZ
(c) IOR/CAR (d) IOR/CLBFigure A.2: aCGH and miRNA expression profiles of individual cell lines
The upper plots show miRNA expression with black dots, and mean valuesacross regions in blue. Regions are determined by the copy number data,which is shown at the bottom. Please refer to Figure A.1 for details on thecopy number profiles.
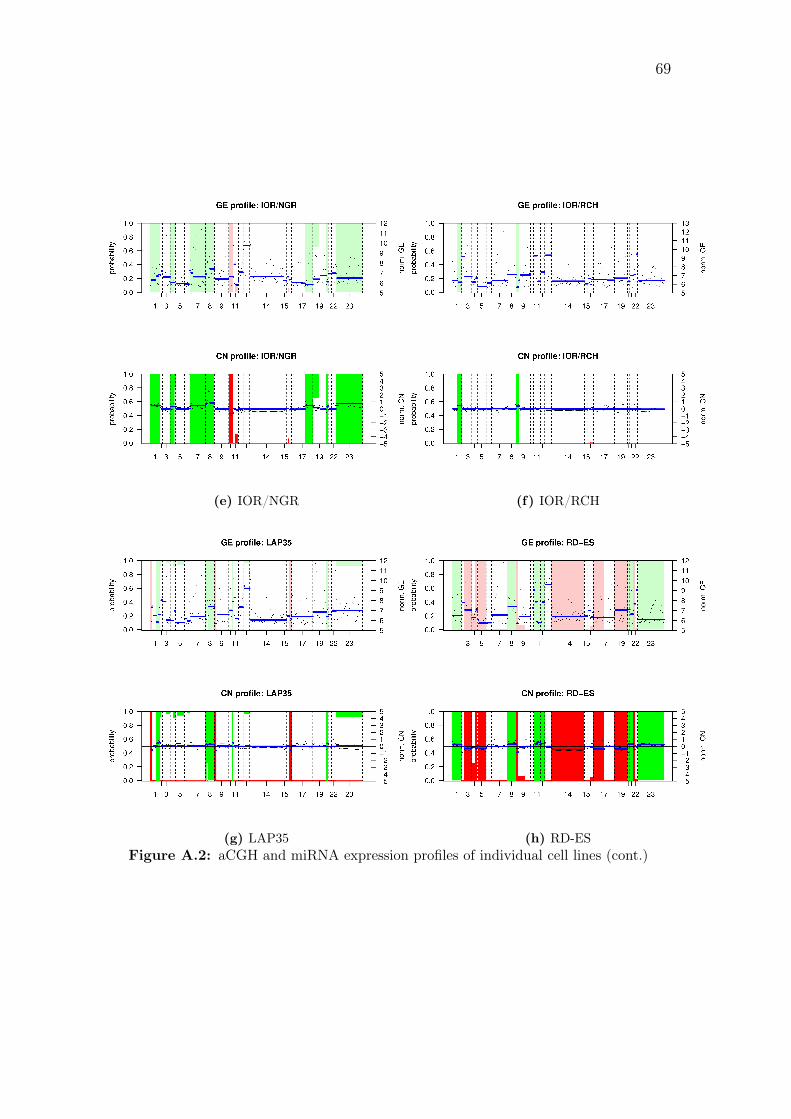
69
(e) IOR/NGR (f) IOR/RCH
(g) LAP35 (h) RD-ESFigure A.2: aCGH and miRNA expression profiles of individual cell lines (cont.)
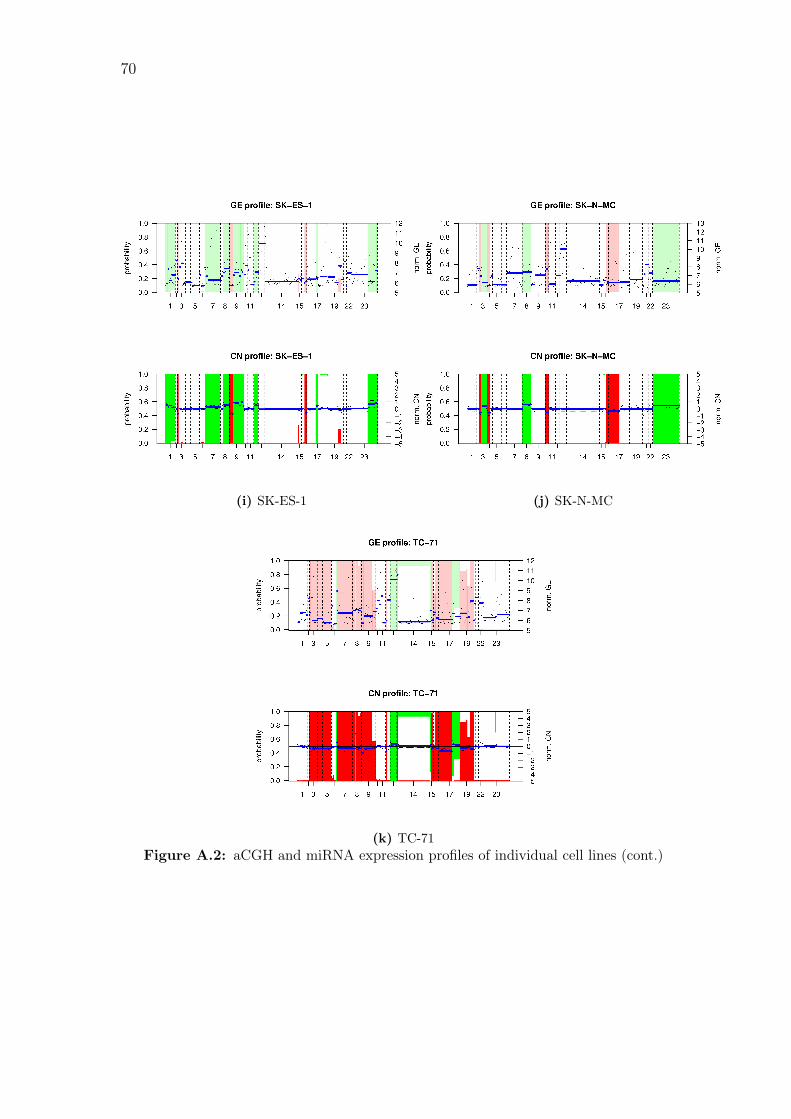
70
(i) SK-ES-1 (j) SK-N-MC
(k) TC-71Figure A.2: aCGH and miRNA expression profiles of individual cell lines (cont.)
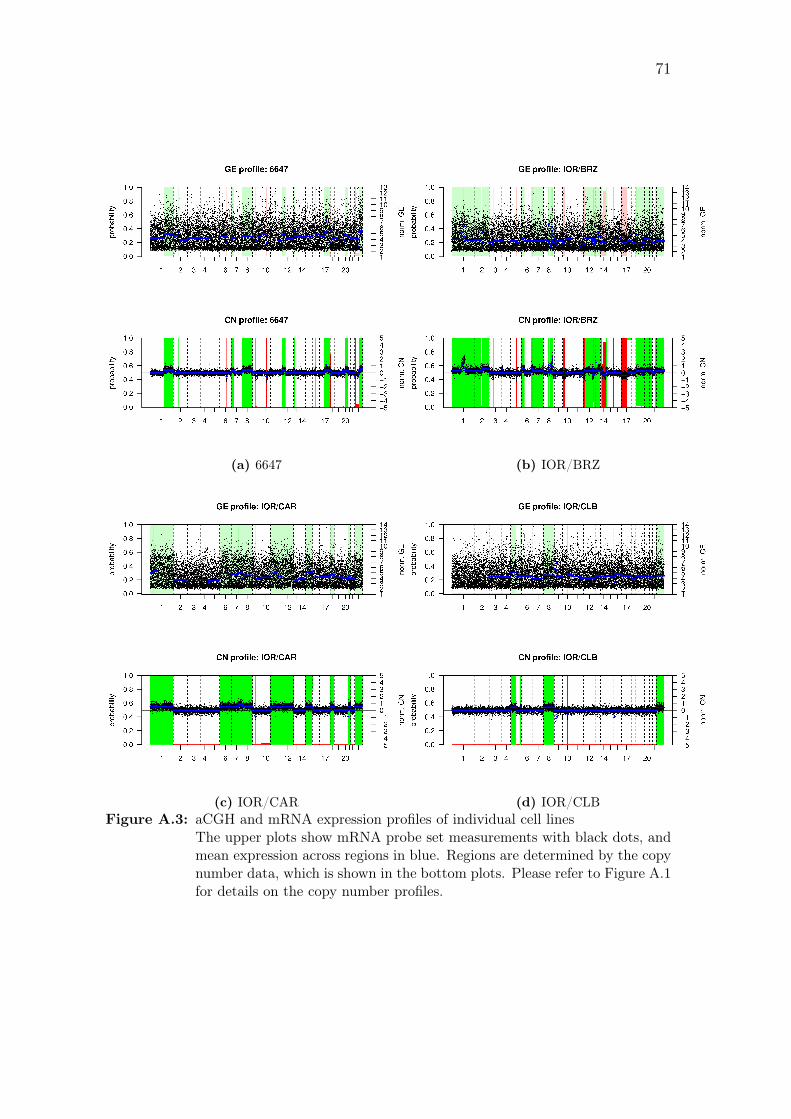
71
(a) 6647 (b) IOR/BRZ
(c) IOR/CAR (d) IOR/CLBFigure A.3: aCGH and mRNA expression profiles of individual cell lines
The upper plots show mRNA probe set measurements with black dots, andmean expression across regions in blue. Regions are determined by the copynumber data, which is shown in the bottom plots. Please refer to Figure A.1for details on the copy number profiles.
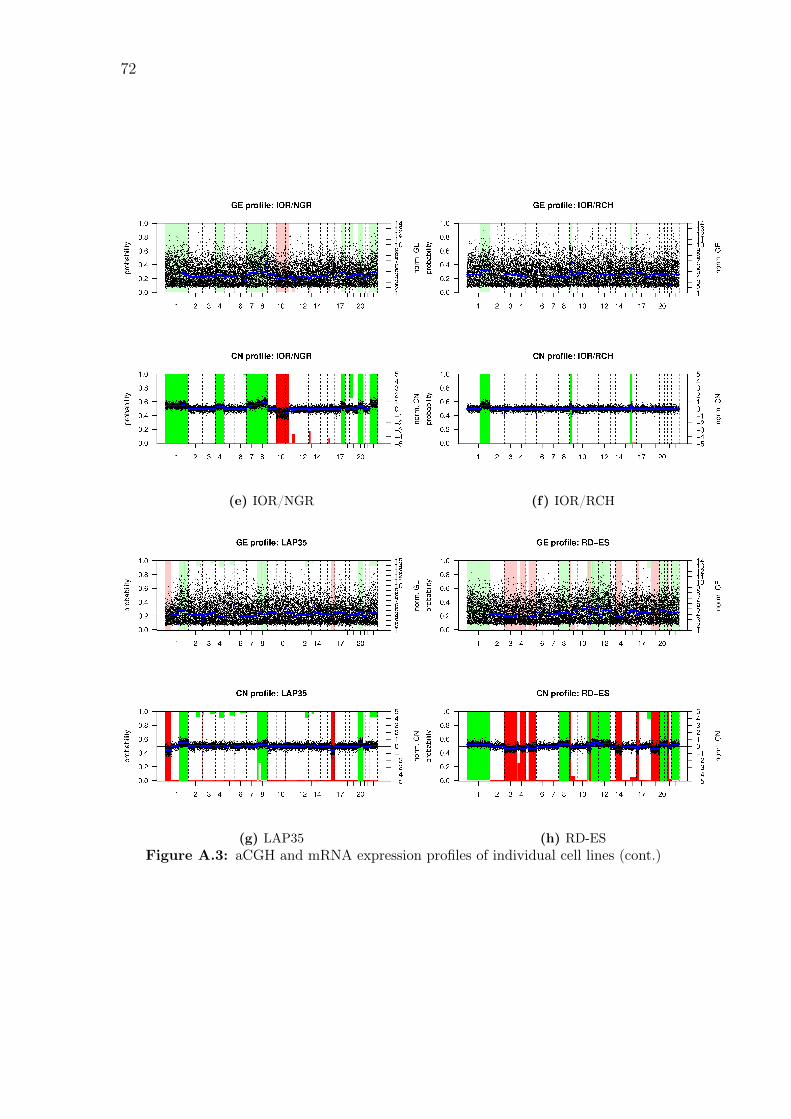
72
(e) IOR/NGR (f) IOR/RCH
(g) LAP35 (h) RD-ESFigure A.3: aCGH and mRNA expression profiles of individual cell lines (cont.)
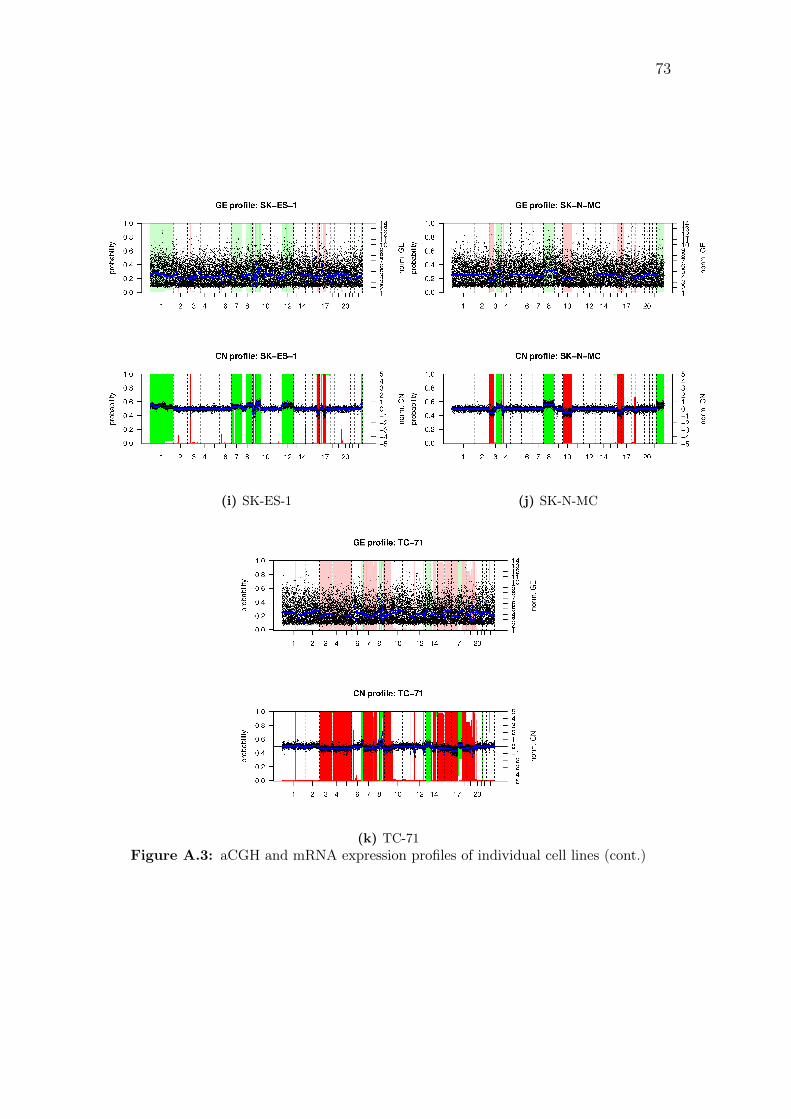
73
(i) SK-ES-1 (j) SK-N-MC
(k) TC-71Figure A.3: aCGH and mRNA expression profiles of individual cell lines (cont.)
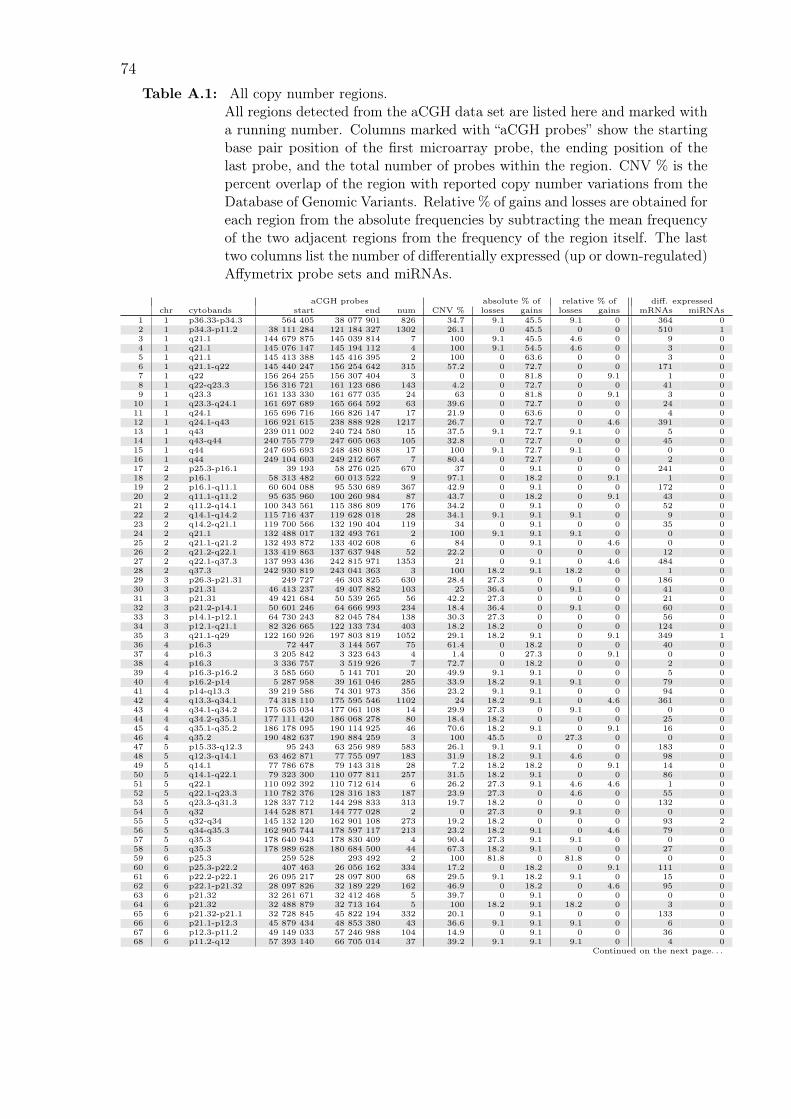
74Table A.1: All copy number regions.
All regions detected from the aCGH data set are listed here and marked witha running number. Columns marked with “aCGH probes” show the startingbase pair position of the first microarray probe, the ending position of thelast probe, and the total number of probes within the region. CNV % is thepercent overlap of the region with reported copy number variations from theDatabase of Genomic Variants. Relative % of gains and losses are obtained foreach region from the absolute frequencies by subtracting the mean frequencyof the two adjacent regions from the frequency of the region itself. The lasttwo columns list the number of differentially expressed (up or down-regulated)Affymetrix probe sets and miRNAs.
aCGH probes absolute % of relative % of diff. expressedchr cytobands start end num CNV % losses gains losses gains mRNAs miRNAs
1 1 p36.33-p34.3 564 405 38 077 901 826 34.7 9.1 45.5 9.1 0 364 02 1 p34.3-p11.2 38 111 284 121 184 327 1302 26.1 0 45.5 0 0 510 13 1 q21.1 144 679 875 145 039 814 7 100 9.1 45.5 4.6 0 9 04 1 q21.1 145 076 147 145 194 112 4 100 9.1 54.5 4.6 0 3 05 1 q21.1 145 413 388 145 416 395 2 100 0 63.6 0 0 3 06 1 q21.1-q22 145 440 247 156 254 642 315 57.2 0 72.7 0 0 171 07 1 q22 156 264 255 156 307 404 3 0 0 81.8 0 9.1 1 08 1 q22-q23.3 156 316 721 161 123 686 143 4.2 0 72.7 0 0 41 09 1 q23.3 161 133 330 161 677 035 24 63 0 81.8 0 9.1 3 010 1 q23.3-q24.1 161 697 689 165 664 592 63 39.6 0 72.7 0 0 24 011 1 q24.1 165 696 716 166 826 147 17 21.9 0 63.6 0 0 4 012 1 q24.1-q43 166 921 615 238 888 928 1217 26.7 0 72.7 0 4.6 391 013 1 q43 239 011 002 240 724 580 15 37.5 9.1 72.7 9.1 0 5 014 1 q43-q44 240 755 779 247 605 063 105 32.8 0 72.7 0 0 45 015 1 q44 247 695 693 248 480 808 17 100 9.1 72.7 9.1 0 0 016 1 q44 249 104 603 249 212 667 7 80.4 0 72.7 0 0 2 017 2 p25.3-p16.1 39 193 58 276 025 670 37 0 9.1 0 0 241 018 2 p16.1 58 313 482 60 013 522 9 97.1 0 18.2 0 9.1 1 019 2 p16.1-q11.1 60 604 088 95 530 689 367 42.9 0 9.1 0 0 172 020 2 q11.1-q11.2 95 635 960 100 260 984 87 43.7 0 18.2 0 9.1 43 021 2 q11.2-q14.1 100 343 561 115 386 809 176 34.2 0 9.1 0 0 52 022 2 q14.1-q14.2 115 716 437 119 628 018 28 34.1 9.1 9.1 9.1 0 9 023 2 q14.2-q21.1 119 700 566 132 190 404 119 34 0 9.1 0 0 35 024 2 q21.1 132 488 017 132 493 761 2 100 9.1 9.1 9.1 0 0 025 2 q21.1-q21.2 132 493 872 133 402 608 6 84 0 9.1 0 4.6 0 026 2 q21.2-q22.1 133 419 863 137 637 948 52 22.2 0 0 0 0 12 027 2 q22.1-q37.3 137 993 436 242 815 971 1353 21 0 9.1 0 4.6 484 028 2 q37.3 242 930 819 243 041 363 3 100 18.2 9.1 18.2 0 1 029 3 p26.3-p21.31 249 727 46 303 825 630 28.4 27.3 0 0 0 186 030 3 p21.31 46 413 237 49 407 882 103 25 36.4 0 9.1 0 41 031 3 p21.31 49 421 684 50 539 265 56 42.2 27.3 0 0 0 21 032 3 p21.2-p14.1 50 601 246 64 666 993 234 18.4 36.4 0 9.1 0 60 033 3 p14.1-p12.1 64 730 243 82 045 784 138 30.3 27.3 0 0 0 56 034 3 p12.1-q21.1 82 326 665 122 133 734 403 18.2 18.2 0 0 0 124 035 3 q21.1-q29 122 160 926 197 803 819 1052 29.1 18.2 9.1 0 9.1 349 136 4 p16.3 72 447 3 144 567 75 61.4 0 18.2 0 0 40 037 4 p16.3 3 205 842 3 323 643 4 1.4 0 27.3 0 9.1 0 038 4 p16.3 3 336 757 3 519 926 7 72.7 0 18.2 0 0 2 039 4 p16.3-p16.2 3 585 660 5 141 701 20 49.9 9.1 9.1 0 0 5 040 4 p16.2-p14 5 287 958 39 161 046 285 33.9 18.2 9.1 9.1 0 79 041 4 p14-q13.3 39 219 586 74 301 973 356 23.2 9.1 9.1 0 0 94 042 4 q13.3-q34.1 74 318 110 175 595 546 1102 24 18.2 9.1 0 4.6 361 043 4 q34.1-q34.2 175 635 034 177 061 108 14 29.9 27.3 0 9.1 0 0 044 4 q34.2-q35.1 177 111 420 186 068 278 80 18.4 18.2 0 0 0 25 045 4 q35.1-q35.2 186 178 095 190 114 925 46 70.6 18.2 9.1 0 9.1 16 046 4 q35.2 190 482 637 190 884 259 3 100 45.5 0 27.3 0 0 047 5 p15.33-q12.3 95 243 63 256 989 583 26.1 9.1 9.1 0 0 183 048 5 q12.3-q14.1 63 462 871 77 755 097 183 31.9 18.2 9.1 4.6 0 98 049 5 q14.1 77 786 678 79 143 318 28 7.2 18.2 18.2 0 9.1 14 050 5 q14.1-q22.1 79 323 300 110 077 811 257 31.5 18.2 9.1 0 0 86 051 5 q22.1 110 092 392 110 712 614 6 26.2 27.3 9.1 4.6 4.6 1 052 5 q22.1-q23.3 110 782 376 128 316 183 187 23.9 27.3 0 4.6 0 55 053 5 q23.3-q31.3 128 337 712 144 298 833 313 19.7 18.2 0 0 0 132 054 5 q32 144 528 871 144 777 028 2 0 27.3 0 9.1 0 0 055 5 q32-q34 145 132 120 162 901 108 273 19.2 18.2 0 0 0 93 256 5 q34-q35.3 162 905 744 178 597 117 213 23.2 18.2 9.1 0 4.6 79 057 5 q35.3 178 640 943 178 830 409 4 90.4 27.3 9.1 9.1 0 0 058 5 q35.3 178 989 628 180 684 500 44 67.3 18.2 9.1 0 0 27 059 6 p25.3 259 528 293 492 2 100 81.8 0 81.8 0 0 060 6 p25.3-p22.2 407 463 26 056 162 334 17.2 0 18.2 0 9.1 111 061 6 p22.2-p22.1 26 095 217 28 097 800 68 29.5 9.1 18.2 9.1 0 15 062 6 p22.1-p21.32 28 097 826 32 189 229 162 46.9 0 18.2 0 4.6 95 063 6 p21.32 32 261 671 32 412 468 5 39.7 0 9.1 0 0 0 064 6 p21.32 32 488 879 32 713 164 5 100 18.2 9.1 18.2 0 3 065 6 p21.32-p21.1 32 728 845 45 822 194 332 20.1 0 9.1 0 0 133 066 6 p21.1-p12.3 45 879 434 48 853 380 43 36.6 9.1 9.1 9.1 0 6 067 6 p12.3-p11.2 49 149 033 57 246 988 104 14.9 0 9.1 0 0 36 068 6 p11.2-q12 57 393 140 66 705 014 37 39.2 9.1 9.1 9.1 0 4 0
Continued on the next page. . .
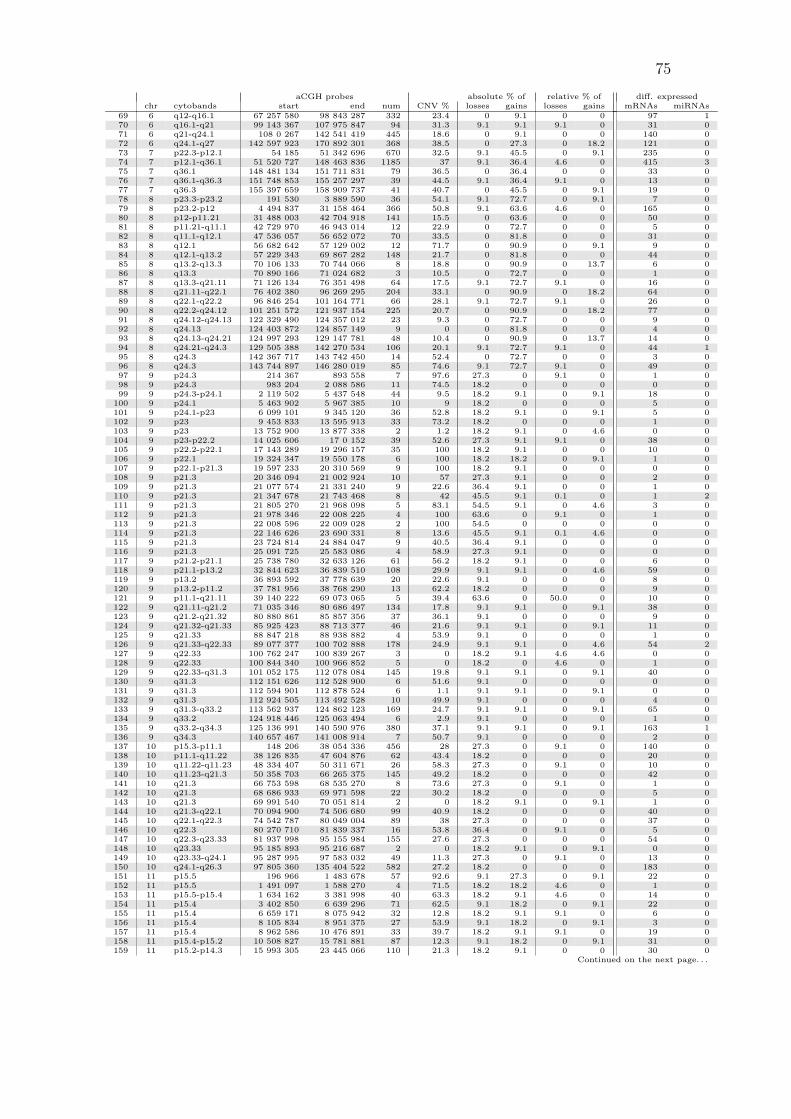
75
aCGH probes absolute % of relative % of diff. expressedchr cytobands start end num CNV % losses gains losses gains mRNAs miRNAs
69 6 q12-q16.1 67 257 580 98 843 287 332 23.4 0 9.1 0 0 97 170 6 q16.1-q21 99 143 367 107 975 847 94 31.3 9.1 9.1 9.1 0 31 071 6 q21-q24.1 108 0 267 142 541 419 445 18.6 0 9.1 0 0 140 072 6 q24.1-q27 142 597 923 170 892 301 368 38.5 0 27.3 0 18.2 121 073 7 p22.3-p12.1 54 185 51 342 696 670 32.5 9.1 45.5 0 9.1 235 074 7 p12.1-q36.1 51 520 727 148 463 836 1185 37 9.1 36.4 4.6 0 415 375 7 q36.1 148 481 134 151 711 831 79 36.5 0 36.4 0 0 33 076 7 q36.1-q36.3 151 748 853 155 257 297 39 44.5 9.1 36.4 9.1 0 13 077 7 q36.3 155 397 659 158 909 737 41 40.7 0 45.5 0 9.1 19 078 8 p23.3-p23.2 191 530 3 889 590 36 54.1 9.1 72.7 0 9.1 7 079 8 p23.2-p12 4 494 837 31 158 464 366 50.8 9.1 63.6 4.6 0 165 080 8 p12-p11.21 31 488 003 42 704 918 141 15.5 0 63.6 0 0 50 081 8 p11.21-q11.1 42 729 970 46 943 014 12 22.9 0 72.7 0 0 5 082 8 q11.1-q12.1 47 536 057 56 652 072 70 33.5 0 81.8 0 0 31 083 8 q12.1 56 682 642 57 129 002 12 71.7 0 90.9 0 9.1 9 084 8 q12.1-q13.2 57 229 343 69 867 282 148 21.7 0 81.8 0 0 44 085 8 q13.2-q13.3 70 106 133 70 744 066 8 18.8 0 90.9 0 13.7 6 086 8 q13.3 70 890 166 71 024 682 3 10.5 0 72.7 0 0 1 087 8 q13.3-q21.11 71 126 134 76 351 498 64 17.5 9.1 72.7 9.1 0 16 088 8 q21.11-q22.1 76 402 380 96 269 295 204 33.1 0 90.9 0 18.2 64 089 8 q22.1-q22.2 96 846 254 101 164 771 66 28.1 9.1 72.7 9.1 0 26 090 8 q22.2-q24.12 101 251 572 121 937 154 225 20.7 0 90.9 0 18.2 77 091 8 q24.12-q24.13 122 329 490 124 357 012 23 9.3 0 72.7 0 0 9 092 8 q24.13 124 403 872 124 857 149 9 0 0 81.8 0 0 4 093 8 q24.13-q24.21 124 997 293 129 147 781 48 10.4 0 90.9 0 13.7 14 094 8 q24.21-q24.3 129 505 388 142 270 534 106 20.1 9.1 72.7 9.1 0 44 195 8 q24.3 142 367 717 143 742 450 14 52.4 0 72.7 0 0 3 096 8 q24.3 143 744 897 146 280 019 85 74.6 9.1 72.7 9.1 0 49 097 9 p24.3 214 367 893 558 7 97.6 27.3 0 9.1 0 1 098 9 p24.3 983 204 2 088 586 11 74.5 18.2 0 0 0 0 099 9 p24.3-p24.1 2 119 502 5 437 548 44 9.5 18.2 9.1 0 9.1 18 0100 9 p24.1 5 463 902 5 967 385 10 9 18.2 0 0 0 5 0101 9 p24.1-p23 6 099 101 9 345 120 36 52.8 18.2 9.1 0 9.1 5 0102 9 p23 9 453 833 13 595 913 33 73.2 18.2 0 0 0 1 0103 9 p23 13 752 900 13 877 338 2 1.2 18.2 9.1 0 4.6 0 0104 9 p23-p22.2 14 025 606 17 0 152 39 52.6 27.3 9.1 9.1 0 38 0105 9 p22.2-p22.1 17 143 289 19 296 157 35 100 18.2 9.1 0 0 10 0106 9 p22.1 19 324 347 19 550 178 6 100 18.2 18.2 0 9.1 1 0107 9 p22.1-p21.3 19 597 233 20 310 569 9 100 18.2 9.1 0 0 0 0108 9 p21.3 20 346 094 21 002 924 10 57 27.3 9.1 0 0 2 0109 9 p21.3 21 077 574 21 331 240 9 22.6 36.4 9.1 0 0 1 0110 9 p21.3 21 347 678 21 743 468 8 42 45.5 9.1 0.1 0 1 2111 9 p21.3 21 805 270 21 968 098 5 83.1 54.5 9.1 0 4.6 3 0112 9 p21.3 21 978 346 22 008 225 4 100 63.6 0 9.1 0 1 0113 9 p21.3 22 008 596 22 009 028 2 100 54.5 0 0 0 0 0114 9 p21.3 22 146 626 23 690 331 8 13.6 45.5 9.1 0.1 4.6 0 0115 9 p21.3 23 724 814 24 884 047 9 40.5 36.4 9.1 0 0 0 0116 9 p21.3 25 091 725 25 583 086 4 58.9 27.3 9.1 0 0 0 0117 9 p21.2-p21.1 25 738 780 32 633 126 61 56.2 18.2 9.1 0 0 6 0118 9 p21.1-p13.2 32 844 623 36 839 510 108 29.9 9.1 9.1 0 4.6 59 0119 9 p13.2 36 893 592 37 778 639 20 22.6 9.1 0 0 0 8 0120 9 p13.2-p11.2 37 781 956 38 768 290 13 62.2 18.2 0 0 0 9 0121 9 p11.1-q21.11 39 140 222 69 073 065 5 39.4 63.6 0 50.0 0 10 0122 9 q21.11-q21.2 71 035 346 80 686 497 134 17.8 9.1 9.1 0 9.1 38 0123 9 q21.2-q21.32 80 880 861 85 857 356 37 36.1 9.1 0 0 0 9 0124 9 q21.32-q21.33 85 925 423 88 713 377 46 21.6 9.1 9.1 0 9.1 11 0125 9 q21.33 88 847 218 88 938 882 4 53.9 9.1 0 0 0 1 0126 9 q21.33-q22.33 89 077 377 100 702 888 178 24.9 9.1 9.1 0 4.6 54 2127 9 q22.33 100 762 247 100 839 267 3 0 18.2 9.1 4.6 4.6 0 0128 9 q22.33 100 844 340 100 966 852 5 0 18.2 0 4.6 0 1 0129 9 q22.33-q31.3 101 052 175 112 078 084 145 19.8 9.1 9.1 0 9.1 40 0130 9 q31.3 112 151 626 112 528 900 6 51.6 9.1 0 0 0 0 0131 9 q31.3 112 594 901 112 878 524 6 1.1 9.1 9.1 0 9.1 0 0132 9 q31.3 112 924 505 113 492 528 10 49.9 9.1 0 0 0 4 0133 9 q31.3-q33.2 113 562 937 124 862 123 169 24.7 9.1 9.1 0 9.1 65 0134 9 q33.2 124 918 446 125 063 494 6 2.9 9.1 0 0 0 1 0135 9 q33.2-q34.3 125 136 991 140 590 976 380 37.1 9.1 9.1 0 9.1 163 1136 9 q34.3 140 657 467 141 008 914 7 50.7 9.1 0 0 0 2 0137 10 p15.3-p11.1 148 206 38 054 336 456 28 27.3 0 9.1 0 140 0138 10 p11.1-q11.22 38 126 835 47 604 876 62 43.4 18.2 0 0 0 20 0139 10 q11.22-q11.23 48 334 407 50 311 671 26 58.3 27.3 0 9.1 0 10 0140 10 q11.23-q21.3 50 358 703 66 265 375 145 49.2 18.2 0 0 0 42 0141 10 q21.3 66 753 598 68 535 270 8 73.6 27.3 0 9.1 0 1 0142 10 q21.3 68 686 933 69 971 598 22 30.2 18.2 0 0 0 5 0143 10 q21.3 69 991 540 70 051 814 2 0 18.2 9.1 0 9.1 1 0144 10 q21.3-q22.1 70 094 900 74 506 680 99 40.9 18.2 0 0 0 40 0145 10 q22.1-q22.3 74 542 787 80 049 004 89 38 27.3 0 0 0 37 0146 10 q22.3 80 270 710 81 839 337 16 53.8 36.4 0 9.1 0 5 0147 10 q22.3-q23.33 81 937 998 95 155 984 155 27.6 27.3 0 0 0 54 0148 10 q23.33 95 185 893 95 216 687 2 0 18.2 9.1 0 9.1 0 0149 10 q23.33-q24.1 95 287 995 97 583 032 49 11.3 27.3 0 9.1 0 13 0150 10 q24.1-q26.3 97 805 360 135 404 522 582 27.2 18.2 0 0 0 183 0151 11 p15.5 196 966 1 483 678 57 92.6 9.1 27.3 0 9.1 22 0152 11 p15.5 1 491 097 1 588 270 4 71.5 18.2 18.2 4.6 0 1 0153 11 p15.5-p15.4 1 634 162 3 381 998 40 63.3 18.2 9.1 4.6 0 14 0154 11 p15.4 3 402 850 6 639 296 71 62.5 9.1 18.2 0 9.1 22 0155 11 p15.4 6 659 171 8 075 942 32 12.8 18.2 9.1 9.1 0 6 0156 11 p15.4 8 105 834 8 951 375 27 53.9 9.1 18.2 0 9.1 3 0157 11 p15.4 8 962 586 10 476 891 33 39.7 18.2 9.1 9.1 0 19 0158 11 p15.4-p15.2 10 508 827 15 781 881 87 12.3 9.1 18.2 0 9.1 31 0159 11 p15.2-p14.3 15 993 305 23 445 066 110 21.3 18.2 9.1 0 0 30 0
Continued on the next page. . .
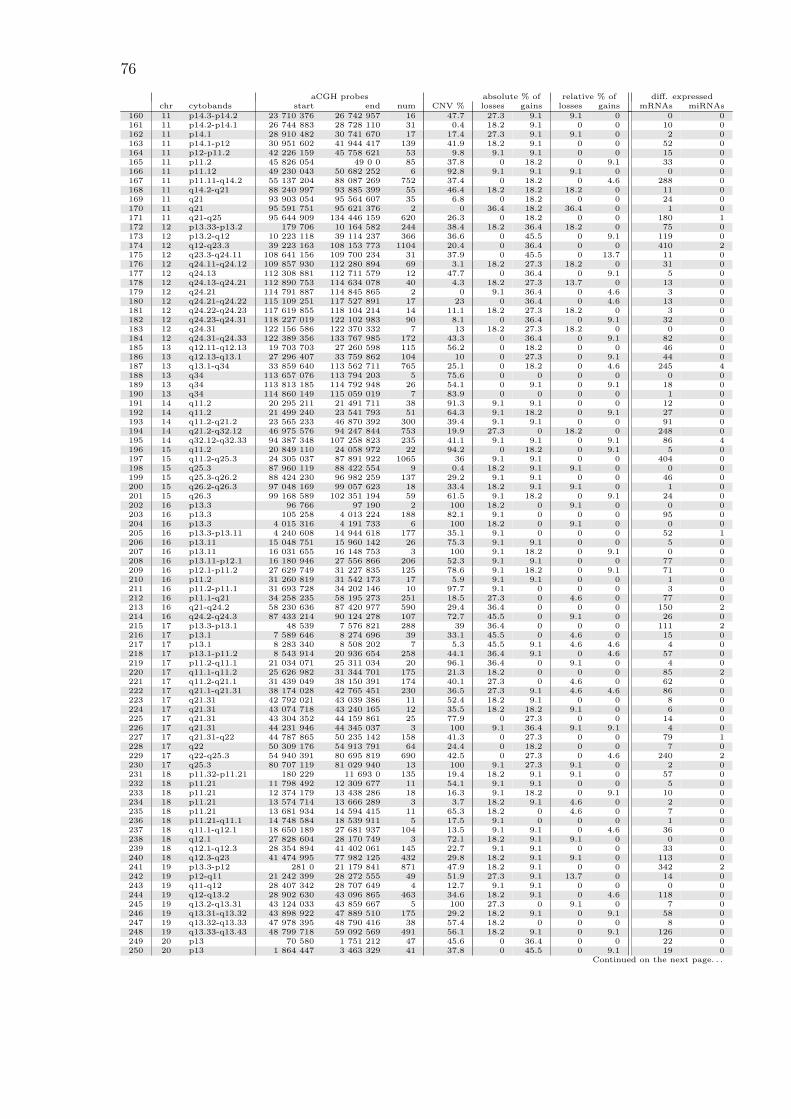
76
aCGH probes absolute % of relative % of diff. expressedchr cytobands start end num CNV % losses gains losses gains mRNAs miRNAs
160 11 p14.3-p14.2 23 710 376 26 742 957 16 47.7 27.3 9.1 9.1 0 0 0161 11 p14.2-p14.1 26 744 883 28 728 110 31 0.4 18.2 9.1 0 0 10 0162 11 p14.1 28 910 482 30 741 670 17 17.4 27.3 9.1 9.1 0 2 0163 11 p14.1-p12 30 951 602 41 944 417 139 41.9 18.2 9.1 0 0 52 0164 11 p12-p11.2 42 226 159 45 758 621 53 9.8 9.1 9.1 0 0 15 0165 11 p11.2 45 826 054 49 0 0 85 37.8 0 18.2 0 9.1 33 0166 11 p11.12 49 230 043 50 682 252 6 92.8 9.1 9.1 9.1 0 0 0167 11 p11.11-q14.2 55 137 204 88 087 269 752 37.4 0 18.2 0 4.6 288 0168 11 q14.2-q21 88 240 997 93 885 399 55 46.4 18.2 18.2 18.2 0 11 0169 11 q21 93 903 054 95 564 607 35 6.8 0 18.2 0 0 24 0170 11 q21 95 591 751 95 621 376 2 0 36.4 18.2 36.4 0 1 0171 11 q21-q25 95 644 909 134 446 159 620 26.3 0 18.2 0 0 180 1172 12 p13.33-p13.2 179 706 10 164 582 244 38.4 18.2 36.4 18.2 0 75 0173 12 p13.2-q12 10 223 118 39 114 237 366 36.6 0 45.5 0 9.1 119 0174 12 q12-q23.3 39 223 163 108 153 773 1104 20.4 0 36.4 0 0 410 2175 12 q23.3-q24.11 108 641 156 109 700 234 31 37.9 0 45.5 0 13.7 11 0176 12 q24.11-q24.12 109 857 930 112 280 894 69 3.1 18.2 27.3 18.2 0 31 0177 12 q24.13 112 308 881 112 711 579 12 47.7 0 36.4 0 9.1 5 0178 12 q24.13-q24.21 112 890 753 114 634 078 40 4.3 18.2 27.3 13.7 0 13 0179 12 q24.21 114 791 887 114 845 865 2 0 9.1 36.4 0 4.6 3 0180 12 q24.21-q24.22 115 109 251 117 527 891 17 23 0 36.4 0 4.6 13 0181 12 q24.22-q24.23 117 619 855 118 104 214 14 11.1 18.2 27.3 18.2 0 3 0182 12 q24.23-q24.31 118 227 019 122 102 983 90 8.1 0 36.4 0 9.1 32 0183 12 q24.31 122 156 586 122 370 332 7 13 18.2 27.3 18.2 0 0 0184 12 q24.31-q24.33 122 389 356 133 767 985 172 43.3 0 36.4 0 9.1 82 0185 13 q12.11-q12.13 19 703 703 27 260 598 115 56.2 0 18.2 0 0 46 0186 13 q12.13-q13.1 27 296 407 33 759 862 104 10 0 27.3 0 9.1 44 0187 13 q13.1-q34 33 859 640 113 562 711 765 25.1 0 18.2 0 4.6 245 4188 13 q34 113 657 076 113 794 203 5 75.6 0 0 0 0 0 0189 13 q34 113 813 185 114 792 948 26 54.1 0 9.1 0 9.1 18 0190 13 q34 114 860 149 115 059 019 7 83.9 0 0 0 0 1 0191 14 q11.2 20 295 211 21 491 711 38 91.3 9.1 9.1 0 0 12 0192 14 q11.2 21 499 240 23 541 793 51 64.3 9.1 18.2 0 9.1 27 0193 14 q11.2-q21.2 23 565 233 46 870 392 300 39.4 9.1 9.1 0 0 91 0194 14 q21.2-q32.12 46 975 576 94 247 844 753 19.9 27.3 0 18.2 0 248 0195 14 q32.12-q32.33 94 387 348 107 258 823 235 41.1 9.1 9.1 0 9.1 86 4196 15 q11.2 20 849 110 24 058 972 22 94.2 0 18.2 0 9.1 5 0197 15 q11.2-q25.3 24 305 037 87 891 922 1065 36 9.1 9.1 0 0 404 0198 15 q25.3 87 960 119 88 422 554 9 0.4 18.2 9.1 9.1 0 0 0199 15 q25.3-q26.2 88 424 230 96 982 259 137 29.2 9.1 9.1 0 0 46 0200 15 q26.2-q26.3 97 048 169 99 057 623 18 33.4 18.2 9.1 9.1 0 1 0201 15 q26.3 99 168 589 102 351 194 59 61.5 9.1 18.2 0 9.1 24 0202 16 p13.3 96 766 97 190 2 100 18.2 0 9.1 0 0 0203 16 p13.3 105 258 4 013 224 188 82.1 9.1 0 0 0 95 0204 16 p13.3 4 015 316 4 191 733 6 100 18.2 0 9.1 0 0 0205 16 p13.3-p13.11 4 240 608 14 944 618 177 35.1 9.1 0 0 0 52 1206 16 p13.11 15 048 751 15 960 142 26 75.3 9.1 9.1 0 0 5 0207 16 p13.11 16 031 655 16 148 753 3 100 9.1 18.2 0 9.1 0 0208 16 p13.11-p12.1 16 180 946 27 556 866 206 52.3 9.1 9.1 0 0 77 0209 16 p12.1-p11.2 27 629 749 31 227 835 125 78.6 9.1 18.2 0 9.1 71 0210 16 p11.2 31 260 819 31 542 173 17 5.9 9.1 9.1 0 0 1 0211 16 p11.2-p11.1 31 693 728 34 202 146 10 97.7 9.1 0 0 0 3 0212 16 p11.1-q21 34 258 235 58 195 273 251 18.5 27.3 0 4.6 0 77 0213 16 q21-q24.2 58 230 636 87 420 977 590 29.4 36.4 0 0 0 150 2214 16 q24.2-q24.3 87 433 214 90 124 278 107 72.7 45.5 0 9.1 0 26 0215 17 p13.3-p13.1 48 539 7 576 821 288 39 36.4 0 0 0 111 2216 17 p13.1 7 589 646 8 274 696 39 33.1 45.5 0 4.6 0 15 0217 17 p13.1 8 283 340 8 508 202 7 5.3 45.5 9.1 4.6 4.6 4 0218 17 p13.1-p11.2 8 543 914 20 936 654 258 44.1 36.4 9.1 0 4.6 57 0219 17 p11.2-q11.1 21 034 071 25 311 034 20 96.1 36.4 0 9.1 0 4 0220 17 q11.1-q11.2 25 626 982 31 344 701 175 21.3 18.2 0 0 0 85 2221 17 q11.2-q21.1 31 439 049 38 150 391 174 40.1 27.3 0 4.6 0 62 0222 17 q21.1-q21.31 38 174 028 42 765 451 230 36.5 27.3 9.1 4.6 4.6 86 0223 17 q21.31 42 792 021 43 039 386 11 52.4 18.2 9.1 0 0 8 0224 17 q21.31 43 074 718 43 240 165 12 35.5 18.2 18.2 9.1 0 6 0225 17 q21.31 43 304 352 44 159 861 25 77.9 0 27.3 0 0 14 0226 17 q21.31 44 231 946 44 345 037 3 100 9.1 36.4 9.1 9.1 4 0227 17 q21.31-q22 44 787 865 50 235 142 158 41.3 0 27.3 0 0 79 1228 17 q22 50 309 176 54 913 791 64 24.4 0 18.2 0 0 7 0229 17 q22-q25.3 54 940 391 80 695 819 690 42.5 0 27.3 0 4.6 240 2230 17 q25.3 80 707 119 81 029 940 13 100 9.1 27.3 9.1 0 2 0231 18 p11.32-p11.21 180 229 11 693 0 135 19.4 18.2 9.1 9.1 0 57 0232 18 p11.21 11 798 492 12 309 677 11 54.1 9.1 9.1 0 0 5 0233 18 p11.21 12 374 179 13 438 286 18 16.3 9.1 18.2 0 9.1 10 0234 18 p11.21 13 574 714 13 666 289 3 3.7 18.2 9.1 4.6 0 2 0235 18 p11.21 13 681 934 14 594 415 11 65.3 18.2 0 4.6 0 7 0236 18 p11.21-q11.1 14 748 584 18 539 911 5 17.5 9.1 0 0 0 1 0237 18 q11.1-q12.1 18 650 189 27 681 937 104 13.5 9.1 9.1 0 4.6 36 0238 18 q12.1 27 828 604 28 170 749 3 72.1 18.2 9.1 9.1 0 0 0239 18 q12.1-q12.3 28 354 894 41 402 061 145 22.7 9.1 9.1 0 0 33 0240 18 q12.3-q23 41 474 995 77 982 125 432 29.8 18.2 9.1 9.1 0 113 0241 19 p13.3-p12 281 0 21 179 841 871 47.9 18.2 9.1 0 0 342 2242 19 p12-q11 21 242 399 28 272 555 49 51.9 27.3 9.1 13.7 0 14 0243 19 q11-q12 28 407 342 28 707 649 4 12.7 9.1 9.1 0 0 0 0244 19 q12-q13.2 28 902 630 43 096 865 463 34.6 18.2 9.1 0 4.6 118 0245 19 q13.2-q13.31 43 124 033 43 859 667 5 100 27.3 0 9.1 0 7 0246 19 q13.31-q13.32 43 898 922 47 889 510 175 29.2 18.2 9.1 0 9.1 58 0247 19 q13.32-q13.33 47 978 395 48 790 416 38 57.4 18.2 0 0 0 8 0248 19 q13.33-q13.43 48 799 718 59 092 569 491 56.1 18.2 9.1 0 9.1 126 0249 20 p13 70 580 1 751 212 47 45.6 0 36.4 0 0 22 0250 20 p13 1 864 447 3 463 329 41 37.8 0 45.5 0 9.1 19 0
Continued on the next page. . .
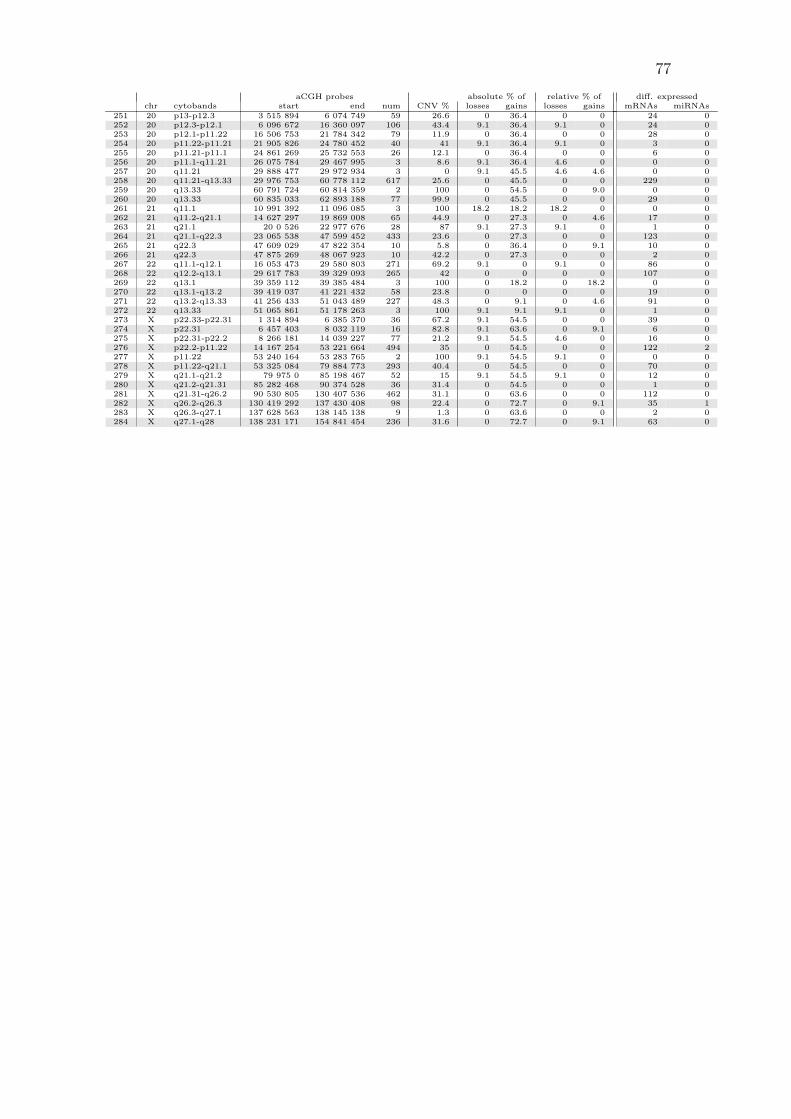
77
aCGH probes absolute % of relative % of diff. expressedchr cytobands start end num CNV % losses gains losses gains mRNAs miRNAs
251 20 p13-p12.3 3 515 894 6 074 749 59 26.6 0 36.4 0 0 24 0252 20 p12.3-p12.1 6 096 672 16 360 097 106 43.4 9.1 36.4 9.1 0 24 0253 20 p12.1-p11.22 16 506 753 21 784 342 79 11.9 0 36.4 0 0 28 0254 20 p11.22-p11.21 21 905 826 24 780 452 40 41 9.1 36.4 9.1 0 3 0255 20 p11.21-p11.1 24 861 269 25 732 553 26 12.1 0 36.4 0 0 6 0256 20 p11.1-q11.21 26 075 784 29 467 995 3 8.6 9.1 36.4 4.6 0 0 0257 20 q11.21 29 888 477 29 972 934 3 0 9.1 45.5 4.6 4.6 0 0258 20 q11.21-q13.33 29 976 753 60 778 112 617 25.6 0 45.5 0 0 229 0259 20 q13.33 60 791 724 60 814 359 2 100 0 54.5 0 9.0 0 0260 20 q13.33 60 835 033 62 893 188 77 99.9 0 45.5 0 0 29 0261 21 q11.1 10 991 392 11 096 085 3 100 18.2 18.2 18.2 0 0 0262 21 q11.2-q21.1 14 627 297 19 869 008 65 44.9 0 27.3 0 4.6 17 0263 21 q21.1 20 0 526 22 977 676 28 87 9.1 27.3 9.1 0 1 0264 21 q21.1-q22.3 23 065 538 47 599 452 433 23.6 0 27.3 0 0 123 0265 21 q22.3 47 609 029 47 822 354 10 5.8 0 36.4 0 9.1 10 0266 21 q22.3 47 875 269 48 067 923 10 42.2 0 27.3 0 0 2 0267 22 q11.1-q12.1 16 053 473 29 580 803 271 69.2 9.1 0 9.1 0 86 0268 22 q12.2-q13.1 29 617 783 39 329 093 265 42 0 0 0 0 107 0269 22 q13.1 39 359 112 39 385 484 3 100 0 18.2 0 18.2 0 0270 22 q13.1-q13.2 39 419 037 41 221 432 58 23.8 0 0 0 0 19 0271 22 q13.2-q13.33 41 256 433 51 043 489 227 48.3 0 9.1 0 4.6 91 0272 22 q13.33 51 065 861 51 178 263 3 100 9.1 9.1 9.1 0 1 0273 X p22.33-p22.31 1 314 894 6 385 370 36 67.2 9.1 54.5 0 0 39 0274 X p22.31 6 457 403 8 032 119 16 82.8 9.1 63.6 0 9.1 6 0275 X p22.31-p22.2 8 266 181 14 039 227 77 21.2 9.1 54.5 4.6 0 16 0276 X p22.2-p11.22 14 167 254 53 221 664 494 35 0 54.5 0 0 122 2277 X p11.22 53 240 164 53 283 765 2 100 9.1 54.5 9.1 0 0 0278 X p11.22-q21.1 53 325 084 79 884 773 293 40.4 0 54.5 0 0 70 0279 X q21.1-q21.2 79 975 0 85 198 467 52 15 9.1 54.5 9.1 0 12 0280 X q21.2-q21.31 85 282 468 90 374 528 36 31.4 0 54.5 0 0 1 0281 X q21.31-q26.2 90 530 805 130 407 536 462 31.1 0 63.6 0 0 112 0282 X q26.2-q26.3 130 419 292 137 430 408 98 22.4 0 72.7 0 9.1 35 1283 X q26.3-q27.1 137 628 563 138 145 138 9 1.3 0 63.6 0 0 2 0284 X q27.1-q28 138 231 171 154 841 454 236 31.6 0 72.7 0 9.1 63 0