Embed Size (px)
Citation preview

ISSN: 2278 - 8875
International Journal of Advanced Research in Electrical, Electronics and Instrumentation Engineering
Vol. 1, Issue 4, October 2012
Copyright to IJAREEIE www.ijareeie.com 291
Integration Challenges in Design and Development
of Pulse Detonation Test Rig
Subhash Chander1, Dr. TK Jindal
2
Scientist „E‟, DH(AND), TBRL, Chandigarh, INDIA
Assistant Professor, PEC University of Technology, Chandigarh, INDIA
Abstract:
The aim of the paper is bring out integration challenges faced during “The design of a Pulse Tube for detonation of gaseous fuel
using Acetylene and Oxygen. The detonation parameters are being analysed. The data generated will help in designing of pulse
detonation propulsion system”. Due to these challenges, the performance of the system was significantly degraded and remedies
became absolutely necessary. Paper also deals at length to deal the challenges faced including remedial actions in subsequent
paras. Subsequently, the system results brought out are significantly encouraging.
Keywords: Pulse detonation engine, Fire Control System, Data acquisition, Thrust / Pressure measurement & Instrumentation
I. INTRODUCTION
A pulse detonation engine, or "PDE", is a type of propulsion system that uses detonation waves to combust the fuel and oxidizer
mixture. The engine is pulsed because the mixture must be renewed in the combustion chamber between each detonation wave
initiated by an ignition source. Theoretically, a PDE can operate from subsonic up to a hypersonic flight speed of roughly Mach
5. An ideal PDE design can have a thermodynamic efficiency higher than other designs like turbojets and turbofans because a
detonation wave rapidly compresses the mixture and adds heat at constant volume. Consequently, moving parts like compressor
spools are not necessarily required in the engine, which could significantly reduce overall weight and cost. PDEs have been
considered for propulsion for over 70 years. Key issues for further development include fast and efficient mixing of the fuel and
oxidizer, the prevention of auto-ignition, and integration with an inlet and nozzle.
The Paper is organized in following Paras:
Concept of PDE, Detonation Initiation, Design of Pulse detonation for PEC Experimental Setup, Pulse Detonation Engine
Details, Fuel Injection/Air Delivery, Channel Calibration/ Voltage-to-Thrust Conversion, Test Cell / PDE Control,
Data Acquisition, Challenges faced including their remedial Management, Results, Data Extraction, Data Accuracy,
Achievements from the project and future course of work is covered. It is followed by acknowledgements and references too.
II. CONCEPT OF PDE
All regular jet engines and most rocket engines operate on the deflagration of fuel, that is, the rapid
but subsonic combustion of fuel. The pulse detonation engine is a concept currently in active development to create a jet engine
that operates on the supersonic detonation of fuel. The basic operation of the PDE is similar to that of the pulse jet engine; air is
mixed with fuel to create a flammable mixture that is then ignited. The resulting combustion greatly increases the pressure of the
mixture to approximately 100 atmospheres (10 MPa), which then expands through a nozzle for thrust. To ensure that the mixture
exits to the rear, thereby pushing the aircraft forward, a series of shutters are used to close off the front of the engine. Careful
tuning of the inlet ensures the shutters close at the right time to force the air to travel in one direction only through the engine.
The main difference between a PDE and a traditional pulse jet engine is that the mixture does not undergo subsonic combustion
but instead, supersonic detonation. In the PDE, the oxygen and fuel combination process is supersonic, effectively an explosion
instead of burning. The other difference is that the shutters are replaced by more sophisticated valves. In some PDE designs
from General Electric, the shutters are eliminated through careful timing, using the pressure differences between the different
areas of the engine to ensure the "shot" is ejected rearward. The main side effect of the change in cycle is that the PDE is
considerably more efficient. In the pulse jet engine the combustion pushes a considerable amount of the fuel/air mix (the charge)
out the rear of the engine before it has had a chance to burn (thus the trail of flame seen on the V-1 flying bomb). Even while
inside the engine the mixture's volume is continually changing, which is an inefficient way to burn fuel. In contrast, the PDE
deliberately uses a high-speed combustion process that burns all of the charge while it is still inside the engine at a constant
volume. This is said to increase the amount of heat produced per unit of fuel above any other engines, although conversion of
ISSN: 2278 - 8875
International Journal of Advanced Research in Electrical, Electronics and Instrumentation Engineering
Vol. 1, Issue 4, October 2012
Copyright to IJAREEIE www.ijareeie.com 292
that energy into thrust would remain inefficient. A combustion process able to produce more heat per unit of fuel would, of
course, be incredibly valuable in countless applications. Another side effect, not yet demonstrated in practical use, is the cycle
time. A traditional pulsejet tops out at about 250 pulses per second due to the cycle time of the mechanical shutters, but the aim
of the PDE is thousands of pulses per second, so fast that it is basically continuous from an engineering perspective. This should
help smooth out the otherwise highly vibrational pulsejet engine — many small pulses will create less volume than a smaller
number of larger pulses for the same net thrust. Unfortunately, detonations are many times louder than deflagrations. The major
difficulty with a pulse-detonation engine is starting the detonation. While it is possible to start a detonation directly with a large
spark, the amount of energy input is very large and is not practical for an engine. The typical solution is to use a deflagration-to-
detonation transition (DDT)—that is, start a high-energy deflagration, and have it accelerate down a tube to the point where it
becomes fast enough to become a detonation. Alternatively the detonation can be sent around a circle and valves ensure that only
the highest peak power can leak into exhaust. This process is far more complicated than it sounds, due to the resistance the
advancing wave front encounters (similar to wave drag). DDTs occur far more readily if there are obstacles in the tube. The most
widely used is the "Shchelkin spiral", which is designed to create the most useful eddies with the least resistance to the moving
fuel/air/exhaust mixture. The eddies lead to the flame separating into multiple fronts, some of which go backwards and collide
with other fronts, and then accelerate into fronts ahead of them. The behaviour is difficult to model and to predict, and research
is on-going. As with conventional pulsejets, there are two main types of designs: valved and valveless. Designs with valves
encounter the same difficult-to-resolve wear issues encountered with their pulsejet equivalents. Valveless designs typically rely
on abnormalities in the air flow to ensure a one-way flow, and are very hard to achieve in regular DDT. NASA maintains a
research program on the PDE, which is aimed at high-speed, about Mach 5, civilian transport systems. However most PDE
research is military in nature, as the engine could be used to develop a new generation of high-speed, long-range reconnaissance
aircraft that would fly high enough to be out of range of any current anti-aircraft defences, while offering range considerably
greater than the SR-71, which required a massive tanker support fleet to use in operation. While most research is on the high
speed regime, newer designs with much higher pulse rates in the hundreds of thousands appear to work well even at subsonic
speeds. Whereas traditional engine designs always include trade-offs that limit them to a "best speed" range, the PDE appears to
outperform them at all speeds. Both Pratt & Whitney and General Electric now have active PDE research programs in an attempt
to commercialize the designs. Key difficulties in pulse detonation engines are achieving DDT without requiring a tube long
enough to make it impractical and drag-imposing on the aircraft (adding a U-bend into the tube extinguishes the detonation
wave); reducing the noise (often described as sounding like a jackhammer); and damping the severe vibration caused by the
operation of the engine.
III. DETONATION INITIATION
Of critical importance in continued PDE research is the development of an efficient process with which to produce reliable,
repeatable detonation waves. The minimum diameter and distance within a combustor required for detonation initiation are
fundamentally limiting factors which influence both size of the engine and operating frequency range. Additionally, the carriage
of onboard oxidizer will effectively negate performance gains offered by the use of PDE technology. Research continues into
techniques which reduce initiation time and initiation distance. The most common techniques in the research community are
direct initiation, shock focusing, and Deflagration-to-Detonation Transition (DDT).
A. Direct Initiation:
Direct initiation is defined by Frolov as a near-instantaneous application of energy into a fuel mixture which generates a blast
wave of sufficient strength and intensity to decay into a self-sustained detonation [11]. Application of this technique would
require the use of high explosives (not practical for PDE) or electrical initiation sources such as lasers or sparks. Energy levels
on the order of 100-1000 kJ applied on a cyclic basis would be necessary and at this time are not feasible. This technique has the
potential to offer the shortest detonation time and lengths, and remains and area of active research; however, limitations listed
above require current PDE research to incorporate self-initiation techniques or those with low net power requirements.
B. Shock Focusing:
Shock focusing techniques use geometric designs to focus a shock wave or multiple shock waves to create regions of high
temperatures and pressures which results in the local ignition of a reactive mixture. Research conducted by Channel found that
multiple methods can be used to achieve focusing of these waves such as combustor geometry, turbulence devices or injection

ISSN: 2278 - 8875
International Journal of Advanced Research in Electrical, Electronics and Instrumentation Engineering
Vol. 1, Issue 4, October 2012
Copyright to IJAREEIE www.ijareeie.com 293
jets [10]. In a reactive mixture, these regions of high temperature can produce violent explosions, and eventually detonations.
This technique is strongly dependent on both engine geometry and the initial creation of moderate shock waves, and has proven
to be of limited value within the dynamic constraints of PDE research.
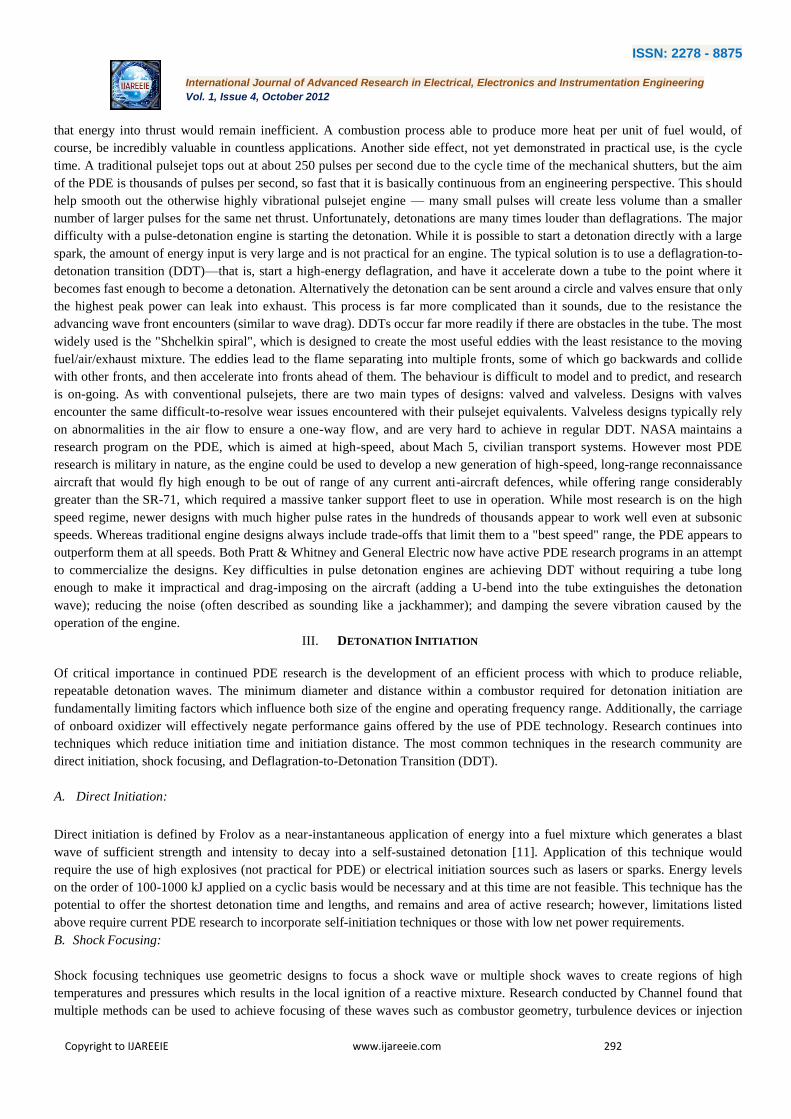
IV. DESIGN OF PULSE DETONATION FOR PEC EXPERIMENTAL SETUP
This section provides information specific to the equipment and techniques used to complete the experimentation performed in
support of this work (figure All testing associated with this project occurred in the Aerospace Engineering Department of PEC
University of Technology Chandigarh campus site [1]. An engine capable of burning both Acetylene/oxygen and Acetylene/air
mixture was required to complete the desired research. A PDE designed and used for previous experimentation was used as the
baseline engine for this project [10]. Prior to initial experimentation, numerous modifications were made to the engine and test cell
to improve on the previous design and enable switching between fuel types with minimum impact. New fuel supply systems were
constructed, a thrust stand was incorporated to measure axial thrust data, and new data acquisition software created for high-speed
data capture.
Fig.1: Simplified schematic layout of system
Fig.2: Pulse Detonation Engine PEC Setup V. PULSE DETONATION ENGINE DETAILS
A single tube, “valveless” PDE was constructed by the investigating team conducting thesis research. The engine consisted of a
combustion tube, fuel injector system, and ignition system. Since the initial design, modifications made by current research team
to fuel injector scheme, flow choke sizing, fuel/air inlet geometry, spiral dimensions and mounting technique, tube diameter, and
combustion chamber volume have been implemented to facilitate performance improvements throughout continuous design
process. Specific engine parameters and systems used during experimentation in support of this research are discussed below and
photograph of the test rig is included in Fig. 2.
Pr. Gauge Air hose Shchelkin spiral Pulse tube
Pr. Sensor
Gate Value
Voltmeter
Magneto
NRV
Acetylene hose Thermocouple FCS Thrust Stand
SCXI/PXI
Chassis
DAQ
Computer

ISSN: 2278 - 8875
International Journal of Advanced Research in Electrical, Electronics and Instrumentation Engineering
Vol. 1, Issue 4, October 2012
Copyright to IJAREEIE www.ijareeie.com 294
VI. FUEL INJECTION/AIR DELIVERY
The fuel injection/air delivery system was designed to provide control of the stoichiometry of the fuel/air mixture supplied to the
combustor. Supply air delivery incorporated a valveless design in that a constant flow of supply air was provided to the engine.
Control of the fuel mixture was achieved by varying the pressure of injected fuel. Fuel pressure changes altered the mass flow
rate ratio of fuel to supply air, which is defined as the equivalency ratio (φ). The mathematical expression for equivalence ratio is
given by
φ = [(F/A)/(F/A)ST] …………. VI.I
Where (F/A) is the mass ratio of fuel to air for the experimental mixture and (F/A)ST is the mass ratio of fuel to air for the
stoichiometric mixture. Performance varied with changing equivalency (φ) ratio
A. Oxygen/Air Delivery:
Supply air was delivered from O2 cylinder at varying mass flow rates w.r.t. the pressure in the pipe line controlled by the valves
in line. The supply was controlled by solenoid valve operated through Lab view software.
B. Acetylene Injection:
An independent injector system was constructed to supply Acetylene from cylinder into the combustion chamber. Electrically-
controlled high frequency Techno make solenoid valve injector was joined by a common feed manifold and mounted to the fuel
arm downstream of the flow chokes. The gaseous fuel mixed with supply air prior to entry into the combustion chamber.
C. Ignition System:
The ignition system consists of a 24 V DC Condenser and spark plug arrangement. The control for the spark plug ignition is with
the control circuit only. The VI control gives an option to ignite the spark plug after the gas has been released into the system for
the required amount of time.
The oxygen inlet and the acetylene inlet are near the spark plug itself, which enables us to start the combustion, by imparting a
high voltage spark to the gases.
D. Combustion Tube:
The combustion tube is a hollow steel pipe (Grade 304) with an internal diameter of 48 mm and external diameter of 60 mm,
providing us a thickness of 6 mm which is strong enough to withstand the detonation pressures generated inside the tube. The
combustion tubes are of various sizes, 20 cm, 40 cm, 80 cm and 100 cm. These various sizes enable us to get any size tube for
our experiment in the steps of 20 cm with a minimum length of 70 cm.
E. Primary Structure:
The primary structure comprises of the combustion tubes lying on the middle support bar. The combustion tubes are
encapsulated in a curved wedge fitted on a slider, to reduce friction to the least amount possible. The fully loaded system with
3.5 m tube length has a friction of 17 N.
F. Load Cell:
The load cells (Max Load Make) fitted in the structure are high capacity load cells with a maximum value of 500 kgf. The loads
cells are fitted on the one extreme point of the structure on the axis of the tube, which allows us to measure the thrust produced
on the system.
G. Data Collection Hardware:
The data collection hardware comprises of 2 25 port boards, a low resistance cable of 16 metres length, a NI DAQ system, a
USB carrier, 4 pressure sensors (MEAS make), 3 thermocouples, 3 load cells (Maxload Make).
H. Engine/Thrust Stand Interface:
ISSN: 2278 - 8875
International Journal of Advanced Research in Electrical, Electronics and Instrumentation Engineering
Vol. 1, Issue 4, October 2012
Copyright to IJAREEIE www.ijareeie.com 295
Thrust stand means the test rig fabricated that will support the entire engine on it. The thrust stand is 12 feet long, 3 feet wide, 4
feet high in dimensions, with another 1.5 feet curved cowl covering over it, to prevent any mishaps to the people working nearby
the structure.
I. Thrust Stand:
As in all systems including thrust stand, which contain mass and elasticity, the thrust stand was assumed to be capable of free
vibration, as well as forced vibration at the excitation frequency which PDE testing would occur. Vibration analysis identifies
the primary physical characteristics which govern system response as mass, damping and stiffness. In the presence of light
(assumed here) or no damping, the system will vibrate very near the natural frequency defined by
ωn = (k/m)1/2 ……………..VI.II
Where k is system stiffness and m represents system mass [17].
VII. CHANNEL CALIBRATION/ VOLTAGE-TO-THRUST CONVERSION
The first phase of the process consisted of calibration of the individual channels which transfer load cell data to the data
collection system and convert voltage data to force units. Small imperfections in cable manufacturing, varying length of supply
cable per channel, and other factors lead to small variances during the data transmission process which must be normalized to
eliminate constant sources of bias error. This process was completed in conjunction with manufacturer representatives, with no
load on the thrust stand and support pins installed. The first step was to install a load cell simulator in place of actual load cells,
and apply excitation voltages at known excitation ranges.
VIII. TEST CELL/ PDE CONTROL
The engine and support equipment in test cell #2 was controlled by a National Instruments (NI) Real-Time VI software program
installed on a personal computer (PC) in the control room with terminations. The PC was linked to a NI PXI-1000B controller in
the test cell through an internet connection to the PXI IP address. The program controlled engine operation by managing engine
supply gas operation via ball valves located in the test cell. A BNC pulse generator also located in the control room controlled
timing of trigger signals sent to both the fuel injectors and TPI via electrical relays located within the test cell. Also located
within the control room were 24 VDC and 220 VAC master power switches, and an emergency shutoff button. The electrical
switches controlled electrical power within the cell for engine control and instrumentation equipment, such as temperature and
pressure transducers connected through termination boxes. The emergency shutoff button was provided as a safety feature and
would disable test cell #2 by closing all supply gas ball valves and interrupt fuel injection and ignition trigger signals.
IX. DATA ACQUISITION
Data acquisition was controlled via the PC in the control room. The PC was linked to the SCXI-1000B controller mounted on the
wall in the test cell, which in turn was linked to three NI data acquisition devices (DAQ) located on the engine stand. The PXI-
6031E was 8 channel, 16 bit card which collected operational parameters such as various engine temperatures and pressures, and
supply gas pressures, at a rate of 10 kHz. A data file path designated on the control program directed data in the form of an excel
spreadsheet to a selected location. These data streams were used to calibrate the stand prior to the commencement of testing, and
record thrust data during engine operation. A second file path designated on the control panel directed thrust data in the form of
an excel spreadsheet to a selected location. Additionally, thrust data was streamed to the control program GUI for real-time
monitoring.
X. THE CHALLENGES FACED AND THEIR REMEDIAL MANAGEMENT
During the design of test rig and firing of system, a large no. of problems have cropped. All these issues were addressed as
follows:
A. Noise in all channels:
There was a huge noise in output of DAQ resulting in signal getting attenuated (refer fig. 3). So, proper grounding, shielding and
crimping was initiated to resolve the issue.

ISSN: 2278 - 8875
International Journal of Advanced Research in Electrical, Electronics and Instrumentation Engineering
Vol. 1, Issue 4, October 2012
Copyright to IJAREEIE www.ijareeie.com 296
Fig.3a: Initial output
Fig.3b: Initial output (red) & after shielding (blue)
B. Data loss:
There was a data loss observed during testing due long cables. It was in tune of mV while travelling a distance of 35 m. This
defect was confirmed through Digital multimeter readings at sensor and DAQ end. This was more than 10%, when signals
were small, making it further worse. Since distance was required for safety clearances, so it can‟t be addressed through that
route. So, problem was redressed by changing the data cable to low loss cables of resistance 0.01Ω/m with MIL connectors
(refer fig. 4).
C. Sampling Frequency Problem:
During the PDE firing, many occasions, large portion of data was clipped due faulty double buffering schemes used for data
acquiring. So, the DAQ sampling frequency was increased to > 1MS/s and problem got resolved (refer fig. 5).
Fig.4a: Normal cable Fig.4b: Low loss cable
6 6.5 7 7.5 8 8.5 9 9.5 10
0
5
10
bar
P1
6 6.5 7 7.5 8 8.5 9 9.5 10
0
5
10
bar
P2
6.5 7 7.5 8 8.5 9 9.5 100
5
10
bar
P3
6 6.5 7 7.5 8 8.5 9 9.5 10
2
4
6
Kgf
PDE Simulation (Pr.)
time in sec.
Bar - raw
TEST 16
0 2 4 6 8 10 12 140
1
2
3
4
5
6
7PDE Simulation (Thrust) with 50 Hz filter
time in sec.
Kgf
Loadcell Kgf - raw
Loadcell Kgf - filtered
Test 16

ISSN: 2278 - 8875
International Journal of Advanced Research in Electrical, Electronics and Instrumentation Engineering
Vol. 1, Issue 4, October 2012
Copyright to IJAREEIE www.ijareeie.com 297
D. Accidental Firing Handling:
Multiple trigger inter locks are designed to place the system to prevent accidental firing. These interlocks are O2 & C2H2
mechanical gate valves on cylinders, Power supply connections to igniters, 2 stage Fire control systems and multi-level strong
password control on FCS make it difficult to fire accidentally.
Fig.5a: Normal clipped DAQ data
E. Flow Pressures:
Analog gauges were introduced at cylinders for better safeties and enhanced ease for regulation of flow to pulse tube. (refer fig.
6).
Fig.5b: DAQ data after sampling frequency increase
Fig.6: Analog Gauges
6 6.1 6.2 6.3 6.4 6.5 6.6
0
5
10
15
20
25
PDE Simulation (Pr.)
time in sec.
bar
p1 Bar
p2 Bar
p3 Bar
p4 Bar
24 24.02 24.04 24.06 24.08 24.1 24.12 24.14 24.16 24.18
0
5
10
15
20
PDE Simulation (Pr.) with 50 Hz filter
time in sec.
bar
p1 Bar
p2 Bar
p3 Bar
p4 Bar
PDE Simulation (Pr.)
time in sec. PDE Simulation (Pr.) with 60 Hz filter
time in sec.

ISSN: 2278 - 8875
International Journal of Advanced Research in Electrical, Electronics and Instrumentation Engineering
Vol. 1, Issue 4, October 2012
Copyright to IJAREEIE www.ijareeie.com 298
F. Back flow of gas:
The back flow of gasses back to cylinders was poising grave problems of safety in the propulsion/structural lab. At higher
pressures it was further worse to make it hazardous configuration. The problem redressal was carried out by fitting the Solenoid
valves with Non-Return Valves (NRV) in upline near the test rig in O2 and C2H2 lines. (refer fig. 7).
G. Firing Hazards:
The firing of PDE in PEC campus was a serious safety hazards in vicinity of students. Proper cordoning with danger flags and
following an approved finalised firing sequence was put to use. The sequence is as follow:
The Firing Checklist:
i. Clear the trial area by following all necessary safety drills. Cordon off the test bed with red ribbons, flags and Safety
Officers placements.
ii. Connect all the pneumatic and electrical lines
Fig.7: NRV
iii. Make the DAQ, PS and instrumentation computer ready
iv. Check O2 & C2H2 cylinders& open mechanical valves & pressurise lines accordingly
v. Make the count down after re-verify hardware and alert siren.
i. Fire solenoid valves to release O2& C2H2into the pulse tube through computer based software
ii. Fire the igniter through FCS through computer based especially designed software
iii. Record the DAQ results in CSV format in computer using data loggers
iv. Clear siren and release the emergency
v. Import the Recorded data to Matlab
vi. Plot the Graphs
vii. Analyse the data obtained
H. General Safety issues:
Handling high energy gases is always dangerous. So proper safety check list created to suggest Safety stand-off distance and
other vital safeties, which is as under:
The cautions and Safeties:
i. The stand should be properly anchored
ii. NRV should be fitted in solenoid valve area to prevent back flow
iii. Fire extinguishers should be placed at accessible areas
iv. Areas should be cordoned off well before
v. Block house should be created for launch teams
vi. In case of any miss-fire / auto fire, a proper drill should be worked out.
vii. All power supplies should be disconnected, when not in use.
viii. All pneumatic supplies should be disconnected, when not in use.

ISSN: 2278 - 8875
International Journal of Advanced Research in Electrical, Electronics and Instrumentation Engineering
Vol. 1, Issue 4, October 2012
Copyright to IJAREEIE www.ijareeie.com 299
I. Rain problem:
The test rig is kept outside in the lawns of Aerospace Engg. Department. Hot sun, rain and other environmental hazards affect
the life of the system. So redressal plan was created to make all weather cover to protect the system. (refer fig. 8).
Fig. 8a. Pulse Detonation Engine Setup
Fig. 8b Pulse Detonation Engine Setup with rain cover
J. Stand-off :
As the thrust increased, so stand-off again became an issue. To make safety stand-off O2 and acetylene cylinders were kept at
distance of 30 m from pulse tube. Further, Technology was used to address the problem. The desktop of FCS was taken over
internet using team viewer. Firing was carried out from a remote block house.
K. Disturbed flow:
There was a lot of disturbance resulting in improper mixing of gases in the tube. So settling chambers (refer fig. 9). were
designed and implemented to make the flow smooth resulting in better mixing and detonation successes.
Fig. 9: Settling Chambers

ISSN: 2278 - 8875
International Journal of Advanced Research in Electrical, Electronics and Instrumentation Engineering
Vol. 1, Issue 4, October 2012
Copyright to IJAREEIE www.ijareeie.com 300
L. Gas Leaks:
There is a chance of accidental gas leakage from hose/port connections. So to ensure safety, all the hose connections were
reinforced using metal clips (refer fig. 10). with nut tights to ensure no leak at joints.
Fig: 10 Metal circlip
M. Hazardous gas handling:
As the pressures of C2H2 and O2 were increased to get more thrust, chances of rubberised metal braded hoses to give away has
increased. To come out of that problem, GI piping (refer fig. 11). from Cylinder till Pulse Detonation tube was carried out. This
ensured longer life alongwith rigid clean design.
Fig.11: GI Piping
N. Flame control:
Proposed to put a flame containment system for flame checks downstream the flow across Pulse tube.
O. Heat handling:
Due high temperature in tube, planned to gap of time for cooling of tube along with forced cooling at key areas with introduction
of vents at high concentration zones.
P. Cooled sensors:
Present pressure and temperature sensors are working satisfactory under current conditions, future requirements of firing PDE in
10 Hz‟s or above for continuous firing, cooled sensors are required to be incorporated.
After incorporating vital changes, firings were carried out.
XI. RESULTS

ISSN: 2278 - 8875
International Journal of Advanced Research in Electrical, Electronics and Instrumentation Engineering
Vol. 1, Issue 4, October 2012
Copyright to IJAREEIE www.ijareeie.com 301
The initial objectives of research conducted in support of this work were to experimentally measure the thrust profile of a PDE
combusting both Acetylene and oxygen to incorporate an experimentally verified fuel mass flow rate to compute specific
impulse values for both fuels at various firing rates. A significant effort was made to understand how to operate the engine and
understand fuelling, timing and ignition effects on engine operation. Several months were spent conducting familiarization runs
in preparation for data collection events, during which time suitable fuel/timing event profiles were established. As test firings
began, it became immediately obvious that harmonics of the thrust stand were excited by combustion events and masked the true
thrust profile. At this point, the objectives of this thesis evolved into designing an analysis system capable of filtering undesired
thrust stand responses and returning accurate detonation thrust information. Additionally, system response varied with engine
mounting techniques, which lead to an investigation into determining the optimal engine mounting design. A final objective of
this research was to understand this phenomenon and assess its impact on the stand‟s capability to accurately measure PDE
thrust data. Raw data from the experimental runs listed above displayed a largely sinusoidal output. Actual thrust profiles from a
nominal PDE should display a series of impulse thrust spikes of positive forces at the operational frequency of the engine. An
average thrust profile would then be obtained by integrating the area under the thrust curve.
Fig.12: Depicting P1, P2, P3 & P4 cross plot of one typical run
As this was the first such engine the Aerospace Engineering Department of PEC University of Technology, Chandigarh
independently designed filtering techniques to extract average thrust values from the raw data.
Figure no. 12 & 13 depicts typical firing results in form of Pressures & thrusts plot. The results obtained from various test runs
are analysed to draw the inferences. Comparative analysis is plotted below as desired.
The Consolidated results are shown below:
Fig.13: Depicting thrusts‟ T1 (Red) Raw & T2 (blue filtered) - cross plot of one typical run
13.195 13.2 13.205 13.21 13.215 13.22 13.225 13.23 13.235 13.24
0
5
10
15
20
25
30
PDE Simulation (Pr.) with 50 Hz filter
time in sec.
bar
p1 Bar
p2 Bar
p3 Bar
15.5 16 16.5 17 17.5 18 18.5 19 19.5 20
-50
0
50
100
150
200
250
PDE Simulation (Thrust) with 50 Hz filter
time in sec.
Kgf
Loadcell Kgf - raw
Loadcell Kgf - filtered
PDE Simulation (Pr.) with 60 Hz filter
PDE Simulation (Pr.) with 60 Hz filter
time in sec.
time in sec.

ISSN: 2278 - 8875
International Journal of Advanced Research in Electrical, Electronics and Instrumentation Engineering
Vol. 1, Issue 4, October 2012
Copyright to IJAREEIE www.ijareeie.com 302
Firing P1 P2 P3 T1
Bar Kgf
PEC_Aero1 40 32 9
PEC_Aero2 27 31 14 35
PEC_Aero3 26 17 6 280
PEC_Aero6 29 32 16 105
PEC_Aero7 28 31 7 37
PEC_Aero8 27 29 9.5 140
Fig.14: Test results
The pressures obtained are cross plotterd for comparasion purposes:
Fig.15: Comparative study of Pressures
The thrusts obtained are cross plotterd for comparasion purposes:
Fig.16: Comparative study of Pressures
05
1015202530354045
PEC
_Aero
1
PEC
_Aero
2
PEC
_Aero
3
PEC
_Aero
6
PEC
_Aero
7
PEC
_Aero
8
P1
P2
P3
0
50
100
150
200
250
300
PEC
_Aero
1
PEC
_Aero
2
PEC
_Aero
3
PEC
_Aero
6
PEC
_Aero
7
PEC
_Aero
8
Thrust
T1
Полиномиальная (T1 )

ISSN: 2278 - 8875
International Journal of Advanced Research in Electrical, Electronics and Instrumentation Engineering
Vol. 1, Issue 4, October 2012
Copyright to IJAREEIE www.ijareeie.com 303
XII. DATA EXTRACTION
The above is the setup for data extraction. The extracted data is displayed online & saved in excel file for more detailed analysis.
XIII. DATA ACCURACY
Data accuracy for the TMS/low pass filter system described above was computed using the root mean square function. The two
major sources of error were introduced by the data acquisition hardware (NI DAQ) and calibration/strain gauge fidelity of the
TMS. National Instruments lists on their website detailed accuracy analysis of all supported DAQ equipment. For the hardware
installed on this rig, the company cites offset, system noise and temperature drift as the predominant error sources, and reports a
system absolute accuracy of +/- 0.377%.
Fig.17: The firing frames as grabbed using High speed camera
XIV. ACHIEVEMENTS FROM THE PROJECT
After analysing the data, the process of experimental analysis is perfectly established. All the range of sensors was also
established. The specifications of DAQ and response times for sensors are now changed. Technology of design of test rig, launch
tube, helical, cabling, igniters, cylinders, piping, and wiring are established to very high level of confidence. So the project has
achieved all its objectives and created an infrastructure for future research work too.
XV. FUTURE COURSE OF WORK
Having created the data and test rig, now stage is set to analyse and supplement experimentally the PDE technology. It can help
in depth analysis of PDE characteristics of C2H2& O2. Other types of fuels including gaseous fuels can also be tried for
comparison purposes. Fuel jets, input pressures manipulations, tube length / diameter optimisation, Shchelkin (helical) length,
position change of igniters are the future key areas. Storage Oscilloscope usage, velocity & torque measurements can also be
captured in due course.
ACKNOWLEDGEMENTS
The team is thankful to Director, TBRL for his kind endeavour. The team also is obliged to Prof. Manoj Datta, Director of PEC
University and Prof. PS Satsangi, Head, AED and AED team for their support and co-operation to the work.
REFERENCES
[1] TK Jindal, YS Chauhan, “Development of Pulse Detonation Rig”, A Report on sponsored research by TBRL, June, 2012
[2] H. Hoffmann, “Reaction-Propulsion Produced by Intermittent Detonative Combustion,” German Research Institute for Gliding, Report ATI-52365,
August 1940.
[3] P.D. Hutcheson, “Design, Modelling and Performance of a Split Path Jp-10/ Air Pulse Detonation Engine”, Master‟s Thesis, Naval Postgraduate School,
Monterey, California, December 2006.
[4] P.G. Harris, S.M. Guzik, and R.A. Stowe, “Design Methodology for a Pulse Detonation Engine as a Ramjet Replacement,” AIAA Paper 2004-3400, Joint
Propulsion Conference and Exhibit, Ft. Lauderdale, Florida, 11-14 July 2004.
1
2
3
4
5
6

ISSN: 2278 - 8875
International Journal of Advanced Research in Electrical, Electronics and Instrumentation Engineering
Vol. 1, Issue 4, October 2012
Copyright to IJAREEIE www.ijareeie.com 304
[5] K.K. Kuo, Principles of Combustion, Second Edition, John Wiley and Sons, 2005.
[6] W.H. Heiser, D.T. Pratt, “Thermodynamic Cycle Analysis of Pulse Detonation Engines,” Journal of Propulsion and Power, Vol. 18, No. 5, 2002.
[7] C.M Brophy, R. K. Hanson, “Fuel Distribution Effects on Pulse Detonation Engine Operation and Performance,” Journal of Propulsion and Power, Vol.
22, No. 6, 2006.
[8] Cesium-based Velocimeter for Model Validation, Retrieved October 10, 2007, from http://hanson.stanford.edu/ research/propulsion/cesiumV.html.
[9] Glassman, I., Combustion, Second Edition, Academic Press, Inc., 1987.
[10] B.T. Channell, “Evaluation and Selection of an Efficient Fuel/Air Initiation Strategy for Pulse Detonation Engines”, Master‟s Thesis, Naval Postgraduate
School, Monterey, California, September 2005.
[11] G. Roy, S. Frolov, D. Netzer, A. Borisov, High-Speed Deflagration and Detonation, ELEX-KM Publishing, 2001.
[12] J.B. Liu, P. Ronney, and M. Gundersen, “Corona Discharge Ignition of Premixed Flames”, http://carambola.usc.edu/ research/coronaignition/
coronaignition.html, September 2005.
[13] E. J. Touse, “Transmission of a Detonation Wave Across a Sudden Expansion with varying Mixture Composition,” Master‟s Thesis, Naval Postgraduate
School, Monterey, California, December 2003. 95
[14] E. Schultz, “Detonation Diffraction Through an Abrupt Area Expansion,” Doctoral Thesis, California Institute of Technology, Pasadena, California, April
2000.
[15] C.N. Hackard, “Ignition Delay Characteristics for Transient Plasma Ignition of Acetylene/Air and JP-10/Air Mixtures in a Pulse Detonation Engine,”
Master‟s Thesis, Naval Postgraduate School, Monterey, California, December 2007.
[16] Operations and Maintenance Manual, Six Component, 500 Pound Pulse Detonation Measurement System, Pacific Press Co., N00244-02-C-0060, Manual
No. 110028, September, 2002.
[17] W.T. Thomson, M.D. Dahleh, Theory of Vibration with Applications, Fifth Edition, Prentice Hall, Inc., 1998. 96
[18] www.wikipedia.com
[19] Pulse Detonation Engine Technology: An Overview by Matthew Lam, Daniel Tillie, Timothy Leaver, Brian McFadden
[20] www.google.com
[21] www.nasa.com
[22] www.meas.com
[23] www.ni.com
BIOGRAPHY
Subhash Chander is currently Scientist „E‟ in TBRL, Chandigarh, INDIA. He has 22 years of research
experience in Missile System Engg., Modelling & Simulation including Aerospace interests from 1990. He
has guided 6 M.E students and 4 MCA Students. He has published 20+ papers in related area and has
authored 100 + reports in relevant areas. He is the Life member of Institution of Engineers (India), Systems
Society of India, The Aeronautical Society of India and High Energy Materials Society of India. He has
also participated in many national and International conferences and seminars by presenting research work.
He is currently perusing Ph. D. from PEC University of Technology, Chandigarh also.
Dr. Tejinder Kumar Jindal is a Assistant Professor in Aerospace Engineering Department, PEC
University of Technology, Chandigarh is having 23 year experience in Aerospace and allied teaching &
Research. He has guided 11 M.E students and 5 PhD Students. His research areas include Wind energy,
Solar Energy, Cryogenics and Pulse Detonation. He has published 25+ papers in related area. He is the
member of Institution of Engineers (India), Life member Indian Cryogenics Council, Life Member
Aeronautical Society of India and Life member Solar Energy Society of India. He has participated in many
national and International conferences and seminars.