Embed Size (px)
Citation preview
1
Integrating SWOT Analysis into the FMEA Methodology to Improve Corrective Action
Decision Making
Abstract
Improving the method for selecting risk-based competing improvement strategies has equal
importance with failure risk quantification in the FMEA methodology. Nevertheless, there are few
studies which focus on this issue. Furthermore, the influence of factors relating to the business
environment which may support or derail improvement efforts is not considered in previous studies.
In order to address these limitations, a model is proposed in which the impact of environmental factors
is considered by integrating SWOT Analysis into the FMEA method in order to support the appraisal
of competing risk-based improvement efforts. The impact of SWOT variables is deployed using a
decision support model based upon the Benefit, Cost, Opportunity, Risk and Organizational Readiness
Index (BCOR2) approach in order for the FMEA team to select from competing corrective actions. A
case example from industry is provided in which the proposed model is applied. This example
illustrates that this new model contributes successfully to good practice by identifying the most
appropriate corrective action option to take and improves upon the decisions provided by existing
developments of the FMEA methodology.
Keywords: FMEA, SWOT Analysis, BCOR, Organizational Readiness, Corrective Action.
1 Introduction
As a sector which is having growing contribution to global economy, delivering reliable service
operation is important for sustaining future economic growth ( Gėcky et al., 2010, Zaman and Anjalin,
2011). At the other side, uncertainty in business environments enforces business practitioners to
develop tools and methodologies to consider the impact of business uncertainty to prevent derailment
of business operations (Wiele et al., 2011). In this context, innovativeness in rectifying service quality
problems is important for sustaining the business operation and FMEA is often applied as a risk
appraisal tool (Hensley and Utley, 2011). By using FMEA, business practitioners can evaluate
potential critical business failures and find appropriate ways to prevent the escalation of their business
losses. Within the FMEA approach, responding appropriately with corrective actions to identified
risks is as important as assessing the score of the risk priority number (RPN). Approaches such as the
use of Cost-Benefit Analysis (CBA), Pareto Chart and Cause and Effect Matrix can be used in
selecting improvement initiatives as surveyed by Bañuelas et al. (2006) as cited in Mariot et al.
2
(2013). However, owing to its simplicity and ease for use for practical purposes, the RPN which
commonly based on the 1-10 ordinal scale of failure occurrence, detectability and severity ratings is
still the most commonly used basis for ranking the risk of failure modes that demand immediate
actions ( Ram, 2013). Nevertheless, relying only on the RPN Index as the basis for selecting
improvement initiatives has serious limitations. In particular, ignorance of the relative importance of
the RPN constituting factors in accessing criticality of failure mode, the inability to measure the
effectiveness of corrective action implemented and the inability to measure the economic impact of
failure occurrences are often suggested as key weaknesses. Prior studies have addressed these
limitations by using various methods such as fuzzy logic, costs basis, grey theory as represented by
Liu et al. (2012).
Similarly, many attempts have been proposed to improve the quality of improvement strategy
selection in risk-based improvement framework. For example, Niu et al. (2009) use grey theory to
rank corrective actions by considering some of its corresponding factors such as implementation time
and implementation cost, the estimated change of the RPN prior and after implementing corrective
action, its probability of success and its effects. Sachdeva et al. (2008) present an improved
maintenance decision selection methodology for ranking criticality of equipment failures based on
multi factors by using AHP instead of relying on the RPN in FMEA. Arunraj and Maiti (2010)
describe a model to select maintenance strategies based on risk of failure and maintenance cost by
integrating AHP and Goal Programming methods. Kumar and Chaturvedi (2011) demonstrate the use
of fuzzy logic and approximate reasoning approaches to prioritize maintenance task selection for the
critical equipment failures in a steel rolling mill. Rewilak (2011) introduced FMEA ROI (Risk
Overload Index ) and DOI ( Detection Overload Index) as means to measure effectiveness of FMEA
implementation measures. Braglia et al. (2013) embody Integer Linear Programming into Reliability
Centered Maintenance in order to identify suitable maintenance strategies to overcome critical failure
modes in a paper mill. Marriot et al. (2013) use the integration of Process Activity Mapping (PAM)
and FMEA as basis for process improvement prioritization in a low volume manufacturing setting.
Wang et al. (2014) utilize a failure propagation graph as a means of advancing failure rectification
methodology by considering the interrelationship among failures using the example of a CNC
machine.
The outcomes of these studies focus on improving the quality of the corrective action selection at
the process level but do appear to be less strong in considering the impact of the factors associated
with the business environment. This is particularly important for practitioners who are using the
FMEA approach to address the root causes of business problems. From this wider perspective, it is
3
possible that the decision maker may overlook the positive impacts and underestimate the negative
impacts of environmental factors when appraising competing improvement strategies. Consequently,
this situation requires the integration of strategic assessment tools within the FMEA approach in order
to strengthen the usefulness of FMEA when considering the impact of business environment factors in
risk-based improvement decision making.
Considering such limitations and the scarcity of prior research into improving the quality of risk
responses suggested by Seyedhosseini and Hatefi (2009), this study explores the use of a model that
integrates SWOT analysis, a commonly used strategic assessment tool, into the FMEA method. The
overall objective is to provide a research contribution comprising of an improved approach to
corrective action selection when a number of potential actions are available. In order to do this, the
model incorporates a quantification (ie., scoring and weighting) of SWOT analysis variables to
represent the impact of business environment factors. These are then integrated in to a decision
support model which uses a Benefit, Opportunity, Cost, Risk and Organizational Readiness Index
(known as BCOR2) approach. The remaining part of this study is presented as below:
In section 2, an overview of FMEA and SWOT Analysis is presented and followed by a model
formulation to estimate the impact factor of SWOT (IF) Variable in section 3. In Section 4, by using
the BCOR2 model, Corrective Action Index (CAI) which represents the FMEA team preference in
choosing competing CAs is formulated. In section 5, illustrative example in using quantitative SWOT
analysis for prioritization of service FMEA - based corrective actions selection is provided. At last,
discussions and managerial implications from the illustrative case study are presented in section 6.
Section 7 relates to conclusions and opportunities for further investigation.
2 Overview of FMEA and SWOT Analysis
2.1. FMEA
Born from military sector in the 1950s, FMEA can be defined as a risk appraisal tool for the
occurrence of critical failures which aids attempts to propose solutions to avoid the recurrence of the
failures in the future. In FMEA, criticality of a failure effect is measured by the metric known as RPN
(risk priority number). The RPN is the product of severity failure ratings, detection of failures ratings,
and occurrence of failure ratings. For detailed definitions, classifications, and criteria of the ratings
can be referred to such as Chang and Sun (2009). By using and updating the findings from FMEA
implementation, company can obtain invaluable failure knowledge in tackling problems in their future
business operation. Among other quality improvement tools, FMEA has special characteristics as it
enables decision makers to rank the risk of critical failure occurrence and attempted finding
4
appropriate ways for its alleviation. Due to its beneficial impacts, the FMEA methodology is
continuously developed and its applications are getting more versatile in non-product design and
manufacturing contexts. For example, FMEA is applied as a means to portray the severity of defective
service provision based on the calculation of service loss in a passengers transportation service
(Jeegadeshan et al., 2007). In healthcare, Ookalkar et al. (2009) use FMEA to map critical failure
modes in a haemodialysis process and propose relevant corrective actions to mitigate the adverse
effects to patient safety. In foodstuffs, Ozilgen (2010) uses FMEA to identify and rank critical failure
modes affecting the safety and quality of confectionary products for consumers. In consumer goods
trading, Chuang (2010) uses FMEA to estimate a disservice index for hypermarket service provision
derived from SERVQUAL’s service quality dimensions. In an attempt to improve performance of
military logistics, Chapman et al. (2012) use FMEA to reveal the cause of lead time variability.
Waterworth and Eldridge (2011) develop a model of FMEA to appraise criticality of failure modes in
the e-commerce environment and propose corrective measures for their alleviation. To prevent
potential loss in service outsourcing, Nassimbeni et al.(2012) use FMEA to highlight the risk factors
and corresponding preventative measures in service outsourcing/offshoring.
In an attempt to strengthen the capability of FMEA, integration with other improvement
approaches is becoming more prevalent. For example, Tanik (2010) integrates Quality Function
Deployment (QFD) with FMEA for assuring the quality of an order handling process in food product
packaging activities. Krishnaraj et al. (2012) present a model of Total FMEA in which quality
problems in foundry product manufacturing are addressed holistically by integrating all the
departments in finding and reducing the risks of failure. Mariajayaprakash and Senthilvelan (2013)
integrate Root Cause Analysis (RCA), FMEA and Taguchi Methods to rectify machinery problems in
the sugar processing industry. Chen (2013) similarly integrates RCA and FMEA to develop a model
for autonomous maintenance to improve productivity in the semiconductor manufacturing industry.
Adaptations of FMEA to accommodate specific decision making applications are also
becoming more common. For example, Chen and Wu (2013) present a modified FMEA as a means of
appraising the risk in selecting suppliers within the context of a supply chain while Lee and Chang
(2011) position FMEA as means to rank problem criticality in a continuous improvement framework
that combines the Theory of Constraints (TOC), RCA and Six Sigma.
2.2. SWOT Analysis
5
The Strengths, Weaknesses, Opportunities and Threat (SWOT) analysis is a strategic assessment
tool which enables an organization to understand its internal and external strengths and weaknesses
and to adjust its strategic position by identifying any potential benefits based on the recognityion of
opportunities and threats. Al-Rousan and Qawasmeh (2009) define Strength in SWOT analysis as
“any organizational characteristics that can be used to compete against their competitors”. According
to Laaksolahti (2005), some organizational characteristics such as talent, speed, collaboration, shared
mind-set and coherent brand identity, accountability, learning, leadership, customer connectivity,
innovativeness and efficiency can be organizational strengths. Flouris and Yilmaz (2010) define
Weakness in SWOT Analysis as “any organizational capability shortage which may make
organizations fail to compete against their competitors or any organizational attributes which company
does not do well.” Both strengths and weaknesses variables are located in the internal company
environment and are thus easier to control and manage than threats and opportunities which usually
come from external environment. According to Trzcieliňski and Trzcieliňska (2011), Opportunity in
SWOT Analysis is defined as “any internal and external favorable factors which can be solutions to
the problems faced by companies.” Meanwhile, Threats are defined as “any unfavorable factors
which hinder the achievement of company objectives.”
Consequently, SWOT Analysis classifies two important factors of business system:
Internal factors: The internal strengths and weaknesses of the company.
External factors: The opportunities and threats represented by the company’s external
environment.
With regard to the influence of internal and external factors, strength and opportunity variables have a
positive impact on the organization while the existence of weakness and threat variables has a
negative impact. By using SWOT Analysis, organizations may estimate what internal and external
business factors may occur and are harmful or beneficial to their businesses. Thus, they may take
preventative measures to avoid any potential losses or to reap any potential benefits from those
occurrences. Owing to its beneficial impact for decision makers in establishing strategy, SWOT
Analysis has been integrated into a variety of decision making tools such as AHP, ANP, and BSC in
studies as described by Ghazioory et al. (2011) and with engineering design and economic
management tools such as QFD, NPV and Pay back Method as exemplified by Frank et al. (2013). As
discussed earlier, many studies have already been presented to improve the capability of FMEA by
integrating it with other tools and, similarly, the integration of SWOT Analysis with other decision
support tools has been proposed. Nevertheless, none of the previous studies has focused on improving
the capability of FMEA by considering the impact of the business environment in proposing

6
corrective or preventative measures. One solution to this limitation which has not previously been
investigated could be to integrate SWOT Analysis into the FMEA methodology. For this to be
successful, correctly quantifying SWOT variables is extremely important (Helms and Nixon, 2010) as
decision makers may still wrongly select appropriate strategies if they assume each of SWOT
variables has equal importance. Consequently, it is necessary to establish a model to quantify the
impact of SWOT variables by considering organizational maturity, organizational resilience, and
organizational ability to utilize resources in exploiting the strength variable and avoiding the weakness
variable. This is missing in SWOT quantification studies and is a clear justification to develop a new
model for appraising the weight of SWOT Variables.
3. Quantifying the Impact Factor of SWOT Variables - Model Development
As introduced earlier, quantifying the impact factor of SWOT variables is a basis for considering
impact of business environment factors. Taking into account that the classification and categorization
of SWOT variables remains an unresolved issue in utilizing SWOT Analysis (Helms and Nixon,
2010), some underlying assumptions and notation used in this study are described below:
i. The occurrence of each SWOT variable is independent of the others. This
assumption is based on idea that without holding assumption (i), FMEA users will find
difficulty in determining impact of every SWOT variable.
ii. Every single opportunity occurrence will only affect one economic benefit.
Similarly, each threat will also yield into one single loss. The assumption (ii) is used to
simplify calculating the magnitude of the impact factor of each of the SWOT variables.
iii. The passage of time as a determining factor for SWOT variable recognition is
ignored. Considering that the determination of the SWOT variable is time dependent
should be neglected in assigning the status of SWOT variables in order to avoid the
confusion of the status of each SWOT variable when the SWOT Analysis is carried out.
The notation method adopted for the variables is as follows:
𝑂𝑂𝑘𝑘= Opportunity variable k,
𝐼𝐼𝐼𝐼𝑂𝑂𝑘𝑘= Impact Factor of opportunity variable k,
𝑇𝑇𝑙𝑙= Threat variable l,
𝐼𝐼𝐼𝐼𝑇𝑇𝑙𝑙= Impact factor of threat variable l,
𝑆𝑆𝑚𝑚= Strength variable m,
𝐼𝐼𝐼𝐼𝑆𝑆𝑚𝑚= Impact factor of strength variable m,
𝑊𝑊𝑝𝑝= Weakness variable p,
7
𝐼𝐼𝐼𝐼𝑊𝑊𝑝𝑝= Impact factor of weakness variable p,
𝐵𝐵𝐵𝐵𝐵𝐵𝑖𝑖𝑘𝑘= Benefit of Implementing Corrective Action i for failure mode k.
𝑃𝑃𝑆𝑆𝐵𝐵𝐵𝐵𝑖𝑖𝑘𝑘= preference score to select corrective action i to failure mode k,
𝐼𝐼𝐵𝐵𝐵𝐵𝐵𝐵𝑖𝑖𝑘𝑘= Implementation cost of corrective action i to failure mode k;
𝑂𝑂𝐵𝐵𝐵𝐵𝑖𝑖𝑘𝑘= Opportunity to corrective action i to failure mode k;
𝑅𝑅𝐵𝐵𝐵𝐵𝑖𝑖𝑘𝑘= The risk of implementing corrective action i to failure mode k;
𝐸𝐸𝑂𝑂𝑘𝑘= Expected Value of Opportunity Variable k;
𝑀𝑀𝑂𝑂𝑘𝑘= Company’s Maturity Index to the Opportunity variable k;
𝑂𝑂𝑅𝑅𝐵𝐵𝐵𝐵𝑖𝑖𝑘𝑘= Organizational Readiness to implement correction action i to failure mode k;
With m,p, k, l = 1,2,3,…. 3.1. Impact Factor of Opportunity Variables
Based on ultimate company’s goal in obtaining business benefit, the impact factor of opportunity
variables can be estimated based on their possibility to trigger numerous economical and operational
benefits (Lee, 2010). Nevertheless, besides the expectation of economic benefit, the company must
also consider its resources capability and maturity in recognizing and utilizing the opportunity. No
matter how big the opportunity variable is, its corresponding impact will be low in the when the scale
of organizational maturity in observing and chasing it is low. From this point of view, the
attractiveness of an opportunity variable equals to the expected economic benefit that may occur and
the organizational maturity index in recognizing the opportunity variable. The score of impact factor
of opportunity variable k is then formulated as
𝐼𝐼𝐼𝐼𝑂𝑂𝑘𝑘= 𝐸𝐸𝑂𝑂𝑘𝑘𝑀𝑀𝑂𝑂𝑘𝑘 (1)
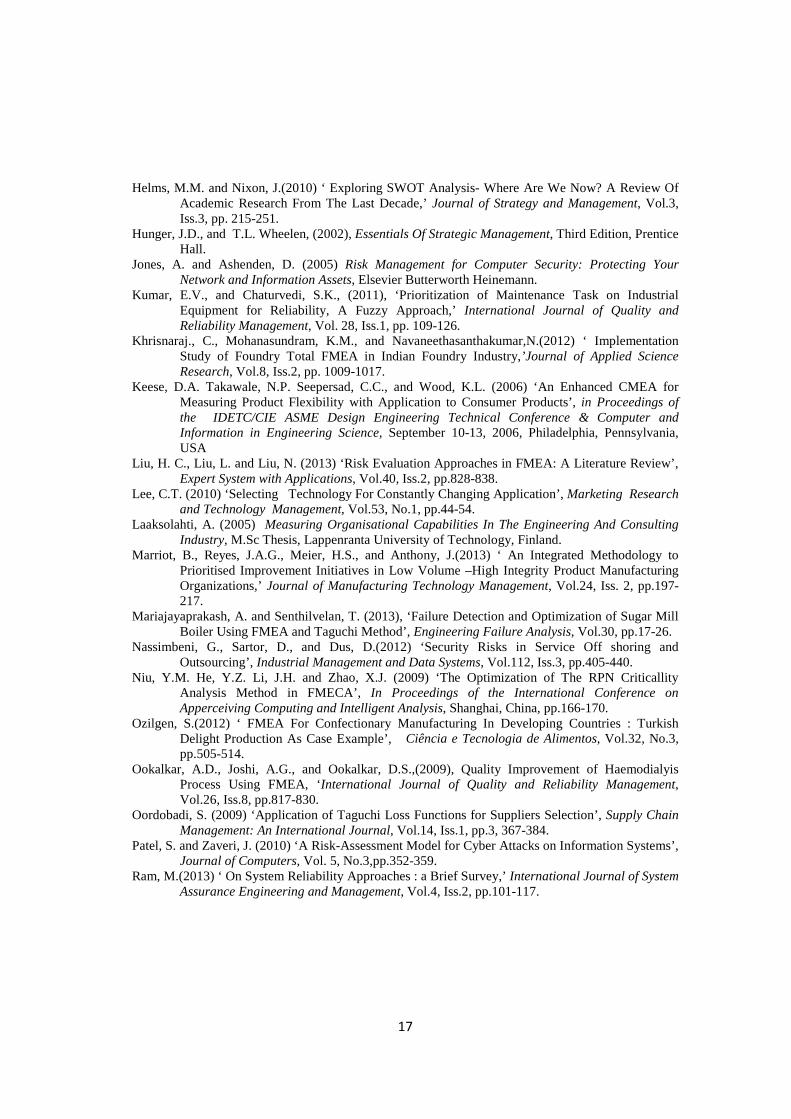
Based on the work of Shah et al. (2009), the details on criteria, ratings, and characteristics to
determine the maturity index for business opportunity k are given in table 1 <Insert Table 1 here>.
3.2. Impact Factor of Threat Variables
In running their businesses, companies are often faced with unfavorable situations which may
hinder achievement of their business goals. In these situations, the existence of any events that
possibly hinder company to achieve its goals are called “threats” (Triszliňki and Triszliňka, 2011). In
this study, business threat quantification is estimated based on its expected loss in monetary terms and
its resilience index 𝑅𝑅𝑇𝑇𝑙𝑙 . The expected loss of threat occurrence is a function of the threat possibility
occurrence, the capability of threat agent and the company’s vulnerability against threat attack (Jones
and Ashenden, 1995).

8
Based on idea that the impact of a threat occurrence is equal to the expected loss it may incur and
reversal with resilience of the company in absorbing its negative impact, the score of impact factor of
threat variables l is therefore formulated as in equation (2).
𝐼𝐼𝐼𝐼𝑇𝑇𝑙𝑙= 𝐸𝐸𝐸𝐸𝑙𝑙𝑅𝑅𝑅𝑅𝑙𝑙
(2)
The Loss value and its corresponding metrics due to potential threats attack can be estimated
based on Patel and Zaveri (2010).
3.3. Impact Factor of Strength and Weakness Variables
Similarly with Threat variables, the existence of Weakness variables negatively affects the
company. The weakness variable resists the company’s operation in achieving its goal. The presence
of weakness variables hinders the company’s operation in reaching its business objective. By viewing
that the existence of weakness variable may give negative risk to the firm, then the amount of negative
impact of weakness variable 𝐼𝐼𝑊𝑊𝑝𝑝 is estimated by two factors, namely:
• The seriousness of the impact of the weakness variable in resisting the company’s operation
(𝑆𝑆𝑊𝑊𝑝𝑝);
• The company’s difficulty scale to avoid and or solve the weakness variables (𝐷𝐷𝑊𝑊𝑝𝑝)
Since the impact factor of weakness variables is equal to those factors, the impact factor of
weakness variable p is then represented by equation (3)
𝐼𝐼𝐼𝐼𝑊𝑊𝑝𝑝= 𝑆𝑆𝑊𝑊𝑝𝑝𝐷𝐷𝑊𝑊𝑝𝑝 (3)
Contrary to the weakness variable, the existence of Strength variables positively affects endeavor
in achieving company’s business goals. If 𝐼𝐼𝐼𝐼𝑆𝑆𝑚𝑚 represents the impact factor of the Strength variable,
its score can be estimated based on criteria such as:
• Capability of Strength variable to accelerate the company’s operation to achieve its business
goal(𝐵𝐵𝑆𝑆𝑚𝑚).
• Company’s capability scale to utilize the Strength variable in solving business problems
(𝐵𝐵𝐵𝐵𝑆𝑆𝑚𝑚.).
Based on the above criteria, the impact factor of Strength variables can then be formulated as
𝐼𝐼𝐼𝐼𝑆𝑆𝑚𝑚= 𝐵𝐵𝑆𝑆𝑚𝑚𝐵𝐵𝐵𝐵𝑆𝑆𝑚𝑚 (4)
For the sake of simplicity, determination of the scale of above elementary criteria can be based
on a Likert ordinal scale using the discretion of the FMEA team.
3.4. Linking Corrective Action Options with SWOT variables
9
In order to link each corrective action (CA) option and the SWOT variables, the coefficient of
correlation r can be used. Depending of the typology of impact that may incur, the form of
relationship between a particular CA and SWOT variables may be negative or positive. If a corrective
action will increase the likelihood of opportunity and strength variables to occur, the value of
correlation coefficient between corrective action and those variables will be positive. In reverse, if the
corrective action prevents the possibility of occurrence of threat and reduce the weakness of the
company, the correlation coefficient will be negative. In this regard, some rules in assigning the score
of such correlations are given as below:
i) If the corrective action increases the likelihood of the SWOT variables’ occurrences,
assign 0.9, 0.6, and 0.3 to their strong, moderate, and weak correlation, respectively.
ii) If the corrective action prevents the possibility of the SWOT variables’ occurrences,
assign -0.9, -0.6, and -0.3 to their strong, moderate, and weak correlation, respectively.
iii) If there is no relation between the two then assign 0 to their correlation.
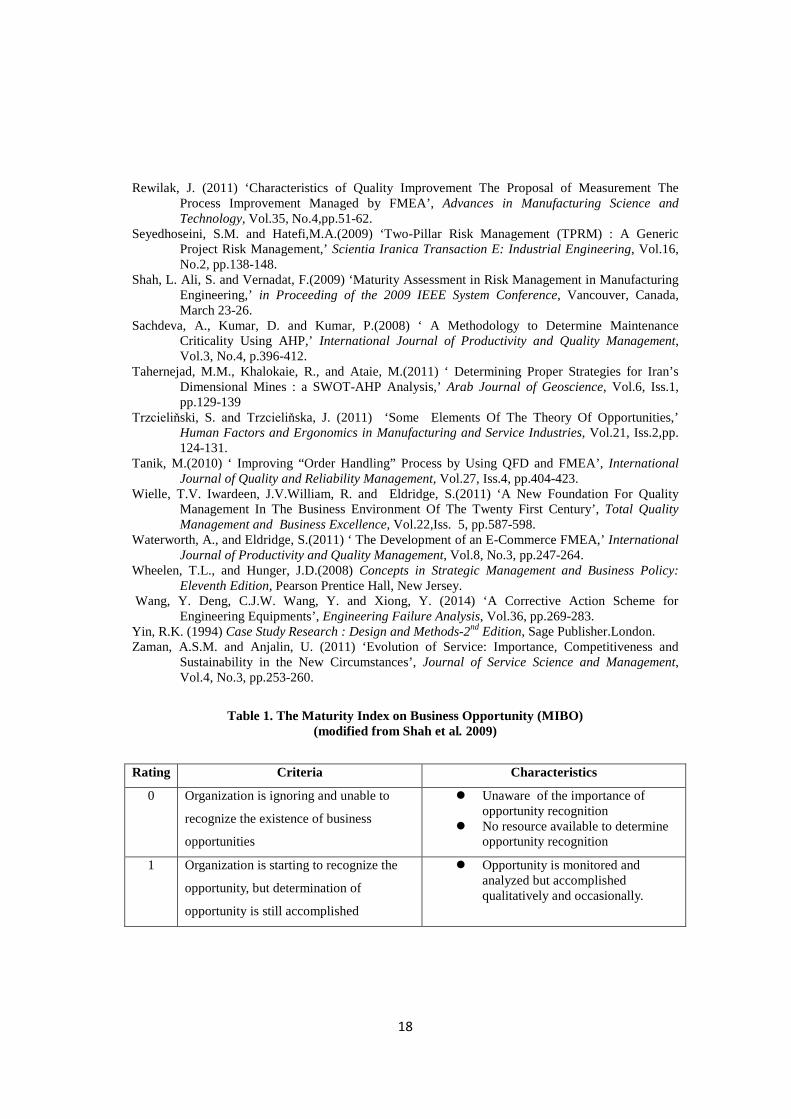
Table 2 depicts relationship between each corrective action and corresponding SWOT variables.
<Insert Table 2 here>. By considering the impact factor of the SWOT variables, estimating the preference score
(𝑃𝑃𝑆𝑆𝐵𝐵𝐵𝐵𝑖𝑖𝑘𝑘) of corrective action 𝐵𝐵𝐵𝐵11, for example, can be carried out using equation (5).
PSCA11 = ∑ RCA11Simi=1 IFSi − ∑ RCA11Wi
pi=1 IFWi + ∑ RCA11Oi
ki=1 IFOi − ∑ RCA11Ti
li=1 IFTi (5)
By linking with the criticality of certain failure mode, as represented by its corresponding RPN
score, and the impact factor of the SWOT variables, prioritization of corrective action based upon the
benefit index of a corrective action (BCAik) can be carried out using the following equation (6):
Benefit Index (BCAik) = RPNFMk PSCAik (6)
4. Selecting Competing Corrective Actions by Using the BCOR2 Model
Selecting an improvement strategy is a complicated task since many factors such as the estimated
amount of benefit could be reaped, opportunity to implement, risk of implementing corrective action,
complexity of implementation, and corresponding implementation cost should all be taken into
consideration. By considering such complexity above, a model based on the BCOR2 Approach which
stands for Benefit, Opportunity, Cost, Risk, and Organizational Readiness in implementing a
corrective action is proposed.
The Benefit element in BCOR2 Approach is defined as any positive impact resulted from
implementing an improvement effort. The impact of a corrective action can be defined as the amount
10
of benefit that can be achieved if a corrective action is implemented. Following El- Haik and Al-
Aomar (2006), the benefit of improvement strategy can be categorized into 3 classes; financial,
operational, and organizational. Depending on the benefit category, the value of strategy benefit can
be defined using some quantitative and qualitative dimensions such as the increase in the level of
customer and employee satisfaction, reduction in operations costs, time delays and quality deficiencies
and so on. Considering that the employee is inseparable part in implementing corrective action, the
priority to select a certain improvement strategy shall be given to that which can give maximum
benefit not only to shareholders and customers but also to employees (Tan and Raghavan, 2004). In
order to weight competing corrective actions by considering their compatibility with company specific
goals, the AHP (Analytical Hierarchy Process) can be used as a decision support tool. Based on these
ideas, the weight of the benefit of a corrective action, which represents its impact, is given in equation
(7):
𝐵𝐵𝐵𝐵𝐵𝐵𝑖𝑖𝑘𝑘= 𝐾𝐾𝐵𝐵𝐵𝐵𝑖𝑖𝑘𝑘𝑊𝑊𝐵𝐵𝐵𝐵𝑖𝑖𝑘𝑘 (7)
The criteria for weighting corrective action impact factors are as depicted in Table 3 <Insert table 3
here>.
The Opportunity component 𝑂𝑂𝐵𝐵𝐵𝐵𝑖𝑖𝑘𝑘 in the BCOR2 model represents any positive attributes
arising from implementing a corrective action and it can be accessed by proposing questions
pertaining to the positive outcome from implementing certain CA such as: what can go well? What is
the chance that it will go well? And what are the consequences if it goes well?
In the BCOR2 model, the Cost component 𝐼𝐼𝐵𝐵𝐵𝐵𝐵𝐵𝑖𝑖𝑘𝑘 is defined as the amount of money that
will be spent to implement specific improvement efforts. It can be in the form of infrastructure cost,
such as cost of facilitating devices and tools, and the cost of manpower spent to execute the corrective
action. The Risk element 𝑅𝑅𝐵𝐵𝐵𝐵𝑖𝑖𝑘𝑘 in the BCOR2 represents any unintended outcome from
implementing a corrective action and it can be in the form of employee resistance, escalating cost,
time overrun and so on. According to typologies proposed by Fijnvandraatand Bouwman (2010) and
Cagno and Guido (2011), the risks inherent in selecting strategy may be classified into some
categories such as goals, resources, competitors, customers, political, technical and managerial risks.
Consequently, there can be situations when the risk elements of implementing corrective actions have
different units of measurement. In these situations, the loss score borrowed from Taguchi Loss
Function can be used. Considering that company management is a profit seeker, the loss function in
terms of ‘the smaller the better’ will fit for quantifying the risk corresponds to the corresponding

11
corrective action. Oordobadi (2009) provides a useful exemplary model to estimate and quantify the
risk components by using Taguchi Loss Function.
The last component in the BCOR2 approach, the Organizational Readiness 𝑂𝑂𝑅𝑅𝐵𝐵𝐵𝐵𝑖𝑖𝑘𝑘 reflects
the readiness of an organization to implement corrective action. The readiness contained in this
component in the BCOR2 relates to the accommodating ability for any compensation pertaining to the
selection and implementation of a specific improvement effort (Keese et al., 2006). For ease of use in
practical situations, the OR component is quantified by ordinal scale 1-10 which 1 represents a
potential change that can be implemented immediately without cost, and a 10 represents a potential
change that in feasible to be implemented.
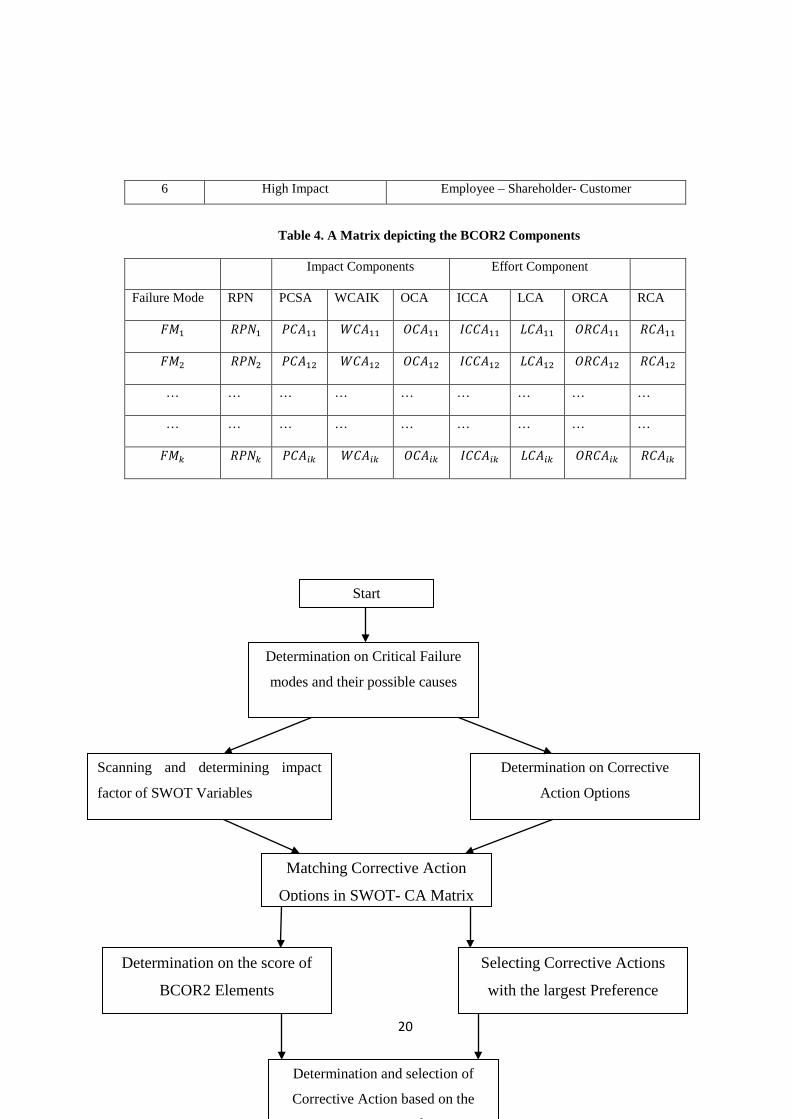
By considering all elements in the BCOR2 approach, with the severity of failure loss
assumed constant over time from initial failure detection point, the preference score to select a
corrective action, which is called Corrective Action Index 𝐵𝐵𝐵𝐵𝐼𝐼𝑖𝑖𝑘𝑘, is given by equation (8):
𝐵𝐵𝐵𝐵𝐼𝐼𝑖𝑖𝑘𝑘=𝑅𝑅𝑅𝑅𝑅𝑅𝑅𝑅𝑅𝑅𝑘𝑘𝑅𝑅𝑃𝑃𝑃𝑃𝑃𝑃𝑖𝑖𝑘𝑘𝑊𝑊𝑃𝑃𝑃𝑃𝑖𝑖𝑘𝑘𝑂𝑂𝑃𝑃𝑃𝑃𝑖𝑖𝑘𝑘𝐼𝐼𝑃𝑃𝑃𝑃𝑃𝑃𝑖𝑖𝑘𝑘𝐸𝐸𝑃𝑃𝑃𝑃𝑖𝑖𝑘𝑘𝑂𝑂𝑅𝑅𝑃𝑃𝑃𝑃𝑖𝑖𝑘𝑘
(8)
The corrective action with the largest value of corrective action index will have the highest
priority to be selected and implemented. Table 4 depicts the above mentioned components <Insert
Table 4 here>.
The framework of integrating SWOT Analysis into FMEA in solving critical failure mode is
given in Figure 1 below <Insert Figure 1 here>.
5. Illustrative Example of Application
In this study, a case study adopted from a FMEA application in a gas tube production and
distribution company is used for illustrative purposes. According to Yin (1994), the case study is used
to demonstrate the application of new theory with limited knowledge to obtain much better
understanding and the study is intended to answer “What?” and “Why?” research questions.
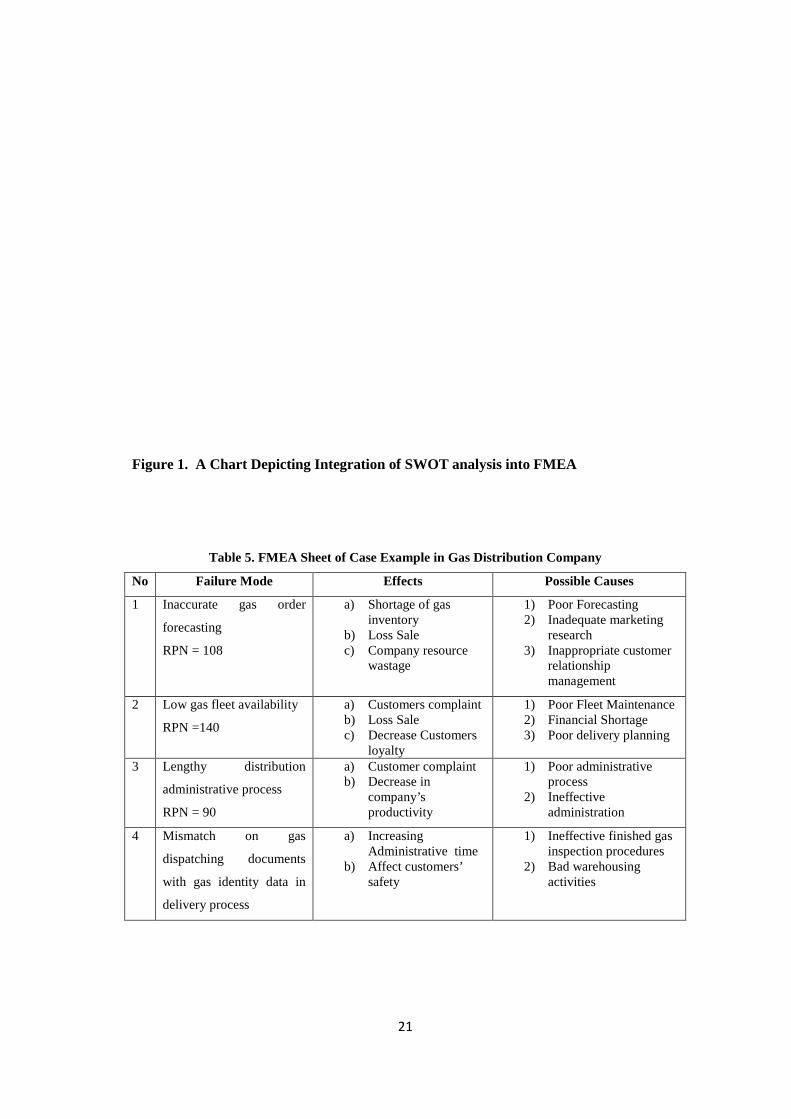
The focus of applying FMEA is on determining critical failure modes, possible root causes
and corresponding corrective actions. The FMEA session is accomplished by the company team
which consists of distribution, operation, marketing and maintenance staff and the result of their
FMEA session is summarized as in Table 5. <Insert table 5 here>
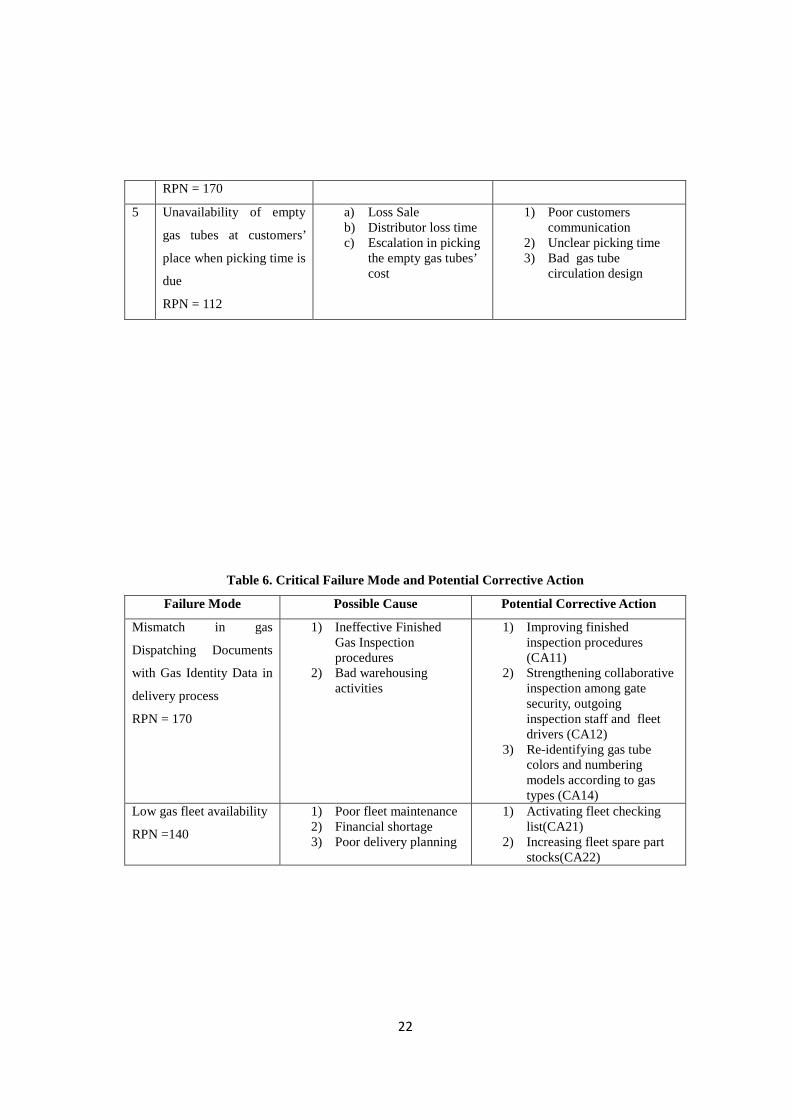
The company’s management has set a threshold RPN value of 130 for critical failure as the basis for
failure alleviation. As can be seen in Table 5, the critical failures that should be rectified are
“Mismatch in Gas Dispatching Documents with Gas Identity Data in Delivery Process (FM4)”, and
12
“Low Gas Fleet Availability (FM2)”. On completion of the discussion between the FMEA team
members on potential corrective actions to tackle the critical failures, the corresponding corrective
action options with critical failures are presented in Table 6 < Insert table 6 here>.
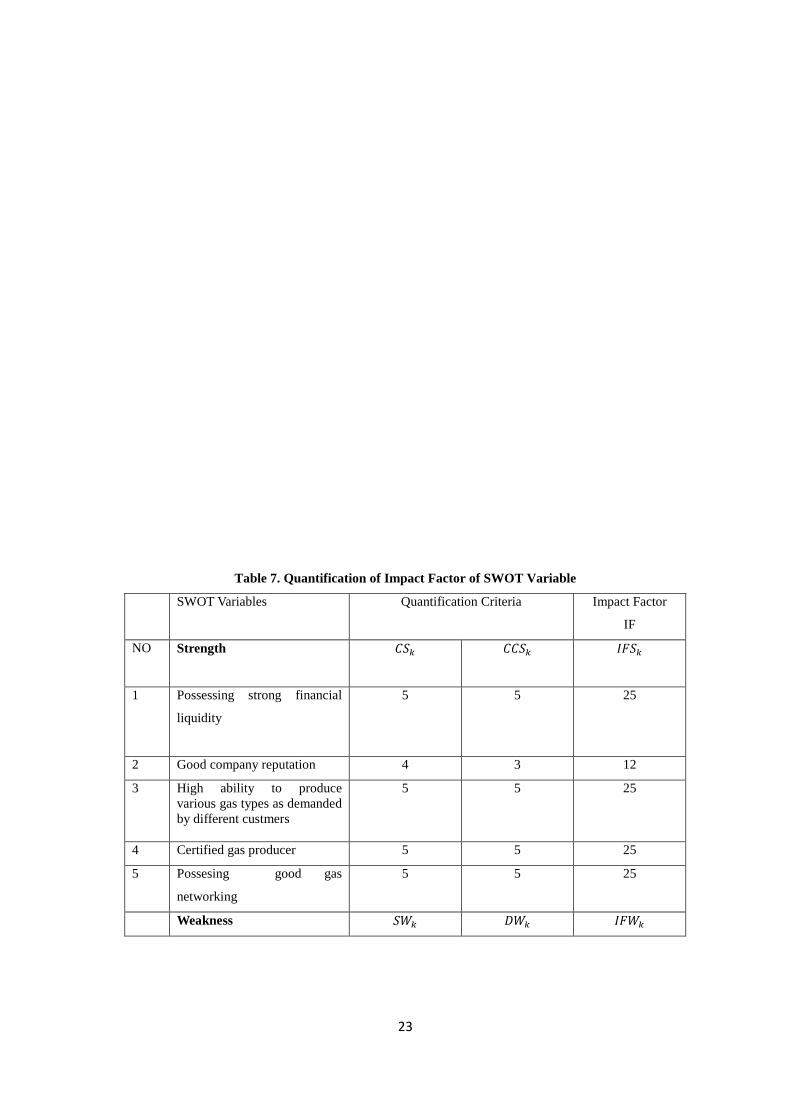
The identification of SWOT variables is accomplished by using internal and external factor analysis
by the FMEA team. Upon identifying the SWOT variables, the corresponding impact factor of each
SWOT variable is then estimated based on equation (2), (3),(4) and (5). The scale to quantify the
impact score of SWOT variables uses a 1-5 ordinal scale. The result of estimating impact factor of
SWOT variables and the preference score to select corrective action based on the impact factor of
SWOT variables are presented in Table 7 and Table 8.
< Insert table 7 and Table 8 here>.
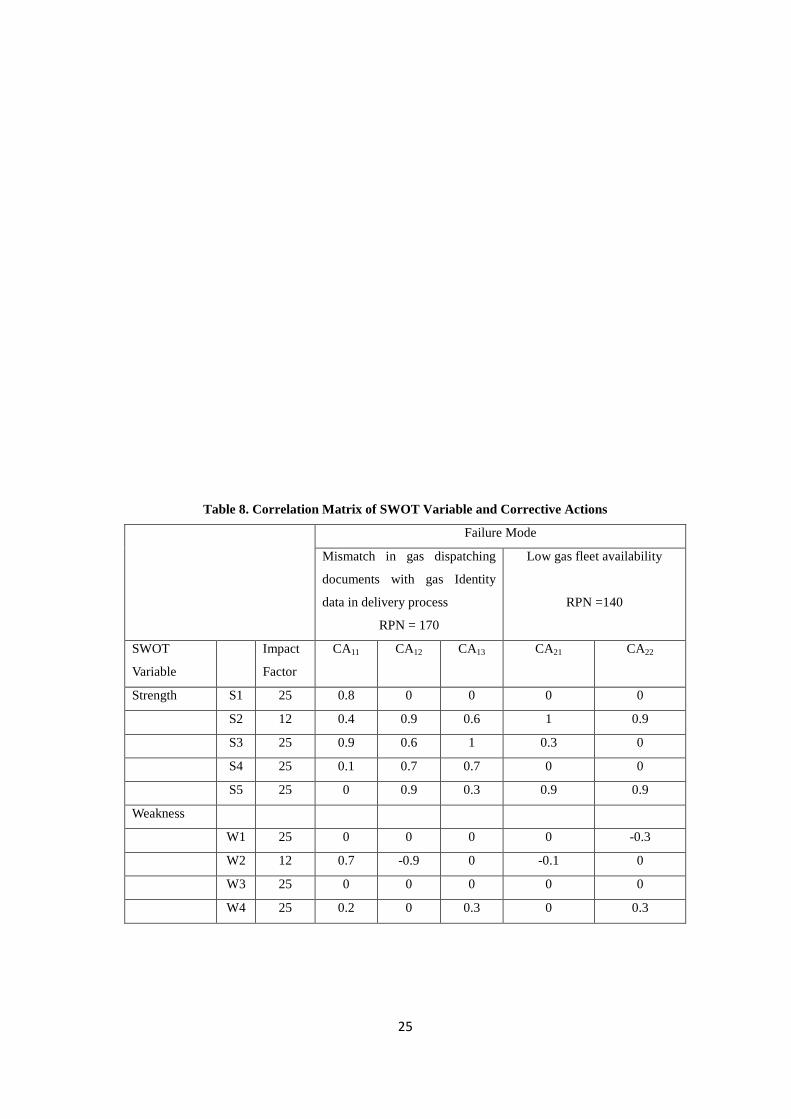
Considering the impact factor of the SWOT variables, the corrective action preferred for solving the
first critical failure “Mismatch in gas Dispatching Documents with Gas Identity Data in delivery
process ” is CA12 (Strengthening Collaborative Inspection among Gate Security, Outgoing Inspection
Staff and Fleet Drivers) and CA21( Activating Fleet Checking List) is preferred for solving second
critical failure mode “ Low gas fleet availability”.
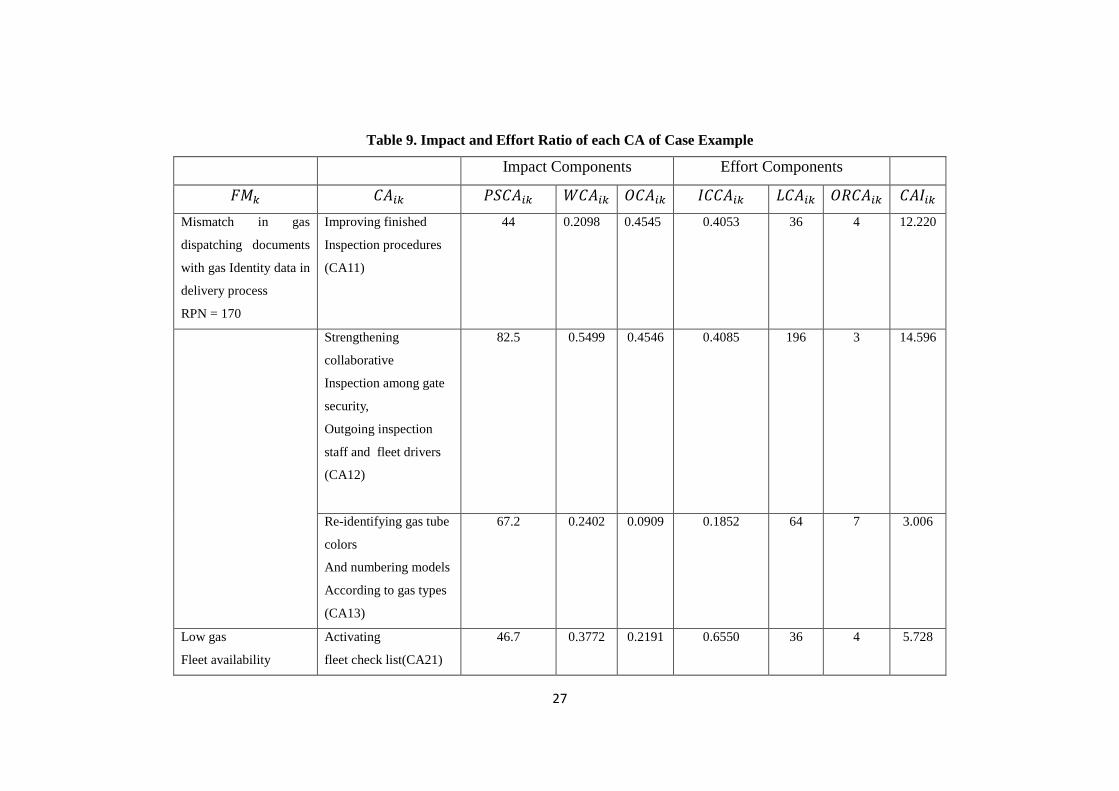
The impact and effort ratio for each corrective action needs to be considered in selecting the
most preferred corrective action. The impact of a corrective action is estimated by the score of the
affected parties if implemented. The criteria to estimate the weight of the impact variables by using
the AHP are consumer safety, distribution on time delivery and cost reduction. Besides distribution,
on time delivery and cost reduction aspect, consumer safety also become criteria in appraising the
benefit of corrective actions based on the fact that gas production, distribution and consumption are
very sensitive to safety requirements and the possibility of a gas explosion. In order to quantify the
loss that may occur when implementing the corrective action, the Taguchi Loss Function (smaller the
better type) and a 1-10 ordinal scale is used to scoring the organizational readiness index in
implementing each corrective action. For example, the risk may incur for implementing CA12 for
FM1 (Mismatch on gas dispatching documents with gas identity data in delivery process) is the
possibility of creating extra administrative time for employee. The result of estimating the impact and
effort ratio of each corrective action is summarized in Table 9. By considering the Impact and Effort
components from the BCOR2 Approach, for solving FM1, CA12 should be chosen and for solving
FM2, CA21 is more appropriate to be selected. <Insert Table 9 here>.
6. Discussions
In this paper, a model to consider impact of business environment factors is introduced by
integrating SWOT analysis in risk-based improvement selection process. Instead of relying solely on
13
the risk dimension as represented by the use of RPN as commonly utilized in earlier FMEA studies,
the impact of SWOT variables is incorporated prior to choosing suitable corrective actions. By using
this model, FMEA practitioners can take advantage of the positive impact from internal and external
business factors which may beneficial to the achievement of company’s goal when alleviating
business problems, and vice versa. Next, the proposed model of quantifying the impact of business
variables also considers company maturity, vulnerability and resilience in order to make it possible for
management to estimate the value of expected loss and gain which is representative of the overall
business situation.
In spite of the benefit offered by the proposed model, the study has some clear limitations.
First and foremost, relying on single case example only is certainly not sufficient to claim validity and
reliability of proposed model. As the case example in the study is based on gas tube production and
distribution, general applicability may be limited. Realizing that different business operations may
have different characteristics which may influence decision makers in choosing improvement
initiative, replication of the model in various cases in different business sectors is recommended to
strengthen its validity and generalizability. Next, the utilization of a relatively sophisticated AHP
method to score the impact and effort components may be difficult for some FMEA team members
who are not confident or regular users of mathematical methods. To eliminate the difficulty in using
AHP, the use of ordinal Likert scales is suggested for ease of implementation in order to represent the
impact and effort components. Another limitation of the model which must be considered carefully
for practical application relates to the model’s ignorance of the risk perceptions of decision makers in
various industries in choosing improvement initiatives. According to Bossuyt et al. (2012), for risk –
averse industries, such as nuclear and aerospace, practitioners tend to choose the least risky
improvement strategy. However, the opposite may be true in the web development industries where
the consequences of failure may be less severe. Integrating Utility theory to take into account the risk
behavior of FMEA teams in appraising multiple improvement strategies would be an appropriate
future development of the model.
6.1. Theoretical Implications
This study has developed a framework for integrating SWOT Analysis into the FMEA methodology.
The proposed framework is consisted of three parts: the classification of critical failure modes and
their potential corrective actions to be chosen; the determination of SWOT variables and their impact
factors; and the appraisal of competing corrective actions based on the BCOR2 model. This
framework and the associated model is a novel contribution to current research into enhancing the
capability of FMEA.
14
In appraising the weight of SWOT variables, this research offered new ideas for quantifying the
impact of SWOT variables. Instead of the multi criteria decision making tools commonly used in the
SWOT Analysis literature, the study uses a simpler calculation method which considers,
simultaneously, organizational maturity in recognizing opportunities, organizational resilience in
considering the impact of the external business environment (threat and opportunity variables) and
organizational capability in getting rid of the weakness and utilizing strengths prior to selecting an
improvement strategy in taking into account the impact of the internal business environment (strength
and weakness variables).
By integrating the risk factors of critical failures in term of their corresponding RPN and impact of
environmental factors in the appraisal of corrective action, the study includes benefit, cost,
opportunity, risk and organizational readiness considerations which is supplementary to previous
studies which rely only on cost and benefit analysis. Inclusion of opportunity and risk elements
provides a more representative and rounded analysis of corrective action options that considers the
uncertainty of outcomes together with the organizational readiness for implementation.
6.2 Managerial Implications
Some implications pertaining to strategy selection based on integrating SWOT Analysis into FMEA
are described in the following below:
6.2.1 Inclusion of Impact factor of SWOT variable and The BCOR2 Approach in Risk Based
Improvement selection Methodology
In FMEA literature, the usual basis to determine corrective and or preventative measures against the
riskiest failure modes are based on a risk dimension, the RPN, and an economic measure, the expected
cost. The case study example illustrates that the impact of business environmental variables is
facilitated by integrating SWOT Analysis in FMEA. If the impact factors of company’s business
environment are excluded from the FMEA generation session, each corrective action for
corresponding failure mode with highest RPN will have equal chance of being chosen. For instance, in
solving FM1 “Mismatch in gas Dispatching Documents with Gas Identity Data in delivery process
(RPN = 170)”, “improving finished inspection procedures” (CA11), “Strengthening Collaborative
Inspection among Gate Security, Outgoing Inspection Staff and Fleet Drivers” (CA12) and “Re-
identifying gas tube colors and numbering models according to gas types” (CA14) can be chosen
simultaneously. However, by considering the correlation of the SWOT variables of the company’s
operation with the available corrective action option and the score of impact and effort components of
the corresponding corrective action, “Strengthening collaborative inspection among Gate Security,
Outgoing Inspection Staff and Fleet Drivers” (CA12) is finally chosen.
15
6.1.2. Quantifying the Weight of SWOT Variables
In an attempt to select an improvement strategy using SWOT Analysis, quantification of SWOT
variables ranging from the simplest model, the ordinal scoring model as exemplified in Wheelen and
Hunger (2008), to a more advanced one, using multi criteria decision methodological basis such as
(Tahernejad et al., 2011), have already presented before. However, organizational maturity and
resilience level which contributes quantitatively to the quantification of SWOT variables is
overlooked. This may yield inaccuracies in weighting the impact factor of SWOT variables that, in
turn, may cause the selection of an inappropriate corrective action. In this study, FMEA practitioners
are provided with a much more accurate reflection of the impact of the business environment when
identifying the most appropriate corrective action.
7. Conclusions
This paper presents a model for selecting corrective actions based on integration of SWOT
analysis and FMEA. Previous studies have been presented to overcome the limitation on the use of the
RPN as foundation to determine the rank of competing improvement efforts but have neglected the
impacts of events occurring within the organization’s internal and external business environments
which a company’s day toy day operation. Ignoring the impact of these events can result in a
corrective action being chosen will either create business losses owing to the presence of threats and
weaknesses in the company or not take advantage of potential opportunities and company strengths.
This paper presents a model for FMEA practitioners to use which encompasses these broader business
factors and enables them to make the appropriate decisions when selecting corrective actions.
Despite the contributions offered by this paper to both theory and practice in managing
quality, the model proposed has limitations. The role of the timing of events is ignored and this needs
to be developed in order to consider the failure time occurrence and its influence on determining the
amount of resource allocation and timing of corrective action implementation. The study needs to be
replicated in a wider variety of industries and business environments to test the reliability and validity
of the model. Further development of the model to incorporate other business improvement strategies
such as QFD and TOC should be considered while the interaction between SWOT variables needs
further investigation. Nevertheless, the current model provides a robust foundation upon which to
base these new developments.
References

16
Al-Rousan, M. and Qawasmeh, F. (2009) ‘The Impact of SWOT analysis on achieving a competitive advantages: evidence from Jordanian banking industry’, International Journal of Business Management, Vol.6, pp. 82-92.
Arunranj, N.S. and Maiti, J. (2010) ‘Risk-based maintenance policy selection using AHP and goal programming’, Safety Science, Vol. 48, No. 2, pp.238–247.
Braglia, M., Castellano, D., and Frosolini, M.(2013) ‘An Integer Linear Programming Approach to Maintenance Strategies Selection’, International Journal of Quality and Reliability Management, Vol.30,Iss. 9,pp.991-1016.
Bossuyt, D.V., Hoyle, C., Tumer, I.Y., and Dong, A., (2012) ‘ Risk Attitude in Risk Based Design : Considering Risk Attitude in Engineering Design,’ Artificial Intelligence in Engineering Design, Analysis,and Manufacturing, Vol.26, Special Issue No.4,pp393-406.
Bañuelas,R., Tennant, C., Tuersley, I., and Tang, C.(2006) ‘ Selection of Six Sigma Projects in the UK,’ The TQM Magazine, Vol. 18, No.5., pp.514-527.
Chen, P.S., and Wu, M.T.(2013) ‘ A Modified FMEA for Supplier Selection Problems in the Supply Chain Risk Environment: A Case Study’, Computers and Industrial Engineering, Vol.66, Iss.4,pp.634-642.
Chen, C.C.(2013) ‘ A Developed Autonomous Preventive Maintenance Programme Using RCA and FMEA,’ International Journal of Production Research, Vol.51, No.18, pp.5404-5412.
Chapman, P., Bernon, M., Hagget, P. (2012) ‘Applying Selected Quality Management Technique to Diagnose Delivery Time Variability’, International Journal of Quality and Reliability Management, Vol. 28, Iss..9, pp.1019-1040.
Chuang, P.T. (2010), ‘Incorporating Disservice Analysis to Enhance to Enhance Perceived Service Quality’, Industrial Management and Data Systems, Vol.110, Iss.3, pp.368-391.
Chuan, T.K. and Raghavan, V. (2004) ‘Incorporating Business Priority into QFD’, International Journal of Innovation Management, Vol.8, Iss.1,pp.21-35.
Cagno, E. and Michaeli, J.L.G. (2011) ‘Enhancing EPC Supply Chain Competitiveness through Procurement Matrix’, Risk Management, Vol.13, pp.147-180.
Chang, D-S.,and Sun, K.L. P.(2009) ‘Applying DEA To Enhance Assessment Capability Of FMEA’, International Journal of Quality and Reliability Management, vol.26, Iss.6, pp.629-643.
El-Haik, B. and Al-Oumar, R. (2006) Simulation-based Lean Six Sigma and Design for Six Sigma, Wiley Interscience.
Einarsson, S. and Rausand, M. (1998) ‘ An Approach To Vulnerability Analysis Of Complex Industrial Systems’, Risk Analysis, Vol. 18, Iss.5, pp. 535-546.
Frank, A.G., de Souza, D.V.S., Ribeiro, J.L., Echeveste, M.(2013) ‘A Framework for Decision Making in Investment Alternatives’, International Journal of Production Research, Vol. 51, Iss.19, pp.5866-5883.
Floris, T., and Yilmaz, A.K. (2010) ‘The Risk Management Framework to Strategic Human Resource Management’, International Research Journal of Finance and Economics, Iss.36, pp.25-45.
Fijnvandraat, M. and Bouwman, H. (2010) ‘Predicting the unpredictable; dealing with risk and uncertainty in broadband roll-out’, Foresight, Vol.12, Iss.6, pp.3-19.
Ghazinoory, S., Abdi, M., and Mehr, M.A.(2011) ‘ SWOT Methodology: A State of The Art Review for The Past, A Framework for the Future,’ Journal of Business Economics and Management,Vol.12, Iss.1,pp.24-48.
Gėcky,P., Izumi, N., and Hasida, K.(2010) ‘ Service Science ; Quo Vadis?’, International Journal of Service Science, Management, Engineering and Technology, Vol.1, Iss.1, pp. 1-16.
Hensley, R.L., and Utley, J.S. (2011) ‘Using Reliability Tools In Service Operations’, International Journal of Quality and Reliability Management, Vol. 28, Iss.5, pp. 587-598.
17
Helms, M.M. and Nixon, J.(2010) ‘ Exploring SWOT Analysis- Where Are We Now? A Review Of Academic Research From The Last Decade,’ Journal of Strategy and Management, Vol.3, Iss.3, pp. 215-251.
Hunger, J.D., and T.L. Wheelen, (2002), Essentials Of Strategic Management, Third Edition, Prentice Hall.
Jones, A. and Ashenden, D. (2005) Risk Management for Computer Security: Protecting Your Network and Information Assets, Elsevier Butterworth Heinemann.
Kumar, E.V., and Chaturvedi, S.K., (2011), ‘Prioritization of Maintenance Task on Industrial Equipment for Reliability, A Fuzzy Approach,’ International Journal of Quality and Reliability Management, Vol. 28, Iss.1, pp. 109-126.
Khrisnaraj., C., Mohanasundram, K.M., and Navaneethasanthakumar,N.(2012) ‘ Implementation Study of Foundry Total FMEA in Indian Foundry Industry,’Journal of Applied Science Research, Vol.8, Iss.2, pp. 1009-1017.
Keese, D.A. Takawale, N.P. Seepersad, C.C., and Wood, K.L. (2006) ‘An Enhanced CMEA for Measuring Product Flexibility with Application to Consumer Products’, in Proceedings of the IDETC/CIE ASME Design Engineering Technical Conference & Computer and Information in Engineering Science, September 10-13, 2006, Philadelphia, Pennsylvania, USA
Liu, H. C., Liu, L. and Liu, N. (2013) ‘Risk Evaluation Approaches in FMEA: A Literature Review’, Expert System with Applications, Vol.40, Iss.2, pp.828-838.
Lee, C.T. (2010) ‘Selecting Technology For Constantly Changing Application’, Marketing Research and Technology Management, Vol.53, No.1, pp.44-54.
Laaksolahti, A. (2005) Measuring Organisational Capabilities In The Engineering And Consulting Industry, M.Sc Thesis, Lappenranta University of Technology, Finland.
Marriot, B., Reyes, J.A.G., Meier, H.S., and Anthony, J.(2013) ‘ An Integrated Methodology to Prioritised Improvement Initiatives in Low Volume –High Integrity Product Manufacturing Organizations,’ Journal of Manufacturing Technology Management, Vol.24, Iss. 2, pp.197-217.
Mariajayaprakash, A. and Senthilvelan, T. (2013), ‘Failure Detection and Optimization of Sugar Mill Boiler Using FMEA and Taguchi Method’, Engineering Failure Analysis, Vol.30, pp.17-26.
Nassimbeni, G., Sartor, D., and Dus, D.(2012) ‘Security Risks in Service Off shoring and Outsourcing’, Industrial Management and Data Systems, Vol.112, Iss.3, pp.405-440.
Niu, Y.M. He, Y.Z. Li, J.H. and Zhao, X.J. (2009) ‘The Optimization of The RPN Criticallity Analysis Method in FMECA’, In Proceedings of the International Conference on Apperceiving Computing and Intelligent Analysis, Shanghai, China, pp.166-170.
Ozilgen, S.(2012) ‘ FMEA For Confectionary Manufacturing In Developing Countries : Turkish Delight Production As Case Example’, Ciência e Tecnologia de Alimentos, Vol.32, No.3, pp.505-514.
Ookalkar, A.D., Joshi, A.G., and Ookalkar, D.S.,(2009), Quality Improvement of Haemodialyis Process Using FMEA, ‘International Journal of Quality and Reliability Management, Vol.26, Iss.8, pp.817-830.
Oordobadi, S. (2009) ‘Application of Taguchi Loss Functions for Suppliers Selection’, Supply Chain Management: An International Journal, Vol.14, Iss.1, pp.3, 367-384.
Patel, S. and Zaveri, J. (2010) ‘A Risk-Assessment Model for Cyber Attacks on Information Systems’, Journal of Computers, Vol. 5, No.3,pp.352-359.
Ram, M.(2013) ‘ On System Reliability Approaches : a Brief Survey,’ International Journal of System Assurance Engineering and Management, Vol.4, Iss.2, pp.101-117.
18
Rewilak, J. (2011) ‘Characteristics of Quality Improvement The Proposal of Measurement The Process Improvement Managed by FMEA’, Advances in Manufacturing Science and Technology, Vol.35, No.4,pp.51-62.
Seyedhoseini, S.M. and Hatefi,M.A.(2009) ‘Two-Pillar Risk Management (TPRM) : A Generic Project Risk Management,’ Scientia Iranica Transaction E: Industrial Engineering, Vol.16, No.2, pp.138-148.
Shah, L. Ali, S. and Vernadat, F.(2009) ‘Maturity Assessment in Risk Management in Manufacturing Engineering,’ in Proceeding of the 2009 IEEE System Conference, Vancouver, Canada, March 23-26.
Sachdeva, A., Kumar, D. and Kumar, P.(2008) ‘ A Methodology to Determine Maintenance Criticality Using AHP,’ International Journal of Productivity and Quality Management, Vol.3, No.4, p.396-412.
Tahernejad, M.M., Khalokaie, R., and Ataie, M.(2011) ‘ Determining Proper Strategies for Iran’s Dimensional Mines : a SWOT-AHP Analysis,’ Arab Journal of Geoscience, Vol.6, Iss.1, pp.129-139
Trzcieliňski, S. and Trzcieliňska, J. (2011) ‘Some Elements Of The Theory Of Opportunities,’ Human Factors and Ergonomics in Manufacturing and Service Industries, Vol.21, Iss.2,pp. 124-131.
Tanik, M.(2010) ‘ Improving “Order Handling” Process by Using QFD and FMEA’, International Journal of Quality and Reliability Management, Vol.27, Iss.4, pp.404-423.
Wielle, T.V. Iwardeen, J.V.William, R. and Eldridge, S.(2011) ‘A New Foundation For Quality Management In The Business Environment Of The Twenty First Century’, Total Quality Management and Business Excellence, Vol.22,Iss. 5, pp.587-598.
Waterworth, A., and Eldridge, S.(2011) ‘ The Development of an E-Commerce FMEA,’ International Journal of Productivity and Quality Management, Vol.8, No.3, pp.247-264.
Wheelen, T.L., and Hunger, J.D.(2008) Concepts in Strategic Management and Business Policy: Eleventh Edition, Pearson Prentice Hall, New Jersey.
Wang, Y. Deng, C.J.W. Wang, Y. and Xiong, Y. (2014) ‘A Corrective Action Scheme for Engineering Equipments’, Engineering Failure Analysis, Vol.36, pp.269-283.
Yin, R.K. (1994) Case Study Research : Design and Methods-2nd Edition, Sage Publisher.London. Zaman, A.S.M. and Anjalin, U. (2011) ‘Evolution of Service: Importance, Competitiveness and
Sustainability in the New Circumstances’, Journal of Service Science and Management, Vol.4, No.3, pp.253-260.
Table 1. The Maturity Index on Business Opportunity (MIBO) (modified from Shah et al. 2009)
Rating Criteria Characteristics
0 Organization is ignoring and unable to
recognize the existence of business
opportunities
Unaware of the importance of opportunity recognition
No resource available to determine opportunity recognition
1 Organization is starting to recognize the
opportunity, but determination of
opportunity is still accomplished
Opportunity is monitored and analyzed but accomplished qualitatively and occasionally.
19
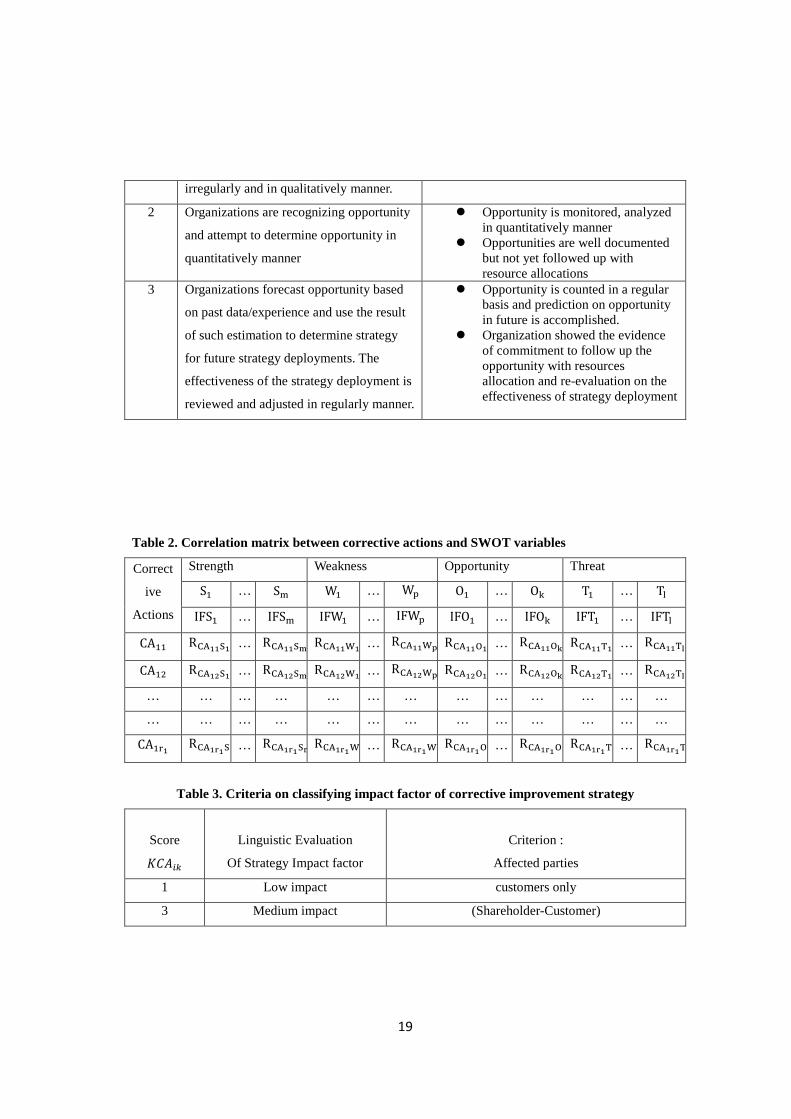
irregularly and in qualitatively manner.
2 Organizations are recognizing opportunity
and attempt to determine opportunity in
quantitatively manner
Opportunity is monitored, analyzed in quantitatively manner
Opportunities are well documented but not yet followed up with resource allocations
3 Organizations forecast opportunity based
on past data/experience and use the result
of such estimation to determine strategy
for future strategy deployments. The
effectiveness of the strategy deployment is
reviewed and adjusted in regularly manner.
Opportunity is counted in a regular basis and prediction on opportunity in future is accomplished.
Organization showed the evidence of commitment to follow up the opportunity with resources allocation and re-evaluation on the effectiveness of strategy deployment
Table 2. Correlation matrix between corrective actions and SWOT variables
Correct
ive
Actions
Strength Weakness Opportunity Threat
S1 … Sm W1 … Wp O1 … Ok T1 … Tl
IFS1 … IFSm IFW1 … IFWp IFO1 … IFOk IFT1 … IFTl
CA11 RCA11S1 … RCA11Sm RCA11W1 … RCA11Wp RCA11O1 … RCA11Ok RCA11T1 … RCA11Tl
CA12 RCA12S1 … RCA12Sm RCA12W1 … RCA12Wp RCA12O1 … RCA12Ok RCA12T1 … RCA12Tl
… … … … … … … … … … … … …
… … … … … … … … … … … … …
CA1r1 RCA1r1S1 … RCA1r1Sm
RCA1r1W … RCA1r1Wp RCA1r1O
… RCA1r1Ok RCA1r1T1
… RCA1r1T
Table 3. Criteria on classifying impact factor of corrective improvement strategy
Score
𝐾𝐾𝐵𝐵𝐵𝐵𝑖𝑖𝑘𝑘
Linguistic Evaluation
Of Strategy Impact factor
Criterion :
Affected parties
1 Low impact customers only
3 Medium impact (Shareholder-Customer)
20
6 High Impact Employee – Shareholder- Customer
Table 4. A Matrix depicting the BCOR2 Components
Impact Components Effort Component
Failure Mode RPN PCSA WCAIK OCA ICCA LCA ORCA RCA
𝐼𝐼𝑀𝑀1 𝑅𝑅𝑃𝑃𝑅𝑅1 𝑃𝑃𝐵𝐵𝐵𝐵11 𝑊𝑊𝐵𝐵𝐵𝐵11 𝑂𝑂𝐵𝐵𝐵𝐵11 𝐼𝐼𝐵𝐵𝐵𝐵𝐵𝐵11 𝐿𝐿𝐵𝐵𝐵𝐵11 𝑂𝑂𝑅𝑅𝐵𝐵𝐵𝐵11 𝑅𝑅𝐵𝐵𝐵𝐵11
𝐼𝐼𝑀𝑀2 𝑅𝑅𝑃𝑃𝑅𝑅2 𝑃𝑃𝐵𝐵𝐵𝐵12 𝑊𝑊𝐵𝐵𝐵𝐵12 𝑂𝑂𝐵𝐵𝐵𝐵12 𝐼𝐼𝐵𝐵𝐵𝐵𝐵𝐵12 𝐿𝐿𝐵𝐵𝐵𝐵12 𝑂𝑂𝑅𝑅𝐵𝐵𝐵𝐵12 𝑅𝑅𝐵𝐵𝐵𝐵12
… … … … … … … … …
… … … … … … … … …
𝐼𝐼𝑀𝑀𝑘𝑘 𝑅𝑅𝑃𝑃𝑅𝑅𝑘𝑘 𝑃𝑃𝐵𝐵𝐵𝐵𝑖𝑖𝑘𝑘 𝑊𝑊𝐵𝐵𝐵𝐵𝑖𝑖𝑘𝑘 𝑂𝑂𝐵𝐵𝐵𝐵𝑖𝑖𝑘𝑘 𝐼𝐼𝐵𝐵𝐵𝐵𝐵𝐵𝑖𝑖𝑘𝑘 𝐿𝐿𝐵𝐵𝐵𝐵𝑖𝑖𝑘𝑘 𝑂𝑂𝑅𝑅𝐵𝐵𝐵𝐵𝑖𝑖𝑘𝑘 𝑅𝑅𝐵𝐵𝐵𝐵𝑖𝑖𝑘𝑘
Determination on Critical Failure
modes and their possible causes
Start
Scanning and determining impact
factor of SWOT Variables
Determination on Corrective
Action Options
Matching Corrective Action
Options in SWOT- CA Matrix
Selecting Corrective Actions
with the largest Preference
Determination on the score of
BCOR2 Elements
Determination and selection of
Corrective Action based on the
C i A i d
21
Figure 1. A Chart Depicting Integration of SWOT analysis into FMEA
Table 5. FMEA Sheet of Case Example in Gas Distribution Company
No Failure Mode Effects Possible Causes
1 Inaccurate gas order
forecasting
RPN = 108
a) Shortage of gas inventory
b) Loss Sale c) Company resource
wastage
1) Poor Forecasting 2) Inadequate marketing
research 3) Inappropriate customer
relationship management
2 Low gas fleet availability
RPN =140
a) Customers complaint b) Loss Sale c) Decrease Customers
loyalty
1) Poor Fleet Maintenance 2) Financial Shortage 3) Poor delivery planning
3 Lengthy distribution
administrative process
RPN = 90
a) Customer complaint b) Decrease in
company’s productivity
1) Poor administrative process
2) Ineffective administration
4 Mismatch on gas
dispatching documents
with gas identity data in
delivery process
a) Increasing Administrative time
b) Affect customers’ safety
1) Ineffective finished gas inspection procedures
2) Bad warehousing activities
22
RPN = 170
5 Unavailability of empty
gas tubes at customers’
place when picking time is
due
RPN = 112
a) Loss Sale b) Distributor loss time c) Escalation in picking
the empty gas tubes’ cost
1) Poor customers communication
2) Unclear picking time 3) Bad gas tube
circulation design
Table 6. Critical Failure Mode and Potential Corrective Action
Failure Mode Possible Cause Potential Corrective Action
Mismatch in gas
Dispatching Documents
with Gas Identity Data in
delivery process
RPN = 170
1) Ineffective Finished Gas Inspection procedures
2) Bad warehousing activities
1) Improving finished inspection procedures (CA11)
2) Strengthening collaborative inspection among gate security, outgoing inspection staff and fleet drivers (CA12)
3) Re-identifying gas tube colors and numbering models according to gas types (CA14)
Low gas fleet availability
RPN =140
1) Poor fleet maintenance 2) Financial shortage 3) Poor delivery planning
1) Activating fleet checking list(CA21)
2) Increasing fleet spare part stocks(CA22)
23
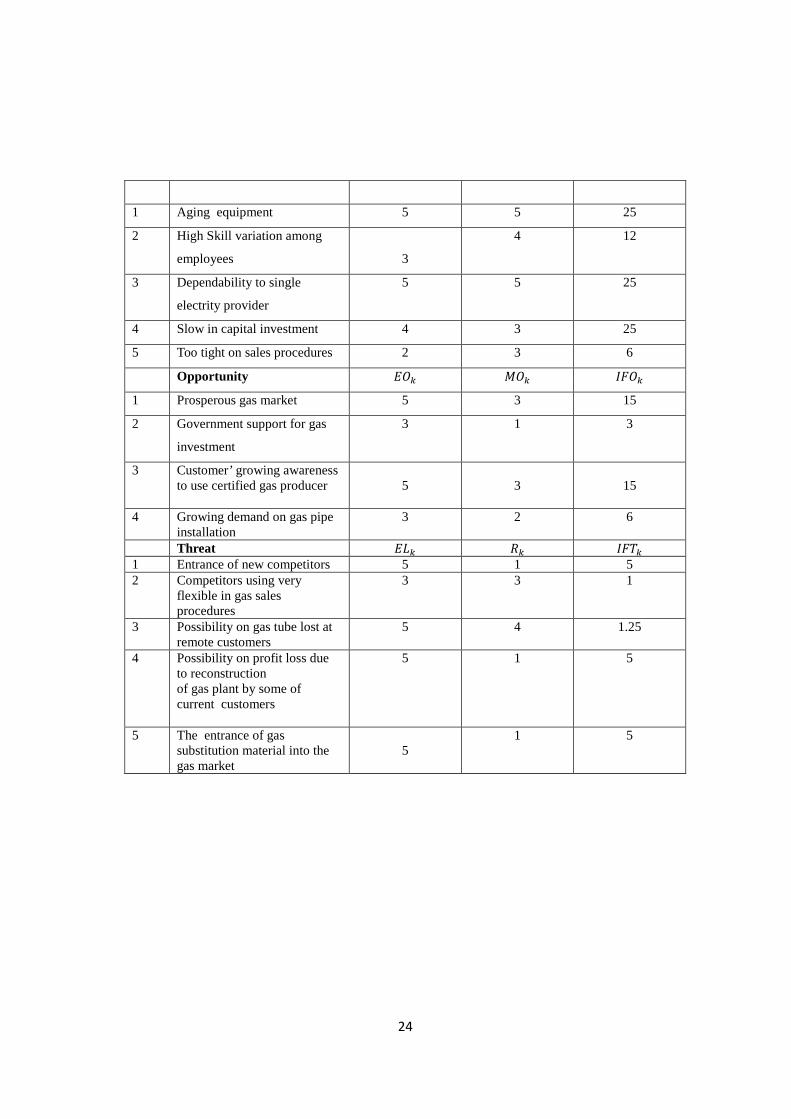
Table 7. Quantification of Impact Factor of SWOT Variable
SWOT Variables Quantification Criteria Impact Factor
IF
NO Strength 𝐵𝐵𝑆𝑆𝑘𝑘
𝐵𝐵𝐵𝐵𝑆𝑆𝑘𝑘
𝐼𝐼𝐼𝐼𝑆𝑆𝑘𝑘
1 Possessing strong financial
liquidity
5 5 25
2 Good company reputation 4 3 12
3 High ability to produce various gas types as demanded by different custmers
5 5 25
4 Certified gas producer 5 5 25
5 Possesing good gas
networking
5 5 25
Weakness 𝑆𝑆𝑊𝑊𝑘𝑘 𝐷𝐷𝑊𝑊𝑘𝑘 𝐼𝐼𝐼𝐼𝑊𝑊𝑘𝑘
24
1 Aging equipment 5 5 25
2 High Skill variation among
employees
3
4 12
3 Dependability to single
electrity provider
5 5 25
4 Slow in capital investment 4 3 25
5 Too tight on sales procedures 2 3 6
Opportunity 𝐸𝐸𝑂𝑂𝑘𝑘 𝑀𝑀𝑂𝑂𝑘𝑘 𝐼𝐼𝐼𝐼𝑂𝑂𝑘𝑘
1 Prosperous gas market 5 3 15
2 Government support for gas
investment
3 1 3
3 Customer’ growing awareness to use certified gas producer
5
3
15
4 Growing demand on gas pipe installation
3 2 6
Threat 𝐸𝐸𝐿𝐿𝑘𝑘 𝑅𝑅𝑘𝑘 𝐼𝐼𝐼𝐼𝑇𝑇𝑘𝑘 1 Entrance of new competitors 5 1 5 2 Competitors using very
flexible in gas sales procedures
3 3 1
3 Possibility on gas tube lost at remote customers
5 4 1.25
4 Possibility on profit loss due to reconstruction of gas plant by some of current customers
5 1 5
5 The entrance of gas substitution material into the gas market
5
1 5
25
Table 8. Correlation Matrix of SWOT Variable and Corrective Actions
Failure Mode
Mismatch in gas dispatching
documents with gas Identity
data in delivery process
RPN = 170
Low gas fleet availability
RPN =140
SWOT
Variable
Impact
Factor
CA11 CA12 CA13 CA21 CA22
Strength S1 25 0.8 0 0 0 0
S2 12 0.4 0.9 0.6 1 0.9
S3 25 0.9 0.6 1 0.3 0
S4 25 0.1 0.7 0.7 0 0
S5 25 0 0.9 0.3 0.9 0.9
Weakness
W1 25 0 0 0 0 -0.3
W2 12 0.7 -0.9 0 -0.1 0
W3 25 0 0 0 0 0
W4 25 0.2 0 0.3 0 0.3
26
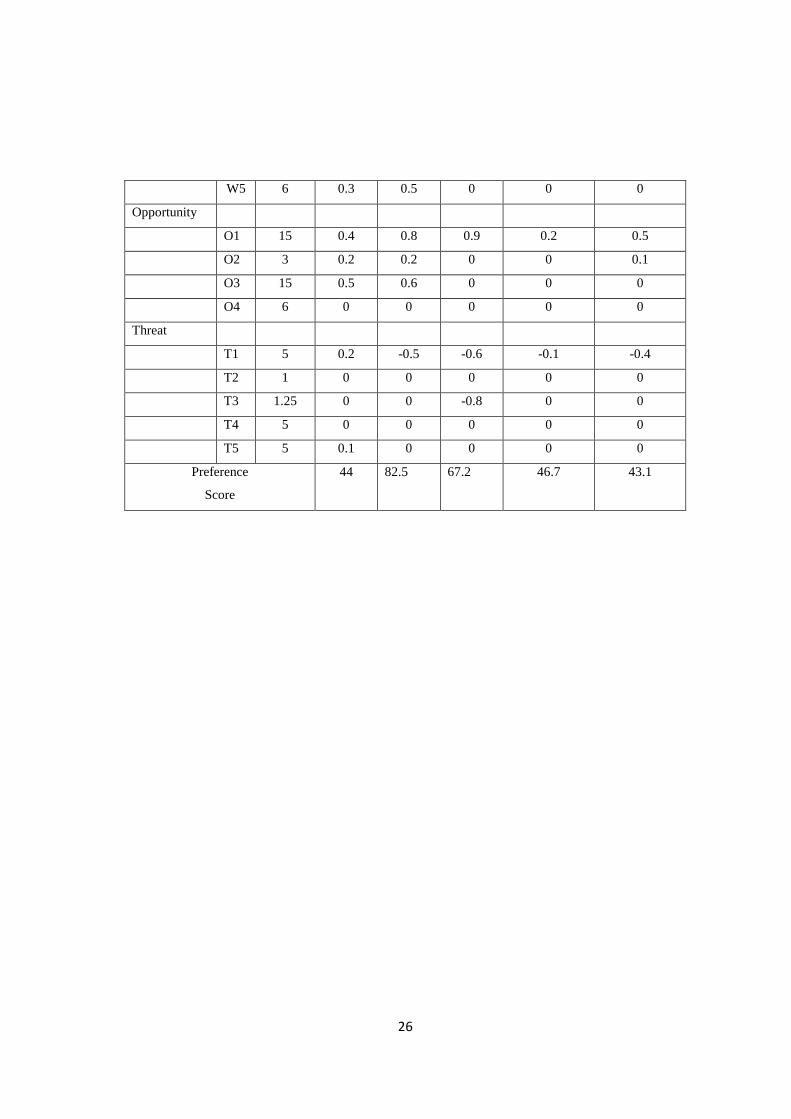
W5 6 0.3 0.5 0 0 0
Opportunity
O1 15 0.4 0.8 0.9 0.2 0.5
O2 3 0.2 0.2 0 0 0.1
O3 15 0.5 0.6 0 0 0
O4 6 0 0 0 0 0
Threat
T1 5 0.2 -0.5 -0.6 -0.1 -0.4
T2 1 0 0 0 0 0
T3 1.25 0 0 -0.8 0 0
T4 5 0 0 0 0 0
T5 5 0.1 0 0 0 0
Preference
Score
44 82.5 67.2 46.7 43.1
27
Table 9. Impact and Effort Ratio of each CA of Case Example
Impact Components Effort Components
𝐼𝐼𝑀𝑀𝑘𝑘 𝐵𝐵𝐵𝐵𝑖𝑖𝑘𝑘 𝑃𝑃𝑆𝑆𝐵𝐵𝐵𝐵𝑖𝑖𝑘𝑘 𝑊𝑊𝐵𝐵𝐵𝐵𝑖𝑖𝑘𝑘 𝑂𝑂𝐵𝐵𝐵𝐵𝑖𝑖𝑘𝑘 𝐼𝐼𝐵𝐵𝐵𝐵𝐵𝐵𝑖𝑖𝑘𝑘 𝐿𝐿𝐵𝐵𝐵𝐵𝑖𝑖𝑘𝑘 𝑂𝑂𝑅𝑅𝐵𝐵𝐵𝐵𝑖𝑖𝑘𝑘 𝐵𝐵𝐵𝐵𝐼𝐼𝑖𝑖𝑘𝑘 Mismatch in gas
dispatching documents
with gas Identity data in
delivery process
RPN = 170
Improving finished
Inspection procedures
(CA11)
44 0.2098 0.4545 0.4053 36 4 12.220
Strengthening
collaborative
Inspection among gate
security,
Outgoing inspection
staff and fleet drivers
(CA12)
82.5 0.5499
0.4546 0.4085 196 3 14.596
Re-identifying gas tube
colors
And numbering models
According to gas types
(CA13)
67.2 0.2402 0.0909 0.1852 64 7 3.006
Low gas
Fleet availability
Activating
fleet check list(CA21)
46.7 0.3772 0.2191 0.6550 36 4 5.728
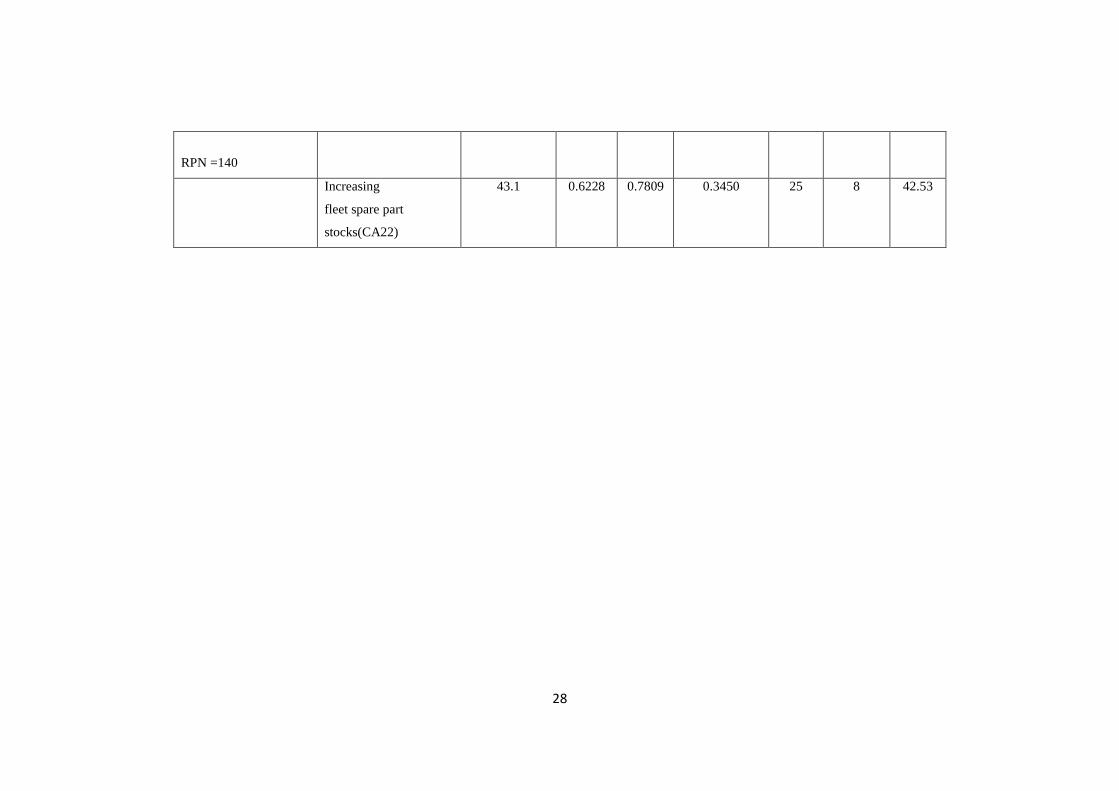
28
RPN =140
Increasing
fleet spare part
stocks(CA22)
43.1 0.6228 0.7809 0.3450 25 8 42.53

29
Keywords: FMEA, SWOT Analysis, BCOR, Organizational Readiness, Corrective Action.