Embed Size (px)
Citation preview

D 4.1 GA No. 731287 1 Co-funded by the Horizon 2020 Framework
Programme of the European Union
Integrating National Research Agendas on Solar Heat
for Industrial Processes
Project Deliverable D 4.1
Mass/energy balances and solar chemical
reactor concepts
D 4.1 – MASS/ENERGY BALANCES AND SOLAR CHEMICAL REACTOR CONCEPTS
WP 4 - Technology and applications to high temperature SHIP (400 °C to
1500 °C)
Due date: M24 (December 2018)
Submitted M29 (May 2019)
Partner responsible D4.1 ETHZ
Person responsible Vikas Patil, Aldo Steinfeld
Reviewed/supervised by: Vikas Patil, Aldo Steinfeld
GA Number 731287
Start of the project January 2017
Duration of the project 48 months (January 2017-December 2020)
DISSEMINATION LEVEL
PU (Public)
NATURE OF THE DELIVERABLE
R (Report)
HISTORY
Author Date Comments
Vikas Patil 08.02.2019 First draft submitted
Vikas Patil 17.05.2019 Revisions incorporated
Vikas Patil 21.05.2019 Draft accepted & finalized
Ref. Ares(2019)3349886 - 22/05/2019

Deliverable Report
D 4.1 GA No. 731287 2 Co-funded by the Horizon 2020 Framework
Programme of the European Union
Contents
1. Content of this Deliverable .......................................................................................................................... 3
2. Solar metals production for the metallurgical industry .......................................................................... 3
2.1. Aluminum ................................................................................................................................................ 3
2.2. Magnesium ........................................................................................................................................... 12
2.3. Copper .................................................................................................................................................. 15
2.4. Tin ............................................................................................................................................................ 18
3. Lime processing from limestone ................................................................................................................ 26
3.1. Solar hybridization for cement production .................................................................................... 26
3.2. Particle based gravity driven solar receiver development for solar lime ................................. 33
3.3. Thermal performance and transient operation of a solar receiver .......................................... 36
4. Solar fuels production from H2O and CO2 via redox cycles ................................................................ 39
4.1. Solar receiver–reactor for thermochemical redox cycling using ceria .................................... 41
4.2. Thermal performance of a lab-scale ceramic volumetric air receiver .................................... 44
4.3. Mass and energy balances expected for a metallic volumetric receiver .............................. 47
5. Fuels production from agricultural waste via gasification ................................................................... 51
5.1. Solar reactor concepts for gasification of carbonaceous materials ........................................ 51
5.2. Co-production of syngas and potassium-based fertilizer by solar-driven thermochemical
conversion of crop residues ........................................................................................................................... 53
6. Degree of progress ...................................................................................................................................... 57
7. Dissemination ................................................................................................................................................ 58
8. References .................................................................................................................................................... 59

Deliverable Report
D 4.1 GA No. 731287 3 Co-funded by the Horizon 2020 Framework
Programme of the European Union
1. Content of this Deliverable
Solar thermochemical processes make use of concentrated solar radiation as the energy source of
process heat to drive endothermic reactions. Three categories of high-temperature energy-
intensive processes are considered: i) solar metallurgy, ii) solar lime, and iii) solar fuels. To provide the
high-temperature solar reactors with highly concentrated sunlight, specific solar optics
technologies are required.
Work Package 4 of the INSHIP project (WP4: Technology and applications to high temperature SHIP
(400 °C to 1500 °C)) aims at advancing the development of high temperature/high-flux solar
chemical reactor technologies and concepts. One of the objectives is feasibility assessment of solar
chemical reactor technologies for metallurgical processes, lime production and solar fuels
production.
In line with this objective, this Deliverable report consolidates analyses carried out by various
institutes under the INSHIP consortium (until the end of year 2018) – both theoretical as well as
experimental – related to the mass and energy balances of the targeted high-temperature
industrial processes and related solar chemical reactor concepts.
2. Solar metals production for the metallurgical industry
The extractive metallurgical industry is a major consumer of high-temperature process heat. It is,
consequently, a major contributor of CO2 emissions derived from the combustion of fossil fuels for
heat and electricity generation. The amount of fuel needed to reduce metal oxides to metals
could be substantially reduced if process heat were supplied by an alternative clean energy
source. Concentrated solar thermal energy can provide the high-temperature process heat
required to drive these highly endothermic reactions. The candidate processes are the productions
of aluminum, magnesium, copper and tin from their ores.
The following sections provide an overview of the work carried out by INSHIP members under Task
4.1 of WP4 (Solar metals production for the metallurgical industry).
2.1. Aluminum
Aluminum production can be considered as a two-stage process. The first stage is from ore to
alumina purification and smelting. The second stage is from alumina to metallic aluminum. The most
common process for the first stage is the Bayer process while for the second stage the most
common one is the Hall-Heroult process by electrochemical reduction. The Bayer process produces
high-purity alumina which is essential for the downstream Hall-Heroult electrolytic process. However,
an important fall-out of this process is the toxic “red mud”, which is one of the most challenging
disposal problems.
Alternatively, the Bayer process can be substituted by a calcination process, and the Hall-Heroult
electrolytic process can be substituted by a carbothermic reduction process. Both thermochemical
processes are energy intensive and proceed at high temperatures, and thus can be driven by solar
process heat, as described in the following sub-sections.

Deliverable Report
D 4.1 GA No. 731287 4 Co-funded by the Horizon 2020 Framework
Programme of the European Union
2.1.1. Solar hybridization paths for the Bayer process
This section has been prepared by the Middle East Technical University (METU), Turkey.
We targeted Seydisehir Aluminum plant in Konya Province of Turkey for mass and energy balances.
We could not get any response to our direct data collection attempts from the plant. However, we
obtained enough data for modelling the plant from a METU thesis dealing with Alumina production
in Seydisehir plant by Kurucak [1] and from a conference paper written by the plant personnel,
Avcu et al. [2]. Seydisehir plant produces Alumina and various Aluminum products but the thesis [1]
only deals with the Bayer process for alumina production.
Solar hybridization of both the Bayer and Hall-Heroult processes may be possible targeting their high
temperature heat input requirements. However, at METU, we plan to concentrate on identifying
solar hybridization paths for the Bayer process which is the most heat intensive one between the
two processes.
We plan to model Seydisehir Aluminum plant Bayer process using the obtained mass and energy
flows among the components of the plant. In the thesis [1], there is a review of process modelling
studies that can be useful in development of our own models. In addition to several studies dealing
with mass and energy balances of alumina production, there are also many other studies
concentrating on reduction of alumina (e.g. Obaidat et al. [3], Gusberti et al. [4] and Balomenos et
al. [5][6]) and these will also be useful in our modelling studies.
The model of the plant is expected to be useful in identification of solar hybridization options for the
plant. After confirming the accuracy of simulation results, solar input at the plant location will be
obtained for decided time periods and time dependent simulations with and without solar
hybridization will be done. From the comparison of the results of simulations, we expect to see how
useful solar hybridization will be in reducing fossil fuel use of the plant.
Table 1 Flow rates of major streams in Figure 1(from [2])
Major streams Stream number in Figure Flow rates (kg/h)
Bauxite S01 48826
Strong liquor S02 7396
Wash water S15 120000
Red mud S27 60626
Hydrate (Al(OH)3) S40 36686
Table 2 Composition of Bauxite (data from [2])
Al2O3 55.63%
SiO2 6.86%
CO2 0.83%
CaO 1.20%
Fe2O3 17.39%
Amorph 3.27%
H2O(s) 12.36%
H2O(l) 2.47%

Deliverable Report
D 4.1 GA No. 731287 5 Co-funded by the Horizon 2020 Framework
Programme of the European Union
Fig
ure
1:
Flo
w s
he
et
of
Se
yd
ise
hir A
lum
inu
m P
lan
t (f
rom
[2])

Deliverable Report
D 4.1 GA No. 731287 6 Co-funded by the Horizon 2020 Framework
Programme of the European Union
Figure 2 Heating and evaporation flow sheet [2]
Table 3 Descriptions of streams and units in heating and evaporation flow sheet [1]
STREAMS Description UNITS Description
S41 Spent liquor from precipitation U-23 Heat exchanger
S43 Spent liquor to digestion U-24 Flash drum
S44 Steam U-25 Mixer
S46 Water
S47 Steam
S48 Steam
Table 4 Mass balance for heating and evaporation section [1]
Inlet streams (kg/h) Outlet streams (kg/h)
S41 S47 S48 TOTAL S43 S44 S46 TOTAL
Al2O3 0 0 0 0 0 0 0 0
SiO2 0 0 0 0 0 0 0 0
Na2O 0 0 0 0 0 0 0 0
CO2 0 0 0 0 0 0 0 0
CaO 0 0 0 0 0 0 0 0
Fe2O3 0 0 0 0 0 0 0 0
Amorph 0 0 0 0 0 0 0 0
H2O(s) 0 0 0 0 0 0 0 0
NaAlO2 25626 0 0 25626 25626 0 0 25626
NaOH 25812 0 0 25812 25812 0 0 25812
Na2CO3 105574 0 0 105574 105574 0 0 105574
H2O 185654 10116 21854 217624 108793 76861 31970 217624
TOTAL 342666 10116 21854 374636 265805 76861 31970 374636

Deliverable Report
D 4.1 GA No. 731287 7 Co-funded by the Horizon 2020 Framework
Programme of the European Union
2.1.2. Solar calcination of alumina
This section has been prepared by the Swiss Federal Institute of Technology (ETH), Zurich,
Switzerland based on Ref. [7].
Alumina is an intermediate product in the production of aluminum and is also a product in its own
right. Alumina refining accounts for approximately 27% of the primary energy used in aluminum
production, over 90% of which is provided by the combustion of fossil fuels [8]. A total of 115.2 million
tons of alumina was produced globally in 2015 at an average energy intensity of 11.9 GJ/ton-
alumina, representing a significant contribution to GHG emissions [9]. Calcination is the last step of
the Bayer process, which heats the hydrated alumina (aluminum hydroxide or gibbsite, Al(OH)3)
from the precipitation stage, to drive off the water of hydration and form anhydrous alumina
(aluminum oxide, Al2O3). It is an energy-intensive process, which has historically been conducted
with the use of fossil fuels and a rotary-kiln [10]. However, since the oil crisis of the 1970s, with the
resulting increase in the cost of fuels, stationary calciners (circulating fluidised bed, gas suspension
and fluid-flash calciners) have been favored over rotary-kilns due to their significantly reduced fuel
consumption [11,12]. The process heat requirements of modern industrial calciners and estimated
resulting CO2 emissions (calculated from the combustion of methane) are now approximately
3 GJ/ton-alumina and 165 kg-CO2/ton-alumina product, respectively, for which the predominant
fuel is natural gas [13,14]. Today, the increasing cost of fuels continues to be a driver for
technological development of more fuel efficient alumina calciner technology [15]. With the price
of natural gas forecast to increase in some locations such as Australia [13], and with the global
need to reduce GHG emissions, there is strong incentive to seek alternative energy sources such as
CST for process heat [16]. This provides the motivation for ongoing investigations.
The calcination of alumina is a thermal decomposition chemical reaction, which proceeds
endothermically according to the following reaction:
( 1 )
The enthalpy change of this reaction is 185 kJ/mol. Modern plants typically process alumina
(generally in the gibbsite form) within flash calciners using particles of ~100 µm in diameter
transported in a gas suspension through the reactor with residence times on the order of a few
seconds. A solar reactor that processes powders of similar size to a flash calciner is the solar vortex
transport reactor. This employs a vortex flow to transport particles in suspension through an
irradiation zone where they undergo high heating rates to drive a thermochemical reaction. Direct
solar irradiation of such a suspension of reacting particles is an efficient means of heat transfer to
the reactants [17–20]. Furthermore, the temperature at which alumina calcination takes place in
the Bayer process, 1273 – 1373 K, is readily achievable in current commercially available solar tower
concentrators [16] and is significantly less than the 1750 K that has been achieved previously in the
solar vortex transport reactor used for solar gasification [21]. The potential for alumina to be
calcined with CST has been assessed with a packed bed of boehmite (an aluminum oxyhydroxide)
in a crucible positioned at the focal plane of a Fresnel concentrator by Padilla et al. [22]. They
reported 75% conversion after 10 minutes of exposure to solar radiation concentrated to 2644 suns
and full conversion with exposure time of 90 minutes. However, to date, no assessments have been
reported for the calcination of gibbsite in a practical reactor under conditions relevant to flash
calcination. The industrial gibbsite calcination process shares similarities with the calcination of
limestone, which takes place at ~1150 K and has previously been demonstrated with the
application of CST [23–26]. This demonstration has been performed with direct irradiation in a
cavity-receiver transporting a flow of entrained particles [23], which suggests that it may also be

Deliverable Report
D 4.1 GA No. 731287 8 Co-funded by the Horizon 2020 Framework
Programme of the European Union
suitable for alumina calcination. It is also noteworthy that the alumina calcination process is
sensitive to the gas-phase composition, which is one reason that natural gas is a preferred fuel for
alumina production [27,28]. The application of CST to the calcination process has the potential to
further improve product quality by eliminating the possibility of contamination with combustion
products and by reducing the significance of back-reactions from the presence of H2O, which is a
product of combustion. While these reasons suggest that the alumina calcination process is
potentially well suited to solar processing, its technical feasibility cannot be determined by
implication. Due to the complex, coupled nature of the process, it is necessary to assess this
experimentally with a prototype solar reactor.
In summary, the calcination stage of alumina refining with the Bayer process is potentially well
suited to the application of CST because it is a highly endothermic process that proceeds at
~1273 K, which is readily achievable with solar tower technology. In addition, the calcination
process is not sensitive to some ingress of air, which raises the possibility that direct irradiation of
particles may be achievable without the need for a window to completely seal a solar reactor.
2.1.3. Solar carbothermic reduction of alumina
This section has been prepared by the Swiss Federal Institute of Technology (ETH), Zurich,
Switzerland based on Ref. [29].
The production of aluminum via the Hall-Héroult electrolytic process is characterized by its high
energy consumption, approximately 45 GJ/ton Al, and its associated high specific greenhouse gas
emissions, 4.9-7.4 ton CO2-equiv/ton Al [30–32]. The alternative path via carbothermal reduction of
Al2O3 can be represented by the overall reaction:
Al2O3 + 3C = 2Al + 3CO ( 2 )
The enthalpy change of this reaction is 1345 kJ/mol. However, reaction (2) is complicated by the
formation of undesired byproducts such as aluminum carbide Al4C3, oxy-carbides Al2OC and
Al4O4C, and the lower valence oxide Al2O [33,34]. One approach to overcome this difficulty was to
reduce the Al2O-Al-CO gas mixture by carbon at about 2273 K (2000oC) [35]. According to the Le
Chatelier principle, the extent of the chemical reaction should be favored by a decrease in the
total gas pressure. Thus, under vacuum conditions, the equilibrium of reaction (2) should be shifted
to the right and the onset temperature for the metal production should be significantly lowered.
This principle had been successfully applied in the production of magnesium and silicon. The
carbothermal reduction of MgO in calcined dolomite yielded Mg using a moderate vacuum of
1.33 millibar at 1673 K (1400°C) [36]. The silicothermic reduction of CaO-MgO in the industrial
Pidgeon process for magnesium was achieved by reacting CaO-MgO with ferrosilicon in
evacuated retorts at 1450-1800 K (1177-1527°C) and less than 1.33·10-4 bar [37–39]. The production
of Si by vacuum carbothermal reduction of SiO2 in the range 1997–2263 K (1724-1990°C) at ~3×10⁻³
bar yielded Si/SiO2 mixtures condensed from the gas phase, with 79 wt.% Si content [40].
As it will be shown in the analysis that follows, reaction (2) is highly endothermic (ΔH°298K = 1344
kJ/mol) and proceeds at above about 1500 K (1227°C) when operating at 10-4 bar. The use of
concentrated solar energy as the source of high-temperature process heat reduces significantly
the discharge of greenhouse gases and other pollutants derived from the combustion of fossil fuels
[41,42]. Previous relevant metallurgical processes performed in solar furnaces include the
carbothermal and methanothermal reductions of Fe3O4, MgO, ZnO, and SiO2 to produce Fe, Mg,
Zn, and Si, respectively [40,43–46], the carbothermal reductions of Al2O3, CaO, SiO2, and TiO2 in an
Ar flow to produce Al4C3, CaC2, SiC, and TiC, respectively [46], and the carbothermal reductions of

Deliverable Report
D 4.1 GA No. 731287 9 Co-funded by the Horizon 2020 Framework
Programme of the European Union
Al2O3, SiO2, TiO2, and ZrO2 in a N2 flow to produce AlN, Si3N4, TiN, and ZrN, respectively [46–48]. The
present study examines thermodynamically the vacuum carbothermal reduction of Al2O3, and
demonstrates experimentally the production of Al using a biomass-based reducing agent and
simulated concentrated solar energy.
Thermodynamic Analysis
Thermochemical equilibrium computations were carried out using the FactSage code [49].
Reaction enthalpies were calculated using NIST webbook data [50] and HSC Outokumpu code
[51]. The equilibrium compositions as a function of temperature for the system Al2O3 + 3C at 1, 10-5,
and 10-6 bar are shown in Figures Figure 3-Figure 5. As observed in Figure 3, at atmospheric pressure,
the production of elementary Al(g) essentially free of Al2O and Al4C3 is thermodynamically
favorable above 2800 K (2527°C), i.e. at a practically prohibitive high temperature. Figures Figure 4
and Figure 5 show that lowering the gas pressure to 10-5 or 10-6 bar not only shifts the formation of
Al(g) to much lower temperatures, but also frees the Al(g) production from the undesired by-
products Al2O and Al4C3 already at more accessible temperatures. The temperatures for the onset
of Al formation at about 0.001% conversion of Al2O3 to Al for gas pressures of 10-6 to 1 bar are listed
in Table 5. At 1800 K (1527°C) and 10-4 bar, the system in equilibrium is mainly composed of a gas
mixture containing 40% Al(g) - 60% CO(g), with small traces of Al2O(g).
In a preliminary environmental evaluation of the potential of such a vacuum thermochemical
process it is assumed that either concentrated solar radiation or coal combustion are applied as
the energy source of process heat. Further, it is proposed that the CO released would be water-gas
shifted to syngas, followed by methanol synthesis, as shown in Table 6. The total enthalpy change of
the reaction was calculated in two steps: 1) for the stoichiometric reaction Al2O3(s) + 3C(gr) = 2Al(g)
+ 3CO(g) at 1 bar and 1800oK (1527°C), ΔH = 1941.1 kJ/mol Al2O3; 2) for the theoretical work of
isothermal expansion of the product gases at 1800 K (1527°C) from 1 to 10-4 bar, ΔG = nRTlnp = 698
kJ/mol Al2O3. Thus, the total theoretical heat and work input would amount to 49 GJ/ton Al, and
comparable to that in the Hall-Héroult electrolytic process. In case the reducing agent is derived
from a biomass source, the solar-driven carbothermal reduction would be CO2 neutral.
Table 5 Equilibrium temperatures for the onset of Al formation at 10-5 mole fraction for the system Al2O3 + 3C.
Extracted from Ref. [29].
Pressure [bar] Temperature [K]
10-6 1370 10-5 1465
10-4 1580
0.001 1703
0.01 1855
0.1 2037
0.5 2190
1.0 2258

Deliverable Report
D 4.1 GA No. 731287 10 Co-funded by the Horizon 2020 Framework
Programme of the European Union
Table 6 Preliminary evaluation of the annual co-production Al and CH3OH by vacuum carbothermic reduction
of Al2O3 from a mixture of Al2O3 and coke, initially at 300 K (27°C) and 1 bar, transformed at 1800 K and 10-4 bar
according to Equation 2. Process heat supplied either by concentrated solar energy or by coal combustion.
Extracted from Ref. [29].
Design Al2O3 feed (kmol/yr) 1.00x10⁶
Annual process heat (GJ/yr) 1.96x10⁶
Annual coke feed (ton/yr) 1.18x10⁶
Annual coal feed (ton/yr) 1 0.048x10⁶
Annual pumping energy (GJ/yr) 2 0.84x10⁶
Total annual fuel input (GJ/yr) 3 2.02x10⁶
Total annual fuel input (GJ/yr) 1 3.98x10⁶
Annual Al production (ton/yr) 4 0.040x10⁶
Annual methanol production (ton/yr) 5 0.0288x10⁶
Total annual CO2 release (ton/yr) 3 0.088x10⁶
Total annual CO2 release (ton/yr) 1 0.26x10⁶
1 Assuming coal combustion for process heat. 2 Assuming 50% efficiency in electricity production. 3 Assuming solar energy for process heat; Ton = metric ton. 4 Assuming 75% overall yield in production of Al. 5 Assuming 90% overall yield in the water-gas shift of 2/3 of CO to syngas, converted to methanol.
0
1
2
3
2200 2400 2600 2800 3000
Eq
uilib
riu
m c
om
po
sit
ion
[m
ol]
Temperature [K]
CO(g)
Al(g)
Al2O(g)
C(gr)
Al4C3(s)
Al2O3(s)
Figure 3: Variation of the equilibrium composition as a function of temperature for the system Al2O3 + 3C at 1
bar. Extracted from Ref. [29].

Deliverable Report
D 4.1 GA No. 731287 11 Co-funded by the Horizon 2020 Framework
Programme of the European Union
0
1
2
3
1400 1500 1600 1700
Eq
uilib
riu
m c
om
po
sit
ion
[m
ol]
Temperature [K]
CO (g)
Al (g)
Al2O (g)
C(gr)
Al4C3 (s)
Al2O3 (s)
Figure 4: Variation of the equilibrium composition as a function of temperature for the system Al2O3
+ 3C at 10-5 bar. Extracted from Ref. [29].
0
1
2
3
1300 1350 1400 1450 1500
Eq
uilib
riu
m c
om
po
sit
ion
[m
ol]
Temperature [K]
CO(g)
Al(g)
Al2O(g)
C(gr)
Al4C3(s)
Al2O3(s)
Figure 5: Variation of the equilibrium composition as a function of temperature for the system Al2O3 + 3C at
10-6 bar. Extracted from Ref. [29].
Deliverable Report
D 4.1 GA No. 731287 12 Co-funded by the Horizon 2020 Framework
Programme of the European Union
2.2. Magnesium
This section has been prepared by the Swiss Federal Institute of Technology (ETH), Zurich,
Switzerland based on Ref. [52].
Mg produced by electrolytic reduction of magnesium chloride is said to consume 40% more energy
per unit weight of metal as compared to Al production, ranging from 10-20 kWh per kg Mg, which
translates to at least 9 kg CO2 emitted per kg Mg produced when using coal-fired electricity. During
the last 20 years the Pidgeon process achieved a strong revival, particularly in China as the major
producer of Mg, reaching 72.5% of the world primary production of this metal [39]. However, this
process is plagued by severe environmental pollution along with heavy CO2 emissions [53]. Its
global warming impact has been estimated by a detailed life-cycle study to be 42 kg CO2-eq/kg
Mg [39]. Replacing fossil fuels by solar process heat for bringing the reactants to the operating
reactor temperature and for providing the enthalpy change of the reaction would significantly
reduce greenhouse gases emissions. CO2 emissions of a solar-driven process are those derived only
from the use of a carbonaceous reducing agent and should not exceed - assuming stoichiometric
carbothermic reduction - 1.83 kg CO2 per kg Mg, resulting in a 5-fold reduction vis-à-vis the
conventional fossil-driven electrolytic production. Furthermore, since the product gases evolved are
not contaminated by combustion byproducts, they are sufficiently valuable commodities to justify
their collection, eliminating inherent gas emissions to the environment.
The alternative path via carbothermal reduction of MgO can be represented by the overall
reaction:
MgO + C = Mg + CO ( 3 )
The enthalpy change of this reaction is 491 kJ/mol. Direct carbothermic reduction has been
developed at pilot scale by CSIRO in Australia [54,55] and by researchers in the USA [56]. The
availability of cheap carbon sources such as petroleum coke, charcoal, or char and the potential
capability of continuous operation are the main advantages of this process. Main challenge
concerns the quenching of the gaseous product necessary to prevent the formation of MgO
through the reverse reaction between magnesium vapor and carbon monoxide.
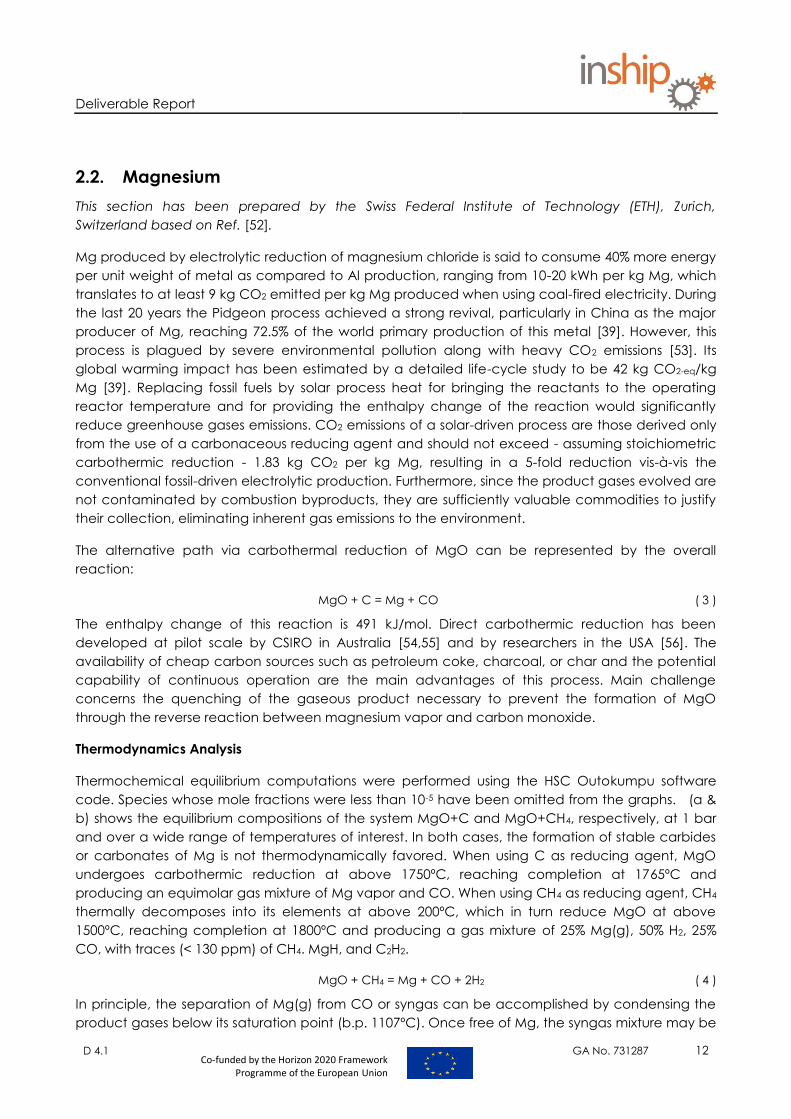
Thermodynamics Analysis
Thermochemical equilibrium computations were performed using the HSC Outokumpu software
code. Species whose mole fractions were less than 10-5 have been omitted from the graphs. (a &
b) shows the equilibrium compositions of the system MgO+C and MgO+CH4, respectively, at 1 bar
and over a wide range of temperatures of interest. In both cases, the formation of stable carbides
or carbonates of Mg is not thermodynamically favored. When using C as reducing agent, MgO
undergoes carbothermic reduction at above 1750ºC, reaching completion at 1765ºC and
producing an equimolar gas mixture of Mg vapor and CO. When using CH4 as reducing agent, CH4
thermally decomposes into its elements at above 200ºC, which in turn reduce MgO at above
1500ºC, reaching completion at 1800ºC and producing a gas mixture of 25% Mg(g), 50% H2, 25%
CO, with traces (< 130 ppm) of CH4. MgH, and C2H2.
MgO + CH4 = Mg + CO + 2H2 ( 4 )
In principle, the separation of Mg(g) from CO or syngas can be accomplished by condensing the
product gases below its saturation point (b.p. 1107ºC). Once free of Mg, the syngas mixture may be
Deliverable Report
D 4.1 GA No. 731287 13 Co-funded by the Horizon 2020 Framework
Programme of the European Union
cooled to ambient temperatures - by using heat exchangers to pre-heat reactants - and
recuperate part of the sensible heat of the products without fear of unwanted recombination
between H2 and CO since the reverse, methanation reaction is unlikely to occur in the absence of
a catalyst. Fast quenching rates may be required to avoid recombination of Mg and CO.
Adiabatic expansion through a Lavalle nozzle has been proposed for fast quenching [54].
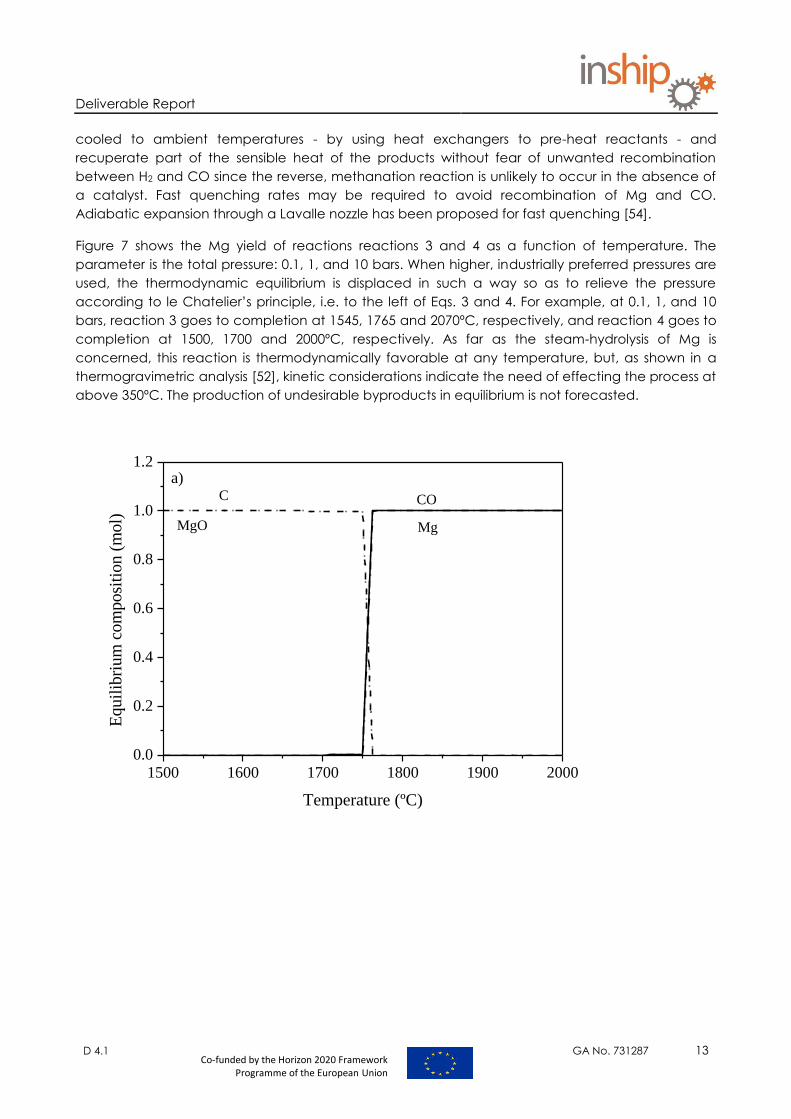
Figure 7 shows the Mg yield of reactions reactions 3 and 4 as a function of temperature. The
parameter is the total pressure: 0.1, 1, and 10 bars. When higher, industrially preferred pressures are
used, the thermodynamic equilibrium is displaced in such a way so as to relieve the pressure
according to le Chatelier’s principle, i.e. to the left of Eqs. 3 and 4. For example, at 0.1, 1, and 10
bars, reaction 3 goes to completion at 1545, 1765 and 2070ºC, respectively, and reaction 4 goes to
completion at 1500, 1700 and 2000ºC, respectively. As far as the steam-hydrolysis of Mg is
concerned, this reaction is thermodynamically favorable at any temperature, but, as shown in a
thermogravimetric analysis [52], kinetic considerations indicate the need of effecting the process at
above 350ºC. The production of undesirable byproducts in equilibrium is not forecasted.
1500 1600 1700 1800 1900 20000.0
0.2
0.4
0.6
0.8
1.0
1.2a)
CO
Mg
C
MgO
Equil
ibri
um
com
posi
tion (
mol)
Temperature (ºC)

Deliverable Report
D 4.1 GA No. 731287 14 Co-funded by the Horizon 2020 Framework
Programme of the European Union
200 400 600 800 1000 1200 1400 1600 1800 20000.0
0.5
1.0
1.5
2.0
2.5
CO
Mg
CH4
MgO
C
H2
b)
Equil
ibri
um
com
posi
tion (
mol)
Temperature (ºC)
Figure 6: Equilibrium compositions of the system (a) MgO + C, and (b) MgO + CH4, as a function
of temperature at 1 bar. Extracted from Ref. [52].
Figure 7: Mg yield for reactions 3 (“1a”) and 4 (“1b”) as a function of temperature and total pressure.
Extracted from Ref. [52].

Deliverable Report
D 4.1 GA No. 731287 15 Co-funded by the Horizon 2020 Framework
Programme of the European Union
2.3. Copper
This section has been prepared by the Middle East Technical University (METU), Turkey.
Copper is produced from copper sulfide concentrates by heating them to 1200-1250 °C in a
furnace and then oxidizing them with air or oxygen-enriched air. Oxidized particles melt into two
phases, a copper iron sulfide solution which is called matte and an iron silicate slag.
There are two types of copper smelting processes: reverberatory smelting and flash smelting. In
reverberatory smelting, the concentrate is reacted in a turbulent bath of matte, slag and gas. In
flash smelting, the exothermic reactions occur between air, or oxygen enriched air, and dispersed
concentrate particles similar to smelting in Alumina production.
Samsun Copper Plant in Turkey is targeted for obtaining process mass and energy balances. The
plant uses flash smelting and the plant data was collected and presented in a previous METU thesis
by Aidar Argyn [57]. At the site, there is an Outokumpu type flash smelter in operation since 1973.
Outokumpu flash smelting consists of injecting dry concentrate and preheated air or oxygen-
enriched air into a furnace. Feed enters through the top of a reaction shaft where it combusts with
the oxygen blast. Off-gases leave via a vertical uptake shaft at the other end of the furnace. The
concentrate particles should pass through dryers and preheaters before entering the furnace.
In the Samsun plant, most of the gases produced during smelting are converted to H2SO4. Also,
there is a flotation plant for processing and enrichment of the slag coming out from the flash
furnace.
In the thesis [57], starting with the flow sheet of the Samsun plant (shown in Figure 8) and flash
furnace parameters (Table 7), compositions of input and output flows for the flash furnace were
given as shown in Table 8. The material flow compositions among the components of the plant are
presented in Figure 9. The final results of the energy audit presented in the thesis are mass and
energy balances of flash smelting process for 1 ton of concentrate input as shown in Table 9 and
Table 10, respectively.
We plan to generate our own model of the plant streams using the information provided in [57] and
investigate the simulation results for a possible high temperature solar heat input. Solar hybridization
of a flash smelting plant may be kept limited to drying and preheating of the concentrated before
the flash furnace or may even involve a solar reactor that can replace part of the furnace. Time
dependent simulations we plan to perform will help us to evaluate various solar hybridization
options we have already identified.

Deliverable Report
D 4.1 GA No. 731287 16 Co-funded by the Horizon 2020 Framework
Programme of the European Union
Figure 8 Flowsheet of the Samsun plant (from [57])
Table 7 Parameters of flash furnace of the Samsun plant (data from [57])
Reaction air temperature 350-400°C
Amount of reaction air for 1 ton of feeding 650-800 m3/h
Feeding 35-40 tons/h
Concentration of SO2 in off-gases of flash
furnace
8-12%
Density of matte 4.7 g/cm3
Density of slag 3.7 g/cm3
Matte grade 45-50%
Copper in furnace slag 0.8-2%

Deliverable Report
D 4.1 GA No. 731287 17 Co-funded by the Horizon 2020 Framework
Programme of the European Union
Table 8 Compositions of input and output flows, %, Symbols in parenthesis overrides the column symbol (from
[57])
Materials Cu Pb Zn Fe S SiO2 Fe3O4 others
Input:
Cu concentrate 19.62 0.26 2.26 29.95 33.31 3.22 3.62 7.76
Flux 87 13
Input dust 20 5 10 25 7 3 - 30
Lignite 53 (C) 6 (H) 23.4
(O)
- 1 - - -
Natural gas (mol %) 85
(CH4)
8
(C2H6)
3
(C3H8)
1
(C4H10)
1
(CO2)
0.5
(O2)
1
(N2)
0.5
(S)
Blast (vol. %) - - 21 (O) 79 (N)
Output:
Matte 45 0.6 1.8 22 23 - 7.4 0.2
Furnace slag 1.5 0.1 3 41 2 30 6.5 15.9
Dust (collected
from Off-gas)
20 5 10 25 7 3 - 30
Off-gas Remainder of calculation
Figure 9 Material flow compositions of Samsun plant (from [57])

Deliverable Report
D 4.1 GA No. 731287 18 Co-funded by the Horizon 2020 Framework
Programme of the European Union
Table 9 Heat balance of flash smelting for 1 ton of concentrate (data from [57])
Inlet heat kJ
Heats evolved in exothermic reactions 2356747
Heat of process air (preheated air T=400°C) 511343
Heat of Lignite 302783
Heat of Natural Gas 833821
Total: 4004694
Outlet heat kJ
Heat of matte (T=1162°C) 315566
Heat of furnace slag (T=1190°C) 439370
Heat of off-gases (T=1263°C) 2437301
Heat of dust (T=1263°C) 82073
Heat loss of reaction shaft 730384
Total: 4004694
Table 10 Material balance of flash smelting for 1 ton of copper sulfide concentrate (from [57])
Materials kg m3
Inlet
Copper concentrate 1000
Flux 112.47
Lignite 28.52
Dust 72.83
Natural Gas 36.2
Air:
for process
for lignite
for natural gas
1012
151.38
378.15
Total: 1213.82 1541.53
Outlet
Matte 423
Furnace slag 510.73
Output dust 83.75
Gas:
from process
from lignite combustion
from natural gas combustion
from leakage air
976.15
164.03
417.22
300
1017.48 1857.4
2.4. Tin
Modeling of tin smelting processes
This section has been prepared by the Middle East Technical University (METU), Turkey.
The principal mineral for tin is cassiterite, SnO2, containing 87.8% of tin [58]. Extracting tin from tin ore
is done differently according to the source of the ore deposit and its quality. Tin is extracted by
reduction with carbon, to produce tin and carbon dioxide. Starting with the mining process,
followed by the smelting and refining processes, tin is extracted.

Deliverable Report
D 4.1 GA No. 731287 19 Co-funded by the Horizon 2020 Framework
Programme of the European Union
Following the mining process, smelting is started. The low-grade concentrate is first roasted in a
furnace. The furnace could be any of 3 types: the reverberatory furnace which is the most
commonly used, the blast furnace, and the electric furnace [58]. Roasting is done to take out the
sulphur, converting them to oxide, where temperatures between 550 to 660 °C are reached [59].
Following that, leaching with water or acid solutions is done to remove impurities made soluble by
roasting. Next, smelting starts. Heating the cassiterite with carbon from anthracite coal and coke
[58] with limestone is done in the furnace to temperatures between 1,300–1,400 °C for 15 hours [59].
This produces molten pool tin, called as crude tin. Above that, slag forms, which contains impurities
and tin. The slag is reprocessed to extract the residual tin over and over again until hardhead forms
(tin recovered from iron-based compounds) and the remaining slag is discarded [59].
The crude tin from the smelting process is refined. The refining process can be of two types: fire
refining and electrolytic refining [58]. Fire refining can be done using boiling, liquation or vacuum
distillation. In boiling, the same furnace used for smelting is used to heat the impure tin in vessels
agitated with compressed air. This oxidizes the impurities that is discarded. In liquation, the impure
tin and the dross from the smelting process are treated. It is fortunate that tin has a low melting
point; hence the material is heated in a reverberatory furnace that melts the tin which is then
collected in a vessel. The unmelted residue is obtained and is treated again. Vacuum distillation is
similar to liquation but is done in a graphite vessel to temperatures between 1100 – 1300 °C [58].
In the reverberatory furnace, hot gases pass over the surface of the metal in a brick box. The brick
box is equipped with end wall burners to provide the heat for smelting [59]. Canadian practice uses
electric furnaces [59], which are the same as the reverberatory except that the heating is done by
a row of graphite electrodes projecting through the roof into the slag and the tin layer. They are
used to achieve very high temperatures, especially in secondary smelting processes. The heating is
then done by means of electrical resistance. Electric currents of 6–20 kA at 50–150 V are used [60].
Depending on the raw material concentration, energy consumption is 750–1400 kW h/t
concentrate (1300–1860 kW h/t tin). The depth of the electrodes can be controlled for process
control. Blast furnaces are sometimes used but are being replaced by reverberatory furnaces [59].
Smelting processes of temperatures up to 1500 °C in electrical furnaces consume 500 – 1000 kW h/t
and 1 – 10kg of electrode per ton of slag [60].
Modelling the various smelting processes with different combinations of fossil fuel and electricity use
and trying to identify solar energy use in the form of heat or PV electricity will be the next step.
In addition to these modelling efforts at METU, there is an ongoing project at AEE-INTEC which
constitutes an in-kind contribution to this INSHIP task. The following sub sections summarize the
project and its outcomes.
Energy audit of a pewter manufacturer
The following section has been prepared by the AEE – Institute for Sustainable Technologies (AEE-
INTEC), Austria.
2.4.1. The company
The data is based on an audit performed in a Malaysian company, operating worldwide (Kuala
Lumpur, London, Hong Kong, Singapore, Beijing, Melbourne and Sydney). The company is
manufacturing giftware and accessories in pewter, wood, gold & precious stones, silver, stannium,
bonded porcelain & glass.

Deliverable Report
D 4.1 GA No. 731287 20 Co-funded by the Horizon 2020 Framework
Programme of the European Union
2.4.2. Process description
The pewter manufacturing process includes: selection of raw materials, casting, handwork, lathe,
cut, burnishing, soldering, hand polishing and packaging. The raw materials (tin, copper and
antimony) are cut up and mixed in the right proportion. The percentage of tin varies from 93-97%
depending on the application. The mixture is then heated to a temperature of about 350°C in a
melting pot above a furnace, and a molten liquid is formed, which using a casting ladle, is poured
into a mold with extreme care. This process is called casting. Then the product is further finished by
hammering, turning in a lathe, polishing, and sometimes engraving. Some product items, such as
snuffboxes, are built from separate pewter pieces and then soldered together.
Since pewter is an expensive material, the waste from the handwork and the lathe cut and other
processes such as polishing, soldering and hand finishing are collected and smelted to be used as
recycled pewter to create new product items. Figure 10 shows the generalized standard
production processes flow sheet of pewter products from casting to finishing.
Figure 10: Flow sheet of pewter manufacturing process
The thermal energy consuming processes are the melting and the die casting. However, most of
the die casting is supplied electrically. Figure 11 shows the flow scheme for the melting process.

Deliverable Report
D 4.1 GA No. 731287 21 Co-funded by the Horizon 2020 Framework
Programme of the European Union
Figure 11: Diesel supply, heat utilization and temperature levels in the melting process
a. Energy sources used
The energy sources typically used are electricity and diesel. Electricity is used to provide lighting
and air conditioning services for the show room, office and production areas. The production
processes use electricity to run the motors, machines and to provide heating for casting process.
Diesel fuel is fired to generate heat supplied to the melting process and parts of casting process.
Electricity is supplied by TNB. Diesel is purchased from few external suppliers.
b. Process evaluation
Melting of swarf (waste material after lathe cut) as shown in Figure 12a was selected for study due
to the low thermal conductivity from its shape and form. Loss of heat to the ambient was minimal
due to good rock wool insulation. Potential loss is from the sensible heat loss in the combustion
product. 76 kg of (swarf + moisture) is heated in the cast iron cauldron. The heat is supplied using
diesel fired furnace as shown in Figure 12b.
The heat generated from the burning of diesel is used to produce a flame. The furnace receives
heat from the flame and heat by convection and conduction from the combustion gas which swirls
around the pot before leaving the chamber and going to the stack. The burner specification states
that the efficiency is in the range of 75-85%. The burner nozzle specification is 2.5 gal/hr and the
burner output specification is 10.7 kg/hr.

Deliverable Report
D 4.1 GA No. 731287 22 Co-funded by the Horizon 2020 Framework
Programme of the European Union
(a) (b)
Figure 12: (a) Photo of swarf material in the cauldron and (b) drawing of the furnace and cauldron
Several physical processes run simultaneously during the melting step: the melting of the material,
the evaporation of the coolant and the heat generation by combustion process. The melting
process requires heat to raise the temperature of the material to the melting point. From the
literature review the pewter is fully melted at a temperature of 290-295⁰C. In this case, because the
swarf material does contain water therefore additional energy is needed as shown in Figure 13 and
in the actual energy demand in Table 11.
Figure 13: Melting process input and output diagram
Table 11 Heat demand of the melting process
Stream Phase Duration
[h]
Mass
[Kg]
T
initial
[⁰C]
T final
[⁰C]
ΔT
[⁰C
]
Cp
[kJ/kgK]
Latent
Heat
[KJ/KgK]
Q
[kJ]
H
change
[kJ/h]
Pewter Solid/
liquid
0.98 67.45 39 421 382 0.211 64.54 9,790 9,990
Water
(coolant)
Liquid 0.98 8.55 39 100 61 4.186 2260 21,506 21,945

Deliverable Report
D 4.1 GA No. 731287 23 Co-funded by the Horizon 2020 Framework
Programme of the European Union
The supply system (diesel) was evaluated based on burnt diesel and the air used. By this the energy
input was calculated.
Sankey diagram
The energy flow for the melting process is presented in the Sankey diagram as shown in Figure 14.
Figure 14: The Sankey diagram for swarf melting
The thermal energy audit and relevant energy data were collected and analyzed. The analysis
revealed that only 2.4% of heat supplied is used for melting, 2.5% for heating the pot, 5.3% for
removing the water and 89.2 % is loss as shown in in Sankey diagram. This is mainly based on the
outlet of flue gas and hot air as well as radiation and convection losses. To a certain extent this will
also include the heat stored in the hot product, but as this reflects only 2.5% of the total energy
demand, this is seen limited.
For system optimization a Pinch analysis was performed, but is not part of the project
documentation within INSHIP.
2.4.3. Identified solar thermal integration concepts
Solar and electricity for melting
The heating process for melting will be carried out through the introduction of Scheffler solar
collector/ electric heaters and the press. Scheffler collector would reduce power requirement of
electrical heaters to melt pewter swarf. Most of the trapped coolant would be removed and safely
disposed through the press without burning process.
Description of the measures
Overall system improvements: The proposed improvement to pewter swarf melting is by combining
electrical heaters and solar thermal heating. Electrical power requirement is reduced by using a
smaller pot and melting in smaller quantity. Solar thermal heating through Scheffler collector is the
second heat source. The Scheffler reflector focuses heat directly on the melting pot. The reflector
surface area of the test rig is 8 m2 and the average aperture area is 6.4 m2. At peak period with
estimated 33% efficiency, the reflector produces 2.3 kW of heating power. The combined heating
sources are to melt minimum of 100 kg of pewter swarf at 350 ⁰C.

Deliverable Report
D 4.1 GA No. 731287 24 Co-funded by the Horizon 2020 Framework
Programme of the European Union
Efficiency of the Scheffler collector system was estimated by setting up 36 mirrors as reflector and
fabricating an aluminum mini cauldron as collector. System efficiency was initially recorded at 28%
with convection heat loss from the exposed or non-insulated aluminum surface of the collector.
System efficiency improved to 33% by fixing a glass plate covering the focal area at the collector.
A prototype Scheffler collector with 2.7 m2 reflector area is being fabricated. The prototype enables
a better study on reducing convection heat loss from focal point area. The proposed solutions are
to install heat resistant glass partition and sun ray sensitive automated trap door at the focal area
of the collector.
Solar heating using Ritter XL
Another option is to preheat the materials and to evaporate the water coolant. A solar thermal
system is designed to achieve a process temperature of 200°C using Ritter XL solar plasma
collectors. The auxiliary heating will be electric. For this system, a SHIP Tool (developed by AEE
INTEC) was used for the evaluation.
The heat required for the process includes the heat required to raise the water coolant
temperature from ambient to 100⁰C and heat required for evaporation and the heat required to
raise the pewter temperature to melting point and provide the heat of fusion. Table 12 shows the
heat requirements and Figure 15 shows the load profile of the process.
Table 12 Daily load and temperature levels of the process

Deliverable Report
D 4.1 GA No. 731287 25 Co-funded by the Horizon 2020 Framework
Programme of the European Union
Figure 15: Annual load profile of the process
Deliverable Report
D 4.1 GA No. 731287 26 Co-funded by the Horizon 2020 Framework
Programme of the European Union
3. Lime processing from limestone
The decomposition of limestone (mainly CaCO3) is the main endothermic step in the production of
lime (CaO) and cement. Lime and cement manufacturing are high-temperature energy intensive
processes. The minimum amount of energy in the form of process heat that is required to drive the
calcination reaction, CaCO3 → CaO + CO2 at the decomposition temperature near 1173 K is about
3029 kJ per kg of CaO, while the heat of dissociation of calcite relative to 298 K is 3184 kJ per kg of
CaO. Total heat consumption of modern lime kilns ranges from 3600 kJ/kg of CaO for vertical
double shaft kilns to 7500 kJ/kg of CaO for non-preheated long rotary kilns.
Because the process heat is traditionally supplied by the combustion of fossil fuels (e.g., oil, coal, or
natural gas) a lime or cement plant releases CO2 derived both from the calcination reaction and
from the combustion process that supplies the energy for the reaction. The use of concentrated
solar energy as the source of process heat can mitigate these emissions [42-46]. The cleanliness of
the solar process leads to very pure lime. It seems conceivable that a pure product may be
advantageous for special niche markets in the chemical and pharmaceutical industries. The
technical feasibility of the solar calcination process has already been demonstrated for 10 kW solar
reactor prototypes [61].
The following sections provide an overview of the work carried out by INSHIP members under Task
4.2 of WP4 (Solar lime production for the cement industry). High-temperature process heat can be
obtained in a solar receiver heating a heat transfer medium with concentrated solar energy. The
medium can be a fluid (e.g. air, steam) or can be a particle flow, as highlighted in the following
sections.
3.1. Solar hybridization for cement production
This section has been prepared by the Middle East Technical University (METU), Turkey.
Within the scope of this research activity, we aim to obtain mass and energy balances for cement
production processes which will be useful in identification of solar hybridization paths.
The most common cement product in the market, Ordinary Portland Cement is produced by
heating limestone with small amounts of other materials such as clay to 1450°C to produce “clinker”
and then by grinding clinker together with a small amount of gypsum and even smaller amounts of
other minerals.
Clinker production process has a large carbon footprint. According to the report prepared by
International Energy Agency (IEA) and the Cement Sustainability Initiative (CSI) of the World
Business Council for Sustainable Development (WBCSD) [62], the cement industry is responsible for
7% of the global carbon dioxide (CO2) emissions. In 2014, this corresponds to 2.2 gigatons of CO2 in
a year which was 27% of total direct industrial CO2 emissions. To be able to understand how we can
reduce CO2 emissions of cement industry, we need to take a look at the sub processes and their
mass and energy balances.
Cement production starts with extraction of limestone, clay and other minerals from quarries. This is
done by excavation machinery and the extracted material is carried by trucks to the usually

Deliverable Report
D 4.1 GA No. 731287 27 Co-funded by the Horizon 2020 Framework
Programme of the European Union
nearby cement plant. The machinery and trucks use fossil fuel and emit CO2 but hybridization with
high temperature solar heat is not possible at this initial step of production.
The next step is crushing the materials together to obtain the raw meal that will go into the cement
plant. The crushing machinery uses electricity and electricity can be supplied from a photovoltaic
(PV) field but we are not interested in hybridization with solar PV either. Because of our limited
scope to solar heat, we only consider the cement production steps after the raw meal enters the
cement plant.
In a modern dry cement plant, the raw meal is heated initially in the preheater then in the pre-
calciner up to 900°C at which the calcination reaction starts to occur. The rest of the calcination
reaction occurs at the early stages of the rotary kiln. The products of the calcination reaction are
lime (CaO) and CO2. In fact, 60-70% of CO2 emissions from cement production occurs as the
product of calcination. About 65% of the fuel use in a cement plant occurs for the calcination
process.
Next, the pre-calcined meal goes into the rotary kiln. The rotary kiln is a fire brick lined long and
heavy steel cylinder. The kiln rotates with a rotation speed in the range of 1-5 rotations per minute
and it is usually inclined to advance the meal slowly towards the hot flame that is at the bottom
lower part of the kiln. The meal gets hotter and hotter as it moves towards the end of the kiln. The
kiln reaches to temperatures as high as 1450°C. The rest of limestone that is not calcined in pre-
calciner gets into reaction and calcination is completed here and all of the raw materials are
combined together in a partially molten form. The product at the exit of the kiln is called clinker.
At the next step, hot clinker coming from the kiln is cooled by fresh air blown onto it at a grate
cooler. Here, clinker temperature reduces to 100°C very rapidly. The resulting clinker goes to
storage.
To produce cement, the stored clinker is mixed with gypsum and other minerals and ground into a
powder. The resulting grey powder is called Ordinary Portland Cement. Clinker can also be
blended with ash or some other materials coming from various industries to produce blended
cement mixtures. The mixing, blending and grinding processes require electricity.
Only the part of cement production process starting with crushed raw meal and ending with
cooled clinker involves heat processes. We call that, clinker production and target it for solar
hybridization.
In modern cement plants, heat processes are optimized for efficiency. Fresh air required for
combustion is preheated by the cooling clinker and exhaust of the kiln goes to the pre-calciner
and after that to the pre-heater. Even the exhaust of the pre-heater can be utilized for site heating
or for district heating. If the exhaust is hot enough, it can be used in Heat Recovery Steam
Generators to produce steam for producing electricity with a steam turbine.
There are still some old cement plants operating without a pre-heater or even without a pre-
calciner but with a long kiln. Thus, their heat recovery options are limited, leading to low
efficiencies. Some of the old plants operate on a wet process instead of a dry one, requiring
evaporation of moisture leading to low thermal efficiencies. We consider a modern cement plant
with pre-heater steps and with a pre-calciner and determine the mass and energy balances for
such a plant starting with dry materials. Hence, our aim is to identify the paths for improving modern
cement plants by solar hybridization.

Deliverable Report
D 4.1 GA No. 731287 28 Co-funded by the Horizon 2020 Framework
Programme of the European Union
Our initial attempt for obtaining mass and energy balances was to try to obtain operational data
from a modernized cement plant in Ankara. That attempt turned out to be unsuccessful because
of two reasons: i) the company operating the plant was not responsive to provide detailed data
most probably due to being protective of their trade information; ii) placement of a student
working on INSHIP at the site for a long period of time to collect data was not foreseen and
budgeted in INSHIP. Considering the operational data even in International Energy Agency (IEA)
reports are always 2 years old due to the same trade secret concerns, it became obvious that
either the cement company or some of its employees should be partners in INSHIP to be able to do
our own energy auditing. Thus, we turned our attention to earlier energy audits of cement plants in
the literature. We found two such audits for cement plants, one of them in Van (eastern Turkey) and
the other in Gaziantep (southeastern Turkey). Especially, Gaziantep is a promising location for solar
hybridization due to its very high year-round Direct Normal Irradiation (DNI) values. We will present
the mass and energy balances of both of the cement plants here.
3.1.1. Van Cement Plant Mass and Energy Balances
Engin and Ari [63] performed mass and energy balances for a dry processing cement plant located
in the province of Van in eastern Turkey. The data have been collected over a long period of time
when the first author was a process engineer in the plant. The plant is a relatively modern cement
plant. As in the case of all energy auditing studies performed for cement plants in the literature,
authors first present the raw material and clinker compositions given in Table 13 as it was presented
in [63]. The mass flows in and out of the kiln system consisting of pre-heater, rotary kiln and grate
cooler are shown in Figure 16. The plant operates by burning coal. Mass inputs and outputs of the
kiln system including the coal and combustion air are shown in Figure 17. The complete energy
balance of the kiln system is also presented in [63]. We extracted only the results of the balance
and formed Table 14 based on that data.
Table 13 Raw material and clinker components and their percentages (from [63])
Component Raw material (%) Clinker (%)
SiO2 13.55 20.55
Al2O2 4.10 5.98
Fe2O3 2.60 4.08
CaO 40.74 64.58
MgO 2.07 2.81
SO3 0.56 1.30
K2O 0.30 0.50
Na2O 0.08 0.20
H2O 0.5 -
Organics 0.9 -
Ignition loss 34.6 -
Total 100 100

Deliverable Report
D 4.1 GA No. 731287 29 Co-funded by the Horizon 2020 Framework
Programme of the European Union
Figure 16: Control volume and mass flows of the kiln system together with the temperatures (as it was
presented in [63])
Figure 17: Mass inputs and outputs of the kiln system including the coal and combustion air [63]

Deliverable Report
D 4.1 GA No. 731287 30 Co-funded by the Horizon 2020 Framework
Programme of the European Union
Table 14 Complete energy balance results (data from [63])
Description Result (kJ/kg-clinker)
Heat Inputs
Combustion of coal 3519 (95.47%)
Sensible heat by coal 7 (0.19%)
Heat by raw material 72 (1.95%)
Organics in the kiln feed 19 (0.52%)
Heat by cooling air 69 (1.87%)
Total heat input 3686 (100%)
Heat outputs
Formation of clinker 1795 (48.70%)
Kiln exhaust gas 706 (19.15%)
Moisture in raw material and coal 26 (0.71%)
Hot air from cooler 207 (5.61%)
Heat loss by dust 11 (0.30%)
Clinker discharge 86 (2.33%)
Radiation from kiln surface 386 (10.47%)
Convection from kiln surface 171 (4.64%)
Radiation from pre-heater surface 7 (0.19%)
Natural convection from pre-heater surface 5 (0.14%)
Radiation from cooler surface 4 (0.11%)
Natural convection from cooler surface 9 (0.24%)
Unaccounted losses 273 (7.41%)
Total heat output 3686 (100%)
3.1.2. Gaziantep Cement Plant Mass and Energy Balances
Atmaca and Yumrutas [64][65][66] performed energy auditing of a cement plant in Gaziantep
province of southeastern Turkey. They performed their first and second law analyses for the cases
before and after some improvements for reducing heat losses. The clinker composition of the plant
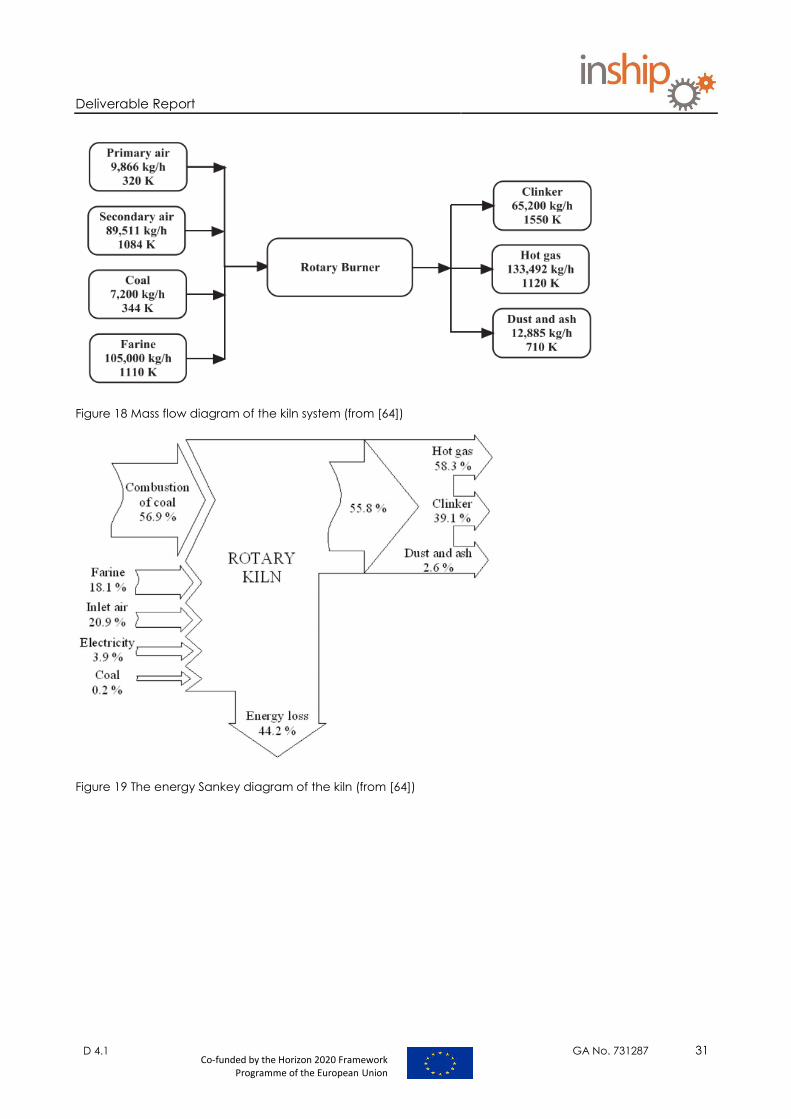
is given in Table 15 as it is shown in [64]. Mass inputs and outputs of the kiln system together with
their temperatures are given in Figure 18. Energy flows are presented as a Sankey diagram in Figure
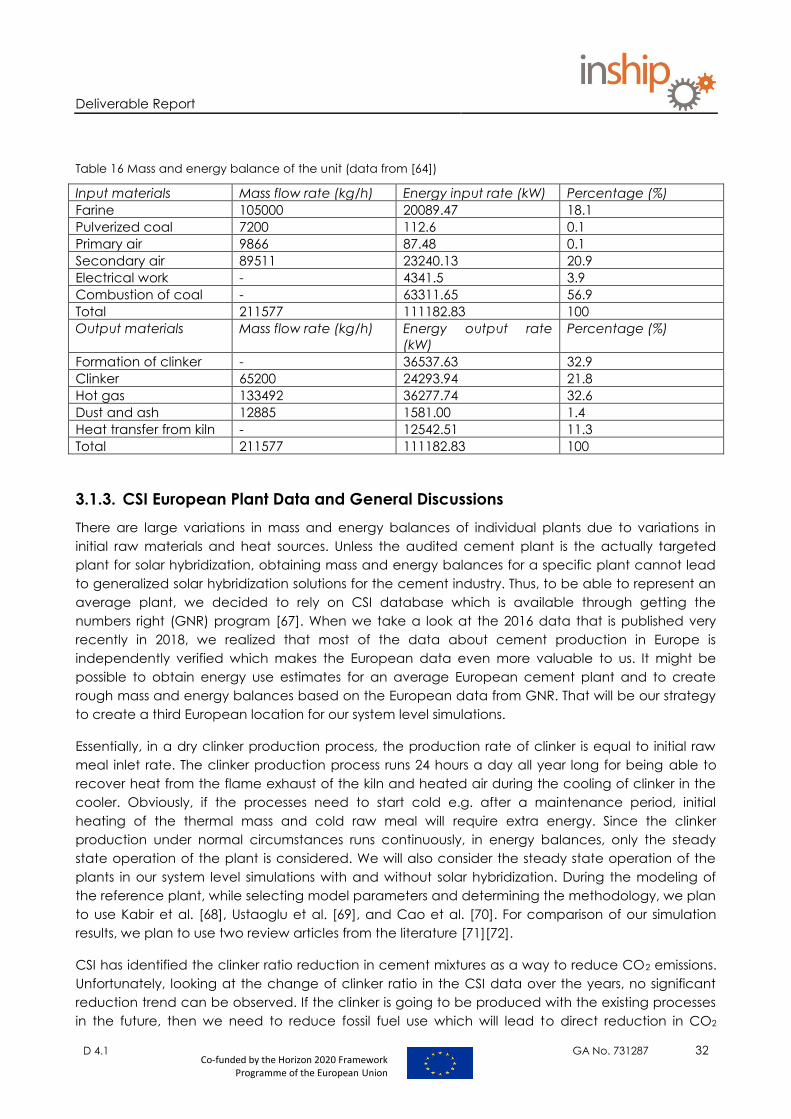
19. The mass and energy balances are shown in Table 16.
Table 15 Clinker composition (as presented in [64])
Chemical name Chemical structure Chemical form Percentage (%)
Calcium ferrite 4CaO.Al2O3.Fe2O3 C4AF 10.4
Di-calcium silicate 2CaO.SiO2 C2S 13.2
Calcium aluminate 3CaO.Al2O3 C3A 9.1
Tri-calcium silicate 3CaO.SiO2 C3S 60.2
Potassium oxide K2O - 2.5
Sulfur trioxide SO3 - 2.1
Magnesium oxide MgO - 1.2
Sodium oxide Na2O - 1.3
Total 100
Deliverable Report
D 4.1 GA No. 731287 31 Co-funded by the Horizon 2020 Framework
Programme of the European Union
Figure 18 Mass flow diagram of the kiln system (from [64])
Figure 19 The energy Sankey diagram of the kiln (from [64])
Deliverable Report
D 4.1 GA No. 731287 32 Co-funded by the Horizon 2020 Framework
Programme of the European Union
Table 16 Mass and energy balance of the unit (data from [64])
Input materials Mass flow rate (kg/h) Energy input rate (kW) Percentage (%)
Farine 105000 20089.47 18.1
Pulverized coal 7200 112.6 0.1
Primary air 9866 87.48 0.1
Secondary air 89511 23240.13 20.9
Electrical work - 4341.5 3.9
Combustion of coal - 63311.65 56.9
Total 211577 111182.83 100
Output materials Mass flow rate (kg/h) Energy output rate
(kW)
Percentage (%)
Formation of clinker - 36537.63 32.9
Clinker 65200 24293.94 21.8
Hot gas 133492 36277.74 32.6
Dust and ash 12885 1581.00 1.4
Heat transfer from kiln - 12542.51 11.3
Total 211577 111182.83 100
3.1.3. CSI European Plant Data and General Discussions
There are large variations in mass and energy balances of individual plants due to variations in
initial raw materials and heat sources. Unless the audited cement plant is the actually targeted
plant for solar hybridization, obtaining mass and energy balances for a specific plant cannot lead
to generalized solar hybridization solutions for the cement industry. Thus, to be able to represent an
average plant, we decided to rely on CSI database which is available through getting the
numbers right (GNR) program [67]. When we take a look at the 2016 data that is published very
recently in 2018, we realized that most of the data about cement production in Europe is
independently verified which makes the European data even more valuable to us. It might be
possible to obtain energy use estimates for an average European cement plant and to create
rough mass and energy balances based on the European data from GNR. That will be our strategy
to create a third European location for our system level simulations.
Essentially, in a dry clinker production process, the production rate of clinker is equal to initial raw
meal inlet rate. The clinker production process runs 24 hours a day all year long for being able to
recover heat from the flame exhaust of the kiln and heated air during the cooling of clinker in the
cooler. Obviously, if the processes need to start cold e.g. after a maintenance period, initial
heating of the thermal mass and cold raw meal will require extra energy. Since the clinker
production under normal circumstances runs continuously, in energy balances, only the steady
state operation of the plant is considered. We will also consider the steady state operation of the
plants in our system level simulations with and without solar hybridization. During the modeling of
the reference plant, while selecting model parameters and determining the methodology, we plan
to use Kabir et al. [68], Ustaoglu et al. [69], and Cao et al. [70]. For comparison of our simulation
results, we plan to use two review articles from the literature [71][72].
CSI has identified the clinker ratio reduction in cement mixtures as a way to reduce CO2 emissions.
Unfortunately, looking at the change of clinker ratio in the CSI data over the years, no significant
reduction trend can be observed. If the clinker is going to be produced with the existing processes
in the future, then we need to reduce fossil fuel use which will lead to direct reduction in CO2

Deliverable Report
D 4.1 GA No. 731287 33 Co-funded by the Horizon 2020 Framework
Programme of the European Union
emissions. High temperature solar heat is a good candidate for replacing some of fossil fuel burning.
Targeting the kiln and the pre-calciner for high temperature solar hybridization looks promising.
3.2. Particle based gravity driven solar receiver development for solar lime
This section has been prepared by the Middle East Technical University (METU), Turkey.
3.2.1. Modeling Solid Particles
Concentrating Solar Power utilizing solid particles as a heat transfer and storage medium has been
gaining attention among researchers [73][74][75], with potential benefits including higher
temperatures, higher efficiencies, and lower cost [76] [77] compared to state-of-the-art molten salt
based systems. The high working range of these systems, projected to be around 700 to 900 ⁰C,
make them well-suited for pre-heating and high temperature industrial applications. Unlike fluids,
which have a long history of research and countless experimental studies validating the
mathematical models, modeling a group of flowing solid particles surrounded by a fluid is much
more difficult to model, given the various ways the particles, fluid, and walls can interact in terms of
both heat transfer and momentum transfer. Therefore, in the pursuit of designing gravity-driven solar
receivers which will be useful for lime calcination, we are improving upon the state-of-the-art
modeling techniques for dense particulate flows. Furthermore, heat transfer experiments will be run
to validate the new modeling techniques. After the models have been built and experimentally
validated, solar receiver designs for lime calcination can be designed and evaluated. The methods
and results are given in more detail in the proceedings from the SolarPaces 2018 conference [78].
Unlike fluids, a flowing collection of particles does not follow the continuum assumptions which are
common in fluid mechanics. By coupling Computational Fluid Dynamics (CFD) with the Discrete
Element Method (DEM), a coupled CFD-DEM simulation can account for both frictional effects of
the particle phase as well as behavior of the interstitial gas [79][80]. With a coupled model, both
frictional effects of the particles as well as the hydrodynamic and thermal effects of the fluid are
simulated, which is not possible with a DEM or CFD model alone. A generic domain consisting of
particles and an interstitial fluid bounded by a heated, opaque wall consists of six heat transfer
modes. Four modes are already incorporated into the LIGGGHTS-CFDEM-OpenFoam, the leading
open-source coupled CFD-DEM software: particle-particle conduction, particle-wall conduction,
particle-fluid convection, wall-fluid convection. Two heat transfer modes, particle-particle radiation
and particle-wall radiation, are not included in this or other available software. However, since
radiation plays a large role in heat transfer at high temperatures, it is crucial to add the radiative
heat transfer modes before a CFD-DEM code can accurately model a solid particle solar receiver.
3.2.2. View Factor Correlation Concept
To calculate the radiative transfer between two bodies in a CFD-DEM simulation, the view factor is
the key unknown parameter. View factors can be calculated analytically or with Monte Carlo ray
tracing [81], but implementing these directly into a DEM code would add a prohibitive
computational burden. Instead, a computationally faster method is pursued here, with a similar
approach previously suggested by Malinouski [82]. First, a randomly packed, static particle bed is
generated using DEM. Second, a Monte Carlo simulation is run to find the view factor between
each particle and its neighbors. Third, each particle-particle view factor is plotted against the
center-to-center distance between the particles, and a polynomial correlation is found. Finally, this
view factor correlation is implemented into DEM. The benefit of this approach is that after the
Monte Carlo simulation has been run once to obtain the correlation for a certain set of conditions,

Deliverable Report
D 4.1 GA No. 731287 34 Co-funded by the Horizon 2020 Framework
Programme of the European Union
view factors in DEM can be quickly calculated based only on the distance between particles, and
radiative heat transfer is readily calculated. Given the random packing and shading of particles,
any isolated pair of particles may have a true view factor more or less than the correlation, but the
correlation should accurately predict radiative heat transfer across the particle bed as a whole. In
this analysis, the particles are assumed to be densely packed with a volume fraction of ~0.64, all
particles and walls are assumed to be black bodies, and all particles are assumed to have the
same diameter.
3.2.3. View Factor Correlation Results
The Monte Carlo method was used to find the view factor from one particle to its neighbors. In this
simulation, many “photons” or rays were emitted in random directions, from a random location on
the particle surface, and the trajectory of each photon was followed until it hit a neighboring
particle. After emitting many photons, the view factors were found by dividing the number of
photons hitting a neighbor by the total number sent. Results are shown in Figure 20, where the view
factor is plotted against distance for both the particle-particle and particle-wall cases. Though
some scatter is inevitable due to the random nature of the particle positions, there is a clear trend,
and the two-part correlations are presented below. The correlations are valid for particles of any
size because distance is expressed in units of particle radii.
Figure 20: Particle-particle view factors (left) and particle-wall view factors (right) found with Monte-Carlo
simulation
Particle-particle view factor:
Particle-wall view factor:
R ≤ 4:
VFP-P = a0 + a1R + a2R2 + a3R3 + a4R4 + a5R5 + a6R6
a0 = 7.406948, a1 = -13.706197, a2 = 10.628515, a3 = -4.3657168
a4 = 0.99654538, a5 = -0.11966892, a6 = 0.0059067682
4 < R < 6:
VFP-P = a0 + a1R + a2R2 + a3R3
a0 =0.012264422, a1 = -0.0045066324, a2 =0.00053308638, a3 = -
0.000020380795
Deliverable Report
D 4.1 GA No. 731287 35 Co-funded by the Horizon 2020 Framework
Programme of the European Union
R ≤ 2.75:
VFP-P = a0 + a1R + a2R2 + a3R3
a0 =0.51909859, a1 = -0.18425542, a2 = -0.045247181, a3 = 0.016712257
2.75 < R < 6:
VFP-P = a0 + a1R + a2R2 + a3R3
a0 =0.13749899, a1 = -0.076620909, a2 =0.014266074, a3 = -0.00088424010
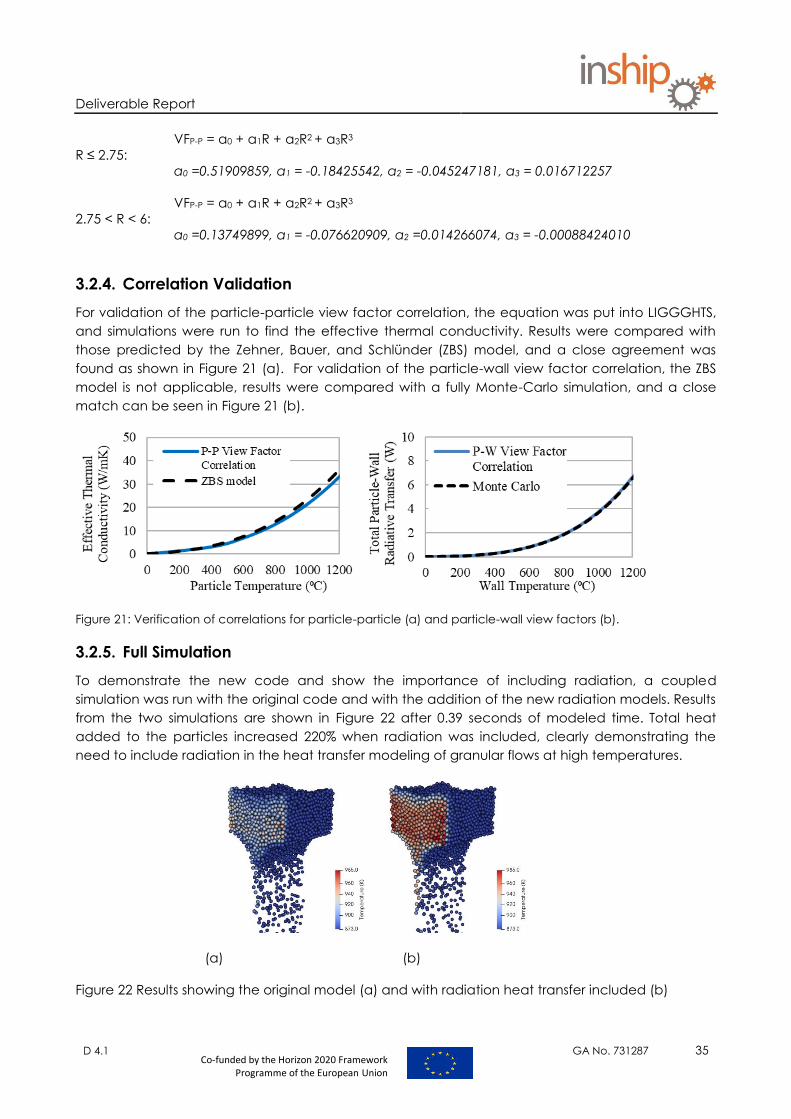
3.2.4. Correlation Validation
For validation of the particle-particle view factor correlation, the equation was put into LIGGGHTS,
and simulations were run to find the effective thermal conductivity. Results were compared with
those predicted by the Zehner, Bauer, and Schlünder (ZBS) model, and a close agreement was
found as shown in Figure 21 (a). For validation of the particle-wall view factor correlation, the ZBS
model is not applicable, results were compared with a fully Monte-Carlo simulation, and a close
match can be seen in Figure 21 (b).
Figure 21: Verification of correlations for particle-particle (a) and particle-wall view factors (b).
3.2.5. Full Simulation
To demonstrate the new code and show the importance of including radiation, a coupled
simulation was run with the original code and with the addition of the new radiation models. Results
from the two simulations are shown in Figure 22 after 0.39 seconds of modeled time. Total heat
added to the particles increased 220% when radiation was included, clearly demonstrating the
need to include radiation in the heat transfer modeling of granular flows at high temperatures.
(a) (b)
Figure 22 Results showing the original model (a) and with radiation heat transfer included (b)

Deliverable Report
D 4.1 GA No. 731287 36 Co-funded by the Horizon 2020 Framework
Programme of the European Union
3.2.6. Conclusions
A method for including radiation heat transfer within a granular flow has been presented and initial
validation performed. The importance of including radiation has been demonstrated with the first
simulation where radiation heat transfer was implemented into a coupled CFD-DEM code. With the
aim of designing a solar receiver capable of efficiently transferring heat to the particles flowing
inside for solar lime production, the CFD-DEM modeling capabilities currently being built will help to
design and optimize such a receiver, by comparing the effects of fin spacing, other geometric
parameters, and material properties. Additionally, particles flowing through the receiver may be an
intermediate material such as sintered bauxite, which is widely available from the hydraulic
fracturing industry, or silica sand, available worldwide. Alternatively, it may be possible to heat the
limestone particles directly in the solar receiver. Given the various options in terms of particle
choice and receiver design, CFD-DEM will be used to compare and different options and evaluate
the potential designs in terms of working temperature range and thermal efficiency.
3.3. Thermal performance and transient operation of a solar receiver
This section has been prepared by the Centro de Investigaciones Energéticas, Medioambientales y
Tecnológicas (CIEMAT), Spain
The manufacture of lime and cement are energy-intensive processes at high temperatures. The
energy in the form of process heat required to carry out the calcination reaction is at
approximately 1173 K.
23 COCaOCaCO
Because process heat is traditionally supplied by the combustion of a fossil fuel (e.g. oil, coal or
natural gas), CO2 is released in a lime or cement plant. Several strategies have been proposed to
mitigate these emissions. Examples include CO2 capture and sequestration, fuel switching, the use
of waste as a fuel source, and the use of concentrated solar energy as a process heat source.
Several approaches to solar reactors to integrate this chemical process have been studied in the
scientific literature. The main objective is to provide the best heat transfer between concentrated
solar energy and the reaction.
The use of chemical reactors with cavity geometries allows solar energy to be captured and
facilitates the reduction of thermal emission losses. These receptors usually showed a low response
to changes in operating conditions, which avoids abrupt temperature changes in the presence of
small transients, which is particularly useful when solar heat is applied in a chemical plant. In this
regard, a thermodynamic characterization of a solar chemical reactor under real conditions
emerges as a relevant matter to be considered.
The research activity of CIEMAT under Task 4.2 of INSHIP focuses on investigation of thermal
performance of a solar receiver on non-steady state conditions. A 100 kW receiver prototype has
been thermally tested at the CRS tower at Plataforma Solar d’Almeria, Spain in real conditions.
Reactor dimensions are the following: cavity reactor with semi-cylindrical shape and a square
aperture of 46 cm x 46 cm.
Mass and Energy Balances
The chemical process defined in the following equation:

Deliverable Report
D 4.1 GA No. 731287 37 Co-funded by the Horizon 2020 Framework
Programme of the European Union
23 COCaOCaCO ΔH298=178 kJ/mol (Endothermic)
produces both volatile carbon dioxide at a rate mCO2 out and a mixture of CaO and CaCO3, which
contains calcium oxide and some un-calcined calcium carbonate. A simplified mass balance is
given in the following equation:
323 CaCOCaOCOCaCO mmm
A complete energy balance scheme for the calcination is provided by Meier et al. [83]. The heat
balance model accounts for non-steady-state conditions by modifying the solar power Qsolar
entering the reactor. The effective power input includes the enthalpy change Qstorage of the reactor
wall materials caused by energy stored and released:
othercondirreradheatdissstoragesolarinput QQQQQQQQ
The authors stated that, for example, 13.6% of the effective power input is conducted through the
walls of the reactor(Qcond), 20.5% is lost by reradiation (Qrerad), 20.2% (Qheat) is carried away in the hot
products, and 14.9% (Qother) of the effective power input leaves the reactor as “other heat losses”
mainly convection heat losses and un-recovered calcined powder. The authors conclude that, the
reactor design changes can reduce any of these terms and it will lead to better reactor efficiency.
A brief heat balance is presented for calculating the efficiency of CIEMAT’s cavity reactor under
Task 4.2.
heatproductlossesCaCOCaCOinput QQHmQ ,33
where Q product heat represents the sensible heat of the flowing gas.
othercondreradlosses QQQQ
Q losses account for thermal energy losses by radiation (Qrad), re-radiation (Qrerad) and convection
(Qother).
The efficiency η is defined as the enthalpy change of the calcination reaction at ambient
temperature, divided by the power input.
input
heatproductCaCOCaCO
Q
QHm ,33
A preliminary evaluation of our cavity receiver has been performed during some experimental
campaigns and an empirical value of Q losses has been obtained from experimental data. This value
could represent a measure of how quickly or slowly the cavity reactor gains or loses heat to its
environment and it is associated with the geometry and working conditions of the receiver.
The Qlosses value was estimated to be about 114 kJ/K. It would represent the power needed for this
cavity receiver for steady state operation at 1100 ºC, that is, the temperature to carry out the
calcination reaction.

Deliverable Report
D 4.1 GA No. 731287 38 Co-funded by the Horizon 2020 Framework
Programme of the European Union
Figure 23: Colored curves correspond to thermocouples placed at different positions across the reactor. Black
points are the incident power in the aperture. Black lines are the number of heliostats focused on the receiver.
By a simplified energy balance across the cavity reactor, considering the Q input the value of power
obtained by the flux measurement system (black dots in Figure 23)
lossesnetinput QQQ
and the heat flows leaving the reactor, our design is able to achieve a thermal efficiency value of
ηreceiver = 0.35 to 0.40, which is a characteristic value for a cavity receiver.

Deliverable Report
D 4.1 GA No. 731287 39 Co-funded by the Horizon 2020 Framework
Programme of the European Union
4. Solar fuels production from H2O and CO2 via redox cycles
This section has been prepared by the Swiss Federal Institute of Technology (ETH), Zurich,
Switzerland based on Ref. [84].
Storage of the vast, yet intermittent, diffuse and unevenly distributed solar energy resource is
essential for the transition away from fossil fuels [85]. Liquid hydrocarbon fuels offer exceptionally
high energy densities and are convenient for the transportation sectors without changes in the
current global infrastructure. However, their production from H2O and CO2 using solar energy input
has remained a grand challenge.
Concentrated solar energy provides a virtually unlimited source of clean, non-polluting, high-
temperature heat. Solar flux concentration ratios exceeding 2000 suns (1 sun = 1 kW/m2) are
attainable with large-scale solar tower and dish systems, and higher concentrations are possible
with the incorporation of secondary optics in tandem with the primary concentrating systems, e.g.
compound parabolic concentrators. Dish systems use sun-tracking paraboloidal mirrors to focus
sunlight onto a solar receiver positioned at a focus. These solar concentrating modular systems
have been proven to be technically feasible for power generation in traditional Stirling cycles. Solar
thermochemical applications, although not as far developed as solar thermal electricity
generation, can employ the same solar concentrating infrastructure with the solar reactor
positioned at the focus of the solar dish in decentralized (approx. 100 kW each) modular systems
[84].
Solar thermochemical approaches to splitting CO2 and H2O inherently operate at high
temperatures and utilize the entire solar spectrum, and as such provide an attractive path to solar
fuels production with high energy conversion efficiencies in the absence of precious metal catalysts
[84]. In contrast to direct thermolysis of CO2 and H2O, two-step thermochemical cycles using metal
oxide redox reactions further bypass the CO/O2 or H2/O2 separation problem. Figure 24 shows
schematically the proposed two-step H2O/CO2 splitting thermochemical cycle based on metal
oxide redox reactions, encompassing:
1) an endothermic reduction of the metal oxide using concentrated solar process heat; and
2) an exothermic reaction of the reduced metal oxide with H2O/CO2 to produce H2/CO.
The net reactions are H2O= H2+½O2 and/or CO2 = CO+½O2. Since O2 and H2/CO are released in
separate steps, the need for high-temperature gas separation is thereby eliminated. The syngas
mixture H2/CO can be further processed to liquid hydrocarbon fuels (via Fischer-Tropsch and other
catalytic processes), such as diesel, kerosene, methanol, and gasoline using existing conventional
technologies.

Deliverable Report
D 4.1 GA No. 731287 40 Co-funded by the Horizon 2020 Framework
Programme of the European Union
Figure 24: Schematic of a two-step solar thermochemical cycle for H2O/CO2 splitting based on metal oxide
redox reactions. MOox denotes a metal oxide, and MOred the corresponding reduced metal or lower-valence
metal oxide. In the first, endothermic, solar step, MOox is thermally dissociated into MOred and oxygen.
Concentrated solar radiation is the energy source for the required high-temperature process heat. In the
second step, MOred reacts with H2O/CO2 to produce H2/CO (syngas). The resulting MOox is then recycled back
to the first step, while syngas is further processed to liquid hydrocarbon fuels [84].
Amongst candidate redox materials, ferrite-based oxides exhibit relatively slow reaction rates,
whereas ZnO, SnO2, and analogous volatile oxides that sublime during decomposition require rapid
quenching of gaseous products to avoid recombination [86–92]. Cerium oxide (ceria) has emerged
as a highly attractive redox active material choice because it displays rapid fuel production
kinetics and high selectivity [93–98]. The non-stoichiometric ceria fluorite-type structure and phase
are maintained as oxygen vacancies are created, making cyclability possible. The two-step
H2O/CO2 splitting solar thermochemical cycle based on oxygen-deficient ceria is represented by:
High-T reduction:
H x
2-δ 2-δ-x 22CeO CeO O
( 5 )
Low-T oxidation with H2O: 2-δ-x 2 2-δ 2CeO xH O CeO xH
( 6 )
Low-T oxidation with CO2: 2-δ-x 2 2-δCeO xCO CeO xCO
( 7 )
Figure 25 shows a) the equilibrium properties for CeO2-δ reduction [99]; and b) the equilibrium mole
fractions of H2 and CO for various reduction temperatures of ceria reacting with a mixture of H2O
and CO2. These graphs indicate that the reduction is thermodynamically favorable at above 1400
°C and 1 bar while the oxidation is favorable at below 1200 °C.

Deliverable Report
D 4.1 GA No. 731287 41 Co-funded by the Horizon 2020 Framework
Programme of the European Union
(a) (b)
Figure 25: (a) Equilibrium O2 pressures for CeO2-δ as a function of nonstoichiometry at 1400-1750 °C (b)
Equilibrium H2 and CO mole fractions for various reduction temperatures, as a function of oxidation
temperature H2O/CO2 molar ratio = 2 [99]
The first realization of a solar-driven ceria-based cycle focused on CeO2/Ce2O3 redox reactions [93].
The thermodynamics and kinetics of the cycles were studied for CeO2-δ [95]. Exploratory studies
have examined the effect of doping ceria with samarium [94], chromium [96], manganese, iron,
nickel, copper [97], and zirconium [98] to improve performance. These studies have largely been
confined to bench-top demonstrations of components or individual steps of the cycle with no
meaningful experimental evaluation of the energy conversion efficiency and limited assessment of
cyclability.
The following sections provide an overview of the work carried out by INSHIP members under Task
4.3 of WP4 (Solar fuel production for the transportation sector).
4.1. Solar receiver–reactor for thermochemical redox cycling using ceria
This section has been prepared by the Swiss Federal Institute of Technology (ETH), Zurich,
Switzerland based on Ref. [100]. This work has been carried out by ETH under the H2020 project SUN-
to-LIQUID (year 2016 to 2019) and is being reported as an in-kind contribution in the INSHIP project.
This work [100] reports on the development of a transient heat transfer model of a solar receiver–
reactor designed for thermochemical redox cycling by temperature and pressure swing of pure
cerium dioxide in the form of a reticulated porous ceramic (RPC).
To analyze the performance of the solar reactor and to gain insight into improved design and
operational conditions, a transient heat transfer model of the solar reactor for a solar radiative input
power of 50 kW during the reduction step was developed and implemented in ANSYS CFX. The
numerical model couples the incoming concentrated solar radiation using Monte Carlo ray tracing,
incorporates the reduction chemistry by assuming thermodynamic equilibrium, and accounts for
internal radiation heat transfer inside the porous ceria by applying effective heat transfer
properties.
The model was experimentally validated using data acquired in a high-flux solar simulator (HFSS),
where temperature evolution and oxygen production results from model and experiment agreed

Deliverable Report
D 4.1 GA No. 731287 42 Co-funded by the Horizon 2020 Framework
Programme of the European Union
well. Figure 26 shows a schematic of the experimental setup used to test the receiver. The reactor
configuration and experimental setup are described in detail in Zoller et al. [100].
Figure 26: Schematic of the experimental setup. During the endothermic reduction step (Eq. (5)) Ar flow is used
to protect the quartz window and is pumped out together with the released O2, while the reactor is under
vacuum. During the exothermic oxidation step (Eq. (7)), the ceria is fully reoxidized with CO2, thereby
producing CO. Details of the reactor configuration and experimental setup are available in Ref. [100].
Energy Flows
The instantaneous energy balance for the reduction step is illustrated as a function of time in Figure
27. Note that heat recovery was not applied. Losses by reradiation from the hot cavity, the change
in sensible heat content of the RPC, the remaining reactor components (Al2O3–SiO2 insulation,
aluminum front, reactor shell, and insulating jacket), the energy consumed by the endothermic
reduction reaction, the conductive heat loss to the water-cooled reactor front, and other heat
losses are indicated. Other heat losses include reflection of incoming solar radiation inside the
reactor cavity and at the quartz window, absorption of incoming radiation at the window, and
convection and radiation at the outer reactor surfaces.
Initially, sensible heating of the RPC dominates energy consumption, consuming 87% of the solar
radiative power input (Psolar ), while on average it consumes 33%. By the end of the reduction step,
reradiation dominates heat loss, accounting for 31% of Psolar on average and 45% at the peak.
Reradiation losses could be lowered by decreasing the size of the aperture, provided that solar
radiation can be delivered with higher concentration. A selective coating with high transmissivity in
the visible region of the solar spectrum, but high reflectivity in the IR region of the radiation emitted
by the hot cavity, could be considered for the quartz window, provided that the coating can
withstand very high temperatures (>500 °C). Sensible heating of the bulk materials consumes 21%
of Psolar on average, but levels off early in the reduction cycle, with the Al2O3–SiO2 insulation being
the dominant consumer, while the aluminum front, reactor shell, and insulating jacket consume
1.2% or less each. Energy loss through sensible heating of the bulk materials could be lowered if
insulation materials with lower specific heat capacity were used. The energy fraction driving the
endothermic reduction reaction of ceria quickly increases with time, and on average, accounts for
5.6% of Psolar.
The conduction heat losses to the water-cooled reactor front are significant, with an average
consumption of 2.7% of Psolar. The losses by convection and radiation at the outer reactor surfaces,
as well as the energy lost by reflection of the incoming solar radiation inside the reactor cavity,

Deliverable Report
D 4.1 GA No. 731287 43 Co-funded by the Horizon 2020 Framework
Programme of the European Union
account for less than 0.3% of Psolar each. The remaining 7.1% of Psolar is lost by absorption and
reflection at the quartz window (transmissivity = 0.929). Although not considered in the simulation,
convective losses associated with gases exiting the solar reactor during the reduction step are also
negligible (less than 0.3% of the input power). The share of energy used to drive the reduction
reaction, and therefore also representative of the solar-to-fuel energy conversion efficiency, could
potentially be increased by using doped ceria to increase the reduction extent [101,102], or by
minimizing the temperature swing with near isothermal operation [103–105], although this does not
necessarily increase the efficiency due to other limitations introduced with a lower temperature
swing.
Figure 27: Instantaneous energy balance for the duration of a reduction step. Other heat losses include
convection and radiation at the outer reactor surfaces, reflection of incoming solar radiation inside the
reactor cavity, and absorption and reflection at the quartz window. Extracted from Ref. [100].
Solar-to-fuel energy conversion efficiency
The solar-to-fuel energy conversion efficiency is defined as
Qsolar is the total solar energy input integrated over the reduction step. Note that Qsolar is only
delivered during the endothermic reduction step. Assuming complete re-oxidation using CO2, the
energy content of the fuel (CO) produced is calculated as , where ΔHfuel is
the heating value of CO (ΔHfuel = 283 kJ mol−1) and is the rate of released O2 integrated over
the reduction step. Qpump and Qinert are the energy penalties associated with vacuum pumping
and the consumption of the inert gas Ar during the reduction step, respectively, and are

Deliverable Report
D 4.1 GA No. 731287 44 Co-funded by the Horizon 2020 Framework
Programme of the European Union
calculated as described in Ref. [106]. Note that ηsolar-to-fuel is weakly dependent on the assumptions
used for the calculation of these two energy penalties, because Qsolar is roughly 2 orders of
magnitude larger than Qpump and Qinert.
An efficiency of ηsolar-to-fuel = 3.4% was predicted by the simulation, which is comparable to the
experimentally determined efficiency ηsolar-to-fuel = 3.2% (for Psolar = 30.5 kW). Heat recovery was not
applied. The slight overestimation is correlated directly to the slight overestimation in total O2 yield
from the simulation. The maximum ηsolar-to-fuel reported to date is 5.25% [107]. The numerical results
indicate the prominent influence of solar radiative input power, where increasing it substantially
reduces reduction time of the cerium dioxide structure. Consequently, the model predicts a solar-
to-fuel energy conversion efficiency of >6% at a solar radiative power input of 50 kW; efficiency
>10% can be obtained provided the RPC macroporosity is substantially increased, and better
volumetric absorption and uniform heating is achieved. Managing the ceria surface temperature
during reduction to avoid sublimation is a critical design consideration for direct absorption solar
receiver–reactors.
4.2. Thermal performance of a lab-scale ceramic volumetric air receiver
This section has been prepared by the Swiss Federal Institute of Technology (ETH), Zurich,
Switzerland based on Ref. [108].
Under the framework of the project INSHIP, a window-less ceramic cavity receiver is being
developed and tested at ETH Zurich to demonstrate supply of air as the heat transfer fluid for
industrial processes at high temperatures (>1000°C). An experimental setup has been developed to
test a lab-scale receiver. The cavity was made up of ceramic foam, namely reticulate porous
ceramic (RPC). Two different RPC materials were tested: ceria (~7 ppi (pores per inch)) and silicon-
infiltrated silicon carbide (SiSiC, 10 ppi). The goal was to demonstrate the proof-of-concept of the
open cavity air receiver and deliver air at high temperatures with reasonable receiver thermal
efficiencies.
A schematic of the receiver is depicted in Figure 28. The receiver consists of a cavity made up of
RPC material. In this work, pure ceria and silicon-infiltrated silicon carbide (SiSiC) are the materials
used as RPC materials. The receiver has a -diameter aperture to allow the entry of solar
radiation as well as ambient air. The cavity is composed of eight trapezoidal bricks, assembled to
form an octagonal cross-section, closed on the rear end with an octagonal cap, all made up of
the same material. The cavity is lined by fibrous ceria and Al2O3-SiO2 insulation layers. Between the
volumetric absorber and the fibrous ceria insulation, an air gap of is maintained to allow fluid
flow around the RPC. The outer shell of the receiver is made of Inconel 600 and the front is closed
by an Al2O3-SiO2 insulation disk and a water-cooled aluminum front plate.

Deliverable Report
D 4.1 GA No. 731287 45 Co-funded by the Horizon 2020 Framework
Programme of the European Union
Outer Shell, Inconel 600
Al2O3-SiO2
insulation
Water-cooledaluminumfront plate
CeO2 fibrousinsulation
Aperture
Air Outlet
Volumetricabsorber
Figure 28: Receiver Schematic. Extracted from Ref. [108].
Schematic of the experimental setup is shown in Figure 29. The receiver was tested at the High-Flux
Solar Simulator of ETH Zurich, with four solar power input levels between 2.5-5.0 kW at the receiver
aperture and for a range of air mass flow rates between 2-10 kg/h. A vacuum pump downstream
of the receiver suctions ambient air into the receiver. The “solar” power input is provided by a set of
xenon arc lamps.

Deliverable Report
D 4.1 GA No. 731287 46 Co-funded by the Horizon 2020 Framework
Programme of the European Union
Steel T-joints
Alumina Tube
Ambient Air in
Solar Flux in
RPC thermocouples
Open Volumetric Receiver
Cold Air Supply (blocked)
Inconel Outlet
Hot Air Outlet
Thermocouple for Air Outlet
T T T
T T
T
Air Mass Flow
Meter
Pu
mp
Co
rro
gate
dP
ipes
To Exhaust
WaterIn
WaterOut
WaterIn
WaterOut
Infrared Camera
T
T
Quartz-glass HX
Shell-and-Tube HX
Figure 29: Schematic of the final experimental setup. Extracted from Ref. [108].
Thermal efficiency of the receiver
Figure 30 shows the thermal efficiency of the receiver as a function of air outlet temperature, for the
four power input levels and two RPC materials, for a range of air mass flow rates. Air outlet
temperatures between 500°C to 1150°C were achieved, with receiver thermal efficiencies
between 0.58 and 0.25. Higher air mass flow rates lead to lower air outlet temperatures but also to
higher thermal receiver efficiencies. It is important for such a receiver to extract as much incoming
heat as possible and deliver it at the receiver outlet at as high air temperatures as possible. From
Figure 30, it can be seen that for a high input power level ( ), air outlet temperatures of
with corresponding thermal receiver efficiencies are possible. The receiver
efficiency is defined as the ratio of the enthalpy rise of the air (from ambient to outlet temperature)
to the solar radiative power coming in through the aperture. The receiver has therefore a viable
trade-off between the air outlet temperature and the thermal receiver efficiency at such a power
input level. This hints towards the level of input power at which this receiver can be operated to
extract high air outlet temperatures efficiently.

Deliverable Report
D 4.1 GA No. 731287 47 Co-funded by the Horizon 2020 Framework
Programme of the European Union
Figure 30: Thermal receiver efficiency over the air outlet temperature for different materials and power input
levels. Extracted from Ref. [108].
The difference between the two volumetric absorber materials is not clearly apparent from these
experiments. Only at low input power levels, SiSiC produces slightly higher air outlet temperatures at
air mass flow rates above than ceria RPC. For high input power levels, the two materials show
similar performances. The subtle differences in the performance of these two materials could be
explained when the overall heat transfer and fluid flow model of the receiver would be completed
and validated, which are also part of ongoing work under INSHIP. The validated model in turn
would assist in further improvements to the receiver design.
4.3. Mass and energy balances expected for a metallic volumetric
receiver
This section has been prepared by the Fondazione Bruno Kessler (FBK), Italy.
Among scientific literature, several works have presented different arrangements using volumetric
receivers for solar thermochemical fuel production[109][84][110]. In the first possible arrangement,
the reactor is directly impinged by the concentrated radiation; in this case, the reactor acts as a
volumetric receiver and is made by a reacting material. The second arrangement uses a heat
transfer fluid (HTF) to provide heat for the reaction, in this case, the volumetric receiver is directly
irradiated and transfers the heat to the HTF. For the second arrangement, depending on the
volumetric receiver type, the HTF could be used in an open or closed cycle. The volumetric receiver
is a crucial device to obtain a good efficiency of the system. FBK has developed a new
hierarchically layered volumetric receiver that could suit as receiver of the solar fuel production
cycle. In Figure 31, a lateral view of the receiver is presented [111].

Deliverable Report
D 4.1 GA No. 731287 48 Co-funded by the Horizon 2020 Framework
Programme of the European Union
2 0 0
725 600
550
261
145
Irradiance from homogenizer kW/m2
150 200
260 550 600
725
Receiver
Iso-irradiance
Homogeneizer
Figure 31: (left) Lateral view of FBK’s absorber, (right) Irradiance distribution at the absorber aperture plane
[109].
The development of variable geometry receivers built from the fractal repetition of elementary cells
has been made possible by recent advances in additive manufacturing techniques. These allow
for the design of creative highly-customized components based on complex geometries with
improved functionality. Selective laser melting (SLM), which utilizes a laser beam to melt successive
layers of powder into a finished part, has been the manufacturing technique employed here.
Receivers are manufactured in AISI 316L stainless steel, but Inconel 625 components can also be
produced. Porosity can be varied over a wide range of scales, the smallest pores achievable being
approximately 0.1mm in diameter. Convective heat transfer can be thus enhanced by employing if
required, augmentation features in this submicron scale. Additionally, variable porosity geometries
allow thermal conduction to be geometry-driven (by adjusting solid cross-sectional areas and
creating bottlenecks for the outward flow of heat) as well as material-driven.
A simplified system of a solar chemical reactor, based on the metallic volumetric receiver is
composed of i) solar dish as the dish developed during the CONTEST project, ii) the FBK hierarchical
receiver, iii) a blower that provides the air circulation to a iv) reactor, see Figure 32. Usually, the
system is designed to have some air return channels in order to maximize the hot air temperature at
the outlet of the receiver. The power input to receiver comes from the solar dish, as CONTEST dish,
that has a theoretical mirroring surface of 59m2. The efficiency of the concentrator (reflectivity,
tracking, and fouling) could be assumed to 0.85. The current focal area is designed to be 0.045 m2
with a geometrical concentration factor of 1311. The total power that hits the focal area is 47,2kW
with a DNI of 800W/m2. Now, the concentration energy is too high to guarantee the thermal and
mechanical stability of a metallic receiver (AISI 316L melting point is 1375 °C). Therefore, a full
concentration of the sun on the receiver should be avoided. Experiment conducted at the IMDEA
Energy Institute using calorimetric facility reveals that an irradiance of 700 kW/m2 can be tolerated
by the volumetric receiver based on AISI 316L [109].

Deliverable Report
D 4.1 GA No. 731287 49 Co-funded by the Horizon 2020 Framework
Programme of the European Union
Figure 32: Simplified System Chart of solar chemical reaction equipment
Figure 31 shows the total irradiance distribution on the solar volumetric receiver with a flux peak of
702 kW/m2. The typical temperature reached by air in this apparatus was in the range between
800-1200K. In this range of temperature, the efficiency can be calculated as the rate of enthalpy
rise of the working fluid divided by the total incident power. It thus gives an indication of the
capability of solar absorbers to transform incident solar power into enthalpy of the working fluid
through a series of radiative-to-convective heat transfer processes.
As is shown in Figure 33, the efficiency generally decreases with operating temperature, mainly
because of thermal re-radiation losses, proportional to the fourth power of temperature. The
maximum efficiency is 0.732. Taking into account the maximum incident irradiation power (650W)
the corresponding value of Q /m ̇0 at the best efficiency is 405.6 kJ kg−1, with corresponding working
fluid temperature rise of 285.8 K. Maximum thermal conversion efficiencies are observed in general
around 400 kJ kg−1 with temperature rises of the working fluid below 300 K in all cases, which further
proves the pronounced trade-off between thermal conversion efficiency and air outlet
temperature.
Using the calculated efficiencies, we can estimate in first approximation the energy and the mass
balances on a real dish (assuming an enough thermomechanical stability of the receiver), Figure
34.

Deliverable Report
D 4.1 GA No. 731287 50 Co-funded by the Horizon 2020 Framework
Programme of the European Union
0.4 0.6 0.8 1.0 1.2
0.40
0.45
0.50
0.55
0.60
0.65
0.70
0.75
Incident radiative power
350 W
500 W
650 WE
ffic
ien
cy
Mass Flow Rate [g/s]
Figure 33: Thermal conversion efficiency of the volumetric receiver as a function of incident radiative power
and mass flow rate
Figure 34: Sketch of the transformation of the solar irradiance solar chemical reactor with a thermal conversion
efficiency
Considering solar irradiance on the dish of 800 W/m2 and a mirror reflectance of 0.85, a 25%
energy loss due to fill factor induced by geometry of volumetric receiver, and 73,2% receiver
efficiency around 22kW can be transferred to the heated fluid in the cycle, which results to an air
mass flow rate of 52,8g/s.
The authors underline that the experiment is limited to a single receiver with a focused area of 0.045
m2 and for a limited number of the conditions. Further investigation using computational
experiments is necessary to estimate in accurate mode the total energy balance and mass
balance of a real solar dish, such as the CONTEST installation.

Deliverable Report
D 4.1 GA No. 731287 51 Co-funded by the Horizon 2020 Framework
Programme of the European Union
5. Fuels production from agricultural waste via gasification
The following sections provide an overview of the work carried out by INSHIP members under Task
4.3 of WP4 (Solar fuel production for the transportation sector).
Among existing biomass conversion technologies, biomass gasification offers high conversion
efficiency and the possibility to handle different bio-feedstock for a wide variety of applications
(heat, electricity, chemicals and transport fuels). Biomass gasification is a thermochemical process
that converts, through partial oxidation at high temperatures, solid biomass into fuel gas, small
quantities of char, ash and several condensable compounds (tars and oils). A promising alternative
to the conventional gasification process is represented by solar-assisted steam-only gasification,
which can convert carbonaceous materials into a quality syngas, high in H2 content and CO2 free.
Concentrated solar energy is used to drive the highly endothermic gasification reactions. Various
solar reactor concepts have been investigated as described in the following sections.
5.1. Solar reactor concepts for gasification of carbonaceous materials
This section has been prepared by the Centro de Investigaciones Energéticas, Medioambientales y
Tecnológicas (CIEMAT), Spain
Solar reactors for biomass gasification
There are many varying ideas for optimizing the use of concentrated solar energy to gasify biomass.
Designs that have been proposed are packed bed, fluidized bed, entrained flow, and drop-tube.
Some advantages and limitations of different reactor configurations are shown in Table 17.
Table 17 Advantages and limitations of different gasifier types
Gasifier Type Advantages Limitations
Packed Bed Simple design At low temperature, more
tar produced
Long solid residence time Limitations of mass
and heat transfer
Ash buildup
Fluidized Bed Compact construction Gas stream contains fine
particles of dust
Uniform temperature profile Complex system due to low
biomass hold up in the fuel
bed
Accept fuel size variation Variety of biomass can be
used but fuel flexibility is
applicable for biomass of
0.1 cm to 1 cm size
High ash melting point of biomass dos
not lead to clinker formation
Entrained flow Applicable to large systems High investment
Short residence time Strict fuel requirements

Deliverable Report
D 4.1 GA No. 731287 52 Co-funded by the Horizon 2020 Framework
Programme of the European Union
Mass and Energy Balances
The global reaction of steam gasification process of a biomass fuel can be expressed as:
)(42222 sCCHOHCOCOHOHOCH ba
where, CHaOb represents the biomass fuel. A simplified mass balance is given in the following
equation:
CCHOHCOCOHOHOCH nnnnnnnnba
42222
where n represents the molar flow of the biomass, steam, residual carbon and the gas products. A
heat balance is also provided considering that there are several inputs and outputs associated with
a solar gasifier that can be considered to examine the energetic and efficiencies of the gasifier,
allowing for comparison with other solar and traditional gasifier systems: inputs are solar heat,
steam, and biomass, while the output is a product gas and char.
A brief heat balance is presented for calculating the efficiency of the cavity reactor:
lossesnetinput QQQ
The Q input includes the heat transferred to the reactants Qnet as well as the major heat losses. Q losses
account for thermal energy losses by radiation (Qrad), re-radiation (Qrerad) and convection (Qother).
The net heat transfer to the reactants Qnet was determined by an energy balance across the
reactor, considering heat flows entering the reactor and leaving it.
heatproductccii isteamsteamOCHOCHnet QHnHnHnHnQbaba ,
The unreacted char is labelled as c and it was assumed to be pure carbon. Gas species i are H2,
CO, CO2, H2O and CH4 and Q product heat represents the sensible heat of the flowing gas.
The enthalpies of the biomass ΔHCHaOb and the char ΔHc are based on their LHV and composition.
OCHOCHOHCOOCH aabaLHVmHHH
22 21
charcharCOc LHVmHH 2
The energy conversion efficiency is defined by:
baba OCHOCHsolar
heatproductccii i
LHVmQ
QHnHn
,
Our preliminary studies conclude that the best energy conversion efficiency was found for packed-
bed reactor configuration with a value of 30%. However, this overview indicates that their capacity
ranges are only a few kilowatts (2–25 kW) or even smaller.
Some works for process integration in the existing solar technologies have been given by Segal and
Epstein [112] and Piatkowski et al. [113] with a beam-down solar concept as the preferred option to
packed bed, etc.
The beam-down concept has some advantages over standard tower-top reactor arrangements. It
allows a large scale reactor to be built on the ground and the solar radiation to enter the reactor
through a window. Another advantage of this arrangement is that it allows for a large heliostat field

Deliverable Report
D 4.1 GA No. 731287 53 Co-funded by the Horizon 2020 Framework
Programme of the European Union
compared with that in conventional tower system, thus much higher solar energy can be obtained
into a one receiver with high concentration. According to Siegel et al. [114], The beam-down
secondary optics perform with an optical efficiency of 93% resulting in an overall collection
efficiency.
Several measures of efficiency can be used in examining a solar gasifier plant performance. A solar
efficiency can be defined based on the equation as follows, indicating that the efficiency of the
gasifier is dependent on the efficiency of the solar technology.
beamdownsolar
The resulting value for the solar for a packed bed coupled with a beam-down concept would be
about 28%.
5.2. Co-production of syngas and potassium-based fertilizer by solar-driven
thermochemical conversion of crop residues
This section has been prepared by the Swiss Federal Institute of Technology (ETH), Zurich,
Switzerland based on Ref. [115].
This work [115], conducted under the INSHIP project, reports on the thermochemical conversion of
inedible crop residues using concentrated solar energy as the source of high-temperature process
heat. Experiments were performed using a 5 kWth solar packed-bed reactor exposed to radiative
fluxes up to 1788 suns (Figure 35). The waste biomass feedstock consisted of unprocessed batches
of cotton boll, soybean husk, and black mustard husk and straw, which were pyrolysed and steam-
based gasified at nominal temperatures in the range 879–1266 °C, yielding high-quality syngas with
molar ratios in the range H2:CO = 1.43–3.25, CO2:CO = 0.28–1.40, and CH4:CO = 0.03–0.28.

Deliverable Report
D 4.1 GA No. 731287 54 Co-funded by the Horizon 2020 Framework
Programme of the European Union
Figure 35: (left) Schematic of the solar packed-bed reactor, (right) Solar experimental setup: (T)
thermocouples, (1) peristaltic pump, (2) steam generator, (3) electrically heated tubes, (4) mass flow
controllers, (5) spring over-pressure valve and pressure transmitter, (6) high-flux solar simulator, (7) mechanical
shutter, (8) deflection mirror, (9) tar cracker, (10) condensation tube, (11) scrubber, (12) filter. Extracted from
Ref. [115].
The carbon conversion, XC, is defined as the portion of the initial mass of carbon present in the
feedstock that has been converted:
C,residue
C
C,feedstock
1m
Xm
The carbon-gas yield, Ygas, is defined as the portion of the initial molar amount of carbon present in
the feedstock that has been converted to CO, CO2, and CH4:
2 4CO CO CH
gas
C,feedstock
n n nY
n
The solar-to-fuel energy conversion efficiency, ηsolar-to-fuel, is defined as the ratio of the heating value
of the syngas produced to the solar radiative energy input and the heating value of the feedstock
[116]:
syngas syngas
solar-to-fuel
solar feedstock feedstock
m LHV
Q m LHV
,
where Qsolar = ʃ Q̇solar dt, integrated over the duration of the entire experimental run. The sensible
heat required for steam generation is assumed to be generated using the waste heat from the
exhaust gases. The energetic upgrade factor, U, is defined as the ratio of the heating value of the
syngas produced to that of the feedstock [116]:

Deliverable Report
D 4.1 GA No. 731287 55 Co-funded by the Horizon 2020 Framework
Programme of the European Union
syngas syngas
feedstock feedstock
m LHVU
m LHV
Table 18 – Properties of the produced soybean husk charcoal and the operational conditions and
results of the solar pyrolysis of soybean husk and of the solar gasification of soybean husk charcoal.
Extracted from Ref. [115].
Characterization of the SBH charcoal
Ultimate (daf)
C 75.31 wt%
H 2.60 wt%
N 2.64 wt%
O 19.29 wt%
S 0.16 wt%
Proximate
Fixed
carbon 58.50 wt%
Volatiles 21.90 wt%
Moisture* 3.96 wt%
Ash 15.62 wt%
LHV 20.32 MJ/kg
SSA 5.15 ± 0.15 m2/g
Operational conditions and results
Pyrolysis: Gasification:
Tabsorber 1252 °C
Ttop,peak 1035 °C Ttop 1209 °C
mfeedstock 356 g mfeedstock 102 g
nH2 4.13 mol nH2 5.91 mol
nCO 3.21 mol nCO 3.57 mol
nCO2 1.88 mol nCO2 0.91 mol
nCH4 1.11 mol nCH4 0.07 mol
mresidue 99 g mresidue 10.2 g
∆t 36 min ∆t 98 min
XC 55.8 % XC 99.9 %
Ygas 54.6 % Ygas 87.9 %
ηsolar-to-fuel 30.7 % ηsolar-to-fuel 9.9 %
U 0.80 U 1.2
*Moisture content is not considered in the pyrolysis run.
The solar-to-fuel energy conversion efficiency, defined as the ratio of the heating value of the
syngas produced to the solar radiative energy input and the heating value of the feedstock,
reached 18%. The heating value of the feedstock was solar-upgraded by 7%, thus outperforming
autothermal gasification that typically downgrades by at least 15%. The ash contained 23%

Deliverable Report
D 4.1 GA No. 731287 56 Co-funded by the Horizon 2020 Framework
Programme of the European Union
potassium. The solar-driven thermochemical process offers a sustainable and efficient path for the
conversion of agricultural wastes into valuable fuels and soil fertilizers.
Summary
The technical feasibility of the solar packed-bed reactor was demonstrated for the pyrolysis and
gasification of unprocessed cotton boll, soybean husk, and black mustard husk and straw. The
quality of the syngas produced was substantially higher than the one resulting from autothermal
gasification [117–119], and was not significantly influenced by the characteristics of the
heterogeneous feedstocks. Energetic upgrade factors above 1 further supported the advantages
of solar-driven gasification vis-à-vis autothermal gasification. The relatively high values obtained for
the solar-to-fuel energy conversion efficiency at the 5 kWth laboratory scale pointed out to the
economic potential of the technology; higher values are expected for a scale-up because of the
larger volume-to-area ratio of the reaction chamber [120]. The ash was shown to be suitable for K-
based fertilizers. In sum, the solar-driven valorization of inedible crop residues is beneficial for the
local and global environment, as it co-produces a carbon-neutral synthetic fuel and a natural
fertilizer using renewable energy and without competing with the food chain.

Deliverable Report
D 4.1 GA No. 731287 57 Co-funded by the Horizon 2020 Framework
Programme of the European Union
6. Degree of progress
This document constitutes Deliverable D4.1 under Work Package 4 of the INSHIP project. This
Deliverable reports results of ongoing work related to mass and energy balances of selected high-
temperature industrial processes driven by concentrated solar process heat and related solar
chemical reactor concepts thereof. Further progress is expected from these research activities until
the end of the project (end of the year 2020).

Deliverable Report
D 4.1 GA No. 731287 58 Co-funded by the Horizon 2020 Framework
Programme of the European Union
7. Dissemination
Parts of this document that are directly related to work carried out under the INSHIP project have
been disseminated through the following publications:
Journal articles
Davis D., Müller F., Saw W., Steinfeld A., Nathan G.J., “Solar-driven alumina calcination for CO2
mitigation and improved product quality”, Green Chemistry, Vol. 19, pp. 2992-3005, 2017.
F. Müller, H. Patel, D. Blumenthal, P. Poživil, P. Das, C. Wieckert, P. Maiti, S. Maiti, A. Steinfeld, Co-
production of syngas and potassium-based fertilizer by solar-driven thermochemical conversion of
crop residues, Fuel Process. Technol. 171 (2018) 89–99. doi:10.1016/J.FUPROC.2017.08.006.
Muhich C., Blaser S., Hoes M., Steinfeld A., “Comparing the solar-to-fuel energy conversion
efficiency of ceria and perovskite based thermochemical redox cycles for splitting H2O and CO2”,
International Journal of Hydrogen Energy, Vol. 43, pp. 18814-18831, 2018.
S. Luque, G. Menéndez, M. Roccabruna, J. González-Aguilar, L. Crema, M. Romero, Exploiting
volumetric effects in novel additively manufactured open solar receivers, Sol. Energy. 174 (2018)
342–351. doi:10.1016/j.solener.2018.09.030.
Conference proceedings/presentations
E. Johnson, D. Baker, I. Tari, Development of View Factor Correlations for Modeling Thermal
Radiation in Solid Particle Solar Receivers Using CFD-DEM, AIP Conf. Proc. (2018).
E. Johnson, D. Baker, I. Tari, Proposal of a novel gravity-fed, particle-filled solar receiver, in: AIP Conf.
Proc., 2017. doi:10.1063/1.4984371.
V. Patil and A. Steinfeld, Heat Transfer and Fluid Flow Analysis of a Volumetric Ceramic Solar
Receiver for High-Temperature Processing, ASME Energy Sustainability Conference, Orlando, USA
(2018)
V. Patil and A. Steinfeld, “Ceramic volumetric receivers for high-temperature solar process heat:
investigating the potential of anisotropic morphology”, 13th SOLLAB Doctoral Colloquium on Solar
Concentrating Technologies, Berlin, Germany, May 15-17, 2017.

Deliverable Report
D 4.1 GA No. 731287 59 Co-funded by the Horizon 2020 Framework
Programme of the European Union
8. References
[1] A. Kurucak, Flow Sheet Optimization By the Concept of Sustainable, METU, 2010.
[2] S. Avcu, G.K. Demir, M.E. Martı, M. Özgören, AA25 - Investigation of energy efficiency
improvements in alumina refinery of Seydiehir ETI Aluminium Plant.pdf, in: n.d.: pp. 1–8.
[3] M. Obaidat, A. Al-Ghandoor, P. Phelan, R. Villalobos, A. Alkhalidi, Energy and exergy analyses
of different aluminum reduction technologies, Sustain. 10 (2018) 1–21.
doi:10.3390/su10041216.
[4] V. Gusberti, D.S. Severo, B.J. Welch, M. Skyllas-Kazacos, Modelling the Aluminium Smelting
Cell Mass and Energy Balance–a Tool Based on the 1st Law of Thermodynamics, Proc. 10th
Aust. Alum. Smelt. Technol. Conf. Launceston, TAS. (2011) 1–23.
[5] E. Balomenos, D. Panias, I. Paspaliaris, Energy and exergy analysis of the primary aluminum
production processes: A review on current and future sustainability, Miner. Process. Extr.
Metall. Rev. 32 (2011) 69–89. doi:10.1080/08827508.2010.530721.
[6] E. Balomenos, D. Panias, Carbothermic Reduction of Alumina: A Review of Developed
Processes and Novel Concepts, Proc. EMC. (2011) 729–744.
[7] D. Davis, F. Müller, W.L. Saw, A. Steinfeld, G.J. Nathan, Solar-driven alumina calcination for
CO 2 mitigation and improved product quality, Green Chem. 19 (2017) 2992–3005.
doi:10.1039/C7GC00585G.
[8] K. Kermeli, P.-H. ter Weer, W. Crijns-Graus, E. Worrell, Energy efficiency improvement and GHG
abatement in the global production of primary aluminium, Energy Effic. 8 (2015) 629–666.
doi:10.1007/s12053-014-9301-7.
[9] The International Aluminium Institute, Statistics, (2016). http://www.world-
aluminium.org/statistics/ (accessed December 4, 2016).
[10] F. Williams, H.-W. Schmidt, Flash- and CFB Calciners, History and Difficulties of Development of
Two Calcination Technologies, in: Light Met. 2012, Springer International Publishing, Cham,
2012: pp. 135–140. doi:10.1007/978-3-319-48179-1_24.
[11] B.E. Raahauge, Smelter Grade Alumina Quality in 40+ Year Perspective: Where to From
Here?, in: Light Met. 2015, John Wiley & Sons, Inc., Hoboken, NJ, USA, 2015: pp. 73–78.
doi:10.1002/9781119093435.ch14.
[12] L.M. Perander, Z.D. Zujovic, T.F. Kemp, M.E. Smith, J.B. Metson, The nature and impacts of fines
in smelter-grade alumina, JOM. 61 (2009) 33–39. doi:10.1007/s11837-009-0164-x.
[13] K. Lovegrove, S. Edwards, N. Jacobson, J. Jordan, J. Petersheim, J. Rutowitz, H. Saddler, M.
Watt, J. Wyder, Renewable energy options for Australian industrial gas users, 2015.
[14] J. Barrie, B. Christine, Improvements in the Design and Operation of Alumina Flash Calciners,
IFRF Combust. J. (2001).
http://citeseerx.ist.psu.edu/viewdoc/download?doi=10.1.1.599.1095&rep=rep1&type=pdf
(accessed December 14, 2018).
[15] C. Klett, L. Perander, Alumina Calcination: A Mature Technology Under Review from Supplier
Perspective, in: Light Met. 2015, Springer International Publishing, Cham, 2015: pp. 79–84.
doi:10.1007/978-3-319-48248-4_15.
Deliverable Report
D 4.1 GA No. 731287 60 Co-funded by the Horizon 2020 Framework
Programme of the European Union
[16] T. Eglinton, J. Hinkley, A. Beath, M. Dell’Amico, Potential Applications of Concentrated Solar
Thermal Technologies in the Australian Minerals Processing and Extractive Metallurgical
Industry, JOM. 65 (2013) 1710–1720. doi:10.1007/s11837-013-0707-z.
[17] D. Hirsch, A. Steinfeld, Radiative transfer in a solar chemical reactor for the co-production of
hydrogen and carbon by thermal decomposition of methane, Chem. Eng. Sci. 59 (2004)
5771–5778. doi:10.1016/J.CES.2004.06.022.
[18] R. Bertocchi, Carbon Particle Cloud Generation for a Solar Particle Receiver, J. Sol. Energy
Eng. 124 (2002) 230. doi:10.1115/1.1488666.
[19] L.A. Dombrovsky, W. Lipiński, A. Steinfeld, A diffusion-based approximate model for radiation
heat transfer in a solar thermochemical reactor, J. Quant. Spectrosc. Radiat. Transf. 103
(2007) 601–610. doi:10.1016/J.JQSRT.2006.08.003.
[20] D. Mischler, A. Steinfeld, Nonisothermal Nongray Absorbing-Emitting-Scattering Suspension of
Fe3O4 Particles Under Concentrated Solar Irradiation, J. Heat Transfer. 117 (1995) 346.
doi:10.1115/1.2822528.
[21] A. Z’Graggen, P. Haueter, D. Trommer, M. Romero, J.C. de Jesus, A. Steinfeld, Hydrogen
production by steam-gasification of petroleum coke using concentrated solar power—II
Reactor design, testing, and modeling, Int. J. Hydrogen Energy. 31 (2006) 797–811.
doi:10.1016/J.IJHYDENE.2005.06.011.
[22] I. Padilla, A. López-Delgado, S. López-Andrés, M. Álvarez, R. Galindo, A.J. Vazquez-
Vaamonde, The application of thermal solar energy to high temperature processes: case
study of the synthesis of alumina from boehmite., Sci. World J. 2014 (2014) 825745.
doi:10.1155/2014/825745.
[23] A. Steinfeld, A. Imhof, D. Mischler, Experimental Investigation of an Atmospheric-Open
Cyclone Solar Reactor for Solid-Gas Thermochemical Reactions, J. Sol. Energy Eng. 114 (1992)
171–174. doi:10.1115/1.2930001.
[24] A. Meier, E. Bonaldi, G.M. Cella, W. Lipinski, D. Wuillemin, Solar chemical reactor technology
for industrial production of lime, Sol. Energy. 80 (2006) 1355–1362.
doi:10.1016/J.SOLENER.2005.05.017.
[25] V. Nikulshina, M. Halmann, A. Steinfeld, Coproduction of Syngas and Lime by Combined
CaCO3-Calcination and CH4-Reforming Using a Particle-Flow Reactor Driven by
Concentrated Solar Radiation, Energy & Fuels. 23 (2009) 6207–6212. doi:10.1021/ef9007246.
[26] G. Flamant, D. Hernandez, C. Bonet, J.-P. Traverse, Experimental aspects of the
thermochemical conversion of solar energy; Decarbonation of CaCO3, Sol. Energy. 24 (1980)
385–395. doi:10.1016/0038-092X(80)90301-1.
[27] H. Wang, B. Xu, P. Smith, M. Davies, L. DeSilva, C. Wingate, Kinetic modelling of gibbsite
dehydration/amorphization in the temperature range 823–923 K, J. Phys. Chem. Solids. 67
(2006) 2567–2582. doi:10.1016/J.JPCS.2006.07.016.
[28] K. Wefers, C. Misra, Oxides and hydroxides of aluminum, Report 19, Alcoa, 1987.
http://epsc511.wustl.edu/Aluminum_Oxides_Alcoa1987.pdf (accessed December 14, 2018).
[29] M. Kruesi, M.E. Galvez, M. Halmann, A. Steinfeld, Solar Aluminum Production by Vacuum
Carbothermal Reduction of Alumina—Thermodynamic and Experimental Analyses, Metall.
Mater. Trans. B. 42 (2011) 254–260. doi:10.1007/s11663-010-9461-6.
[30] International Aluminum Institute, International Aluminum Institute, Aluminum for Future
Generations Sustainability Update 2007., (2007). http://www.world-aluminium.org.

Deliverable Report
D 4.1 GA No. 731287 61 Co-funded by the Horizon 2020 Framework
Programme of the European Union
[31] W.T. Choate, J.A.S. Green, Light Metals 2006 Volume 2: Aluminum Reduction Technology, T.J.
Galloway Ed, 2006.
[32] W.T. Choate, J.A.S. Green, U.S. Energy Requirements for Aluminum Production, Historical
Perspective, Theoretical Limits and New Opportunities, 2003, 2003.
http://www1.eere.energy.gov/industry/aluminum/pdfs/al_theoretical.pdf.
[33] J.H. Cox, L.M. Pidgeon, AN INVESTIGATION OF THE ALUMINUM–OXYGEN–CARBON SYSTEM,
Can. J. Chem. 41 (1963) 671–683. doi:10.1139/v63-095.
[34] M. Halmann, A. Frei, A. Steinfeld, Carbothermal reduction of alumina: Thermochemical
equilibrium calculations and experimental investigation, Energy. 32 (2007) 2420–2427.
doi:10.1016/j.energy.2007.06.002.
[35] R.J. Fruehan, Y. Li, G. Carkin, Mechanism and rate of reaction of Al2O, Al, and CO vapors
with carbon, Metall. Mater. Trans. B Process Metall. Mater. Process. Sci. 35B (2004) 617–623.
doi:10.1007/s11663-004-0002-z.
[36] R. Winand, M. Van Gysel, A. Fontana, L. Segers, J. Carlier, Production of Magnesium by
vacuum carbothermic reduction of calcined dolomite, Trans. Inst. Min. Metall. Sect. C -
Miner. Process. Extr. Metall. 99 (1990) C105–C112.
[37] J.M. Toguri, L.M. Pidgeon, HIGH-TEMPERATURE STUDIES OF METALLURGICAL PROCESSES: PART I.
THE THERMAL REDUCTION OF MAGNESIUM OXIDE WITH SILICON, Can. J. Chem. 39 (1961) 540–
547. doi:10.1139/v61-065.
[38] J.M. Toguri, L.M. Pidgeon, HIGH-TEMPERATURE STUDIES OF METALLURGICAL PROCESSES: PART II.
THE THERMAL REDUCTION OF CALCINED DOLOMITE WITH SILICON, Can. J. Chem. 40 (1962)
1769–1776. doi:10.1139/v62-271.
[39] S. Ramakrishnan, P. Koltun, Global warming impact of the magnesium produced in China
using the Pidgeon process, Resour. Conserv. Recycl. 42 (2004) 49–64.
doi:10.1016/J.RESCONREC.2004.02.003.
[40] P.G. Loutzenhiser, O. Tuerk, A. Steinfeld, Production of Si by vacuum carbothermal reduction
of SiO2 using concentrated solar energy, JOM. 62 (2010) 49–54. doi:10.1007/s11837-010-0137-
0.
[41] A. Steinfeld, High-temperature solar thermochemistry for CO2 mitigation in the extractive
metallurgical industry, Energy. (1997). doi:10.1016/S0360-5442(96)00103-X.
[42] J.P. Murray, Aluminum Production Using High-Temperature Solar Process Heat, Sol. Energy. 66
(1999) 133–142. doi:10.1016/S0038-092X(99)00011-0.
[43] A. Steinfeld, P. Kuhn, J. Karni, High-temperature solar thermochemistry: Production of iron and
synthesis gas by Fe3O4-reduction with methane, Energy. 18 (1993) 239–249. doi:10.1016/0360-
5442(93)90108-P.
[44] A. Steinfeld, M. Brack, A. Meier, A. Weidenkaff, D. Wuillemin, A solar chemical reactor for co-
production of zinc and synthesis gas, Energy. 23 (1998) 803–814. doi:10.1016/S0360-
5442(98)00026-7.
[45] T. Osinga, U. Frommherz, A. Steinfeld, C. Wieckert, Experimental Investigation of the Solar
Carbothermic Reduction of ZnO Using a Two-cavity Solar Reactor, J. Sol. Energy Eng. 126
(2004) 633–637. doi:10.1115/1.1639001.
[46] J.P. Murray, A. Steinfeld, E.A. Fletcher, Metals, nitrides, and carbides via solar carbothermal
reduction of metal oxides, Energy. 20 (1995) 695–704. doi:10.1016/0360-5442(95)00032-C.

Deliverable Report
D 4.1 GA No. 731287 62 Co-funded by the Horizon 2020 Framework
Programme of the European Union
[47] J.P. Murray, Solar Production of Aluminum by Direct Reduction: Preliminary Results for Two
Processes, J. Sol. Energy Eng. 123 (2001) 125. doi:10.1115/1.1351809.
[48] M.E. Gálvez, A. Frei, F. Meier, A. Steinfeld, Production of AlN by carbothermal and
methanothermal reduction of Al2O3in a N2flow using concentrated thermal radiation, Ind.
Eng. Chem. Res. 48 (2009) 528–533. doi:10.1021/ie8011193.
[49] Centre for Research in Computational Thermochemistry Ecole Polytechnique de Montreal
Canada, FactSage - Thermochemical Software & Database Package, (n.d.).
www.crct.polymtl.ca.
[50] NIST, Standard Reference Data Program, Chemistry Webbook, (n.d.).
http://webbook.nist.gov/chemistry.
[51] A. Roine, HSC Chemistry 5, Outokumpu Research, Finland, n.d.
[52] M.E. Gálvez, A. Frei, G. Albisetti, G. Lunardi, A. Steinfeld, Solar hydrogen production via a two-
step thermochemical process based on MgO/Mg redox reactions—Thermodynamic and
kinetic analyses, Int. J. Hydrogen Energy. 33 (2008) 2880–2890.
doi:10.1016/J.IJHYDENE.2008.04.007.
[53] H. Li, S. Xie, Research on development of dolomite-ferrosilicon thermal reduction process of
magnesium production, J. Rare Earths. 23 (2005) 606–610.
[54] G. Brooks, S. Trang, P. Witt, M.N.H. Khan, M. Nagle, The carbothermic route to magnesium,
JOM. 58 (2006) 51–55. doi:10.1007/s11837-006-0024-x.
[55] L.H. Prentice, M.W. Nagle, T.R.D. Barton, S. Tassios, B.T. Kuan, P.J. Witt, K.K. Constanti-Carey,
Carbothermal Production of Magnesium: Csiro’s MagsonicTM Process, in: Magnes. Technol.
2012, Springer International Publishing, Cham, 2012: pp. 31–35. doi:10.1007/978-3-319-48203-
3_6.
[56] J.W. Evans, The evolution of technology for light metals over the last 50 years: Al, Mg, and Li,
JOM. 59 (2007) 30–38. doi:10.1007/s11837-007-0020-9.
[57] A. Argyn, Material and Heat Balance Calculations of Eti-Bakir Plant By Computer a Thesis,
METU, 2008.
[58] B.T.K. Barry, C.J. Thwaites, Tin and its alloys and compounds, Ellis Horwood, 1983.
[59] C.L. Mantell, Tin: Its Mining, Production, Technology and Application, Hafner Publishing Co
Ltd, 1970.
[60] G.G. Graf, Tin, Tin Alloys, and Tin Compounds, in: Ullmann’s Encycl. Ind. Chem., Wiley-VCH
Verlag GmbH & Co. KGaA, Weinheim, Germany, 2000. doi:10.1002/14356007.a27_049.
[61] A. Meier, N. Gremaud, A. Steinfeld, Economic evaluation of the industrial solar production of
lime, Energy Convers. Manag. 46 (2005) 905–926. doi:10.1016/J.ENCONMAN.2004.06.005.
[62] IEA, Technology Roadmap: Low-Carbon Transition in the Cement Industry, (2018) 66.
doi:10.1007/SpringerReference_7300.
[63] T. Engin, V. Ari, Energy auditing and recovery for dry type cement rotary kiln systems - A case
study, Energy Convers. Manag. 46 (2005) 551–562. doi:10.1016/j.enconman.2004.04.007.
[64] A. Atmaca, R. Yumrutaş, Analysis of the parameters affecting energy consumption of a rotary
kiln in cement industry, Appl. Therm. Eng. 66 (2014) 435–444.
doi:10.1016/j.applthermaleng.2014.02.038.

Deliverable Report
D 4.1 GA No. 731287 63 Co-funded by the Horizon 2020 Framework
Programme of the European Union
[65] A. Atmaca, R. Yumrutaş, Thermodynamic and exergoeconomic analysis of a cement plant:
Part II - Application, Energy Convers. Manag. 79 (2014) 799–808.
doi:10.1016/j.enconman.2013.11.054.
[66] A. Atmaca, R. Yumrutaş, Thermodynamic and exergoeconomic analysis of a cement plant:
Part i - Methodology, Energy Convers. Manag. 79 (2014) 790–798.
doi:10.1016/j.enconman.2013.11.053.
[67] World Business Council for Sustainable Development (WBCSD), Getting the Numbers Right
(GNR) - Global Cement Database on CO₂ and Energy Information Geographic coverage by
country and region, GNR Proj. Report. CO2. (2016). https://www.wbcsdcement.org/GNR-
2016/ (accessed February 7, 2018).
[68] G. Kabir, A.I. Abubakar, U.A. El-Nafaty, Energy audit and conservation opportunities for
pyroprocessing unit of a typical dry process cement plant, Energy. 35 (2010) 1237–1243.
doi:10.1016/j.energy.2009.11.003.
[69] A. Ustaoglu, M. Alptekin, M.E. Akay, Thermal and exergetic approach to wet type rotary kiln
process and evaluation of waste heat powered ORC (Organic Rankine Cycle), Appl. Therm.
Eng. 112 (2017) 281–295. doi:10.1016/j.applthermaleng.2016.10.053.
[70] Z. Cao, L. Shen, J. Zhao, L. Liu, S. Zhong, Y. Yang, Modeling the dynamic mechanism between
cement CO2emissions and clinker quality to realize low-carbon cement, Resour. Conserv.
Recycl. 113 (2016) 116–126. doi:10.1016/j.resconrec.2016.06.011.
[71] M.B. Ali, R. Saidur, M.S. Hossain, A review on emission analysis in cement industries, Renew.
Sustain. Energy Rev. 15 (2011) 2252–2261. doi:10.1016/j.rser.2011.02.014.
[72] N.A. Madlool, R. Saidur, M.S. Hossain, N.A. Rahim, A critical review on energy use and savings
in the cement industries, Renew. Sustain. Energy Rev. 15 (2011) 2042–2060.
doi:10.1016/j.rser.2011.01.005.
[73] C.K. Ho, J.M. Christian, J. Yellowhair, N. Siegel, S. Jeter, M. Golob, S.I. Abdel-Khalik, C. Nguyen,
H. Al-Ansary, On-sun testing of an advanced falling particle receiver system, AIP Conf. Proc.
1734 (2016). doi:10.1063/1.4949074.
[74] E. Johnson, D. Baker, I. Tari, Proposal of a novel gravity-fed, particle-filled solar receiver, in: AIP
Conf. Proc., 2017. doi:10.1063/1.4984371.
[75] G. Flamant, D. Gauthier, H. Benoit, J.-L. Sans, B. Boissière, R. Ansart, M. Hemati, A New Heat
Transfer Fluid for Concentrating Solar Systems: Particle Flow in Tubes, Energy Procedia. 49
(2014) 617–626. doi:10.1016/j.egypro.2014.03.067.
[76] C.K. Ho, A new generation of solid particle and other high-performance receiver designs for
concentrating solar thermal (CST) central tower systems, Adv. Conc. Sol. Therm. Res. Technol.
(2017) 107–128. doi:10.1016/B978-0-08-100516-3.00006-X.
[77] A.B. Morris, Z. Ma, S. Pannala, C.M. Hrenya, Simulations of heat transfer to solid particles
flowing through an array of heated tubes, Sol. Energy. 130 (2016) 101–115.
doi:10.1016/j.solener.2016.01.033.
[78] E. Johnson, D. Baker, I. Tari, Development of View Factor Correlations for Modeling Thermal
Radiation in Solid Particle Solar Receivers Using CFD-DEM, AIP Conf. Proc. (2018).
[79] C. Goniva, C. Kloss, A. Hager, S. Pirker, An open source CFD-DEM perspective, Proc.
OpenFOAM Work. (2010) 1–10.
[80] C. Kloss, C. Goniva, A. Hager, S. Amberger, S. Pirker, Models , algorithms and validation for

Deliverable Report
D 4.1 GA No. 731287 64 Co-funded by the Horizon 2020 Framework
Programme of the European Union
opensource DEM and CFD-DEM, Pcfd. 12 (2012) 140–152. doi:10.1504/PCFD.2012.047457.
[81] F.P. Incropera, D.P. DeWitt, T.L. Bergman, A.S. Lavine, Fundamentals of Heat and Mass
Transfer, John Wiley & Sons, 2007. doi:10.1016/j.applthermaleng.2011.03.022.
[82] A. Malinouski, Evaluation of particle-scale radiative heat transfer in polydisperse beds, (2017).
[83] A. Meier, E. Bonaldi, G.M. Cella, W. Lipinski, Multitube Rotary Kiln for the Industrial Solar
Production of Lime, J. Sol. Energy Eng. 127 (2005) 386. doi:10.1115/1.1979517.
[84] M. Romero, A. Steinfeld, Concentrating solar thermal power and thermochemical fuels,
Energy Environ. Sci. 5 (2012) 9234–9245. doi:10.1039/c2ee21275g.
[85] N.S. Lewis, D.G. Nocera, Powering the planet: chemical challenges in solar energy utilization.,
Proc. Natl. Acad. Sci. U. S. A. 103 (2006) 15729–35. doi:10.1073/pnas.0603395103.
[86] J.E. Miller, M.D. Allendorf, R.B. Diver, L.R. Evans, N.P. Siegel, J.N. Stuecker, Metal oxide
composites and structures for ultra-high temperature solar thermochemical cycles, J. Mater.
Sci. 43 (2008) 4714–4728. doi:10.1007/s10853-007-2354-7.
[87] T. Kodama, N. Gokon, Thermochemical Cycles for High-Temperature Solar Hydrogen
Production, Chem. Rev. 107 (2007) 4048–4077. doi:10.1021/cr050188a.
[88] M. Chambon, S. Abanades, G. Flamant, Solar thermal reduction of ZnO and SnO2:
Characterization of the recombination reaction with O2, Chem. Eng. Sci. 65 (2010) 3671–
3680. doi:10.1016/J.CES.2010.03.005.
[89] C. Perkins, A.W. Weimer, Solar-thermal production of renewable hydrogen, AIChE J. 55 (2009)
286–293. doi:10.1002/aic.11810.
[90] L.O. Schunk, A. Steinfeld, Kinetics of the thermal dissociation of ZnO exposed to
concentrated solar irradiation using a solar-driven thermogravimeter in the 1800-2100 K
range, AIChE J. 55 (2009) 1497–1504. doi:10.1002/aic.11765.
[91] D. Gstoehl, A. Brambilla, L.O. Schunk, A. Steinfeld, A quenching apparatus for the gaseous
products of the solar thermal dissociation of ZnO, J. Mater. Sci. 43 (2008) 4729–4736.
doi:10.1007/s10853-007-2351-x.
[92] P.G. Loutzenhiser, A. Meier, A. Steinfeld, Review of the Two-Step H2O/CO2-Splitting Solar
Thermochemical Cycle Based on Zn/ZnO Redox Reactions, Materials (Basel). 3 (2010) 4922–
4938. doi:10.3390/ma3114922.
[93] S. Abanades, G. Flamant, Thermochemical hydrogen production from a two-step solar-
driven water-splitting cycle based on cerium oxides, Sol. Energy. 80 (2006) 1611–1623.
doi:10.1016/J.SOLENER.2005.12.005.
[94] W.C. Chueh, S.M. Haile, Ceria as a Thermochemical Reaction Medium for Selectively
Generating Syngas or Methane from H2O and CO2, ChemSusChem. 2 (2009) 735–739.
doi:10.1002/cssc.200900138.
[95] W.C. Chueh, S.M. Haile, A thermochemical study of ceria: exploiting an old material for new
modes of energy conversion and CO2 mitigation, Philos. Trans. R. Soc. A Math. Phys. Eng. Sci.
368 (2010) 3269–3294. doi:10.1098/rsta.2010.0114.
[96] P. Singh, M.S. Hegde, Ce 0.67 Cr 0.33 O 2.11 : A New Low-Temperature O 2 Evolution Material
and H 2 Generation Catalyst by Thermochemical Splitting of Water, Chem. Mater. 22 (2010)
762–768. doi:10.1021/cm9013305.
[97] H. Kaneko, T. Miura, H. Ishihara, S. Taku, T. Yokoyama, H. Nakajima, Y. Tamaura, Reactive

Deliverable Report
D 4.1 GA No. 731287 65 Co-funded by the Horizon 2020 Framework
Programme of the European Union
ceramics of CeO2–MOx (M=Mn, Fe, Ni, Cu) for H2 generation by two-step water splitting
using concentrated solar thermal energy, Energy. 32 (2007) 656–663.
doi:10.1016/J.ENERGY.2006.05.002.
[98] S. Abanades, A. Legal, A. Cordier, G. Peraudeau, G. Flamant, A. Julbe, Investigation of
reactive cerium-based oxides for H2 production by thermochemical two-step water-splitting,
J. Mater. Sci. 45 (2010) 4163–4173. doi:10.1007/s10853-010-4506-4.
[99] M. Zinkevich, D. Djurovic, F. Aldinger, Thermodynamic modelling of the cerium–oxygen
system, Solid State Ionics. 177 (2006) 989–1001. doi:10.1016/J.SSI.2006.02.044.
[100] S. Zoller, E. Koepf, P. Roos, A. Steinfeld, Heat Transfer Model of a 50 kW Solar Receiver–Reactor
for Thermochemical Redox Cycling Using Cerium Dioxide, J. Sol. Energy Eng. 141 (2019)
021014. doi:10.1115/1.4042059.
[101] J.R. Scheffe, R. Jacot, G.R. Patzke, A. Steinfeld, Synthesis, Characterization, and
Thermochemical Redox Performance of Hf 4+ , Zr 4+ , and Sc 3+ Doped Ceria for Splitting CO 2,
J. Phys. Chem. C. 117 (2013) 24104–24114. doi:10.1021/jp4050572.
[102] M. Takacs, J.R. Scheffe, A. Steinfeld, Oxygen nonstoichiometry and thermodynamic
characterization of Zr doped ceria in the 1573–1773 K temperature range, Phys. Chem.
Chem. Phys. 17 (2015) 7813–7822. doi:10.1039/C4CP04916K.
[103] R. Bader, R. Bala Chandran, L.J. Venstrom, S.J. Sedler, P.T. Krenzke, R.M. De Smith, A. Banerjee,
T.R. Chase, J.H. Davidson, W. Lipinski, Design of a Solar Reactor to Split CO 2 Via Isothermal
Redox Cycling of Ceria, J. Sol. Energy Eng. 137 (2015) 031007. doi:10.1115/1.4028917.
[104] R. Bader, L.J. Venstrom, J.H. Davidson, W. Lipiński, Thermodynamic Analysis of Isothermal
Redox Cycling of Ceria for Solar Fuel Production, Energy & Fuels. 27 (2013) 5533–5544.
doi:10.1021/ef400132d.
[105] Y. Hao, C.-K. Yang, S.M. Haile, High-temperature isothermal chemical cycling for solar-driven
fuel production, Phys. Chem. Chem. Phys. 15 (2013) 17084. doi:10.1039/c3cp53270d.
[106] P. Furler, A. Steinfeld, Heat transfer and fluid flow analysis of a 4 kW solar thermochemical
reactor for ceria redox cycling, Chem. Eng. Sci. 137 (2015) 373–383.
doi:10.1016/J.CES.2015.05.056.
[107] D. Marxer, P. Furler, M. Takacs, A. Steinfeld, Solar thermochemical splitting of CO 2 into
separate streams of CO and O 2 with high selectivity, stability, conversion, and efficiency,
Energy Environ. Sci. 10 (2017) 1142–1149. doi:10.1039/C6EE03776C.
[108] F. Kiener, Master Thesis: Window-less Ceramic Cavity Receiver: Assembly, Testing and Heat
Loss Analysis, ETH Zurich, 2019.
[109] S. Luque, G. Menéndez, M. Roccabruna, J. González-Aguilar, L. Crema, M. Romero, Exploiting
volumetric effects in novel additively manufactured open solar receivers, Sol. Energy. 174
(2018) 342–351. doi:10.1016/j.solener.2018.09.030.
[110] H.I. Villafán-Vidales, S. Abanades, C. Caliot, H. Romero-Paredes, Heat transfer simulation in a
thermochemical solar reactor based on a volumetric porous receiver, Appl. Therm. Eng. 31
(2011) 3377–3386. doi:10.1016/j.applthermaleng.2011.06.022.
[111] F. Alberti, S. Santiago, M. Roccabruna, S. Luque, J. Gonzalez-Aguilar, L. Crema, M. Romero,
Numerical analysis of radiation propagation in innovative volumetric receivers based on
selective laser melting techniques, AIP Conf. Proc. 1734 (2016). doi:10.1063/1.4949053.
[112] A. Segal, M. Epstein, Solar ground reformer, Sol. Energy. 75 (2003) 479–490.

Deliverable Report
D 4.1 GA No. 731287 66 Co-funded by the Horizon 2020 Framework
Programme of the European Union
doi:10.1016/J.SOLENER.2003.09.005.
[113] N. Piatkowski, C. Wieckert, A. Steinfeld, Experimental investigation of a packed-bed solar
reactor for the steam-gasification of carbonaceous feedstocks, Fuel Process. Technol. 90
(2009) 360–366. doi:10.1016/J.FUPROC.2008.10.007.
[114] N.P. Siegel, J.E. Miller, I. Ermanoski, R.B. Diver, E.B. Stechel, Factors Affecting the Efficiency of
Solar Driven Metal Oxide Thermochemical Cycles, Ind. Eng. Chem. Res. 52 (2013) 3276–3286.
doi:10.1021/ie400193q.
[115] F. Müller, H. Patel, D. Blumenthal, P. Poživil, P. Das, C. Wieckert, P. Maiti, S. Maiti, A. Steinfeld,
Co-production of syngas and potassium-based fertilizer by solar-driven thermochemical
conversion of crop residues, Fuel Process. Technol. 171 (2018) 89–99.
doi:10.1016/J.FUPROC.2017.08.006.
[116] N. Piatkowski, C. Wieckert, A.W. Weimer, A. Steinfeld, Solar-driven gasification of
carbonaceous feedstock-a review, Energy Environ. Sci. 4 (2011) 73–82.
doi:10.1039/C0EE00312C.
[117] Y. Zhao, S. Sun, H. Tian, J. Qian, F. Su, F. Ling, Characteristics of rice husk gasification in an
entrained flow reactor, Bioresour. Technol. 100 (2009) 6040–6044.
doi:10.1016/j.biortech.2009.06.030.
[118] S. Maiti, P. Bapat, P. Das, P.K. Ghosh, Feasibility study of jatropha shell gasification for captive
power generation in biodiesel production process from whole dry fruits, Fuel. 121 (2014) 126–
132. doi:10.1016/j.fuel.2013.12.048.
[119] H. Karatas, H. Olgun, F. Akgun, Experimental results of gasification of cotton stalk and
hazelnut shell in a bubbling fluidized bed gasifier under air and steam atmospheres, Fuel. 112
(2013) 494–501. doi:10.1016/j.fuel.2013.04.025.
[120] C. Wieckert, A. Obrist, P. von Zedtwitz, G. Maag, A. Steinfeld, Syngas Production by
Thermochemical Gasification of Carbonaceous Waste Materials in a 150 kW th Packed-Bed
Solar Reactor, Energy & Fuels. 27 (2013) 47770–4776. doi:10.1021/ef4008399.