Embed Size (px)
Citation preview

University of Mississippi University of Mississippi
eGrove eGrove
Honors Theses Honors College (Sally McDonnell Barksdale Honors College)
Spring 5-9-2020
Integrating Google Forms as a Means of Formative Assessment Integrating Google Forms as a Means of Formative Assessment
in the Elementary Math Classroom in the Elementary Math Classroom
Morgan Douell
Follow this and additional works at: https://egrove.olemiss.edu/hon_thesis
Part of the Educational Methods Commons
Recommended Citation Recommended Citation Douell, Morgan, "Integrating Google Forms as a Means of Formative Assessment in the Elementary Math Classroom" (2020). Honors Theses. 1467. https://egrove.olemiss.edu/hon_thesis/1467
This Undergraduate Thesis is brought to you for free and open access by the Honors College (Sally McDonnell Barksdale Honors College) at eGrove. It has been accepted for inclusion in Honors Theses by an authorized administrator of eGrove. For more information, please contact [email protected].

INTEGRATING GOOGLE FORMS AS A MEANS OF FORMATIVE ASSESSMENT
IN THE ELEMENTARY MATH CLASSROOM
by
Morgan Elyse Douell
A thesis submitted to the faculty of The University of Mississippi in partial fulfillment of
the requirements of the Sally McDonnell Barksdale Honors College.
Oxford, MS
May 2020
Approved by
_______________________________________
Advisor: Dr. Sara Platt
_______________________________________
Reader: Dr. Diane Lowry
_______________________________________
Reader: Dr. Ann Monroe

© 2020 Morgan Elyse Douell
ALL RIGHTS RESERVED

This thesis is dedicated to my students, without whom I would not have been able to
successfully complete this project. While we did not get to finish out our time together in
a traditional sense, the time we did get to spend together has impacted me as an educator
and as a person. The 42 of you will always hold a special place in my heart.

ACKNOWLEDGEMENTS Thank you first, to my husband, Taner, for your constant support and encouragement throughout the completion of this project. I love you and I am grateful to have such a wonderful teammate as we go through life together. I would also like to thank my family and friends for their support and encouragement during this process. Thank you for listening to me babble about Google Forms and for sharing in my excitement about this research. You guys are the best and I love you! I would also like to thank my thesis advisor, Dr. Sara Platt. Thank you for the many hours conferencing with me and assisting me with my research and writing. Thank you for guiding me through this process and encouraging me along the way. I am so grateful for the ways in which you helped me grow as an educator and a writer. I would also like to thank Dr. Diane Lowry and Dr. Ann Monroe for serving as the Second and Third readers for this project. Thank you for dedicating your time and energy to help make this project successful. Finally, I would like to thank all of my professors at the University of Mississippi for pouring into me and equipping me to be the teacher I am today.

TABLE OF CONTENTS
ABSTRACT 6
LITERATURE REVIEW 8
PURPOSE OF THE STUDY 17
METHODS 18
RESULTS 20
DISCUSSION 57
REFERENCES 60
APPENDIX A 66
APPENDIX B 81
APPENDIX C 112

ABSTRACT
MORGAN ELYSE DOUELL: Integrating Google Forms as a Means of Formative
Assessment in the Elementary Math Classroom
(Under the direction of Dr. Sara Platt)
This study provides a case study in the use of Google Forms as a formative assessment
tool. Literature regarding formative assessment is included and models are applied in
lesson plan development and implementation. However, no research has been found
linking the implementation of formative assessment along with Google Forms. Formative
assessment and Google Forms both provide feedback to learners, which is a critical
component of formative assessment. This study reported the use of formative assessment
in conjunction with Google Forms and the impact it has on the lesson planning process.
The researcher designed a lesson plan using the principles of the Understanding by
Design approach to teaching, which was based on pre-assessment data, and administered
daily formative assessments via Google Forms. The researcher analyzed data from the
Google Forms to inform future instruction and meet the needs of students. Third grade
students were surveyed using a self-constructed Google Form survey regarding their
experience with Google Form assessments. The researcher also discusses the practical
application of using Google Forms in the classroom. Results from this study indicated
that Google Forms can be an effective formative assessment tool and supports the
argument that formative assessment data drives classroom instruction.

LITERATURE REVIEW
History of Formative Assessment
Since the beginning of education, evaluation has been a key aspect of the learning
process. The term “formative” was first mentioned as part of a conversation about
curriculum development and analyzing student growth by Cronbach (1963). Cronbach
(1963) noticed the need for an evaluation process that measured what students did and
did not know and then used that data to guide instructional practices. Following
Cronbach’s ideas, Michael Scriven first coined the terms formative and summative in
1967 but used the word evaluation rather than assessment. Scriven (1967) described the
role that evaluation could play in the ongoing improvement of students’ learning. Both
Cronbach and Scriven discussed the need to have evaluations serve as a practical tool for
teachers to use to impact student learning or student achievement.
Summative assessments are ‘cumulative assessments ... that intend to capture what a
student has learned, or the quality of the learning, and judge performance against some
standards’ (Dixson and Worrell, 2016, p.172 ). Unlike formative assessments, which are
generally used for providing feedback to students and teachers, summative assessments
are generally high-stakes assessments and are used to get a final assessment of how much
learning has taken place—that is, how much a student knows (Gardner, 2010 p.8). While
formative and summative assessments focus on how much learning has taken place,
formative assessments are used to directly shift instruction in some way, whereas
summative assessments give data on student growth and performance. Some examples of

summative assessments are unit tests, final exams, the ACT, etc. These types of tests are
typically used to determine how a student performs without follow-up action to target
areas in which the student is struggling. If students do not perform well enough on these
types of assessments, there are often repercussions- they do not get into a gifted program,
they do not pass the class, etc. In order for summative assessments to be as effective as
possible, formative assessment must also be used, so weaknesses can be addressed before
they cause the student to fail.
Furthering Scriven’s (1967) idea, Bloom, Hasting, & Madaus (1971) expanded the
definition of formative evaluation. Bloom, Hasting, & Madaus (1971) studied formative
evaluations and paid particular attention to the ways in which formative evaluation could
provide feedback and corrections during the teaching and learning process. Rather than
viewing evaluations as a one and done process, Bloom (1981) suggested a much more
effective use of formative evaluation to gauge student learning, diagnose any difficulties,
and design specific interventions to promote mastery .
At this point in the development of formative evaluation, the conversation about how to
use formative evaluation circled back to the question of what teachers can do for the
student as opposed to how the student can take responsibility for his own learning.
Sadler (1989) challenged the dialogue by suggesting students should be a part of the
assessment process and even proposed the idea of self-assessment. The student’s role in
the learning process was believed to be valuable and focus began to shift from not only

what the teacher could do to help the student, but also what the student could do to help
himself. Also, around this time, research reviews began to highlight the importance of
using assessment to inform instruction and suggested that regular assessment along with
follow-up action increased student learning.
Firestone et. al. (1999) redefined formative evaluation as assessment for learning. This
study found that there must be 5 essential elements of instruction in assessment for
learning. These are the five criteria:
1. Providing effective feedback to students
2. Actively involving students in their own learning
3. Adjusting teaching to take into account the assessment results
4. Recognizing the profound influence assessment has on student motivation and
self-esteem, both of which are crucial influences on learning
5. Needing students to be able to assess themselves and understand how to
improve.
Firestone et. al. (1999) added student motivation and self-regulation to the discussion
about formative assessment. This idea is important because it changed the goal of
formative assessment. “The theoretical ideal of formative assessment is for students to
develop the capacity to gather evidence of their own learning, which they then interpret
and use to plan the next steps of the learning process” (Clark, 2011, p. 29). Not only
should teachers be using assessments to guide instruction, but they should also be
teaching students to learn how to take an active role in their own education by

self-monitoring and making adjustments on their own.
Defining Formative Assessment
Understanding the history of formative assessment leads to the current definition of
formative assessment. Sadler (1998, p. 123) wrote, “formative assessment refers to
assessment that is specifically intended to generate feedback on performance to improve
and accelerate learning.” According to Sadler, the purpose of formative assessment is to
first, provide data showing student learning and second, give specific feedback to help
the student continue to grow. Catherine Garrison (2007) defined formative assessment as
“part of the instructional process.” Garrison states that formative assessment is not only
an assessment such as a unit test or vocabulary quiz, but rather formative assessment
occurs at all stages of the instructional process, in particular while the learning is
forming. Popham (2008) elaborated on the elements of formative assessment and
recommended formative assessment must include opportunities for students and teachers
to adjust instruction. Popham further explained in order for assessment to be formative, it
should guide instructional decisions, which results in modifications in teaching and
learning made by the teacher or student.
Summing up the process of formative assessment, Nickerson and Dickerson (2018)
created the 4 steps to instruction: 1. Chunk, 2. Chew, 3. Check, 4. Change. As seen in
Figure 1, this is the process of formative assessment (Nickerson & Dickerson, 2018, p.
11). First comes instruction aligned to a standard and an objective, when teachers

“chunk” together material. Next, students “chew” on the material and learn it by practice
or investigations. Then, teachers “check” students’ learning by using assessment. Finally,
teachers “change” or differentiate instruction to meet their students’ needs and the cycle
starts all over again.
Figure 1
The Formative Assessment Process
Note. This model is adapted from Nickerson and Dickerson (2018.)
Connection to Instruction
What separates formative assessment from other types of assessment is its connection to
instruction. “The general goal of formative assessment is to collect detailed information
that can be used to improve instruction and student learning while it’s happening. What
makes an assessment “formative” is not the design of a test, technique, or self-evaluation,
per se, but the way it is used—i.e., to inform in-process teaching and learning
modifications” (Abbot, 2015, p. 1 ). The objective of formative assessment is to allow
teachers and students opportunities to change instruction while learning is forming, rather
than at the end of instruction (Marshall, 2008; Moss, Abbots & Brookhart, 2009;
Popham, 2008). As discussed throughout this chapter, formative assessment includes
changing instruction based on formative assessment results.
The ultimate goal of assessment is to understand where students are now, and determine
what changes need to be made to increase student achievement. Assessment with no
follow-up action is futile. Rather than only assessing student achievement after
instruction has taken place, assessments should occur along the learning process and
should inform instruction. Figure 2 shows the flow of planning assessments, instructing,
assessing, analyzing student work, and changing instruction. Also referenced in Figure 2
is the need to analyze the assessments used to verify that the assessments are accurately
measuring student growth. When teachers use assessment as defined in Figure 2, it is
meaningful and enhances student learning.

Figure 2
Model of Formative Assessment Process
Understanding by Design
Grant Wiggins and Jay McTighe in 2012 developed the Understanding by Design (UbD)
lesson planning framework. . The purpose of the UbD framework was to shift teacher
focus to teaching and assessing for understanding and then creating curriculum
“backwards” from that point (McTighe & Wiggins, 2012). McTighe and Wiggins (2012)
also sought to create a process that values learning transfer, meaning students are able to
apply content knowledge in different scenarios. Using the UbD framework, teachers first
identify goals they want students to meet by looking at standards and teachers create
“Key Questions” students should be able to answer by the end of the instructional unit.
This is considered Stage 1. The core of Stage 2 is determining how students will show

growth and planning assessments to monitor student growth and learning transfer.
Finally, Stage 3 is where teachers focus on how they will instruct students so they reach
the goals set in Stage 1 as evidenced in the assessments created in Stage 2. Overall, the
UbD framework sets student achievement at the center of the lesson planning process and
values assessments and assessment data as useful tools to show evidence of student
success and learning transfer.
Growth of Technology
Before the growth of technology, the amount of information that students had access to in
the classroom was limited to the content in books and the knowledge of the educator.
However, as technology has evolved, students in classrooms have access to more
information and tools today than ever before (Chandar & Jayaprakash, 2015). Traditional
pencil and paper worksheets and lecture teaching methods are not sufficient as teachers
seek to increase student achievement in the era of technology (Sarkar et. al., 2017).
Because of the influence of technology, students have shorter attention spans now than
ever (Kim & Byrne, 2011). Students today are digital natives, meaning they are
surrounded by technology outside of school and are accustomed to multitasking;
therefore, the task teachers are faced with is finding ways in which to bring technology
into the classroom to promote student engagement and active learning (Sarkar et. al.,
2017).
Formative Assessment Technology Tools (For Math)
Most formative assessment technology tools are designed to be adaptable for use with
multiple subjects. Some of the most popular and free formative assessment technologies
are Kahoot, Quizziz, Edulastic, and Formative. A main feature of all of these tools is the
ability to quickly create a quiz or select questions and quizzes from a question bank. The
aforementioned tools are only a small representation of the formative assessment
technologies that are available to teachers, especially when adding in tools that require a
subscription or payment of some form.
What is Google Forms?
Google Forms is a free tool for anyone with a Google account and a survey technology
that is designed to quickly send out questionnaires or surveys and receive data in a timely
and organized fashion (Gavin, 2019). These forms can be used for basic research, t-shirt
orders, RSVPs, or in this case, as a formative assessment tool. Google Forms are
completely customizable, so users can create the perfect quiz or survey. Themes, fonts,
colors, question types, and response types can be tailored to the user’s liking (Google
Help Center, 2019).
Responses from Google Forms are organized into Google Sheets documents as soon as
the respondent submits the form, making it one of the fastest data collection tools (Gavin,
2019). Once the data is compiled into the Google Sheet, users can create charts, graphs,

and tables to visually present the collected data (Weber, 2018). Users can also choose to
organize data according to specific responses or by question.
Another feature of Google Forms is the ability to collaborate with others by sharing the
forms and the responses (Gavin, 2019). This feature makes sharing data among teachers,
instructional coaches or principals an easy task.
Why Use Google Forms?
Teachers are always looking for innovative ways to save time and maximize student
engagement and learning. However, when it comes to assessment, teachers may shy away
from analyzing data because it is time consuming or they decide to focus more on
improving instructional practices and decide to abandon the data collection strategy.
Google Forms organizes and graphs the data and allows teachers to more efficiently
analyze data, and provides more time for teachers to develop creative solutions to meet
the needs of their students.
PURPOSE OF THE STUDY
The purpose of this project was to examine the use of Google Forms as formative
assessments in an elementary math classroom. Google Forms is a free and underutilized
tool available to educators that could fulfill a role in providing formative assessment. To
date, there is no research concerning the link between Google Forms and formative
assessment. This study also sought to demonstrate the connection between assessment

and instruction by linking Google Forms and formative assessment. The researcher used
data from the Google Forms to make instructional changes which impact student
learning.
RESEARCH OBJECTIVES
The following objectives guided the research conducted in this study:
Objective 1: Evaluate Google Forms as an educational tool for formative assessment,
particularly in an elementary math classroom. How are Google Forms practical tools for
assessment? Are Google Forms logistically successful? Does Google Forms present
academic data in a way that is easy to understand and quick in delivery?
Objective 2: Describe the connection between formative assessments and instructional
choices. In what ways did the researcher make adjustments to the planned lessons after
analyzing data from the previous day of instruction?
METHODS
Setting and Participants
This study took place in an elementary school in North Mississippi during the spring of
2020. The researcher was randomly assigned to a third grade classroom as part of the
senior student teaching experience required by the School of Education. Participants
came from various races (white, black, Hispanic), academic levels, and socioeconomic
backgrounds. Ages of the participants ranged from 8 to 10 years old and there was a
gender ratio of 17 girls: 25 boys. There were 42 total participants because third grade

students at this school have 2 teachers- one for Reading, Writing, and English and one for
Math, Science, and Social Studies. The researcher included students from both her
homeroom class and her team teacher’s homeroom class.
Procedure
Before conducting the project, the researcher received approval from the Institutional
Review Board at the University of Mississippi. An information sheet was sent home to
parents, but formal written consent was not needed.
The researcher administered assessments to two third grade classes, once per day (10
separate times) from January 21, 2020- February 3, 2020. Data was collected from
formative assessments to show student growth and to guide classroom instruction. Data
was collected using Google Forms as exit tickets to show mastery of two MS College and
Career Readiness Third Grade Math Standards- 3.NF.1 and 3.NF.2. Each assessment
period lasted for fifteen minutes.
Over the course of the project, the researcher taught 9 lessons, implemented 8 formative
assessments and 1 summative assessment. See Appendix for more detailed lessons and
formative and summative assessments. Instructional blocks occurred once per day and
lasted approximately one hour and thirty minutes apiece. During the instructional time,
students received direct instruction, small group guided instruction, peer-peer instruction.

RESULTS
Pre-Assessment Development and Administration Before instruction on fractions, it was important to develop and administer a pre-assessment in order to effectively plan a unit that met the needs of the learners in this classroom. In order to develop the pre-assessment, the researcher analyzed the standards that were to be taught. There were three standards that needed to be covered: 3.NF.1, 3.NF.2, and 3.NF.3 (Figure 3). To see which of these standards needed to be focused on and for what length of time, the researcher located questions which assessed all three standards. Figure 3 Third Grade Fractions Standards
To develop items based on the standards the researcher used MasteryConnect, an assessment technology that generates assessment questions based on the Common Core Standards and the CASE 21 Benchmark Items. CASE 21 Benchmark Items are test questions that have been thoroughly reviewed by teachers and other professionals in the education field to align with and assess mastery of Common Core standards (CASE Benchmark Assessment Website, 2020). Collaborative Assessment Solutions for Educators or CASE Benchmark assessments are an alternative assessment option to other benchmark assessments such as the NWEA assessment. MasteryConnect questions

mirror the types of questions that will be on the benchmark and Mississippi Academic Assessment Program (MAAP).
The researcher created a seven-question assessment on Google Forms using questions from MasteryConnect. On the multiple-choice assessment were four questions on identifying fractions, one question on understanding fractions on a number line, and two questions on comparing fractions.
After consulting with the Clinical Instructor, the researcher decided to give the pre-assessment on the last day of student teaching in the fall semester. This allowed time to analyze the data from the pre-assessment and plan appropriate instruction that met the students’ needs.
When administering the pre-assessment, the researcher explained to the students that she was giving them a short quiz on fractions. The researcher explained that she was simply giving the students the quiz to see what they already know so that she could be a better teacher and could teach them the things they do not know.
While the students were completing the pre-assessment, the researcher had her computer opened to the Pre-Assessment and could see the students’ scores as they submitted the quiz on the “Responses” tab of the Google Form. Due to the automaticity of Google Forms, the researcher was able to see the students’ results in bar graphs and pie charts according to the class average, individual scores, and question averages. Google Forms also created a Google Sheet displaying the data in a spreadsheet.
Pre-Assessment Results
Figure 4 shows the data generated by Google Forms on the Pre-Assessment. The red arrow in the figure points to the class average on the assessment, while the blue arrow points to the breakdown of scores. Figure 4 Pre-Assessment Data

The pre-assessment data revealed the students on average scored 8.56 out of 14
points or 61% accuracy. Looking further into the data, the researcher focused on the specifics of the students’ understanding and misunderstandings. Figure 5 shows the most missed questions from the assessment.
Figure 5 Frequently Missed Questions from Pre-Assessment
Question 5 and Question 6 assessed comparing and ordering fractions. In order to assess students’ holistic knowledge of fraction concepts, questions on comparing and ordering fractions were left on the assessment. However, the school district’s pacing guide suggested that two weeks was the appropriate time to spend on 3.NF.1 and 3. NF.2. Therefore, the researcher was not surprised that many of the students missed these questions, as these are the more difficult fraction concepts to be covered in third grade.

Figure 6
Pre-Assessment Results
The questions assessing standards 3.NF.1 and 3.NF.2 were not answered correctly by every student, but there was a significantly higher number of correct responses to those questions as seen in Figure 6. For example, in Question 1, 79.1% of students correctly answered the question. However, there was still 20.9% of the class who answered incorrectly.
From this information, the researcher gathered that she would need to start teaching from the first standard on fractions and work through them all. Advice from the Clinical Instructor prompted the following schedule: one week for 3.NF.1 on naming and modeling fractions and one week for 3.NF.2 which covers fractions represented on number lines. For the purpose of this study and in accordance with the district pacing guide, the researcher limited the unit to only two weeks of instructional time. This meant that the researcher would not be teaching 3.NF.3 on comparing and ordering fractions in the time restrictions of this study.

Figure 6 Day 1 Lesson Plan

Day 1 Using the results from the pre-assessment, the researcher developed a timeline for the unit. For Day 1, the goals were to introduce the topic, address vocabulary terms, and explain the basic concepts (Figure 6). Step 1: The Lesson The researcher introduced fractions. Lesson objectives focused on naming fractions, the parts of a fraction, how to read fractions, and what fractions represent. Initially, the students showed little signs of understanding and few were eager to answer my questions. The researcher slowed down the pace of teaching and took more time giving examples and asking questions in order to allow time for students to grasp the foundational fractions concepts. For example, on the slide about unit fractions, the students were asked to determine which were examples and nonexamples of unit fractions. On the naming fractions slide, the researcher slowed down and went through each fraction, having students model with manipulatives and write the fractions to check for understanding. Students used the document camera to show their models and explain their work. The students used the terms numerator and denominator in their explanations. Then, while they were working in groups naming and then modeling fractions, the researcher determined growth in their comfort levels using the terms based on the frequency in which they used the terms. The researcher then reviewed two different word problems with the students and had them work together using a Think, Pair, Share for one problem. On the second word problem, students worked in groups to justify why the given answer to the problem was correct. Step 2: The Assessment Fifteen minutes before the end of the Mathematics block, the researcher instructed the students to log onto Google Classroom on their Chromebooks and guided the students to the Day 1 Google Form . The students were given fifteen minutes to complete the formative assessment before the class was dismissed. Step 3: Assessment Results The breakdown of student scores and overall class average from Day 1 Exit Ticket is shown in Figure. As seen in the figure, the class average was 3.73 out of 5 points. Figure shows the most missed question from this Form, which was Question 4. For the complete Day 1 Assessment Report generated by Google Forms, refer to Appendix C.

Figure 7 Day 1 Assessment Data Step 4: Instructional Changes Due to Formative Assessment Results As shown in Figure 7 students' lacked understanding of Question Four. Question Four was a word problem. As a result, the researcher determined students needed additional instruction in breaking down word problems. This was the only word problem on the assessment and was the most missed question, which suggests the students do not have a strong understanding of breaking down word problems. The researcher decided to substitute one of the activities on Wednesday– the day scheduled for center rotations in small groups– for an opportunity to further develop word problem skills. It was important that the students had a solid grasp of that concept because it is on the state test. By adding this activity to Wednesday’s lesson, the researcher would be able to work with the students in a small group setting during center rotations which would allow the researcher to address specific groups’ needs. As explained by Fountas and Pinnell (2012), using small group instruction advances student achievement by focusing on the exact skills the students in that group need to progress.

When looking forward to Day 2’s plans, the researcher decided to keep the activities that were prepared because the activities required students to practice modeling and naming fractions. The researcher also wanted to reinforce the students’ understanding by allowing them to work in groups and teach one another. Hsiung (2012) argues that students working in groups show high achievement and stay on task during the learning process. Step 5: Reflection After analyzing the data, the researcher determined the use of Google Forms aligned to students' understanding of the content taught. Data showed the most missed question as Question 4. The students most likely missed this question because it was a word problem and required the students to read the problem, not simply look at the figure and answer the question. Many students missed this question because they failed to read the full problem and answered with the amount of yellow counters instead of the amount of red counters. During instructional time, the students demonstrated an initial grasp of the concept of equal parts through modeling and were gaining confidence in using the terms numerator/denominator. However, translating base knowledge into a word problem was a difficult task for the students at this point in the learning process.

Figure 8 Day 2 Lesson Plan

Day 2 Step 1: The Lesson On the second day of the unit, the students in the first class enjoyed the “Notice and Wonder” activity (Figure 8) which led to class discussion about fraction parts. The students found many different ways to create fractions from the pictures and they asked great questions such as, “What would happen if you take one cupcake away?” or “What is a word problem for this picture?” Most, if not all, students seemed to be engaged and were eager to answer questions. Then, the class moved onto the Mimio lesson. The students enjoyed drawing models of the fractions on whiteboards. Students utilized the iPad to create models or write fractions on the Mimio board. The implementation of iPads resulted in increased student engagement. During the kite activity, the students were focused and easily completed each part of the activity after hearing the directions only once. The researcher decided to take out the “Is it ½?” activity because data collected from the Day 1 Assessment along with student feedback during the lesson suggested it was not necessary to break down fraction concepts in the way this assignment described because the students were demonstrating growth (Figure 8). Step 2: The Assessment Fifteen minutes before the end of the Mathematics block, the researcher instructed the students to log onto Google Classroom on their Chromebooks and guided the students to the Day 2 Google Form . The students were given fifteen minutes to complete the formative assessment before the class was dismissed. Step 3: Assessment Results When student data began to appear on the Responses tab, the researcher realized there was an error on one of the questions, causing it to have multiple correct answers. The researcher corrected the error to allow for only one correct answer. After making that adjustment, the researcher administered a second assessment, so data from this day would be accurate. Therefore, there are two sets of data from this day- one for each class. Figures show the class averages from the quiz. The scores indicated an overall average of 4.1 out of 5. Data from this assessment suggests an increase in student achievement compared to the previous day’s average score of 3.71 out of 5. There was not a “most missed question” on this assessment, meaning students missed various questions for various reasons. For the complete Day 2 Assessment Report generated by Google Forms, refer to Appendix C.

Figure 9 Day 3 Assessment Data Step 4: Instructional Changes Due to Formative Assessment Results For instruction on Day 3, the researcher decided to focus on helping the students deepen their understanding of fractions now that they had an initial grasp of the foundational knowledge. The researcher split the students into 3 groups based on their performance on the past two exit tickets. On the following day, the researcher would use center rotations to challenge the students to think more critically about fractions. The researcher pulled more questions from the CASE 21 Item Bank to use during small group instruction. Step 5: Reflection The class average on the exit ticket was higher today than yesterday, suggesting that students were showing growth. Considering the students’ participation and responses in class, the researcher believed this assessment data was an accurate representation of their understanding. The researcher observed many more students engaged and ready to answer questions today as she taught the lesson.

Figure 10 Day 3 Lesson Plan

Day 3 Step 1: The Lesson To begin the day, the researcher led the class in a game of Balloon Pop on the Mimio. Students were shown a modeled fraction on the board and then had to name the fraction on their individual whiteboards. After the class showed their boards, one student got to come to the iPad and “Pop!” the balloon. Students were grouped based on ability levels according to the Google Form responses. The researcher was able to focus on the specific learning needs of those groups which deepened students’ understanding of the objective. While each group worked on the same questions, the researcher differentiated instruction. For example, with the lowest group, the researcher and the students went through each question, marked up the word problem, and made a model for the problem. When working with the highest group, the researcher went through the questions faster, so she challenged them to explain how certain answers were wrong or prompted students to create a word problem or situation that would make that answer correct. At other centers, students worked with fractions by using hands-on manipulatives such as dice, color counters, egg cartons, and pom-pom balls. Step 2: The Assessment Fifteen minutes before the end of the Mathematics block, the researcher instructed the students to log onto Google Classroom on their Chromebooks and guided the students to the Day 3 Google Form . The students were given fifteen minutes to complete the formative assessment before the class was dismissed. Step 3: Assessment Data Data from Day 3 Exit Ticket is shown in Figure 11. The class average from this assessment was 3.41 out of 5. This is a drop from the average on Day 2. However, the questions on this assessment were more challenging. For this assessment, the researcher pulled questions from the CASE 21 Item Bank with an increased Depth of Knowledge (DOK) level to mirror the students’ deeper understanding of fractions concepts. All of these questions were word problems and only 3 of the 5 questions gave a model along with the question. The “Most Missed Question” on this assessment was Question 4. For the complete Day 3 Assessment Report generated by Google Forms, refer to Appendix C.

Figure 12 Day 3 Assessment Data Step 4: Instructional Changes Based on Assessment Data Because the average on today’s assessment was lower than both of the previous days, the researcher hypothesized there was one of two issues: hypothesis one– the students were struggling with the mathematics concepts being taught; or hypothesis two– the students were demonstrating an error in solving word problems. Due to the students’ high achievement on the Day 2 assessment and the students’ growth from Day 1 to Day 2, the researcher ruled out the first hypothesis and took action to address hypothesis two. The researcher planned to pull some of the questions from this assessment and review the problems the next day in class. The researcher wanted to use a graphic organizer to remind the students of the process to use when solving a word problem. Using graphic organizers when problem-solving helps students identify missing information and identify the key information (Ellis 2004). Step 5: Reflection During small group instruction, the researcher observed the students showing understanding by asking questions and gaining confidence in their work. However, assessment data showed that only 8 students made a perfect score as compared to the previous day’s total of 19 perfect scores. The researcher’s initial concern was that the students were rushing through the exit ticket and not taking time to read the questions

thoroughly. Several of the questions were tricky– particularly Question 4– but the students had received explicit instruction on solving word problems similar to this one. Day 4 On this day of instruction, the school schedule was changed due to an assembly. So, the researcher used the day to review. The students also had to take a weekly Common Assessment that is required by the school district. Therefore, there is no data on Google Forms from this day. Figure 13 Break It Down Graphic Organizer MasteryConnect data indicated the students understood the content well, proving that the researcher’s second hypothesis was correct. The students’ struggles were in their ability to complete word problems. In order to overcome this issue, the researcher decided to use a graphic organizer (Figure 13) on the following day to help the students slow down and identify the important information and pinpoint what the question is asking.

Figure 14 Day 5 Lesson Plan
Day 5 Step 1: The Lesson Starting the lesson, the researcher and the students reviewed a handful of word problems using a graphic organizer. The class highlighted and underlined important pieces of

information needed to accurately solve the problem. The students were eager to answer questions and showed evidence of a strong understanding of fractions through their models and explanations during the class discussion. The students then participated in a Whiparound and shared their “A-ha!” moments from the past week. The students then opened their Digital Interactive Notebook (DINB) on Google Slides and pulled up today’s materials on their computers. Using this technology, the students were able to manipulate and interact with the material on their Chromebooks as the researcher taught. The concept of fractions as part of a whole transitioned well into the students’ understanding of splitting the number line into equal parts such as fourths or sixths. The researcher led the students through exercises identifying number lines that represented particular fractions. The students practiced labeling “0” and “1” on the number line to show the correct whole as well as changing the whole. The researcher drew points on a digital number line and had the students name the fraction that the point represented. Initially, there was some hesitation to answer, but as the lesson progressed, the students were more eager to answer the questions and their accuracy in answering the questions increased. Step 2: The Assessment Fifteen minutes before the end of the Mathematics block, the researcher instructed the students to log onto Google Classroom on their Chromebooks and guided the students to the Day 5 Google Form . The students were given fifteen minutes to complete the formative assessment before the class was dismissed. Step 3: Assessment Data Data from Day 5 Exit Ticket is shown to the right in Figure 16 and Figure 17 The class average from this assessment was 4.51 out of 5 points. Questions 2 and 3 were word problems and were missed more than the other questions. The other questions on this Exit Ticket had only a couple of incorrect responses and assessed fractions on a number line. For the complete Day 5 Assessment Report generated by Google Forms, refer to Appendix C.

Figure 16 Day 5 Assessment Data Overview Figure 17 Day 5 Assessment Data Question Breakdown
Step 4: Instructional Changes Based on Assessment Data As seen in Figure 16 the average on the assessment increased from the previous assessment suggesting student growth. Based on assessment data which suggested a growth student achievement, the researcher decided to omit another day of practice with modeling fractions on a number line and move on to a cooperative learning task. The researcher planned for group work time to help deepen the students’ understanding of the concepts as suggested by Hsiung (2012). Step 5: Reflection The class average on this assessment was 4.51 out of 5. There were 2 word problems on the quiz to assess students’ growth. However, the students’ accuracy on these questions was 81.1%, which was lower than the students’ accuracy, 96.4%, on the questions assessing number lines. The researcher discussed with the Clinical Instructor about how to proceed and the Clinical Instructor advised the researcher to focus on teaching the fraction skills to work on problem-solving along with the fractions skills.

Figure 18 Day 6 Lesson Plan

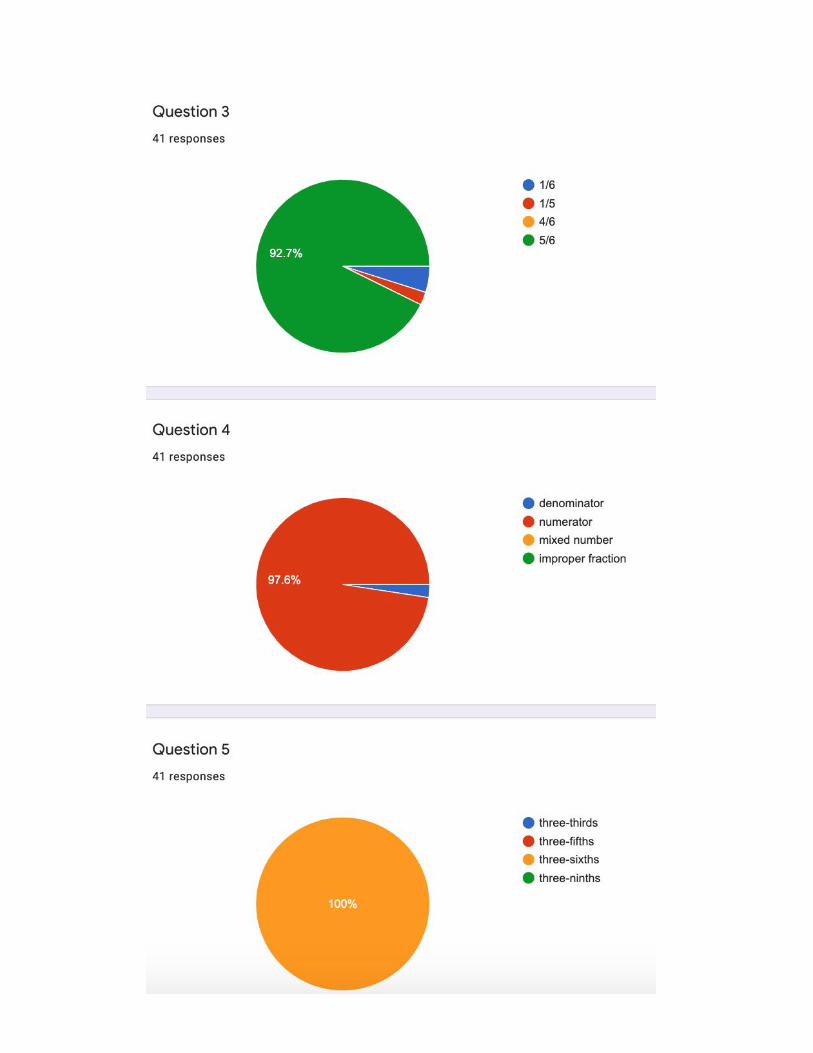
Day 6 Step 1: The Lesson The researcher began the day playing a review game with the students on the Mimio board. Then, the researcher set the students to work on a group task. The students were instructed to create a number line as a group that showed how far students had run in the game “Red Light, Green Light.” The researcher explained the example she had created. The students were grouped based on their performance on the previous day’s exit ticket and based on which students work well together. Many students demonstrated a decent understanding of number lines and were using terms like “tick marks,” “intervals,” and other fraction terms correctly. During this time, the researcher was able to work with each group and assist them as needed. Step 2: The Assessment Fifteen minutes before the end of the Mathematics block, the researcher instructed the students to log onto Google Classroom on their Chromebooks and guided the students to the Day 6 Google Form . The students were given fifteen minutes to complete the formative assessment before the class was dismissed. Step 3: Assessment Data Data from Day 6 Exit Ticket is shown in Figure 19 and Figure 20. The class average on this assessment was 4.26 out of 5 points. The “most missed question” for this day was Question 2. Only 53.8% of the class answered Question 2 correctly. There were 17 perfect scores on this assessment. For the complete Day 6 Assessment Report generated by Google Forms, refer to Appendix C. Figure 19 Day 6 Assessment Data Overview

Figure 20 Day 6 Assessment Data Question Breakdown Step 4: Instructional Changes Based on Assessment Data As seen in Figure 20, 18 students missed this question. Many of the students explained they did not understand the term “interval.” As a result, the researcher decided to explicitly teach this term the following day. From assessment data, the researcher identified that students who missed questions were making errors in counting tick marks instead of spaces on a number line. The researcher planned to reteach this skill during small group instruction the following day with the low-achieving small group and the middle-achieving small group. However, the researcher planned to briefly reteach the skill for the middle-achieving group and then move on to new concepts. For the high-achieving group who had repeatedly shown mastery of the skill, the researcher decided to move on to the next skill– comparing and ordering fractions using a number line. Step 5: Reflection The results on the exit ticket today were greatly encouraging, as the class average was 4.26 out of 5. There were 17 students who answered all 5 questions correctly. The responses from this Google Form also showed me that the errors the students did make centered around distinguishing between tick marks and intervals. While there was confusion about the term “interval,” the researcher planned to explicitly define the term the following day. From this exit ticket, the researcher could also see that there were 5 students who needed extra learning support. These students scored 2s or 3s on the exit ticket.

Figure 21 Day 7 Lesson Plan

Day 7 Step 1: The Lesson The researcher started the math block by leading the students in a quick game on the Mimio. Then, the students finished up the group task from the previous day. The students presented their work, explaining how they constructed number lines. Then, the class began center rotations. There was a small group instruction center, a center working with technology, and a center doing hands-on practice with number lines. During small group instruction with the lowest group, the researcher retaught creating fractions on a number line. A couple of students that do not normally answer questions during whole-group instruction asked questions. The researcher worked with the students on reviewing how to draw number lines and reviewed some of the problems the students had missed on the past two days of exit tickets. One of the major struggle areas for this group of students was that they struggled to distinguish between using tick marks and spaces as indicators of a piece or interval of the number line. On every problem, the researcher talked the students through the process to create and plot the points. During the middle group, the researcher again reviewed the exit tickets and identified the errors that were often made and were the cause of being just one question away from a 5/5. These students showed evidence of understanding the content through their discussions and explanations. We did not have time to finish all of the center rotations today in both classes. Step 2: The Assessment Fifteen minutes before the end of the Mathematics block, the researcher instructed the students to log onto Google Classroom on their Chromebooks and guided the students to the Day 7 Google Form . The students were given fifteen minutes to complete the formative assessment before the class was dismissed. Step 3: Assessment Data Data from the Day 7 Assessment is shown below in Figure ###. The class average for this assessment was 4.57 out of 5 points. There were 27 students who answered all 5 questions correctly. Only 3 students missed more than one question. There was not a “most missed question” on this assessment. For the complete Day 7 Assessment Report generated by Google Forms, refer to Appendix C.

Figure 22 Day 7 Assessment Data Step 4: Instructional Changes Based on Assessment Data While there were 27 perfect scores on this assessment, there are still students who need help mastering the skill. When analyzing the incorrect responses an overall theme is the misconception about tick marks versus intervals. To address this issue, the researcher decided to add a few practice problems to the agenda for the following day. Because all students were not proficient in this skill, the researcher planned to do a Think, Pair, Share and pair low-performing students with middle-performing students and middle-performing students with high-performing students. By making this change, the researcher hoped students might understand the concept when it is explained by a peer rather than hearing my explanation again. As stated by Webb (1988), peer tutoring has positive impacts for both the peer tutor and the tutee as the tutor reinforces his/her own understanding and the tutee receives immediate help he/she needs in terms he/she understands. Step 5: Reflection Today, we had an accidental error with some data being deleted from the Google Form. So, I had a handful of students in my first class retake the exit ticket after lunch. After analyzing the results of the exit ticket, the researcher concluded that the majority of the students are showing high achievement in this skill. The responses from this Google Form also indicated the errors the students make are distinguishing between tick marks and intervals. According to Cramer, et. al. (2016), third graders often struggle making this distinction and it is one of the most common mathematical misconceptions for students this age.

Figure 23 Day 8 Lesson Plan

Day 8 Step 1: The Lesson The researcher began class by finishing center work from the previous day. The researcher only met with the high-level student group today, because the other groups met the day before. For the high-level students, the researcher quickly reviewed a couple of problems and then moved to comparing and ordering fractions. The students in this group shared their excitement to learn something new through comments like “Wow!! This is cool!” and “Yes! I like when we get a challenge!” The students were eager to try problems on their own and demonstrated an initial grasp of the concept through their models on whiteboards After finishing centers, the researcher gathered the class together to review a handful of problems. The class worked on one problem on the board and then the students partnered together for Think, Pair, Share for 3 more problems. The researcher circulated the room and listened to the students use math terms such as, “The zero is only the starting point. I do not count the tick mark above zero.” When the students were finished with the problems, the class played the “Super Bowl” game, which was a review of fractions on a number line. The students were given a fraction and they had to choose which spot correctly modeled that fraction on a number line. The students were eager to play and eager to answer. Most of the time, the students guessed the correct point. They were working well as a team and they engaged in “Math Talk” with their team to justify answer choices. Step 2: The Assessment Fifteen minutes before the end of the Mathematics block, the researcher instructed the students to log onto Google Classroom on their Chromebooks and guided the students to the Day 8 Google Form . The students were given fifteen minutes to complete the formative assessment before the class was dismissed. Step 3: Assessment Data The data from Day 8 Exit Ticket is shown in Figure 24 The class average on this exit ticket was 3.97 out of 5 points. The most missed question was Question 4. For the complete Day 8 Assessment Report generated by Google Forms, refer to Appendix C.
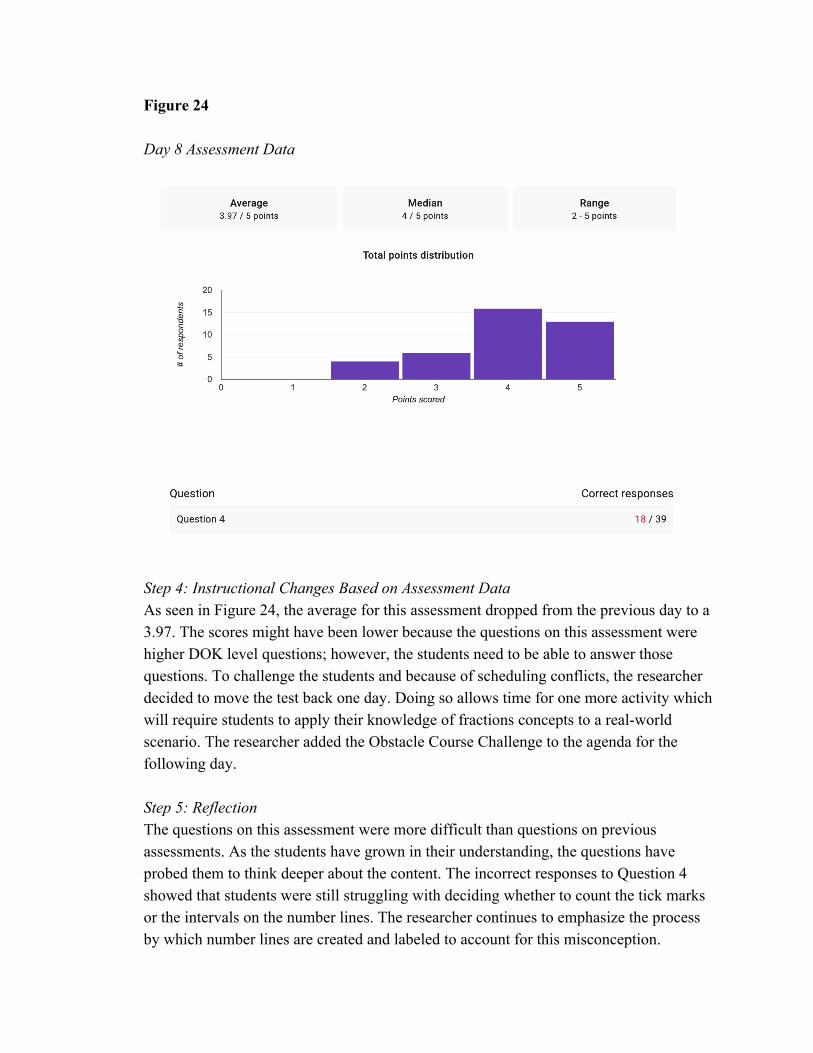
Figure 24 Day 8 Assessment Data
Step 4: Instructional Changes Based on Assessment Data As seen in Figure 24, the average for this assessment dropped from the previous day to a 3.97. The scores might have been lower because the questions on this assessment were higher DOK level questions; however, the students need to be able to answer those questions. To challenge the students and because of scheduling conflicts, the researcher decided to move the test back one day. Doing so allows time for one more activity which will require students to apply their knowledge of fractions concepts to a real-world scenario. The researcher added the Obstacle Course Challenge to the agenda for the following day. Step 5: Reflection The questions on this assessment were more difficult than questions on previous assessments. As the students have grown in their understanding, the questions have probed them to think deeper about the content. The incorrect responses to Question 4 showed that students were still struggling with deciding whether to count the tick marks or the intervals on the number lines. The researcher continues to emphasize the process by which number lines are created and labeled to account for this misconception.
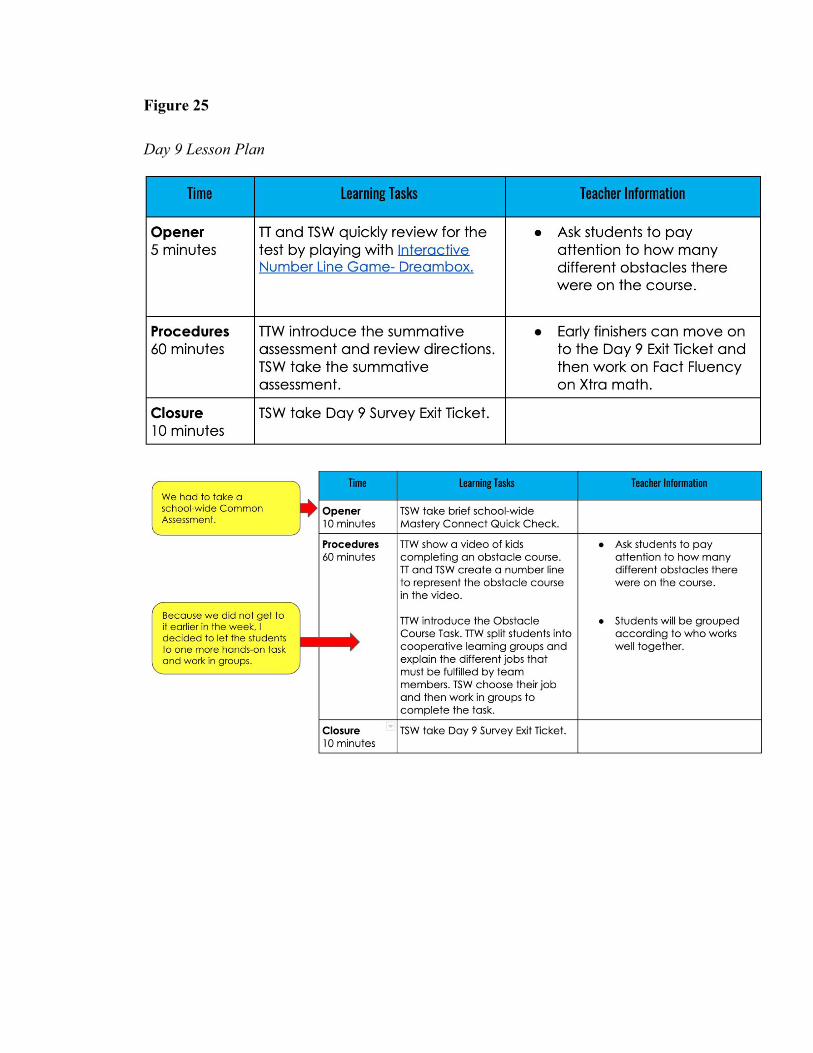
Figure 25 Day 9 Lesson Plan

Day 9 Step 1: The Lesson The students began the day by taking a short MasteryConnect Common Assessment. Then they started working on the obstacle course task, which required them to create an original obstacle course with at least 4 obstacles. The students were instructed to model their course on a number line from 0 to 1 using fractions to represent the amount of the course different obstacles would cover. The researcher introduced the task in a cooperative learning style to give every student a specific job and encourage high student involvement. The students took great interest in working on this activity because it gave them a chance to take ownership of their learning and be creative. Working together in groups, the students practiced explaining how they should create the number line to accurately represent their obstacle course. Step 2: The Assessment After finishing the task, the researcher administered a survey on Google Forms to collect feedback on the use of Google Forms in the classroom. The students were given fifteen minutes to complete the formative assessment before the class was dismissed. Step 3: Assessment Data The data collected in Figure 26 and Figure 27 shows student feedback about their experience taking assessments on Google Forms. For the complete Day 9 Survey Report generated by Google Forms, refer to Appendix C. Figure 26 Survey Data Part 1

Figure 27 Survey Data Part 2
Step 4: Instructional Changes Based on Assessment Data No changes were needed as this was a survey about the students’ experiences with Google Forms. Step 5: Reflection Data from the survey administered to the students on Day 9 indicates how the students felt about their understanding of the material we had covered. Their responses are listed in Figure 27. This data shows that 95% of the students felt confident about the fractions concepts we had covered in class. The results from the survey indicated based on scale of 1-5, 72.5% of students chose 5, 15% chose 4, 7.5% chose 3, and 5% chose 2 (Figure 27). The scale was explained to the students as follows:1 being the worst thing ever, 2 being something they didn’t enjoy 3 being something that was okay, 4 being something they enjoyed, and 5 being the best thing ever. An overwhelming majority, 87.5% percent of the students, liked using Google Forms. Only a small percentage, 12.5% of the students responded that they were either indifferent to Google Forms or didn’t really like using Google Forms. To gain more clarity about why students responded this way, the next question asked students to explain their answer to the previous question (Figure 27). Because this section was open-ended, the researcher categorized student responses into the following

categories: Easy to use (8 students), Fun/More fun than paper quizzes (11 students), See progress/score quickly (3 students), Technical Issues/Hard to Navigate (2 students), Miscellaneous/Off-Topic Responses (7 students). Some students did not choose to explain their answers. However, from these responses, it is evident that aside from a couple of technical issues, the students thought the forms were easy to navigate. One of the most exceptional findings from the survey was students’ enthusiasm for keeping up with their progress and tracking their growth. The researcher had taken note of several students who would eagerly share their assessment results when they showed growth. Inadvertently, using Google Forms had given the students ownership of their learning and they were self-monitoring their progress throughout the unit. This is the ultimate goal of formative assessment. Not only did the researcher receive data from the Google Forms and use it to inform instruction, but the students had taken their learning into their own hands and were monitoring their own progress throughout the course of the unit.

Figure 28 Day 10 Lesson Plan
Day 10 Step 1: The Lesson Beginning this day, the researcher led the students in a quick review game where the students practiced naming different points on the number line and naming different fractions from given models. Before taking the test, the students followed along with a yoga video on Go Noodle to help them relax and settle their nerves. Then, the students completed the summative assessment for this unit. Step 2: The Assessment The students were instructed to log onto Google Classroom and find the Fractions Unit Test. The students were alloted the entire math block to complete the assessment. Step 3: Assessment Data The data from the end of unit summative assessment are shown in Figure 29 and Figure 30. Figure 29 shows the class average on the summative assessment- 17. 41 out of 20 points. The next figure shows the most missed questions, Question 2 and Question 10.

Figure 29 Summative Assessment Data Breakdown Figure 30 Summative Assessment Data Most Missed Questions Breakdown
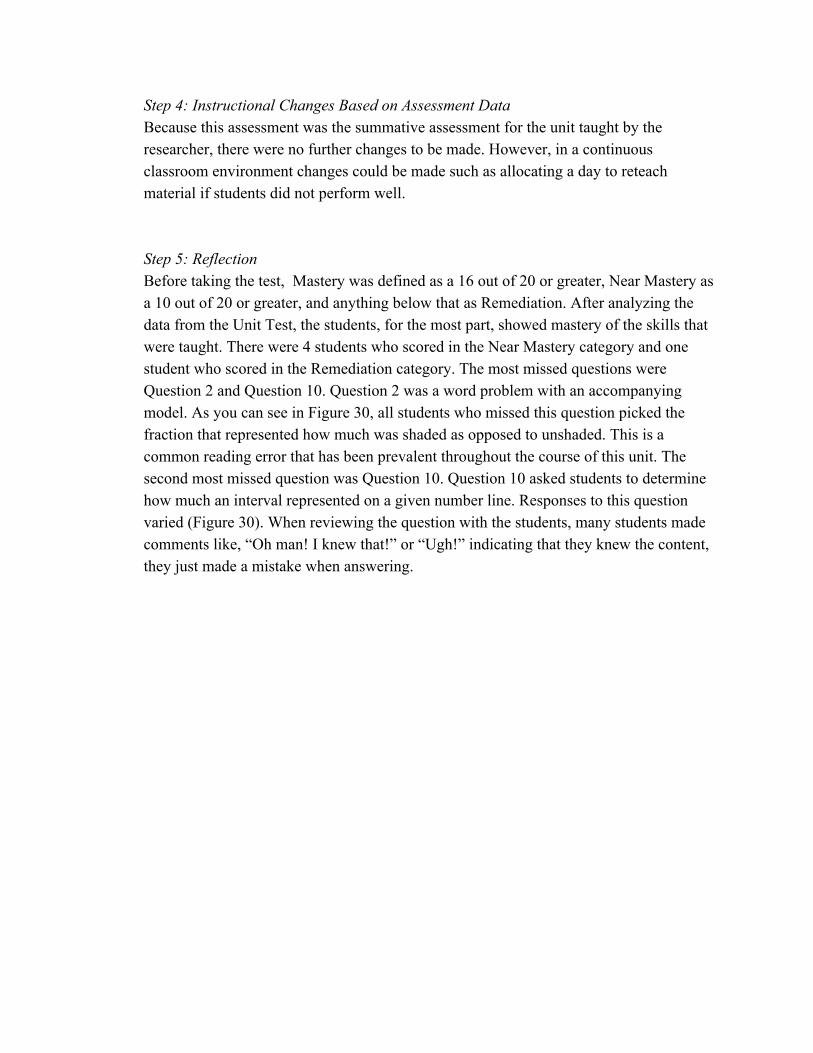
Step 4: Instructional Changes Based on Assessment Data Because this assessment was the summative assessment for the unit taught by the researcher, there were no further changes to be made. However, in a continuous classroom environment changes could be made such as allocating a day to reteach material if students did not perform well. Step 5: Reflection Before taking the test, Mastery was defined as a 16 out of 20 or greater, Near Mastery as a 10 out of 20 or greater, and anything below that as Remediation. After analyzing the data from the Unit Test, the students, for the most part, showed mastery of the skills that were taught. There were 4 students who scored in the Near Mastery category and one student who scored in the Remediation category. The most missed questions were Question 2 and Question 10. Question 2 was a word problem with an accompanying model. As you can see in Figure 30, all students who missed this question picked the fraction that represented how much was shaded as opposed to unshaded. This is a common reading error that has been prevalent throughout the course of this unit. The second most missed question was Question 10. Question 10 asked students to determine how much an interval represented on a given number line. Responses to this question varied (Figure 30). When reviewing the question with the students, many students made comments like, “Oh man! I knew that!” or “Ugh!” indicating that they knew the content, they just made a mistake when answering.

DISCUSSION
Connections to the Literature Throughout the course of this project, the researcher used data collected from the Google Form assessments to guide instruction. Following the model by Nickerson & Dickerson (2018), the researcher planned lessons, implemented activities, evaluated student learning, administered assessments, and then analyzed data to make informed decisions about the next lesson. The researcher followed this cycle every day of the unit and allowed for the assessments to fully drive instruction. The researcher found that when planning, the standard or learning target was at the center of the planning process just like Dickerson & Dickerson (2018) suggested in their model and Grant and McTighe (2012) suggest in the UbD format. As the teacher, the role of the researcher was to provide meaningful experiences for the students to engage with the content in meaningful ways. Every instructional decision made was for the sake of the students growing in their understanding of the mathematical content. Every decision made during this project was aided by the data provided by Google Forms. The lesson planning process, therefore, turned into a fluid process. While there was an initial plan for each day, the flow of the lesson was different by the end of the day whether because of pre-planned adjustments based on assessment data or in-the-moment changes based on student responses. The researcher followed the definition of formative assessment according to Abbot (2015) closely in that she used the assessments to inform the “process of teaching” and promote student achievement. By giving formative assessments daily to the students, the researcher was able to track the students growth in understanding and pinpoint particular misconceptions that needed to be readdressed. Following Popham’s (2008) research, daily formative assessments allowed for the researcher to correct any misconceptions while the learning was forming, rather than once all learning had taken place. The process of assessing data was simplified by using the ready-made data from Google Forms. The researcher was quickly able to see which students were doing well and which students needed extra support, as well as see what content or skill those students needed extra help to master. Making Instructional Changes Based on Data The lessons were planned based on pre-assessment data. Over the course of the unit, the researcher made a total of 14 modifications to the initial lesson plans. Of those 14 modifications, the researcher made 5 changes to the plans to compensate or adjust for

scheduling conflicts. Three of those changes were made because other activities took up too much instructional time and there was not enough time to get to all planned activities. Two of the five scheduling changes were made because of an interruption to the daily schedule, so activities had to be moved to accommodate a different school-wide schedule. The remaining 9 changes that occurred throughout the course of the unit were based on student performance and assessment data. Four of these changes were made as the researcher was teaching in response to student feedback and performance during the lesson. For example, on Day 2, the researcher removed the “Is it ½?” activity because students were showing a strong understanding of modeling fractions during the Mimio game. The last 5 changes to the unit were intentional modifications based on assessment data. The researcher made these changes to either provide interventions, such as focused small group reteaching, when students were not showing mastery of a skill or to add enrichment opportunities when students were showing mastery of a skill. For example, on Day 7, the researcher made adjustments to the work the students in the highest performing group would do at the small group instruction center by introducing the skill of comparing and ordering fractions. This was not planned originally, however, assessment data showed several of the students had consistently shown mastery of fractions on a number line, so it made sense to move them to the next skill. Overall, the researcher used data provided by Google Forms to make several changes to the plans in order to enhance student learning and meet the students needs during the process of learning. Evaluating Google Forms as a Formative Assessment Learning how to use Google Forms for assessment was a period of trial and error. The researcher spent about 2 hours one afternoon exploring the different features within Google Forms and created a mock quiz to learn how to use the different functions within Google Forms. Because Google Forms is a user-friendly tool, most of the time spent was exploring and manipulating the different controls and tabs on the editing screen. The researcher combined previous knowledge of the Google Suite programs with this new platform. There were no tricks or shortcuts to learn which would have made the process less difficult, the researcher simply had to become familiar with the tool and the possibilities that were available through it. After the researcher created the first quiz, the time it took to create each consecutive quiz shortened. Developing a Google Forms assessment from a blank Google Form to an assigned assessment required approximately 10 minutes of time per assessment.

The researcher compiled her acquired knowledge of creating a Google Forms assessment into a How-To guide to make the process even smoother for teachers in the future. Included in this guide are some extra tips learned from administering the assessment in real time. For more information on how to create a Google Form assessment, refer to Appendix ##. Using Google Forms as a formative assessment tool was practical in the classroom. Administering the Google Form required only fifteen minutes each day. After initially showing the students how to get to a Form uploaded to Google Classroom, the students were able to quickly and easily log in to their Chromebooks and complete the short assessment. Logistically, Google Forms made sense in this classroom because the school has a one-to-one classroom set of Chromebooks. Each student was able to have their own device and all students could test at the same time. While students were taking the quiz, the researcher had a computer opened to the “Responses” tab in the Google Form. When students submitted the assessment, Google Forms automatically produced the following data on the Summary tab: a breakdown of the average, median, and range of the scores; a tally of the most missed question(s) from the assessment; a list of student scores/email addresses/timestamp of submission; a bar graph for each question showing the responses to each question. The researcher used this information to gauge whole-class performance and pinpoint any particular topics that needed to be readdressed during whole-group instruction. Google Forms also generated a Question tab where it is possible to navigate the assessment question by question to see how many students responded with each answer choice. Here, the number of responses and a drop-down list would appear of the students who chose each answer. The researcher used this feature to decide which students to pull together to correct minor misconceptions as a small-group. Lastly on the Responses page was the Individual tab. On this tab, a drop-down list appeared of all student responses. Available for view are each student’s answers to every question on the assessment. The researcher used this feature to determine what to reteach when students needed to be met with individually to address major misconceptions. Another option of viewing assessment data in Google Forms is through a Google Sheets spreadsheet. Just as quickly as Google Forms creates graphs, it also creates a spreadsheet of individual student responses. Future Implications and Research Teachers' time is extremely limited. Teachers are tasked with incorporating technology into their lessons. Google Forms is a free resource available to anyone with a Google

account and offers many benefits to educators and students alike. Benefits of Google Forms include the following: a free tool for teachers and students; results could be easily shared with other teachers, students and parents via Google Accounts; using Google Forms for differentiation is also an option. When conducting research on Google Forms in education, the researcher found a resource from a teacher who uses Google Forms as a differentiation tool (Bell, 2017). Differentiation involves the process of adapting lessons/materials to meet the individual needs of all students. This teacher used a setting on Google Forms to “branch” her assessments, meaning, she created one basic test and included questions that both enriched the standard and gave interventions to help struggling students better understand the content. Students would then take the test and depending on how they answered questions, they would be given enrichments or interventions when needed. Research concerning this topic would be interesting as many teachers struggle with finding time to differentiate. Unique solutions such as using Google Forms could be an answer. Google Forms could also be used for summative assessments that could be integrated into Google Classroom. Due to its rapid data presentation, Google Forms could be useful as a summative assessment tool. Because of the sharing capabilities of Google Forms, teachers can share students’ responses through Google Classroom or directly to a Google Account. Future research could include using Google Forms at the Secondary Level, further evaluating teacher perceptions of developing Google Forms, evaluating teacher perceptions of using Google Forms for other grade or subject levels. Teachers have only begun to tap into the possibilities Google Forms offers to the field of education.

REFERENCES
Abbot, S. (2015). Assessment. Retrieved from
https://courses.lumenlearning.com/educationx92x1/chapter/assessment/. CC
BY-NC-SA 4.0
Bell, K. (2017, March 21). Shut the front door (again)! updated differentiation
with google forms. [Web log post]. Retrieved from
http://shakeuplearning.com/blog/shut-the-front-door-digital-differentiation-with-g
oogle-forms/
Bloom, B. S., Madaus, G. F., & Hastings, J. T. (1971). Handbook on formative
and summative evaluation of student learning. New York: McGraw-Hill.
Bloom, B. S., Madaus, G. F., & Hastings, J. T. (1981). Evaluation to improve
learning. New York: McGraw-Hill.
Clark, Ian. (2011). Formative assessment and motivation: theories and themes.”
Prime Research on Education, 1(2), 27–36.
Cramer, K., Ahrendt, S., Miller, C., Monson, D., & Wyberg, T. (2016). Making
sense of third-grade students’ misunderstandings of the number line.
Investigations in Mathematics Learning, 9(1), 19-37. doi:
10.1080/19477503.2016.1245035
Cronbach, L. J. 1963. Course improvement through evaluation. Teacher’s College
Record. 64(8), 672–683.

Dixson, Dante., & Worrell, Frank C. (2016). Formative and summative
assessment in the classroom. Theory Into Practice, 55 (2), 153-259.
https://doi.org/10.1080/00405841.2016.1148989
Ellis, E. (2004). What’s the big deal about graphic organizers? Retrieved on
March 30, 2020 from http://www.GraphisOrganizers.com
Firestone, W. A., Fitz, J., & Broadfoot, P. (1999). Power, learning, and
legitimation: Assessment implementation across levels in the United States and
the United Kingdom. American Educational Research journal, 36(4), 759-793.
Foss, J. O. (2020, February 21). Printable Math Graphic Organizers,
Understood, 21 Feb. 2020,
http://www.understood.org/en/school-learning/learning-at-home/homework-study
-skills/download-graphic-organizers-to-help-kids-with-math.
Fountas, I., Pinnell, G. (2013) Guided reading: the romance and reality. The
Reading Teacher, 66(4). Retreived from
https://www.fountasandpinnell.com/Authenticated/ResourceDocuments/FP_GR_
Article_Guided-Reading-The-Romance-and-the-Reality-for-IRA-attendees_v201
4-07.pdf
Gardner, J. (2010). Developing teacher assessment: An introduction. Developing
teacher assessment, 1-11.

Garrison, C., & Ehringhaus, M. (2007). Formative and summative assessments in
the classroom. Retrieved from
http://www.amle.org/Publications/WebExclusive/Assessment/tabid
/1120/Default.aspx
Gavin, B. (2019, August 6). The beginner’s guide to google forms. How To Geek.
https://www.howtogeek.com/434570/the-beginners-guide-to-google-forms/
Google Help Center. (2016, October 30) Create a survey using google forms.
Docs Editors Help.
https://support.google.com/docs/answer/6281888?visit_id=637213784907271882
-1394624540&rd=1
Hsiung, C. (2013). The effectiveness of cooperative learning. The Research
Journal for Engineering Education, 101(1), 119-137.
doi:10.1002/j.2168-9830.2012.tb00044.x
Li, C., Wu, M., Lin, W. (2019). The use of a “think-pair-share” brainstorming
advance organizer to prepare learners to listen in the k-l2 classroom. International
Journal of Listening, 33, 114-127. doi: 10.1080/10904018.2017.1394193
Marshall, K. (2008) Interim assessment: A user’s guide. Phi Delta Kappa, 90(1), 64-68.
McTighe, J., Wiggins, G. Understanding by design® framework. Retrieved from
https://www.ascd.org/ASCD/pdf/siteASCD/publications/UbD_WhitePaper0312.p
df
Mississippi Department of Education. (2016). College and career readiness
standards: math. Retrieved from

https://districtaccess.mde.k12.ms.us/curriculumandInstruction/Mathematics%20R
esources/MS%20CCSSM%20Framework%20Documents/2016-MS-CCRS-Math.
Moss & Brookhart. (2009) Advancing formative assessment in every classroom: a
guide for instructional leaders. Association for Supervision & Curriculum
Development.
Mueller, J. (2008). What is authentic assessment? Authentic Assessment Toolbox.
North Central College. Retrieved from
http://jfmueller.faculty.noctrl.edu/toolbox/whatisit.htm.
Nickerson, L. & Dickson, M. (2018). Teaching with the instructional cha-chas:
Four steps to make learning stick. Solutions Tree Press.
Popham, W. J. (2008). Transformative assessment. ASCD.
Sadler, D. R. (1989). Formative assessment and the design of instructional
systems. Instructional Science, 18, 119– 144. doi:10.1007/BF00117714.
Sarkar, N., Ford, W., & Manzo, C. (2017). Engaging digital natives through social
learning. Systemics, Cybernetics, and Informatics, 15(2). p. 1-4.
Scriven, M. (1967). The methodology of evaluation. Perspectives on Curriculum
Evaluation. Chicago: Rand, McNally, 39-83.
Training and Education in the 21st Century. (2020, February 27) Case
Benchmark Assessments. www.te21.com/case.
Usman, B., Fata, I., Pratiwi, R. (2018). Teaching reading through know-
want-learned (kwl) strategy: The effects and benefits. Englisia, 6(1). p. 35-32.

Webb, N. M. (1988). Peer helping relationships in urban schools. Equity and
Choice, 4(3), 35-38.
Weber, Ryan. (2020, September 5). "Five new ways to reach your goals faster
with G Suite". Google. Retrieved from
https://www.blog.google/products/g-suite/five-new-ways-reach-your-goals-faster-
g-suite/
William, Dylan. 2017. Embedded formative assessment: Strategies for classroom
assessment that drives student engagement and learning. Bloomington, IN:
Solution Tree.

APPENDIX A
How to Use Google Forms for Formative Assessment
Quiz Set Up
Accessing the Template
Creating a Google Form is quick and easy thanks to the user-friendly design of the Google Forms
site.
1. To create a quiz, first, log in to a Google account. On the top right-hand corner of the
screen is the Google waffle, an array of nine small gray dots. Click on the waffle and the
icons for all of the Google Suite applications will appear.
2. Find the “Forms” purple icon and click to open the application.

3. When the site has loaded, options to create a new quiz or choose from the premade
templates will appear. Under these options are any Forms that have previously been
made. When creating a blank quiz, every aspect of the Form is customizable. Choosing a
template allows the creator to quickly insert information into a premade template and
removes the hassle of formatting.
Customization
1. At the top right hand side of the screen, there are a few icons. Click on the “Customize
Theme” icon to make adjustments to the presentation of the Form.
2. The toolbar shown below should appear to the right of the workspace. Within the toolbar,
are the options to add an image, change the main and highlight colors, as well as change
the style of the font.

Size and formatting of the fonts cannot be changed. Google Forms automatically adjusts
the font for titles, headings, and subheadings.
Creating Questions
Writing Questions
Google Forms allows for customization of the forms. For this reason, writing questions is as
simple as following the question templates.
1. The image below shows the dropdown box listing the types of question templates Google
Forms offers. Choose which type of question and add in the question and answer choices.
Inserting Questions as Screenshots
While Google Forms does not have a question bank like its counterparts Edulastic or Kahoot, it is
easy to insert screenshots of other questions. When creating the Google Forms for this project, the

researcher used questions from the Case 21 Item Bank on MasteryConnect. The researcher
navigated the item bank to find questions that assessed the content taught and then took a
screenshot of the question. The researcher used a MacBook Air to create the Google Forms.
Screenshot features may not be available on other devices.
1. On a MacBook Air, screenshotting is accomplished by simultaneously holding the
“Command,” “Shift,” and “4” buttons. The cursor will change. Use the trackpad to
highlight the desired area. Releasing the trackpad captures the image on the highlighted
portion of the screen and saves it as a PNG file on the computer desktop.
2. Now that the screenshot is saved on the desktop, it is possible to insert it into the Google
Form. To add a photo to a question, click on the “Add Image” icon on the right-hand
toolbar.
3. A box will pop up giving the option to insert an image by uploading- or dragging and
dropping a file- or a few other methods. Choose the “Browse” button and find the file to
upload or find the image on your desktop and drag the screenshot icon from the desktop
and drop it into the “Insert Image” box. The desired image should be inserted into the
Form.

Adding Multiple Questions
To add more than one question to an assessment, refer to the toolbox on the right-hand side of the
page.
1. The image below shows the “Add a Question” icon on the toolbox. Simply click this
icon and a new question will be added. It is now possible to edit all of the features of this
question.
Adjusting the Settings
Now that multiple questions are added to the form, it is possible to customize the features of the
form to make it into a quiz.
1. Find the Settings Icon at the top right hand side of the form. Click that button and a list of
settings should pop up.
2. In the Settings box, there is a tab labeled “Quizzes.” Click that tab. Make sure that the
slide bar is to the right beside “Make this a quiz.” Otherwise, the Google Form will not
record students’ email addresses and the responses will be anonymous. Choose to either

turn off “Locked Mode” on Chromebooks or leave it on. Leaving this setting on keeps
students focused on the quiz and prevents them from opening new tabs.
3. Other features to note are
the “Release Grade” and “Respondent Can See” sections. These settings are adjustable
according to personal preferences.
4. To prevent cheating, click on the “General” tab and scroll down to the “Respondents
Can” section. For the sake of a quiz, make sure “Edit After Submit” is not checked. One
of the students in this study figured out a way to get back into the quiz and changed initial
answers after receiving the score and reviewing the correct answers to the questions. For
this reason, wait until all of the students submit the exit ticket before releasing scores.

5. The image above shows an option in settings to collect email addresses. By sliding the
slide bar to make the form a quiz, emails will be collected for the sake of grading. Check
this box as well, just to be sure the results can be connected to the students.
Making Assessments Available
Preview the Form
When all of the questions have been inserted and the formatting and settings have been adjusted,
preview the quiz before sending it out to the students. This feature is beneficial to catch small
errors made when creating the form and to make adjustments for better readability. To access the
preview, select the “Preview” icon on the top right-hand side of the screen between the
“Customize Theme” and “Settings” icons.
Email Precautions
After previewing the Form, make sure the form uses the same email domain as the students’
emails. If the students’ emails are something like [email protected], then the Form needs to

be created from the teacher’s @school.org Google account. Otherwise, the students will not be
able to open the form.
Assigning the Form in Google Classroom
Assigning a Google Form in Google Classroom is a simple task once the Form has been created.
1. Go back to the Gmail homepage and click on the Google waffle.
2. Find the Google Classroom logo.
3. Once you are in Google Classroom, a bar will appear across the top of the page . Click on
the “Classwork tab. On the screen, there will be an icon with a plus sign and the word
“Create.” Click the “Create” button.
4. A drop-down menu will pop up. On the menu, choose the “Quiz Assignment” button and
it will automatically open a pop-up box with a blank Google Form attached to it.

5. Delete the blank Google Form by clicking the “X” on the Blank Quiz.
6. Then, click the “Add” button. A drop-down menu will pop up. Here, it is possible to add
a file from Google Drive, add a link, add a regular file, or add a YouTube video. To insert
the quiz, choose the Google Drive option and find the quiz that needs to be assigned.
7. Select the quiz and push the “Add” button to insert the quiz. Then, add a title to the
assignment, assign a due date, or choose how many points the assignment is worth.

8. When finished with the assignment details, click the “Assign” button at the top right-hand
side of the page and the students will be able to find the assignment when they login to
Google Classroom.
Sharing a Google Form Link
An alternative to sharing the file via Google Classroom is sharing a link to the quiz.
1. Refer to the top right-hand side of the screen and you’ll see a button that says “Send.”
Click “Send” and it will pop up this box.
2. Here, choose to send the form via email, by sharing a link, or embedding an HTML link..

Receiving Scores/Data
As the students are taking the Form, the teacher can view the assessment results as soon as the
students submit the Form.
1. To view the scores, open the Form and find the “Responses” tab beside the “Questions”
tab.
2. Select “Responses” and it will take you to a page with three more tabs- “Summary,”
“Question,” and “Individual.” Here, both class and individual results are displayed.
3. Google Forms automatically sorts the data into a graph showing how many students made
which scores. Also tabulated by Google is the class average as well as a list of the most
missed questions. This information can be found under the “Insights” tab.

4. Scroll down the “Summary” page to view a running record of student scores, email
addresses, and times submitted.
5. Under the “Frequently missed questions” section is a question-by-question breakdown of
the student’s responses. This section provided exceptionally helpful information because
teachers can quickly tell which questions were tricky for the class.
6. On the “Question” tab, there is a breakdown of each question. Here, specific question
data is presented.

7. The last tab of this page is the “Individual” tab which shows each students’ individual
answers to the quiz. This page is helpful for organizing groupings according to similar
missed questions or common mistakes.
Providing Feedback
The “Individual” tab on the Response page provides another helpful resource. On each student’s
quiz, there is a question by question breakdown. Teachers can provide specific feedback
immediately after the student submits the quiz.
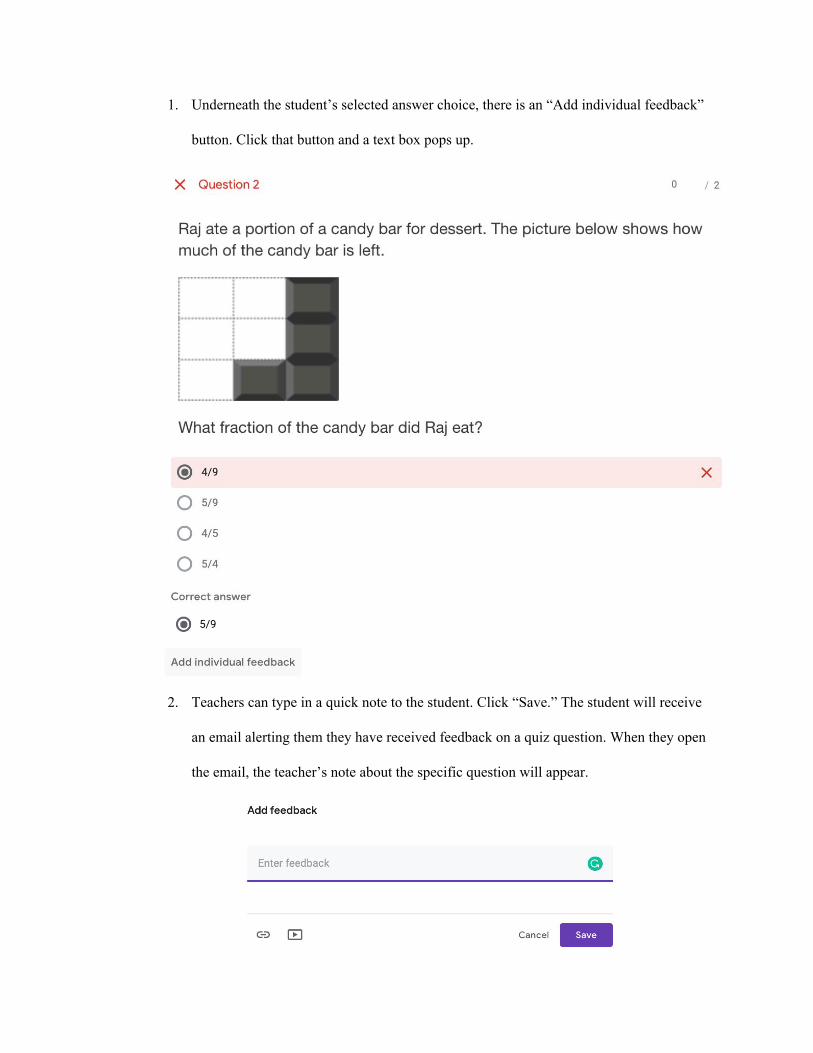
1. Underneath the student’s selected answer choice, there is an “Add individual feedback”
button. Click that button and a text box pops up.
2. Teachers can type in a quick note to the student. Click “Save.” The student will receive
an email alerting them they have received feedback on a quiz question. When they open
the email, the teacher’s note about the specific question will appear.

APPENDIX B
Fractions Unit Plan
Contextual Information What is the class like?
Describe the students by age, gender, and total number.
The students in my 3rd-grade class at North Pontotoc Elementary are ages 8-10. There are 21 students in my homeroom class. 8 of my students are boys and 13 of my students are girls.
What are the Overall Achievement levels of students? How were these levels determined?
The achievement levels in my classroom vary from high performing to remedial. There are 9 students in the Gifted/Talented program, 4 students who get pulled during Power Hour for special education services, 1 student who gets pulled for ELL services, and 2 students who are repeating 3rd grade for the 2nd or 3rd time and are very low performing students. Most of my students are performing at grade level with 3 students who are not yet at grade level. We have 5 students who are above grade level and are doing exceptionally well so far.
What is the likely socio-economic description of this class?
Of the students in my homeroom class, most come from low or middle-class families. I do have a handful of students who come from very low-income families and are near the poverty line. There are also a couple of my students that are from an upper-middle-class income, however, that is a rare exception. In my class, there are 8 students on free or reduced lunch plans. Most of my students come to school with the supplies they need, however, there are a few students who do not always have what they need and
What is the typical demeanor of students in this class?
The students in my class typically come to school excited to learn. They are ready to participate in the activities that are planned and learn. They love getting to be social and talk with their peers. They really enjoy group work and getting to sit and work in different places around the room. They are also really focused during individual work times, but they don’t have the stamina to stay focused for a long period of time without moving or changing activities.

What are the typical interests and involvement of students?
Many of my students love when they have time on the chrome books. They enjoy technology time and especially when they get to play on Prodigy or do Cool Math games. The students are almost always involved in the lesson, but they do get antsy after a little while, so you have to keep them busy and moving around.
What are the varied approaches to learning in this class?
Most of my students enjoy learning and are eager to learn. There are a few students who approach school reluctantly and complete their work quickly just to get it finished with it. Some of my students are having a hard time adjusting to third grade because there is more responsibility put on them to learn some things on their own like multiplication facts.
What has this class/grade learned about this topic already this year, or previous years?
My CI has the students do a few spiral review bellwork problems every morning, so they have seen some problems that ask them to find the answer to an input/output table. They have also seen numbers in a sequence in their homework when we first started multiplication.
How are parents involved in this classroom?
Parents are involved through Classtag- a Facebook-style platform that allows teachers to easily communicate with parents via posts and photo updates as well as personal messages. The parents are also involved in the classroom as a result of the Star Student program that is in place. Whenever a student is Star Student for the week, the student’s parents are invited to join them for lunch.
What is the school like?
What is the school like as far as academic achievement records?
North Pontotoc Elementary is located in Ecru, MS. It is considered a 3A school according to MHSAA. For the past two years, North Pontotoc Elementary has been an “A” ranked school by the Mississippi Department of Education.

What is the school like as far as socioeconomic status indicators?
The school is located in a rural community where the population is made up of mostly middle to low-income families. Therefore, it is a high poverty area and many students are on free and reduced lunch plans. The school is predominantly white, but has a relatively diverse minority population due to the amount of factory and industrial jobs in the area. There is a small African American population and a more prevalent Hispanic population, so many students receive ELL services.
What systems are put in place school-wide?
There are a couple of school-wide systems that are in place. One of those is a PBIS where “Viking Bucks” are used as an incentive for good behavior and exceptional citizenship. The students can trade in Viking Bucks for prizes or coupons at the end of each nine-week grading period. Another school-wide system in place is the Mad Minute Math Challenge. Each week, students in every class complete “Mad Minute” fact challenges where they must accurately answer 30 or more math facts in one minute. The class with the highest average of correct facts wins a door hanger that is displayed on their door for the next week.
What are ways the school reaches out to families?
The school often hosts family nights to get the parents more involved in what is going on at the school. Some examples of themes of these nights are school safety and community involvement. At the community involvement night, different groups with programs or activities for families or kids presented information and answered questions about their programs.

Stage 1- Desired Results
Standards: ● 3.NF.1 Understand a fraction 1/b as the quantity formed by 1 part when a whole is
partitioned into b equal parts; understand a fraction a/b as the quantity formed by a parts of size 1/b.
● 3.NF.2 Understand a fraction as a number on the number line; represent fractions on a number line diagram.
o a. Represent a fraction 1/b on a number line diagram by defining the interval from 0 to 1 as the whole and partitioning it into b equal parts. Recognize that each part has size 1/b and that the endpoint of the part based at 0 locates the number 1/b on the number line.
o b. Represent a fraction a/b on a number line diagram by marking off a lengths 1/b from 0. Recognize that the resulting interval has size a/b and that its endpoint locates the number a/b on the number line.
Big Idea or Concept: ● Fractions can be
understood as parts of a whole.
Essential Questions: ● What does it mean to partition a shape into parts? ● What are the important features of a unit fraction? ● How can I model fractions? ● What fractions are on the number line between 0 and 1? ● What relationships can I discover about fractions?
Objectives: TSW …
● Explain and represent a unit fraction. ● Explain and represent a non-unit fraction. ● Describe numerator and denominator. ● Represent fractions with color tiles, pattern blocks, Cuisenaire rods, fraction
circles, and other region or set models. ● Explain how representations are related. ● Represent any fraction (a/b) less than 1 on a number line. ● Determine where a fraction is located on a number line by partitioning.

Stage 2- Assessment Evidence
Day: Assessment: Objective(s) Tested
Day 1 Formative Assessment- Google Forms Quick Check
Explain and represent a unit fraction.
Explain and represent a non-unit fraction.
Describe numerator and denominator.
Day 2 Formative Assessment- Google Forms Quick Check
Explain and represent a unit fraction.
Explain and represent a non-unit fraction.
Represent fractions with color tiles, pattern blocks, Cuisenaire rods, fraction circles, and other region or set models.
Day 3 Formative Assessment- Google Forms Quick Check
Represent fractions with color tiles, pattern blocks, Cuisenaire rods, fraction circles, and other region or set models.
Explain how representations are related.
Day 4 3. NF. 1 Quiz on Google Forms
Explain and represent a unit fraction.
Explain and represent a non-unit fraction.
Describe numerator and denominator.
Represent fractions with color tiles, pattern blocks, Cuisenaire rods, fraction circles, and other region or set models.

Explain how representations are related.
Day 5 Formative Assessment- Google Forms
Represent any fraction (a/b) less than 1 on a number line.
Determine where a fraction is located on a number line by partitioning.
Day 6 Formative Assessment- Google Forms
Represent any fraction (a/b) less than 1 on a number line.
Determine where a fraction is located on a number line by partitioning.
Day 7 Formative Assessment- Google Forms
Represent any fraction (a/b) less than 1 on a number line.
Determine where a fraction is located on a number line by partitioning.
Day 8 Formative Assessment- In Class Q & A Discussion
Represent any fraction (a/b) less than 1 on a number line.
Determine where a fraction is located on a number line by partitioning.
Day 9 3.NF.1 and 3.NF.2 Summative Assessment- Google Forms
Explain and represent a unit fraction.
Explain and represent a non-unit fraction.
Describe numerator and denominator.
Represent fractions with color tiles, pattern blocks, Cuisenaire rods, fraction circles, and other region or set models.
Explain how representations are related.
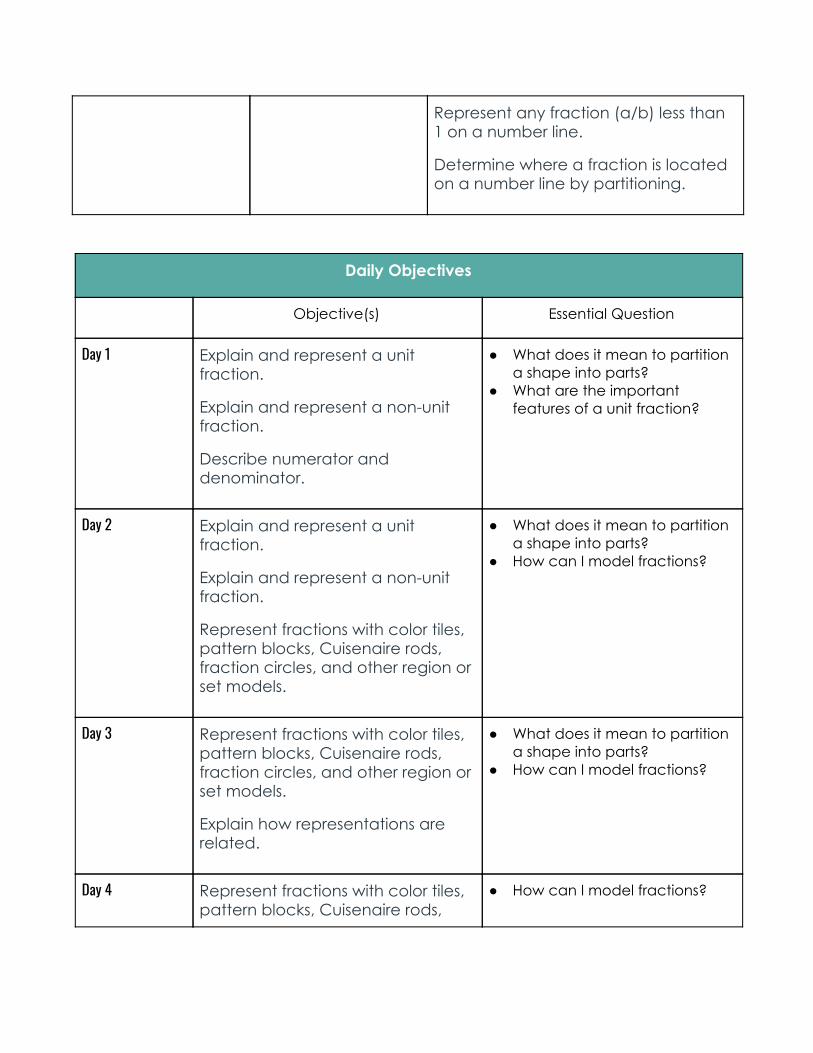
Represent any fraction (a/b) less than 1 on a number line.
Determine where a fraction is located on a number line by partitioning.
Daily Objectives
Objective(s) Essential Question
Day 1 Explain and represent a unit fraction.
Explain and represent a non-unit fraction.
Describe numerator and denominator.
● What does it mean to partition a shape into parts?
● What are the important features of a unit fraction?
Day 2 Explain and represent a unit fraction.
Explain and represent a non-unit fraction.
Represent fractions with color tiles, pattern blocks, Cuisenaire rods, fraction circles, and other region or set models.
● What does it mean to partition a shape into parts?
● How can I model fractions?
Day 3 Represent fractions with color tiles, pattern blocks, Cuisenaire rods, fraction circles, and other region or set models.
Explain how representations are related.
● What does it mean to partition a shape into parts?
● How can I model fractions?
Day 4 Represent fractions with color tiles, pattern blocks, Cuisenaire rods,
● How can I model fractions?

fraction circles, and other region or set models.
Explain how representations are related.
Day 5 Represent any fraction (a/b) less than 1 on a number line.
● What fractions are on the number line between 0 and 1?
Day 6 Represent any fraction (a/b) less than 1 on a number line.
Determine where a fraction is located on a number line by partitioning.
● What fractions are on the number line between 0 and 1?
● What relationships can I discover about fractions?
Day 7 Represent any fraction (a/b) less than 1 on a number line.
Determine where a fraction is located on a number line by partitioning.
● What fractions are on the number line between 0 and 1?
● What relationships can I discover about fractions?
Day 8 Represent any fraction (a/b) less than 1 on a number line.
Determine where a fraction is located on a number line by partitioning.
● What fractions are on the number line between 0 and 1?
● What relationships can I discover about fractions?
Day 9 Explain and represent a unit fraction.
Explain and represent a non-unit fraction.
Describe numerator and denominator.
Represent fractions with color tiles, pattern blocks, Cuisenaire rods, fraction circles, and other region or set models.
● What does it mean to partition a shape into parts?
● What are the important features of a unit fraction?
● What fractions are on the number line between 0 and 1?
● What relationships can I discover about fractions?

Explain how representations are related.
Represent any fraction (a/b) less than 1 on a number line.
Determine where a fraction is located on a number line by partitioning.
Stage 3: Overview of Lessons
Day 1 Day 2 Day 3 Day 4
Warm-up
Hershey Bar opener
Cupcakes- Notice & Wonder
Mimio Balloon Pop Game- pg 8 of Identifying and Modeling Fractions
Quick Review Word Problems from Day 3 Exit Ticket
Activity
What is a fraction? Spin and Cover Game
Mimio Model/Name Game Fly Your Fraction Kite
Centers: With me: Word Problem Fraction Practice On Your Own: Fraction Roll, Shake, Dump Practice on Your Own: Egg-Citing Fractions
Mastery Connect Quiz for Common Assessment Fractions Task Cards (Early Finishers Activity)

Wrap-up
Google Forms Exit Ticket
Google Forms Exit Ticket
Google Forms Exit Ticket
Review Questions from Quiz
Stage 3: Overview of Lessons
Day 5 Day 6 Day 7 Day 8 Day 9 Day 10
Warm-up
Review Last Week’s Word Problems w/Graphic Organizer Whip Around
Fractions on a Number Line (Mimio Game)
Fractions on a Number Line Interactive Game (Mimio)
Exit Ticket Review
Masteryconnect Quick Check
Teacher Tools for Interactive Whiteboards
Activity
Digital interactive notebook- fractions on a number line
Red Light, Green Light Task Card
Centers: Rolling Fractions Khan Academy 3. NF.2 Assignments
With Teacher
Centers Wrap Up Super Bowl Game (Level 1 & 2)
Obstacle Course
Summative Assessment

Wrap-up
Day 5 Exit Ticket
Day 6 Exit Ticket
Day 7 Exit Ticket
Day 8 Survey Exit Ticket
Review Missed Test Questions
DAY 1 LESSON Standard(s) MATH: ● 3.NF.1 Understand a fraction 1/b as the quantity formed by 1 part when a
whole is partitioned into b equal parts; understand a fraction a/b as the quantity formed by a parts of size 1/b.
Objective(s) • Explain and represent unit and non-unit fractions. • Describe numerator and denominator. • Represent fractions with color counters.
Essential Question(s)
● What are the parts of a fraction?
Materials
● Day 1 Slides
● Pencils
● Hershey Bars
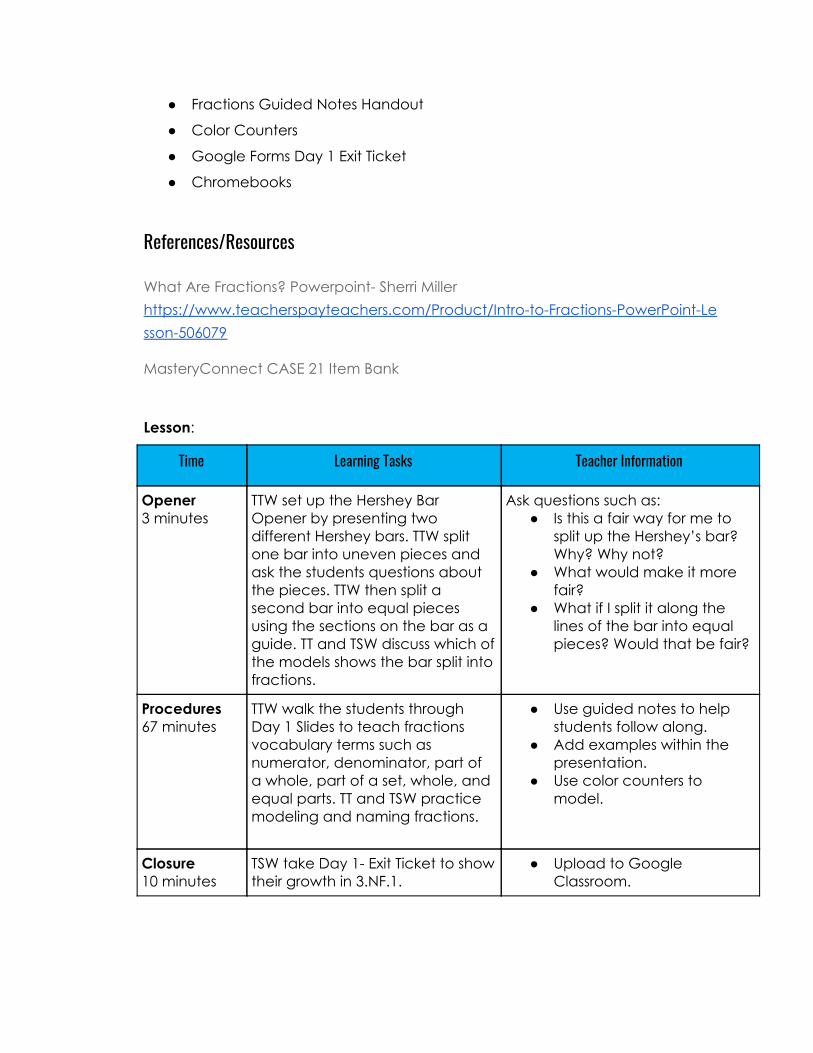
● Fractions Guided Notes Handout
● Color Counters
● Google Forms Day 1 Exit Ticket
● Chromebooks
References/Resources
What Are Fractions? Powerpoint- Sherri Miller https://www.teacherspayteachers.com/Product/Intro-to-Fractions-PowerPoint-Lesson-506079
MasteryConnect CASE 21 Item Bank
Lesson:
Time Learning Tasks Teacher Information
Opener 3 minutes
TTW set up the Hershey Bar Opener by presenting two different Hershey bars. TTW split one bar into uneven pieces and ask the students questions about the pieces. TTW then split a second bar into equal pieces using the sections on the bar as a guide. TT and TSW discuss which of the models shows the bar split into fractions.
Ask questions such as: ● Is this a fair way for me to
split up the Hershey’s bar? Why? Why not?
● What would make it more fair?
● What if I split it along the lines of the bar into equal pieces? Would that be fair?
Procedures 67 minutes
TTW walk the students through Day 1 Slides to teach fractions vocabulary terms such as numerator, denominator, part of a whole, part of a set, whole, and equal parts. TT and TSW practice modeling and naming fractions.
● Use guided notes to help students follow along.
● Add examples within the presentation.
● Use color counters to model.
Closure 10 minutes
TSW take Day 1- Exit Ticket to show their growth in 3.NF.1.
● Upload to Google Classroom.

DAY 2 LESSON
Standard(s) MATH: ● 3.NF.1 Understand a fraction 1/b as the quantity formed by 1 part when a
whole is partitioned into b equal parts; understand a fraction a/b as the quantity formed by a parts of size 1/b.
Objective(s) • Explain and represent unit and non-unit fractions. • Describe numerator and denominator. • Represent fractions with color counters.
Essential Question(s)
● What are the parts of a fraction?
Materials
● Day 2 Slides
● Pencil

● Post-Its
● Kite Activity Handouts
● Crayons
● Scissors
● Tape
● String
● Google Forms Day 2 Exit Ticket
● Chromebooks
References/Resources
Notice and Wonder Cupcakes- Howard County Public School Systems https://docs.google.com/presentation/d/14O1iB9LYsVIS-6VLsNsnUhHBSwGIJ1CFaaIuFu3DjFM/copy
Mimio Game https://www.mimioconnect.com/node/16581
Kite Activity- Markers & Minions https://www.teacherspayteachers.com/Product/Fly-your-Fractions-Fraction-Kite-1669075
MasteryConnect CASE 21 Item Bank
Lesson:
Time Learning Tasks Teacher Information
Opener 10 minutes
TSW analyze a picture of cupcakes and complete a Notice and Wonder activity. TSW record their ideas on sticky notes. TTW call on students to share their ideas with the class.
● Ask students to think about the picture in relation to math. How can they see some of the math concepts we’ve talked about in the picture? Is there anything they wonder about the picture? Any questions they have about the picture?
Procedures 60 minutes
TSW play a game to practice modeling fractions. TTW facilitate the game using the iPad. TTW call on different students to come
● Students adjust the iPad to show different fractions/models.

adjust the controls on the Mimio game to model different fractions for the students to name. TTW introduce parts 1 and 2 of the kite activity. TSW color in a kite and then make fractions based on the amount of squares they colored.
Closure 10 minutes
TSW take Day 2- Exit Ticket to show their growth in 3.NF.1.
DAY 3 LESSON Standard(s) MATH: ● 3.NF.1 Understand a fraction 1/b as the quantity formed by 1 part when a
whole is partitioned into b equal parts; understand a fraction a/b as the quantity formed by a parts of size 1/b.
Objective(s) • Explain and represent unit and non-unit fractions. • Describe numerator and denominator.
Essential Question(s)
● What are the parts of a fraction?
Materials
● Day 3 Slides
● Pencil
● Fraction Roll, Shake, Dump Sheet
● Dice

● Word Problem Practice
● Egg-citing Fractions Handout
● Egg cartons
● Pom-Pom balls
● Google Forms Day 3 Exit Ticket
● Chromebooks
References/Resources
Mimio Balloon Pop https://www.mimioconnect.com/node/11173
Fraction Roll, Shake, Dump- Howard County Public School Systems https://hcpss.instructure.com/courses/97/files/25054/download?verifier=RT25XjsYb2E8Dru5s64cwnxDYpsyaUGiHzPhG0iO&wrap=1
Egg-citing Fractions- Howard County Public School Systems https://hcpss.instructure.com/courses/97/files/25037/download?verifier=fA09qY4WJ5jvB6o4Vys8YJVTBrBJxYYcYR78zgqy&wrap=1
Fractions Word Problems- Nancy Melriv (2019) https://www.teacherspayteachers.com/Product/Fraction-Number-Line-Word-Problem-Wkst-1645381
MasteryConnect CASE 21 Item Bank
Lesson:
Time Learning Tasks Teacher Information
Opener 10 minutes
TTW facilitate the Mimio Balloon Pop game. TSW name or model fractions according to the fraction modeled or given. TSW display answers on whiteboards. TTW call on a student to come “pop” the balloon on the iPad to reveal the correct answer.
● Ask students to think about the picture in relation to math. How can they see some of the math concepts we’ve talked about in the picture? Is there anything they wonder about the picture? Any questions they have about the picture?
● Have them record thoughts on Post-its
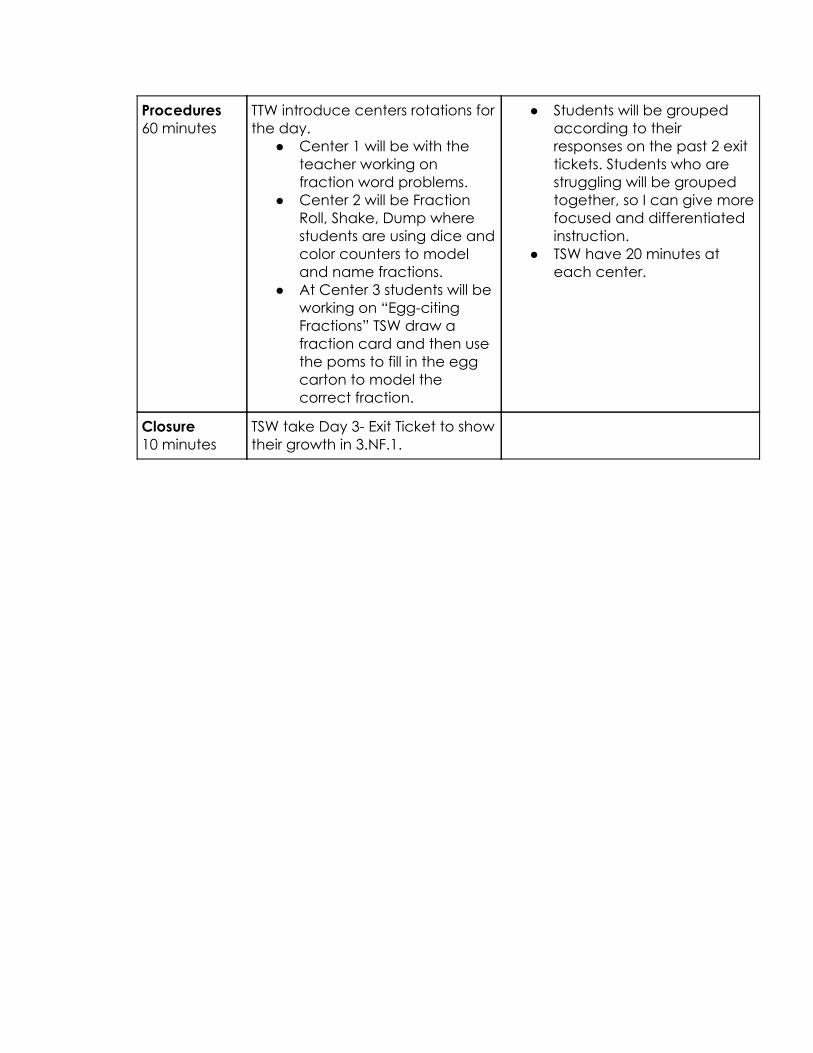
Procedures 60 minutes
TTW introduce centers rotations for the day.
● Center 1 will be with the teacher working on fraction word problems.
● Center 2 will be Fraction Roll, Shake, Dump where students are using dice and color counters to model and name fractions.
● At Center 3 students will be working on “Egg-citing Fractions” TSW draw a fraction card and then use the poms to fill in the egg carton to model the correct fraction.
● Students will be grouped according to their responses on the past 2 exit tickets. Students who are struggling will be grouped together, so I can give more focused and differentiated instruction.
● TSW have 20 minutes at each center.
Closure 10 minutes
TSW take Day 3- Exit Ticket to show their growth in 3.NF.1.

DAY 4 LESSON Standard(s) MATH: ● 3.NF.1 Understand a fraction 1/b as the quantity formed by 1 part when a
whole is partitioned into b equal parts; understand a fraction a/b as the quantity formed by a parts of size 1/b.
Objective(s) • Explain and represent unit and non-unit fractions. • Describe numerator and denominator.
Essential Question(s)
● What are the parts of a fraction?
Materials
● Day 4 Slides
● Pencil
● Link to Matching Game
● Google Forms Quiz
● Chromebooks

● Pizza Project Rules Handout
● Construction Paper
● Scissors
● Glue
● Markers
● Crayons
References/Resources
MasteryConnect CASE 21 Item Bank
Fractions Task Cards- Educational Emporium https://www.teacherspayteachers.com/Product/The-ULTIMATE-3rd-Grade-Math-Task-Cards-Bundle-2819144
Lesson:
Time Learning Tasks Teacher Information
Opener 10 minutes
TTW review some of the word problems from the Day 3 Exit Ticket to address some errors in working on word problems.
● Address the most missed questions briefly. Will review more in-depth on Day 5.
Procedures 50 minutes
TSW take a quiz on Mastery Connect for a common assessment for the School. TSW work on Fractions Task Cards as an early finishers activity. When all students are finished, TTW spread out cards like a scavenger hunt.
● Monitor students.
Closure 10 minutes
TTW review questions from the Mastery Connect quiz.

DAY 5 LESSON Standard(s) MATH: ● 3.NF.2 Understand a fraction as a number on the number line; represent
fractions on a number line diagram. o a. Represent a fraction 1/b on a number line diagram by defining the
interval from 0 to 1 as the whole and partitioning it into b equal parts. Recognize that each part has size 1/b and that the endpoint of the part based at 0 locates the number 1/b on the number line.
o b. Represent a fraction a/b on a number line diagram by marking off a lengths 1/b from 0. Recognize that the resulting interval has size a/b and that its endpoint locates the number a/b on the number line.
Objective(s) • Represent any fraction (a/b) less than 1 on a number line.
• Determine where a fraction is located on a number line by partitioning.
Essential Question(s) ● What fractions are on the number line between 0 and 1?
Materials
● Day 5 Slides
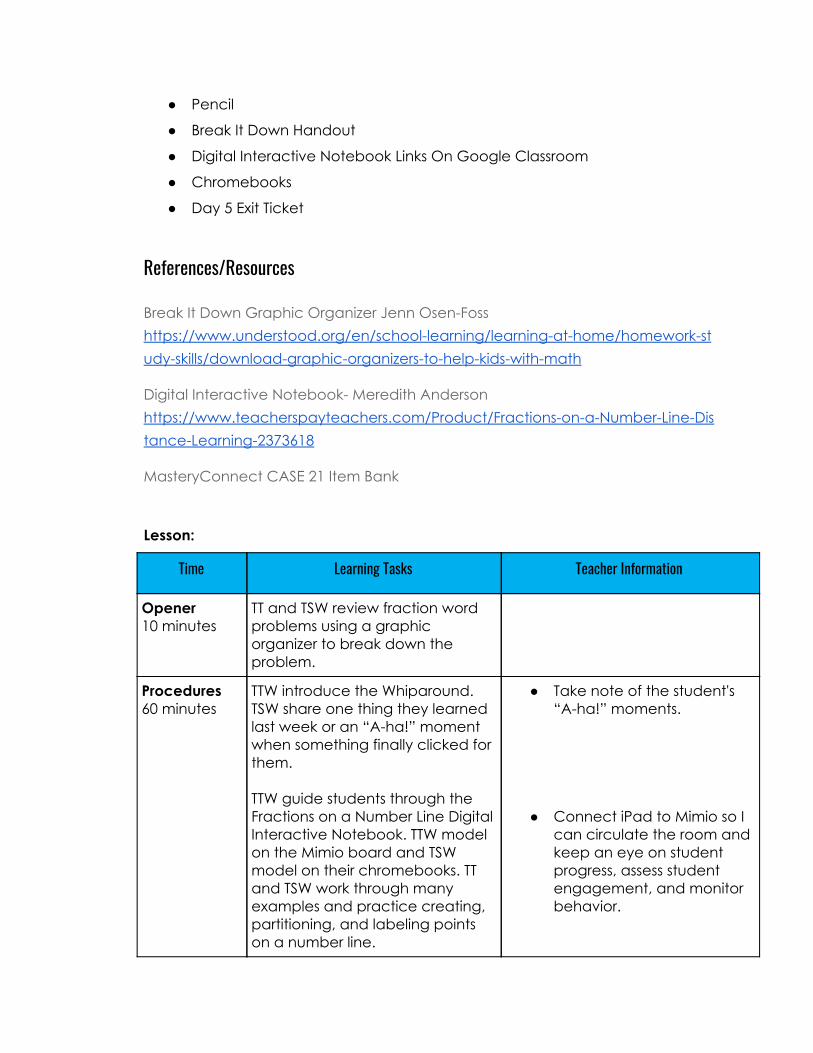
● Pencil
● Break It Down Handout
● Digital Interactive Notebook Links On Google Classroom
● Chromebooks
● Day 5 Exit Ticket
References/Resources
Break It Down Graphic Organizer Jenn Osen-Foss https://www.understood.org/en/school-learning/learning-at-home/homework-study-skills/download-graphic-organizers-to-help-kids-with-math
Digital Interactive Notebook- Meredith Anderson https://www.teacherspayteachers.com/Product/Fractions-on-a-Number-Line-Distance-Learning-2373618
MasteryConnect CASE 21 Item Bank
Lesson:
Time Learning Tasks Teacher Information
Opener 10 minutes
TT and TSW review fraction word problems using a graphic organizer to break down the problem.
Procedures 60 minutes
TTW introduce the Whiparound. TSW share one thing they learned last week or an “A-ha!” moment when something finally clicked for them. TTW guide students through the Fractions on a Number Line Digital Interactive Notebook. TTW model on the Mimio board and TSW model on their chromebooks. TT and TSW work through many examples and practice creating, partitioning, and labeling points on a number line.
● Take note of the student's “A-ha!” moments.
● Connect iPad to Mimio so I can circulate the room and keep an eye on student progress, assess student engagement, and monitor behavior.

Closure 10 minutes
TSW take Day 5- Exit Ticket to show their growth in 3.NF.2.
DAY 6 LESSON Standard(s) MATH: ● 3.NF.2 Understand a fraction as a number on the number line; represent
fractions on a number line diagram. o a. Represent a fraction 1/b on a number line diagram by defining the
interval from 0 to 1 as the whole and partitioning it into b equal parts. Recognize that each part has size 1/b and that the endpoint of the part based at 0 locates the number 1/b on the number line.
o b. Represent a fraction a/b on a number line diagram by marking off a lengths 1/b from 0. Recognize that the resulting interval has size a/b and that its endpoint locates the number a/b on the number line.
Objective(s) • Represent any fraction (a/b) less than 1 on a number line.
• Determine where a fraction is located on a number line by partitioning.
Essential Question(s) ● What fractions are on the number line between 0 and 1? ● What relationships can I discover about fractions?
Materials
● Day 6 Slides

● Pencil
● Fractions on a Number Line Game Link
● Red Light, Green Light Task Card
● Chromebooks
● Day 6 Exit Ticket
References/Resources
Fractions on a Number Line Game https://www.mimioconnect.com/node/43268
Red Light Green Light- Howard County Public School Systems https://docs.google.com/presentation/d/1QNlzs634DtX_5tdEm2r8dDBxAEL3TXUG5Md4SoY-kEE/copy
MasteryConnect CASE 21 Item Bank Lesson:
Time Learning Tasks Teacher Information
Opener 10 minutes
TTW facilitate Fractions on a Number Line Game on the Mimio.
● Ask questions like, “What if I moved the point to this tick mark? Then, what would the fraction be?”
Procedures 60 minutes
TTW introduce Red Light, Green Light Task. TTW split students into groups.
● Split students into ability level groups.
● Circulate to ask students questions/challenge their thinking.
● Give early finishers enrichment questions to have them think about their work from a different perspective.
Closure 10 minutes
TSW take Day 6- Exit Ticket to show their growth in 3.NF.2.
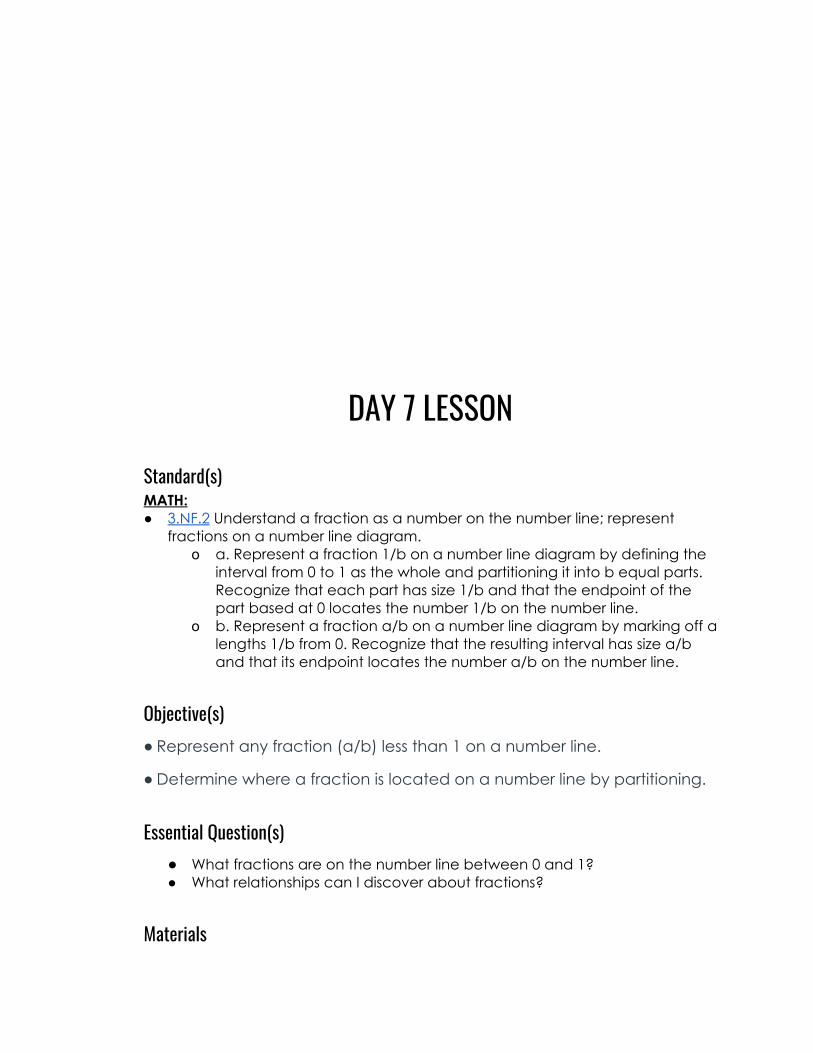
DAY 7 LESSON Standard(s) MATH: ● 3.NF.2 Understand a fraction as a number on the number line; represent
fractions on a number line diagram. o a. Represent a fraction 1/b on a number line diagram by defining the
interval from 0 to 1 as the whole and partitioning it into b equal parts. Recognize that each part has size 1/b and that the endpoint of the part based at 0 locates the number 1/b on the number line.
o b. Represent a fraction a/b on a number line diagram by marking off a lengths 1/b from 0. Recognize that the resulting interval has size a/b and that its endpoint locates the number a/b on the number line.
Objective(s) • Represent any fraction (a/b) less than 1 on a number line.
• Determine where a fraction is located on a number line by partitioning.
Essential Question(s) ● What fractions are on the number line between 0 and 1? ● What relationships can I discover about fractions?
Materials

● Day 7 Slides
● Pencil
● Dice
● Rolling Fractions handout/instructions
● Fractions on a Number Line Problems
● Chromebooks
● Day 7 Exit Ticket
References/Resources
Fractions on a Number Line Game https://www.mimioconnect.com/node/43268
Rolling Fractions https://hcpss.instructure.com/courses/97/files/2175908/download?wrap=1
MasteryConnect CASE 21 Item Bank Lesson:
Time Learning Tasks Teacher Information
Opener 10 minutes
TTW facilitate the fractions on a number line interactive Mimio game.
● Ask questions like, “What if I moved the point to this tick mark? Then, what would the fraction be?”
● Have students move points on a number line.
Procedures 60 minutes
TTW introduce centers for the day. ● Center 1: Rolling Fractions.
TSW roll a die to determine how to split a number line.
● Center 2: Khan Academy. TSW complete the assigned lessons on 3.NF.2.
● Center 3: Meet with the teacher. TT and TSW work on fractions on a number line using the whiteboards with number line templates
● Students will be grouped according to their responses on the past 2 exit tickets. Students who are struggling will be grouped together, so I can give more focused and differentiated instruction.
● TSW have 20 minutes at each center.

with mid and low groups. (Questions will be pulled from Mastery Connect bank.) TTW work on comparing/ordering fractions with high group.
Closure 10 minutes
TSW take Day 7- Exit Ticket to show their growth in 3.NF.2.
DAY 8 LESSON Standard(s) MATH: ● 3.NF.2 Understand a fraction as a number on the number line; represent
fractions on a number line diagram. o a. Represent a fraction 1/b on a number line diagram by defining the
interval from 0 to 1 as the whole and partitioning it into b equal parts. Recognize that each part has size 1/b and that the endpoint of the part based at 0 locates the number 1/b on the number line.
o b. Represent a fraction a/b on a number line diagram by marking off a lengths 1/b from 0. Recognize that the resulting interval has size a/b and that its endpoint locates the number a/b on the number line.
Objective(s) • Represent any fraction (a/b) less than 1 on a number line.
• Determine where a fraction is located on a number line by partitioning.
Essential Question(s) ● What fractions are on the number line between 0 and 1? ● What relationships can I discover about fractions?
Materials
● Day 8 Slides
● Pencil
● Centers Work from Yesterday
● Chromebooks
● Day 8 Exit Ticket
References/Resources
Fractions on a Number Line Sports Game- Meredith Anderson https://www.teacherspayteachers.com/Product/Fractions-on-a-Number-Line-Distance-Learning-2373618
MasteryConnect CASE 21 Item Bank
Lesson:
Time Learning Tasks Teacher Information
Opener 5 minutes
TTW review most missed questions from the exit tickets from this week in a Think, Pair, Share style.
● Pair students according to ability levels.
Procedures 60 minutes
TSW finish up the centers work from yesterday. TTW introduce the “Super Bowl” fractions on a number line game. TSW practice identifying points on the number line and dividing number lines into the correct number of parts.
● Students will be in the same groups from yesterday. Give them time to complete the last center rotation.
● Split students into 2 teams- Chiefs and the 49ers.
Closure 10 minutes
TSW take Day 8 Exit Ticket to show growth in 3. NF. 2.

DAY 9 LESSON Standard(s) MATH: ● 3.NF.2 Understand a fraction as a number on the number line; represent
fractions on a number line diagram. o a. Represent a fraction 1/b on a number line diagram by defining the
interval from 0 to 1 as the whole and partitioning it into b equal parts. Recognize that each part has size 1/b and that the endpoint of the part based at 0 locates the number 1/b on the number line.
o b. Represent a fraction a/b on a number line diagram by marking off a lengths 1/b from 0. Recognize that the resulting interval has size a/b and that its endpoint locates the number a/b on the number line.
Objective(s) • Represent any fraction (a/b) less than 1 on a number line.
• Determine where a fraction is located on a number line by partitioning.
Essential Question(s) ● What fractions are on the number line between 0 and 1? ● What relationships can I discover about fractions?
Materials

● Day 9 Slides
● Pencil
● Obstacle Course Handout
● Posterboard
● Chromebooks
● Day 9- Survey Exit Ticket
References/Resources
Obstacle Course Task- Howard County Public School Systems https://hcpss.instructure.com/courses/97/files/25053/download?wrap=1
MasteryConnect CASE 21 Item Bank
Lesson:
Time Learning Tasks Teacher Information
Opener 10 minutes
TSW take brief school-wide Mastery Connect Quick Check.
Procedures 60 minutes
TTW show a video of kids completing an obstacle course. TT and TSW create a number line to represent the obstacle course in the video. TTW introduce the Obstacle Course Task. TTW split students into cooperative learning groups and explain the different jobs that must be fulfilled by team members. TSW choose their job and then work in groups to complete the task.
● Ask students to pay attention to how many different obstacles there were on the course.
● Students will be grouped
according to who works well together.
Closure 10 minutes
TSW take Day 9 Survey Exit Ticket.

DAY 10 LESSON
Standard(s) MATH: ● 3.NF.2 Understand a fraction as a number on the number line; represent
fractions on a number line diagram. o a. Represent a fraction 1/b on a number line diagram by defining the
interval from 0 to 1 as the whole and partitioning it into b equal parts. Recognize that each part has size 1/b and that the endpoint of the part based at 0 locates the number 1/b on the number line.
o b. Represent a fraction a/b on a number line diagram by marking off a lengths 1/b from 0. Recognize that the resulting interval has size a/b and that its endpoint locates the number a/b on the number line.
Objective(s) • Represent any fraction (a/b) less than 1 on a number line.
• Determine where a fraction is located on a number line by partitioning.
Essential Question(s) ● What fractions are on the number line between 0 and 1? ● What relationships can I discover about fractions?

Materials
● Day 10 Slides
● Pencil
● Scratch paper
● Chromebooks
● Survey Exit Ticket
References/Resources
Number Line Game- https://www.dreambox.com/teachertools
MasteryConnect CASE 21 Item Bank
Lesson:
Time Learning Tasks Teacher Information
Opener 5 minutes
TT and TSW quickly review for the test by playing with Interactive Number Line Game- Dreambox.
● Ask students to pay attention to how many different obstacles there were on the course.
Procedures 60 minutes
TTW introduce the summative assessment and review directions. TSW take the summative assessment.
● Early finishers can move on to the Exit Ticket and then work on Fact Fluency on Xtra math.
Closure 10 minutes
TSW present Obstacle Course projects from the day before.

APPENDIX C
Google Forms Data
Day One


Day Two
*The data from Day Two is presented in 2 sets. The researcher had to correct the error for
the second class and pushed out an edited version of the form. Therefore, the data was
collected on two different Google Forms.*
Class A Data:


Class B Data:


Day Three


Day Five


Day Six


Day Seven


Day Eight


Day Nine


Day Ten