Embed Size (px)
Citation preview
Tecnociencia, Vol. 9. N° 2 89
EVALUATING THE PERFORMANCE OF DIFFERENT GEOPHYSICAL METHODS FOR GROUNDWATER PROSPECTING IN ESPIRITO SANTO BASIN - SOUTHEAST BRAZIL
Carrasquilla, Abel.*; Gonçalves, Carlos A.** & Ulugergerli, Emin.*** *Petroleum Engineering and Exploration Laboratory of the North Fluminense State university in Macaé-RJ, Brazil. Laboratório de Engenharia e Exploração de Petróleo, Universidade Estadual do Norte Fluminense Darcy Ribeiro (LENEP/UENF), Macaé-RJ, Brazil. Email:[email protected] **Schlumberger Servicos de Petroleo Ltda. Av. Presidente Wilson 231 - 20 andar Rio de Janeiro, Brazil. ***Geophysical Department, Ankara Universitesi, Muh. Fak, Besevler, Ankara, 06100, Turkey. RESUMEN Cuatro técnicas geofísicas fueron utilizadas en diferentes locales de la Cuenca de Espirito Santo en el Sudeste de Brasil, en terrenos del tipo sedimentar, en el distrito de Veracruz, y del tipo ígneo, en los distritos de Rio Bananal y Ibiraçu. El objetivo principal del estudio fue avaluar el desempeño de los diferentes métodos geofísicos en la prospección de agua subterránea, dentro de tales tipos de geología. Los trabajos de campo fueron ejecutados a través de sondeos, usando el método electromagnético en el dominio del tiempo (TDEM), mientras que perfiles horizontales en la superficie del terreno fueron obtenidos por medio de los métodos de electro-resistividad (resistividad DC - DCRE) y electromagnético en el dominio de la frecuencia (FDEM). Por otro lado, el método geofísico de pozo (WL - well logging) fue usado con los perfiles verticales de temperatura, rayos gammas naturales, potencial espontáneo y resistividad (normal y lateral). De esta forma, la utilización de esos métodos geofísicos permitió separar las formaciones geológicas arcillosas de las arenosas, como también detectar la existencia de fallas y fracturas en la roca cristalina. Esos resultados son muy importantes, puesto que ayudan a localizar esas estructuras geológicas, y, como consecuencia, a definir la geometría de los acuíferos dentro de las diferentes áreas ígneas o sedimentares de esa cuenca. Finalmente, el reconocimiento de esos ambientes es importante para encontrar los locales más adecuados para la perforación de pozos y colocar correctamente los
Carrasquilla, A. y colaboradores 90
tubos de acero de revestimiento, permitiendo, en esta forma, obtener buena cantidad de recursos de agua potable para el consumo humano. PALABRAS CLAVES Técnicas geofísicas, Cuenca de Espírito Santo, Sudeste de Brasil, acuíferos, agua subterránea potable. ABSTRACT Four geophysical techniques were used in different parts of Espirito Santo Basin (Southeast Brazil), in both sedimentary (Aracruz District) and crystalline (Rio Bananal and Ibiraçu Districts) kind of terrains. The main goal of the survey was to evaluate the performance of these geophysical methods for groundwater prospecting in such kinds of geology. Fieldworks were performed through several soundings, using time domain electromagnetic (TDEM), while surface profiles were obtained using Direct Current Resistivity (DCRE) and frequency domain electromagnetic (FDEM). On the other hand, geophysical well logging method (WL) was used through temperature, natural gamma ray, spontaneous potential and normal/lateral resistivity logs. Thus, with the utilized geophysical methods we were able to separate shaly and sandy geological formations, as well as, the presence of faults or fractures in the crystalline rocks, which are important geological structures in the definition of aquifers within different igneous or sedimentary areas of this basin. The recognition of these environments permitted us to locate the best places to drill wells and to put correctly the casings, obtaining, in this form, freshwater resources for human consumption.
KEYWORDS Geophysical techniques, Espirito Santo Basin, Southeast Brazil, aquifers, freshwater.
INTRODUCTION Groundwater is a vital natural resource and it is important for geoscientists to be able to monitor its quality and quantity in subsurface reservoirs, which are known as aquifers. In this sense, electromagnetic (EM) geophysical methods are well established in groundwater resource evaluations to map subtle changes in electrical resistivity (or conductivity) below the surface of the earth. There are many proven and potential applications of resistivity studies to a variety of geological targets at shallow to intermediate depths; one of the most important is the groundwater exploration. The resistivity readings are used to locate geological formations, e.g. aquifers, which have a resistivity contrast with the rocks around them. Thus, resistivity measurements can be made at the surface of the earth or in boreholes to investigate subsurface conditions in an area, because its the wide range variation in rocks (over seven orders
Tecnociencia, Vol. 9. N° 2 91
of magnitude) has long made it an attractive physical parameter for subsurface exploration and description. Thus, resistivity surveys are often used to search for groundwater in both porous and fissured media. In porous media, generally related with sedimentary rocks as clean sands and gravels, which have high porosities and make good aquifers, when saturated with fresh water they can easily be differentiated from lower resistivity impermeable clays and marls (which are poor aquifers), and also from bedrock, which is usually of much higher resistivity. On the other hand, the presence of fissures (faults, alterations or fractures) is the most important thing of crystalline rocks (igneous and metamorphic). In this case, the alteration and fissuration are most favorable to accumulation of groundwater, causing the resistivity of rocks measured at the surface to decrease, which permit location of these zones, associated with low resistivity values. Thus, EM and well logging geophysical methods are commonly driven through the ground and boreholes to detect inhomogeneities underground, such as electrically better or poorer conducting layers or structures, which are inferred from the fact that they deflect or canalize the current around or inside these geological structures. (Sharma, 1997).
Regarding our study, we used four geophysical techniques in different parts of Espirito Santo Basin, in both sedimentary and crystalline kind of terrains (Fig. 1). Sedimentary geology was found in Aracruz District, while crystalline rocks were found in Rio Bananal and Ibiraçu Districts. Thus, the main goal of the survey was to evaluate the performance of these geophysical methods for groundwater prospecting in such kinds of geology, mainly its capability to distinguish the resistivity and geometry (depth and thickness) of the different layers in sedimentary terrains and the lateral variations of resistivity in crystalline terrains, permitting the best locations to drill wells. During the fieldworks, we used time domain electromagnetic (TDEM), direct current resistivity (DCRE), frequency domain electromagnetic (FDEM) and well logging (WL). TDEM was used in the form of soundings to obtain the vertical variation of the resistivity, meanwhile DCRE and HD/VD were utilized in the form of profiles to obtain the horizontal variation of the resistivity. On the other hand, WL was used through natural gamma ray, normal/lateral resistivity, spontaneous potential and temperature logs, aiming to measured different properties along the wells. All these methods will be rapidly described in the next section.
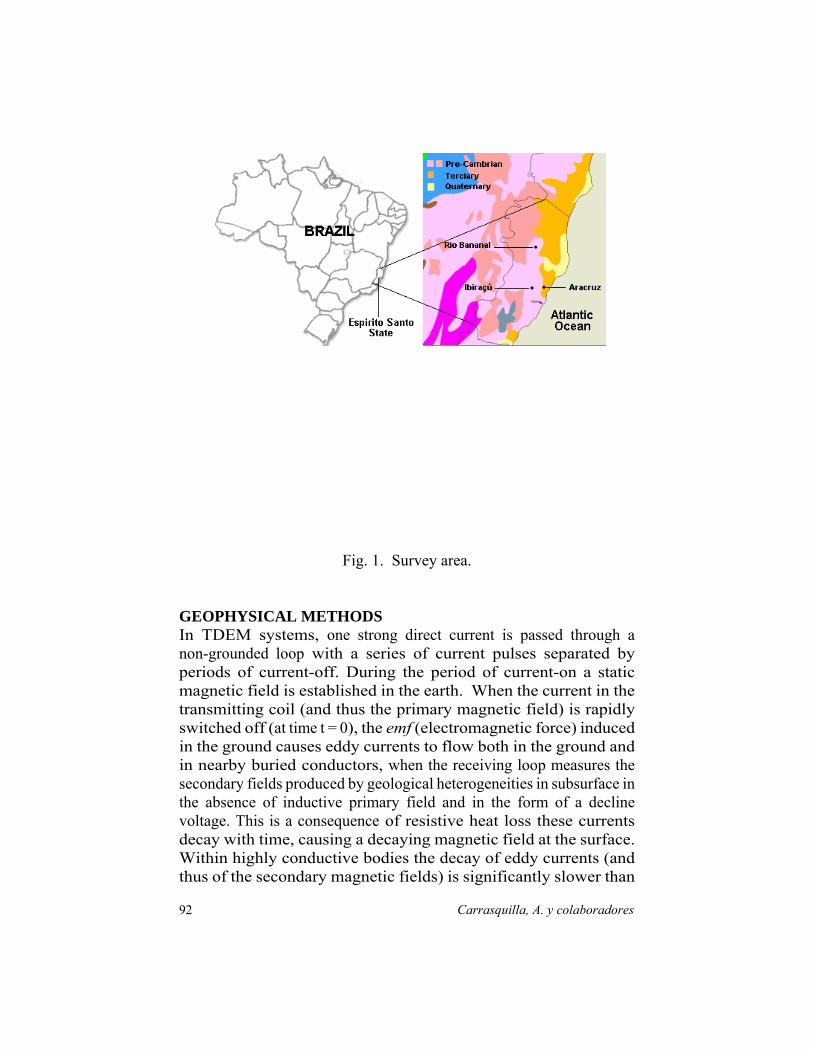
Fig. 1. Survey area.
GEOPHYSICAL METHODS In TDEM systems, one strong direct current is passed through a non-grounded loop with a series of current pulses separated by periods of current-off. During the period of current-on a static magnetic field is established in the earth. When the current in the transmitting coil (and thus the primary magnetic field) is rapidly switched off (at time t = 0), the emf (electromagnetic force) induced in the ground causes eddy currents to flow both in the ground and in nearby buried conductors, when the receiving loop measures the secondary fields produced by geological heterogeneities in subsurface in the absence of inductive primary field and in the form of a decline voltage. This is a consequence of resistive heat loss these currents decay with time, causing a decaying magnetic field at the surface. Within highly conductive bodies the decay of eddy currents (and thus of the secondary magnetic fields) is significantly slower than
Carrasquilla, A. y colaboradores 92
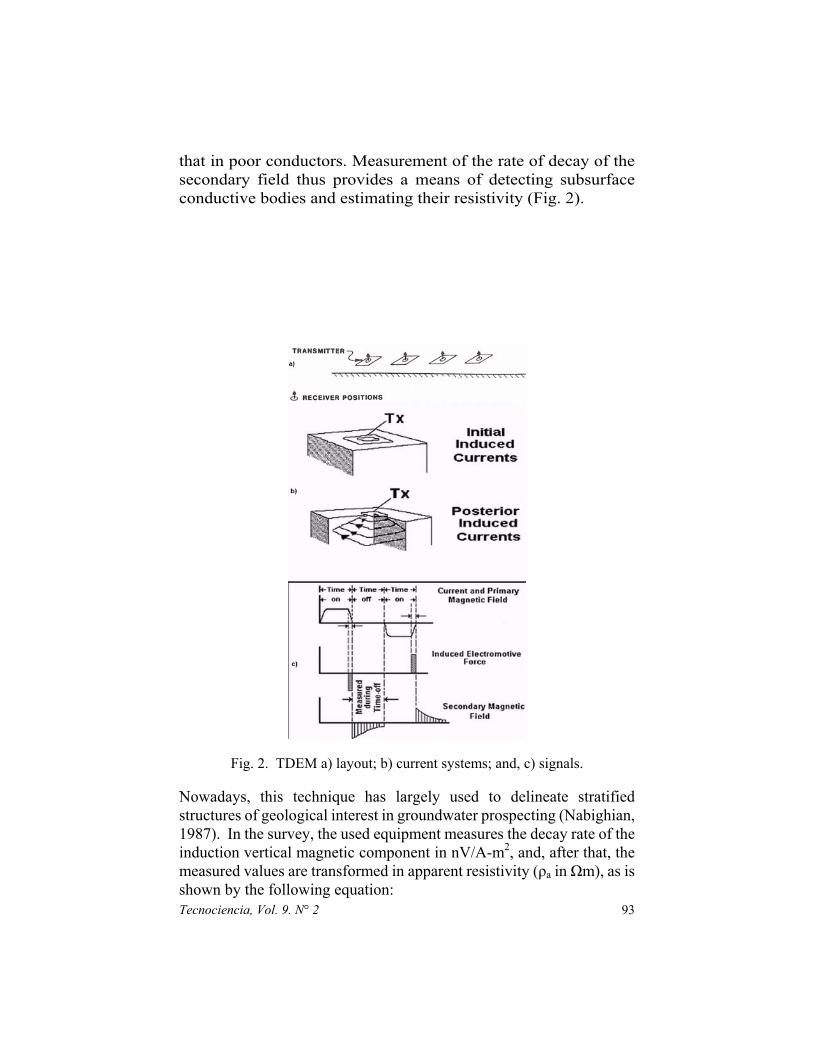
that in poor conductors. Measurement of the rate of decay of the secondary field thus provides a means of detecting subsurface conductive bodies and estimating their resistivity (Fig. 2).
Fig. 2. TDEM a) layout; b) current systems; and, c) signals. Nowadays, this technique has largely used to delineate stratified structures of geological interest in groundwater prospecting (Nabighian, 1987). In the survey, the used equipment measures the decay rate of the induction vertical magnetic component in nV/A-m2, and, after that, the measured values are transformed in apparent resistivity (ρa in Ωm), as is shown by the following equation: Tecnociencia, Vol. 9. N° 2 93
32
22
54 ⎥⎦
⎤⎢⎣
⎡⎥⎦
⎤⎢⎣
⎡=
tVIAb
ta πμρ , (1)
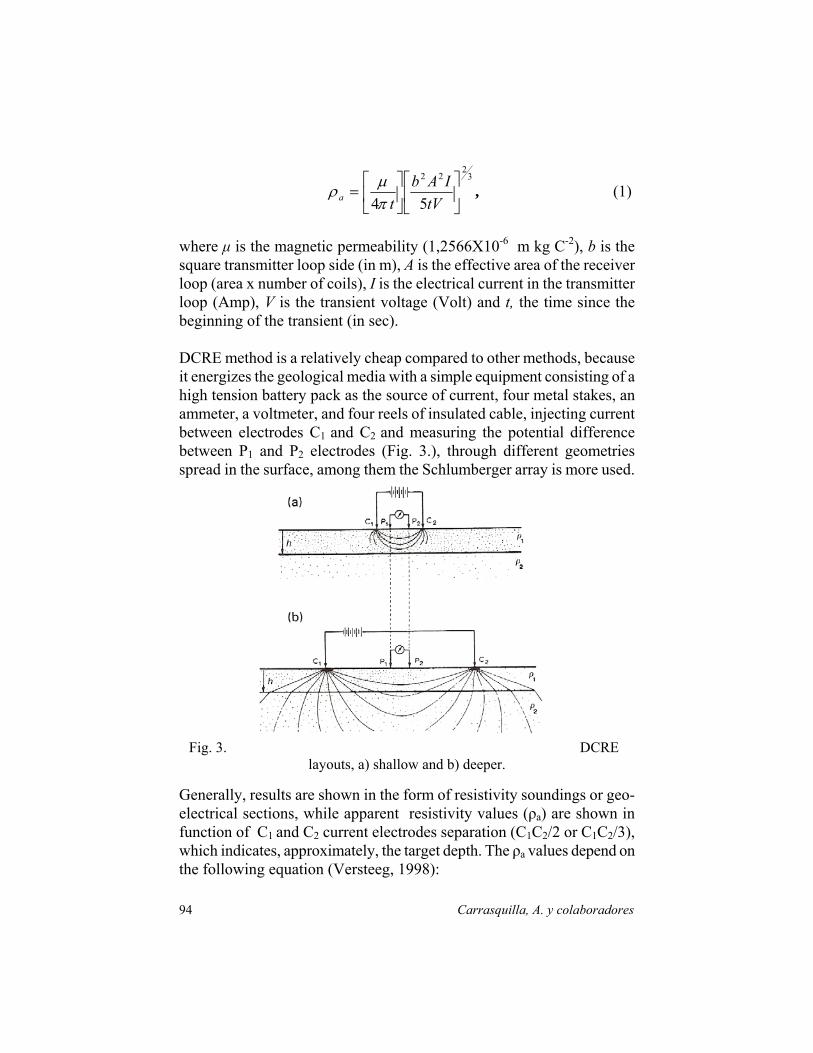
where μ is the magnetic permeability (1,2566X10⁻⁶ m kg C-2), b is the square transmitter loop side (in m), A is the effective area of the receiver loop (area x number of coils), I is the electrical current in the transmitter loop (Amp), V is the transient voltage (Volt) and t, the time since the beginning of the transient (in sec). DCRE method is a relatively cheap compared to other methods, because it energizes the geological media with a simple equipment consisting of a high tension battery pack as the source of current, four metal stakes, an ammeter, a voltmeter, and four reels of insulated cable, injecting current between electrodes C1 and C2 and measuring the potential difference between P1 and P2 electrodes (Fig. 3.), through different geometries spread in the surface, among them the Schlumberger array is more used.
Fig. 3. DCRE layouts, a) shallow and b) deeper.
Generally, results are shown in the form of resistivity soundings or geo-electrical sections, while apparent resistivity values (ρa) are shown in function of C1 and C2 current electrodes separation (C1C2/2 or C1C2/3), which indicates, approximately, the target depth. The ρa values depend on the following equation (Versteeg, 1998):
Carrasquilla, A. y colaboradores 94
⎟⎠⎞
⎜⎝⎛ Δ⎟⎠⎞
⎜⎝⎛=
IV
Gaπρ 2 , with ⎟⎟
⎠
⎞⎜⎜⎝
⎛+−−=
22122111
1111PCPCPCPC
G , (2)
where G is the geometrical factor, V is the potential difference (Volts) and I is the injected current (Amp). This method is largely utilized in different type of studies, especially in groundwater prospecting, mainly because it is usefulness to map thickness of weathering and stratigraphy, as well as the existence of faults and fractures (Ward, 1990). In FDEM technique, we used ground resistivity meters, commonly called horizontal or vertical transmitter loops, where an alternate current is flowing with frequencies between 100 to 5000 Hz, produces a primary magnetic field (HP) that induces a secondary magnetic field (HS) in the conductor bodies located in the subsurface (Fig. 4.). The sum of these two kinds of field results in a total magnetic field (HT), which is measured through a horizontal or vertical coil located in surface, allowing thus, the location of conductor targets in subsurface. EM response at low induction numbers with either horizontal or vertical transmitter/receiver dipole orientation is based on the assumption that all current flow is horizontal and all current loops are independent of all other current loops. This allows the construction of a function, which gives the relative response to Hs at the receiver from a thin layer of a ground at any depth. On the other hand, the coils must always be coplanar, but may be used in a vertical position or lying horizontally on the ground. The vertical coil configuration (horizontal dipoles – HD, also known as vertical loop electromagnetic - VLEM) is the most sensitive to near surface materials and the response decreases with depth. The horizontal coil configuration (vertical dipoles – VD, also known as horizontal loop electromagnetic - HLEM) is most responsive to materials located at shallow depths. Thus, the depth of exploration is mainly a function of coil separation and orientation. FDEM equipments are designed to directly measure linear conductivity under certain constraints, defined as operation under low induction numbers by simply measuring the ratio between HS and HP. Given HS/HP, the apparent conductivity σa (mS/m) indicated by the instrument is defined as:
( ) ⎥⎦
⎤⎢⎣
⎡⎥⎦
⎤⎢⎣
⎡==
P
S
oaa H
Hs 2
41ωμρ
σ , (3)
Tecnociencia, Vol. 9. N° 2 95
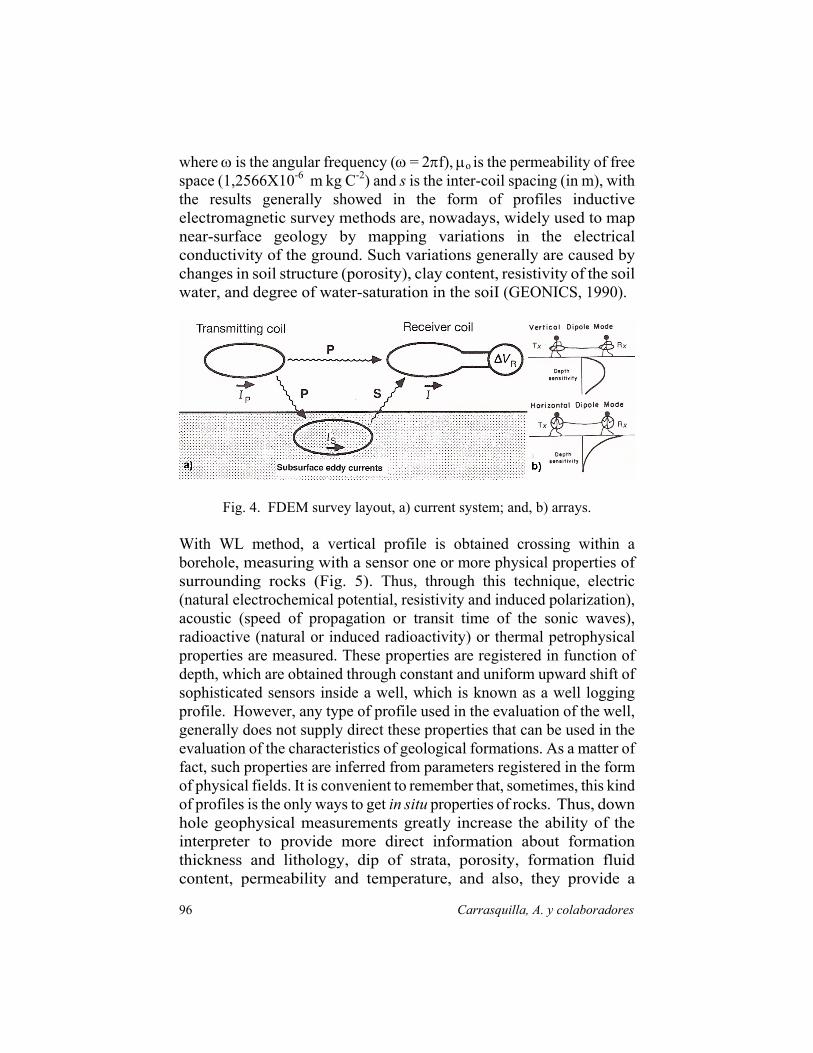
where ω is the angular frequency (ω = 2πf), μo is the permeability of free space (1,2566X10⁻⁶ m kg C-2) and s is the inter-coil spacing (in m), with the results generally showed in the form of profiles inductive electromagnetic survey methods are, nowadays, widely used to map near-surface geology by mapping variations in the electrical conductivity of the ground. Such variations generally are caused by changes in soil structure (porosity), clay content, resistivity of the soil water, and degree of water-saturation in the soiI (GEONICS, 1990).
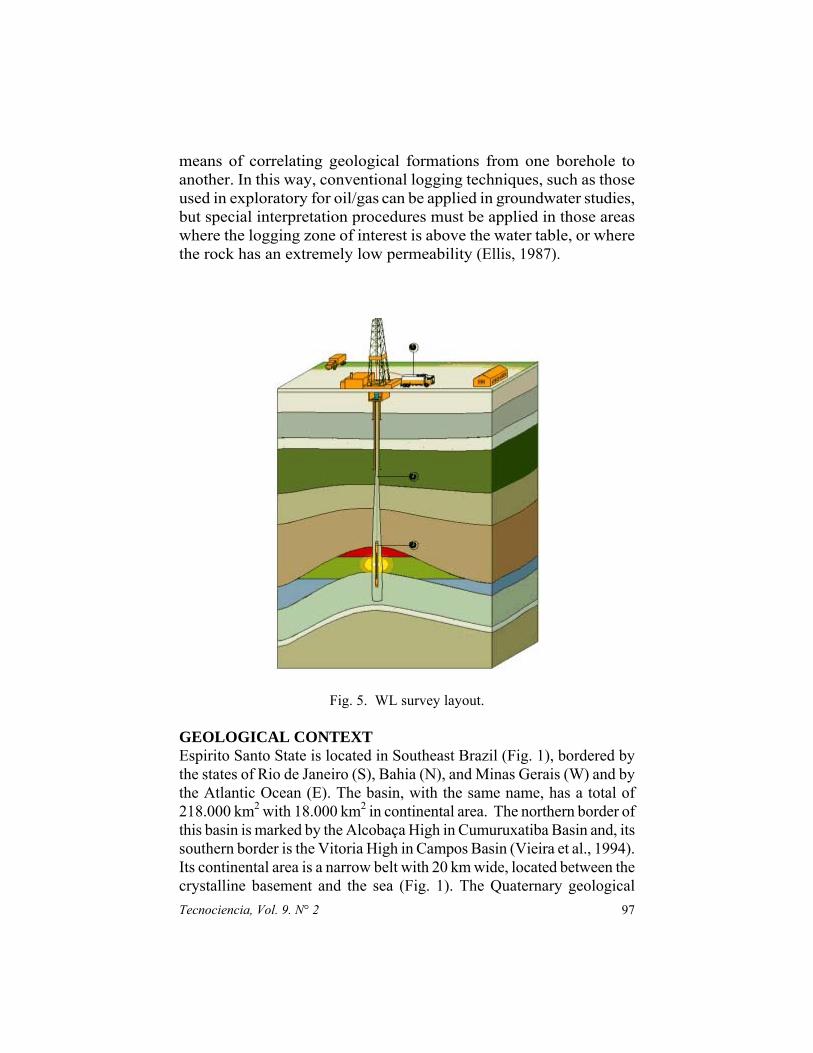
Fig. 4. FDEM survey layout, a) current system; and, b) arrays. With WL method, a vertical profile is obtained crossing within a borehole, measuring with a sensor one or more physical properties of surrounding rocks (Fig. 5). Thus, through this technique, electric (natural electrochemical potential, resistivity and induced polarization), acoustic (speed of propagation or transit time of the sonic waves), radioactive (natural or induced radioactivity) or thermal petrophysical properties are measured. These properties are registered in function of depth, which are obtained through constant and uniform upward shift of sophisticated sensors inside a well, which is known as a well logging profile. However, any type of profile used in the evaluation of the well, generally does not supply direct these properties that can be used in the evaluation of the characteristics of geological formations. As a matter of fact, such properties are inferred from parameters registered in the form of physical fields. It is convenient to remember that, sometimes, this kind of profiles is the only ways to get in situ properties of rocks. Thus, down hole geophysical measurements greatly increase the ability of the interpreter to provide more direct information about formation thickness and lithology, dip of strata, porosity, formation fluid content, permeability and temperature, and also, they provide a
Carrasquilla, A. y colaboradores 96
means of correlating geological formations from one borehole to another. In this way, conventional logging techniques, such as those used in exploratory for oil/gas can be applied in groundwater studies, but special interpretation procedures must be applied in those areas where the logging zone of interest is above the water table, or where the rock has an extremely low permeability (Ellis, 1987).
Fig. 5. WL survey layout. GEOLOGICAL CONTEXT Espirito Santo State is located in Southeast Brazil (Fig. 1), bordered by the states of Rio de Janeiro (S), Bahia (N), and Minas Gerais (W) and by the Atlantic Ocean (E). The basin, with the same name, has a total of 218.000 km2 with 18.000 km2 in continental area. The northern border of this basin is marked by the Alcobaça High in Cumuruxatiba Basin and, its southern border is the Vitoria High in Campos Basin (Vieira et al., 1994). Its continental area is a narrow belt with 20 km wide, located between the crystalline basement and the sea (Fig. 1). The Quaternary geological Tecnociencia, Vol. 9. N° 2 97
Carrasquilla, A. y colaboradores 98
formation of this basin, called Urucutuca, is formed by sandy - conglomerates and shales. The Tertiary geological formation, known as Barreiras, is constituted mainly with conglomerates. Both formations are very common in all Brazilian coast and they are the only two litho-stratigraphical units that outcrop in the continental portion of this basin. On the other hand, pre-Cambrian geological basement consists of a complex association of igneous and metamorphic rocks, which are intruded by diabasium and gabro dykes (Fundão Suite), generally oriented in a NW-SE direction, probably related with the Atlantic Ocean opening (Figueiredo, 1985). Our work was developed in the continental part of this basin, in both sedimentary and crystalline environments, using different geophysical methods in several places of Espirito Santo Basin, mainly in Aracruz, Ibiraçu and Rio Bananal Districts (Fig. 1). METHODOLOGY To perform the survey using TDEM method, field procedure consists in obtaining several electromagnetic sounding along a profile, to show resistivity changes in distance and depth (Fig. 2). The receiver coil, which is the same of transmitter coil in an arrangement known as coincident loop, samples the transient field at intervals of 400 μs over a broad time range extending to 150 ms. For shallow depth investigations (groundwater and environmental studies) a smaller unit (SIROTEM MK3) is available with a transmitting loop of 20x20 m, permitting to explore depths up to 50 m with a survey productivity usually between 30-50 stations per day (GEO INSTRUMENTS, 1990). Beside the notch filter utilized in the data acquisition, in the data processing, we used the TEMIX XL 4 commercial program (INTERPEX, 1996), which use common filters to eliminate the cultural noise (60 Hz and its harmonics). The aim of a DCRE survey was to delineate resistivity boundaries (both horizontal and vertical) in a heterogeneous ground. In practice this is accomplished by two distinct procedures, often called, by analogy, vertical electric sounding (or drilling) and electric profiling (or trenching). In our case, as the resistivity boundaries are almost vertical planes, rather than horizontal, the electric profiling is adopted with this method. In the case of Schlumberger (gradient) method of
Tecnociencia, Vol. 9. N° 2 99
electric profiling (Fig. 3), which was the array used in our survey, the current electrodes (C1, C2) remain fixed at a very large distance, for instance, a few hundred meters, and the potential electrodes with a small constant separation (P1P2) are moved between C1 and C2. ρa is calculated from Equation 2 for each position that the mobile pair of potential electrodes takes. At the end of the profile line the gradient setup is transferred on the adjacent line and so on, until the area to be investigated has been covered. In fact, the profile will usually be at right angle to the 'strike' of the structures (e.g., faults or dikes discovered from geological map) to be detected so that we may expect to find somewhat similar results from profile to profile. Thus, in our work, DCRE was performed, using separations of 40, 50, 60, 70 and 80 m between currents electrodes, with the objective to measure the resistivity of the local geology in depths of 20, 25, 30, 35 and 40 m, respectively. A SYSCAL Junior equipment manufactured by IRIS Instruments was utilized in this survey, with maximum capability of 100 W, 200 V and a current of 1.2 mA (IRIS, 2000). In FDEM method, HD/VD surveys were carried out using a GEONICS EM-34 resistivity meter has separate coils connected by a cable, which can be 10, 20 and 40 m long (Fig. 4). The effective depth investigation are 7,5 m (HD) and 15 m (VD) for a frequency of 6,4 KHz and separation of 10 m. For a separation of 20 m and frequency of 1,6 Hz, is obtained a depth investigation of 15 m (HD) and 30 m (VD), as soon as, for the separation of 40 m and frequency of 0,4 Hz, the investigation depth is 30 m (HD) and 60 m (VD) (GEONICS, 1990). This equipment is a two-man portable system comprising of a transmitter (Tx) and a receiver (Rx) coils. When Tx is energized with an alternating current at audio frequencies (100 - 5000 Hz), the time varying magnetic field arising from this effect induces very small currents in the earth, which is assumed uniform. These currents generate a secondary magnetic field (Hs), which is sensed together with the primary field (Hp) by the receiver, in the form of total field (HT). Thus, Hs is a complicated function of the inter-coil spacing (s), the operating frequency (f) and the ground conductivity σ, as is shown in Equation 3 (McNeill 1980). The utilized arrays were an horizontal (vertical magnetic dipole - VD) and vertical (horizontal magnetic dipole - HD) coplanar positions. Profiles with 10 and 20 m of separation between transmitter and receiver were performed, using 6,4 and 1,6 Hz frequencies. As DCRE method, we performed a right angle to the strike of the structure, which was discovered from
Carrasquilla, A. y colaboradores 100
geological map. In this case, only notch filter utilized in the data acquisition, without any filtering process in data processing, meaning that only qualitative interpretation of the data is available. The basic WL system consists of a down hole probe (or 'sonde'), a multicore cable rose by a winch system, a probe-control surface module, and a recording unit (Fig. 5). Probes normally contain a combination of logging tools that do not mutually interfere, so that several types of geophysical logs can be obtained simultaneously using a multichannel recorder. A probe is lowered to the base of the section of the hole to be logged, and logging is carried out as the probe is winched back up through the section. In our case, equipment manufactured by AUSLOG (2001) was utilized through temperature, natural gamma ray, and spontaneous potential and normal/lateral resistivity logs. In addition to the probes which measure the physical properties of the formations penetrated, devices are available to measure the parameters of the hole itself, its diameter and deviation from the vertical. Open holes are usually logged with the full suite of logging tools just before the setting of casing. The hole diameter may increase above that of the drilling bit when friable formations are encountered. Where the borehole penetrates a permeable formation and the drilling mud is dense enough to exert pressure in the hole to exceed that in the formation, an invaded zone is formed in which the mud filtrate penetrates the wallrock and displaces indigenous formation fluid The clay particles in suspension in the drilling mud are filtered off during invasion to form a mudcake whose character is determined by the porosity and permeability of the wallrock formation. Thus, the drilling of a borehole can cause major damage to penetrated fractures, and thereby significantly influence the response of the borehole logging tools. Drilling may also induce fracturing where none was present, both in the wallrock and in the core-cuttings. Similarly false indications of fractures can occur with washouts, borehole wall breakouts, chemical weathering of soluble minerals, and mechanical erosion of softer rocks. Therefore, considerable caution must be exercised in using a specific log response as definitive evidence of fracture or lithologic discontinuity. For quantitative log interpretation, a number of corrections have to be applied for factors such as hole irregularities and mudcake effects, commonly called environmental corrections. In our research, we did not use any correction, for this reason, only qualitative interpretation was able to do.
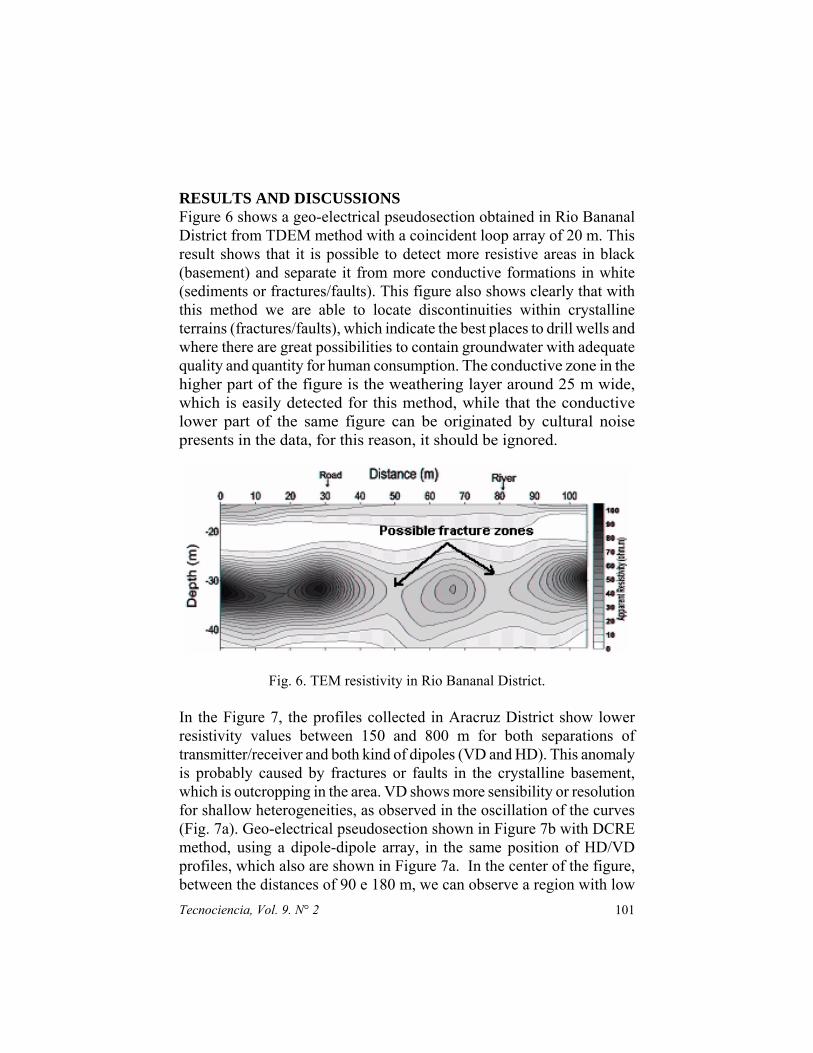
RESULTS AND DISCUSSIONS Figure 6 shows a geo-electrical pseudosection obtained in Rio Bananal District from TDEM method with a coincident loop array of 20 m. This result shows that it is possible to detect more resistive areas in black (basement) and separate it from more conductive formations in white (sediments or fractures/faults). This figure also shows clearly that with this method we are able to locate discontinuities within crystalline terrains (fractures/faults), which indicate the best places to drill wells and where there are great possibilities to contain groundwater with adequate quality and quantity for human consumption. The conductive zone in the higher part of the figure is the weathering layer around 25 m wide, which is easily detected for this method, while that the conductive lower part of the same figure can be originated by cultural noise presents in the data, for this reason, it should be ignored.
Fig. 6. TEM resistivity in Rio Bananal District.
In the Figure 7, the profiles collected in Aracruz District show lower resistivity values between 150 and 800 m for both separations of transmitter/receiver and both kind of dipoles (VD and HD). This anomaly is probably caused by fractures or faults in the crystalline basement, which is outcropping in the area. VD shows more sensibility or resolution for shallow heterogeneities, as observed in the oscillation of the curves (Fig. 7a). Geo-electrical pseudosection shown in Figure 7b with DCRE method, using a dipole-dipole array, in the same position of HD/VD profiles, which also are shown in Figure 7a. In the center of the figure, between the distances of 90 e 180 m, we can observe a region with low Tecnociencia, Vol. 9. N° 2 101
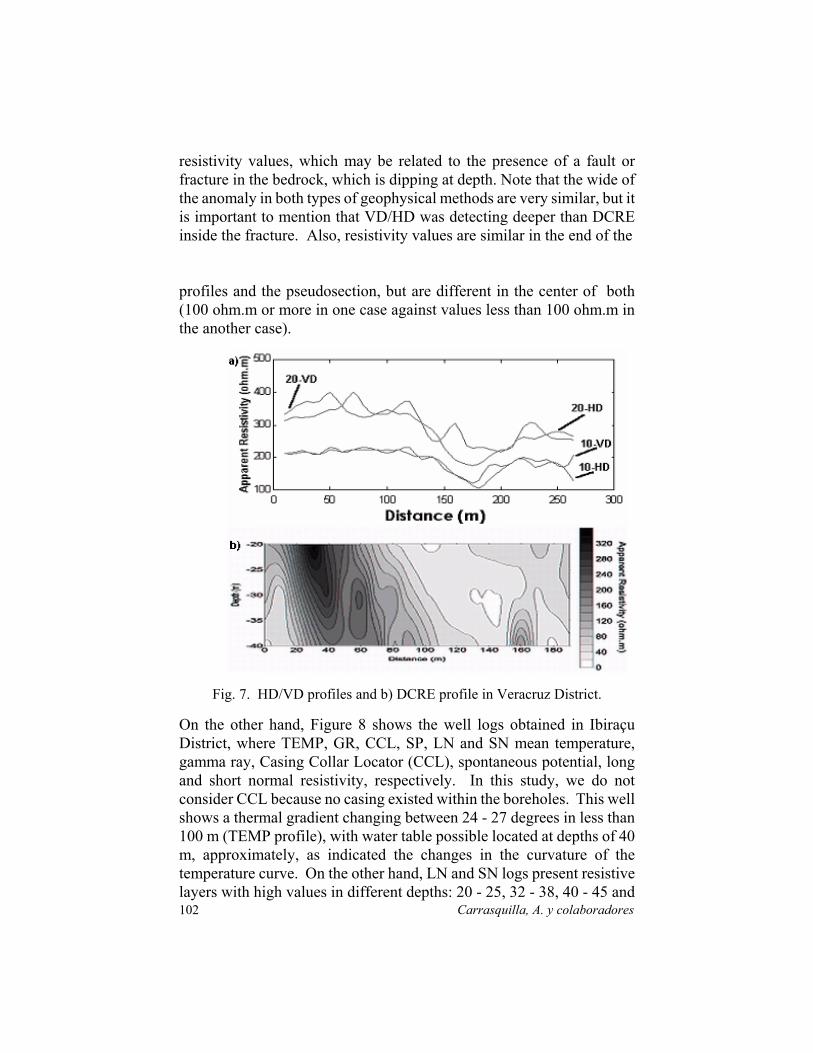
resistivity values, which may be related to the presence of a fault or fracture in the bedrock, which is dipping at depth. Note that the wide of the anomaly in both types of geophysical methods are very similar, but it is important to mention that VD/HD was detecting deeper than DCRE inside the fracture. Also, resistivity values are similar in the end of the profiles and the pseudosection, but are different in the center of both (100 ohm.m or more in one case against values less than 100 ohm.m in the another case).
Fig. 7. HD/VD profiles and b) DCRE profile in Veracruz District.
Carrasquilla, A. y colaboradores 102
On the other hand, Figure 8 shows the well logs obtained in Ibiraçu District, where TEMP, GR, CCL, SP, LN and SN mean temperature, gamma ray, Casing Collar Locator (CCL), spontaneous potential, long and short normal resistivity, respectively. In this study, we do not consider CCL because no casing existed within the boreholes. This well shows a thermal gradient changing between 24 - 27 degrees in less than 100 m (TEMP profile), with water table possible located at depths of 40 m, approximately, as indicated the changes in the curvature of the temperature curve. On the other hand, LN and SN logs present resistive layers with high values in different depths: 20 - 25, 32 - 38, 40 - 45 and
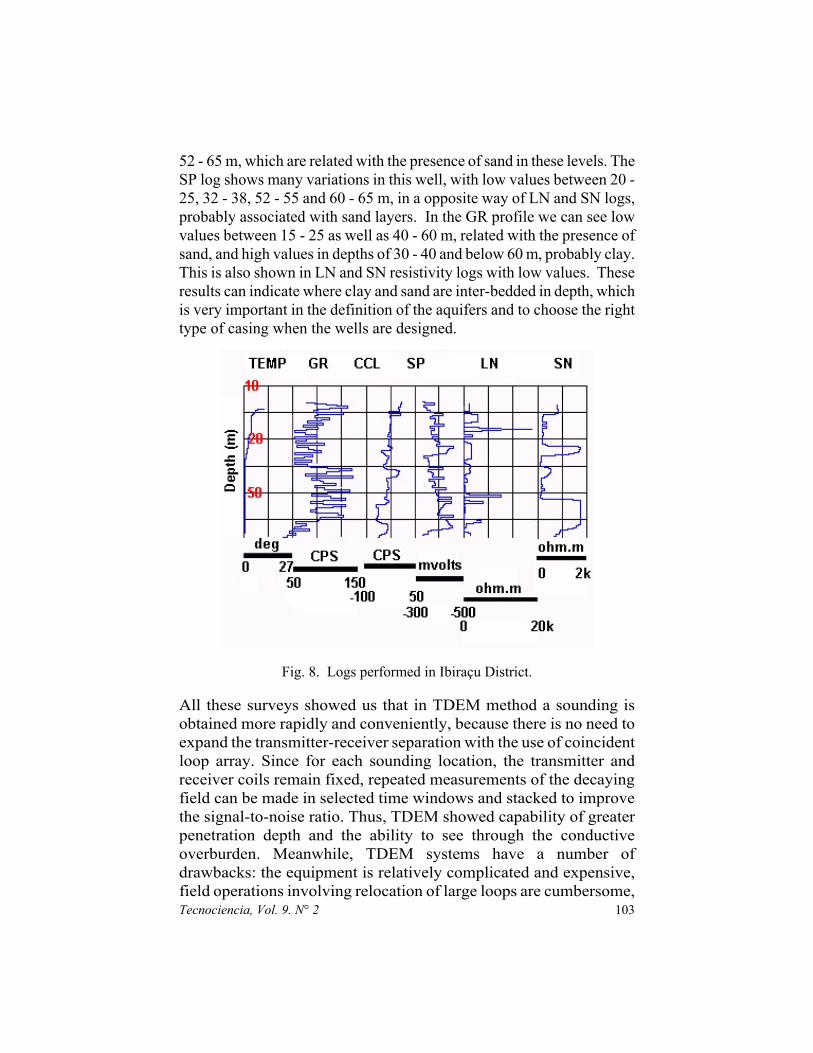
52 - 65 m, which are related with the presence of sand in these levels. The SP log shows many variations in this well, with low values between 20 - 25, 32 - 38, 52 - 55 and 60 - 65 m, in a opposite way of LN and SN logs, probably associated with sand layers. In the GR profile we can see low values between 15 - 25 as well as 40 - 60 m, related with the presence of sand, and high values in depths of 30 - 40 and below 60 m, probably clay. This is also shown in LN and SN resistivity logs with low values. These results can indicate where clay and sand are inter-bedded in depth, which is very important in the definition of the aquifers and to choose the right type of casing when the wells are designed.
Fig. 8. Logs performed in Ibiraçu District.
Tecnociencia, Vol. 9. N° 2 103
All these surveys showed us that in TDEM method a sounding is obtained more rapidly and conveniently, because there is no need to expand the transmitter-receiver separation with the use of coincident loop array. Since for each sounding location, the transmitter and receiver coils remain fixed, repeated measurements of the decaying field can be made in selected time windows and stacked to improve the signal-to-noise ratio. Thus, TDEM showed capability of greater penetration depth and the ability to see through the conductive overburden. Meanwhile, TDEM systems have a number of drawbacks: the equipment is relatively complicated and expensive, field operations involving relocation of large loops are cumbersome,
Carrasquilla, A. y colaboradores 104
and, there is a widely felt lack of practical. Meanwhile, FDEM survey seemed more efficient that DCRE in obtaining profiles, because is faster, without necessity of expand electrodes in the array. Although, the presence of cultural noise is a disadvantage of FDEM comparing with DCRE, because data processing, through the use of filters, is necessary to clean the cultural noise of the data. The great advantage of DCRE method is the inexistence of data processing and the low prices of the equipment, beside the easier way to interpret the data. WL method, on the other hand, is a powerful tool to measure the physical and geometrical properties of the geological formations in situ, it can be used as calibration of the other surface geophysical methods, because it has a better confidence to derivate the parameters of the geological formations. CONCLUSIONS In this work, we used four geophysical techniques (DCRE, TDEM, FDEM and WL) to detect groundwater presence in three areas of Espirito Santo State: Aracruz and Rio Bananal districts (crystalline terrains), as well as in Ibiraçu District, the last one inside the sedimentary basin. With these methods, we were able to detect the petrophysical characteristics (resistivity, radioactive properties, spontaneous potential, temperature, etc.) of different underground targets, as well as, it was possible to quantify their depth and geometry. Thus, results derived from data plotting and preliminary interpretation of surface data shown that, with this wide range of techniques, it is possible not only to map the depth and the length of sedimentary layers and the fault/fracture planes, but also to know the exact position of these structural features. These kind of information allowed us to chose the best places to drill the wells, to design their casings and thus, to obtain abundant hydrological resources. ACKNOWLEDGMENTS This work was supported by the Rio de Janeiro State Foundation for Research (FAPERJ) and Geohydro Geophysical Services. We are grateful to LENEP/UENF and ON/MCT for computational framework and fieldwork facilities and Brazilian National Scientific Council (CNPq) for a research fellowship.
Tecnociencia, Vol. 9. N° 2 105
REFERENCES AUSLOG. 2001. AUSLOG user’s manual, AUSLOG Pty Ltd., Australia. Ellis, D.V. 1987. Well logging for earth scientist. Elsevier, New York. 532 p. Figueiredo, A.M.F. 1985. Geologia das Bacias Brasileiras, In: WEC Brasil, Avaliação das Bacias Brasileiras, Schlumberger. 235 p. GEO INSTRUMENTS. 1990. SIROTEM MK3 user´s manual, Geo Instruments Pty Ltd., Australia. GEONICS. 1990. EM-34 user’s manual, GEONICS Ltd., Canada. INTERPEX. 2002. TEMIX XL V.4 user’s manual, INTERPEX Ltd., USA. IRIS. 2000. SYSCAL Junior user’s manual, IRIS Ltd., France. McNeill, J.D. 1980. Electrical conductivity of soils and rocks. Technical Note TN-5, GEONICS Ltd., Mississauga, Canada, 21 p. Nabighian, M.N. 1987. Electromagnetic methods in applied geophysics. I. Theory and Vol. II, Applications, Parts A and B. Society of Exploration Geophysicist, Tulsa. 513 and 972 p. Sharma, P.V. 1997. Enviromental and engineering geophysics. Cambridge University Press, Cambridge – UK, 475 p. Versteeg, R. 1998. Introduction to Enviroment and Engineering Geophysics, SAGEEP 98, Chicago, IL,154 p. Vieira, R.A.B., M.P. Mendes, P.E. Vieira, L.A.R. Costa, C.V. Tagliari, A.P. Bacelar & F.J. Feijo. 1994. Bacias de Espirito Santo e Mucuri. Boletim de Geociencias da PETROBRAS. Rio de Janeiro. 8(1): 191-202. Ward, S.H. 1990. Geotechnical and Enviromental Geophysics. Vol. I. Review and Tutorial; Vol. II: Enviromental and Groundwater; Vol. III: Geotechnical. Society of Exploration Geophysicist, Tulsa. 389, 342 and 300 p.

Carrasquilla, A. y colaboradores 106
Recibido agosto de 2006, aceptado julio de 2007.