Embed Size (px)
Citation preview

School of Engineering and Information Technology
Integrated Water Systems of The Grove
Library: Optimisation via Data Analysis from an
Automated Building Management System (BMS)
“A report submitted to the school of Engineering and Information Technology,
Murdoch University in partial fulfilment of the requirements for the Bachelor of
Engineering”
Gelareh Khakbaz
Unit Coordinator:
Dr. Gareth Lee
Academic Supervisor:
Dr. Martin Anda
Industry supervisors: Dr. Stewart Dallas, JBA
Michael Whitbread, Shire of Peppermint Grove
2
Executive Summary
This study is an attempt to uncover the underlying operation and maintenance issues in
sustaining the operation of an automated green building with focus on its water systems. The
Grove Library is a public building in Peppermint Grove, Western Australia, with smart design
aimed to address environmentally sustainable concepts in their entirety.
A sophisticated Building Management System (BMS) integrates the operation of the entire
Environmentally Sustainable Design (ESD) systems in operation at The Grove. However a
number of continual breakdowns in the operation of the ESD water systems, namely wastewater,
rainwater and irrigation systems, lead to high levels of disappointment for the people managing
and operating these systems. This is the first time that data have been extracted from the BMS.
Prior to this study, it was possible to quantify the performance of any of the ESD water systems.
This has resulted in the inability of external contractors to monitor the ESD systems’ operation.
This study discussed the factors contributing to this situation using data analysis as the main
method for troubleshooting and investigating the causes to these breakdowns. Upon achieving a
good understanding of the situation, the recommendations were able to be formulated.
It was found that the current situation with the ESD water systems at The Grove is a
consequence of some interrelated factors forming a ‘vicious circle’. The ESD systems, their
maintenance, the BMS and the management were the key factors identified as responsible for the
issues in The Grove. The recommendations produced in this study were mainly on the technical
side of the problem, that is, the BMS, ESD water systems and their maintenance. In order to
overcome the issues at The Grove this relationship among these factors should be recognised and
established.

3
Acknowledgement
I would like to acknowledge Dr. Martin Anda of Murdoch University; Dr. Stewart Dallas,
Josh Byrne & Associates; Michael Whitbread, Shire of Peppermint Grove; Dr. Ross
Mars, Water Installations, Andrew Crabtree, IBMS; and Don Jagodage, Honeywell, who
made this work possible with their support throughout the course of this project.

4
List of Abbreviations & Acronyms
ABGR: Australian Building Greenhouse Rating scheme
NABERS: National Australian Built Environment Rating Systems
BEMS: Building Energy Management System
BMCS: Building Monitoring and Control System
BMS: Building Management System
BW: Brown Water (system at The Grove)
DoH: Department of Health
DEWR: Department of the Environment and Water Resources
EMS: Energy Manager Server
ESD: Environmentally Sustainable Design
GBCA: Green Building Council of Australia
GHG: Greenhouse Gas
GW: Greywater (system at The Grove)
HVAC: Heating, Ventilation, and Air Conditioning
I/O Schedule: Input Output Schedule document
O/M: Operation and Maintenance
RW: Rainwater (system at The Grove)
SW: Stormwater (system at The Grove)
UV: Ultraviolet (disinfectant unit at the Grove)
WA: Western Australia
YW: Yellow Water (system at The Grove)

5
Table of Contents
Executive Summary ........................................................................................................... 2
Acknowledgement .............................................................................................................. 3
List of Abbreviations & Acronyms .................................................................................. 4
Table of Contents ............................................................................................................... 5
List of Figures .................................................................................................................... 8
Chapter 1: Introduction .................................................................................................. 11
1.1. Background .................................................................................................................... 11
1.2. Literature Review ........................................................................................................... 13
1.3. Objectives ....................................................................................................................... 14
1.4. Scope .............................................................................................................................. 15
1.5. Methodology .................................................................................................................. 16
1.6. Structure of Thesis ......................................................................................................... 16
Chapter 2: Systems at The Grove .................................................................................. 18
2.1. Building Management System (BMS) ........................................................................... 18
2.1.1. Introduction to the BMS ......................................................................................... 18
2.1.2. BMS at The Grove .................................................................................................. 18
2.2. Environmentally Sustainable Design (ESD) Systems .................................................... 20
2.2.1. Rainwater Systems .................................................................................................. 20
2.2.2. Wastewater Systems ............................................................................................... 23
2.2.3. Irrigation ................................................................................................................. 29
Chapter 3: The Performance of the ESD Systems ....................................................... 32
3.1. BMS Performance .......................................................................................................... 32
3.1.1. Data Access and Extraction .................................................................................... 33

6
3.1.2. Reporting Output .................................................................................................... 33
3.1.3. Maintenance Scheduling ......................................................................................... 34
3.1.4. Document Complications........................................................................................ 34
3.1.5. Tag-naming System ................................................................................................ 35
3.2. ESD Water Systems’ Performance ................................................................................ 35
3.2.1. Rainwater (RW) Status ........................................................................................... 35
3.2.2. Wastewater Systems Status..................................................................................... 37
3.2.3. Irrigation Status ....................................................................................................... 39
Chapter 4: Data Analysis of the ESD Water Systems .................................................. 42
4.1. Rainwater Systems (RW) Data Analysis ....................................................................... 42
4.2. Yellow Water (YW) Data Analysis ............................................................................... 45
4.3. Greywater (GW) Data Analysis ..................................................................................... 46
4.4. Brown Water (BW) Data Analysis................................................................................. 48
Chapter 5: Problems and Recommendations ............................................................... 52
5.1. Problems with the BMS ................................................................................................. 52
5.2. Problems with the ESD Water Systems ......................................................................... 53
5.2.1. Rainwater (RW) Systems ........................................................................................ 53
5.2.2. Wastewater Systems ............................................................................................... 55
5.2.3. Irrigation ................................................................................................................. 58
5.3. Problems with Documentation ....................................................................................... 59
Chapter 6: Conclusion..................................................................................................... 61
6.1. Project Conclusion ......................................................................................................... 61
6.2. Future Research Opportunities ....................................................................................... 63
Chapter 7: Reflection ...................................................................................................... 64
7.1. “Vicious Circle” at The Grove ....................................................................................... 64

7
7.2. Lessons Learnt on the Performance of Smart Buildings ................................................ 68
References ......................................................................................................................... 69
Appendices ....................................................................................................................... 73
Appendix A: Instructions on Data Extraction from the BMS................................................... 73
Appendix B: The BMS Backup Support .................................................................................. 78
Appendix C: ESD Water Systems’ Layout at The Grove......................................................... 81
Appendix D: Field Visit with the Water Contractor ................................................................. 88

8
List of Figures
Figure 1 Location of The Grove Library, taken from (Google Maps, 2013) .................................. 12
Figure 2 A snapshot of the BMS homepage ................................................................................. 19
Figure 3 A snapshot of the BMS showing some historical trends ................................................. 19
Figure 4 Schematic presentation of rainwater design system at The Grove (The Grove Precinct,
2012) ............................................................................................................................................. 21
Figure 5 Cross section drawing of the stormwater system, adapted from (adapted from COX
Howlett & Bailey Woodland, 2008) .............................................................................................. 22
Figure 6 Picture showing inside of a settling tank at The Grove .................................................. 22
Figure 7 Schematic design of integrated wastewater systems at The Grove (adapted from (The
Grove Precinct, 2012) .................................................................................................................... 23
Figure 8 Diagrammatic presentation of wastewater systems setup ............................................ 24
Figure 9 A picture of the YW system components ........................................................................ 25
Figure 10 Schematic diagram of the YW operation at The Grove ............................................... 25
Figure 11 A picture of the GW system components ..................................................................... 26
Figure 12 Schematic diagram of the GW system at The Grove .................................................... 26
Figure 13 A picture of the BW system components ...................................................................... 27
Figure 14 Schematic diagram showing the Biolytix operation according to its design ................ 28
Figure 15 Drip-line setup at The Grove (Picture from (Anda, 2012), from the early stages of
setting the irrigation line) ............................................................................................................. 29
Figure 16 Landscape of The Grove with irrigation hydrozones, adapted from (Huxtable, 2012) 31
Figure 17 A schematic of the BW system operation after its shut down (All the BW is diverted to
the sewer) ..................................................................................................................................... 38
Figure 18 Picture of damaged greywater line at The Grove......................................................... 40
Figure 19 Picture of damaged BW irrigation line at The Grove ................................................... 41
Figure 20 Historical trends of rainwater tanks’ levels for the period of July 2011 to March 2013
....................................................................................................................................................... 42
9
Figure 21 Rainfall events during the period of July 2011 to March 2013 (Bureau of Meteorology,
2013) ............................................................................................................................................. 43
Figure 22 Historical Trends of rainwater tanks’ levels for the period of Jan 2013 to May 2013.. 44
Figure 23 Rain gauge status in 6 minute intervals during 25 April 2013 to 02 May 2013 ........... 44
Figure 24 Cumulative rainwater volume at The Grove during Feb 2013 to May 2013 ................ 45
Figure 25 Historical trends of yellow water tanks’ levels for the period of August 2011 to March
2013 .............................................................................................................................................. 46
Figure 26 Historical trends of greywater tank level for the period of July 2011 to March 2013.. 47
Figure 27 Historical trends of greywater tank level for the period of Jan 2012 to August 2012 . 48
Figure 28 Historical trends of greywater tank level for the period of June 2012 to March 2013 48
Figure 29 Historical trends of brown water tank level for the period of July 2011 to March 2013
....................................................................................................................................................... 49
Figure 30 Historical trends of brown water tank level for the period of August 2011 to
September 2012 ............................................................................................................................ 50
Figure 31 Historical trends of brown water tank level for the period of mid-September 2012 to
March 2013 (after shutting the Biolytix system) .......................................................................... 50
Figure 32 Brown water tank level changes in 10-11 March 2012 ................................................ 51
Figure 33 Interrelated factors contributing to the complications and issues at The Grove ......... 64
Figure 34 A Snapshot of the The Grove BMS Trends page ........................................................... 74
Figure 35 A Snapshot of the The Grove BMS Trends configuration page .................................... 75
Figure 36 A Snapshot of the The Grove BMS Trends configuration page with points names ...... 75
Figure 37 Snapshots of the The Grove BMS Trend Configuration a) View b) Period, c) Interval, d)
Selector and e)Scale selection tabs ............................................................................................... 76
Figure 38 Snapshot of the The Grove BMS final trend ................................................................. 77
Figure 39 Rainwater system’s layout and details at The Grove (Water Installations, 2009) ....... 81
Figure 40 Plan view of the stormwater system's layout at the Grove (COX Howlett & Bailey
Woodland, 2008) .......................................................................................................................... 82
Figure 41 Layout of the wastewater systems at The Grove, (Water Installations, 2009) ............ 83
Figure 42 Yellow water system’s layout and details at The Grove (Water Installations, 2009) ... 84

10
Figure 43 Greywater system's layout and details at The Grove (Water Installations, 2009) ....... 85
Figure 44 Brown water system's layout and details at The Grove (Water Installations, 2009) ... 86
Figure 45 Irrigation design layout of The Grove (Water Design International, 2008) ................. 87
Figure 46 Picture showing the inside of a full yellow water tank ................................................ 90
Figure 47 Picture showing the inside of the greywater pump tank at The Grove ........................ 91
Figure 48 A picture of inside of the Biolytix tank at The Grove .................................................... 93

11
Chapter 1: Introduction
This dissertation forms the final assessable component of the ENG460 Engineering Thesis for
the Bachelor of Engineering at Murdoch University. The aim of performing a specialised study is
to demonstrate the following competencies for an engineering student:
To be able to examine, analyse and report on a design or research of a problem and
demonstrate a level of mastery of the subject area;
To be able to undertake the necessary research and/or design practice to produce a
solution/outcome for the set task; and
To be able to present the results/ findings of the work through both verbal and written
presentations
1.1. Background
The Grove Library is recognised as a state-of-art building in terms of green building technology
in Western Australia. The Grove building comprises a new library, community learning centre
and administration office for the Shire of Peppermint Grove located at 1 Leake St (Corner of
Stirling Hwy), Peppermint Grove, Western Australia. The design of the building commenced in
2007 with the collaboration of the Shire of Peppermint Grove (Shire of Peppermint Grove,
2012), the Town of Mosman Park (Town of Mosman Park, 2012) and the Town of Cottesloe
(Town of Cottesloe, 2012). Figure 1 presents an aerial map showing the location of The Grove
(Google Maps, 2013; Whereis, 2011). The Grove is an iconic building in terms of the
‘Environmentally Sustainable Design’ (ESD) systems incorporating a sophisticated Building
Management System (BMS) in charge of monitoring and to some extent controlling the water
and energy use in the building and landscape irrigation systems.

12
Figure 1 Location of The Grove Library at the a) country scale; b) region scale; c) street scale (Google Maps,
2013)
The main purpose of The Grove creation is to demonstrate the environmental benefits of the
ESD systems in a green building to encourage the community to adopt these practices for their
personal use. This will ideally result in the reduction in water and energy consumption levels and
subsequent reduction in greenhouse gas (GHG) emissions. The BMS was established to report on
the operation and quantify the environmental benefits of the ESD systems.
However, some breakdowns of the ESD water systems, namely, wastewater, rainwater and
irrigation, caused disappointment for people operating and managing them. This raised the
opportunity for involvement of a third party to study and comment further on the operation of
these systems.
This work is the first attempt to study and troubleshoot these systems since the commencement
of their operation in 2011. This study represents that data were accessed from the BMS for

13
analysing and commenting on the operation of the ESD system for the first time. It is expected
the findings will provide a base for future studies at The Grove.
1.2. Literature Review
Research into smart buildings and their monitoring systems found most of the current studies to
be focused on energy management systems (Ahmed, et al., 2010; Levermore, 2003; Marinakis,
et al., 2013; Medved, 2006). Not many studies are dealing with data analysis of the ESD water
systems. It is also noteworthy that there is not a widespread agreement on the definition of a
BMS, considering its capabilities and limitations. Different terms are used in this sense, such as
Building Monitoring and Control System (BMCS), Building Automation and Control Tool
(Marinakis, et al., 2013), or Building Information and Control System ICT-based BMS’s
(Aghemo, et al., 2013). For more details refer to section “2.1.1. Introduction to the BMS”.
In general most of the smart buildings worldwide using automated systems for monitoring their
performance have limitations in processing the monitored data in order to produce practical
information to improve the building’s performance (Ahmed, et al., 2010; Marinakis, et al.,
2013). In that sense the data analysis for the environmental optimisation of the building is an
issue that most of the building automation and control systems are facing.
One purpose of green public buildings is for them to demonstrate innovative sustainable designs
which can reduce consumption and GHG emissions (Deng, et al., 2011). One case study on a
multi-functional green building in Shanghai Jiao Tong University is on energy systems design
and GHG emission reduction being the main emphasis (Deng, et al., 2011). This paper relates to
The Grove study in terms of an automated control system for different systems and the multi-
level functioning building with ESD energy systems.
The Green Building Council of Australia (GBCA) provides guidelines and education for
promoting sustainable building construction or renovation in Australia (GBC Australia, 2012).
The GBCA provides green star guidelines for particular requirements for BMS, ESD,
commissioning and monitoring of buildings (GBC Australia, 2012). One case study exemplifies
a six-star commercial building located on 40 Albert Road, Melbourne incorporating innovative
sustainable technologies to aim for the first zero-emission building in Australia (GBC Australia,

14
2008). Some other examples of GBCA accredited buildings in Australia are the 5-star rated 8
Brindable Circuit building in Canberra, City Central Tower 1 in Adelaide and the Morgan
Stanley Tenancy at 30 The Bond, Sydney (GBCA, 2012). BMS and ESD features in these
building are specially designed for commercial buildings under urban conditions. All these
buildings showcase the integration of BMS into a green stared building.
The Australian Building Greenhouse Rating scheme (ABGR, 2013) and the National Australian
Built Environment Rating Systems (NABERS, 2013) are two performance benchmarks for
commercial buildings. These initiatives for environmental performance are used as commercial
buildings’ rating systems. The ABGR scheme is a universal rating system dealing with GHG
emissions of buildings, whereas the NABERS is the sustainability rating system for existing
buildings developed by the Department of the Environment and Water Resources (DEWR).
In recent years, the concept of sustainable buildings has been developed substantially. New
clarifications in determining a sustainable building have emerged. Environmental factors
together with socio-economic aspects form critical issues to a sustainable building (Berardi,
2013). Relevant to this research, the new concept of ‘sustainable building’ was introduced in
assessing The Grove.
The environmental and economic challenge of transformation to a green building industry is
another area of special interest for many of the related papers. For example, LSE Cities (2012)
introduces a comparison for the green technology barriers and opportunities of 53 cities around
the world. This study provides a deeper insight into the present and future of green and smart
building technology and can be used as a reference.
1.3. Objectives
Identify the faults with the ESD water systems
In order to find the solution to the problems, it was first important to identify the individual faults
with each system, e.g., a tank’s faulty water level sensor resulting in malfunctioning of the
rainwater system.

15
Extract data from the BMS and analyse data to study operational trends of the ESD water
systems
Extracting and analysing the stored data from different sensors of the ESD water systems from
the BMS was next objective. This will allow an understanding of the historical trends and
possible anomalies in the operation of the water systems.
Liaise with external contractors and the Peppermint Grove Shire to study past and future
decisions regarding the ESD water systems
External contractors who were involved in designing and maintaining the systems as well as the
Shire of Peppermint Grove are important sources for uncovering the past and future trends of
decisions made and subsequent actions for different systems. Therefore liaising with these
parties will produce invaluable information and possible solutions for the current problems at
The Grove.
Outline issues with the ESD systems according to the data retrieved from the BMS
The next objective of this study is to investigate the underlying causes of the problems at The
Grove. By determining the underlying factors causing the current problems with the ESD water
systems, it is hoped to find the answers to them.
Produce recommendations for optimisation of the ESD water systems and the BMS
The final stage of this study is to produce recommendations for rectification of the faults and
shortcomings with the BMS and ESD water systems at The Grove.
1.4. Scope
The scope of this study mainly concerns data analysis to define the problems with the ESD water
systems at The Grove. The recommendations will then be produced for the optimisation of the
situation. The choice of the ESD systems requires further analysis; this is not within the scope of
this study. The final decision is to be made by the Shire upon considering the final costs and
other policies involved. A list of further research opportunities is included in Chapter 6.

16
1.5. Methodology
The main method used in this study was an analysis of data from the BMS to study the historical
trends and the anomalies in the ESD water systems. From this point semi-structured interviews
with involved parties in maintenance, operation and management of the systems shed light on the
cause of the issues with the water systems. Speicific and general recommendations for the
problems were then developed to enhance the operation of the ESD water systems at The Grove.
The list of tasks throughout The Grove project is as follows:
a) Researching the principal ESD features at The Grove and similar systems worldwide
(with main focus on water systems)
b) Becoming familiarised with the BMS and the principal ESD water systems’ technologies
c) Liaising with persons involved in operating and managing the systems to capture their
experience of the ESD water systems’ operations
d) Extracting data from the BMS and document the process for future references
e) Analysing the extracted data from the BMS
f) Investigating the performance of the ESD technologies using data analysis strategies
g) Producing recommendations for improving the ESD systems’ operations
1.6. Structure of Thesis
The structure of this study as follows:
Chapter 2: Introduces different systems at The Grove that make it a smart and green building,
namely the BMS and the ESD systems.
Chapter 3: Elaborates on the problems with different ESD water systems as well as the BMS
status at The Grove.
Chapter 4: Analysis of data taken from the BMS on different ESD water systems, explaining
historical trends and anomalies in each system.

17
Chapter 5: Lists the faults and associated recommendations to rectify the problems with the
BMS, ESD water systems and document control at The Grove.
Chapter 6: Summarises the findings on the operation of the ESD water systems and suggests
future research opportunities on The Grove building.
Chapter 7: Provides a reflection on the cause of the current issues by introducing a ‘vicious
circle’ at The Grove with remedial recommendations for improving the situation.

18
Chapter 2: Systems at The Grove
2.1. Building Management System (BMS)
2.1.1. Introduction to the BMS
BMS is a general term referring to an automation and control tool used for monitoring and
controlling the operation of different systems in a building (Medved, 2006). The presence of
such an automated control system makes a building ‘smart’. It is noteworthy that different
terminologies are used to refer to such systems, specifying their main operation. Building
Monitoring and Control System (BMCS) is a more specific term used when an automated system
is in charge of both monitoring and controlling building operations. Not all the BMSs are
BMCSs, but all of the BMCSs are considered to have the capabilities of a BMS. Other automated
systems are mainly in charge of controlling and monitoring the energy and alarm systems in a
building (Levermore, 2003); these systems which prevail more in the ‘smart’ building industry,
are referred to as Building Energy Management Systems (BEMS) (Levermore, 2003).
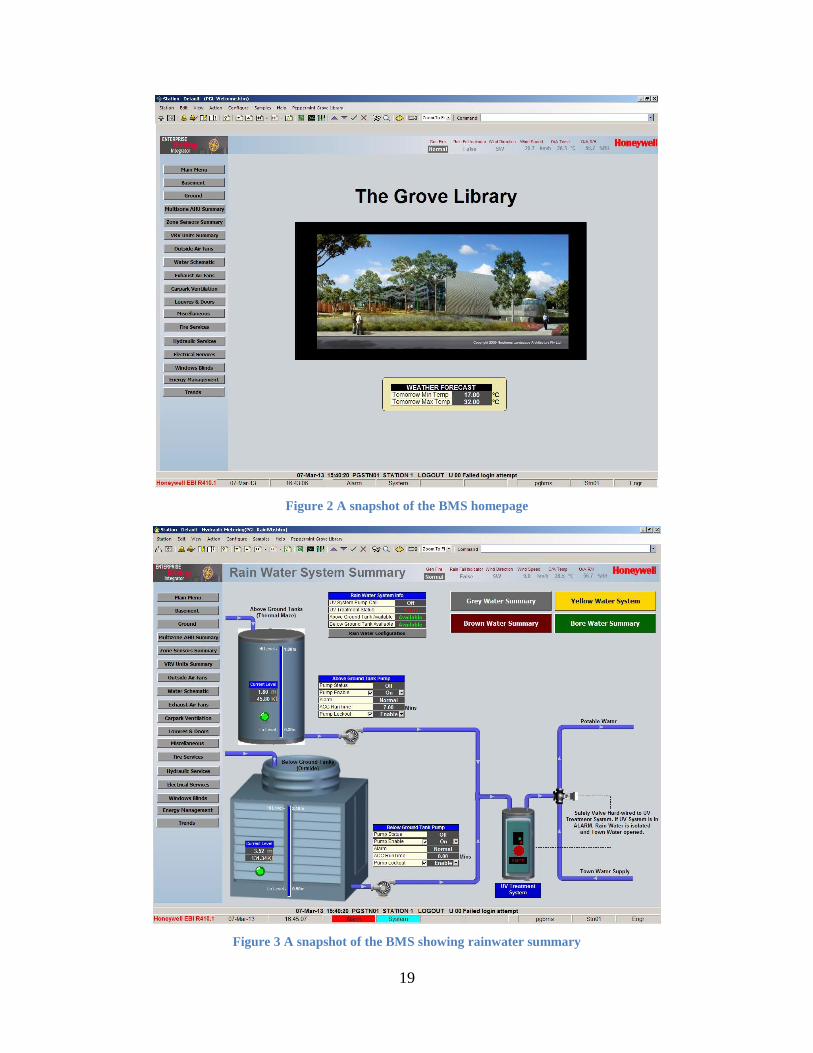
2.1.2. BMS at The Grove
The automated system at The Grove is referred to as the BMS which is mostly in charge of
monitoring and to some extent controlling the systems as cited in Honeywell website, accessed
May 13, 2013 (Honeywell, 2010). The BMS was installed by Honeywell; integrating all the ESD
energy, HVAC, alarm and water systems into one automated ‘smart’ setup as shown in Figure 2.
This version of BMS is outdated being of 2007 vintage, so having some limitations in accessing
data and setting up sensors (Refer to section “3.1. BMS Performance”).
There are two computerised control stations located at The Grove from which the BMS can be
accessed, one being in the Shire’s office and the other in the car park area. The system is
designed to display the status of each ESD system (Figure 3) and its historical trends. The BMS
has the capability of both controlling and monitoring the lighting, alarm, and HVAC systems.
Water systems, on the other hand, can mainly be monitored and the controlling of them is not
supported through the current BMS.
19
Figure 2 A snapshot of the BMS homepage
Figure 3 A snapshot of the BMS showing rainwater summary

20
2.2. Environmentally Sustainable Design (ESD) Systems
The ESD systems at The Grove are comprehensive to all the energy, water, lighting and HVAC
systems in the building.
Grid-connected photovoltaic solar panels are installed to provide part of the energy requirements
of the building. The system consists of 72 x 300W panels producing a total of 32,000kWh per
year which is equivalent to a 26,000kg reduction in GHG emissions per year (The Grove
Precinct, 2012). In addition, two wind turbines, which are currently not functional due to
mistakes in initial sizing of the height of the turbines, are designed to produce 2,400kWh per
year equivalent to an approximately 2,000kg reduction in GHG emissions annually (The Grove
Precinct, 2012).
The orientation and eco-architectural design of the building not only serve as an aesthetically
pleasing feature, but also are intended to reduce energy requirements during hot and cold
seasons. An open loop geothermal system utilises a shallow groundwater supply as a direct
energy source in charge of the HVAC. Water at 21°C is taken out from the first bore and re-
injected to the second bore at 28°C (Pujol, 2013).
The focus of this study is on the ESD water systems and their operation at The Grove. Therefore
a more comprehensive explanation of each of the ESD water systems and their design follows.
2.2.1. Rainwater Systems
Rainwater (RW)
The Grove’s rainwater system’s design is comprised of 6 in-ground concrete tanks and 11 above-
ground steel tanks in the basement of the building. Rainwater storage was designed to meet
100% of the water demand for internal usage, saving up to 730,000L per annum (Dallas, et al.,
2009). The total capacity of all the tanks is 254,000L which is carefully designed to meet the
internal demand considering the high and low occupancy rates of the building (Josh Byrne &
Associates, 2011b). Figure 4 presents a schematic diagram of how rainwater is distributed at The
Grove.
21
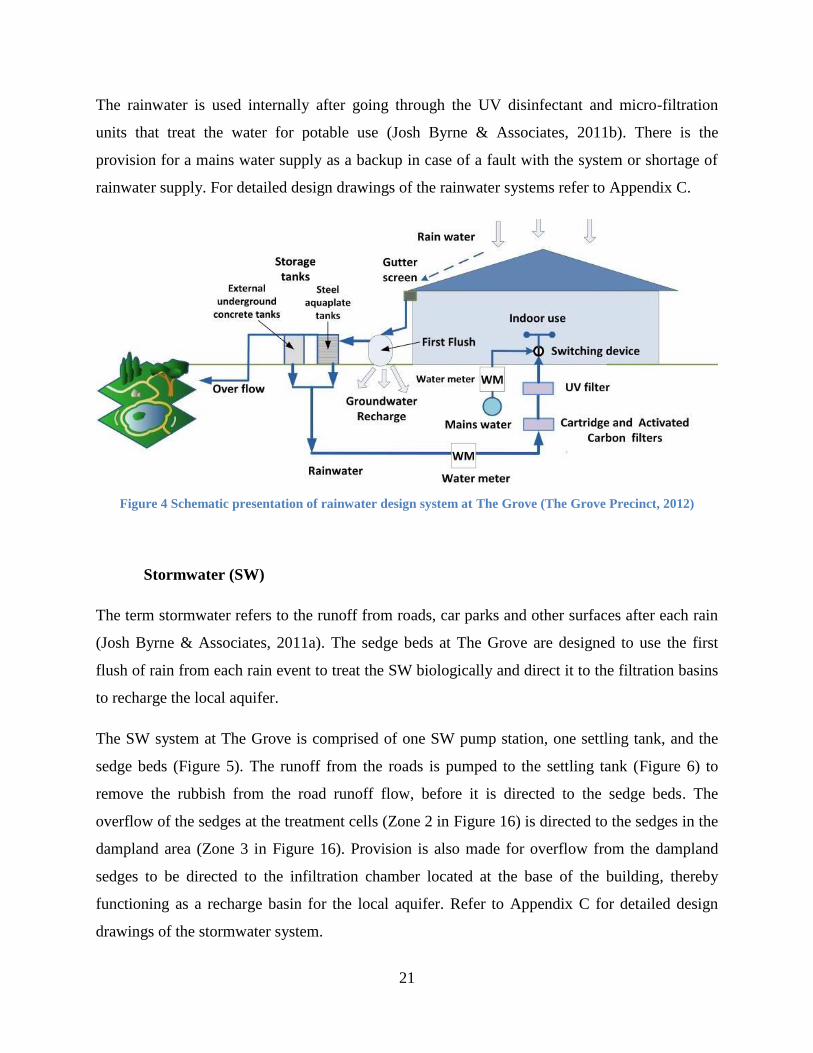
The rainwater is used internally after going through the UV disinfectant and micro-filtration
units that treat the water for potable use (Josh Byrne & Associates, 2011b). There is the
provision for a mains water supply as a backup in case of a fault with the system or shortage of
rainwater supply. For detailed design drawings of the rainwater systems refer to Appendix C.
Figure 4 Schematic presentation of rainwater design system at The Grove (The Grove Precinct, 2012)
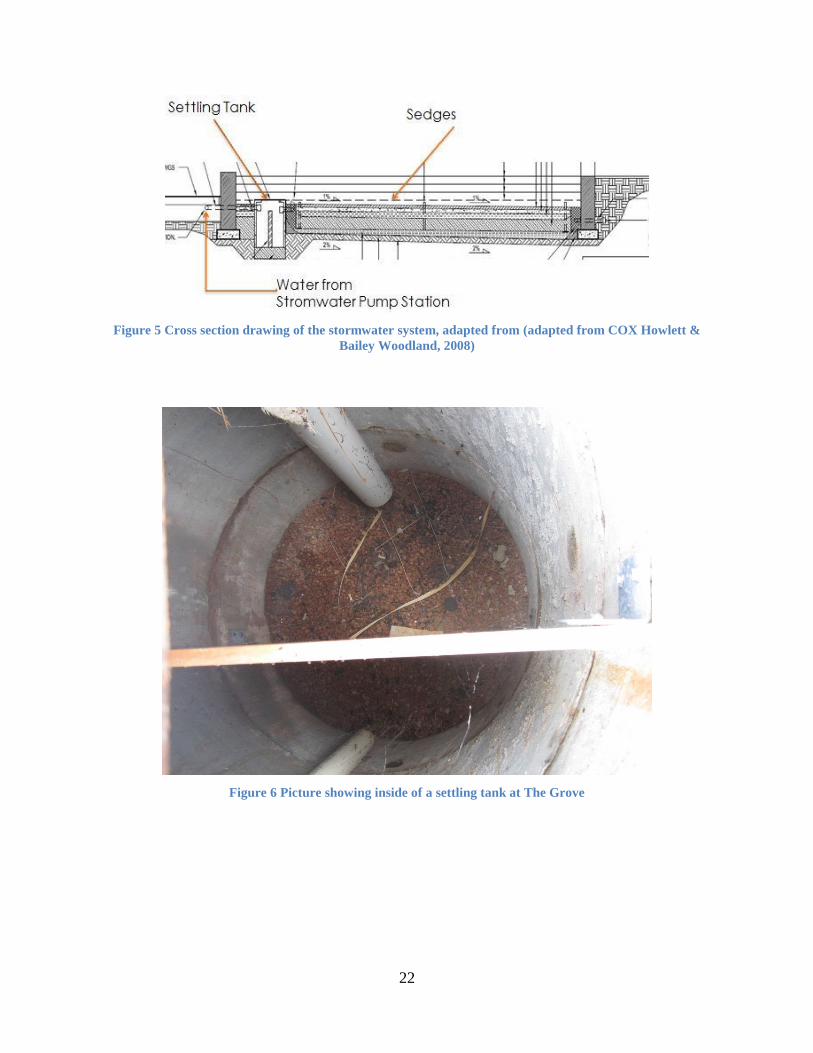
Stormwater (SW)
The term stormwater refers to the runoff from roads, car parks and other surfaces after each rain
(Josh Byrne & Associates, 2011a). The sedge beds at The Grove are designed to use the first
flush of rain from each rain event to treat the SW biologically and direct it to the filtration basins
to recharge the local aquifer.
The SW system at The Grove is comprised of one SW pump station, one settling tank, and the
sedge beds (Figure 5). The runoff from the roads is pumped to the settling tank (Figure 6) to
remove the rubbish from the road runoff flow, before it is directed to the sedge beds. The
overflow of the sedges at the treatment cells (Zone 2 in Figure 16) is directed to the sedges in the
dampland area (Zone 3 in Figure 16). Provision is also made for overflow from the dampland
sedges to be directed to the infiltration chamber located at the base of the building, thereby
functioning as a recharge basin for the local aquifer. Refer to Appendix C for detailed design
drawings of the stormwater system.
22
Figure 5 Cross section drawing of the stormwater system, adapted from (adapted from COX Howlett &
Bailey Woodland, 2008)
Figure 6 Picture showing inside of a settling tank at The Grove

23
2.2.2. Wastewater Systems
The innovative wastewater system at The Grove is designed to separate the wastewater into
greywater, brown water and yellow water streams on-site. In this case the greywater is the
wastewater from shower and hand basins; the brown water is from toilets and the kitchen; and
the yellow water is from male urinals. It should be noted that local regulations prevented
installation of urine separating toilet pans for females available in Europe. Each of these
wastewater streams is treated and reused onsite to provide part of the landscape irrigation and
supply of nutrients for the plant requirements (Josh Byrne & Associates, 2011c). A projected
saving of over 700,000L per annum of water can be achieved by this innovative wastewater
system (Dallas, et al., 2011).
Figure 7 presents the schematic diagram of how these systems are integrated to provide water for
different external uses in the Grove. For a diagrammatic representation of the wastewater
systems’ components refer to Figure 8, and for detailed design drawings of the systems refer to
Appendix C.
Figure 7 Schematic design of integrated wastewater systems at The Grove (adapted from (The Grove
Precinct, 2012)

24
Figure 8 Diagrammatic presentation of wastewater systems setup
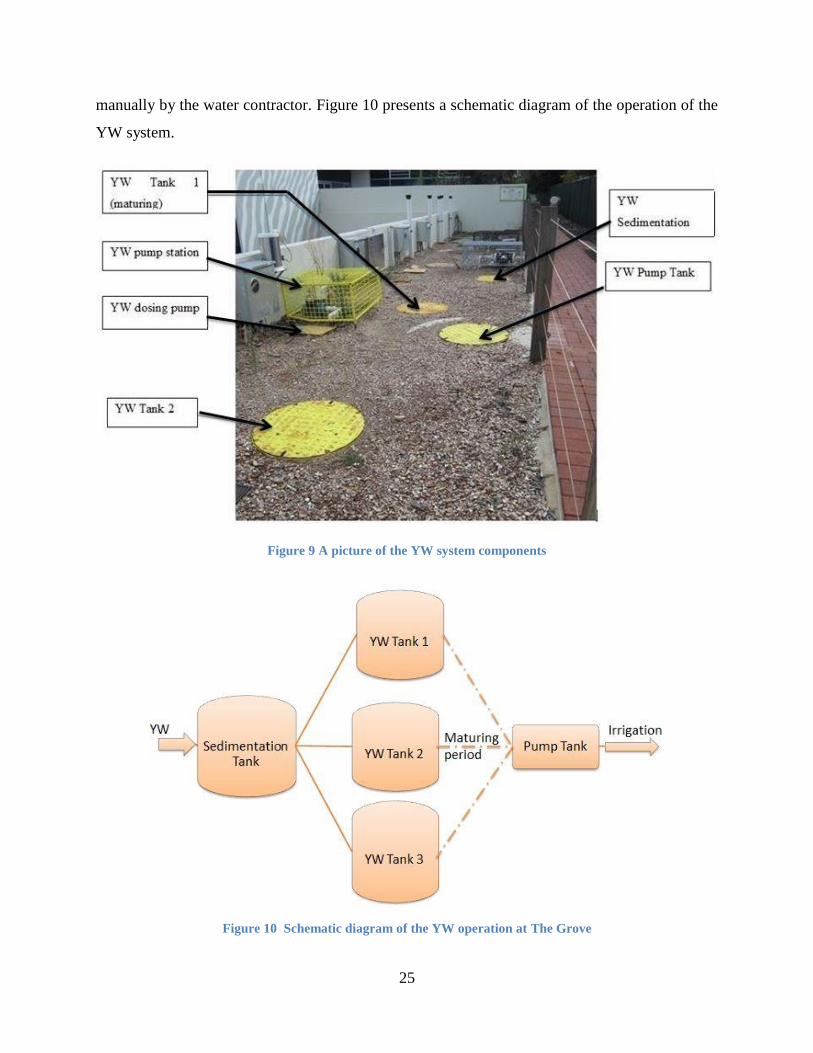
Yellow Water (YW)
The YW system includes three urine tanks, one sedimentation tank and one pump tank (Figure
9). Urine enters any of the three urine tanks after going through the sedimentation tank where the
external particles in the urine are settled and removed. When one of the tanks is full, it is closed
for maturing for six months (Dallas, et al., 2011). At the time of this investigation one of the
tanks was at the maturing stage. Once the maturing phase has passed, the pump draws the
matured YW, sending it to the dozing tank from which the dozing pump will suck the liquid out
before pumping it to the GW, BW, bore-water or irrigation line as a fertilizer. Refer to Figure 7
for details on how the YW is injected into the irrigation for fertigation. All this is carried out
25
manually by the water contractor. Figure 10 presents a schematic diagram of the operation of the
YW system.
Figure 9 A picture of the YW system components
Figure 10 Schematic diagram of the YW operation at The Grove
26
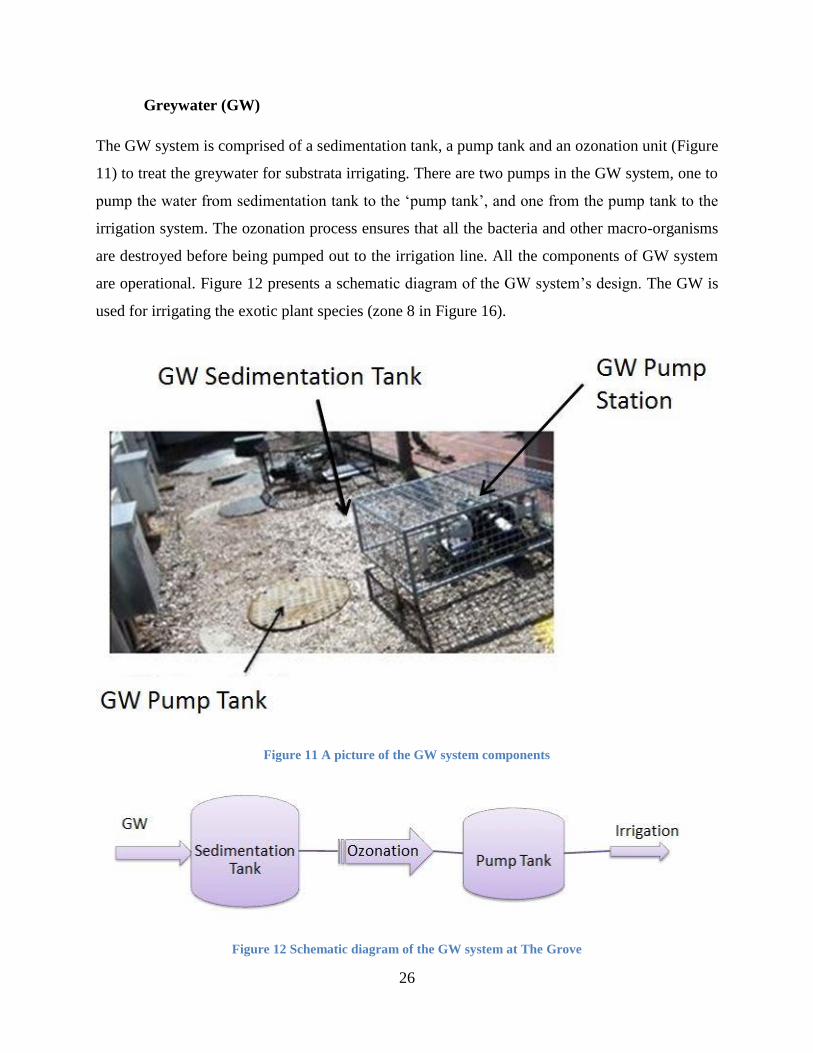
Greywater (GW)
The GW system is comprised of a sedimentation tank, a pump tank and an ozonation unit (Figure
11) to treat the greywater for substrata irrigating. There are two pumps in the GW system, one to
pump the water from sedimentation tank to the ‘pump tank’, and one from the pump tank to the
irrigation system. The ozonation process ensures that all the bacteria and other macro-organisms
are destroyed before being pumped out to the irrigation line. All the components of GW system
are operational. Figure 12 presents a schematic diagram of the GW system’s design. The GW is
used for irrigating the exotic plant species (zone 8 in Figure 16).
Figure 11 A picture of the GW system components
Figure 12 Schematic diagram of the GW system at The Grove

27
Brown Water (BW)
Biolytix (Biolytix, 2013) provides the BW treatment system at the Grove. This system is
comprised of one Biogrinder and two Biolytix filtration units (Figure 13). The BW enters the
Biogrinder tanks first and is then split evenly between the two Biolytix units where the BW is
treated by an aerobic process using macro-organisms such as earthworms, beetles, and mites
(Biolytix, 2013). Figure 14 presents a schematic representation of the BW system’s design. For
the current operation diagram of the BW system refer to Figure 17.
The Biogrinder is connected to the BMS to ensure that no more than approximately 1,000L/day
of wastewater enters each Biolytix unit to avoid overloading (The Grove Precinct, 2012). This
estimate would be sufficient to handle a typical daily wastewater flow; more than 90% of all BW
can be treated by the Biolytix system with the minimal volume being diverted to the sewer in this
design (The Grove Precinct, 2011). The treated BW is used for subsurface irrigation to the lawn
area (zone 9 in Figure 16).
Figure 13 A picture of the BW system components

28
Figure 14 Schematic diagram showing the Biolytix operation according to its design

29
2.2.3. Irrigation
The landscape irrigation is based on a drip-line setup (Figure 15) which minimises the quantity
of water employed for watering the plants. Different hydro zones are allocated to different
planted areas with respect to their location and water requirements. For the design drawing of
The Grove irrigation refer to Appendix C.
Figure 15 Drip-line setup at The Grove (Picture from Anda (2012), from the early stages of setting the
irrigation line)
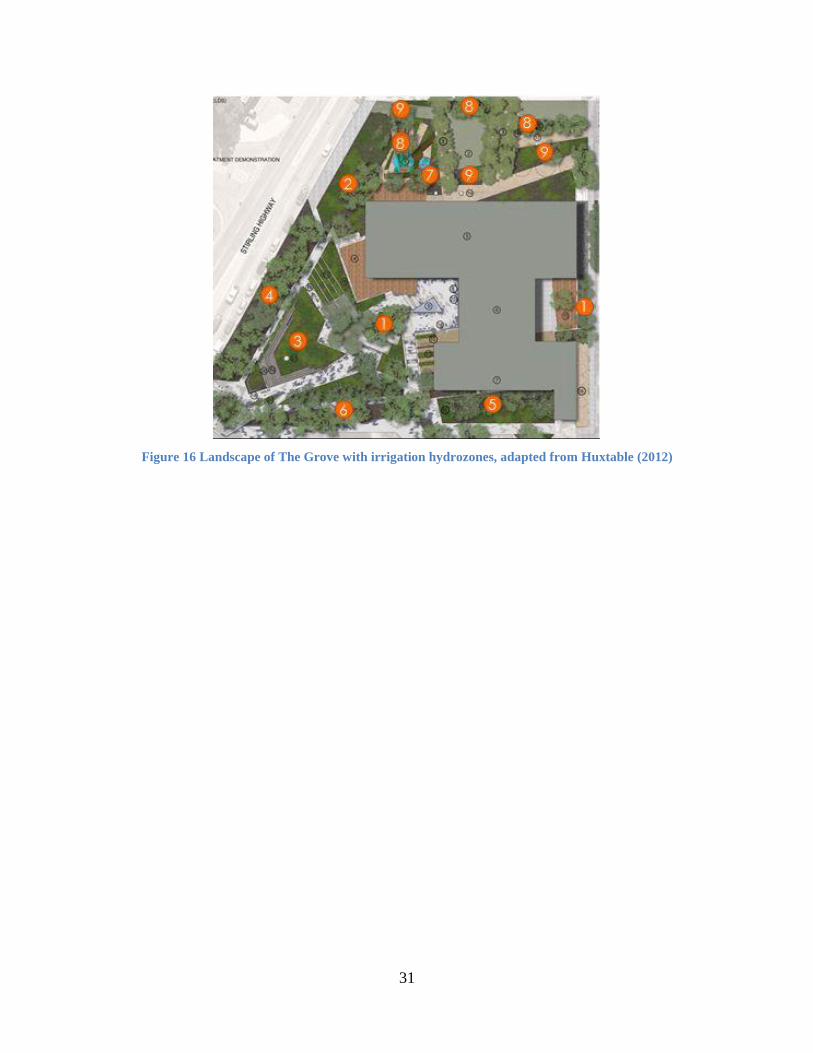
Table 1 lists the hydro zones for different sections of The Grove’s landscape, while Figure 16
displays the zoning of The Grove’s landscape. The zone numbers (1-9) in Figure 16 correspond
to those in Table 1 which reflect the irrigation design layout (Figure 45 in Appendix C)
overlaying these zone numbers.
The water sources for all the zones are mainly from wastewater or bore water. The YW
component which acts as the fertilizer provides the Phosphorous and Nitrogen to the plantation
in all zones. Figure 7 presents the schematic design of how the YW is injected into all different
irrigation sources (bore-water, BW and GW).

30
The 400 m2 of lawn area is designed to be watered by BW using subsurface irrigation (Zone 8 in
Figure 16). The drip-line for subsurface irrigation is placed about 100 mm below the lawn as per
Department of Health (DoH) regulations (The Grove Precinct, 2012). There is provision for bore
water top up during summer months.
The GW is used mainly for irrigating the exotic plants spreading over about 240 m2 of the
landscape. The substrata irrigation for GW refers to the drip-lines on the surface of the turf
covered by mulch (Zone 9 in Figure 16).
Zones 2 and 3 are designed to use SW during the rain events; however during the dry season they
are irrigated using bore water. Other zones (zones 1, 4, 5, 6 and7) are incorporated with bore
water arrangements.
This hydro zoning with drip-line irrigation ensures the optimum usage of water, saving about
700,000 L of groundwater per year (The Grove Precinct, 2011).
Table 1 Irrigation line zoning at The Grove, adapted from Anda (2012)
Zone Irrigation
1 Native Shrubs Bore + urine
2 Sedges (Treatment Cell) Bore + urine + SW
3 Sedges (Dampland) Bore + urine +SW
4 Native Shrubs Bore + urine
5 Native Shrubs Bore + urine
6 Native Shrubs Bore + urine
7 Trees Bore + urine
8 Fruit & Exotic Garden GW
9 Lawn BW
31
Figure 16 Landscape of The Grove with irrigation hydrozones, adapted from Huxtable (2012)

32
Chapter 3: The Performance of the ESD Systems
3.1. BMS Performance
The BMS at The Grove has failed to meet the requirements of its promised initial design.
Interviews with external water contractors (JBA and IBMS) concerning the initial stages of the
systems’ design suggests that the BMS should promise to provide remote monitoring access of
the performance of all the ESD systems to the external contractors for at least the first year of
operation at The Grove. At the practical level this condition has not been met, posing great
difficulty for the contractors in accessing the data and monitoring the ESD systems for the
contractors. This has resulted in no information being available on the operation of the ESD
water systems since their commencing in July 2011. For data analyses of different ESD water
systems in the historical context of their operation refer to Chapter 4.
From the backup-support perspective, Honeywell operators have poorly served The Grove in
terms of knowledge about the design, operation and limitations of the system when it is
requested (Appendix B).
The following issues were identified with the BMS and are discussed further:
3.1.1. Data access and extraction;
3.1.2. Report output;
3.1.3. Maintenance scheduling;
3.1.4. Document complications; and
3.1.5. Tag-naming system.

33
3.1.1. Data Access and Extraction
The current BMS is not user friendly for monitoring the ESD systems’ performance and data
extraction for research. The extent of data, both recorded and stored in the BMS, is massive;
however access and extraction of them is not an easy or self-explanatory process and no
document or report exists which explains the process. When contacted, the backup support from
the BMS provider (Honeywell) was not resourceful in this sense either (Appendix B). Hence the
data extraction was not possible for this study upon request from Honeywell. Only after
involvement of The Grove’s former commissioning agent (IBMS) was the data extraction
process achieved; which is captured and documented in Appendix A). The best practice for data
extraction tracks the following steps:
1) Open the BMS
2) View > Trend Summary
3) From the list choose the relevant set of data for your research (Figure 36)
4) Choose View Trend with Tabular History (Figure 37.a)
5) Select the Period and Interval as applicable to the set of data of particular interest
6) Click on Edit > Copy
7) Go to Excel and paste.
For a more detailed explanation of each step with corresponding screenshot refer to Appendix A.
A newer server to be used alongside the current BMS has been proposed by Honeywell enabling
access to data extraction called the “Energy Manager Server”. The current BMS license does not
enable upgrading to the new server, thereby requiring the complete and costly replacement with
the new server, estimated at $20,000 (Refer to Chapter 5).
3.1.2. Reporting Output
Although the provision of a reporting system is provided in the BMS to produce different output
formats, such as Excel, Word or PDF, this has not been configured in such a manner as to
produce any outputs for the Shire or anyone undertaking research. No report or manual exists

34
which explains the configuration process for external parties. When assistance was requested,
Honeywell was not able to provide the support necessary to solve the problem (Appendix B).
Contrary to the purpose of the promoting of The Grove as a smart building, the BMS does not
provide any structure for monitoring the operation of different ESD systems against their design
benchmarks. Therefore no evidence shows the performance of the building in terms of savings
and environmental impacts for commentary.
3.1.3. Maintenance Scheduling
The maintenance and operation of the ESD water systems are not supported or recorded in the
BMS. The maintenance contractor, who is the party in charge of servicing and looking after the
water systems, has no interaction with the BMS. This has limited the level of accountability from
the perspective of the data as the breakdowns with the ESD water systems cannot be explained
by referring to the BMS, and the contractor cannot monitor any change made to the water
systems (Appendix D).
This state of affairs conflicts with the remote access option intentioned by the BMS to be used by
external contractors to monitor the operation of the ESD systems; this facility was not available
to them at the time of this study. Access remotely for the water contractor could have prevented
some breakdowns with water systems, such as clogging of the BW pump resulting in flooding of
the area.
3.1.4. Document Complications
The BMS was intended to be used by unspecialised operators; however, the design is
sophisticated requiring continuous and supportive backup from Honeywell. On the practical
level, poor back-up support and lack of any documentation system in place has caused
difficulties for the people operating the BMS.
Although the operator’s manual or functional specifications documents were generated when the
BMS was installed at The Grove, none of these documents was to be found at The Grove. Nor
was Honeywell able to provide this documentation upon request, claiming this item was not in
their archive (Refer to Appendix B). However a 2011 copy of the manual (version 6.a) was

35
retrieved after further investigation from the external contractors, JBA and IBMS, and placed at
The Grove.
Another significant document required for data extraction is the Input Output (I/O) Schedule, a
comprehensive document listing the sensors at the monitoring points with their tag names in the
BMS. Accessing data from the BMS for research requires an understanding of the point names
referred to in the BMS (Appendix B), and thus the presence of the I/O Schedule is significant for
undertaking investigation using it. The first version of the I/O Schedule, dating back to 2009,
was retrieved from external contractors, JBA and IBMS. Being an outdated document, it does
not include many of the sensors’ tag names.
3.1.5. Tag-naming System
The tag-naming system, which addresses each monitored point (sensor), is not consistent and the
current I/O schedule retrieved from external contractors is not easily comprehensible by an
unspecialised operator. For example, the brown water tank level sensor is called
“BW_Tank_Lvl” in the BMS but is referred to and described as “P_L_BWAeroSys_TankLevel”
in the I/O Schedule document.
The simple conclusion is that the naming system should be consistent so as to enable the
monitored point (sensor) for research or practice to be found. Considering the numerous sensors
for the different ESD systems, finding the corresponding BMS sensor name for the I/O schedule
or vice versa is not an efficient and effective process.
3.2. ESD Water Systems’ Performance
3.2.1. Rainwater (RW) Status
Rainwater has not been accessible for internal use because of a number of issues with some
components of the system, namely, the UV disinfectant unit, the rainwater pump, and the in-
ground tank water level sensors.
36
UV Disinfectant Unit (UV)
The RW design requires UV activation before the rainwater pump is started; this process is
automated and controlled by the BMS. Although all individual components of the RW system
are operational (Appendix D), currently the BMS does not recognise the operation of the UV,
thereby hindering the start of the rainwater pump.
Further investigation revealed that this concept of the RW design had been unknown by the
water contractor until recently, that is, Feb 2013, and after replacing the UV with a new system
(Appendix D).
The initial UV, sophisticated and expensive, was replaced after a breakdown during the first year
under warranty. However when for the second time the UV became faulty, it was no longer
under warranty and, due to its high cost of replacement; it was decided to change it with a much
simpler system which is in current use. At the time of purchasing the new system it could not be
confirmed whether it had the capacity to be connected to a monitoring system (Appendix D).
Therefore the current system was not set to send signals to the BMS. This explains the current
situation where the BMS does not allow the start of the rainwater pump.
RW Tanks’ Water Level Sensors
The BMS display informs that both above-ground and below-ground tanks are full (Section “4.1.
Rainwater Systems (RW) Data Analysis”). This was proven wrong when the rainwater tanks
were inspected by the water contractor in March 2013. Although there was water in the above-
ground tanks, the below-ground tanks were reported as empty. This anomaly can be traced back
to being the result of a faulty sensor in the rainwater tank not being identified by the BMS.
On the other hand, as there has not been a monitoring system accessible for the external
contractors in place, this fault was not diagnosed in its early stages when it could have been
replaced under warranty (Appendix D).
37
3.2.2. Wastewater Systems Status
Yellow Water (YW) Status
The YW system is operating satisfactorily according to its design. All the components are
serviced regularly according to the operation and maintenance (O/M) requirements.
When one of the tanks is full, a determination made by the direct inspection of the water
contractor without any interaction with the BMS, it is closed manually and left for six months for
maturing. This date is recorded into the BMS to reckon the six months maturing period required
by the Shire. Every time the water contractor came for servicing according to the maintenance
contract, he inspected inside the tanks to determine their level without any interaction with the
BMS or recording anything into it.
At the time of writing this paper (May 2013), the tank which was closed for maturing in
September, 2012, has passed its six months maturing period with the contents being ready for
use as a fertilizer in the irrigation line. However the maintenance contract for this year has not
yet been signed by the Shire, thus hindering the commencement of YW use (Appendix D).
Greywater (GW) Status
The GW system operates satisfactorily as well. The only matter is the small amount of GW
produced which is much less than what it was anticipated in the design level. However there is a
provision for bore water top up to fill the tank every 30 sec with bore water (as quoted from the
water contractor, Appendix D), so that whenever the pump is activated, the tank is filled up with
bore water and is pumped out to the irrigation.
However the bore has been turned off since June 2012 which has resulted in decreased flow of
GW entering the irrigation line, thereby affecting the pressure in the irrigation line. The BMS
had not recognised the bore pump being switched off. This has been due to the setting in the
BMS that had put the bore pump activation in manual instead of automatic mode. It was not
known who had made that change in the BMS.
38
Thus, at the time of writing this paper, the GW was not being used in the landscaped areas due to
the decrease in its flow; therefore hand watering of the zone 8 was undertaken instead.
Brown Water (BW) Status
Biolytix was the system with low energy intensity at the time of its installation; however after
one year the system started to fail due to clogging of the pump and flooding the area (Appendix
D). The reason for the pump’s failure was due to the geotextile liner being clogged up resulting
in entrance of untreated material in the pump chamber.
Some retrofit on the system was undertaken in 2012, such as using an air blower in the
Biogrinder and Biolytix tanks to improve the aerobic conditions for the macro organism’s
environment. This improved the situation for some time; however due to continual breakdowns
with the Biolytix system, it was decided to shut down in Sep 2012. The manufacturer could not
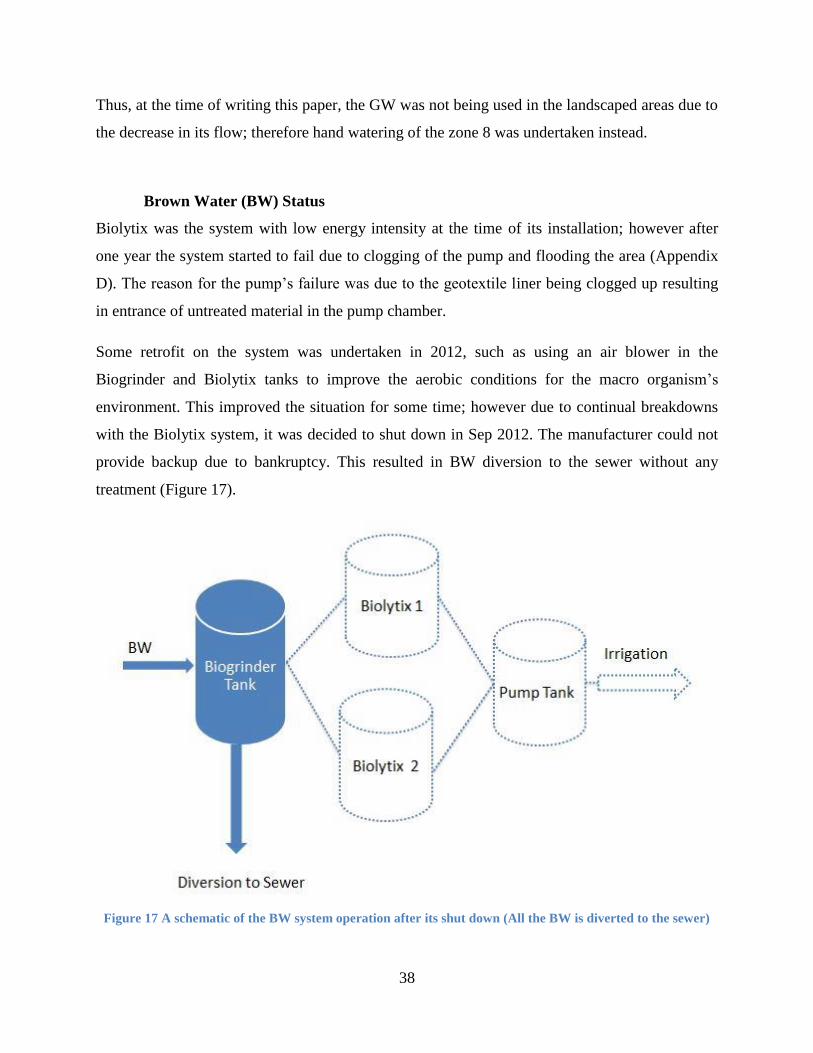
provide backup due to bankruptcy. This resulted in BW diversion to the sewer without any
treatment (Figure 17).
Figure 17 A schematic of the BW system operation after its shut down (All the BW is diverted to the sewer)

39
At the time of undertaking this research as the Biolytix system was shut down, the tanks were
dry and no evidence of macro-organism were present (Appendix D). Interviews with water
contractor on the reason behind the poor quality of the effluent, at the time of the operation of the
Biolytix system, revealed that the environment for the macro organisms (worms and bacteria)
had not been optimal. During the operation of the Biolytix system, the worm community was
dying due to the high temperatures (Appendix D).
This maintenance issue revealed that the lids of the Biolytix should have been covered in mulch
to reduce the heat and thus provide optimal environment for the macro organisms. This condition
was not known by the water contractor prior to diversion of the BW system from the irrigation
line (Appendix D).
3.2.3. Irrigation Status
Irrigation became a problem after the reinjection bore machinery damaged the turf and the
irrigation lines in 2012. They caused damage to BW and GW irrigation lines for zones 8 and 9
(Figure 16). Figure 18 and Figure 19 present the current condition of the GW and BW lines
respectively. It is apparent that the GW line setting has completely been distorted and there can
be breakage in the line as well (Figure 18). The BW line, on the other hand, has been exposed
while it is required to be 100mm below ground in accordance with the DoH guidelines (Figure
19). As a remedial action, the Shire decided to employ sprinklers using mains water instead to
irrigate zone 9 (lawn area) in September 2012, and using hand watering for irrigating zone 8
(exotic garden).
On the other hand, as the bore water was turned off for the summer irrigation, all other zones
(Zones 1-7 in Figure 16) were not receiving water during these months. This explains the poor
condition of vegetation at The Grove. This could not have been explained until recently when it
was revealed that the bore water had not been turned on and the BMS had not recognised this.
Further investigation with BMS operator involvement revealed that in the BMS the bore pump
status had been set on the manual. It is not known by whom and when this setup has been
implemented; indicating another shortcoming in operation with the BMS.
40
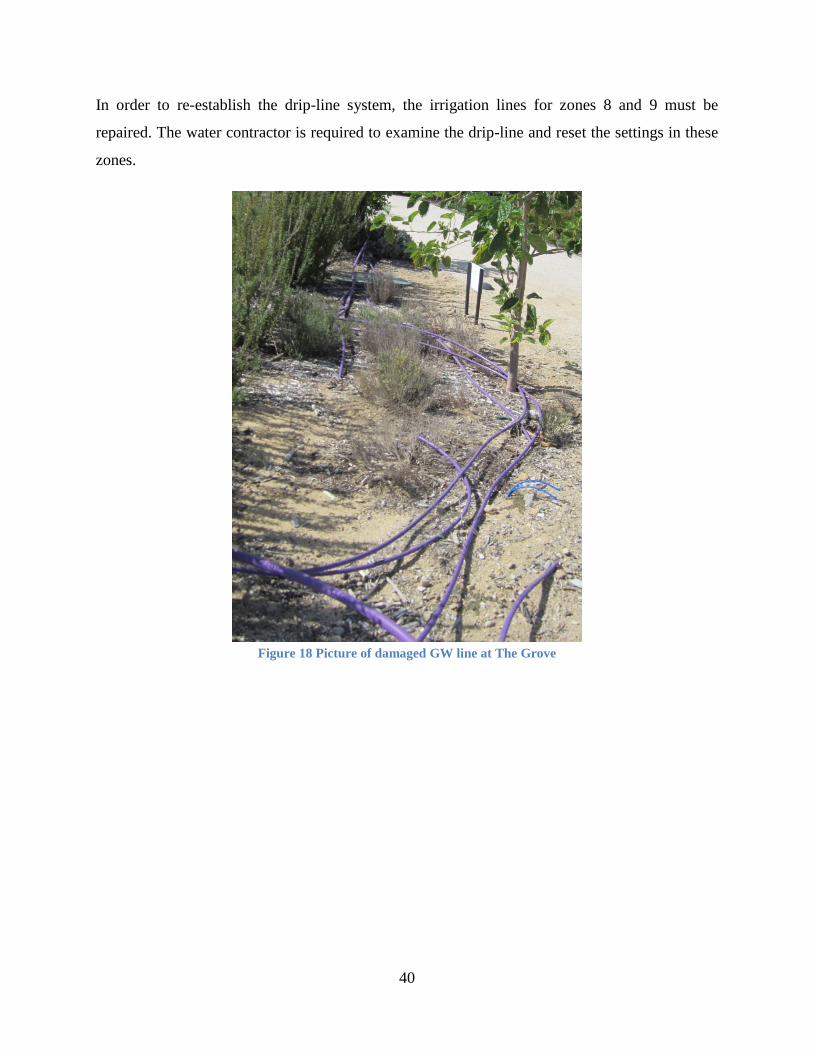
In order to re-establish the drip-line system, the irrigation lines for zones 8 and 9 must be
repaired. The water contractor is required to examine the drip-line and reset the settings in these
zones.
Figure 18 Picture of damaged GW line at The Grove

41
Figure 19 Picture of damaged irrigation turf at The Grove exposing the BW line
42
Chapter 4: Data Analysis of the ESD Water Systems
Analysis of the data from the BMS for the ESD systems (rainwater and wastewater systems)
identified the operational trends presented in this chapter. Some anomalies between the data from
the BMS and real physical evidence of the ESD systems were noticeable. Further investigation
and site-visit observations of each system having these trends were used to determine the source
of the problems. For site layout and design of each of the ESD water systems refer to Appendix
C.
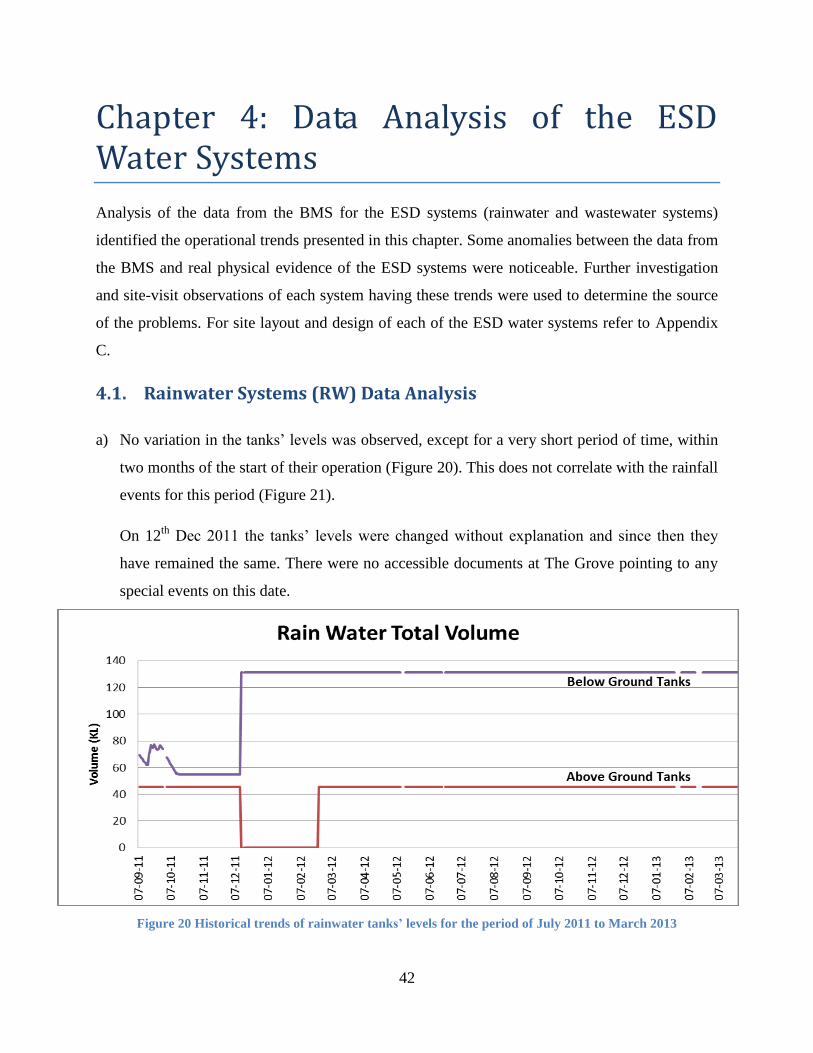
4.1. Rainwater Systems (RW) Data Analysis
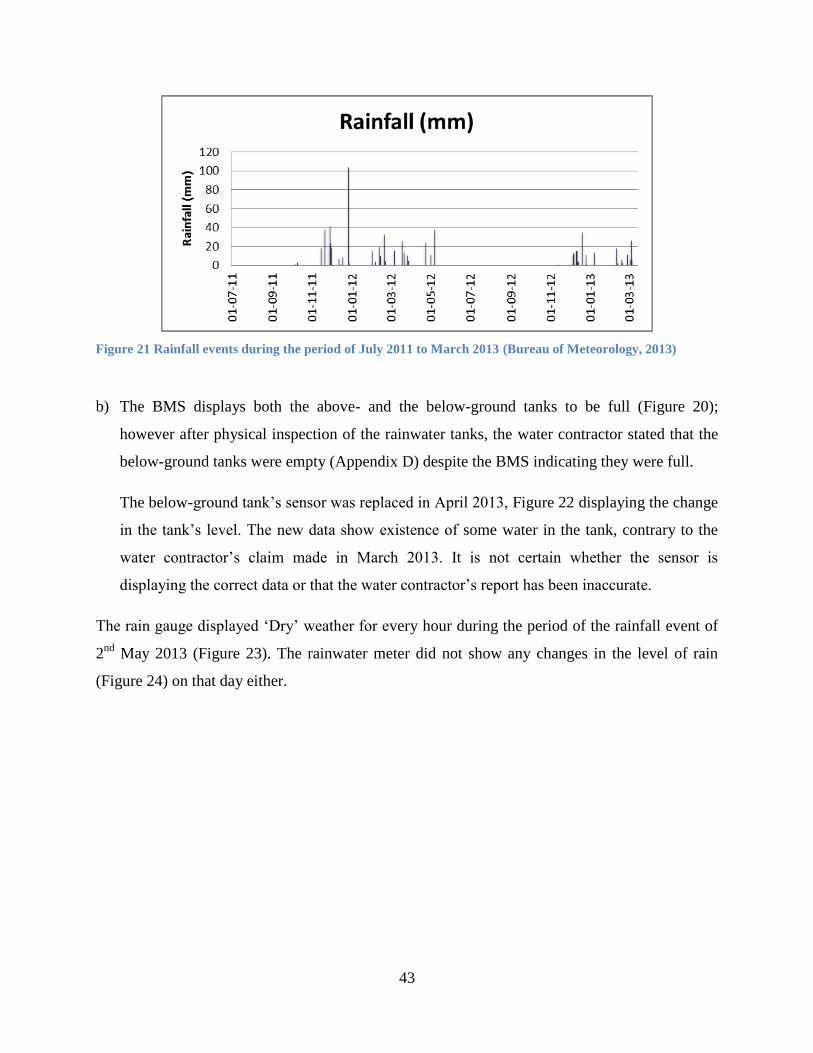
a) No variation in the tanks’ levels was observed, except for a very short period of time, within
two months of the start of their operation (Figure 20). This does not correlate with the rainfall
events for this period (Figure 21).
On 12th
Dec 2011 the tanks’ levels were changed without explanation and since then they
have remained the same. There were no accessible documents at The Grove pointing to any
special events on this date.
Figure 20 Historical trends of rainwater tanks’ levels for the period of July 2011 to March 2013
43
Figure 21 Rainfall events during the period of July 2011 to March 2013 (Bureau of Meteorology, 2013)
b) The BMS displays both the above- and the below-ground tanks to be full (Figure 20);
however after physical inspection of the rainwater tanks, the water contractor stated that the
below-ground tanks were empty (Appendix D) despite the BMS indicating they were full.
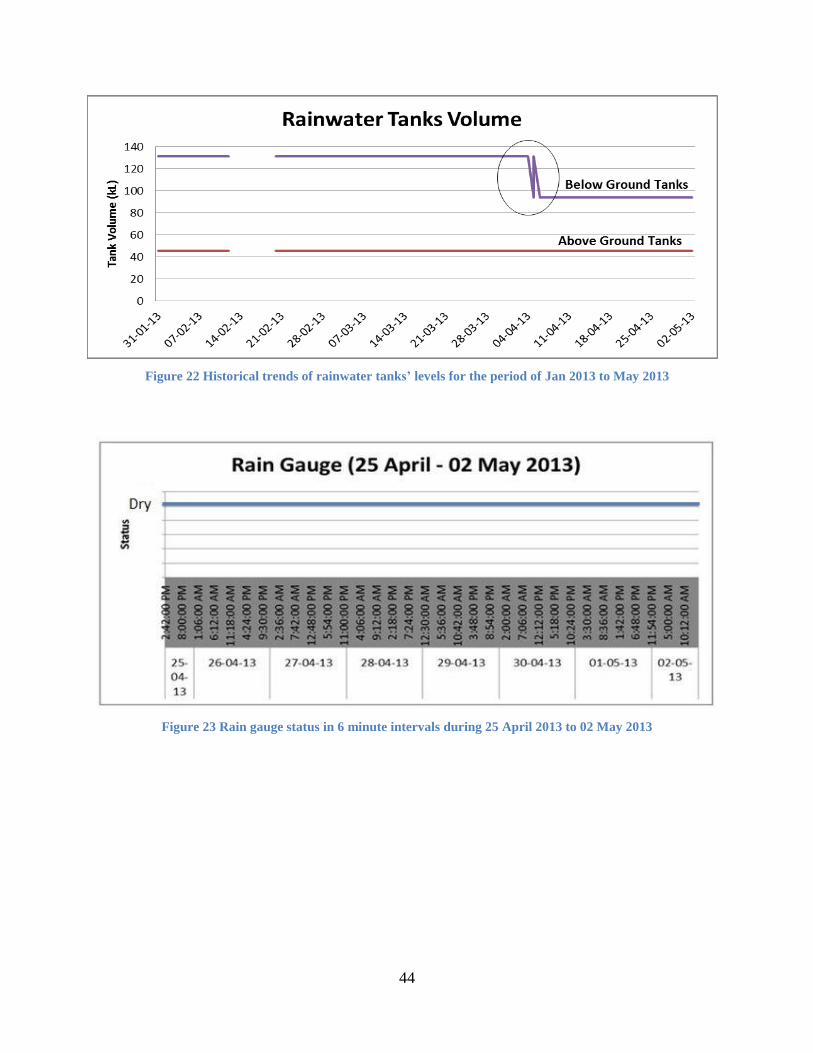
The below-ground tank’s sensor was replaced in April 2013, Figure 22 displaying the change
in the tank’s level. The new data show existence of some water in the tank, contrary to the
water contractor’s claim made in March 2013. It is not certain whether the sensor is
displaying the correct data or that the water contractor’s report has been inaccurate.
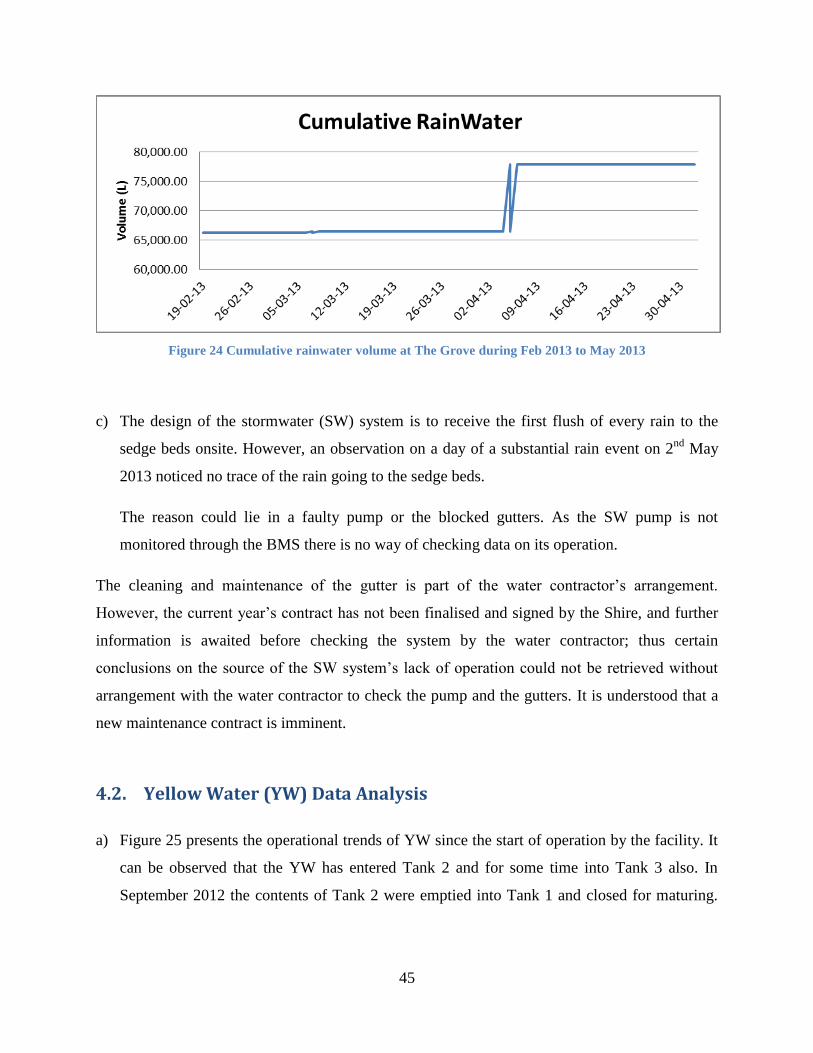
The rain gauge displayed ‘Dry’ weather for every hour during the period of the rainfall event of
2nd
May 2013 (Figure 23). The rainwater meter did not show any changes in the level of rain
(Figure 24) on that day either.
44
Figure 22 Historical trends of rainwater tanks’ levels for the period of Jan 2013 to May 2013
Figure 23 Rain gauge status in 6 minute intervals during 25 April 2013 to 02 May 2013
45
Figure 24 Cumulative rainwater volume at The Grove during Feb 2013 to May 2013
c) The design of the stormwater (SW) system is to receive the first flush of every rain to the
sedge beds onsite. However, an observation on a day of a substantial rain event on 2nd
May
2013 noticed no trace of the rain going to the sedge beds.
The reason could lie in a faulty pump or the blocked gutters. As the SW pump is not
monitored through the BMS there is no way of checking data on its operation.
The cleaning and maintenance of the gutter is part of the water contractor’s arrangement.
However, the current year’s contract has not been finalised and signed by the Shire, and further
information is awaited before checking the system by the water contractor; thus certain
conclusions on the source of the SW system’s lack of operation could not be retrieved without
arrangement with the water contractor to check the pump and the gutters. It is understood that a
new maintenance contract is imminent.
4.2. Yellow Water (YW) Data Analysis
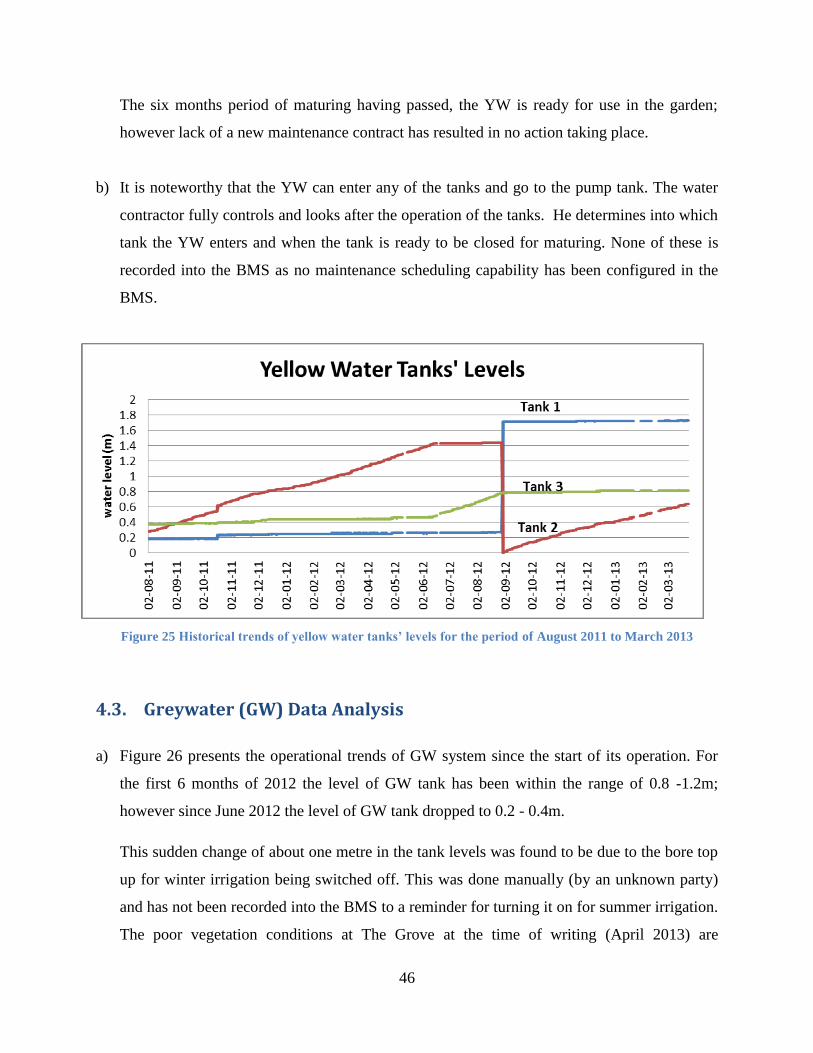
a) Figure 25 presents the operational trends of YW since the start of operation by the facility. It
can be observed that the YW has entered Tank 2 and for some time into Tank 3 also. In
September 2012 the contents of Tank 2 were emptied into Tank 1 and closed for maturing.
46
The six months period of maturing having passed, the YW is ready for use in the garden;
however lack of a new maintenance contract has resulted in no action taking place.
b) It is noteworthy that the YW can enter any of the tanks and go to the pump tank. The water
contractor fully controls and looks after the operation of the tanks. He determines into which
tank the YW enters and when the tank is ready to be closed for maturing. None of these is
recorded into the BMS as no maintenance scheduling capability has been configured in the
BMS.
Figure 25 Historical trends of yellow water tanks’ levels for the period of August 2011 to March 2013
4.3. Greywater (GW) Data Analysis
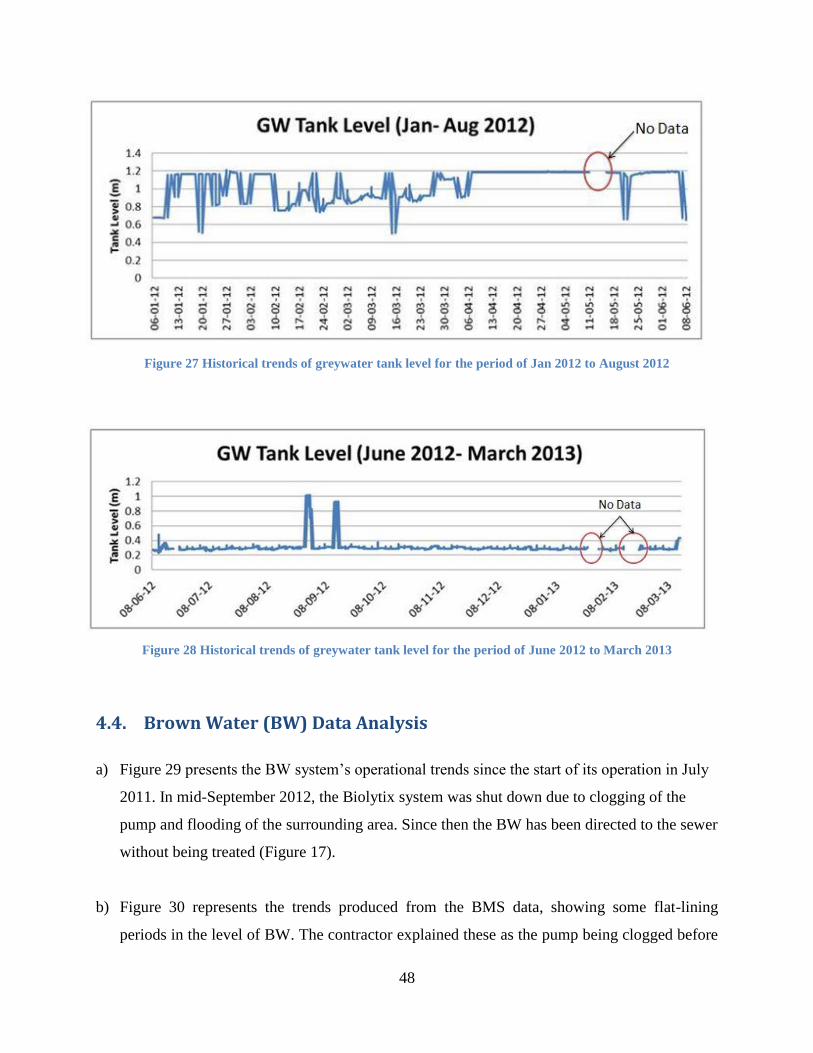
a) Figure 26 presents the operational trends of GW system since the start of its operation. For
the first 6 months of 2012 the level of GW tank has been within the range of 0.8 -1.2m;
however since June 2012 the level of GW tank dropped to 0.2 - 0.4m.
This sudden change of about one metre in the tank levels was found to be due to the bore top
up for winter irrigation being switched off. This was done manually (by an unknown party)
and has not been recorded into the BMS to a reminder for turning it on for summer irrigation.
The poor vegetation conditions at The Grove at the time of writing (April 2013) are

47
explained because the bore water has been turned off. Additionally, the bore pump switch
had been set on manual mode in the BMS (by an unknown party) which resulted in inaction
of the alarm/reminder system of the bore water pump during the summer months.
The new Shire year started in September 2012 and apparently in any necessary handover
procedure for the bore top up has not been explained.
b) A closer look at the first six months of 2012, when bore water top up was operational (Figure
27), reveals that the tank level follows cycles of increase and decrease, that is, filling up and
emptying of tanks by bore water, which confirms the operability of GW system.
Figure 28 on the other hand shows the GW tank level changes during the second 6 months of
2012. It is apparent that the GW production at The Grove has been considerably lower; thus
the bore top up has been required for the summer.
Two spikes in the trend are noticeable during this period; these may be explained as being
due to sensor’s error and will be disregarded.
There are some parts of the graphs with no data available for them (Figure 26, Figure 27 and
Figure 28 for GW, and Figure 31 for BW data analysis). The reason for lack of data for these
periods is due to turning off the whole BMS for maintenance purposes during which no data
has been logged to the system.
Figure 26 Historical trends of greywater tank level for the period of July 2011 to March 2013
48
Figure 27 Historical trends of greywater tank level for the period of Jan 2012 to August 2012
Figure 28 Historical trends of greywater tank level for the period of June 2012 to March 2013
4.4. Brown Water (BW) Data Analysis
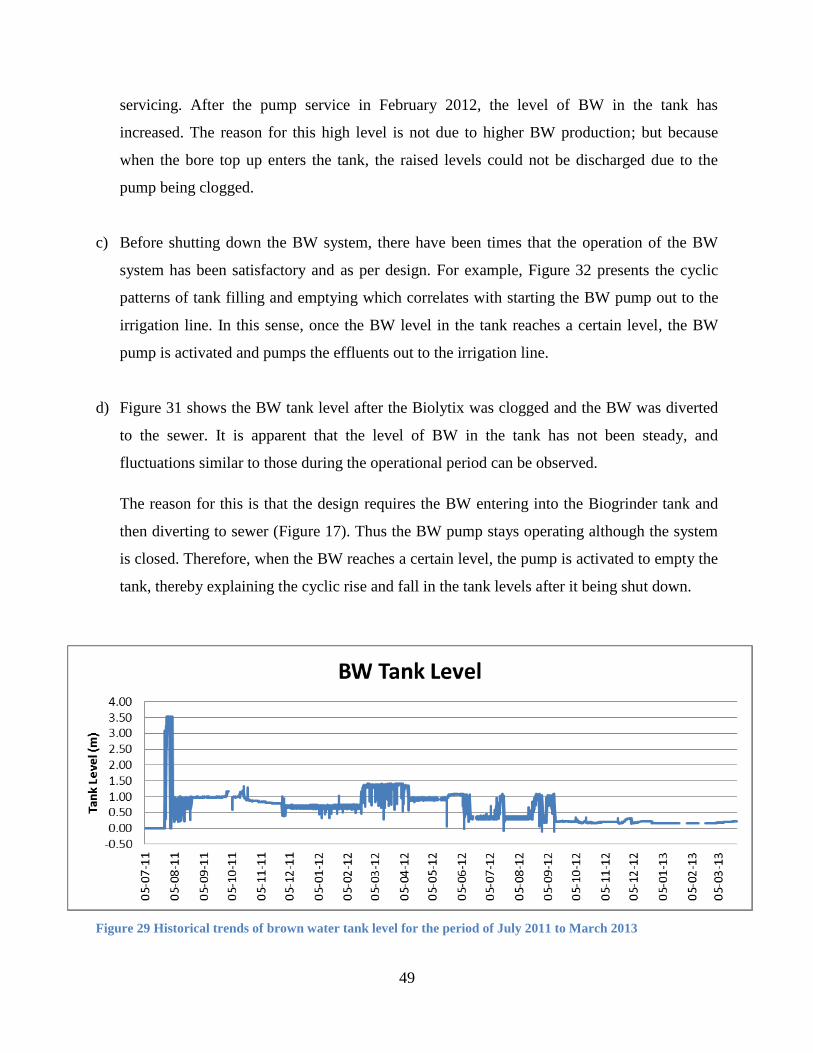
a) Figure 29 presents the BW system’s operational trends since the start of its operation in July
2011. In mid-September 2012, the Biolytix system was shut down due to clogging of the
pump and flooding of the surrounding area. Since then the BW has been directed to the sewer
without being treated (Figure 17).
b) Figure 30 represents the trends produced from the BMS data, showing some flat-lining
periods in the level of BW. The contractor explained these as the pump being clogged before
49
servicing. After the pump service in February 2012, the level of BW in the tank has
increased. The reason for this high level is not due to higher BW production; but because
when the bore top up enters the tank, the raised levels could not be discharged due to the
pump being clogged.
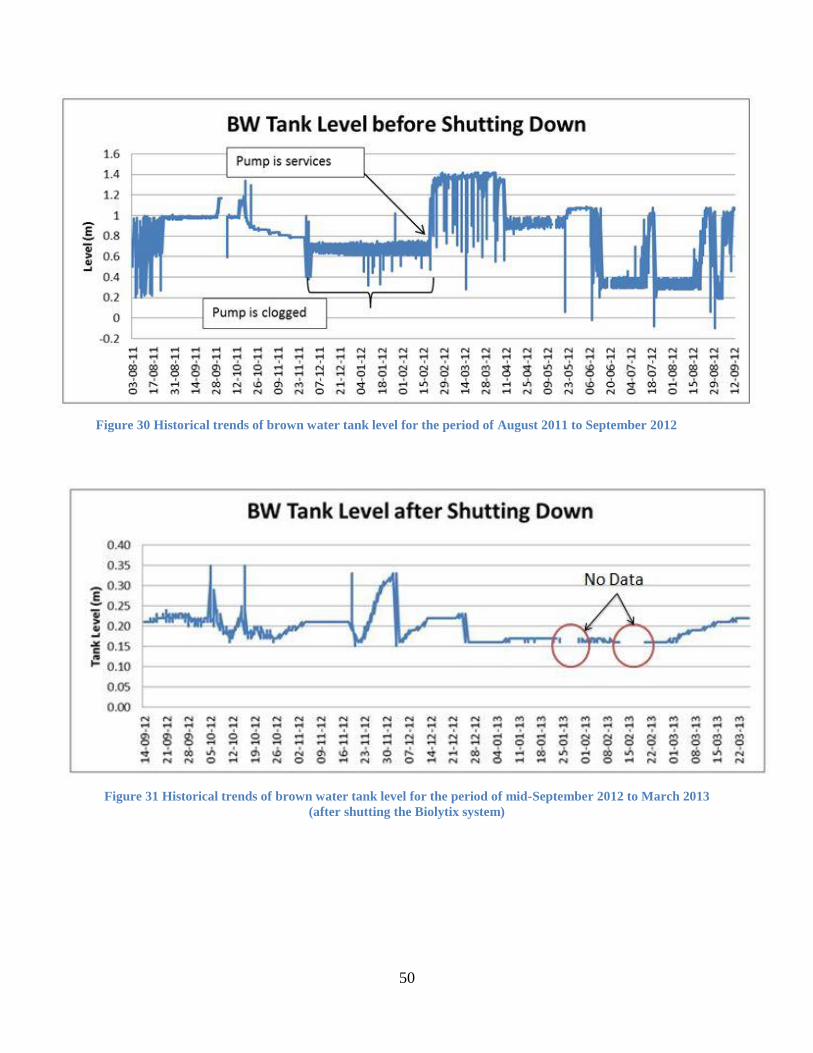
c) Before shutting down the BW system, there have been times that the operation of the BW
system has been satisfactory and as per design. For example, Figure 32 presents the cyclic
patterns of tank filling and emptying which correlates with starting the BW pump out to the
irrigation line. In this sense, once the BW level in the tank reaches a certain level, the BW
pump is activated and pumps the effluents out to the irrigation line.
d) Figure 31 shows the BW tank level after the Biolytix was clogged and the BW was diverted
to the sewer. It is apparent that the level of BW in the tank has not been steady, and
fluctuations similar to those during the operational period can be observed.
The reason for this is that the design requires the BW entering into the Biogrinder tank and
then diverting to sewer (Figure 17). Thus the BW pump stays operating although the system
is closed. Therefore, when the BW reaches a certain level, the pump is activated to empty the
tank, thereby explaining the cyclic rise and fall in the tank levels after it being shut down.
Figure 29 Historical trends of brown water tank level for the period of July 2011 to March 2013
50
Figure 30 Historical trends of brown water tank level for the period of August 2011 to September 2012
Figure 31 Historical trends of brown water tank level for the period of mid-September 2012 to March 2013
(after shutting the Biolytix system)

51
Figure 32 Brown water tank level changes in 10-11 March 2012 before shutting down the BW system

52
Chapter 5: Problems and Recommendations
5.1. Problems with the BMS
The proposal was for the BMS to provide a high level of precision and easy access in controlling
and monitoring the ESD systems to make The Grove the showcase of a ‘smart’ green building.
At the practical level however, the BMS has not met these conditions completely. Table 2 lists
the identified shortcomings of the BMS at The Grove as provided by Honeywell.
Table 2 List of problems with the BMS
Problems with the BMS
The reporting system does not provide any outputs
Monitored points’ tag-names are not consistent posing great difficulty in accessing data
Poor documentation of manual and I/O Schedule
Poor backup support and knowledge of Honeywell
The BMS did not recognise and identify some of the sensors’ faults (e.g. rainwater tank or bore top up switch)
Many points that are present at the BMS do not log any data (e.g. rain gauge)
The Stormwater pump is not integrated into the BMS
No maintenance scheduling is set up in the BMS
The alarm system in the BMS can be turned off from the station without any subsequent actions
No access for the external ESD water systems’ contractors to monitor the systems remotely
The energy management is not possible through the current BMS
Considering the above list of shortcomings with the BMS, three solutions can rectify the
specifications of a smart building.
a) Install the “Energy Manager Server” (EMS) with the same provider, namely Honeywell. As
the current BMS server cannot be upgraded to the new EMS one, complete installation of the
EMS is required. The price of this new server is estimated to be $20,000 (Appendix B).

53
This new server has the capabilities of reporting on the performance of the energy and water
systems against industry/design benchmarks as well as data extraction and analysis tools (as
quoted from the Honey agent).
b) Use add-ons to the current system with the same provider. For example adding the SW
system to be controlled by the BMS will cost around $4000-5000 as quoted by the
Honeywell agent. Other algorithm inclusion will cost separate costs that needs estimation by
Honeywell.
c) Install a new automation and control system with another provider. In this sense, further
research on available providers of such systems is required. The cost analysis of a new
system to compare it with the present system should also be undertaken.
5.2. Problems with the ESD Water Systems
- Table 5 present a comprehensive list of problems with different ESD water systems and the
recommendations for their rectification. Some of these problems are simply component
breakdown, such as, a faulty tank level sensor, which would require sensor replacement. Some
other issues are more complicated, for example, BW system breakdown. In this case, further
research and analysis is required to provide the systems’ long term perspective as well as a cost
analysis.
5.2.1. Rainwater (RW) Systems
Table 3 lists the identified problems with their necessary rectification incorporating the RW and
stormwater (SW) systems.
54
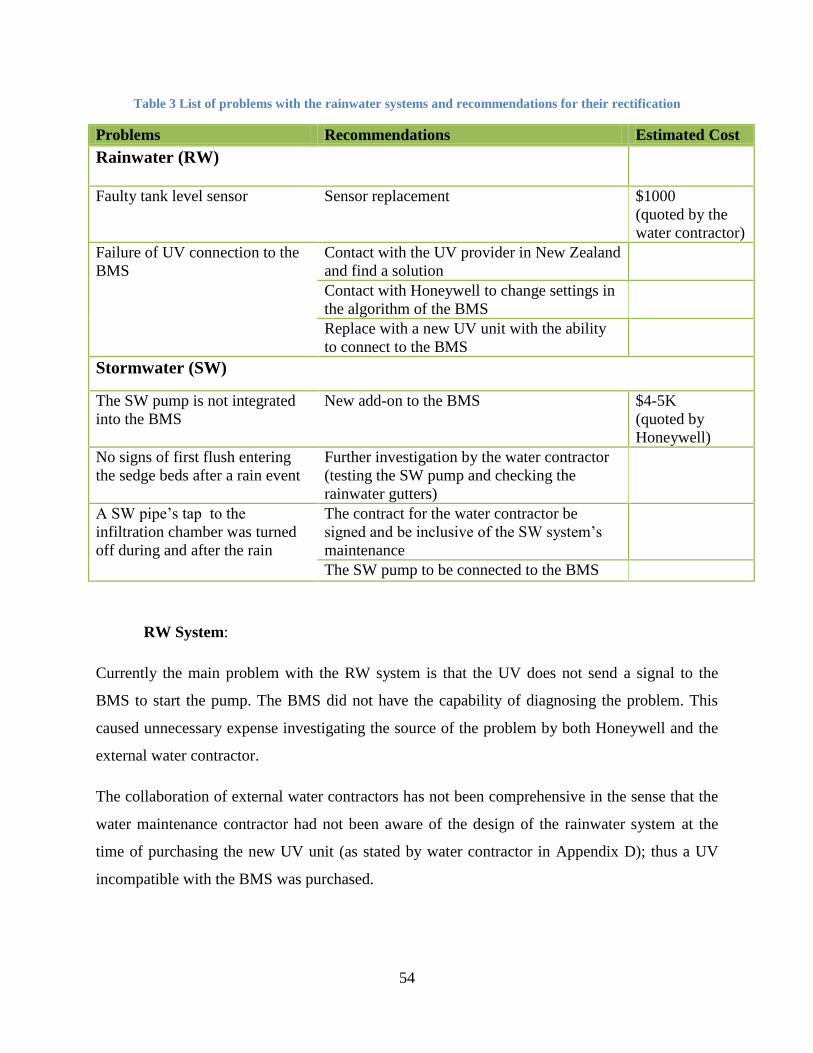
Table 3 List of problems with the rainwater systems and recommendations for their rectification
Problems Recommendations Estimated Cost
Rainwater (RW)
1) Faulty tank level sensor Sensor replacement $1000
(quoted by the
water contractor)
2) Failure of UV connection to the
BMS
a) Contact with the UV provider in New Zealand
and find a solution
b)
c) Contact with Honeywell to change settings in
the algorithm of the BMS
d)
e) Replace with a new UV unit with the ability
to connect to the BMS
f)
Stormwater (SW)
1) The SW pump is not integrated
into the BMS
New add-on to the BMS $4-5K
(quoted by
Honeywell)
2) No signs of first flush entering
the sedge beds after a rain event
Further investigation by the water contractor
(testing the SW pump and checking the
rainwater gutters)
3) A SW pipe’s tap to the
infiltration chamber was turned
off during and after the rain
a) The contract for the water contractor be
signed and be inclusive of the SW system’s
maintenance
b)
c) The SW pump to be connected to the BMS d)
RW System:
Currently the main problem with the RW system is that the UV does not send a signal to the
BMS to start the pump. The BMS did not have the capability of diagnosing the problem. This
caused unnecessary expense investigating the source of the problem by both Honeywell and the
external water contractor.
The collaboration of external water contractors has not been comprehensive in the sense that the
water maintenance contractor had not been aware of the design of the rainwater system at the
time of purchasing the new UV unit (as stated by water contractor in Appendix D); thus a UV
incompatible with the BMS was purchased.

55
In order to rectify this problem, it is recommended that the UV provider first be contacted to
explore the UV design and its competencies when connected to the BMS. The ultimate solution
could be to purchase a new UV with the capability of being connected to the BMS.
SW System:
The main problem with the SW system is that it cannot be monitored through the BMS and thus
no alarm system is in place in case of a breakdown with system’s components. As part of the
maintenance contract, the water contractor checks and services the system; however, not having
a contract at this time of the research (15th
May 2013), he is not responsible for its operation.
The rectification of the SW system requires integrating the SW pump with the BMS to monitor
its operation. This will require the involvement of Honeywell, if the current BMS is retained, or
of a new BMS provider. More interaction between the water contractor and the SW system to
maintain its operation should be undertaken so aligning with connecting to the BMS.
5.2.2. Wastewater Systems
Table 4 lists the identified problems and recommended solutions with the YW, GW and BW
systems.
Table 4 List of problems with the wastewater systems and recommendations for their rectification
Problems Recommendations
Yellow Water (YW) System
1) No interaction between the water
contractor and the BMS when
monitoring the YW tanks’ levels
a) Train the water contractor with the BMS operation
b) Establish a maintenance section in the BMS
2) Water is not tested before sending to
the irrigation line
a) Undertake water testing in the maintenance
process
b) Report on the quality of matured YW to DoH so
enabling YW usage for other public buildings
Greywater (GW) System
1) Bore water top up was switched off
last winter and not turned on again
a) Should be a requirement to record everything into
the BMS

56
b) Comprehensive handover to the new Shire officer
2) Greywater production is low Bore top up to be used according to the design
Brown Water (BW) System
1) The Biolytix system is shut down and
BW is diverted to the sewer
a) Retrofit to a new system, e.g. aerated activated
sludge return
b) Rectify the current system with regular
maintenance
c) Remove the Biolytix and replace it with a new
system
2) Poor quality of effluent Maintain the optimal environment for bacterial life
YW System:
The YW system is operational; however use of the matured YW has not been undertaken even
though the six months maturing period has passed. The Shire has not signed the new contract for
maintenance of the water systems which is a major hindrance. It is understood that a new
maintenance contract is imminent.
Although it is not necessary as part of the maintenance process, it is recommended that water
quality testing such as (pH and Nitrate testing) be undertaken on the YW before using it onsite.
This will provide documentation on the effects of the process and the quality of the matured YW
for further research.
GW System:
The GW system is also operational; however the low volume of GW production has resulted in
the necessity of a bore-water top up before its use in irrigation. The bore water top up was turned
off in June 2013 during winter; however it was not turned back on for summer irrigation. On the
other hand, the resultant poor vegetation condition brought distrust from the Shire as having the
ability to design a GW system and its maintenance, without awareness of the bore-water
switched off being in conflict with the design intent.
The bore pump status is incorporated into the BMS and the data on its status is logged, but not
the bore switch status. It is recommended to incorporate the status of the bore into the BMS. This

57
requires involvement of Honeywell to setup a logging and alarm system for the bore status with
seasonal considerations included, to preclude the bore alarm being switched off during the
summer or on during winter months.
BW system:
The Biolytix failure and its discontinuance from the irrigation line in Sep 2012 brought such
disappointment for the operators and Shire on the BW system design and its operation that it was
decided to exclude the system from the irrigation line completely. However three main
rectification strategies were identified that will enable the re-establishment of the BW system at
The Grove. They are discussed below. However, further research and risk analysis of these
strategies are required, but are not within the scope of this study.
a) The first option for retaining the Biolytix system is to improve the servicing methods. The
current service requirement of the system is for such action once a year (Biolytix, 2013), but
according to the DoH requirements quarterly service is required (DoH, 2012). According to
the water contractor, utilising more frequent servicing of the pump and filters as regularly as
once a month, and undertaking water testing to monitor effluent quality (such as temperature
and turbidity) and macro organisms environment (such as dissolved oxygen and wetness),
will prevent clogging of the pump, thereby retaining the current Biolytix system.
The cost of this option is estimated to be $2000 for resetting the system with $1000 per year
maintenance costs as quoted from the water contractor.
b) Retrofitting the BW system with new available systems is the second option. As the Biolytix
system has failed in the past, causing many breakdowns in its operation, this option is
preferred.
The cost of retrofitting the BW system is estimated to approximate $6000 for a rebuild (e.g.
conversion to an aerated activated sludge return system) and re-setup, with $500 per year for
maintenance as quoted by the water contractor.
Removing the Biolytix system and tanks completely and establishing a new BW treatment
system is the third option. Many different providers are approved by the DoH in WA (DoH,

58
2012). The Fuji Clean (Fuji Clean, 2011) is the provider suggested by the water contractor as
a replacement for the current Biolytix system (Appendix D).
The approximate cost of Fuji Clean is approximately $3500 per tank which is $10,500 for the
three tanks, with additional costs for removing the Biolytix tanks and installing the new
system.
Further investigation on the best option in terms of cost analysis and risk assessment should
be undertaken.
5.2.3. Irrigation
Table 5 lists the problems and recommendations for their rectification of the irrigation system at
The Grove.
Table 5 List of problems with the Irrigation and recommendations for their rectification
Problems with Irrigation Recommendations
1) The irrigation line and turf is
distorted and exposed
New drip-line to be established
2) The BW line (lawn area) is exposed
whereas it is supposed to be 100mm
below ground (according to DoH
requirements) (Figure 19).
3) The GW line (exotic plants area) is
damaged and distorted from its
design (Figure 18).
4) Bore water is turned off, and the
bore water pump setting in the
BMS was set to manual instead of
automatic.
(Thus alarm was not activated when
top-up to GW was required.)
a) The bore switch to be put on ‘automatic’ mode in
the BMS.
b) An alarm system to be configured for the bore pump
switch status
The problems with the irrigation system are the damaged line and turf problems of the GW and
BW hydro-zones at zones 8 and 9 (Figure 16). The GW line is completely distorted and dis-
located (Figure 18). The BW line at the lawn area on the other hand is exposed and there is the
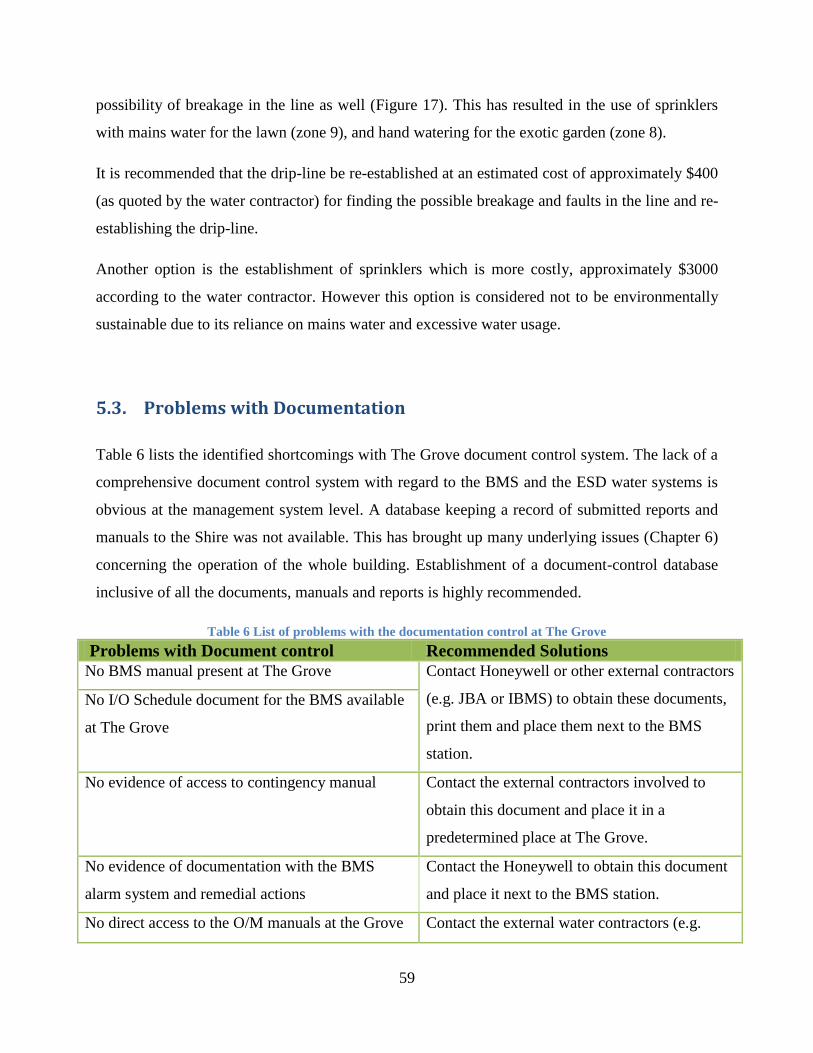
59
possibility of breakage in the line as well (Figure 17). This has resulted in the use of sprinklers
with mains water for the lawn (zone 9), and hand watering for the exotic garden (zone 8).
It is recommended that the drip-line be re-established at an estimated cost of approximately $400
(as quoted by the water contractor) for finding the possible breakage and faults in the line and re-
establishing the drip-line.
Another option is the establishment of sprinklers which is more costly, approximately $3000
according to the water contractor. However this option is considered not to be environmentally
sustainable due to its reliance on mains water and excessive water usage.
5.3. Problems with Documentation
Table 6 lists the identified shortcomings with The Grove document control system. The lack of a
comprehensive document control system with regard to the BMS and the ESD water systems is
obvious at the management system level. A database keeping a record of submitted reports and
manuals to the Shire was not available. This has brought up many underlying issues (Chapter 6)
concerning the operation of the whole building. Establishment of a document-control database
inclusive of all the documents, manuals and reports is highly recommended.
Table 6 List of problems with the documentation control at The Grove
Problems with Document control Recommended Solutions No BMS manual present at The Grove Contact Honeywell or other external contractors
(e.g. JBA or IBMS) to obtain these documents,
print them and place them next to the BMS
station.
No I/O Schedule document for the BMS available
at The Grove
No evidence of access to contingency manual Contact the external contractors involved to
obtain this document and place it in a
predetermined place at The Grove.
No evidence of documentation with the BMS
alarm system and remedial actions
Contact the Honeywell to obtain this document
and place it next to the BMS station.
No direct access to the O/M manuals at the Grove Contact the external water contractors (e.g.

60
JBA) for access to this document and place it in
a predetermined place at The Grove.
Lack of documentation explaining the roles and
interactions between the water contractor,
management and the BMS
This document needs to be provided by external
water contractors involved in design of the ESD
water systems and placed in a predetermined
place at The Grove.
No database to keep track of the documents,
reports and manuals submitted to the Shire
This needs to be done by defining a new role to
start archiving all the documentations and make
a database for them.
61
Chapter 6: Conclusion
6.1. Project Conclusion
At the design level, The Grove has utilised best practice ESD features for a ‘green’ building. The
water, energy, HVAC and alarm systems are selected ESD systems to showcase the sustainable
design in a public building. The BMS design was meant to integrate all these systems at one
control station so fully automating the operation of these ESD systems. Savings on energy, water
and greenhouse gas emissions were expected to be achieved through the design and operation of
these systems.
At the operational level, however, some breakdowns, mainly with ESD water systems, resulted
in the anticipated performance and savings not being achieved. The breakdowns with the
rainwater and wastewater systems resulted in the employment of mains water internally and
externally, thereby hindering achievement of the anticipated savings. Irrigation has been another
area of concern due to damaged lines and turfed areas which required a re-setup of the drip-line
for irrigation. These breakdowns have caused dissatisfaction for the operators and managers of
these systems.
The high sophistication level of the BMS and absence of an accessible operational manual at The
Grove has resulted in dissatisfaction for its operators. On the other hand, the BMS does not have
a capable reporting system enabling the performance of the ESD water systems, in accordance
with its environmental benchmarks, to be determined.
In order to have such a sophisticated system, interaction between Shire personnel, maintenance
staff and the BMS should be established. This is because the ESD systems showcase the best
design, but in order to have them operated according to their design, regular maintenance is
essential. Presence of support from the Shire is critical because this organisation influences the
budget for the continual operation of the systems. On the other hand, presence of a methodical
training program and handover procedure for the Shire and operators of the BMS and the ESD
systems is critical to achieve appreciation and support for the existence of these systems at The
Grove.

62
If this relationship is established, the breakdowns and faults can be regulated and managed to
enable the optimal performance of the building. This will provide a chance for the community to
appreciate the sustainable design systems and provide confidence for more widespread adoption.

63
6.2. Future Research Opportunities
The following areas of research were identified for further study:
a) Life cycle analysis of the ESD water and energy systems
The significance of life cycle analysis is in documenting the environmental impacts associated
with all stages of the ESD systems’ life cycles as a green library compared to a conventional
library. This will produce confidence for relying more on environmentally sustainable design
systems. Also as the water system has shown faults and breakdowns to this point, undertaking a
life cycle analysis for water systems can reveal significance of design and maintenance in the
performance of these systems, and possible solutions may be reached.
b) Benchmarking the performance of the ESD water systems
To this date, there has not been any benchmarking on the performance of the ESD systems to
determine their current performance against industry and design benchmarks. Performing
benchmarking may enhance the pathway for attaining Green Star-Performance (GBCA, 2013)
and NABERS rating (NABERS, 2013).
c) Ongoing performance monitoring of the water systems
This will be the continual of the current study with more focus in the remedial action. Now that
the areas of faultiness in the ESD water systems are identified, through ongoing performance
monitoring of them against their design benchmarks, faults with these systems may be traced.
d) Retrofitting or fully removing Biolytix, replacing it with different system
Detailed study on possible options for the BW system with cost benefit analysis may attract the
Shire’s trust to re-establish the BW system.
e) YW application to gardens, its usage and effectiveness
As this is the first time that the YW is used on the garden, study on its quality and effectiveness
may be highly beneficial especially for increasing awareness on its usage for other buildings.

64
Chapter 7: Reflection
7.1. “Vicious Circle” at The Grove
Through the course of this study, four components were identified as the underlying causes of
issues and problems at The Grove, namely the BMS, ESD systems, maintenance and
management (Figure 33). The relationship of these interrelated factors has contributed to the
current issues and complications noted there. Table 7 is a summary of the current status of these
four factors in relationship to each other at The Grove.
Figure 33 Interrelated factors contributing to the complications and issues at The Grove

65
Table 7 Summary of relationships between the four interrelated factors contributing to the situation at The
Grove
BMS ESD System Maintenance Management
BMS Outdated version with
many glitches
Not all systems fully
integrated into the
BMS
Does not provide
maintenance
scheduling
Lack of appropriate
training to operate
the BMS
ESD System Not all systems fully
integrated and
controlled by the
BMS
Best sustainably
designed systems at
the time
Not adequate
support for the
maintenance of the
systems
No appropriate
clarification about
support capacity
Maintenance No interaction
between the
maintenance
contractor and the
BMS
Sophisticated design
results in only a few
contractors being
able to maintain the
systems
Ongoing
maintenance
required for optimal
performance of the
systems
Lack of support from
Shire for budget
allocation needed for
on-going
maintenance
Management Not fully able to
operate the BMS due
to sophisticated design
and lack of training
Not trained on the
ESD systems’
purpose and not
supportive of their
operation
Not supportive on
budget allocation
necessary for the
systems’
maintenance
Handover to the new
Shire without
appropriate
acknowledgment of
the ESD systems at
The Grove
BMS
a) The BMS was designed to be in charge of controlling and monitoring the ESD systems, and
to be accessible for Shire personnel and the operators of the BMS who were not specialised
in its operation. The design of the BMS at the user level is very sophisticated, but there are
not methodical training and handover procedures for the Shire and the operators of the BMS.
Moreover, absence of an operation and maintenance manual has caused disappointment and
frustration for the Shire management.
b) The BMS has not been configured to produce reports on the performance of the ESD system.
Therefore there is no evidence on performance of the building ESD systems which can be
compared to the environmental benchmarks of their initial designs. Breakdowns with the
ESD water systems and inability to monitor their performance contributed to a lack of trust in
these systems for the Shire, and a dearth of support for maintaining and sustaining their
66
operation. This may affect the ESD systems’ optimum operation and cause more
breakdowns.
c) The ESD water systems are not fully integrated into the BMS, for example, the stormwater
pump’s operation has not been incorporated into the BMS. Also the level of tanks and their
operational status can be monitored but not fully controlled through the BMS.
Additionally, maintenance is not scheduled or recorded in the BMS resulting in the water
contractor, who is in charge of maintaining the water systems, not having any interaction
with the BMS or remote monitoring of the status of the ESD water systems.
Some breakdowns with the systems, for instance, rise in BW tank level resulting in flooding
of the area, could have been prevented if remote access was available to the water contractor.
These many shortcomings of the BMS cause dissatisfaction for the Shire and operators of the
ESD systems, resulting their lack of support for the continual operation and maintenance of
the facility.
ESD Systems
d) Although the best, sustainably-designed systems were selected, the level of interaction
between different contractors was not settled so that they could become familiar with each
system’s operational specifications. For example, the water contractor was not aware of the
rainwater design requiring BMS recognition of UV activation before it starts the pump for
internal usage.
e) At the design stage, the long-term support capacity of the Shire management as the party
whose long term support is essential for optimal performance of the systems was not
clarified. This is significant as the continued sustaining of the ESD systems can be affected
by lack of budget for their ongoing maintenance.
f) The sophisticated and innovative design of the ESD systems means that only a few aptly
qualified contractors are capable of maintaining and servicing the systems. For example, the
innovative design of the YW system requires specialised contractors for its maintenance.
Their unavailability has exacerbated the management’s distrust in the optimum design of the
systems.
67
Maintenance
g) The total cost of the construction at The Grove was about $18 million, including
approximately $3.6 million for the ESD systems’ contracts and a $1.5 million grant from the
Australian Government’s Green Precinct Program (The Grove Precinct, 2011).
Conventionally, about 1.3% of total cost of construction is assigned for annual maintenance,
however for such sophisticated green building this amount is up to 2.7% (as quoted from the
Shire officer). The resulting budget for annual maintenance of The Grove is equivalent to
$36-72K for ESD systems only to ensure the optimal performance of the systems. Lack of
support from the Shire will result in a reduction in budgets for operation and maintenance of
these systems. Consequently this may cause breakdowns, thereby contributing to increased
dissatisfaction by the Shire.
h) There is not a section in the BMS for maintenance scheduling. No interaction with the water
contractor and the BMS has inhibited the optimal monitoring and controlling of the ESD
water systems. This omission will hinder preventive actions for some breakdowns within the
water systems.
Management
i) A lack of a methodical training program for the operators and the managers of the ESD
systems underlies the dissatisfaction which has affected their support in sustaining the ESD
systems. On the other hand, the complications with the BMS have contributed to the distrust
of Shire management at The Grove about ‘smart’ design.
j) The significance of the relationship between management, BMS and the ESD systems is that
it has the potential to ensure continual operation of the ESD systems thereby showcasing a
state of art public building in WA. Conversely it can affect the performance of the systems
negatively if a good relationship among all concerned is not maintained in long term.

68
7.2. Lessons Learnt on the Performance of Smart Buildings
a) The smart green buildings are sophisticated systems requiring involvement of all external
contractors at the commissioning stage, including critical interaction between
management, BMS and the maintenance operators.
b) A periodical report system to monitor the performance of the operating systems against
the environmental benchmarks can provide trust and support for ongoing sustainment of
the building systems.
c) Allocation of sufficient annual maintenance budget for ongoing operation of the building
and its operating systems should be established at the initial design stages.
d) Risk assessment and life cycle assessment of the ESD systems should be undertaken at
design stage to contemplate long term performance of the systems. In case of a
breakdown with a particular component, responsible parties should be able to take action
according to contingency guidelines.
e) Document control is significant in the sense that all the reports, manuals and guidelines
need to be easily accessible for operation and upon arousal of a breakdown in the system.

69
References
ABGR, 2013. Australian Building Greenhouse Rating Scheme. [Online]
Available at: www.abgr.com.au
Aghemo, C. et al., 2013. Management and monitoring of public buildings through ICT based
systems: Control rules for energy saving with lighting and HVAC services. Frontiers of
Architectural Research.
Ahmed, A., Ploennings, J., Menzel, K. & Cahill, B., 2010. Multi-dimensional building
performance data management for continuous commissioning. Advanced Engineering
Informatics, Volume 24, pp. 466-475.
Anda, M., 2012. Landscape irrigation nutrients management & future research opportunities.
The Grove Seminar: Integrating Sustainable Technologies in Public Building.
Berardi, U., 2013. Clarifying the new interpretations of the concept of sustainable building.
Sustainable Cities and Society, Volume 8, pp. 72-78.
Biolytix, 2013. Biolytix Wastewater. [Online]
Available at: http://www.biolytix.com
Bureau of Meteorology, 2013. Daily rainfall totals for Australia. [Online]
Available at: http://www.bom.gov.au/jsp/awap/rain/index.jsp
COX Howlett & Bailey Woodland, 2008. Landscape Architectural: Sedge Treatment Terraces
Stormwater Sedgeland. CPGMP Library and Community Learning Centre, PG Shire Offices.
Dallas, S., Anda , M., Byrne, J. & Mars, R., 2011. A yellow water reuse system for a public
building in perth, western australia. International Conference on Integrated Water Management.
Dallas, S., Anda, M., Byrne, J. & Menage, X., 2009. A fully integrated water cycle system for a
public building in Perth, Western Australia. OzWater.
70
Deng, S., Dai, Y., Wang, R. & Zhai, X., 2011. Case study of green energy system design for a
multi-function building in campus. Institute of Refrigeration and Cryogenics, Shanghai Jiao
Tong University. Volume 1, pp. 152-163.
DoH, 2012. Approved Aerobic Treatment Units, Department of Health, Western Australia.
Fuji Clean, 2011. Fuji Clean Australia: Domestic Wastewater Treatment Systems. [Online]
Available at: http://www.fujiclean.com.au/
[Accessed 2013 May 20].
GBC Australia, 2012. Green Building Council Australia. [Online]
Available at: http://www.gbcaus.org.au/
[Accessed 9 May 2013].
GBC Austrlia, 2008. Case Study: 40 Albert Road, GBC Australia.
GBCA, 2012. ESD Design Guide- Office and Public Buildings, Green Building Council of
Australia.
GBCA, 2013. Delivering the next generation of Green Star rating tools, s.l.: Green Building
Council of Australia.
Google Maps, 2013. Peppermint Grove Library. [Online]
[Accessed 15 May 2013].
Honeywell, 2010 Honeywell Building Solutions: Building Management Systems. [Online]
Available at: https://buildingsolutions.honeywell.com/Cultures/en-
US/ServicesSolutions/BuildingManagementSystems/
[Accessed 13 May 2013].
Huxtable, M., 2012. Landscape & Architecture & The Grove. The Grove Seminar: Integrating
Sustainable Technologies in Public Building.
Josh Byrne & Associates, 2011a. Stormwater treatment- Environmentally sustainable design
(ESD) fact sheet 5, The Grove Precinct.

71
Josh Byrne & Associates, 2011b. Rainwater harvesting: Environmentally sustainable design
(ESD) fact sheet 4, The Grove Precinct.
Josh Byrne & Associates, 2011c. Wastewater treatment and reuse: Environmentally sustainable
design (ESD) fact sheet 6, The Grove Precinct.
Levermore, G., 2003. Building Energy Management Systems: Applications to Low-energy HVAC
and Natural Ventilation Control. 3rd ed. Taylor & Francis.
LSE Cities, 2012. Going Green: How Cities are Leading the Next Economy, London: LSE
Cities.
Marinakis, V. et al., 2013. A building automation and control tool for remote and real time
monitoring of energy consumption. Sustainable Cities and Society, Volume 6, pp. 11-15.
Medved, S., 2006. Intelligent Controls and Advanced Building Management Systems. In: M.
Santamouris, ed. Environmental Design of Urban Buildings: An Integrated Approach. Earthscan.
NABERS, 2013. National Australian Built Environment Rating System. [Online]
Available at: www.nabers.com.au
Pujol, M., 2013. Geothermal heating and cooling for the Peppermint Grove Library, The Grove
Precinct.
Shire of Peppermint Grove, 2012. The Shire of Peppermint Grove. [Online]
Available at: www.peppermintgrove.wa.gove.au
The Grove Precinct, 2011. Final Report for the Green Precincts Fund, The Grove Precinct.
The Grove Precinct, 2012. [Online]
Available at: www.thegroveprecinct.com.au
Town of Cottesloe, 2012. [Online]
Available at: www.cottesloe.wa.gov.au
Town of Mosman Park, 2012. [Online]
Available at: www.mosmanpark.wa.gov.au

72
Water Design International, 2008. Irrigation Plan. CPGMP Library and Community Learning
Centre PG Shire Offices.
Water Installations, 2009. CPGMP Library and Community Learning Centre Drawings.

73
Appendices
Appendix A: Instructions on Data Extraction from the BMS
In order to extract data from The Grove Building Management System in the form of an
Excel or Word file, use the following instructions:
1) Open the BMS
2) View > Trend Summary
3) From the list of the already configured trends choose the one you are most interested in
(Figure 36). Alternatively you can configure a new trend-log for your specific points:
a. Click on a number with no trend name assigned to it, e.g. 50. A new page will
open. (Figure 35)
b. Click on the first cell in ‘Point ID‘ column, a new window will open which lists
all the points in BMS database from which to choose data. Choose the point from
which data is to be taken (Figure 36)
c. Click on the cell under ‘Parameter’ and select ‘Present Value’
d. Repeat previous steps for as many other points as required
e. Choose the period and interval of interest from the tab on the very top right side
of the page (Figure 37.b and Figure 37.c)
f. Save
4) Choose View Trend with Tabular History (Figure 37.a)
5) Select the Period and Interval as applicable to the set of data of particular interest, e.g. 1
year interval with 8 hours average (Figure 37.b andFigure 37.c).
6) Select ‘Show Selector Left and Right’; this will show the data selection for both start and
end of the period (Figure 37.d)
7) Auto Scale all Plots (Figure 37.e)
8) Click on Pause button and then Play to reveal the trends on screen (Figure 38).
9) Click on one row of data or on the graph
10) Click on Edit > Copy (this is the only way to copy the data); the usual ‘Ctrl+C’ does not
work in this version of the BMS.
11) Go to Excel or Word and Paste.
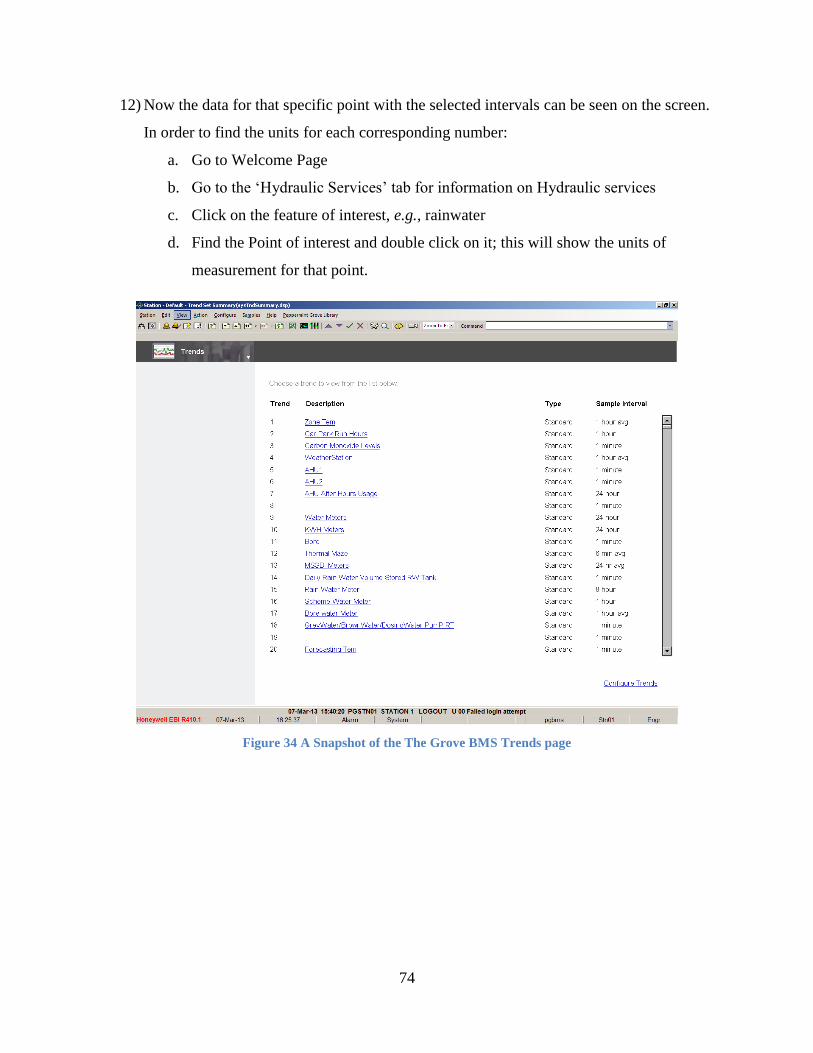
74
12) Now the data for that specific point with the selected intervals can be seen on the screen.
In order to find the units for each corresponding number:
a. Go to Welcome Page
b. Go to the ‘Hydraulic Services’ tab for information on Hydraulic services
c. Click on the feature of interest, e.g., rainwater
d. Find the Point of interest and double click on it; this will show the units of
measurement for that point.
Figure 34 A Snapshot of the The Grove BMS Trends page

75
Figure 35 A Snapshot of the The Grove BMS Trends configuration page
Figure 36 A Snapshot of the The Grove BMS Trends configuration page with points names
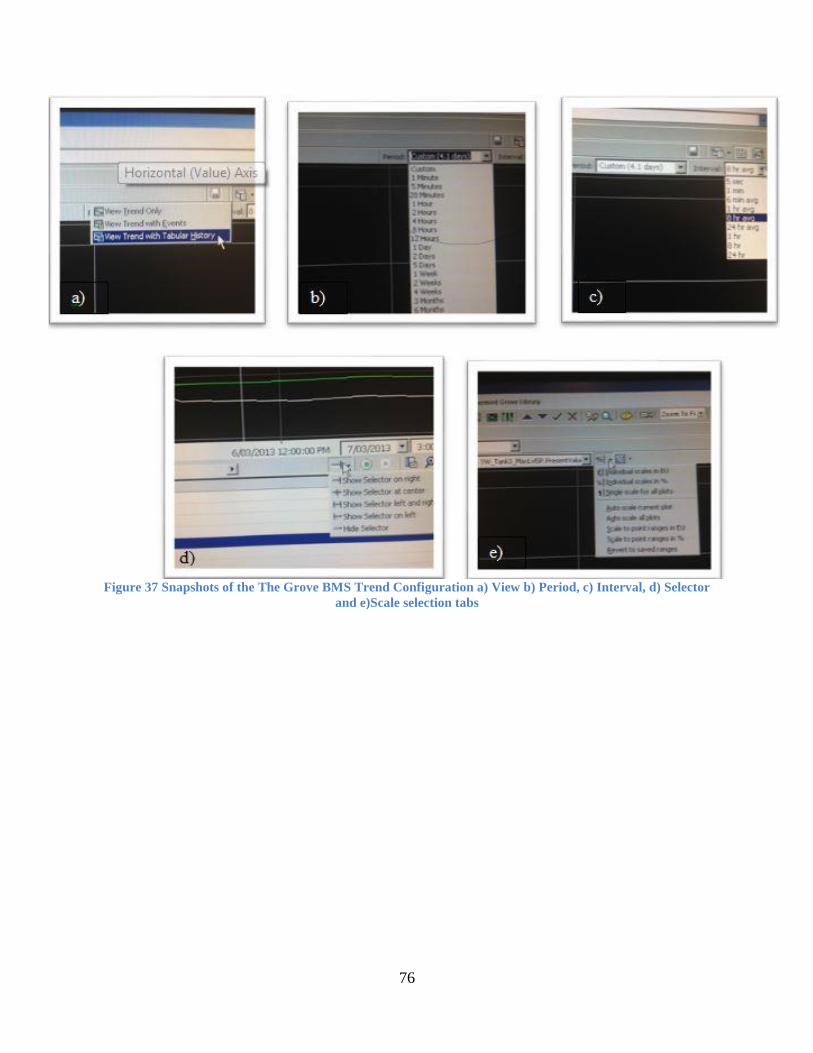
76
Figure 37 Snapshots of the The Grove BMS Trend Configuration a) View b) Period, c) Interval, d) Selector
and e)Scale selection tabs
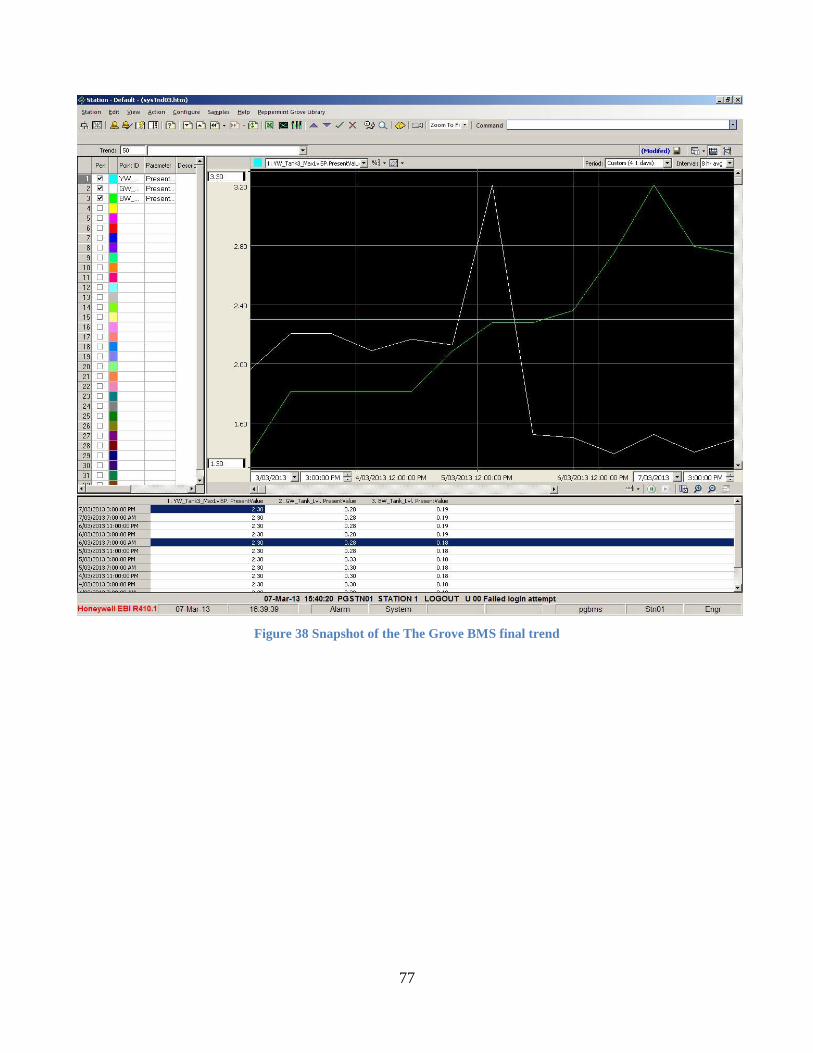
77
Figure 38 Snapshot of the The Grove BMS final trend

78
Appendix B: The BMS Backup Support
Chronological events on accessing and extracting data from the BMS are listed below with
people involved and communications taking place:
19 Feb 2013
A technician from Honeywell came to fix the log-in problems with the BMS. This was
the first time he visited The Grove and he did not have any background on the venue.
However Don Jagodage, who was one of the main technicians involved in The Grove
BMS installation, was on-call providing back-up.
This technician was able to fix the log-in problem of the BMS; however the BMS still did
not show any data. It displayed '0' level for all tanks and systems. Finally he discovered
that another program was not activated thereby triggering this issue.
This was the first time access to the BMS was provided for this study. Different sections
of the BMS were observed.
One section of most interest for this study was the ‘Report’ section in the BMS. The
operator and the Researcher tried to extract data from it; however no output was
produced. Additionally it was not clear how the ‘Report’ section was to be used for
producing outputs. The operator could not explain the system either.
21 Feb 2013
Don Jagodage from Honeywell came to The Grove to solve the data extraction problem.
He had been previously involved at The Grove so possessed a good knowledge of the
system and the ESD systems.
This operator explained that extracting data for the ESD systems other than energy and
alarm systems could not be undertaken for this, the 2007 version of the BMS. The
version enabling data extraction for all systems is named the "Energy Manager Server"
(EMS).
He suggested visual observation of the trends, as shown in the ‘Trend’ section, though
without copying those data into an external file (e.g. Excel). He further suggested the

79
direct use of these trends for this study., the Researcher noted this could pose a serious
time constraint on the progress of the project.
Another issue was to determine the specific sensors’ tag names for the ESD monitoring
points. There are numerous monitored points in the BMS for different ESD systems and
features in its operation. A manual/document was required to find descriptions for them.
This document was not available in The Grove, the operator stating that Honeywell did
not possess that document either. As a solution he suggested direct contact to him for any
enquiries about the monitored points’ tag names.
7 March 2013
Andrew Crabtree from IBMS, who was previously involved in commissioning The Grove
ESD systems, came to help with data extraction into Excel.
Being knowledgeable about the system and its limitations, he explained exactly how to
save the logged data using the trends summary (Appendix A).
This was the first time data were extracted from the BMS to an Excel file for further
analysis. The specific monitored points for most of the ESD water systems were already
established. Further configuration of other points not already configured in the system
would be a complement to more comprehensive results.
The IBMS technician stated that access to the latest Input-Output (I/O) Schedule
document would be necessary in order to determine the points’ name tags. The version to
which he had access was an older version dating back to 2009. He stressed that an
updated version would be required especially following the new irrigations settings of
2012.
Michael Whitbread (Shire of Peppermint Grove) however could not find any I/O
Schedule document stored at The Grove.

80
27 March 2013
E-mail contact with Don Jagodage, the Honeywell operator in order to establish access
to an updated version of the I/O Schedule for The Grove BMS, had him replying that as
Honeywell did not have the document in question he should be contacted directly for
confirmation of the name tag for each monitoring point.
Another problem with the available I/O schedule of 2009, other than it being an outdated
document, was that the points described in the schedule did not have a matching tag name
in the BMS, causing further difficulties for mapping the correct abbreviation of the
required points.
12 May 2013
Upon email contact with Don Jagodage concerning the approximate price of upgrading
the BMS to a newer version, he stated that the current version at The Grove did not have
provision for upgrading to the “Energy Manager Server” (EMS) which enables extraction
and reporting on the entire ESD systems. Therefore complete replacement is required, the
total installment cost being estimated at $20,000 as quoted by Don Jagodage.
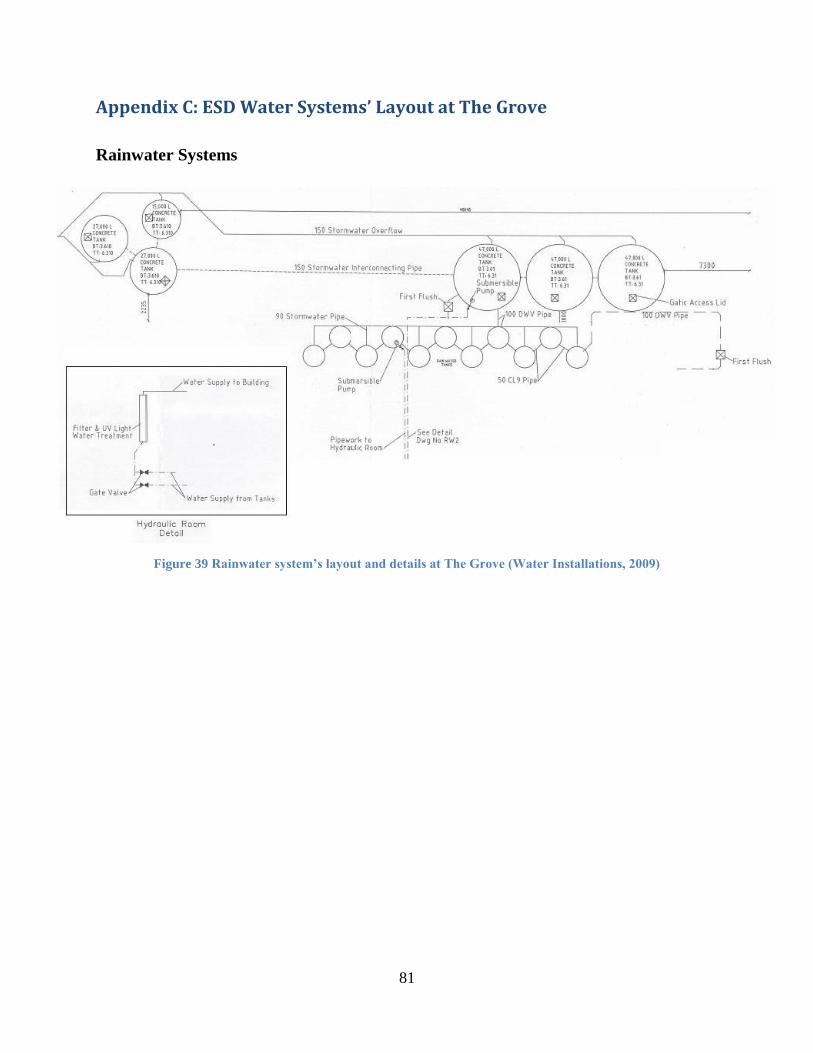
81
Appendix C: ESD Water Systems’ Layout at The Grove
Rainwater Systems
Figure 39 Rainwater system’s layout and details at The Grove (Water Installations, 2009)
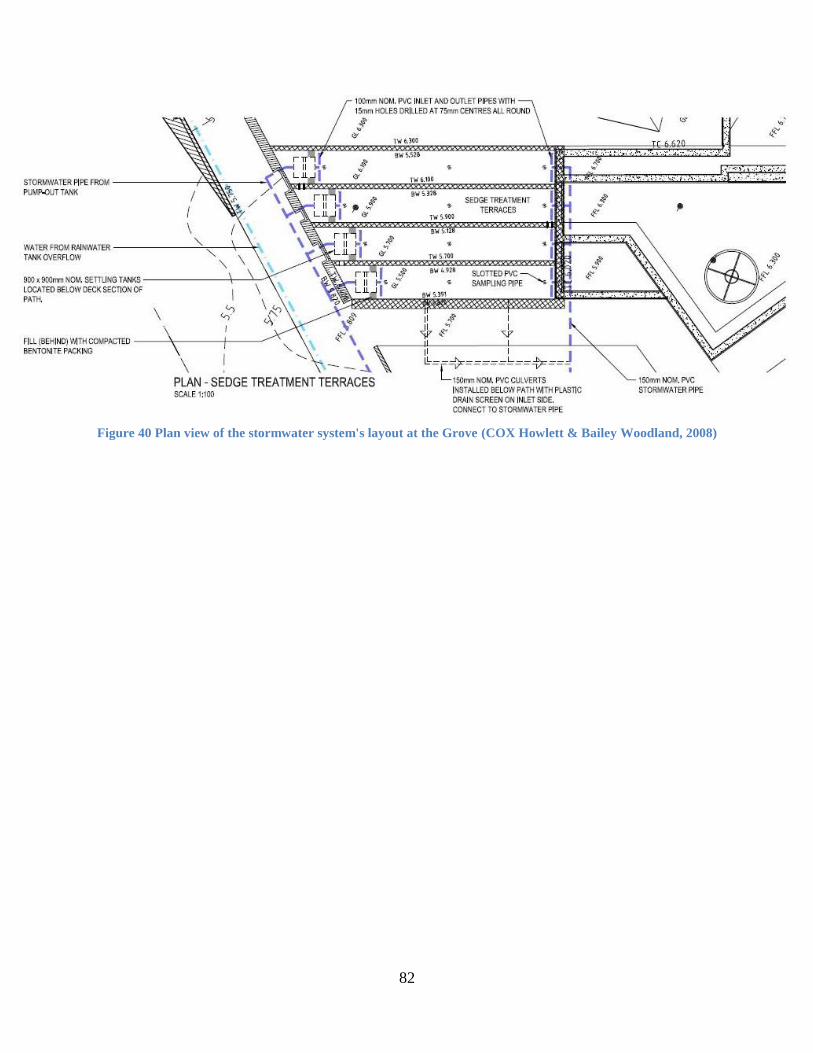
82
Figure 40 Plan view of the stormwater system's layout at the Grove (COX Howlett & Bailey Woodland, 2008)

83
Wastewater Systems
Figure 41 Layout of the wastewater systems at The Grove (Water Installations, 2009)
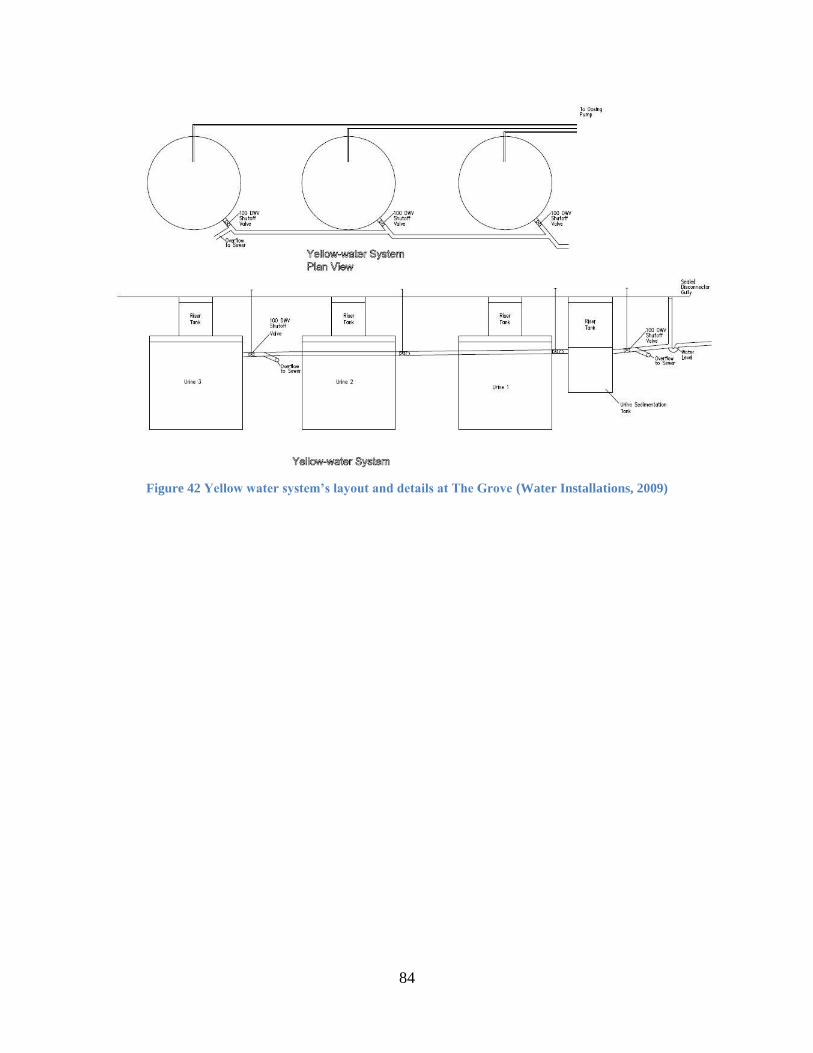
84
Figure 42 Yellow water system’s layout and details at The Grove (Water Installations, 2009)
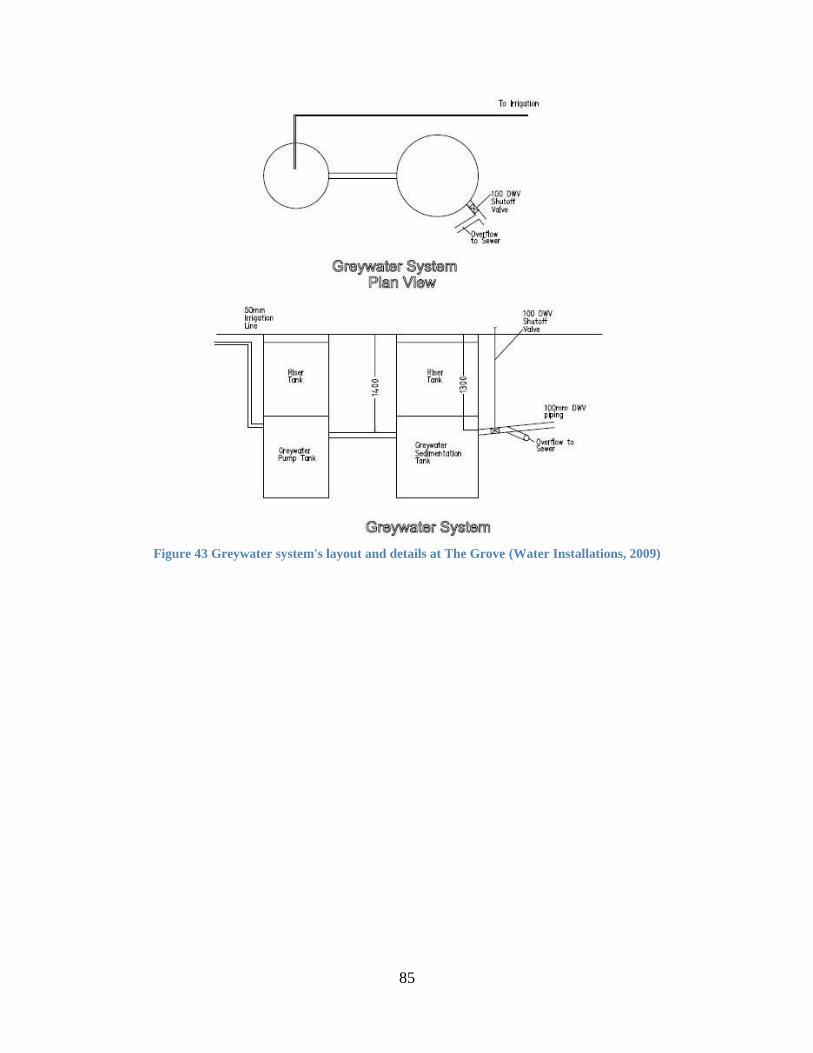
85
Figure 43 Greywater system's layout and details at The Grove (Water Installations, 2009)

86
Figure 44 Brown water system's layout and details at The Grove (Water Installations, 2009)
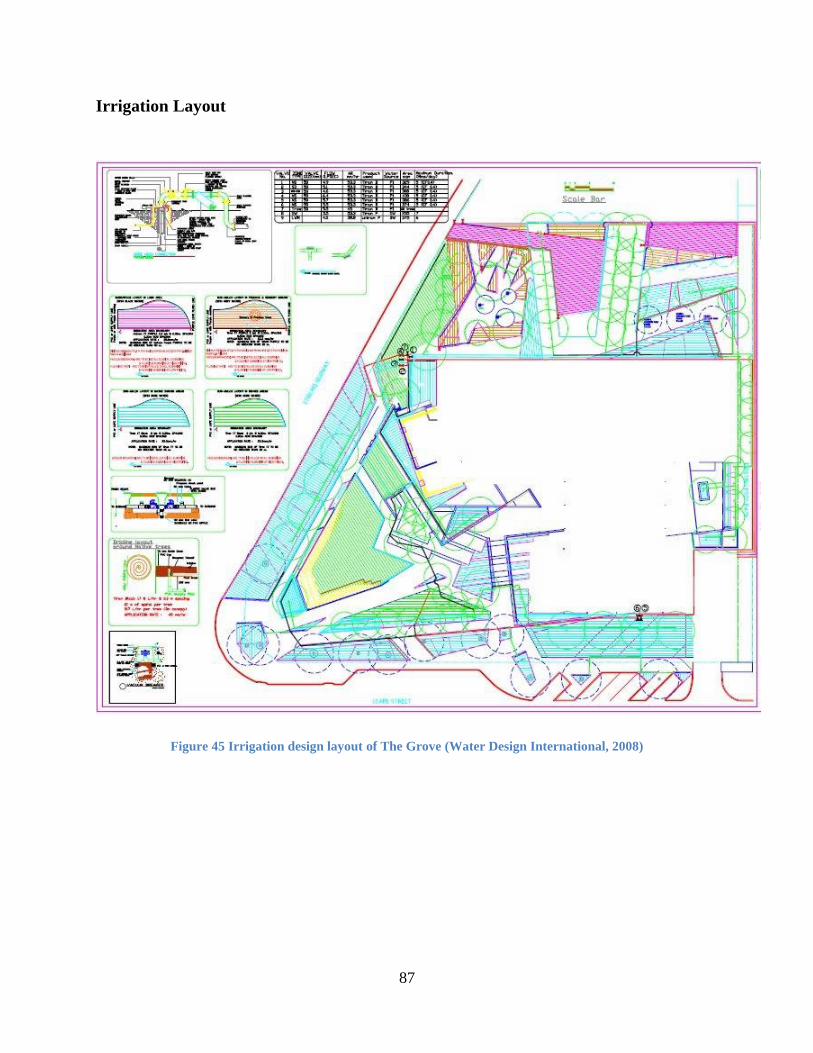
87
Irrigation Layout
Figure 45 Irrigation design layout of The Grove (Water Design International, 2008)

88
Appendix D: Field Visit with the Water Contractor
Field visit with Ross Mars, water contractor of The Grove
This report provides an understanding of the different ESD water systems’ operation from a site
visit to The Grove with Ross Mars, Water Installation, on 26th
April 2013.
Rainwater (RW)
a) The RW has not been accessible for internal use for a long time. The contractor explained the
series of actions which had taken place to correct the problem. The reason for the actions was
thought to be the pump, the controller or the UV. During February 2013 the UV was replaced
for the third time as it seemed to be the faulty component of the system. The system was
tested wherein the pump, pressure and the rainwater system were working properly. However
the RW system did not start to pump water automatically for internal usage.
b) Upon further investigation, it was only recently realised by the contractor that the rainwater
system’s design required UV activation before the pump operated. During all this time, the
BMS was preventing the pump from starting because it did not recognise the UV to be
operating. However, he did not know this at the time the UV was being replaced.
c) The initial UV was a sophisticated and expensive facility which was replaced under warranty
after a breakdown during the first year of operation. However, when for the second time the
UV became faulty it was not under warranty; it was deemed not worth paying approximately
$5,000 for such expensive system. Therefore it was decided to use a much simpler UV
system, the current one. But this new system was not checked for compatibility in connecting
to a monitoring system. The end result was that the system was not set so as to signal the
BMS to start the pump. Now the UV provider in New Zealand must be contacted to check
whether there is a method for connecting the UV to the BMS.
d) The BMS displays that both above-ground and below-ground tanks are full (Figure 20 of
Chapter 4), whereas the below ground tanks were empty when inspected by the contractor in
March 2013.
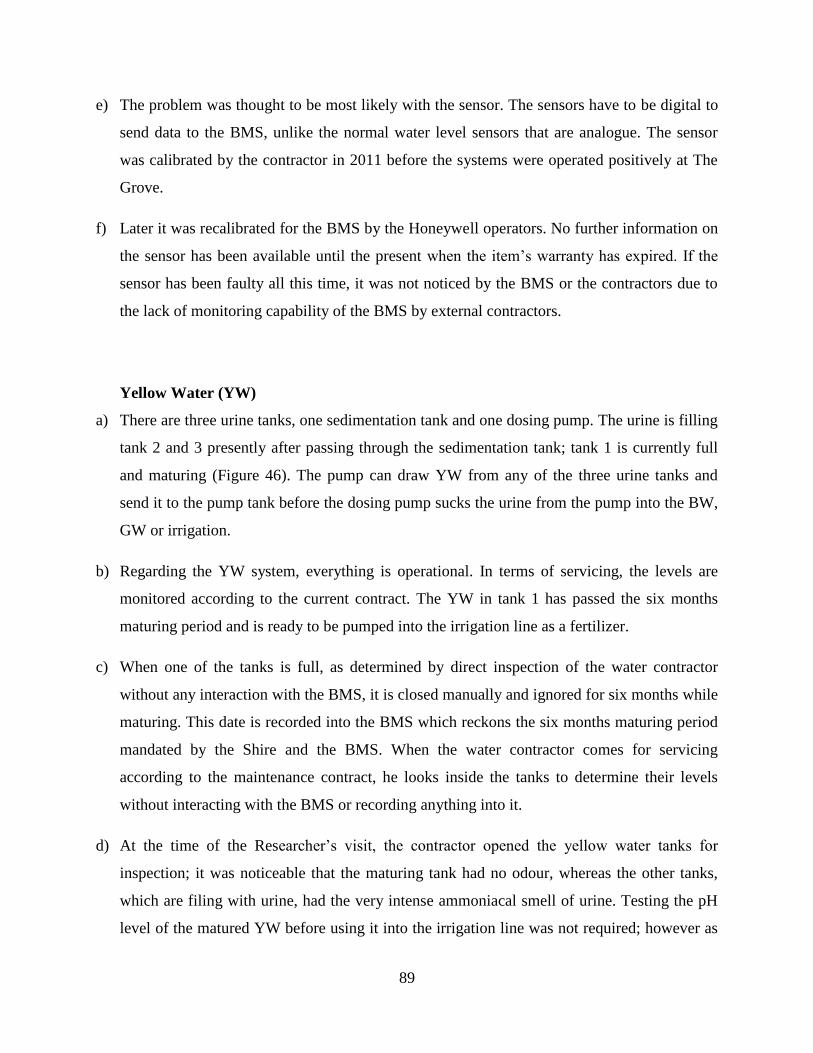
89
e) The problem was thought to be most likely with the sensor. The sensors have to be digital to
send data to the BMS, unlike the normal water level sensors that are analogue. The sensor
was calibrated by the contractor in 2011 before the systems were operated positively at The
Grove.
f) Later it was recalibrated for the BMS by the Honeywell operators. No further information on
the sensor has been available until the present when the item’s warranty has expired. If the
sensor has been faulty all this time, it was not noticed by the BMS or the contractors due to
the lack of monitoring capability of the BMS by external contractors.
Yellow Water (YW)
a) There are three urine tanks, one sedimentation tank and one dosing pump. The urine is filling
tank 2 and 3 presently after passing through the sedimentation tank; tank 1 is currently full
and maturing (Figure 46). The pump can draw YW from any of the three urine tanks and
send it to the pump tank before the dosing pump sucks the urine from the pump into the BW,
GW or irrigation.
b) Regarding the YW system, everything is operational. In terms of servicing, the levels are
monitored according to the current contract. The YW in tank 1 has passed the six months
maturing period and is ready to be pumped into the irrigation line as a fertilizer.
c) When one of the tanks is full, as determined by direct inspection of the water contractor
without any interaction with the BMS, it is closed manually and ignored for six months while
maturing. This date is recorded into the BMS which reckons the six months maturing period
mandated by the Shire and the BMS. When the water contractor comes for servicing
according to the maintenance contract, he looks inside the tanks to determine their levels
without interacting with the BMS or recording anything into it.
d) At the time of the Researcher’s visit, the contractor opened the yellow water tanks for
inspection; it was noticeable that the maturing tank had no odour, whereas the other tanks,
which are filing with urine, had the very intense ammoniacal smell of urine. Testing the pH
level of the matured YW before using it into the irrigation line was not required; however as
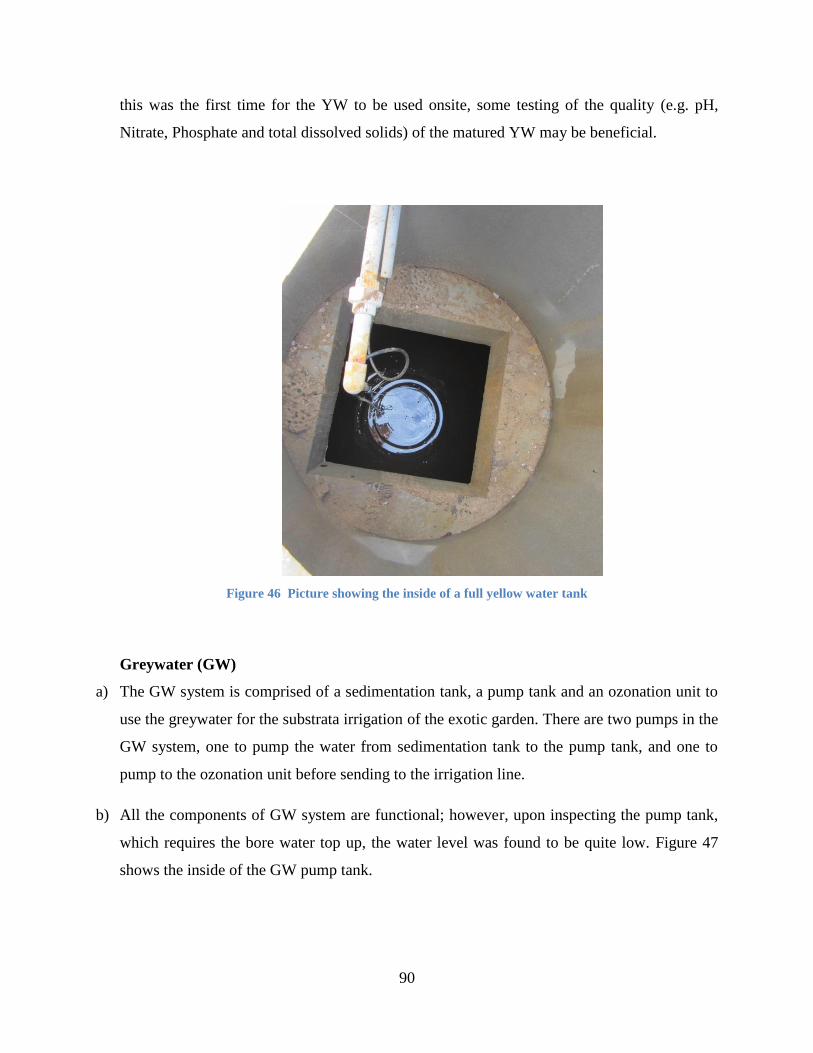
90
this was the first time for the YW to be used onsite, some testing of the quality (e.g. pH,
Nitrate, Phosphate and total dissolved solids) of the matured YW may be beneficial.
Figure 46 Picture showing the inside of a full yellow water tank
Greywater (GW)
a) The GW system is comprised of a sedimentation tank, a pump tank and an ozonation unit to
use the greywater for the substrata irrigation of the exotic garden. There are two pumps in the
GW system, one to pump the water from sedimentation tank to the pump tank, and one to
pump to the ozonation unit before sending to the irrigation line.
b) All the components of GW system are functional; however, upon inspecting the pump tank,
which requires the bore water top up, the water level was found to be quite low. Figure 47
shows the inside of the GW pump tank.
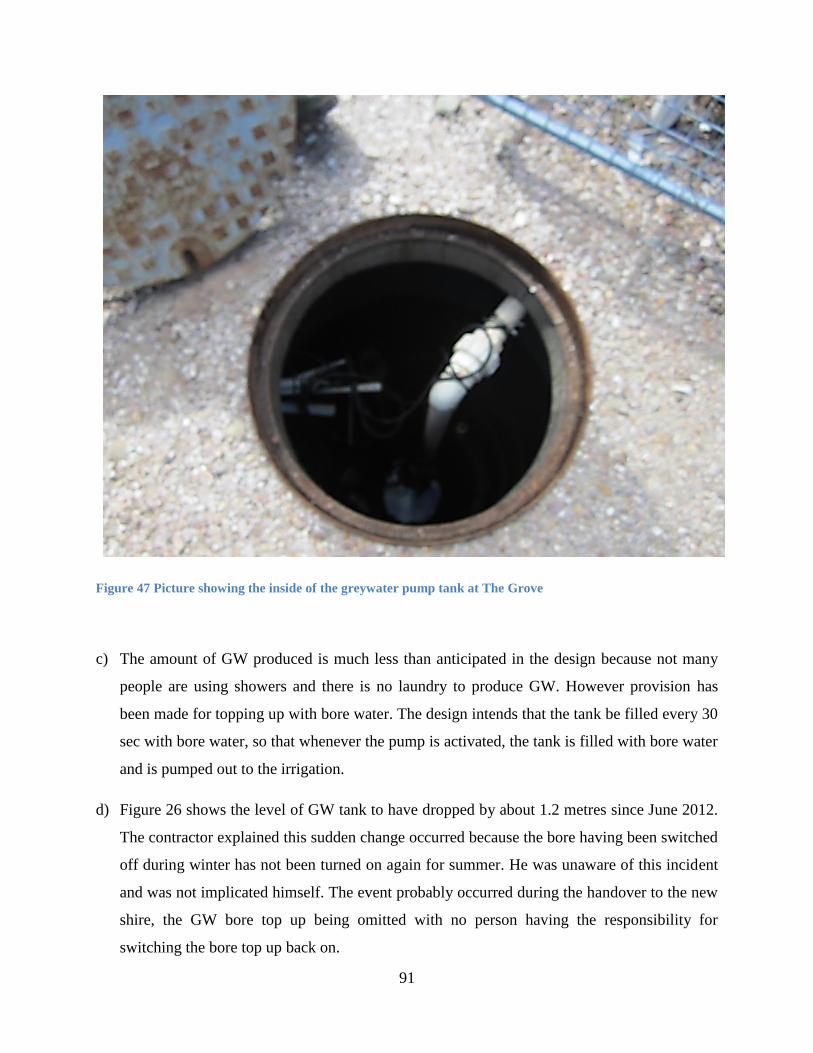
91
Figure 47 Picture showing the inside of the greywater pump tank at The Grove
c) The amount of GW produced is much less than anticipated in the design because not many
people are using showers and there is no laundry to produce GW. However provision has
been made for topping up with bore water. The design intends that the tank be filled every 30
sec with bore water, so that whenever the pump is activated, the tank is filled with bore water
and is pumped out to the irrigation.
d) Figure 26 shows the level of GW tank to have dropped by about 1.2 metres since June 2012.
The contractor explained this sudden change occurred because the bore having been switched
off during winter has not been turned on again for summer. He was unaware of this incident
and was not implicated himself. The event probably occurred during the handover to the new
shire, the GW bore top up being omitted with no person having the responsibility for
switching the bore top up back on.

92
Brown Water (BW)
a) The BW system is comprised of a Biogrinder and two Biolytix tanks wherein the BW is
treated by bacteria and worms, one pump chamber, and filters. The treated BW was used for
subsurface irrigating of the lawns. Figure 48 depicts the inside of an un-operational Biolytix
tank.
b) The Biolytix tanks were flooded due to high volume of bore water coming into them when
the pump was clogged as a result of high material turbidity, and the geotextile layers not
draining properly. The system was posing so much trouble that it was decided to remove the
BW completely from the irrigation line.
c) The effluent quality was poor and the Biolytix system started to fail and cause problems. The
reason behind the poor quality of the effluent was that the environment for the worms and
bacteria was not optimal. The worms were dying due to high temperatures. At the time of the
site visit the Biolytix tanks were dry and no evidence of macro-organisms life was present
(Figure 48).
It is now known that the lids of the Biolytix should be covered in mulch to reduce the heat
and thus provide the appropriate environment for the bacteria and worms, this not being
realised previously.
d) Also the BW system’s components need to be serviced regularly using improved servicing
methods which will allow reuse of the Biolytix tanks. The current service requirement of
these tanks is once a year while in practice more frequent servicing is required, as regularly
as once a month if the decision is to keep and make use of the current system. However, due
to the previous uncertainties, the Shire has decided not to spend any more money on
servicing or caring for the BW systems.
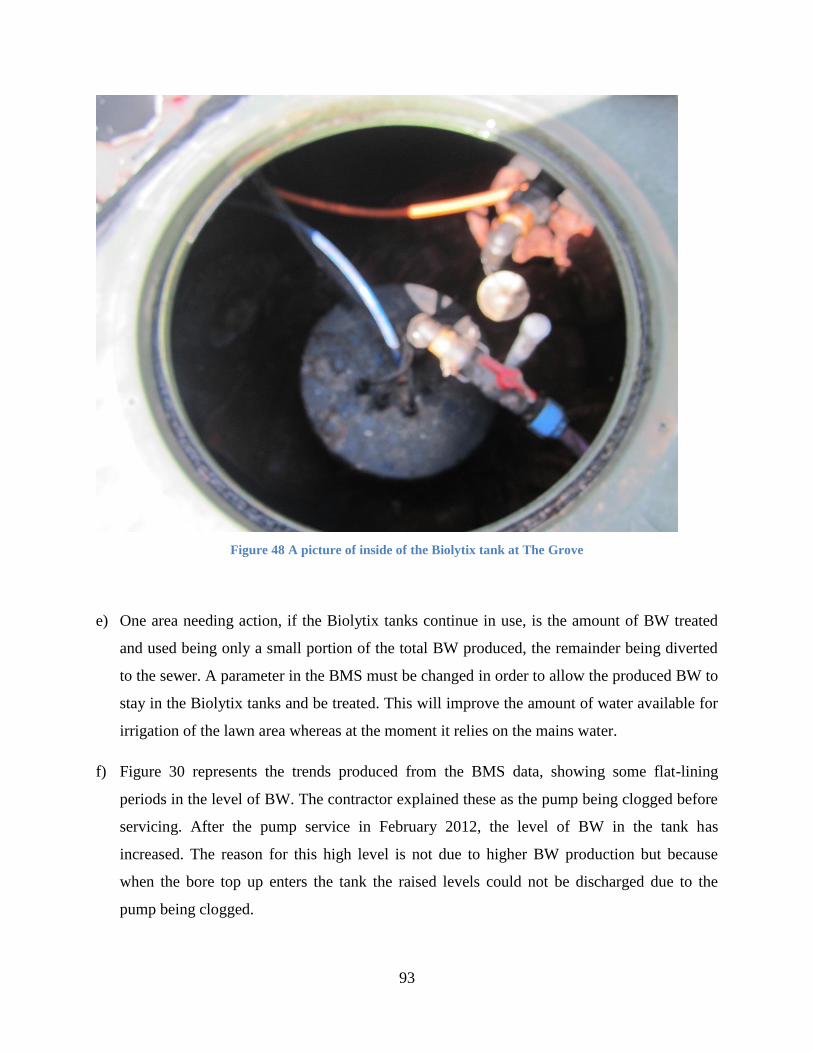
93
Figure 48 A picture of inside of the Biolytix tank at The Grove
e) One area needing action, if the Biolytix tanks continue in use, is the amount of BW treated
and used being only a small portion of the total BW produced, the remainder being diverted
to the sewer. A parameter in the BMS must be changed in order to allow the produced BW to
stay in the Biolytix tanks and be treated. This will improve the amount of water available for
irrigation of the lawn area whereas at the moment it relies on the mains water.
f) Figure 30 represents the trends produced from the BMS data, showing some flat-lining
periods in the level of BW. The contractor explained these as the pump being clogged before
servicing. After the pump service in February 2012, the level of BW in the tank has
increased. The reason for this high level is not due to higher BW production but because
when the bore top up enters the tank the raised levels could not be discharged due to the
pump being clogged.
94
g) The pump is still activated in order to remove the BW when, at a certain level, a signal
informs it to operate and pump the BW out. This will explain the fluctuation on the BW tank
level after its removal from the water system (Figure 31). However if the pump gets clogged,
it will not pump the water out and the water level keeps increasing and eventually floods
again. Therefore, although the BW system is disconnected from the irrigation system, regular
service is required to prevent the pump clogging and flooding the area.
Irrigation
a) Irrigation is a big problem as drip-lines are damaged because the reinjection bore machinery
for digging the bore severely damaged the irrigation setup and the associated turf.
b) Presently, sprinklers are employed for all the lawn areas using mains water. The sprinklers
are engaged instead of the drip-line because of their wide cover, but wasting much water.
They have been in use since late last year after a Halloween event at the library.
c) A means has already been set up in the system to make it possible to use bore water instead
of wastewater from the system; however, this capability to use the bore water has not been
used; mains water is used instead. Michael Whitbread, Shire of Peppermint Grove informs
that the cost of water used is not considerable though, being $24 per day.
d) As matters stand, all the irrigation must be restored if the system is to be used as it was
designed. This work is in addition to the regular maintenance contract; it requires urgent
attention from the Shire of Peppermint Grove.