Embed Size (px)
Citation preview
Journal of Tethys: Vol. 2, No. 3, 228–241 ISSN: 2345–2471 ©2014
Babakan and Oskouei, 2014 228 Available online at http://jtethys.org
Integrated use of multispectral remote sensing and GIS for primary gold favorability
mapping in Lahroud Region (NW Iran)
Solmaz Babakan1*
, Majid Mohammady Oskouei2
1- Phd Student at Sahand University of Technology
2- Mining Engineering Faculty, Sahand University of Technology, Tabriz, Iran
* Corresponding Author: [email protected]
Abstract
In this study, the reliability of the primary gold mineralization exploration using multispectral
ETM+ imagery was investigated in Lahroud region, northwest Iran, which was conducted by
integration of alteration and structural indicators. Co-occurrence of the clay minerals and iron
oxides is an important criterion in gold deposit exploration; therefore, their alteration zones were
mapped using Landsat 7 Enhanced Thematic Mapper Plus (ETM+) data analysis by feature oriented
component analysis (FPCS) and band ratio techniques considering their applicability and simplicity.
The structural data layers including lithological units and faults maps were also utilized to enhance
the accuracy of the results. The gold favorability map of the study area was then created by the
combination of the aforementioned resultant alteration and structural data layers in ArcGIS based
on the weights assigned by the analytic hierarchy process method (AHP) considering the main role
of the alteration zones in gold mineralization exploration. The final primary gold favorability map
was evaluated through the known Au indices and ore bodies in the study area. Quantitative
assessment of the results was carried out by means of the frequency ratio coefficient (FRC) that
normalizes the total number of Au signatures in each potential zone with the relevant area
measurement. Approximately 16% of the study area was categorized as the most favorable zone for
primary gold mineralization which involves 50% of the Au signatures. Accordingly, the high
potential zone which represents the highest FRC value (3.14) confirms the efficiency and reliability
of the applied procedure. Therefore, the application of multispectral remote sensing techniques
alongside the structural analysis is a reliable, rapid and cost effective method for mineral
exploration.
Keywords: Alteration mineral mapping; ETM+; GIS; Multispectral data analysis; Analytic hierarchy
process, Primary gold mineralization, Lahroud.
1–Introduction
Considering their remarkable extension,
recognition of alteration haloes in mineral
prospecting is an essential process and they
have a key role in simplifying and prosperity of
exploration programs. Despite the diverse
techniques of the alteration mapping,
developing remote sensing methods have found
an increasing application in this arena and
implementation of multispectral remote sensing
techniques in ore deposits exploration has been
intensively interested (Crosta and McM Moore,
1989; Loughlin, 1991; Zhang et al., 2007b;
Sadeghi et al., 2013; Amer et al., 2012).
Remote sensing sensors record spectral behavior
of the materials comprising the earth’s surface,
and thus, they have been used for decades to
map rock types, mineral assemblages and
weathering characteristics. Remotely sensed
data analysis, improving our abilities in the
earth’s surface recognition, is effective in
arid/semi-arid regions where the geologic units
Journal of Tethys: Vol. 2, No. 3, 228–241 ISSN: 2345–2471 ©2014
Babakan and Oskouei, 2014 229 Available online at http://jtethys.org
are extensively exposed (Khan and Mahmood,
2008; Bedini, 2011; Zhang et al., 2007a).
Because of its suitable wavelength coverage,
multispectral systems such as Landsat TM
imagery have been routinely utilized in the
detection of the ore deposit associated alteration
zones, and as a result, it is considered as an
efficient tool in mineral exploration, particularly
in remote areas with little or no access (Zhang et
al., 2007a).
Active tectonics of the study area and thus,
extension of numerous igneous and
metamorphic complexes in NW Iran has
motivated plenty of systematic exploration
programs and detailed investigations aiming
economic mineralization in this area. The
purpose of this study is to determine the most
favorable areas of gold mineralization in
Lahroud region, NW Iran, which confirms the
efficiency of Landsat 7 Enhanced Thematic
Mapper Plus (ETM+) in gold mineralization
potential mapping because of its ability in
detection of related alteration minerals as well
as its accessibility. Despite the higher spectral
resolution of the Advanced Space borne
Thermal Emission and Reflection Radiometer
(ASTER) data, the indicator minerals of the
gold mineralization including clay minerals and
iron oxides are also detectable using ETM+
images.
As gold cannot be detected directly by any
remote sensing method, the presence of iron
oxides alongside the clay minerals such as
kaolinite, montmorillonite, and alunite could be
used as an indicator for identification of
hydrothermal alteration zones associated with
gold mineralization considering their diagnostic
spectral signatures in the visible/shortwave
infrared portion of the electromagnetic spectrum
(Kujjo, 2010; Zoheir and Emam, 2012). Hence,
gold mineralization associated alteration
minerals were mapped by the Feature oriented
Principal Components analysis (FPCS) and
band ratio techniques. These methods are
practical and successfully employed in
alteration mapping. At the same time, they are
very simple methods leading to their popularity
in the various researches. Moreover, structural
features of the study area, including lithological
units and faults maps were used for improving
the reliability of the results. Finally, the gold
potential map was generated by weighted
overlaying of the aforementioned factor maps
according to the weights assigned based on the
analytic hierarchy process (AHP) method.
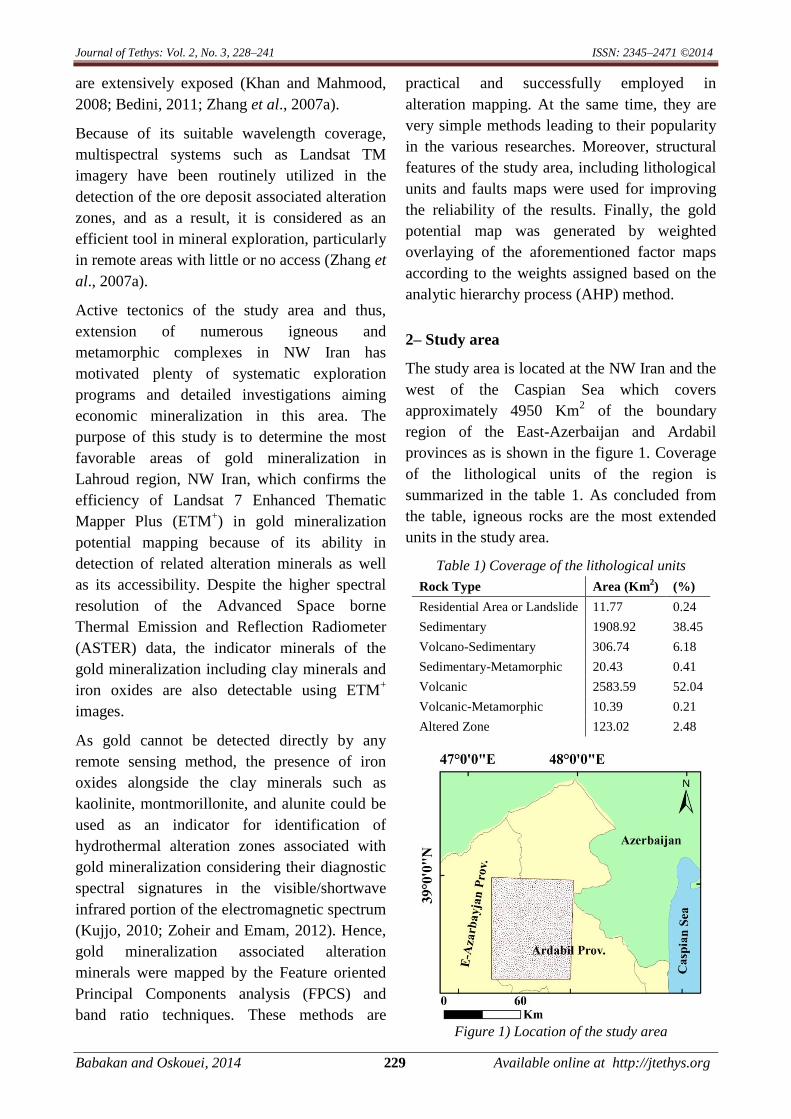
2– Study area
The study area is located at the NW Iran and the
west of the Caspian Sea which covers
approximately 4950 Km2 of the boundary
region of the East-Azerbaijan and Ardabil
provinces as is shown in the figure 1. Coverage
of the lithological units of the region is
summarized in the table 1. As concluded from
the table, igneous rocks are the most extended
units in the study area.
Table 1) Coverage of the lithological units
Rock Type )2
(Km Area (%)
Residential Area or Landslide 11.77 0.24
Sedimentary 1908.92 38.45
Volcano-Sedimentary 306.74 6.18
Sedimentary-Metamorphic 20.43 0.41
Volcanic 2583.59 52.04
Volcanic-Metamorphic 10.39 0.21
Altered Zone 123.02 2.48
Figure 1) Location of the study area

Journal of Tethys: Vol. 2, No. 3, 228–241 ISSN: 2345–2471 ©2014
Babakan and Oskouei, 2014 230 Available online at http://jtethys.org
3– Dataset
In this study, remotely sensed multispectral
ETM+ images acquired on June 5, 2000 were
processed to extract alteration mineral zones
associated with primary gold mineralization.
Additionally, improving accuracy of the gold
favorability map of the region, structural factor
maps were utilized in the overlaying process.
Structural evaluation of the study area regards
the ore formation was conducted using the
lithological units and faults maps. Faults were
digitized from the four 1:100,000 scale geologic
quadrangle maps of Lahroud, Kaleybar,
Meshkin Shahr and Ahar. Also, the 1:250,000
scale Ahar geologic map was used to extract
lithological units of the region.
4– Pre-processing
Considering undesired interactions of the
atmosphere and adjacent pixels, pre-processing
is a necessary stage for improving clarity of the
images and thus provides higher quality data for
analysis purposes (Oskouei and Busch, 2008;
Poormirzaee and Oskouei, 2010). One of the
common atmospheric correction methods is to
estimate the path radiance by the regression
method and then to subtract this value from the
signal received by the sensor (Mather and Koch,
2010).
In this study, the regression method was
implemented for path radiance correction in
which the scatter plot of the spectral bands
against the thermal band (band 6) was plotted in
turn and the intercept of the line best fitted to
data points were subtracted from the
corresponding band’s digital numbers as the
path radiance correction (PRC). This method
supposes that the effect of the path radiance on
the thermal bands is zero or negligible
(Jiménez-Muñoz et al., 2010; Mather and Koch,
2010). The path radiance correction of ETM+
bands is illustrated in table 2. As implied from
the table, the path radiance decreases as the
wavelength increases expectedly.
Table 1) PRC of ETM+ bands
ETM+ Bands PRC ETM
+ Bands PRC
Band 1 44 Band 4 4
Band 2 25 Band 5 1
Band 3 8 Band 7 1
5– Methods
Image processing methods are aimed to increase
the contrast between interesting targets and
undesired background effects in the image
(Camps-Valls et al., 2011). Digital processing
of ETM+ dataset was performed using ENVI 4.8
by the feature oriented component analysis and
band ratio techniques.
5.1– Alteration indicators
5.1.1– Band ratio
Band ratioing is the common powerful satellite
image processing technique, especially in areas
where topographic effects are important. This
method was widely applied in alteration mineral
mapping. In fact, earth’s surface features have
their particular spectral reflectance patterns in
different wavelength portions which could be
used as a kind of fingerprint of the objects.
According to the position of the high reflectance
and absorption spectral bands of the objects, the
main concept of the band ratioing technique was
developed (Wang and Nunez, 1992; Hadi and
Najeeb, 2011; San et al., 2004; Fu et al., 2006;
Zoheir and Emam, 2012; Beiranvand Pour et
al., 2013; Rajendran et al., 2013).
The basic idea of the band ratio method is to
emphasize the subtle variations in the spectral
reflectance characteristics of the various surface
covers or target objects. The important property
of this method is its invariance to shading
effects as the contribution of the geometric
factor related to shading is approximately
constant for all image bands; thus ratioing the
two band values effectively cancels them out
(Wang and Nunez, 1992; Hadi and Najeeb,
2011; San et al., 2004; Shalaby et al., 2010;
Ranjbar et al., 2004; Fu et al., 2006).

Journal of Tethys: Vol. 2, No. 3, 228–241 ISSN: 2345–2471 ©2014
Babakan and Oskouei, 2014 231 Available online at http://jtethys.org
Depending on the purpose of their application,
e.g., lithology or alteration discrimination, lots
of band ratios has been developed based on the
spectral reflectance maxima and the position of
the absorption features of the target minerals
(Kujjo, 2010; Rajendran et al., 2013). The
spectral bands of ETM+ are well suited for
recognition of the assemblages of the altered
minerals.
A
B
Figure 2) Normalized alteration maps by the band ratio method: A) clay mineral; B) iron oxides.
Generally, Landsat ETM+ band ratios 5/7 and
3/l were used to emphasize the clay and iron
oxide alteration zones respectively (Dehnavi et
al., 2010; Moghtaderi et al., 2007; van der Meer
et al., 2012).
It is well established that the Landsat ETM+
band ratio 3/1 is efficient in Fe alteration
mapping given their reflectance maxima and
minima within the spectral range of bands 3 and
1 respectively, and thus increases the
differences between the digital number of iron
alteration zones and those of unaltered rocks
leading to a better discrimination of
hydrothermally altered and unaltered rocks
(Dehnavi et al., 2010; Moghtaderi et al., 2007;
Van der Meer et al., 2012; Sadeghi et al., 2013;
Beiranvand Pour et al., 2013).
The most widespread products of the alteration
process, hydroxyl minerals such as the clay
minerals and sheet silicates, based on the
position of band minima related to Al–OH
vibrational absorption, have a diagnostic
spectral absorption features in 2.1–2.4 μm
(ETM+ band 7). At the same time they have a
very high reflectance in the range of ETM+ band
5. Therefore, a band ratio of 5/7 would yield
very high values for altered zones comprising
dominantly hydroxyl-bearing minerals such as
the clays, alunite, etc. (Ranjbar et al., 2004;
Moghtaderi et al., 2007; Beiranvand Pour and
Hashim, 2011; Van der Meer et al., 2012;
Honarmand et al., 2011; Sadeghi et al., 2013;
Beiranvand Pour et al., 2013).
Iron oxide and clay minerals alteration maps
were produced by applying 3/1 and 5/7 band
ratios respectively, and consequently
normalized to be in the range of 0-1. The
resultant alteration maps are presented in figure
2. Then, the product of the two alteration maps
was calculated using the band math tool in the
ENVI software which represents the
simultaneous occurrence of the iron oxide and
clay minerals by higher values. Finally, the
region was categorized based on the probability
of the gold mineralization, as the higher value
the higher promising for Au mineralization.
Journal of Tethys: Vol. 2, No. 3, 228–241 ISSN: 2345–2471 ©2014
Babakan and Oskouei, 2014 232 Available online at http://jtethys.org
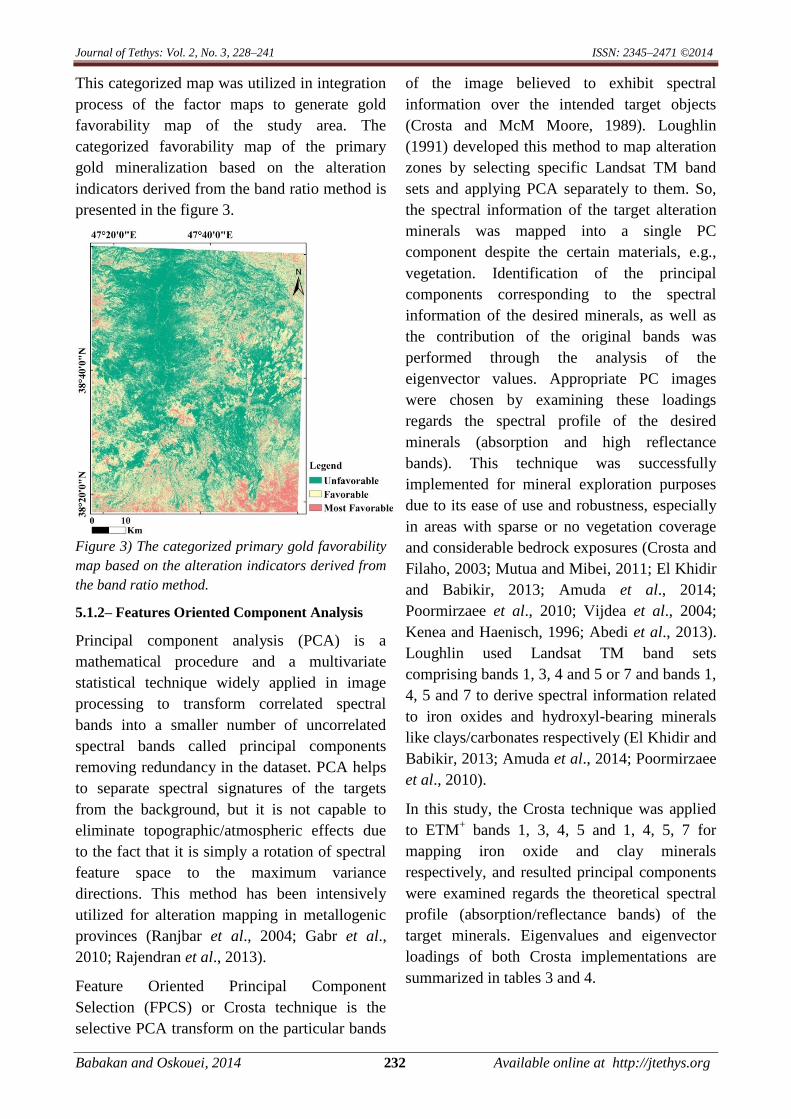
This categorized map was utilized in integration
process of the factor maps to generate gold
favorability map of the study area. The
categorized favorability map of the primary
gold mineralization based on the alteration
indicators derived from the band ratio method is
presented in the figure 3.
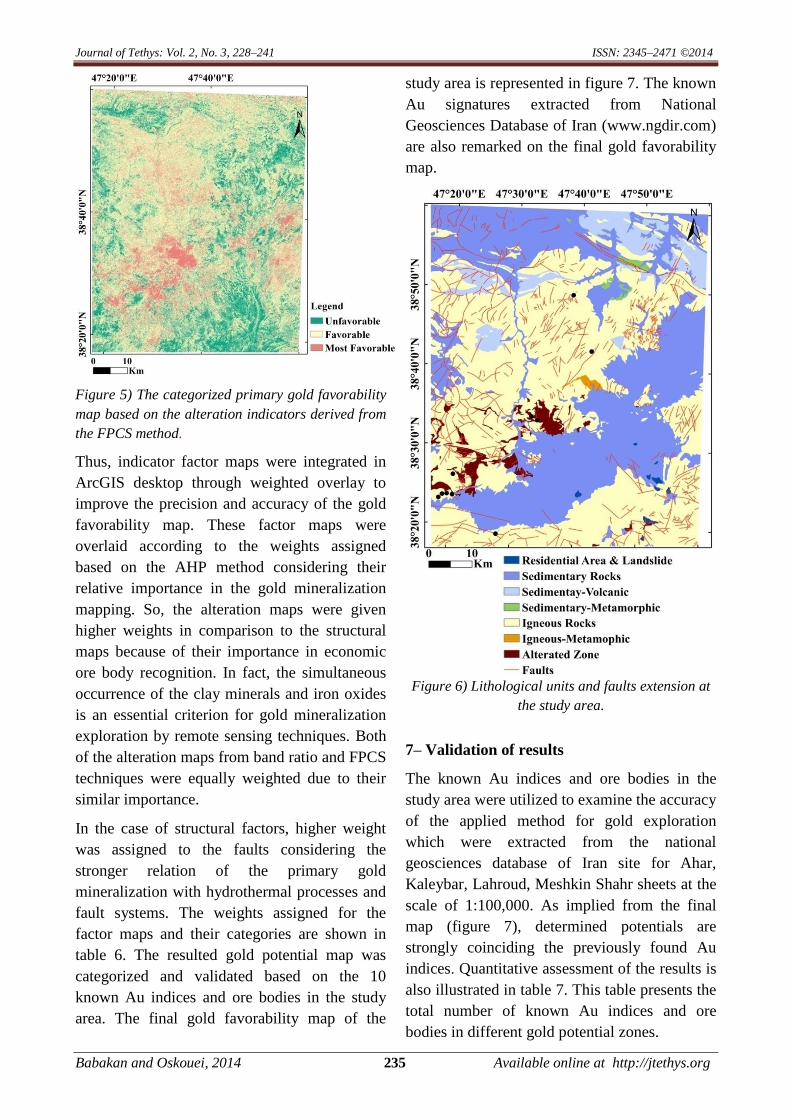
Figure 3) The categorized primary gold favorability
map based on the alteration indicators derived from
the band ratio method.
5.1.2– Features Oriented Component Analysis
Principal component analysis (PCA) is a
mathematical procedure and a multivariate
statistical technique widely applied in image
processing to transform correlated spectral
bands into a smaller number of uncorrelated
spectral bands called principal components
removing redundancy in the dataset. PCA helps
to separate spectral signatures of the targets
from the background, but it is not capable to
eliminate topographic/atmospheric effects due
to the fact that it is simply a rotation of spectral
feature space to the maximum variance
directions. This method has been intensively
utilized for alteration mapping in metallogenic
provinces (Ranjbar et al., 2004; Gabr et al.,
2010; Rajendran et al., 2013).
Feature Oriented Principal Component
Selection (FPCS) or Crosta technique is the
selective PCA transform on the particular bands
of the image believed to exhibit spectral
information over the intended target objects
(Crosta and McM Moore, 1989). Loughlin
(1991) developed this method to map alteration
zones by selecting specific Landsat TM band
sets and applying PCA separately to them. So,
the spectral information of the target alteration
minerals was mapped into a single PC
component despite the certain materials, e.g.,
vegetation. Identification of the principal
components corresponding to the spectral
information of the desired minerals, as well as
the contribution of the original bands was
performed through the analysis of the
eigenvector values. Appropriate PC images
were chosen by examining these loadings
regards the spectral profile of the desired
minerals (absorption and high reflectance
bands). This technique was successfully
implemented for mineral exploration purposes
due to its ease of use and robustness, especially
in areas with sparse or no vegetation coverage
and considerable bedrock exposures (Crosta and
Filaho, 2003; Mutua and Mibei, 2011; El Khidir
and Babikir, 2013; Amuda et al., 2014;
Poormirzaee et al., 2010; Vijdea et al., 2004;
Kenea and Haenisch, 1996; Abedi et al., 2013).
Loughlin used Landsat TM band sets
comprising bands 1, 3, 4 and 5 or 7 and bands 1,
4, 5 and 7 to derive spectral information related
to iron oxides and hydroxyl-bearing minerals
like clays/carbonates respectively (El Khidir and
Babikir, 2013; Amuda et al., 2014; Poormirzaee
et al., 2010).
In this study, the Crosta technique was applied
to ETM+ bands 1, 3, 4, 5 and 1, 4, 5, 7 for
mapping iron oxide and clay minerals
respectively, and resulted principal components
were examined regards the theoretical spectral
profile (absorption/reflectance bands) of the
target minerals. Eigenvalues and eigenvector
loadings of both Crosta implementations are
summarized in tables 3 and 4.
Journal of Tethys: Vol. 2, No. 3, 228–241 ISSN: 2345–2471 ©2014
Babakan and Oskouei, 2014 233 Available online at http://jtethys.org
Table 2) FPCS for iron oxides using ETM+ bands
(1-3-4-7)
PCs PC1 PC2 PC3 PC4
B1 0.37 0.05 0.39 0.84
B3 0.73 0.02 0.44 -0.52
B4 -0.06 -0.99 0.16 0.01
B7 0.58 -0.16 -0.79 0.12
Eigenvalues%
81.78 11.61 5.72 0.89
Table 3) FPCS for clay minerals using ETM+ bands
(1-4-5-7)
PCs PC1 PC2 PC3 PC4
B1 0.34 -0.33 0.8 -0.37
B4 0.02 0.86 0.45 0.24
B5 0.65 0.35 -0.39 -0.55
B7 0.68 -0.19 -0.04 0.71
Eigenvalues%
76.23 16.64 5.94 1.2
According to the loadings of bands 1
(absorption) and 3 (reflectance) in table 3, as
well as the loadings of bands 5 and 7 in table 4,
anomalous desired alteration minerals were then
highlighted by dark pixels in the corresponding
4th
PC components.
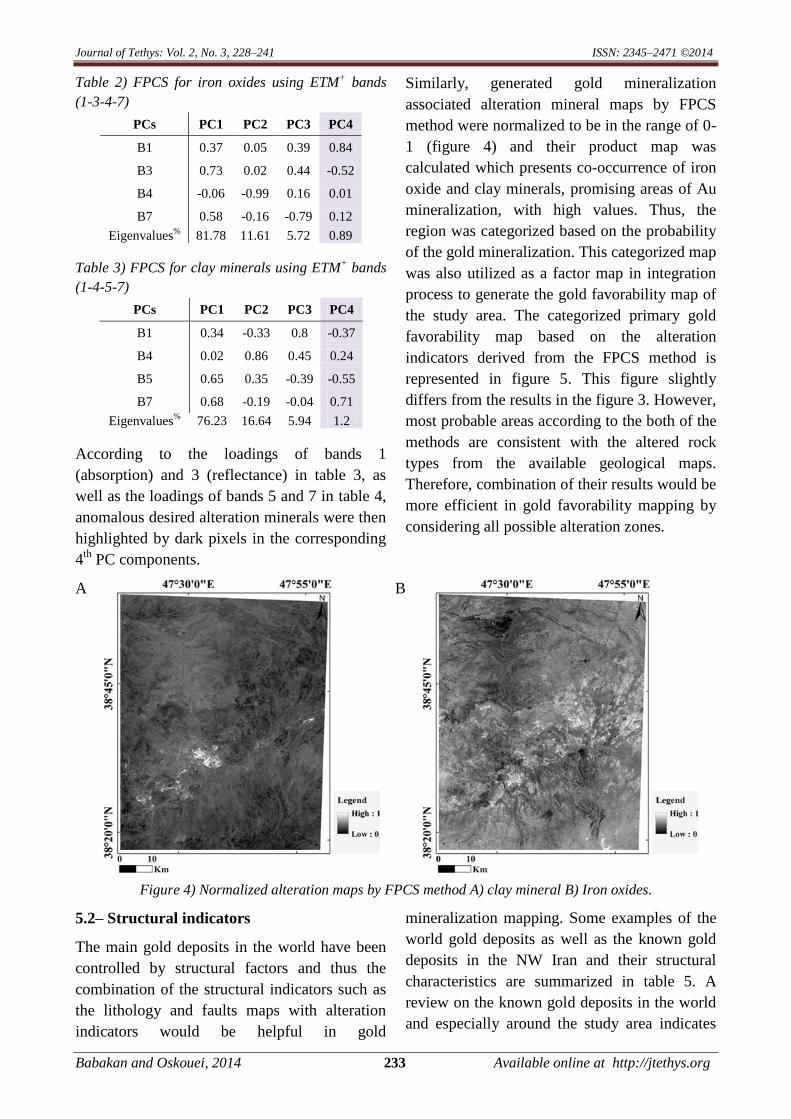
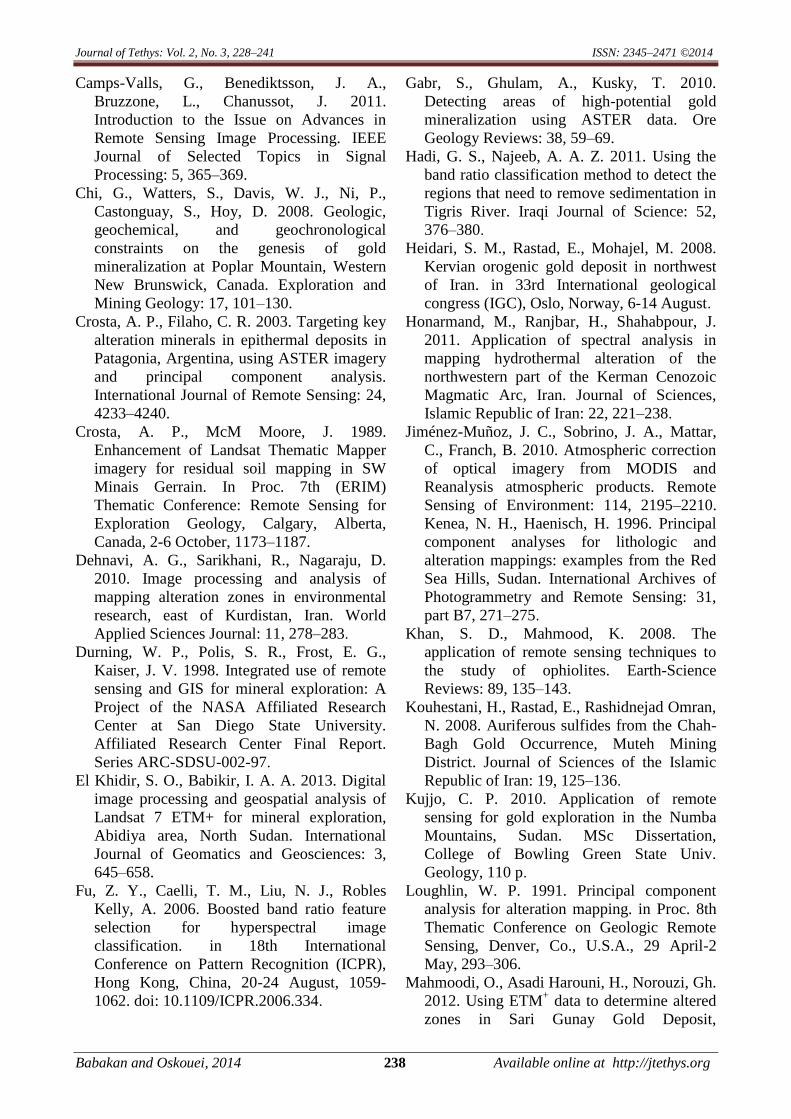
Similarly, generated gold mineralization
associated alteration mineral maps by FPCS
method were normalized to be in the range of 0-
1 (figure 4) and their product map was
calculated which presents co-occurrence of iron
oxide and clay minerals, promising areas of Au
mineralization, with high values. Thus, the
region was categorized based on the probability
of the gold mineralization. This categorized map
was also utilized as a factor map in integration
process to generate the gold favorability map of
the study area. The categorized primary gold
favorability map based on the alteration
indicators derived from the FPCS method is
represented in figure 5. This figure slightly
differs from the results in the figure 3. However,
most probable areas according to the both of the
methods are consistent with the altered rock
types from the available geological maps.
Therefore, combination of their results would be
more efficient in gold favorability mapping by
considering all possible alteration zones.
A
B
Figure 4) Normalized alteration maps by FPCS method A) clay mineral B) Iron oxides.
5.2– Structural indicators
The main gold deposits in the world have been
controlled by structural factors and thus the
combination of the structural indicators such as
the lithology and faults maps with alteration
indicators would be helpful in gold
mineralization mapping. Some examples of the
world gold deposits as well as the known gold
deposits in the NW Iran and their structural
characteristics are summarized in table 5. A
review on the known gold deposits in the world
and especially around the study area indicates
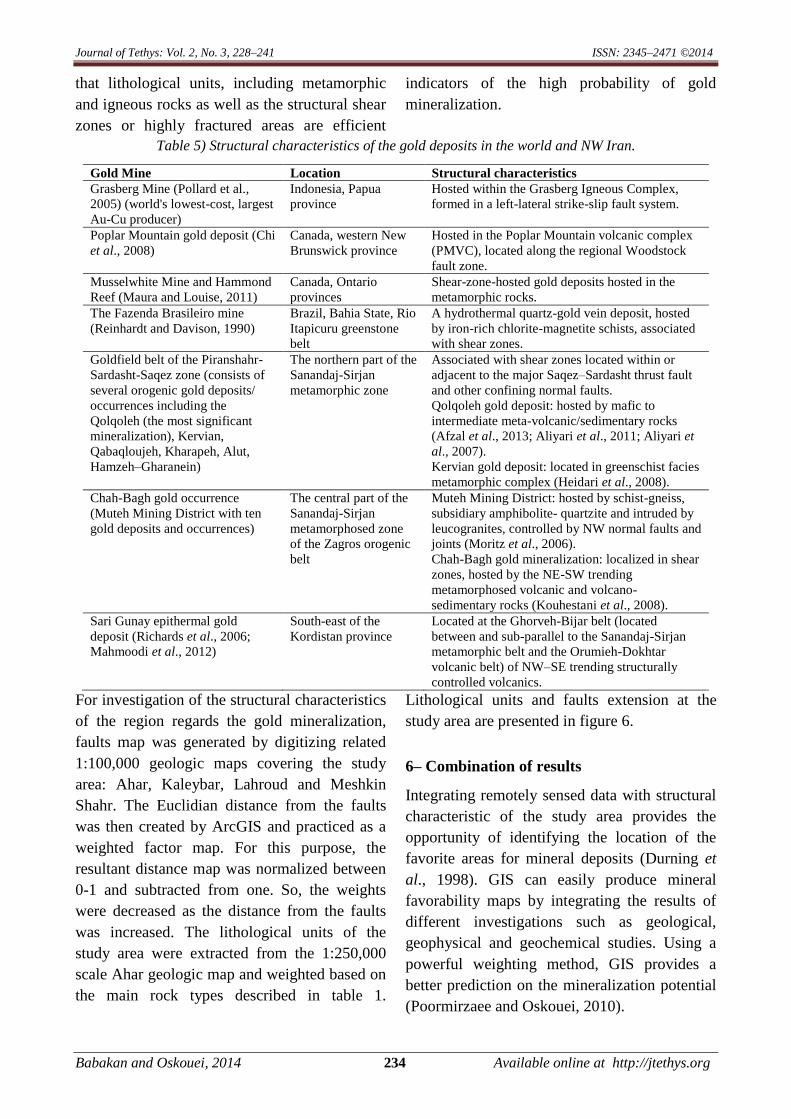
Journal of Tethys: Vol. 2, No. 3, 228–241 ISSN: 2345–2471 ©2014
Babakan and Oskouei, 2014 234 Available online at http://jtethys.org
that lithological units, including metamorphic
and igneous rocks as well as the structural shear
zones or highly fractured areas are efficient
indicators of the high probability of gold
mineralization.
Table 5) Structural characteristics of the gold deposits in the world and NW Iran.
Gold Mine Location Structural characteristics
Grasberg Mine (Pollard et al.,
2005) (world's lowest-cost, largest
Au-Cu producer)
Indonesia, Papua
province Hosted within the Grasberg Igneous Complex,
formed in a left-lateral strike-slip fault system.
Poplar Mountain gold deposit (Chi
et al., 2008)
Canada, western New
Brunswick province
Hosted in the Poplar Mountain volcanic complex
(PMVC), located along the regional Woodstock
fault zone.
Musselwhite Mine and Hammond
Reef (Maura and Louise, 2011)
Canada, Ontario
provinces
Shear-zone-hosted gold deposits hosted in the
metamorphic rocks.
The Fazenda Brasileiro mine
(Reinhardt and Davison, 1990)
Brazil, Bahia State, Rio
Itapicuru greenstone
belt
A hydrothermal quartz-gold vein deposit, hosted
by iron-rich chlorite-magnetite schists, associated
with shear zones.
Goldfield belt of the Piranshahr-
Sardasht-Saqez zone (consists of
several orogenic gold deposits/
occurrences including the
Qolqoleh (the most significant
mineralization), Kervian,
Qabaqloujeh, Kharapeh, Alut,
Hamzeh–Gharanein)
The northern part of the
Sanandaj-Sirjan
metamorphic zone
Associated with shear zones located within or
adjacent to the major Saqez–Sardasht thrust fault
and other confining normal faults.
Qolqoleh gold deposit: hosted by mafic to
intermediate meta-volcanic/sedimentary rocks
(Afzal et al., 2013; Aliyari et al., 2011; Aliyari et
al., 2007).
Kervian gold deposit: located in greenschist facies
metamorphic complex (Heidari et al., 2008).
Chah-Bagh gold occurrence
(Muteh Mining District with ten
gold deposits and occurrences)
The central part of the
Sanandaj-Sirjan
metamorphosed zone
of the Zagros orogenic
belt
Muteh Mining District: hosted by schist-gneiss,
subsidiary amphibolite- quartzite and intruded by
leucogranites, controlled by NW normal faults and
joints (Moritz et al., 2006).
Chah-Bagh gold mineralization: localized in shear
zones, hosted by the NE-SW trending
metamorphosed volcanic and volcano-
sedimentary rocks (Kouhestani et al., 2008).
Sari Gunay epithermal gold
deposit (Richards et al., 2006;
Mahmoodi et al., 2012)
South-east of the
Kordistan province Located at the Ghorveh-Bijar belt (located
between and sub-parallel to the Sanandaj-Sirjan
metamorphic belt and the Orumieh-Dokhtar
volcanic belt) of NW–SE trending structurally
controlled volcanics.
For investigation of the structural characteristics
of the region regards the gold mineralization,
faults map was generated by digitizing related
1:100,000 geologic maps covering the study
area: Ahar, Kaleybar, Lahroud and Meshkin
Shahr. The Euclidian distance from the faults
was then created by ArcGIS and practiced as a
weighted factor map. For this purpose, the
resultant distance map was normalized between
0-1 and subtracted from one. So, the weights
were decreased as the distance from the faults
was increased. The lithological units of the
study area were extracted from the 1:250,000
scale Ahar geologic map and weighted based on
the main rock types described in table 1.
Lithological units and faults extension at the
study area are presented in figure 6.
6– Combination of results
Integrating remotely sensed data with structural
characteristic of the study area provides the
opportunity of identifying the location of the
favorite areas for mineral deposits (Durning et
al., 1998). GIS can easily produce mineral
favorability maps by integrating the results of
different investigations such as geological,
geophysical and geochemical studies. Using a
powerful weighting method, GIS provides a
better prediction on the mineralization potential
(Poormirzaee and Oskouei, 2010).
Journal of Tethys: Vol. 2, No. 3, 228–241 ISSN: 2345–2471 ©2014
Babakan and Oskouei, 2014 235 Available online at http://jtethys.org
Figure 5) The categorized primary gold favorability
map based on the alteration indicators derived from
the FPCS method.
Thus, indicator factor maps were integrated in
ArcGIS desktop through weighted overlay to
improve the precision and accuracy of the gold
favorability map. These factor maps were
overlaid according to the weights assigned
based on the AHP method considering their
relative importance in the gold mineralization
mapping. So, the alteration maps were given
higher weights in comparison to the structural
maps because of their importance in economic
ore body recognition. In fact, the simultaneous
occurrence of the clay minerals and iron oxides
is an essential criterion for gold mineralization
exploration by remote sensing techniques. Both
of the alteration maps from band ratio and FPCS
techniques were equally weighted due to their
similar importance.
In the case of structural factors, higher weight
was assigned to the faults considering the
stronger relation of the primary gold
mineralization with hydrothermal processes and
fault systems. The weights assigned for the
factor maps and their categories are shown in
table 6. The resulted gold potential map was
categorized and validated based on the 10
known Au indices and ore bodies in the study
area. The final gold favorability map of the
study area is represented in figure 7. The known
Au signatures extracted from National
Geosciences Database of Iran (www.ngdir.com)
are also remarked on the final gold favorability
map.
Figure 6) Lithological units and faults extension at
the study area.
7– Validation of results
The known Au indices and ore bodies in the
study area were utilized to examine the accuracy
of the applied method for gold exploration
which were extracted from the national
geosciences database of Iran site for Ahar,
Kaleybar, Lahroud, Meshkin Shahr sheets at the
scale of 1:100,000. As implied from the final
map (figure 7), determined potentials are
strongly coinciding the previously found Au
indices. Quantitative assessment of the results is
also illustrated in table 7. This table presents the
total number of known Au indices and ore
bodies in different gold potential zones.

Journal of Tethys: Vol. 2, No. 3, 228–241 ISSN: 2345–2471 ©2014
Babakan and Oskouei, 2014 236 Available online at http://jtethys.org
Table 6) Weights of the factor maps assigned by AHP method.
Str
uct
ura
l F
act
ors
Factor Maps Weights Classes Scores
Fault Map 22% <760.47 1
760.47-1749.91 3
1749.91-3067.96 5
3067.96-4716.64 7
>4716.64 9
Lithological outcrops 14% Residential Area or Landslide 1
Sedimentary 4
Volcano-sedimentary 5
Sedimentary-Metamorphic 6
Volcanic 7
Volcanic-Metamorphic 8
Altered Zone 9
Alt
era
tio
n F
act
ors
Band Ratio Alteration Map 32% Low 1
Medium 5
High 9
FPCS Alteration Map 32% Low 1
Medium 5
High 9
Figure 7) Final gold favorability map alongside the
known Au indices and ore bodies at the study area.
The last column indicates the frequency ratio
coefficient (FRC) that normalizes this number
with each zone’s area measurement. As implied
from the table, the FRC for the high potential
zone is considerably high and thus emphatically
confirms high performance of the proposed
method for gold mineralization potential
mapping.

Journal of Tethys: Vol. 2, No. 3, 228–241 ISSN: 2345–2471 ©2014
Babakan and Oskouei, 2014 237 Available online at http://jtethys.org
Table 4) Quantitative assessment of the results of Au potential mapping.
Au Potential Number of indices and ore bodies Coverage (Km2) FRC (Number
%/Coverage
%)
Unfavorable 2 1890.33 0.52
Favorable 3 2271.35 0.65
Most Favorable 5 788.43 3.14
8– Conclusions
Current paper was aimed to present the
efficiency of multispectral ETM+ imagery in
primary gold mineralization exploration which
was conducted by integration of different data
layers from different sources. Alteration maps
extracted by band ratio and FPCS methods were
combined with the structural data layers
including lithological units and faults maps in
ArcGIS environment, according to the weights
assigned by the AHP method based on their
relative importance in gold mineralization. The
final gold potential map was validated using the
location of known Au indices and ore bodies
indicating the high performance of the proposed
procedure and representing the overall trend of
mineralization in the field. Therefore, the
application of multispectral remote sensing
techniques in conjunction with the structural
analysis is a reliable method for mineral
exploration. As well, it is rapid and cost
effective in comparison to the other exploration
methods.
Acknowledgments:
The authors would like to thank Prof. A.
Madani and Dr. B. Sadeghi for their appreciate
comments which help us to improve manuscript.
References: Abedi, M., Gholami, A., Norouzi, G.H. 2013. A
stable downward continuation of airborne
magnetic data: A case study for mineral
prospectivity mapping in Central Iran.
Computers and Geosciences: 52, 269–280.
Afzal, P., Dadashzadeh Ahari, H., Rashidnejad
Omran, N., Aliyari, F. 2013. Delineation of
gold mineralised zones using concentration–
volume fractal model in Qolqoleh gold
deposit, NW Iran. Ore Geology Reviews: 55,
125–133.
Aliyari, F., Rastad, E., Mohajjel, M. 2011. Gold
deposits in the Sanandaj–Sirjan zone
orogenic gold deposits or intrusion-related
gold systems. Resource Geology: 62, 296–
315.
Aliyari, F., Rastad, E., Zengqian, H. 2007.
Orogenic gold mineralization in the Qolqoleh
deposit, northwestern Iran. Resource
Geology: 57, 269–282.
Amer, R., Kusky, T., El Mezayen, A. 2012.
Remote sensing detection of gold related
alteration zones in Um Rus area, Central
Eastern Desert of Egypt. Advances in Space
Research: 49, 121–134.
Amuda, A. K., Danbatta, U. A., Najime, T.
2014. Utilisation of Landsat 7 ETM+
multispectral data and ASTERGDEM in
geological investigation and alteration
mapping around Yankara-Dan Sabo-
Takulawa area within Wonaka Schist Belt,
northwestern Nigeria. Journal of
Environmental and Earth Sciences: 4, 44–56.
Bedini, E. 2011. Mineral mapping in the Kap
Simpson Complex, central east Greenland,
using HyMap and ASTER remote sensing
data. Advances in Space Research: 47, 60–
73.
Beiranvand Pour, A., Hashim, M. 2011.
Application of advanced spaceborne thermal
emission and reflection radiometer (ASTER)
data in geological mapping. International
Journal of Physical Sciences: 6, 7657–7668.
Beiranvand Pour, A., Hashim, M., van
Genderen, J. 2013. Detection of
hydrothermal alteration zones in a tropical
region using satellite remote sensing data:
Bau goldfield, Sarawak, Malaysia. Ore
Geology Reviews: 54, 181–196.
Journal of Tethys: Vol. 2, No. 3, 228–241 ISSN: 2345–2471 ©2014
Babakan and Oskouei, 2014 238 Available online at http://jtethys.org
Camps-Valls, G., Benediktsson, J. A.,
Bruzzone, L., Chanussot, J. 2011.
Introduction to the Issue on Advances in
Remote Sensing Image Processing. IEEE
Journal of Selected Topics in Signal
Processing: 5, 365–369.
Chi, G., Watters, S., Davis, W. J., Ni, P.,
Castonguay, S., Hoy, D. 2008. Geologic,
geochemical, and geochronological
constraints on the genesis of gold
mineralization at Poplar Mountain, Western
New Brunswick, Canada. Exploration and
Mining Geology: 17, 101–130.
Crosta, A. P., Filaho, C. R. 2003. Targeting key
alteration minerals in epithermal deposits in
Patagonia, Argentina, using ASTER imagery
and principal component analysis.
International Journal of Remote Sensing: 24,
4233–4240.
Crosta, A. P., McM Moore, J. 1989.
Enhancement of Landsat Thematic Mapper
imagery for residual soil mapping in SW
Minais Gerrain. In Proc. 7th (ERIM)
Thematic Conference: Remote Sensing for
Exploration Geology, Calgary, Alberta,
Canada, 2-6 October, 1173–1187.
Dehnavi, A. G., Sarikhani, R., Nagaraju, D.
2010. Image processing and analysis of
mapping alteration zones in environmental
research, east of Kurdistan, Iran. World
Applied Sciences Journal: 11, 278–283.
Durning, W. P., Polis, S. R., Frost, E. G.,
Kaiser, J. V. 1998. Integrated use of remote
sensing and GIS for mineral exploration: A
Project of the NASA Affiliated Research
Center at San Diego State University.
Affiliated Research Center Final Report.
Series ARC-SDSU-002-97.
El Khidir, S. O., Babikir, I. A. A. 2013. Digital
image processing and geospatial analysis of
Landsat 7 ETM+ for mineral exploration,
Abidiya area, North Sudan. International
Journal of Geomatics and Geosciences: 3,
645–658.
Fu, Z. Y., Caelli, T. M., Liu, N. J., Robles
Kelly, A. 2006. Boosted band ratio feature
selection for hyperspectral image
classification. in 18th International
Conference on Pattern Recognition (ICPR),
Hong Kong, China, 20-24 August, 1059-
1062. doi: 10.1109/ICPR.2006.334.
Gabr, S., Ghulam, A., Kusky, T. 2010.
Detecting areas of high-potential gold
mineralization using ASTER data. Ore
Geology Reviews: 38, 59–69.
Hadi, G. S., Najeeb, A. A. Z. 2011. Using the
band ratio classification method to detect the
regions that need to remove sedimentation in
Tigris River. Iraqi Journal of Science: 52,
376–380.
Heidari, S. M., Rastad, E., Mohajel, M. 2008.
Kervian orogenic gold deposit in northwest
of Iran. in 33rd International geological
congress (IGC), Oslo, Norway, 6-14 August.
Honarmand, M., Ranjbar, H., Shahabpour, J.
2011. Application of spectral analysis in
mapping hydrothermal alteration of the
northwestern part of the Kerman Cenozoic
Magmatic Arc, Iran. Journal of Sciences,
Islamic Republic of Iran: 22, 221–238.
Jiménez-Muñoz, J. C., Sobrino, J. A., Mattar,
C., Franch, B. 2010. Atmospheric correction
of optical imagery from MODIS and
Reanalysis atmospheric products. Remote
Sensing of Environment: 114, 2195–2210.
Kenea, N. H., Haenisch, H. 1996. Principal
component analyses for lithologic and
alteration mappings: examples from the Red
Sea Hills, Sudan. International Archives of
Photogrammetry and Remote Sensing: 31,
part B7, 271–275.
Khan, S. D., Mahmood, K. 2008. The
application of remote sensing techniques to
the study of ophiolites. Earth-Science
Reviews: 89, 135–143.
Kouhestani, H., Rastad, E., Rashidnejad Omran,
N. 2008. Auriferous sulfides from the Chah-
Bagh Gold Occurrence, Muteh Mining
District. Journal of Sciences of the Islamic
Republic of Iran: 19, 125–136.
Kujjo, C. P. 2010. Application of remote
sensing for gold exploration in the Numba
Mountains, Sudan. MSc Dissertation,
College of Bowling Green State Univ.
Geology, 110 p.
Loughlin, W. P. 1991. Principal component
analysis for alteration mapping. in Proc. 8th
Thematic Conference on Geologic Remote
Sensing, Denver, Co., U.S.A., 29 April-2
May, 293–306.
Mahmoodi, O., Asadi Harouni, H., Norouzi, Gh.
2012. Using ETM+ data to determine altered
zones in Sari Gunay Gold Deposit,

Journal of Tethys: Vol. 2, No. 3, 228–241 ISSN: 2345–2471 ©2014
Babakan and Oskouei, 2014 239 Available online at http://jtethys.org
Kordestan. in 1st Iranian Mining
Technologies Conference and Exhibition
(IMT2012), Yazd, Iran, 5-7 September, 276–
283.
Mather, P. M., Koch, M. 2010. Preprocessing of
remotely-sensed data, in: Computer
processing of remotely-sensed images: an
introduction. fourth ed. New York, Wiley,
pp. 87–125.
Maura, K., Louise, H. M. 2011. Microstructural
control of gold mineralization in shear–zone-
hosted gold deposits: examples from the
superior province of northwestern Ontario. in
Proc. Northeastern (46th Annual) and North-
Central (45th Annual) Joint Meeting,
Pittburgh, Pennsylvania, U.S.A., 20–22
March. doi: 10.2113/gsecongeo. 85.5.952.
Moghtaderi, A., Moore, F., Mohammadzadeh,
A. 2007. The application of advanced space-
borne thermal emission and reflection
(ASTER) radiometer data in the detection of
alteration in the Chadormalu paleocrater,
Bafq region, Central Iran. Journal of Asian
Earth Sciences: 30, 238–252.
Moritz, R., Ghazban, F., Singer, B. S. 2006.
Eocene gold ore formation at Muteh,
Sanandaj-Sirjan tectonic zone, western Iran:
a result of late-stage extension and
exhumation of metamorphic basement rocks
within the Zagros Orogen. Economic
Geology: 101, 1497–1524.
Mutua, J., Mibei, G. 2011. Remote sensing
application in geothermal exploration: case
study of Barrier Volcanic Complex, Kenya.
Geothermal Resources Council Transactions:
35, 943–947.
Oskouei, M. M., Busch, W. 2008. A
geostatistically based preprocessing
algorithm for hyperspectral data analysis.
GIScience and Remote Sensing: 45, 356–
368.
Pollard, P. J., Taylor, R. G., Peters, L. 2005.
Ages of intrusion, alteration and
mineralization at the Grasberg Cu-Au
deposit, Papua, Indonesia. Economic
Geology: 100, 1005–1020.
Poormirzaee, R., Mohamadzade, M. J., Naseri,
A., Zekri, H. 2010. Interpretation and
Processing of ETM+ Data for Alteration
Mapping, A Case Study: Behabad, Iran. in
Proc. 5th IASME/ WSEAS, International
Conference on Water Resources, Hydraulics
and Hydrology (WHH'10), Proc. of the 4th
IASME/WSEAS, International Conference
on Geology and Seismology (GES '10),
University of Cambridge, UK, 23-25
February.
Poormirzaee, R., Oskouei, M. M. 2010. Use of
spectral analysis for detection of alterations
in ETM data, Yazd, Iran. Applied Geomatics:
2, 147–154.
Rajendran, S., Nasir, S., Kusky, T. M., Ghulam,
A., Gabr, S., El-Ghali, M. A. K. 2013.
Detection of hydrothermal mineralized zones
associated with listwaenites in Central Oman
using ASTER data. Ore Geology Reviews:
53, 470–488.
Ranjbar, H., Honarmand, M., Moezifar, Z.
2004. Application of the Crosta technique for
porphyry copper alteration mapping, using
ETM+ data in the southern part of the Iranian
volcanic sedimentary belt. Journal of Asian
Earth Sciences: 24, 237–243.
Reinhardt, M. C., Davison, I. 1990. Structural
and lithologic controls on gold deposition in
the shear zone-hosted Fazenda Brasileiro
Mine, Bahia State, Northeast Brazil.
Economic Geology: 85, 952–967.
Richards, J. P., Wilkinson, D., Ullrich, T. 2006.
Geology of the sari gunay epithermal gold
deposit, northwest Iran. Economic Geology:
101, 1455–1496.
Sadeghi, B., Khalajmasoumi, M., Afzal, P.,
Moarefvand, P., Yarebi, A.B., Wetherelt, A.,
Foster, P., Ziazarifi, A. 2013. Using ETM+
and ASTER sensors to identify iron
occurrences in the Esfordi 1:100,000
mapping sheet of Central Iran. Journal of
African Earth Sciences: 85, 103–114.
San, B. T., Sumer, E. O., Gurcay, B. 2004.
Comparison of band ratioing and spectral
indices methods for detecting alunite and
kaolinite minerals using aster data in Biga
region, Turkey, in Proc. 20th ISPRS
Congress: 35, Part B7, Technical
Commission VII, Istanbul, Turkey, 12-23
July.
Shalaby, M. H., Bishta, A. Z., Roz, M. E., El
Zalaky, M. A. 2010. Integration of geologic
and remote sensing studies for the discovery
of uranium mineralization in some granite
plutons, Eastern Desert, Egypt. Journal of
King Abdulaziz University: Earth Sciences:
21, 1–25.
Journal of Tethys: Vol. 2, No. 3, 228–241 ISSN: 2345–2471 ©2014
Babakan and Oskouei, 2014 240 Available online at http://jtethys.org
van der Meer, F. D., van der Werff, H. M. A.,
van Ruitenbeek, F. J. A., Hecker, C. A.,
Bakker, W. H., Noomen, M. F., van der
Meijde, M., Carranza, E. J. M., de Smeth, J.
B., Woldai, T. 2012. Multi-and hyperspectral
geologic remote sensing: a review.
International Journal of Applied Earth
Observation and Geoinformation: 14, 112–
128.
Vijdea, A. M., Sommer, S., Mehl, W. 2004. Use
of remote sensing for mapping and
evaluation of mining waste anomalies at
national to multi-country scale, A case study
to integrate remote sensing information with
thematic data layers and national inventories
on mining features in pre-accession
countries. Joint Research Centre of the
European Commission, Ispra, EUR 21185
EN.
Wang, G., Nunez, M. 1992. A new method of
estimating path radiance for band ratio
application. International Journal of Remote
Sensing: 13, 527–539.
Zhang, X., Pazner, M., Duke, N. 2007.
Lithologic and mineral information
extraction for gold exploration using ASTER
data in the south Chocolate Mountains
(California). ISPRS Journal of
Photogrammetry and Remote Sensing: 62,
271–282.
Zhang, Y., Yang, J., Yao, F. 2007. The
potentials of multi-spectral remote sensing
techniques for mineral prognostication -
taking Mongolian Oyu Tolgoi Cu-Au deposit
as an example. Earth Science Frontiers: 14,
63–69.
Zoheir, B., Emam A. 2012. Integrating geologic
and satellite imagery data for high-resolution
mapping and gold exploration targets in the
South Eastern Desert, Egypt. Journal of
African Earth Sciences: 66–67, 22–34.
Received: 03 April 2013 / Accepted: 30
August 2014 / Published online: 07
September 2014
EDITOR–IN–CHIEF:
Dr. Vahid Ahadnejad:
Payame Noor University, Department of
Geology.PO BOX 13395–3697, Tehran, Iran.
E–Mail: [email protected]
EDITORIAL BOARD:
Dr. Jessica Kind:
ETH Zürich Institut für Geophysik, NO H11.3,
Sonneggstrasse 5, 8092 Zürich, Switzerland
E–Mail: [email protected]
Prof. David Lentz University of New Brunswick, Department of
Earth Sciences, Box 4400, 2 Bailey Drive
Fredericton, NB E3B 5A3, Canada
E–Mail: [email protected]
Dr. Anita Parbhakar–Fox
School of Earth Sciences, University of
Tasmania, Private Bag 126, Hobart 7001,
Australia
E–Mail: [email protected]
Prof. Roberto Barbieri
Dipartimento di Scienzedella Terra e
Geoambientali, Università di Bologna, Via
Zamboni 67 – 40126, Bologna, Italy
E–Mail: [email protected]
Dr. Anne–Sophie Bouvier
Faculty of Geosciences and Environment,
Institut des science de la Terre, Université
deLausanne, Office: 4145.4, CH–1015
Lausann, Switzerland
E–Mail: Anne–[email protected]
Dr. Matthieu Angeli
The Faculty of Mathematics and Natural
Sciences, Department of Geosciences,
University of Oslo
Postboks 1047 Blindern, 0316 OSLO, Norway
E–Mail: [email protected]
Dr. Miloš Gregor
Geological Institute of DionysStur,
MlynskaDolina, Podjavorinskej 597/15
DubnicanadVahom, 01841, Slovak Republic
E–Mail: [email protected]
Dr. Alexander K. Stewart
Department of Geology, St. Lawrence
University, Canton, NY, USA
E–mail: [email protected]
Dr. Cristina C. Bicalho
Journal of Tethys: Vol. 2, No. 3, 228–241 ISSN: 2345–2471 ©2014
Babakan and Oskouei, 2014 241 Available online at http://jtethys.org
Environmental Geochemistry, Universidade
Federal Fluminense – UFF, Niteroi–RJ, Brazil
E–mail: [email protected]
Dr. Lenka Findoráková
Institute of Geotechnics, Slovak Academy of
Sciences, Watsonova 45,043 53 Košice, Slovak
Republic
E–Mail: [email protected]
Dr. Mohamed Omran M. Khalifa
Geology Department, Faculty of Science, South
Valley, Qena, 83523, Egypt
E–Mail: [email protected]
Prof. A. K. Sinha
D.Sc. (Moscow), FGS (London). B 602,
VigyanVihar, Sector 56, GURGAON 122011,
NCR DELHI, Haryana
E–Mail: [email protected]