Embed Size (px)
Citation preview

1
INTEGRATED REPORTAND FINANCIAL STATEMENTS 2017
REGULATED BY THE CENTRAL BANK OF KENYA
KCB INTEGRATED REPORT AND FINANCIAL STATEMENTS | 2017
2

3
About this Report 4
KCB at a glance 5
Our purpose and values 6
Our distribution 7
Our value creation process 8
Our stakeholders 9
Value added statement 10
Our material issues 11
Operating environment 12 – 17
Risk management 18 – 21
Group Chairman’s statement 22 – 23
Taarifa ya Mwenyekiti 24 - 25
Interview with Group CEO and MD 26 – 27
Mahojiano na Mkurugenzi Mkuu Mtendaji wa Kundi 28 – 29
Group Board of Directors 30 – 31
Executive Committee 32 – 33
Our Strategy 34 – 35
Five-Year Review 36
Financial highlights 37
Report from the CFO 38 – 39
Business Review 40 – 46
Our digital journey 47
Sustainability Review 48 – 53
Statement of corporate governance 54 – 59
Shareholding 60
Financial statement and Notes 61
TABLE OF CONTENTS
KCB INTEGRATED REPORT AND FINANCIAL STATEMENTS | 2017
4
Our journeyThe 2017 Integrated Report takes us through the journey of KCB Group during the year, by detailing operational highlights that contributed to the growth of the business, and a review showing how specific units performed.
The report provides an opportunity for the Group to evaluate and report on its progress, successes, challenges, plans and strategies.
It is prepared for existing and prospective investors, but also for other stakeholders as part of our commitment to transparency and accountability. Our success is underpinned by the ability to deliver value to stakeholders. This is anchored on a keen interest to deliver shared value through sustainable banking practices. The Group draws resources from the broader society, as characterized by the six capital model (human, financial, intellectual, manufactured, natural and social and relationship capital) and utilizes these resources to create value for stakeholders. Our purpose is to simplify your world to enable your progress. In this regard, the Group operates in true adherence to its corporate values of being Inspiring, Simple and Friendly. To deliver on this, we always endeavor to work towards enriching our customer experience.
Our frameworkThe Group has a framework for taking a holistic and considered approach in delivering shareholder returns while responding to stakeholders’ needs. Performance is measured against strategic objectives and stakeholders’ needs. The report provides data to support the Group’s performance.
The materiality determinationThe annual integrated report aims to present a balanced and succinct analysis of the Group’s strategy, performance, governance and prospects. Potential material matters were identified through a broad range of processes, from engagement with our stakeholders to our own internal processes such as risk assessments and considering international trends.
An issue is considered material if it is likely to impact KCB’s ability to achieve its strategy, to remain commercially sustainable and to be socially relevant. In particular, material issues are those that have a strong bearing on the assessment of stakeholders on the extent to which the Group can fulfil their needs over the long term. The KCB Group takes into account the factors that affect the economic growth and social stability of the regions in which it operates.
Basis for preparation and presentation frameworks appliedThis report has been prepared with guidance from the International Integrated Reporting Framework. The Board of Directors (the Board) and management have considered the fundamental concepts, guiding principles and content elements recommended in the Framework and has endeavoured to apply these recommendations in the report. This report is aligned to the parameters of the Kenya Companies Act 2015, guidelines issued by the Capital Markets Authority, the Nairobi Securities Exchange (NSE) Listings Manual, and the Central Bank of Kenya’s Prudential Guidelines. The Group Annual Financial Statements were prepared in accordance with International Financial Reporting Standards (IFRS).
PurposeThe purpose of this report is to provide our stakeholders with concise communication about the Group in the context of the internal and external environment, as well as our ability to create value over the short, medium and long term.
Primary audienceIntegrated reports are prepared primarily for the providers of capital to help inform their decision-making regarding financial capital allocations. Matters not related to finance or governance also impact on the ability of KCB Group to create value over the short, medium and long term. These matters, be they social or environmental, are of interest to other stakeholders and, were considered material, are addressed herein.
Preparation and presentationKCB Group 2017 integrated report has been prepared for the period 1 January 2017 to 31 December 2017 and covers the activities of KCB Group Plc, its subsidiary companies, its divisions and key strategic investments.
The executive directors and senior management were instrumental in the preparation of this report.
AssuranceThe Group Annual Financial Statements were audited by KPMG Kenya, save for KCB Uganda and KCB Tanzania which were audited by Price Waterhouse Coopers (PwC) and Burundi which was audited by Deloitte.
ABOUT THIS REPORT
The Group has a framework for
taking a holistic and considered
approach in delivering
shareholder returns while responding to stakeholders’
needs.”
5
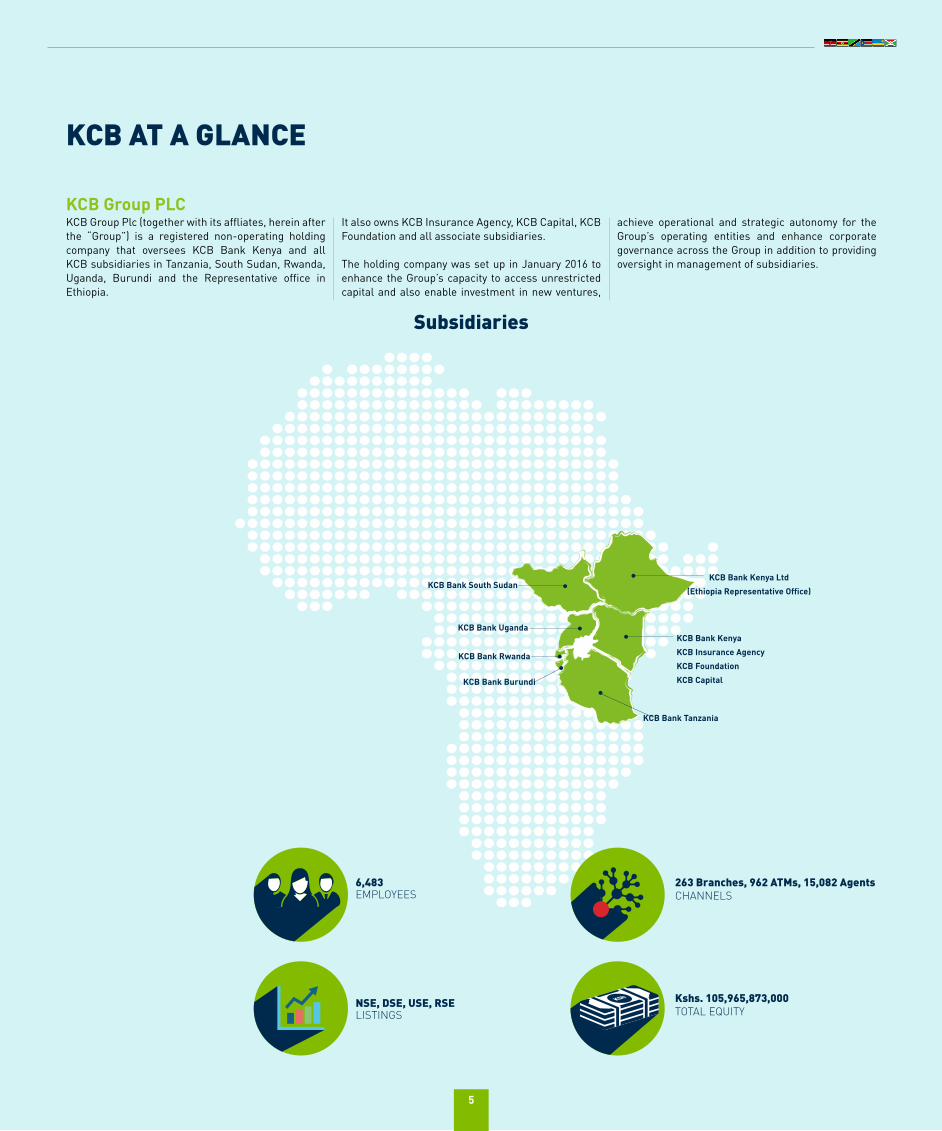
KCB AT A GLANCE
Subsidiaries
KCB Bank Kenya
KCB Insurance Agency
KCB Foundation
KCB Capital
KCB Bank Kenya Ltd
(Ethiopia Representative Office)
6,483EMPLOYEES
KCB Bank Uganda
KCB Bank Rwanda
KCB Bank Burundi
KCB Bank Tanzania
KCB Bank South Sudan
NSE, DSE, USE, RSELISTINGS
263 Branches, 962 ATMs, 15,082 AgentsCHANNELS
Kshs. 105,965,873,000TOTAL EQUITY
KCB Group PLC
5
KCB Group Plc (together with its affliates, herein after the “Group”) is a registered non-operating holding company that oversees KCB Bank Kenya and all KCB subsidiaries in Tanzania, South Sudan, Rwanda, Uganda, Burundi and the Representative office in Ethiopia.
It also owns KCB Insurance Agency, KCB Capital, KCB Foundation and all associate subsidiaries.
The holding company was set up in January 2016 to enhance the Group’s capacity to access unrestricted capital and also enable investment in new ventures,
achieve operational and strategic autonomy for the Group’s operating entities and enhance corporate governance across the Group in addition to providing oversight in management of subsidiaries.

KCB INTEGRATED REPORT AND FINANCIAL STATEMENTS | 2017
6
OUR PURPOSE AND VALUES
Our Values• Inspiring• Simple• Friendly
Our PurposeSimplifying your world to
enable your progress
Our PromiseGo ahead
Our Behaviour• I am a leader• I find solutions• I drive efficiency• I simplify work• I listen and care• I am positive and committed
KCB INTEGRATED REPORT AND FINANCIAL STATEMENTS | 2017
6
7
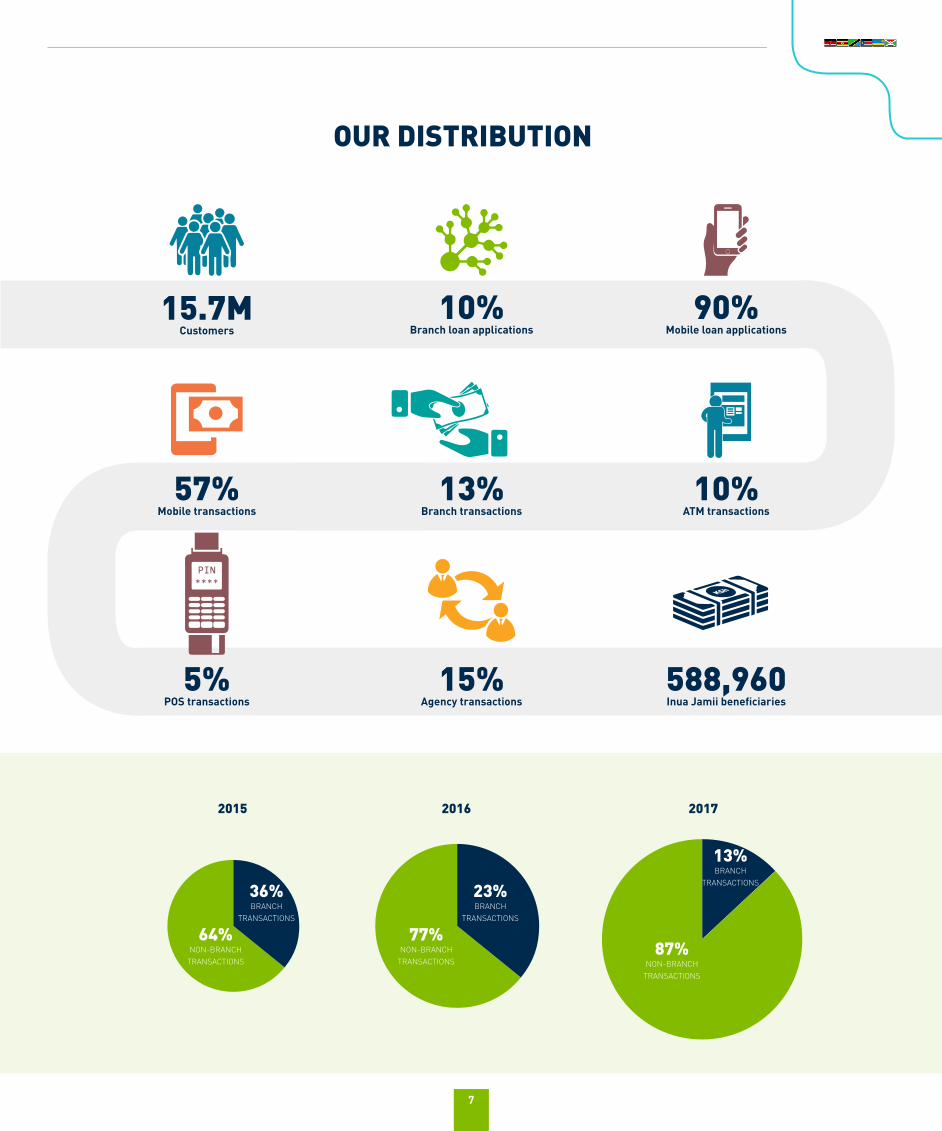
OUR DISTRIBUTION
20162015 2017
15.7MCustomers
57%Mobile transactions
10%Branch loan applications
5%POS transactions
588,960Inua Jamii beneficiaries
10%ATM transactions
90%Mobile loan applications
15%Agency transactions
13%Branch transactions
13%BRANCH
TRANSACTIONS
87%NON-BRANCH
TRANSACTIONS
77%NON-BRANCH
TRANSACTIONS
64%NON-BRANCH
TRANSACTIONS
23%BRANCH
TRANSACTIONS
36%BRANCH
TRANSACTIONS
7
KCB INTEGRATED REPORT AND FINANCIAL STATEMENTS | 2017
8
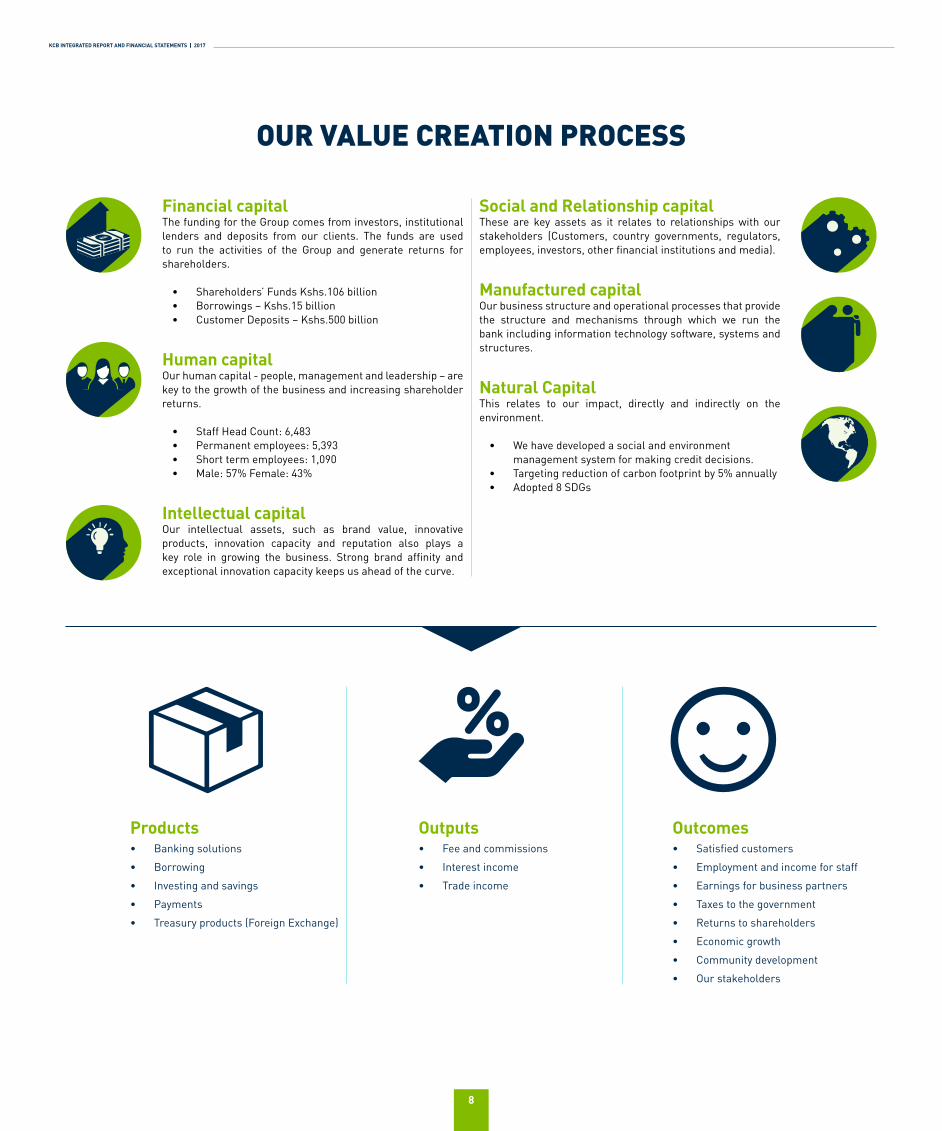
OUR VALUE CREATION PROCESS
Financial capitalThe funding for the Group comes from investors, institutional lenders and deposits from our clients. The funds are used to run the activities of the Group and generate returns for shareholders.
• Shareholders’ Funds Kshs.106 billion• Borrowings – Kshs.15 billion• Customer Deposits – Kshs.500 billion
Human capitalOur human capital - people, management and leadership – are key to the growth of the business and increasing shareholder returns.
• Staff Head Count: 6,483• Permanent employees: 5,393• Short term employees: 1,090• Male: 57% Female: 43%
Intellectual capitalOur intellectual assets, such as brand value, innovative products, innovation capacity and reputation also plays a key role in growing the business. Strong brand affinity and exceptional innovation capacity keeps us ahead of the curve.
Social and Relationship capitalThese are key assets as it relates to relationships with our stakeholders (Customers, country governments, regulators, employees, investors, other financial institutions and media).
Manufactured capitalOur business structure and operational processes that provide the structure and mechanisms through which we run the bank including information technology software, systems and structures.
Natural CapitalThis relates to our impact, directly and indirectly on the environment.
• We have developed a social and environment management system for making credit decisions.
• Targeting reduction of carbon footprint by 5% annually• Adopted 8 SDGs
Outcomes• Satisfied customers
• Employment and income for staff
• Earnings for business partners
• Taxes to the government
• Returns to shareholders
• Economic growth
• Community development
• Our stakeholders
Outputs• Fee and commissions
• Interest income
• Trade income
Products• Banking solutions
• Borrowing
• Investing and savings
• Payments
• Treasury products (Foreign Exchange)
9
OUR STAKEHOLDERS
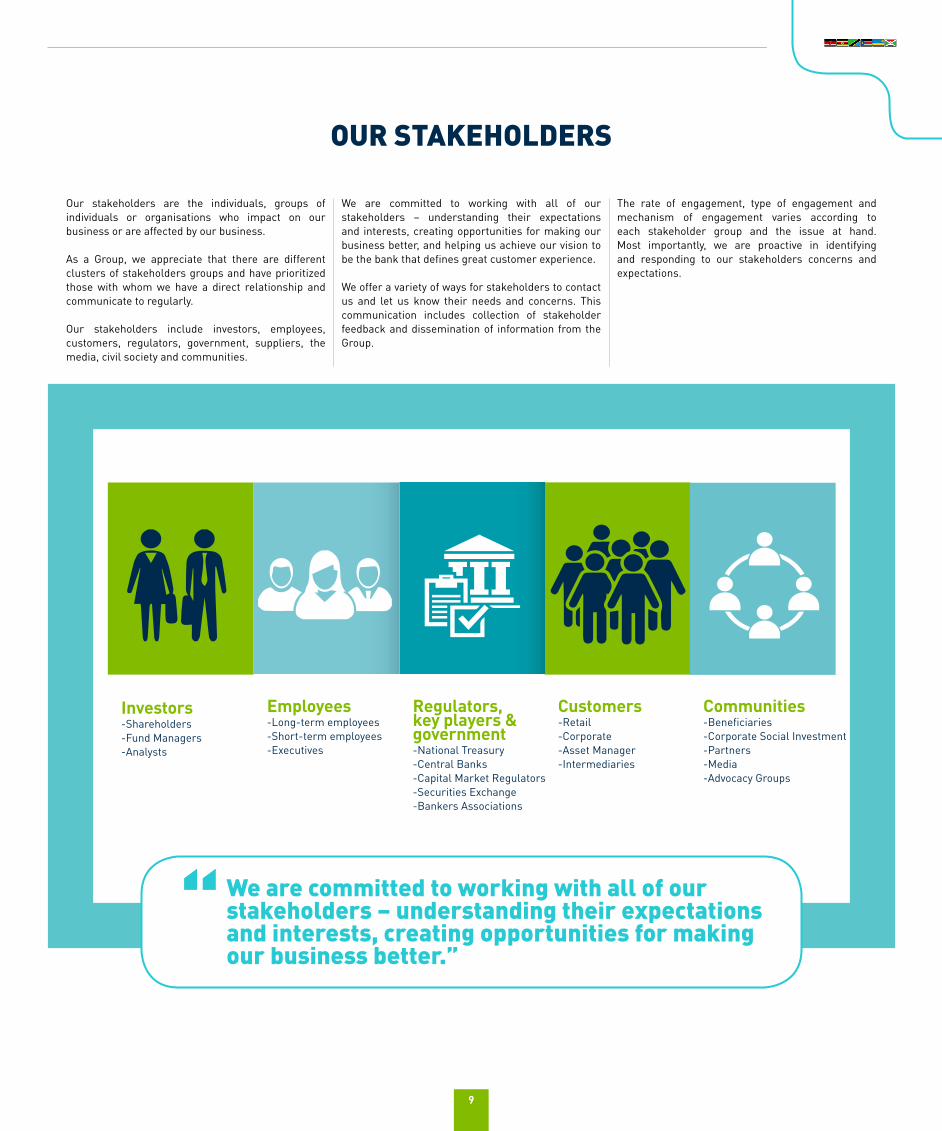
Our stakeholders are the individuals, groups of individuals or organisations who impact on our business or are affected by our business.
As a Group, we appreciate that there are different clusters of stakeholders groups and have prioritized those with whom we have a direct relationship and communicate to regularly.
Our stakeholders include investors, employees, customers, regulators, government, suppliers, the media, civil society and communities.
We are committed to working with all of our stakeholders – understanding their expectations and interests, creating opportunities for making our business better, and helping us achieve our vision to be the bank that defines great customer experience.
We offer a variety of ways for stakeholders to contact us and let us know their needs and concerns. This communication includes collection of stakeholder feedback and dissemination of information from the Group.
The rate of engagement, type of engagement and mechanism of engagement varies according to each stakeholder group and the issue at hand. Most importantly, we are proactive in identifying and responding to our stakeholders concerns and expectations.
Investors-Shareholders-Fund Managers-Analysts
Employees-Long-term employees-Short-term employees-Executives
Regulators, key players & government-National Treasury-Central Banks-Capital Market Regulators-Securities Exchange-Bankers Associations
Customers-Retail-Corporate-Asset Manager-Intermediaries
Communities-Beneficiaries-Corporate Social Investment -Partners-Media-Advocacy Groups
We are committed to working with all of our stakeholders – understanding their expectations and interests, creating opportunities for making our business better.”
KCB INTEGRATED REPORT AND FINANCIAL STATEMENTS | 2017
10
VALUE ADDED STATEMENT
2017 2016 2015 2014 2013
VALUE ADDED Kshs. million Kshs. million Kshs. million Kshs. million Kshs. million
Interest Income,Fees,Commission and Other Revenues 86,673 85,256 76,175 66,771 56,492
Interest Paid to Depositors and Cost of Other Services (33,205) (34,454) (29,801) (25,447) (19,289)
Interest paid on borrowings (2,126) (1,298) (1,852) (894) (758)
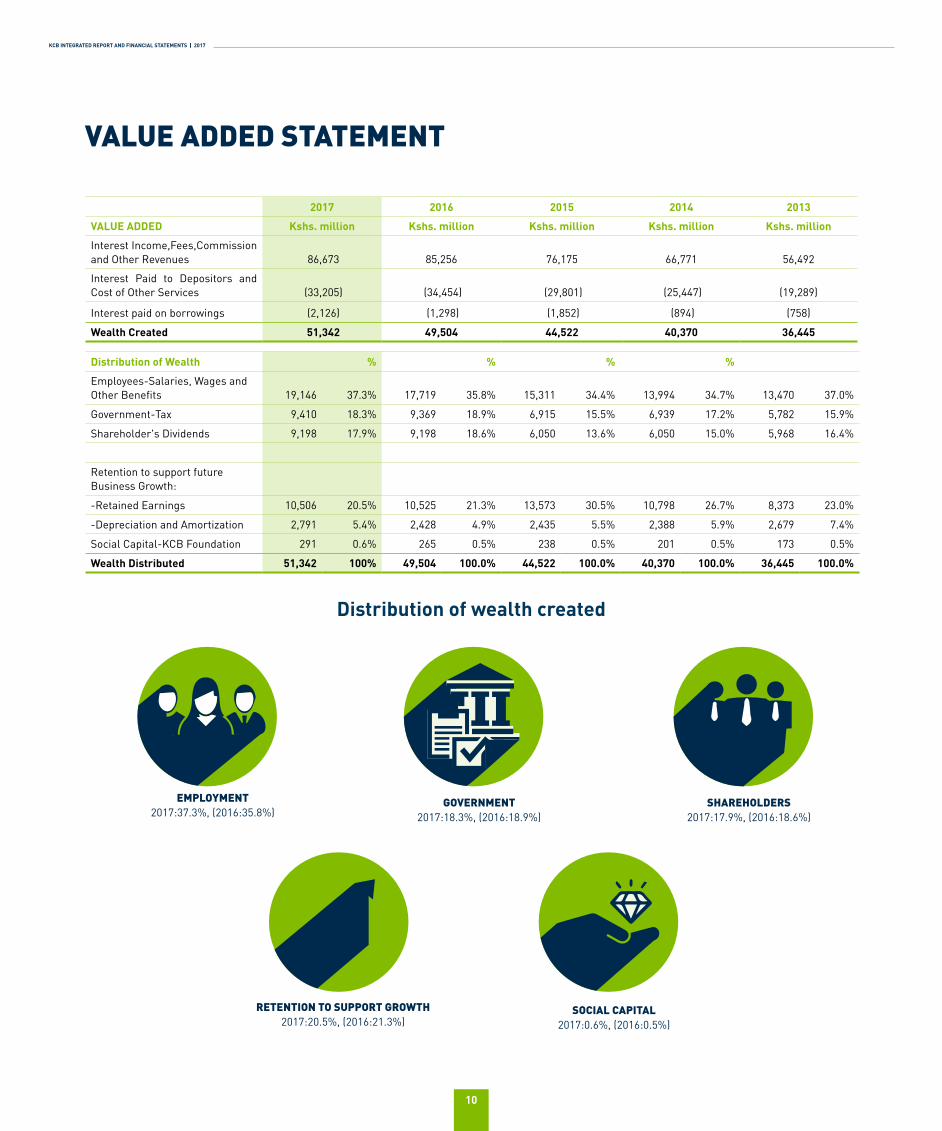
Wealth Created 51,342 49,504 44,522 40,370 36,445
Distribution of Wealth % % % %
Employees-Salaries, Wages and Other Benefits 19,146 37.3% 17,719 35.8% 15,311 34.4% 13,994 34.7% 13,470 37.0%
Government-Tax 9,410 18.3% 9,369 18.9% 6,915 15.5% 6,939 17.2% 5,782 15.9%
Shareholder's Dividends 9,198 17.9% 9,198 18.6% 6,050 13.6% 6,050 15.0% 5,968 16.4%
Retention to support future Business Growth:
-Retained Earnings 10,506 20.5% 10,525 21.3% 13,573 30.5% 10,798 26.7% 8,373 23.0%
-Depreciation and Amortization 2,791 5.4% 2,428 4.9% 2,435 5.5% 2,388 5.9% 2,679 7.4%
Social Capital-KCB Foundation 291 0.6% 265 0.5% 238 0.5% 201 0.5% 173 0.5%
Wealth Distributed 51,342 100% 49,504 100.0% 44,522 100.0% 40,370 100.0% 36,445 100.0%
EMPLOYMENT2017:37.3%, (2016:35.8%)
GOVERNMENT2017:18.3%, (2016:18.9%)
SOCIAL CAPITAL2017:0.6%, (2016:0.5%)
RETENTION TO SUPPORT GROWTH2017:20.5%, (2016:21.3%)
SHAREHOLDERS2017:17.9%, (2016:18.6%)
Distribution of wealth created
11
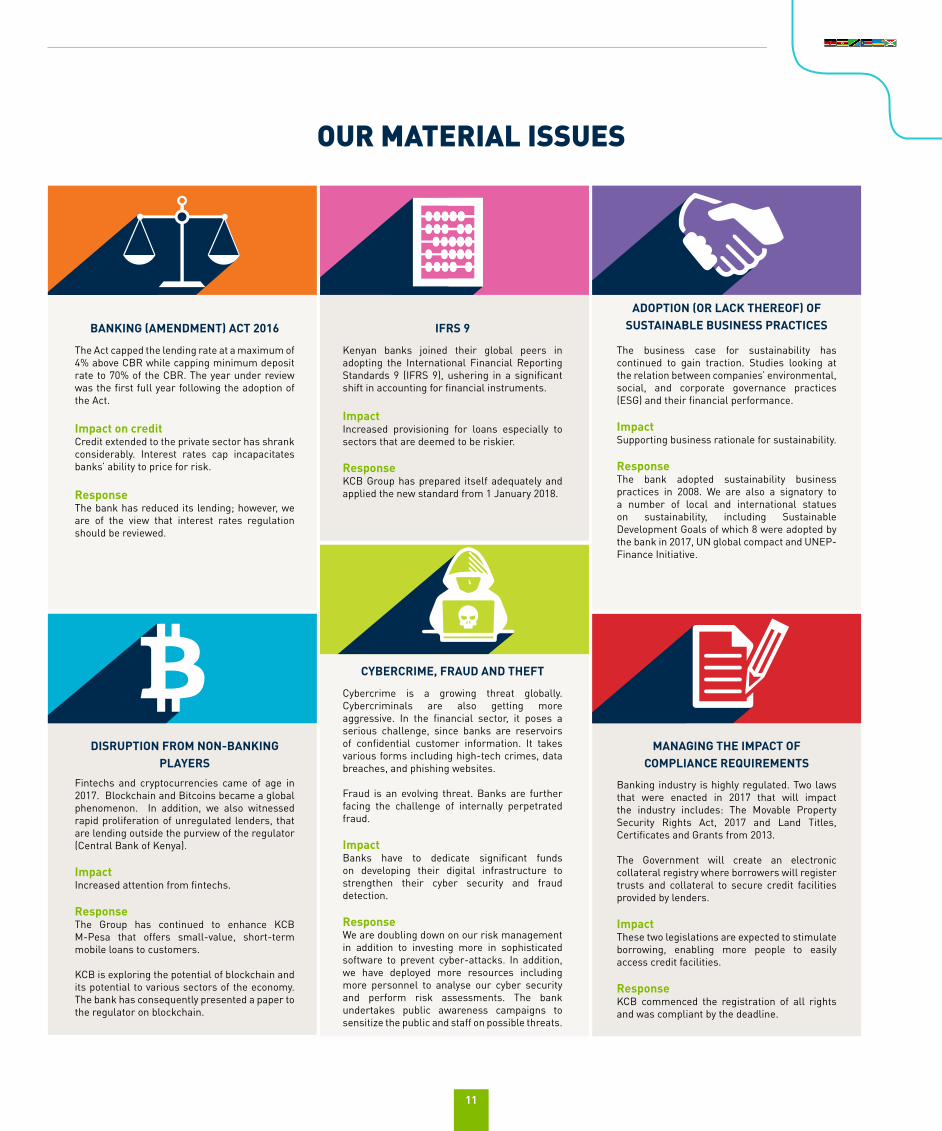
CYBERCRIME, FRAUD AND THEFT
Fintechs and cryptocurrencies came of age in 2017. Blockchain and Bitcoins became a global phenomenon. In addition, we also witnessed rapid proliferation of unregulated lenders, that are lending outside the purview of the regulator (Central Bank of Kenya).
ImpactIncreased attention from fintechs.
ResponseThe Group has continued to enhance KCB M-Pesa that offers small-value, short-term mobile loans to customers.
KCB is exploring the potential of blockchain and its potential to various sectors of the economy. The bank has consequently presented a paper to the regulator on blockchain.
Cybercrime is a growing threat globally. Cybercriminals are also getting more aggressive. In the financial sector, it poses a serious challenge, since banks are reservoirs of confidential customer information. It takes various forms including high-tech crimes, data breaches, and phishing websites.
Fraud is an evolving threat. Banks are further facing the challenge of internally perpetrated fraud.
ImpactBanks have to dedicate significant funds on developing their digital infrastructure to strengthen their cyber security and fraud detection.
ResponseWe are doubling down on our risk management in addition to investing more in sophisticated software to prevent cyber-attacks. In addition, we have deployed more resources including more personnel to analyse our cyber security and perform risk assessments. The bank undertakes public awareness campaigns to sensitize the public and staff on possible threats.
OUR MATERIAL ISSUES
The Act capped the lending rate at a maximum of 4% above CBR while capping minimum deposit rate to 70% of the CBR. The year under review was the first full year following the adoption of the Act.
Impact on creditCredit extended to the private sector has shrank considerably. Interest rates cap incapacitates banks’ ability to price for risk.
ResponseThe bank has reduced its lending; however, we are of the view that interest rates regulation should be reviewed.
Kenyan banks joined their global peers in adopting the International Financial Reporting Standards 9 (IFRS 9), ushering in a significant shift in accounting for financial instruments.
ImpactIncreased provisioning for loans especially to sectors that are deemed to be riskier.
ResponseKCB Group has prepared itself adequately and applied the new standard from 1 January 2018.
Banking industry is highly regulated. Two laws that were enacted in 2017 that will impact the industry includes: The Movable Property Security Rights Act, 2017 and Land Titles, Certificates and Grants from 2013.
The Government will create an electronic collateral registry where borrowers will register trusts and collateral to secure credit facilities provided by lenders.
ImpactThese two legislations are expected to stimulate borrowing, enabling more people to easily access credit facilities.
ResponseKCB commenced the registration of all rights and was compliant by the deadline.
BANKING (AMENDMENT) ACT 2016
DISRUPTION FROM NON-BANKING PLAYERS
IFRS 9
The business case for sustainability has continued to gain traction. Studies looking at the relation between companies’ environmental, social, and corporate governance practices (ESG) and their financial performance.
ImpactSupporting business rationale for sustainability.
ResponseThe bank adopted sustainability business practices in 2008. We are also a signatory to a number of local and international statues on sustainability, including Sustainable Development Goals of which 8 were adopted by the bank in 2017, UN global compact and UNEP-Finance Initiative.
MANAGING THE IMPACT OF COMPLIANCE REQUIREMENTS
ADOPTION (OR LACK THEREOF) OF SUSTAINABLE BUSINESS PRACTICES
KCB INTEGRATED REPORT AND FINANCIAL STATEMENTS | 2017
12
Economic growth in Kenya was adversely affected by the prolonged electioneering
period and persistent drought which saw the overall growth drop to 4.7% from an
initial high of 5.8% in 2016. Interest rate capping affected the credit sector which narrowed margins. However, the country witnessed strong growth rates averaging 5.7 % between 2013 and 2016.
Apart from the agricultural, manufacturing and financial sectors, other sectors posted higher growth rates of above 5%. The sectors that recorded low growth rates were affected by drought (agriculture), election uncertainties (manufacturing and trade) and interest rate capping for the financial services sector. However, hospitality and ICT sectors posted impressive results despite the setbacks.
Inflation stood at 7.98% for the year 2017, an increase from 6.31% in 2016. The government’s upper projection of 7.5% was passed due to the factors outlined above. The government intervened on food inflation through application of price ceiling on maize flour when it averaged 13.5% with a high of 21.5 % in May 2015, but generally, overall inflation is still below the sub Saharan average which stands at 9.5 % and the East African average at 9.9%. By the close of the year inflation dropped to 4.5%.
The Kenyan shilling remained stable, depreciating by 0.65% in 2017 with the average exchange rate at Kshs. 103.42, compared to 101.49 in 2016. The average foreign exchange reserve stood at USD 7,657 million. The Monetary Policy Committee benchmark was maintained at an interest rate of 10% and despite the drought and the elections, other macroeconomic indicators remained stable.
The 91 Day Treasury bills averaged 8.4% in 2017 from 8.6% in 2016. Banks’ average lending rates stood at 13.67 % and deposit rates at 7.46% due to interest rate capping. Private sector growth declined from 4.1% in 2016 to 2.4% in 2017, mainly due to reduced credit in agriculture, trade, transport, finance & insurance and private households.
The debt portfolio in Kenya grew by 19.4%, riding on a 23.9% growth in external debt, while domestic debt grew 15%. External debts accounted for at least 51.44% of the total debt while domestic debt was at 48.66%. In the external debt portfolio, multi-lateral debt accounted for 35.6%, bilateral debt at 33.6% and commercial banks at 29.8%.
At the end of the year, T-bills accounted for 31.9% of the total domestic debt while T-Bonds accounted for 68.1 %. Banking institutions held the majority of the government debt at 54.6%, pension funds at 27.5%,
parastatals at 6.9% and insurance companies at 6.4%. Kenya’s debt to GDP ratio increased from 42.1% five years ago to 56.4% in 2017.
OPERATING ENVIRONMENT
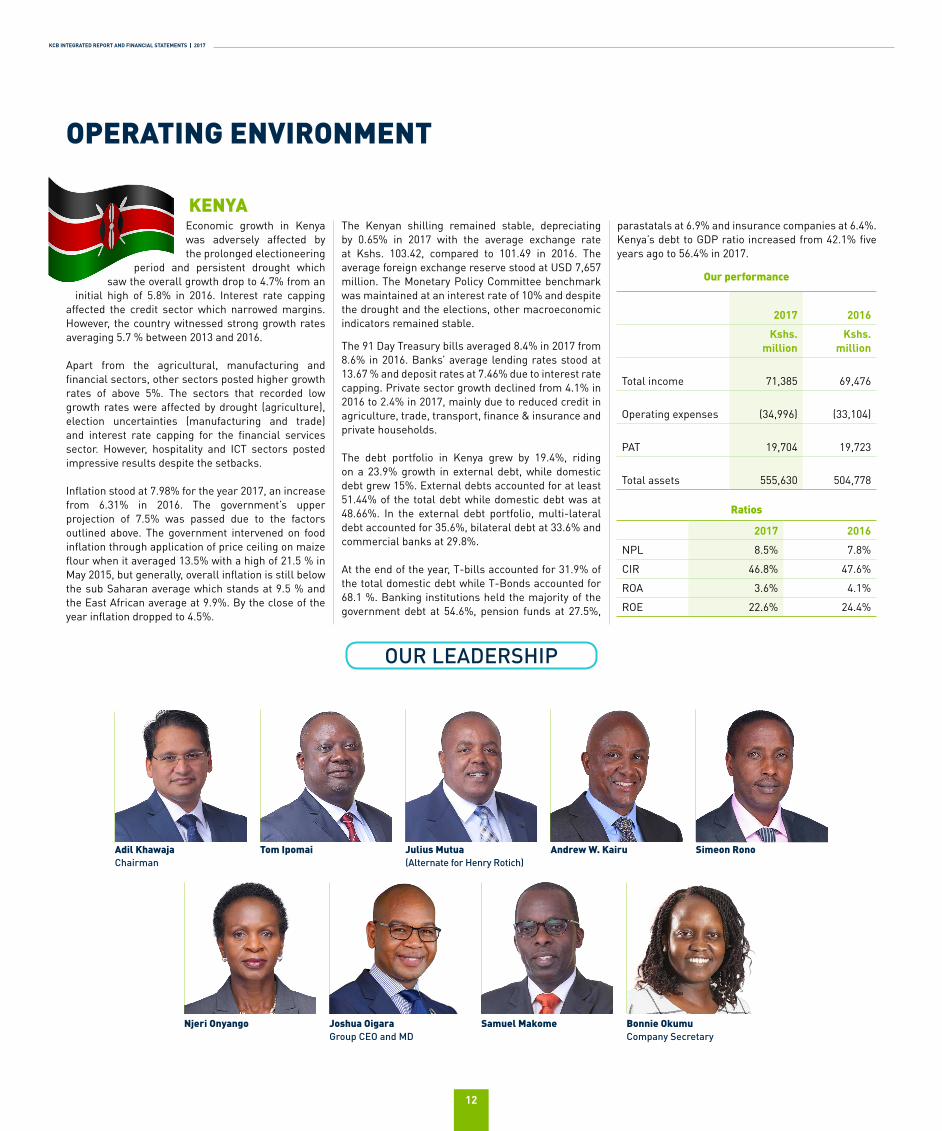
Simeon RonoAdil KhawajaChairman
Andrew W. KairuJulius Mutua(Alternate for Henry Rotich)
Tom Ipomai
Samuel Makome Bonnie OkumuCompany Secretary
Njeri Onyango Joshua OigaraGroup CEO and MD
KENYA
2017 2016
Kshs. million
Kshs. million
Total income 71,385 69,476
Operating expenses (34,996) (33,104)
PAT 19,704 19,723
Total assets 555,630 504,778
2017 2016
NPL 8.5% 7.8%
CIR 46.8% 47.6%
ROA 3.6% 4.1%
ROE 22.6% 24.4%
Our performance
Ratios
OUR LEADERSHIP
13
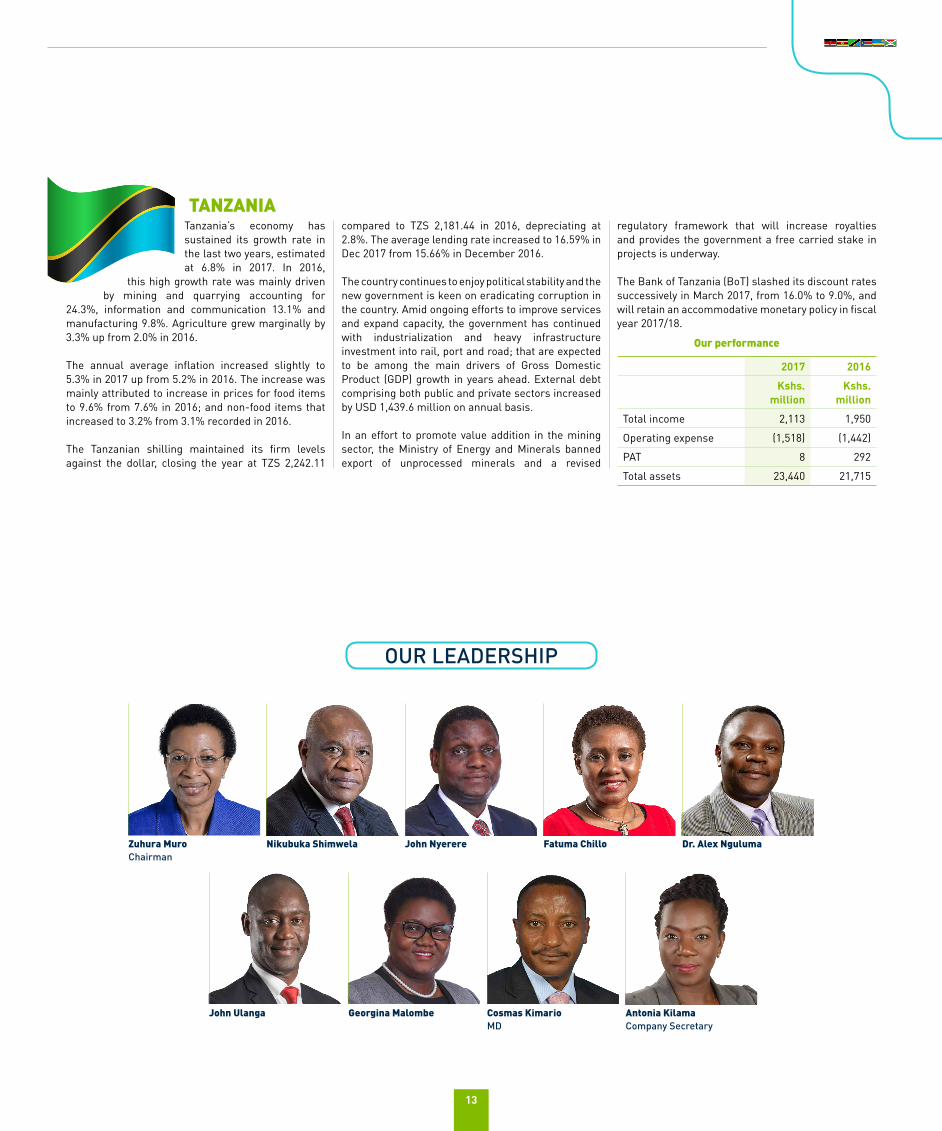
Tanzania’s economy has sustained its growth rate in the last two years, estimated at 6.8% in 2017. In 2016,
this high growth rate was mainly driven by mining and quarrying accounting for
24.3%, information and communication 13.1% and manufacturing 9.8%. Agriculture grew marginally by 3.3% up from 2.0% in 2016.
The annual average inflation increased slightly to 5.3% in 2017 up from 5.2% in 2016. The increase was mainly attributed to increase in prices for food items to 9.6% from 7.6% in 2016; and non-food items that increased to 3.2% from 3.1% recorded in 2016.
The Tanzanian shilling maintained its firm levels against the dollar, closing the year at TZS 2,242.11
compared to TZS 2,181.44 in 2016, depreciating at 2.8%. The average lending rate increased to 16.59% in Dec 2017 from 15.66% in December 2016.
The country continues to enjoy political stability and the new government is keen on eradicating corruption in the country. Amid ongoing efforts to improve services and expand capacity, the government has continued with industrialization and heavy infrastructure investment into rail, port and road; that are expected to be among the main drivers of Gross Domestic Product (GDP) growth in years ahead. External debt comprising both public and private sectors increased by USD 1,439.6 million on annual basis.
In an effort to promote value addition in the mining sector, the Ministry of Energy and Minerals banned export of unprocessed minerals and a revised
regulatory framework that will increase royalties and provides the government a free carried stake in projects is underway.
The Bank of Tanzania (BoT) slashed its discount rates successively in March 2017, from 16.0% to 9.0%, and will retain an accommodative monetary policy in fiscal year 2017/18.
Georgina Malombe Cosmas Kimario MD
Antonia KilamaCompany Secretary
John Ulanga
Zuhura MuroChairman
Dr. Alex Nguluma John Nyerere Fatuma ChilloNikubuka Shimwela
TANZANIA
2017 2016
Kshs. million
Kshs. million
Total income 2,113 1,950
Operating expense (1,518) (1,442)
PAT 8 292
Total assets 23,440 21,715
Our performance
OUR LEADERSHIP
KCB INTEGRATED REPORT AND FINANCIAL STATEMENTS | 2017
14
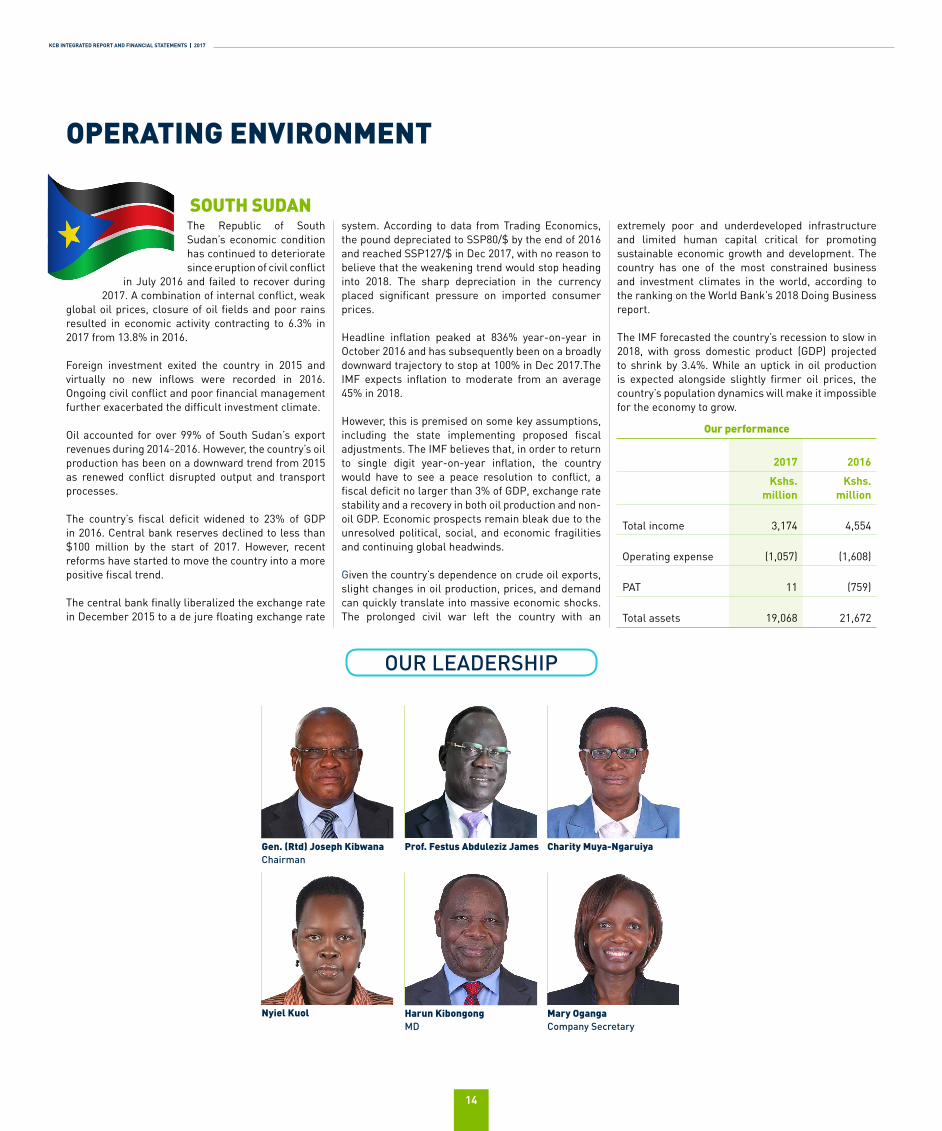
The Republic of South Sudan’s economic condition has continued to deteriorate since eruption of civil conflict
in July 2016 and failed to recover during 2017. A combination of internal conflict, weak
global oil prices, closure of oil fields and poor rains resulted in economic activity contracting to 6.3% in 2017 from 13.8% in 2016.
Foreign investment exited the country in 2015 and virtually no new inflows were recorded in 2016. Ongoing civil conflict and poor financial management further exacerbated the difficult investment climate.
Oil accounted for over 99% of South Sudan’s export revenues during 2014-2016. However, the country’s oil production has been on a downward trend from 2015 as renewed conflict disrupted output and transport processes.
The country’s fiscal deficit widened to 23% of GDP in 2016. Central bank reserves declined to less than $100 million by the start of 2017. However, recent reforms have started to move the country into a more positive fiscal trend.
The central bank finally liberalized the exchange rate in December 2015 to a de jure floating exchange rate
system. According to data from Trading Economics, the pound depreciated to SSP80/$ by the end of 2016 and reached SSP127/$ in Dec 2017, with no reason to believe that the weakening trend would stop heading into 2018. The sharp depreciation in the currency placed significant pressure on imported consumer prices.
Headline inflation peaked at 836% year-on-year in October 2016 and has subsequently been on a broadly downward trajectory to stop at 100% in Dec 2017.The IMF expects inflation to moderate from an average 45% in 2018.
However, this is premised on some key assumptions, including the state implementing proposed fiscal adjustments. The IMF believes that, in order to return to single digit year-on-year inflation, the country would have to see a peace resolution to conflict, a fiscal deficit no larger than 3% of GDP, exchange rate stability and a recovery in both oil production and non-oil GDP. Economic prospects remain bleak due to the unresolved political, social, and economic fragilities and continuing global headwinds.
Given the country’s dependence on crude oil exports, slight changes in oil production, prices, and demand can quickly translate into massive economic shocks. The prolonged civil war left the country with an
extremely poor and underdeveloped infrastructure and limited human capital critical for promoting sustainable economic growth and development. The country has one of the most constrained business and investment climates in the world, according to the ranking on the World Bank’s 2018 Doing Business report.
The IMF forecasted the country’s recession to slow in 2018, with gross domestic product (GDP) projected to shrink by 3.4%. While an uptick in oil production is expected alongside slightly firmer oil prices, the country’s population dynamics will make it impossible for the economy to grow.
Gen. (Rtd) Joseph KibwanaChairman
Charity Muya-NgaruiyaProf. Festus Abduleziz James
Nyiel Kuol Mary OgangaCompany Secretary
Harun KibongongMD
SOUTH SUDAN
2017 2016
Kshs. million
Kshs. million
Total income 3,174 4,554
Operating expense (1,057) (1,608)
PAT 11 (759)
Total assets 19,068 21,672
Our performance
OUR LEADERSHIP
OPERATING ENVIRONMENT
15
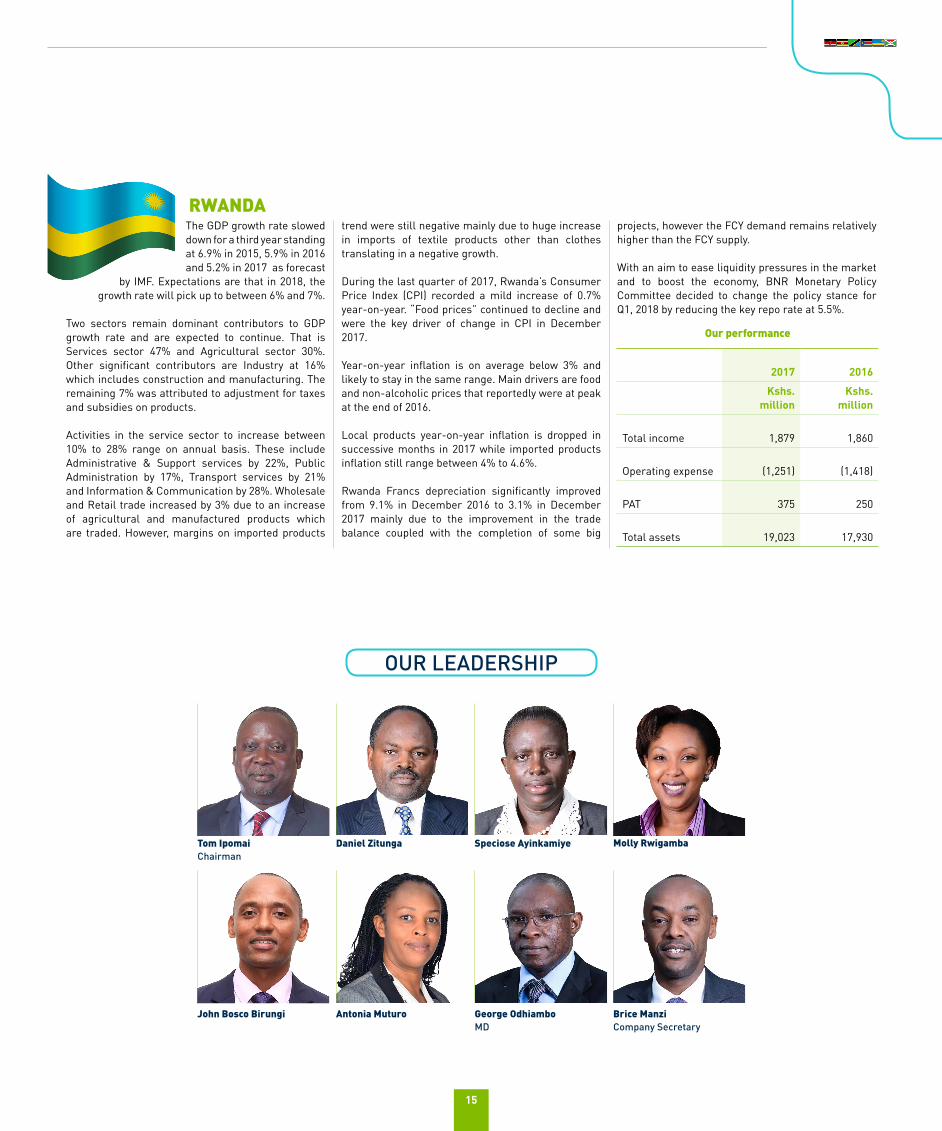
The GDP growth rate slowed down for a third year standing at 6.9% in 2015, 5.9% in 2016 and 5.2% in 2017 as forecast
by IMF. Expectations are that in 2018, the growth rate will pick up to between 6% and 7%.
Two sectors remain dominant contributors to GDP growth rate and are expected to continue. That is Services sector 47% and Agricultural sector 30%. Other significant contributors are Industry at 16% which includes construction and manufacturing. The remaining 7% was attributed to adjustment for taxes and subsidies on products.
Activities in the service sector to increase between 10% to 28% range on annual basis. These include Administrative & Support services by 22%, Public Administration by 17%, Transport services by 21% and Information & Communication by 28%. Wholesale and Retail trade increased by 3% due to an increase of agricultural and manufactured products which are traded. However, margins on imported products
trend were still negative mainly due to huge increase in imports of textile products other than clothes translating in a negative growth.
During the last quarter of 2017, Rwanda’s Consumer Price Index (CPI) recorded a mild increase of 0.7% year-on-year. “Food prices” continued to decline and were the key driver of change in CPI in December 2017.
Year-on-year inflation is on average below 3% and likely to stay in the same range. Main drivers are food and non-alcoholic prices that reportedly were at peak at the end of 2016.
Local products year-on-year inflation is dropped in successive months in 2017 while imported products inflation still range between 4% to 4.6%.
Rwanda Francs depreciation significantly improved from 9.1% in December 2016 to 3.1% in December 2017 mainly due to the improvement in the trade balance coupled with the completion of some big
projects, however the FCY demand remains relatively higher than the FCY supply.
With an aim to ease liquidity pressures in the market and to boost the economy, BNR Monetary Policy Committee decided to change the policy stance for Q1, 2018 by reducing the key repo rate at 5.5%.
Tom IpomaiChairman
Speciose Ayinkamiye Molly RwigambaDaniel Zitunga
Antonia Muturo George OdhiamboMD
Brice ManziCompany Secretary
John Bosco Birungi
RWANDA
2017 2016
Kshs. million
Kshs. million
Total income 1,879 1,860
Operating expense (1,251) (1,418)
PAT 375 250
Total assets 19,023 17,930
Our performance
OUR LEADERSHIP
KCB INTEGRATED REPORT AND FINANCIAL STATEMENTS | 2017
16
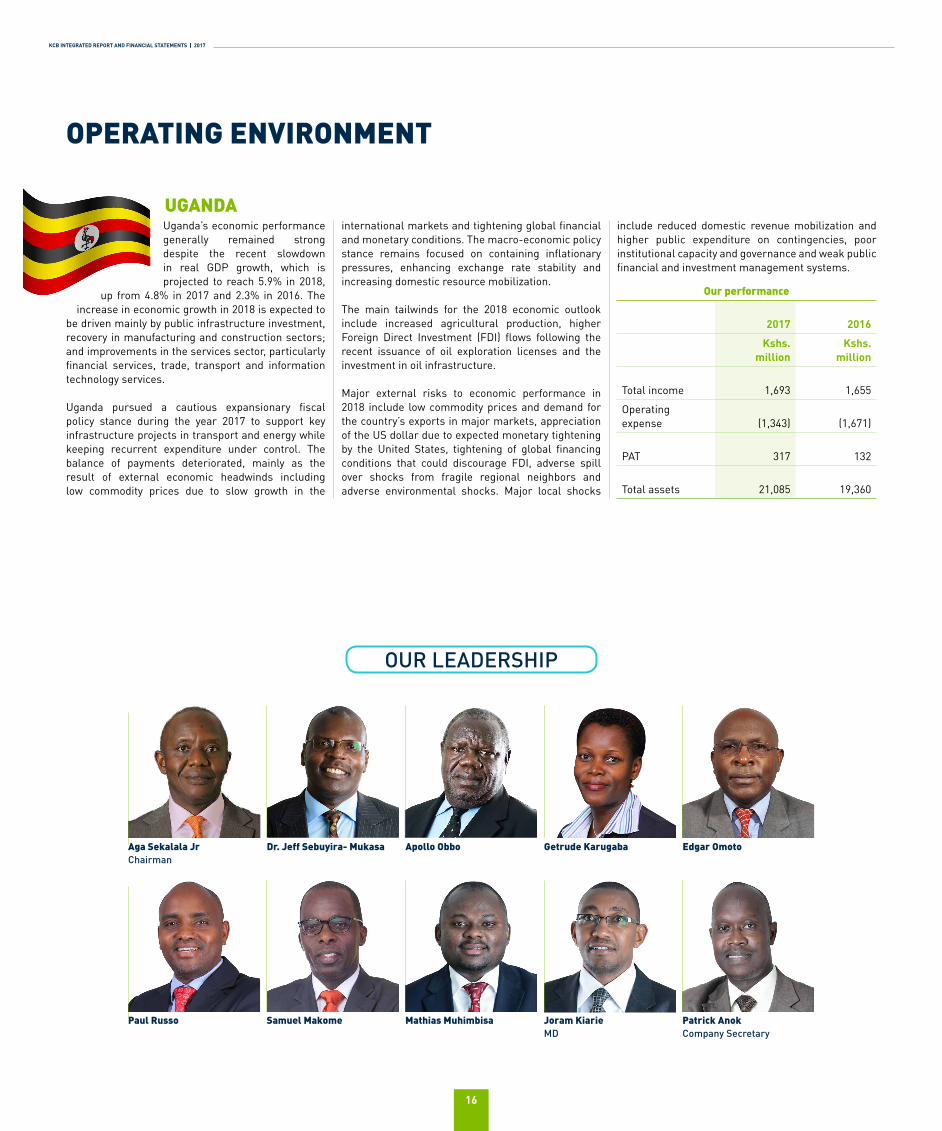
Uganda’s economic performance generally remained strong despite the recent slowdown in real GDP growth, which is projected to reach 5.9% in 2018,
up from 4.8% in 2017 and 2.3% in 2016. The increase in economic growth in 2018 is expected to
be driven mainly by public infrastructure investment, recovery in manufacturing and construction sectors; and improvements in the services sector, particularly financial services, trade, transport and information technology services.
Uganda pursued a cautious expansionary fiscal policy stance during the year 2017 to support key infrastructure projects in transport and energy while keeping recurrent expenditure under control. The balance of payments deteriorated, mainly as the result of external economic headwinds including low commodity prices due to slow growth in the
international markets and tightening global financial and monetary conditions. The macro-economic policy stance remains focused on containing inflationary pressures, enhancing exchange rate stability and increasing domestic resource mobilization.
The main tailwinds for the 2018 economic outlook include increased agricultural production, higher Foreign Direct Investment (FDI) flows following the recent issuance of oil exploration licenses and the investment in oil infrastructure.
Major external risks to economic performance in 2018 include low commodity prices and demand for the country’s exports in major markets, appreciation of the US dollar due to expected monetary tightening by the United States, tightening of global financing conditions that could discourage FDI, adverse spill over shocks from fragile regional neighbors and adverse environmental shocks. Major local shocks
include reduced domestic revenue mobilization and higher public expenditure on contingencies, poor institutional capacity and governance and weak public financial and investment management systems.
Aga Sekalala JrChairman
Paul Russo
Apollo Obbo Getrude Karugaba Edgar Omoto
Mathias Muhimbisa Patrick AnokCompany Secretary
Dr. Jeff Sebuyira- Mukasa
Samuel Makome Joram Kiarie MD
UGANDA
2017 2016
Kshs. million
Kshs. million
Total income 1,693 1,655
Operating expense (1,343) (1,671)
PAT 317 132
Total assets 21,085 19,360
Our performance
OUR LEADERSHIP
OPERATING ENVIRONMENT
17
Economic growth remains severely affected by the acute political crisis that has gripped the country since 2015; A succession
of adverse events, including suspension of financial aid by major donors,
shortage of foreign exchange reserves, imports price inflation, and declining investment, seriously weakened the country’s economy, Burundi heavily depends on agriculture had a GDP growth of 0% and is expected to remain in recession until 2018 (0.3% decline in real GDP) before growing slightly in 2019 (1%).
The current account deficit, which reached an estimated 11.6% of GDP in 2017, reflects restrictions on coffee and tea exports as well as insufficient foreign exchange reserves.
Revenue collection was at 86% of the budget. In September 2017, the EU and USA renewed sanctions against Burundi for another one year.
Foreign exchange shortage continued to put pressure on the official exchange rate which depreciated by 4.6% from 1,688.9 to 1,767 against the dollar. The foreign currency control regime continued in 2017 key among them the requirement that all NGOs, Coffee,
tea and mineral exporting companies to close FCY accounts with commercial banks and open them with the Central bank and corporates to only withdraw in LCY from there accounts.
Treasury bill rates remained low throughout the year closing the year at 6.1% for the 1 year below up from 5% in December 2016. The Government concentrated more on the Treasury Bonds market where their rates were between 11.5% and 14.6% for the 2 to 5 year Bonds depending on tenure.
The overnight lending rates were at 3% or below throughout the year. Lending rates remained stable at 16%.
According to Burundi Statistics Bureau (ISTEEBU), end year Inflation was 10%, recovering from a high of 21.1% in March having started the year at 9.6%. The annual average inflation was 16.95%.
The new Burundi Banking Act was promulgated by the president on 22 August 2017. Among the key changes is the introduction of a development fund to be 30% of profit after Tax which commercial banks have to agree on a developmental project with the central bank and effect within 10 years. The Act did away with exclusive contracts on money transfer services and introduced welcomed controls in corporate governance.
The 2018 budget was promulgated on 31 December 2017. The total budget is BIF 1.388 trillion up from 1.326 trillion (4.6% growth) and will be finance by 32.8% from revenue collection and 67.2% from domestic borrowing. This offer an opportunity to commercial banks with liquidity to support the government and benefit in term of interest income.
Article 28 of the budget introduced a 5% of profit before tax special development fund for all financial institution. This fund is tax allowable and guidance on which government arm the fund will be remitted to will be provided in due course.
Janet MwalumaCompany Secretary
Gloria NyambokMD
Consolata NdayishimiyeJulius MutuaChairman
Adrien Sibomana
BURUNDI
2017 2016
Kshs. million
Kshs. million
Total income 731 616
Operating expense (582) (521)
PAT 69 36
Total assets 7,160 5,668
Our performance
OUR LEADERSHIP
KCB INTEGRATED REPORT AND FINANCIAL STATEMENTS | 2017
18
IntroductionKCB Group practices proactive risk management which considers risk management as an integral part of decision making at all levels thus influencing shareholder value by viewing risks as opportunities that can be exploited for competitive advantage.
KCB Group has embraced an Enterprise-wide Risk Management framework that ensures all risks are identified, quantified and managed to achieve an optimal risk reward profile that enhances shareholder value. This holistic risk management approach takes into account correlations across all risk classes and aligns strategic objectives to risk management practices.
Risk Management PrinciplesThe diversity of our business model requires us to identify, assess, measure, aggregate and manage our risks, and to allocate our capital among our businesses. Our aim is to help reinforce our resilience by encouraging a holistic approach to the management of risk and return throughout our organization as well as the effective management of our risk, capital and reputational profile. We actively take risks in connection with our business and as such the following principles underpin our risk management framework:
• Risk is taken within a defined risk appetite;• Every risk taken needs to be approved within
the risk management framework;• Risk taken needs to be adequately
compensated; and• Risk should be continuously monitored and
managed.
Risk Management Approach and FrameworkThe Board of Directors has established a robust risk culture and documented clear policies that define risk management as everyone’s responsibility. They provide oversight through the Board Risk committee and approve risk limits based on the bank’s risk appetite.
Through delegated responsibility to senior management, they implement the integrated risk framework that assesses and appropriately manages various risk exposures of the bank. This has been achieved by developing a system and structure that monitors the bank’s risk exposures and optimizes
capital management. Further, the Board ensures that the Group complies with all external regulations, internal policies and procedures through a strong internal control environment.
KCB Group has adopted comprehensive Internal Capital Adequacy Assessment Process (ICAAP) under Pillar II of Basel II framework that ensures that risks are identified, assessed and that the Bank maintains sufficient capital to face these risks and apply appropriate risk-management techniques to maintain adequate capitalization on an ongoing and forward looking basis.
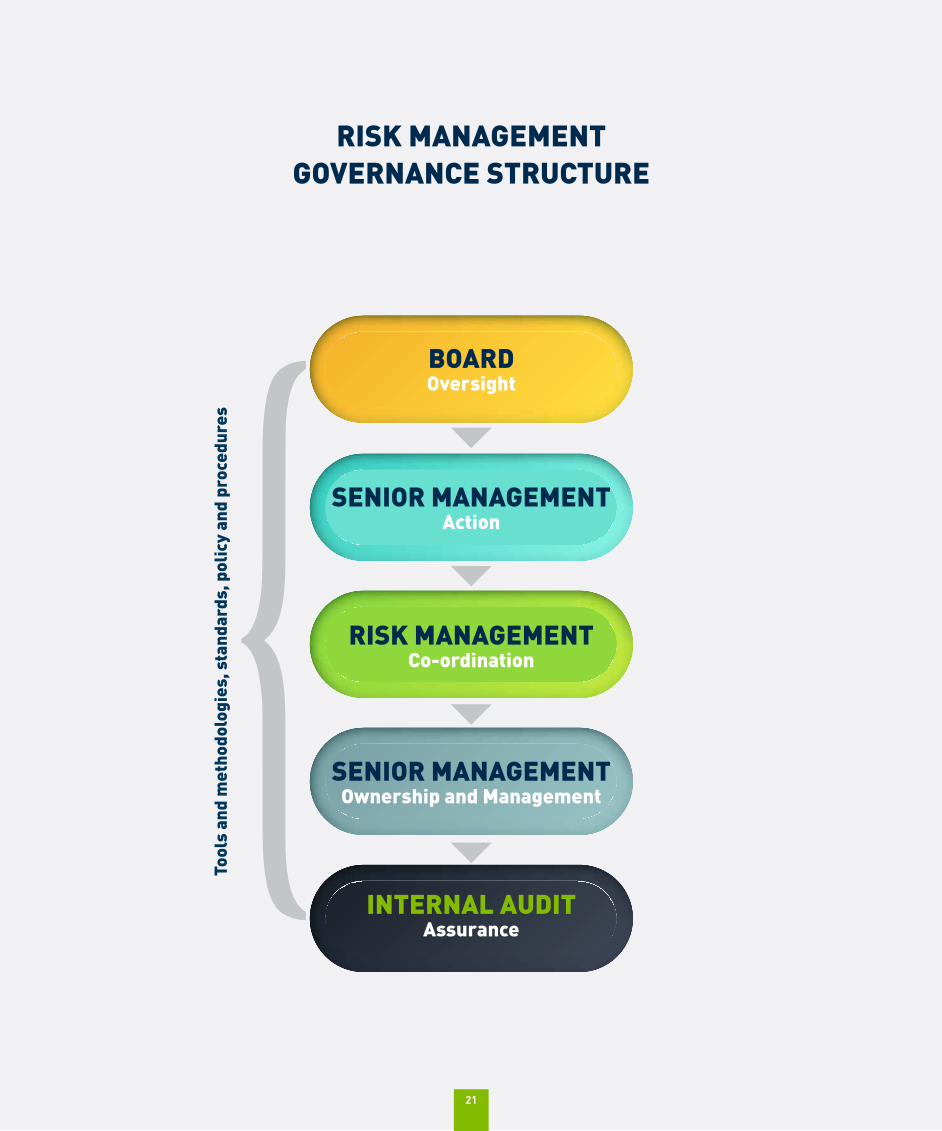
Risk Management GovernanceThe Board of Directors has overall responsibility for the establishment and oversight of the Group’s risk management framework. Our Group’s risk management policies are established to identify and analyse the risks faced by the Group, to set appropriate risk limits and controls, to monitor risks and adherence to limits. Risk management policies and systems are reviewed regularly to reflect changes in regulations, market conditions, products and services offered.
The Risk Committee of the Board is responsible for monitoring compliance with the Group’s risk management policies and procedures and for reviewing the adequacy of the risk management framework in relation to the risks faced by the Group. The Committee is assisted in these functions by the Risk Division, which undertakes reviews of risk management controls and procedures, the results of which are reported to the risk committee.
The Group’s management and control model is based on three lines of defence. The first line is constituted by the business units and the support areas which as part of their activity give rise to the Bank’s risk exposure. These units are responsible for managing, monitoring and reporting adequately the risk generated, which must be adjusted to the risk appetite and the various limits of risk management. Risk Division serves as the Group’s second line of defence. It has responsibility for recommending and monitoring the Group’s risk appetite and policies and for following up and reporting on risk issues across all risk types, organisational units and geographical regions. Group Risk Management oversees the risk management framework and practices across the
organisation and serves as the secretariat of the Operational Risk Committee and Asset & Liability Committee.
Internal audit is the third line of defence and as the last layer of control in the Group regularly assesses the policies, methods and procedures to ensure they are adequate and are being implemented effectively.
The three lines of defence have a sufficient level of separation and independence to not compromise the effectiveness of the general framework. They operate in coordination with one another in order to maximize their efficiency and strengthen their effectiveness.
The Risk Management Division continuously offers training initiatives to create awareness of key risks in the Bank and in specific areas of operations. As a result, employees have a better knowledge of their operational scope and the risks inherent in their operations. All units of the Bank are provided with tools and skills to identify, assess, measure, report and mitigate risks in their areas of operations. Additionally, all new products and initiatives undertaken by the Group are risk profiled before roll out of the same.
Risk TypesKCB Group operates in a risk landscape that is familiar and evolving with emerging risks that may have potential adverse effect on business. In this regard, the Bank has established a comprehensive and reliable risk management framework and systems that integrates all business activities and provides the bank risk profile to be always in line with the established risk propensity. The bank manages the following broad risks types among others:- Credit RiskKCB Group credit strategy is to support business growth by granting quality loan book with strong controls in order to optimize return while keeping credit risk within acceptable predetermined limits. The Bank adds value to customers and generates returns for shareholders by taking and managing credit risk in line with strategy and within risk appetite. The Bank’s credit risk management aim’s at preserving the high credit quality of the portfolios and thereby protecting the Bank’s short and long-term viability.
RISK MANAGEMENT
This holistic risk management approach takes into account correlations across all risk classes and aligns strategic
objectives to risk management practices.”
19
Operational RiskKCB Group has put in place robust Operational Risk management (ORM) frameworks, policies, processes and systems that help in the management of operational risk. The policies and procedures are documented and have been communicated to all staff. Similarly, ORM tools for identification, assessment, monitoring, controlling and reporting of risk activities and exposures are in place. To embed ORM culture in the bank’s day-to-day processes, continuous training and awareness to staff is undertaken to ensure that internal controls are well designed and effective in mitigating potential exposures.
Market RiskKCB Group manages market, liquidity and country risks to ensure business units do not expose the bank to unacceptable losses beyond the approved risk appetite and maximize return on risk adjusted capital. It has put in place mechanisms and systems to help to identify complexities arising from globalization of financial services, together with growing sophistication of financial technology, expansion into different geographies among others to insulate or reduce losses that may result thereof.
Compliance Risk KCB Group minimizes compliance uncertainty by ensuring that activities of the Group are conducted in accordance with all regulations, codes of conduct and standards of good practice applicable in all the jurisdictions it operates in, as well as conforming to internal policies and standards of operation, and with the highest ethical standards. At a minimum all activities and operational areas of KCB Group are governed by policy.
The Group does not associate with money laundering and terrorism financing, and holds that no customer relationship is worth compromising its commitment to combating money laundering and terrorism financing.
Reputational RiskKCB Group has no appetite for reputation risk. The Group has no appetite for adverse media coverage and uses every effort to ensure that events that could potentially lead to such coverage are avoided. The Group considers and appropriately addresses the reputational impact of business decisions made at all times.
Fraud RiskThe focus of KCB Group is on fraud prevention through focused fraud awareness trainings and fraud risk assessments. KCB Group is in the process of implementing a fraud management solution to proactively identify potential fraudulent activities before they crystallize to losses.
This will ensure that fraudulent activities are reduced to a minimum level through proactive detection and response. KCB Group also has a whistle blowing hotline that helps management to be informed at an early stage about suspected fraudulent, immoral, unethical or malicious activities or misconduct and take appropriate actions that will deter and prevent such activities.
Ethics and Code of ConductThe Group Code of Ethical Conduct outlines the behaviors and standards of ethical conduct required of Staff and others acting for the Group. KCB Group is committed to the fundamental values of integrity, transparency, accountability and adopts a zero tolerance position to all forms of corruption, bribery and unethical business practices. All employees are expected to adhere to the Code of Ethical conduct in its entirety and to undertake a mandatory annual Ethics E-Learning Course.
Crisis ManagementThe Group recognizes the importance of having plans and procedures in place to ensure that it is viable in the long term and that the critical services are available.
The Group’s operational crisis management is supported by business continuity plans, which describe measures that can restore the Group’s operational capabilities and that allow it to recover from material operational risk events.
In a situation of severe financial stress, the Group’s contingency plans for capital and liquidity will ensure that the Group takes measures to restore the Group’s liquidity and funding position.
Risk CultureThe Group’s risk culture is specified in the principles of responsibility, prudence and compliance, as all units and employees (regardless of the function they carry out) are responsible for ensuring that not only does the institution comply, but also it is prudent and responsible in what it does. This risk culture is also based on the principles of KCB Group risk management model and is transmitted to all business and management units and is supported, among other things, by the following drivers:
• Involvement of senior management in risk control and Management.
• Independence of the control functions (risks, compliance and internal audit), with sufficient authority and direct access to the governance bodies.
• KCB Group appropriately documents risk activity, through detailed frameworks, models and policies for risk management and control.
• The Group has specific policies for compliance, conduct and reputational risks.
• The consistency and alignment between risk appetite, risk management and the Group’s business strategy is ensured by the budgetary process, governance of approval of operations and quantitative limits in which the risk appetite principles are specified.
• The remuneration and reward policy includes performance variables that take into account the quality of the risk.
ReportingThe Group’s risk appetite, risk profile and risk exposures are reported on a regular basis to the board and senior management through various governance committees. Risk management reports originate in the business units and are then escalated through a formalised governance structure as mandated, based on materiality. A Group risk management report is tabled at both board and senior management risk committees.
Risk and InnovationKCB Group has put in place governance structures that allow innovation to flourish. Risk management is a key enabler of business long-term growth and achievement of sustainable profitability. Risk management function has developed advanced capabilities to manage innovation risks successfully.
Risk management has also championed the development of predictive models for risk assessment.
The Group recognizes the importance of having plans and
procedures in place to ensure that it is viable in the long term and that the
critical services are available.”
KCB INTEGRATED REPORT AND FINANCIAL STATEMENTS | 2017
20
RISK CATEGORIZATION
Information Risk Threat arising from weaknesses in data integrity, system availability or weaknesses in the lCT environment e.g. Data phishing, data fraud, data privacy breaches.
IT security policy, IT operations and monitoring, firewalls, strong business continuity plans, stringent information protection processes and policies.
Market RiskPotential loss of earnings or economic value due to sudden shifts in financial and economic factors. Market risk at KCB includes: Interest rate risk, foreign exchange risk, investment risk, settlement risk, liquidity risk and country risk e.g. Loss in economic value due to shift in interest rates.
Regular monitoring of KCB’s risk profile against risk appetite limits e.g. exposure and risk limits, liquidity and solvency ratios which are contained in the market risk framework incorporating market and country risk policies approved by the board.
Compliance RiskFailure to adhere to new or existing legislation, regulations, prudential guidelines as well as key internal compliance policies. e.g. Introduction of new or changes to existing legislation, regulations and prudential guidelines.
Identification of changes to the regulatory compliance universe, gap analysis and enhancement of the internal policy environmentMonthly compliance self-assessments and validationsIdentification and analysis of compliance gaps.
Continuous compliance training for staff.
Reputational RiskPotential that negative publicity regarding the Bank’s business practices, whether true or not, will cause a decline in the customer confidence, costly litigation, or revenue reductions. This risk may result from the Bank’s failure to effectively manage any or all of the other risk types. e.g. Negative publicity.
Strong risk management and ethics culture.Monitoring of print, electronic and social media, instant global communications and resolution of issues.
Identifying and preparing for strategic risks.
Senior management oversight.
Credit RiskFailure of an obligor of the Bank to repay principal or interest at the stipulated time or failure otherwise to perform as agreed. e.g. Inadequate/insufficient documentation of processes or procedures.
Lack of inbuilt controls in procedures, health and safety issues, Fraud risk.
Monitoring and reporting of loan book, setting of appetite limits, sector concentration limits, risk adjusted loan pricing, calculating the Basel II/III capital adequacy requirements for credit risk and development of core risk models.
Operational RiskThe risk of losses resulting from inadequate or failed internal processes, people and systems or from external events. e.g. Inadequate/insufficient documentation of processes or procedures.
Lack of inbuilt controls in procedures, health and safety issues, Fraud risk.
A robust risk management framework that ensures operational risks are identified in a timely fashion, measured and corrective action taken to cushion the bank from surprise operationalrisk events.
21
RISK MANAGEMENT GOVERNANCE STRUCTURE
BOARDOversight
SENIOR MANAGEMENTAction
Tool
s an
d m
etho
dolo
gies
, sta
ndar
ds, p
olic
y an
d pr
oced
ures
RISK MANAGEMENTCo-ordination
SENIOR MANAGEMENTOwnership and Management
INTERNAL AUDITAssurance
21
KCB INTEGRATED REPORT AND FINANCIAL STATEMENTS | 2017
22
An overviewIn 2017, the regional banking sector was beset by various challenges – some localized and others regional – which impacted on the overall operating environment and the Group’s performance.
Kenya for instance, marked the first full year of the implementation of the capping of interest rates which saw reduced appetite for lending to the small and medium sector even on the back of an improvement in corporate and retail lending. There were also the added challenges of a prolonged election period in the country which depressed lending operations in this key market which was not helped by the severe drought that prevailed in most parts of the country.
Under the circumstances however, the Group remained resilient and good robust growth. This was catalyzed by the robust governance structure at the Group level which helped us weather the myriad challenges and led to improved underlying performance for the business.
At the board level, we instituted key measures that resulted in a growth-focused business grounded on solid fundamentals. As we continued to oversee policy formulation for the Group, the management and staff must be commended for executing the strategies that saw the business thrive even in the turbulent operating
environment.
Operating overviewMajor changes in the regulatory environment continued to impact on the banking sector in 2017, and are expected to continue shaping the banking landscape in the coming year.
Top among these was the enactment of the Movable Property Security Rights Act which came into operation in May 2017. The law is aimed at facilitating the use of movable property as collateral for credit facilities. Essentially, it creates a framework that allows entities and individuals to use movable assets as collateral in accessing credit.
Regarding corporate governance in subsidiaries, there were no major changes or challenges faced in 2017. In Kenya the Capital Markets Authority Code of Corporate Governance Practices for Issuers of Securities to the Public which was gazetted into law in March 2016 became fully applicable at Group level effective March 2017. Public Listed Companies are required to fully comply with the code and align their governance structures and reporting arrangements to the requirements of the Code.
GROUP CHAIRMAN’SSTATEMENT
23
To grow the business, we must continue investing in infrastructure
that support operational
excellence, giving our customers platforms that
make their lives easier while
protecting the assets they hold
dear.”
Board OperationsWe have been conducting peer reviews on board performance and I am glad to report that we had a 91% score, which, even by global standards, is exceptionally high. We also rolled out the Board Charter, one of the most progressive in the world to direct board operations going forward.
During the year, the Board was fairly stable, with some board members leaving and others joining in a staggered manner to ensure continuity and retain institutional memory.
We also invested in a software for managing board information which is expected to streamline board operations. The software will harmonise resolutions across the board and the Group, thereby standardizing Board information flow.
During the year, we pushed the performance ratios for the board to 46, one of highest for the sector, which is expected to drive efficiencies.
At the board level, several changes took place, as seven directors retired and five were appointed. Mrs. Charity Muya Ngaruiya and Gen (Rtd.) Joseph Kibwana retired from the Group board having attained the age of 70 while Mrs. Catherine Kola retired having served the maximum tenure of 8 years. In Rwanda Ms. Sarah Mukatundiye resigned as a director and Ms. Anne Muchoki and Mr. Faustin Mbundu retired having served the maximum term of 8 years. In Uganda Mr. Protus Sigei retired having served the maximum tenure of 8 years.
Five new directors were appointed; Dr. Nancy Onyango in the Group and Kenya Boards while Mr. Andrew Kairu joined the Kenya Board; Mr. Austen Barasa and Mrs. Alice Kirenge joined the KCB Foundation Board; Mrs. Antonia Muturo in Rwanda and Mr. Edgar Omoto in Uganda.
Building a trusted institutionBanking is anchored on trust. As a leader in the sector, we have made a conscious effort to continuously build trust in our operations because we see this as essential to business continuity.
We engender trust by listening to our clients, engaging them and easing the processes of dealing with us. As a result, our trust scores have been improving and during the year under review, an independent survey found that trust levels for the Bank had steadily been increasing to 87%.
To grow the business, we must continue investing in infrastructure that support operational excellence, giving our customers platforms that make their lives easier while protecting the assets they hold dear.
As a business therefore, we have made it a strategic imperative to earn our customers’ trust by listening to them, acting on their needs and conducting our business in line with the highest ethical standards.
SubsidiariesOn the regional front, the Group continued to thrive despite the various hurdles that we faced. At the same time, we continued engaging the authorities on any business issues that hampered our operations. In South Sudan for instance, we faced a number of challenges arising from a difficult operating environment that was further impacted on by hyperinflation and shortage of foreign exchange.
As a Group, we make every effort to assimilate our operations in the countries we operate in by understanding the underlying dynamics that prevail in it.
SustainabilityAs a business, we are driven by much more than just making profits; we believe we have a higher calling to give back to society and take care of the environment in a sustainable manner.
It is through initiatives such as mifugo ni mali – where we empower pastoralist families to be financially self-
sufficient – and 2Jiajiri which targets at empowering the youth by providing skills that will enable them set up their own businesses – that the bank is able to touch the lives of the larger community. These are initiatives that are carried out under the KCB Foundation which in its ten-year journey has touched thousands of lives through its health, environmental, youth upskilling and pastoralist financial empowerment programmes.
We are looking at building blocks that society will always associate with us in addition to the core financial and banking services that they already associate with us.
OutlookDuring the coming year, we will take stock of what we have accomplished as part of our mid-term review of the five-year strategic plan. This will help us in refining what we need to do in the remaining part of the plan as well as developing the building blocks for the next five-year strategy.
Ngeny BiwottGroup Chairman
KCB INTEGRATED REPORT AND FINANCIAL STATEMENTS | 2017
24
Kwa ufupi Katika mwaka 2017, sekta ya benki katika kanda hii ilikabiliwa na changamoto nyingi. Baadhi ya changamoto hizi zilikuwa za ndani ya nchi na nyingine kutoka kwenye kanda na ziliathiri pakubwa mazingira ya kufanyia biashara pamoja na matokeo ya Kampuni kwa jumla.
Kwa mfano, Kenya ilikamilisha mwaka wa kwanza tangu kuanza kutekelezwa kwa sheria ya kuweka kipimo katika viwango vya riba. Sheria hii ilipunguza hamu ya asasi za kifedha kukopesha biashara ndogo ndogo na za wastani. Hii ilitokea licha ya kuimarika kwa ukopeshaji kwa kampuni na mashirika. Kulikuwa pia na changamoto ya kuwepo kwa kipindi kirefu cha uchaguzi nchini. Hili liliathiri shughuli za ukopeshaji katika soko hili muhimu. Shughuli za kibiashara zilitatizwa pia zaidi na hali mbaya ya ukame katika sehemu mbalimbali nchini Kenya.
Hata hivyo, licha ya mazingira hayo magumu, Kampuni hii iliendelea kuwa imara na kushuhudia ukuaji thabiti. Hili lilichangiwa na mfumo mzuri wa usimamizi katika Kampuni ambao ulituwezesha kuhimili changamoto za aina nyingi na kusaidia kuimarika kwa matokeo yetu ya kifedha.
Katika bodi, tulichukua hatua muhimu ambazo zilisababisha biashara yetu kuwa na msingi imara unaoangazia ukuaji. Hata tulipokuwa tunaendelea kutekeleza sera za Kampuni, hatuwezi kusahau kuwapongeza wafanyikazi kwa kutekeleza mikakati ambayo iliisaidia biashara hii kufanikiwa licha ya mazingira magumu yaliyokuwepo.
Uendeshaji shughuliMabadiliko makubwa katika sheria na usimamizi yaliendelea kuathiri sekta ya benki mwaka 2017 na yanatarajiwa kuendelea kuathiri sekta hii mwaka ujao.Kuu kati ya sheria hizi ni ile ya Dhamana ya Mkopo kwa kutumia Mali Inayoweza Kuhamishwa ambayo ilianza kutekelezwa Mei 2017. Sheria hii inalenga kuwezesha kutumiwa kwa mali ambayo inaweza kuhamishwa kama dhamana ya mkopo. Kimsingi sheria hii inaruhusu taasisi au mtu binafsi kutumia mali inayoweza kuhamishwa ((tofauti na mali kama vile ardhi) kama dhamana kupata mkopo.
Hakukuwa na mabadiliko yoyote makubwa katika usimamizi au changamoto kubwa kwa biashara zetu tanzu mwaka 2017. Nchini Kenya, mwongozo wa
TAARIFA YA MWENYEKITI WA KUNDI
25
maadili ya usimamizi kwa watoaji wa hisa na hati za dhamana kwa umma, uliotayarishwa na Mamlaka ya Masoko ya Mtaji, uliidhinishwa kuwa sheria Machi 2016. Ulianza kutekelezwa kikamilifu Machi 2017. Kampuni zilizoorodheshwa katika soko la hisa zinatakiwa kufuata kikamilifu mwongozo huo na kuainisha mpangilio wake wa usimamizi pamoja na uongozi kwenda sambamba nao.
Shughuli za BodiTumekuwa tukifanya utathmini wa utendakazi wa bodi kwa kutumia wanachama wa bodi kutoka nje na nina furaha kuwafahamisha kwamba tulipata alama 91 ambazo kuambatana na viwango vya kimataifa, ni matokeo ya juu sana. Kadhalika, tulizindua Mkataba wa Huduma ya Bodi, ambao ndio wa kisasa zaidi. Lengo la mkataba huu ni kuongoza shughuli za bodi.Mwaka uliomalizika, Bodi ilikuwa imara. Baadhi ya wanachama waliondoka na wengine wakajiunga na bodi kwa mpangilio mzuri kuhakikisha shughuli zinaendelea bila kutatizika.
Kadhalika, tuliwekeza katika programu ya kompyuta ya kusimamia habari muhimu za bodi. Programu hii inatarajiwa kulainisha shughuli za bodi. Aidha, itaainisha maazimio kwenye bodi na kote kwenye kampuni ili kusawazisha mtiririko wa habari muhimu.Katika mwaka uliomalizika, tuliimarisha kiwango cha utendakazi wa bodi hadi kuwa alama 46. Kiwango hicho ni miongoni mwa viwango vya juu zaidi katika sekta ya benki kanda hii, na hilo linatarajiwa kuimarisha utendakazi.
Katika bodi, kulitokea mabadiliko kadha, ambapo wakurugenzi saba walistaafu na watano wakateuliwa. Bi. Charity Muya Ngaruiya na Jen (Mstaafu) Joseph Kibwana walistaafu baada ya kutimiza umri wa miaka 70 naye Bi. Catherine Kola akastaafu baada ya kuhudumu kwa kipindi kirefu zaidi kinachoruhusiwa cha miaka nane. Nchini Rwanda Bi. Sarah Mukatundiye alijiuzulu nafasi yake kama mkurugenzi na Bi. Anne Muchoki na Bw. Faustin Mbundu wakastaafu baada ya kuhudumu kwa kipindi kirefu zaidi kinachoruhusiwa cha miaka nane. Nchini Uganda Bw. Protus Sigei alistaafu baada ya kuhudumu kwa kipindi kirefu zaidi kinachoruhusiwa cha miaka nane.
Wakurugenzi watano wapya waliteuliwa; Dkt. Nancy Onyango kwenye Bodi ya Kampuni na Bodi ya Kenya naye Bw. Andrew Kairu akajiunga na Bodi ya Kenya; Bw. Austen Barasa na Bi. Alice Kirenge walijiunga na Bodi ya Wakfu wa KCB; Bi. Antonia Muturo nchini Rwanda na Bw. Edgar Omoto nchini Uganda.
Kujenga taasisi ya kuaminikaMsingi wa benki ni kuaminika kwake. Kama benki inayoongoza katika sekta hii, tumefanya juhudi katika kujenga imani ya wateja katika shughuli zetu kwa sababu hili ni muhimu sana katika uendelevu wa biashara.
Tunaendeleza uaminifu huu kwa kuwasikiliza kwa makini wateja wetu, kushauriana nao na kurahisisha shughuli yao kufanya biashara nasi. Matokeo yake ni kwamba viwango vya kuaminika vimekuwa vikiimarika na katika mwaka uliomalizika utafiti huru ulibaini kwamba viwango vya kuaminika vya Benki hii vimekuwa vikiongezeka na kufikia asilimia 87.
Ni lazima tuendelee kuwekeza katika miundo msingi inayosaidia kuboresha utendakazi na kuwapa wateja wetu huduma kwa njia inayorahisisha maisha yao na pia kulinda mali yao ili kukuza biashara yetu.
Kwa kutambua hili, tumetilia mkazo sana juhudi za kujenga imani ya wateja kwa kuwasikiliza, kutimiza mahitaji yao na kuendesha shughuli zetu kwa kufuata viwango vya juu zaidi vya ubora na maadili.
Biashara tanzuKatika kanda, Kampuni iliendelea kunawiri licha ya changamoto zilizokuwepo. Wakati huo huo, tuliendelea kushauriana na maafisa wa serikali kuhusu masuala ambayo yaliathiri shughuli zetu za kibiashara. Nchini Sudan Kusini kwa mfano, tulikabiliwa na changamoto zilizotokana na mazingira magumu ya kufanyia kazi, hali iliyoathiriwa zaidi na kiwango cha juu cha mfumko na uhaba wa sarafu za kigeni.
Kama Kampuni, tunafanya kila juhudi kulainisha shughuli zetu katika mataifa tunayohudumu huku tukielewa mazingira yaliyopo.
UendelevuKama biashara hatuongozwi na haja ya kutengeneza faida pekee. Tunaamini kwamba tuna jukumu la kutoa mchango kwa jamii na kusaidia uhifadhi wa mazingira.
Ni kupitia mipango kama vile mifugo ni mali – ambapo tunaziwezesha familia za wafugaji kujitosheleza kifedha – na 2Jiajiri ambapo tunalenga kuwapa vijana ujuzi utakaowawezesha kuanzisha biashara zao – ambapo benki hii imeweza kubadilisha maisha ya watu wengi katika jamii. Mipango hii hutekelezwa chini ya Wakfu wa KCB ambao katika mwaka wake wa kumi uligusa maisha ya wengi kupitia mipango ya afya, mazingira, kutoa mafunzo kwa vijana na kuwainua kifedha wafugaji.
Kando na huduma za kimsingi za kifedha na benki ambazo tayari tunatambulika kwazo katika jamii, tunataka tutambuliwe pia kwa miradi mingine inayoifaa jamii.
Mtazamo wa siku zijazoKatika mwaka ujao, tutatathmini mambo ambayo tumeweza kuyatimiza katikati ya kipindi cha mpango wetu wa mkakati wa miaka mitano. Utathmini huu utatusaidia kujua kwa ufasaha mambo ambayo tunahitajika kufanya katika kipindi kilichosalia cha utekelezaji wa mpango huu wa mikakati na vilevile kuweka msingi wa mpango wa mikakati wa miaka mitano ijayo.
Ngeny BiwottMwenyekiti wa Kundi
Ni lazima tuendelee
kuwekeza katika miundo msingi
inayosaidia kuboresha utendakazi na kuwapa
wateja wetu huduma kwa njia
inayorahisisha maisha yao na
pia kulinda mali yao ili kukuza
biashara yetu.”
KCB INTEGRATED REPORT AND FINANCIAL STATEMENTS | 2017
26
How was the year 2017 like? Although it was not entirely unanticipated, the year 2017 proved a challenging one for the Group on the back of various setbacks at the macro level, among them the impact of the interest rate cap, widespread drought, rising political temperatures in our key markets, slow-down in credit uptake and generally lethargic economic growth.
The prolonged electioneering period in Kenya acted as a damper to the economy and triggered the onset of a slowdown in business performance as clearly evidenced by a number of profit warnings by publicly listed companies.
Despite these challenges, KCB Group profit remained flat, mainly spurred by a spike in consumer and corporate loans while our continued investments in fintech paid off with increased uptake of loans on the mobile platform. Our new fintech platform, allows for full integration of customer transactions.
Despite these setbacks, we delivered on all our key measures, posting a 20% return on investment, growing our loan book by 10% and increasing staff productivity to an all-time high of 87% according to a staff engagement survey.
How has the business come to terms with the emergence
of Fintech as a key driver for the business?We have a long term strategy of continuous investments in fintech because we see that as the only way to stay ahead of the pack. We also believe that we must innovate for the greater good of our customers. In this regard, we have invested KShs. 1.5 billion in a new Huawei platform which will help drive our ambition to see at least 80% of all new transactions onto the mobile platform in the near future. Already, we are lending upwards of KShs. 30 billion on the mobile platform, which, incidentally, has an unprecedented repayment rate of over 95%. Our plan is to connect the ecosystem to enable our customers’ transact on the digital platform.
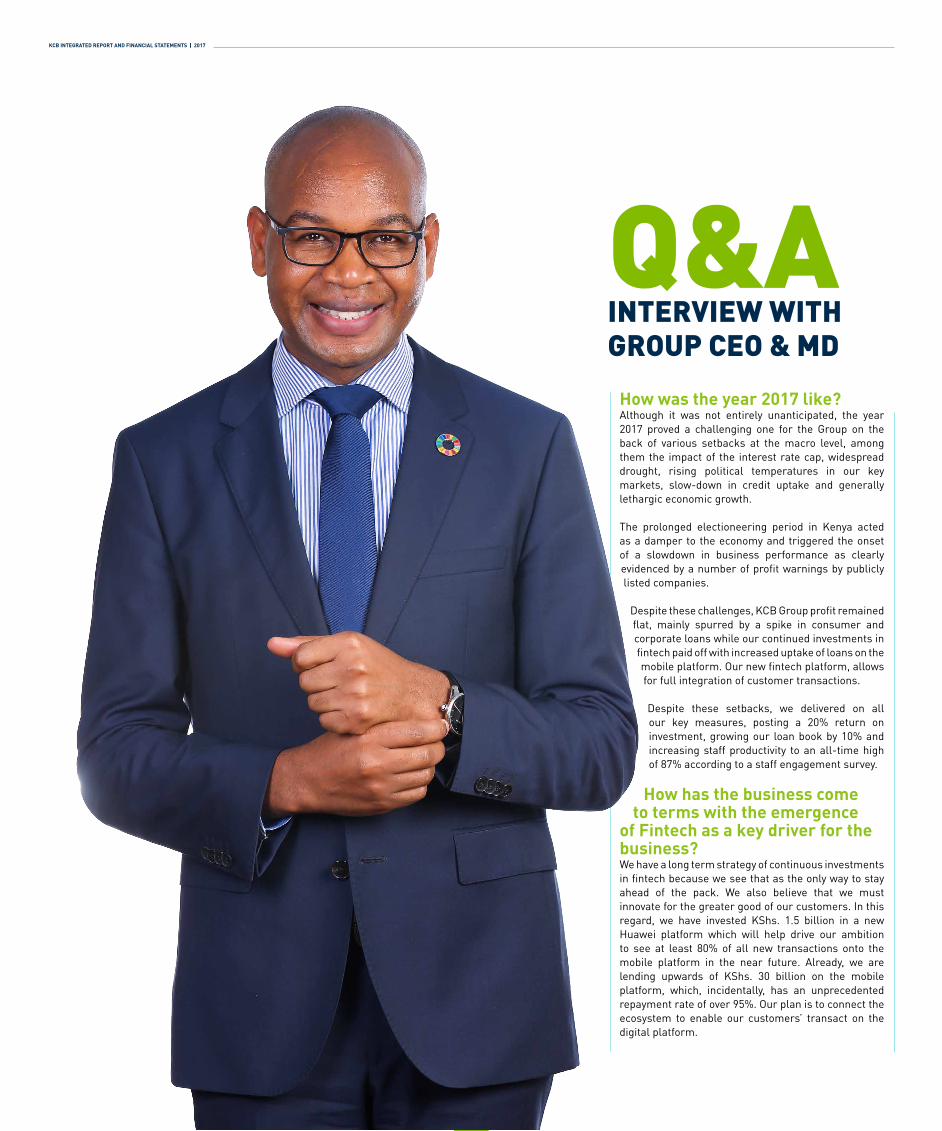
Q&AINTERVIEW WITH GROUP CEO & MD
27
This was the first full year following the introduction of the interest rate cap in 2016. How did you weather the storm?While the banking sector felt the full impact of the interest rate cap introduced in 2016 during the year under review, we weathered the storm by instituting critical strategic initiatives that countered the negative impact. Changing the model of our business was critical in dealing with the hurdles that beset the sector.
We focused on the areas that we are strong at such as consumer and corporate lending, improved the loan book and managed operating costs. This is the same model that we are seeing through in 2018. Demand for credit remained high, with a 10% increase in corporate and consumer lending, though there was a slight drop in lending to the small and medium scale enterprises following a review of the credit score cards for the sector.
We continue engaging the authorities on the matter of interest rate capping which the industry feels not only goes against the spirit of liberalization and free market, but it hurts those it was supposed to provide relief. If we must have interest rate caps, they should be strategically applied to boost sectors that have traditionally been starved of funding, such as agricultural and SME sectors.
You have the largest branch network in the country; what is their future given the shift towards the digital platform?We are seeing a huge reduction in branch transactions but that will not necessarily result in mass branch closures. Although we see 90% of our transactions taking place on the digital platform by 2020, branches will remain a strategic imperative as we position the bank to offer personalized service as opposed to their traditional roles. Currently, we have over 15 million customers, of whom 10 million mainly use the digital channels to transact.
We are seeing new competitors from unexpected quarters; how are you dealing with this?The competition landscape is changing, with new players coming onto the scene and playing the role that traditional banks have been playing. Global technology companies are eying opportunities in fintech through exploring payment options that will disrupt the traditional banking model. We must protect our turf by being innovative, understanding our customers better and staying on the cutting edge of technology by investing heavily in state of the art
platforms. The entry of these global giants present an imminent danger that must be acted on lest we are caught flat footed.
What is the state of the Bank’s subsidiaries?Uganda, Rwanda and Tanzania posted stable growth but we experienced some challenges in Burundi while the situation in South Sudan did not improve much from the previous year. Hyperinflation, an unstable currency and inability to repatriate earnings hurt our South Sudan subsidiary. We are however very hopeful that the peace negotiations that have already been initiated will result in a positive resolution to the crisis. We work very closely with the UN security Council panel of experts on South Sudan in complying with any sanctions. At the same time, we will continue to monitor the country closely.
What is your take on the role of KCB in entrenching sustainability in the business?As a business, we do not exist solely to make money; we have to also take care of the communities in which we operate in by lending a helping hand where we can. To leave a lasting impact on these communities, we work closely with partners to empower communities and more importantly, our future customers as well. Companies that invest more in the communities they operate in deliver a better return on investments than their peers in the same sector. We see ourselves not only as early adopters but also as catalysts for adopting SDGs by corporate entities.
We have been working with Mastercard Foundation on a USD30 million project - dubbed Mobigrow – targeting 500,000 farmers who will be provided with the necessary information and tools that will enhance their productivity through this collaboration.
NPLs have been a big problem to the entire industry. How is the Group managing them?Non-Performing Loans have been the bane of the banking industry for a long time. They have weighed heavily on banks’ operations triggered by the prevailing harsh macro-environment. However, we have over the recent past put in place measures that have tamed NPL’s which now stand at 8.5% against the industry average of 10.6%.
Our challenge has mainly been with a few corporate clients - five of whom contribute three quarters of the NPLs – who have faced operational challenges as a result of a general slow-down in the economy. However, we have engaged these clients and restructured the debt to tide them through the tough times.
IFRS 9 and its implementation is the talk of the banking sector. How will it impact on operations?Although there have been jitters about the implementation of IFRS9 and the effect it will have on the operations of the local banking sector, these fears have been over played. This is not a totally new standard to us. In fact, we have been modelling the standard over the last 18 months and, in January 2018, we were fully compliant. Our only concern is that all the banks may not be ready at the same time, in line with CBK’s deadline of December 2018. Overall, we expect the cost of risk to go up by 25% as a result of implementation of IFRS9.
The Government is laying emphasis on what is being referred to as the Big Four agenda; is there a role for the bank to play in realising these development pillars? The government has enumerated four pillars of growth in the next five years: housing, agriculture, healthcare, and manufacturing. As the largest lender to the manufacturing sector and mortgages market, we see ourselves playing a critical role in realizing these initiatives. On housing, we want to take this a notch higher by entering into Public Private Partnership to develop affordable housing that cost less than Kshs. 2.5 million. We are starting with 20,000 units under a government project that is targeting at providing housing to the police.
What does the coming year hold for the Bank?We are very bullish about 2018 since we are seeing credit coming back in manufacturing, real estate bouncing back, agriculture and energy. Tourism is showing a promise of a resurgence, and with the recent commissioning of direct flights to the US, we will see increasing numbers of tourists.
As a business, we see all these pointers leading to increased credit uptake while on the regulatory front, we are hoping that some of the bottlenecks that have been hampering growth – such as the credit squeeze occasioned by the interest rate capping – will be resolved to allow us continue playing a meaningful role in growing our economies.
Joshua OigaraGroup CEO & MD
KCB INTEGRATED REPORT AND FINANCIAL STATEMENTS | 2017
28
Mwaka 2017 ulikuwaje kibiashara?Mwaka 2017 ulikuwa na changamoto nyingi kwa kampuni yetu kwa jumla, jambo ambalo kwa kiwango fulani lilitarajiwa. Miongoni mwa mambo yaliyoathiri Kampuni ni kuwekwa kwa kipimo cha viwango vya riba, ukame na misukosuko ya kisiasa katika mengi ya mataifa tunayoendesha shughuli zetu za kibiashara. Pia, watu kutochukua mikopo kwa wingi na kwa jumla kupungua kwa kasi ya ukuaji wa uchumi.
Kuwepo kwa kipindi kirefu cha uchaguzi Kenya kuliathiri uchumi na kusababisha kuathirika kwa biashara.
Lakini licha ya changamoto hizi, Kampuni ya KCB ilibaki imara na kuandikisha mapato kutoka kwa uwekezaji asilimia 20. Ukuaji huu kwa kiwango kikubwa ulichangiwa na ongezeko kubwa la mikopo iliyochukuliwa na wateja wakibinafsi pamoja na kampuni na mashirika mbalimbali. Uwekezaji wetu katika huduma ya kiteknolojia ya Fintech pia uliendelea
kuzaa matunda kwa kuchangia ongezeko la mikopo iliyotolewa kwa njia ya simu.
Licha ya matatizo haya, tulipata matokeo mazuri katika maeneo muhimu kibiashara. Tulipata mapato ya asilimia 20 kutoka kwa uwekezaji, mikopo tuliyowakopesha wateja ikaongezeka kwa asilimia 10 na kipimo cha utendaji shughuli vyema kikaimarika na kufikia asilimia 50.
Biashara imebadilika vipi tangu mlipoikumbatia Fintech kama mchangiaji mkuu wa biashara?Tuna mpango wa muda mrefu wa kuendelea kuwekeza katika Fintech kwa sababu tunaitazama huduma hii kama njia pekee ya kusalia mbele ya wale wengine. Tunaamini kwamba ni lazima tuendelee kuvumbua ili pia tuwahudumie wateja wetu vyema zaidi. Kutokana na hili, tumewekeza dola 15 milioni za Marekani katika mfumo ambao utatuwezesha kutimiza lengo letu la kuhakikisha angalau asilimia 80 ya shughuli mpya za kibiashara katika benki yetu hivi karibuni zinafanywa kwa kutumia simu. Tayari kufikia sasa tunawakopesha wateja karibu shilingi bilioni 30 kupitia huduma hii inayotumia simu. Jambo la kufurahisha ni kwamba tumeshuhudia kiwango cha juu sana cha ulipaji wa mikopo kupitia huduma hii, ambacho kimefikia zaidi ya asilimia 95.
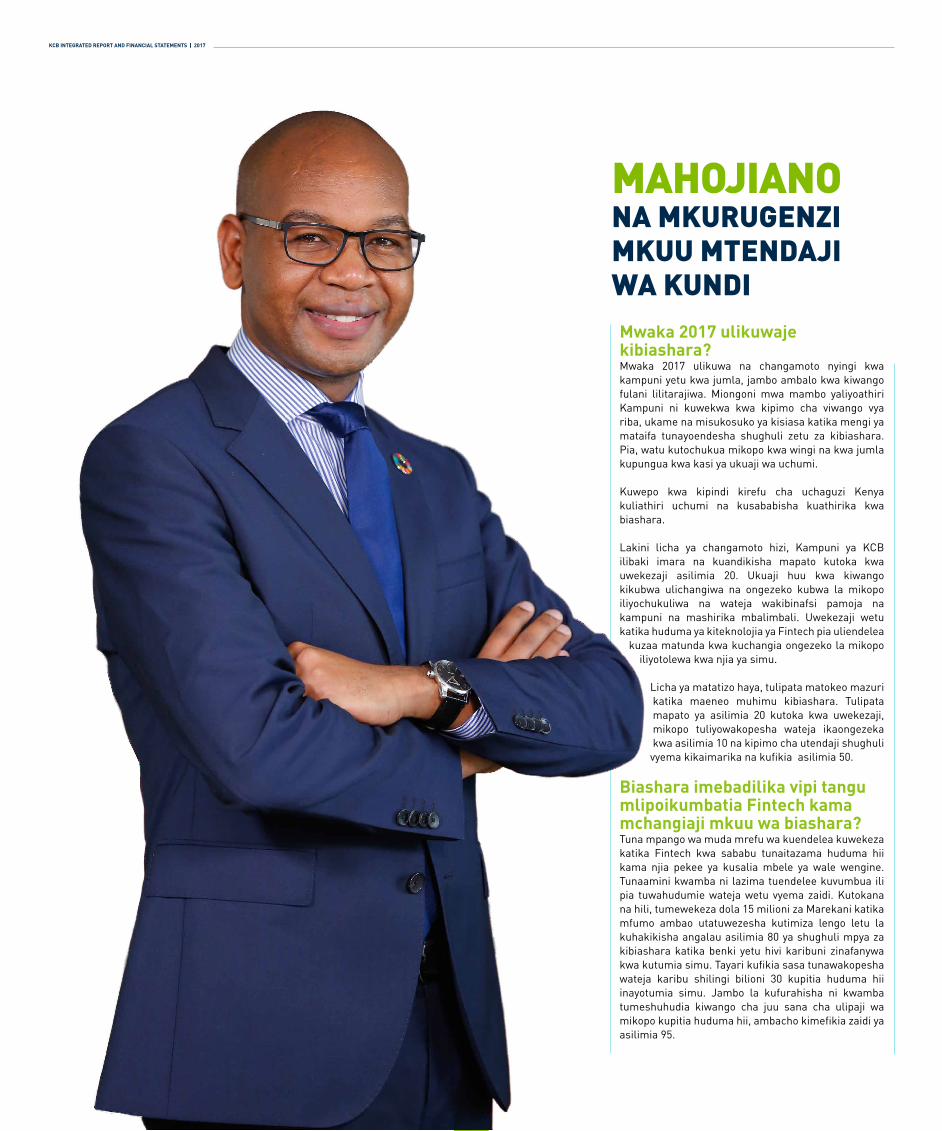
MAHOJIANO NA MKURUGENZI MKUU MTENDAJI WA KUNDI
29
Mliwezaje kuhimili na kuzoea utekelezaji wa sheria ya kuweka kipimo katika viwango ya riba?Ingawa ni kweli sekta ya benki iliathirika pakubwa na sheria hii ya kipimo katika viwango vya riba, ambayo ilianza kutekelezwa mwaka 2016, katika mwaka ambao tunaurejelea sasa, tulibadilisha mkakati wetu na kuanza kutekeleza mipango ya kuongeza idadi ya wateja, kuboresha utendaji wa biashara na kuongeza mapato kutokana na ada za benki zisizotozwa riba ili kujikinga. Ilikuwa muhimu sana kufanya mabadiliko haya ili kukabiliana na changamoto zilizokumba sekta hii ya benki.
Hitaji la kutoa mikopo lilisalia kuwa juu, ambapo ukopeshaji kwa kampuni na mashirika na wateja binafsi ulipanda kwa asilimia 10. Hata hivyo, tulishuhudia kupungua kiasi kwa ukopeshaji kwa asasi ndogo na za wastani za kibiashara kutokana na kutathminiwa upya kwa viwango vya uwezo wa kulipa mikopo wa asasi hizo.
Mna mtandao mkubwa zaidi wa matawi ya benki kanda hii; hatima ya matawi haya ni gani ikizingatiwa kwamba mnakumbatia zaidi mfumo wa kidijitali?Ndio, tunashuhudia kupungua kwa shughuli za kibiashara zinazotekelezwa kila siku kwenye matawi yetu. Lakini hili halina maana kwamba tutalazimika kufunga matawi kwa wingi. Ingawa tunatarajia asilimia 90 ya shughuli za kibiashara katika benki yetu zitakuwa zikitekelezwa kupitia mfumo wa kidijitali ifikapo mwaka 2020, matawi yetu yatasalia kuwa kiungo muhimu. Tunakusudia kuifanya benki hii kuwa ikitoa huduma zinazoangazia zaidi mahitaji ya kibinafsi ya wateja kinyume na ambavyo hali imekuwa kwa muda mrefu. Kwa sasa, tuna wateja zaidi ya 15 milioni. Kati ya hao, 10 milioni tayari hutumia mifumo ya kidijitali kufanya shughuli za kibiashara. Matokeo yake ni kwamba tutawapanga upya wafanyakazi wetu kuambatana na uhalisia huu.
Kuna washindani wapya kutoka maeneo ambayo hayakutarajiwa; mnakabiliana vipi na hali hii?Mazingira katika sekta ya benki yamekuwa yakibadilika. Kila siku, kuna wahudumu wanaojitokeza na kuanza kutekeleza majukumu ambayo zamani yalitekelezwa na benki pekee. Kampuni za teknolojia duniani ni miongoni mwa wale wanaotazama fursa zinazoletwa na huduma ya Fintech, na wanafikiria njia za mifumo ya malipo ambayo itavuruga mpangilio wa zamani wa benki. Ni lazima tujilinde kwa kuwa wabunifu zaidi, kuwaelewa vyema wateja wetu na kufahamu mahitaji yao na kisha kutumia teknolojia ya kisasa. KCB tayari imeanza kutoa huduma zinazotumia teknolojia mpya. Mwaka ujao, tunapanga kufanikisha huduma ambayo itawawezesha wateja kulipa, kukopa na kuweka pesa zao kwenye akaunti wakiwa popote pale kwa kutumia vifaa mbalimbali. Tutafanikisha haya kwa uwekezaji wetu binafsi au kwa ushirikiano na wadau wengine.
Hatima ya benki tanzu za benki hii ni gani?Benki ya KCB Uganda, Benki ya KCB Rwanda na Benki ya KCB Tanzania zote ziliandikisha ukuaji wa kuridhisha. Hata hivyo, tulipata changamoto kadha katika Benki ya KCB Burundi. Hali ya Benki ya KCB Sudan Kusini haikuimarika sana ikilinganishwa na mwaka uliotangulia. Kiwango cha juu cha mfumko wa bei, kuyumbayumba kwa thamani ya sarafu na kutoweza kuhamisha mapato kutoka kwa benki hiyo vyote vilitatiza biashara yetu huko. Tuna imani hata hivyo kwamba mazungumzo ya amani ambayo tayari yameanzishwa yatazaa matunda. Tunafanya kazi kwa karibu sana na jopo la wataalamu la Baraza la Usalama la Umoja wa Mataifa kuhusu Sudan Kusini katika kutimiza vikwazo vilivyowekwa.
Mtazamo wako ni upi kuhusu mchango wa KCB katika kuhakikisha uendelevu katika kanda hii?Hatupo tu kwa ajili tu ya kutengeneza faida, huwa tunaendesha biashara yetu tukifikiria pia kuhusu uendelevu, ambao unaangaziwa katika nguzo tatu kuu – nguzo ya kifedha, kiuchumi pamoja na kijamii na kimazingira. Ili kutimiza hili, Kampuni hii imekumbatia, kuainisha na kuchagua Malengo Manane ya Maendeleo Endelevu maarufu kama SDGs katika mpango wetu wa mikakati. Tunaamini kwa dhati kwamba hatua yetu ya kuwa kielelezo cha biashara endelevu itaendeleza sifa hizi nzuri kwa jamii na hatimaye kwa wateja wetu wa siku za usoni. Kampuni ambazo huwekeza na kuwezesha uendelevu wa wafanyakazi wake pamoja na shughuli zake mwishowe huvuna matunda zaidi kutoka kwa uwekezaji walioufanya kuliko wenzao wanaofanya biashara sawa. Kama kampuni, tunajitazama sio tu kama watu wanaokumbatia mabadiliko mapema bali pia kama kichocheo kwa kampuni na mashirika mengine kukumbatia SDGs.
Ubora wa mali ni kipimo muhimu katika sekta ya benki. Sekta hii inapokabiliana na hili kwa pamoja, KCB imeangaziaje hili?Mikopo ambayo hailipwi imekuwa tatizo kuu kwa sekta ya benki kwa muda mrefu. Mikopo hii imekuwa mzigo sana kwa biashara ya benki, hasa kutokana na mazingira magumu ya kibiashara. Hata hivyo, katika siku za karibuni, tumeweka mikakati ambayo imepunguza pakubwa idadi ya mikopo ambayo hailipwi (NPL). Mikopo hii kwa sasa ni asilimia 8.5 ukilinganisha na kiwango cha wastani cha asilimia 10.6 kwa sekta hii kufikia mwisho wa 2017 kanda hii.
Tatizo letu kuu limekuwa kuhusu kampuni na mashirika kadha ambayo yamekuwa yakikabiliwa na changamoto za uendeshaji shughuli na usimamizi.Hadhi yao ya kuweza kukopeshwa imeshushwa kutokana na hilo, kwa kufuata mwongozo uliowekwa. Hata hivyo, tunaendelea kushirikiana nao wakati huu mgumu na tuna imani kwamba baadhi wanaweza kujikwamua na kuanza kulipa tena mikopo.
IFRS 9 na utekelezaji wake ni mambo ambayo yanazungumziwa sana sekta ya benki. Itaathiri vipi shughuli zenu?Ingawa kumekuwa na wasiwasi kuhusu utekelezwaji wa IFRS 9, ambacho ni kiwango cha kimataifa cha kuandika taarifa za hali ya kifedha kinachotumiwa kwa sasa, pamoja na athari zake kwa uendeshaji shughuli katika sekta ya benki, kwa kweli wasiwasi huu umetiwa chumvi. Hiki si kigezo ambacho ni kipya. Kusema kweli, tumekuwa tukitekeleza matakwa hayo kwa majaribio kwa miezi 18 iliyopita. Kufikia Januari 2018, tulikuwa tumetimiza masharti yote. Hofu yetu pekee ni kwamba benki zote hazitakuwa tayari wakati mmoja. Kwa jumla, tunatarajia kwamba gharama ya hatari itapanda kwa asilimia 25 kutokana na utekelezaji wa IFRS 9. Uwiano wa mtaji wetu nao utapungua mara moja pekee kwa alama 150.
Serikali imetilia mkazo sana kile kinachoitwa Ajenda Nne Kuu; kuna mchango wa KCB katika kutimiza nguzo hizi kuu za maendeleo?Serikali imetaja nguzo nne kuu za ukuaji ambazo itaangazia miaka mitano ijayo: nyumba, chakula, huduma ya afya kwa wote na viwanda. Sisi kama asasi kubwa zaidi inayokopesha wadau katika sekta ya viwanda na pia ujenzi wa nyumba, tunaamini tutatekeleza mchango muhimu katika kutimiza malengo haya. Kuhusu nyumba, tunataka kupeleka hili hatua zaidi kwa kuingia katika ushirikiano na serikali kujenga nyumba za gharama nafuu zitakazogharimu chini ya Kshs. 2.5 milioni. Tutaanza kwa nyumba 20,000 chini ya mradi wa serikali ambao unalenga kutoa makazi kwa polisi.
Mwaka ujao tutarajie nini kutoka kwa Benki hii?Tuna matumaini makubwa kuhusu 2018 kwa sababu sasa tunashuhudia uwekezaji katika sekta ya utengenezaji wa bidhaa, nyumba na ardhi, kilimo na kawi. Sekta ya utalii pia inaonyesha matumaini ya kuimarika. Tunatarajia ongezeko la idadi ya watalii, hasa ukizingatia kwamba safari za moja kwa moja za ndege kati ya Marekani na Kenya zitaanza karibuni.
Kwetu sisi, tunavitazama viashiria hivi vyote kama ishara kwamba kiwango cha mikopo inayochukuliwa kitapanda. Katika upande wa sheria, tunatarajia kwamba baadhi ya mambo ambayo yametatiza ukuaji, hasa kupungua kwa mikopo inayotolewa kutokana na sheria iliyoweka kipimo kwenye kiwango cha riba, yatatuliwa. Hili litatuwezesha kuendelea kutekeleza mchango wetu muhimu katika mataifa haya yanayoendelea kukua kiuchumi.
Joshua OigaraMkurugenzi Mkuu Mtendaji Wa Kundi
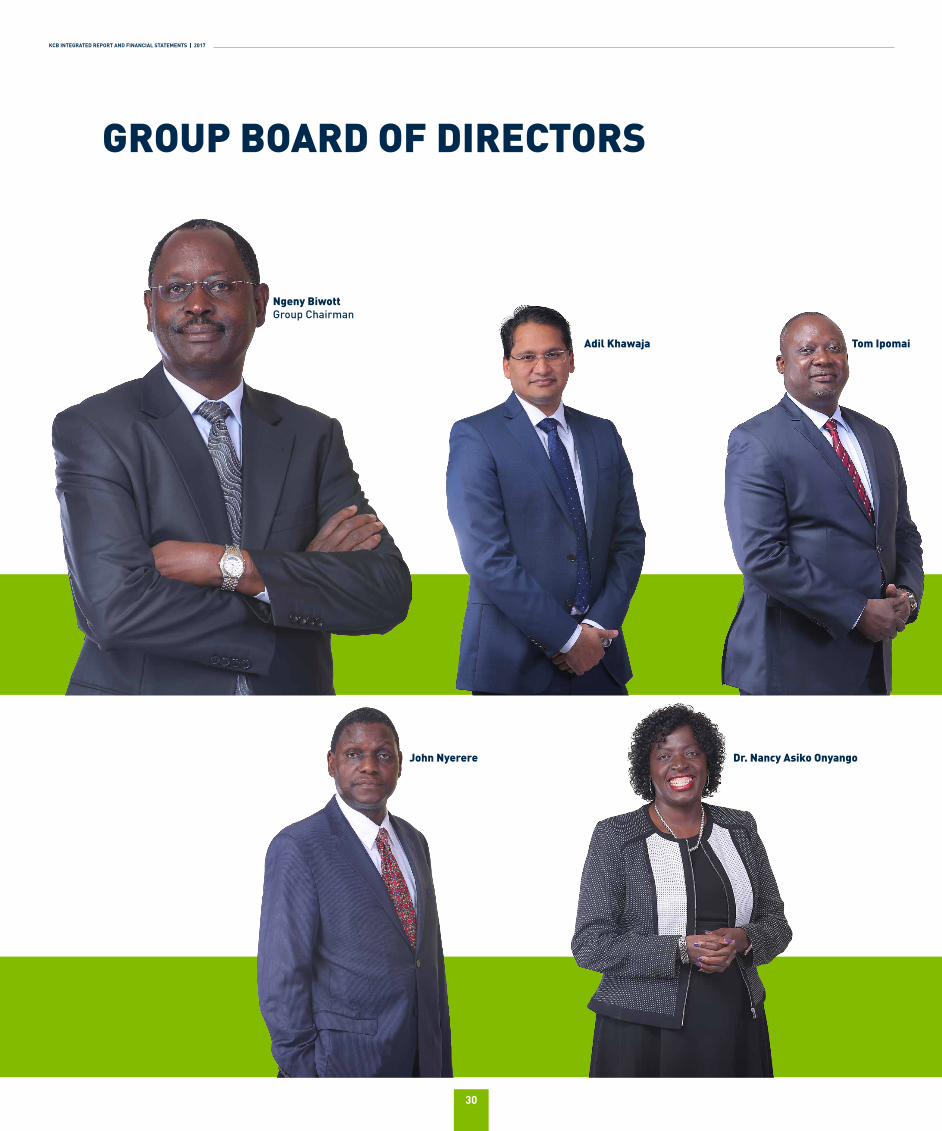
KCB INTEGRATED REPORT AND FINANCIAL STATEMENTS | 2017
30
Ngeny BiwottGroup Chairman
GROUP BOARD OF DIRECTORS
Adil Khawaja Tom Ipomai
John Nyerere Dr. Nancy Asiko Onyango
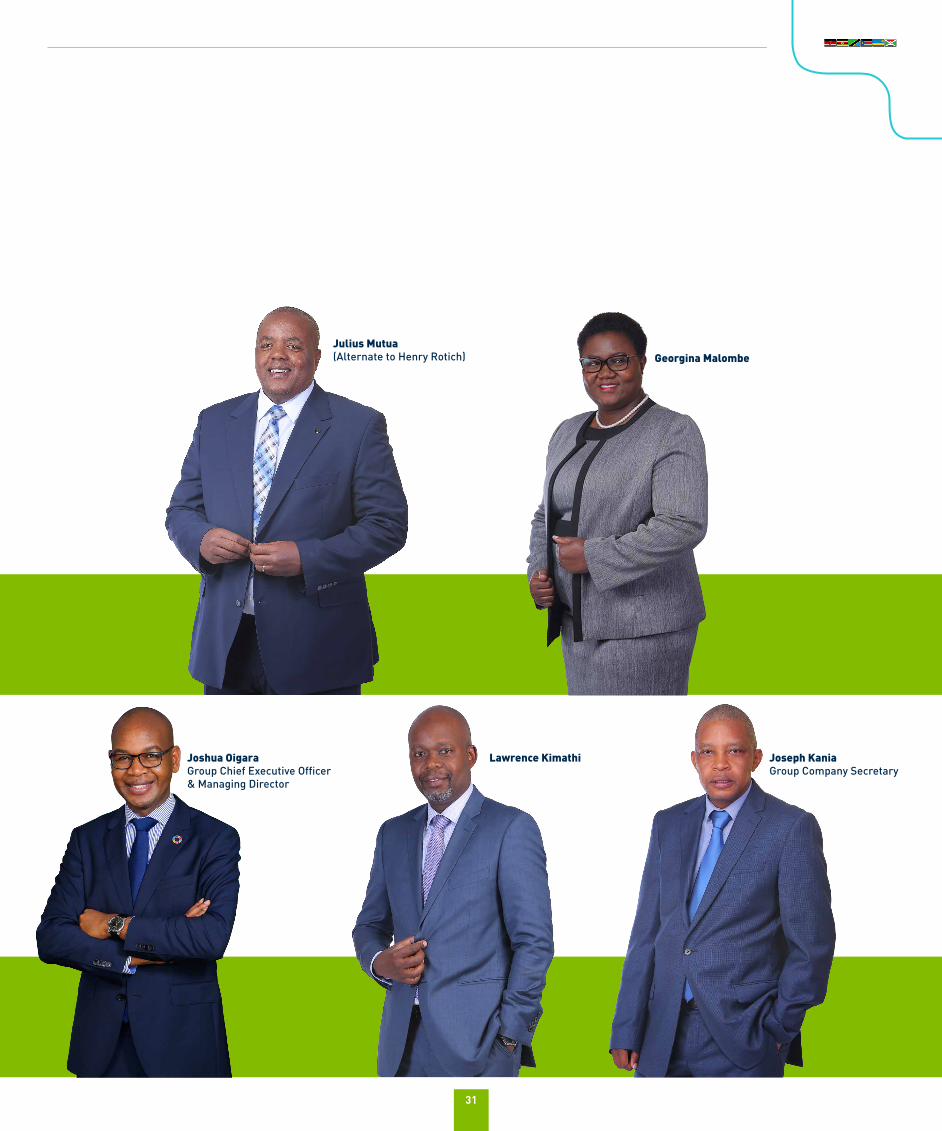
31
Julius Mutua(Alternate to Henry Rotich) Georgina Malombe
Lawrence KimathiJoshua OigaraGroup Chief Executive Officer & Managing Director
Joseph KaniaGroup Company Secretary
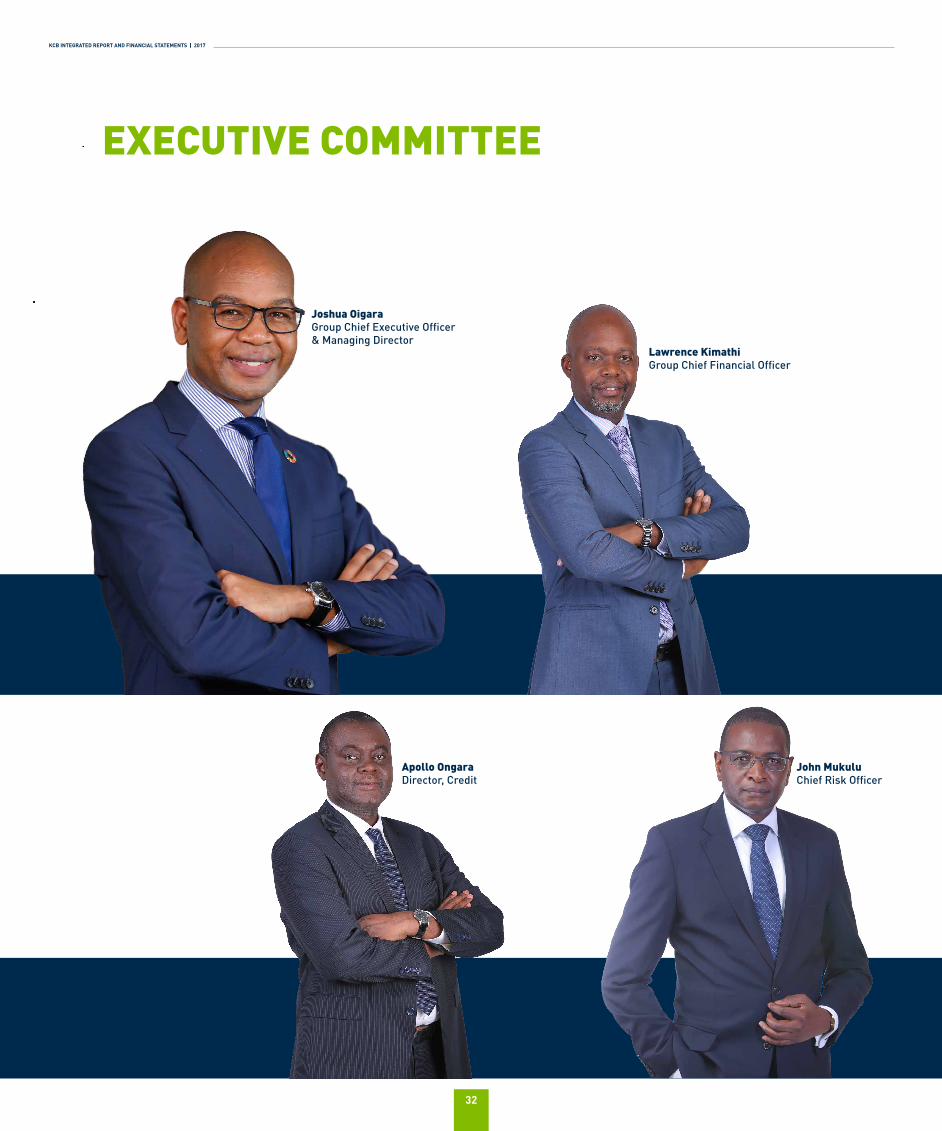
KCB INTEGRATED REPORT AND FINANCIAL STATEMENTS | 2017
32
EXECUTIVE COMMITTEE
Joshua OigaraGroup Chief Executive Officer & Managing Director
Lawrence KimathiGroup Chief Financial Officer
John MukuluChief Risk Officer
Apollo OngaraDirector, Credit
33
John MukuluChief Risk Officer
Paul RussoGroup Human Resource Director
Samuel MakomeGroup Chief Operating Officer
Judith Sidi OdhiamboGroup Head Corporate & Regulatory Affairs
Jane MwangiExecutive Director KCB Foundation
Joseph KaniaGroup Company Secretary
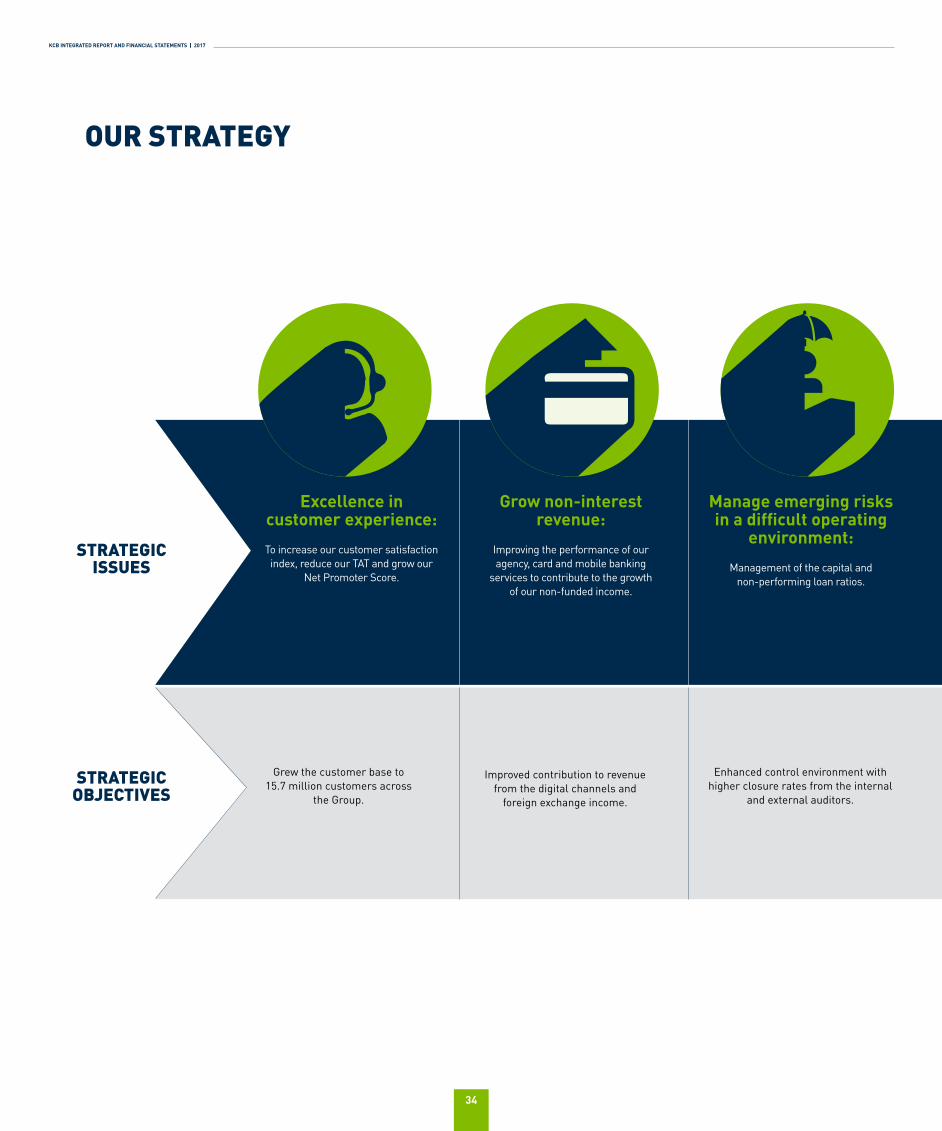
KCB INTEGRATED REPORT AND FINANCIAL STATEMENTS | 2017
34
OUR STRATEGY
Grew the customer base to 15.7 million customers across
the Group.
Improved contribution to revenue from the digital channels and
foreign exchange income.
Enhanced control environment with higher closure rates from the internal
and external auditors.
Manage emerging risks in a difficult operating
environment:
Management of the capital and non-performing loan ratios.
Grow non-interest revenue:
Improving the performance of our agency, card and mobile banking
services to contribute to the growth of our non-funded income.
Excellence in customer experience:
To increase our customer satisfaction index, reduce our TAT and grow our
Net Promoter Score.
STRATEGIC ISSUES
STRATEGIC OBJECTIVES
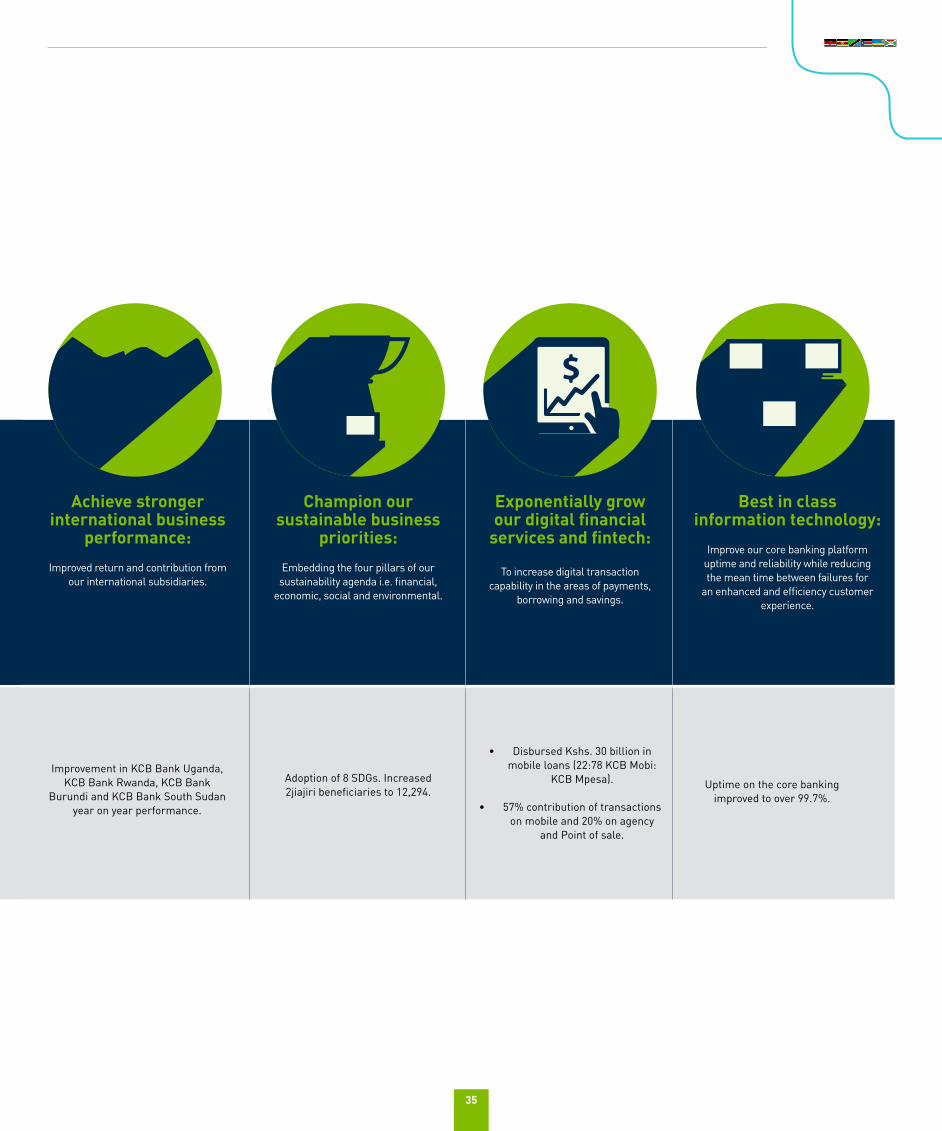
35
Improvement in KCB Bank Uganda, KCB Bank Rwanda, KCB Bank
Burundi and KCB Bank South Sudan year on year performance.
Adoption of 8 SDGs. Increased 2jiajiri beneficiaries to 12,294.
• Disbursed Kshs. 30 billion in mobile loans (22:78 KCB Mobi:
KCB Mpesa).
• 57% contribution of transactions on mobile and 20% on agency
and Point of sale.
Uptime on the core banking improved to over 99.7%.
Achieve stronger international business
performance:
Improved return and contribution from our international subsidiaries.
Champion our sustainable business
priorities:
Embedding the four pillars of our sustainability agenda i.e. financial,
economic, social and environmental.
Exponentially grow our digital financial
services and fintech:
To increase digital transaction capability in the areas of payments,
borrowing and savings.
Best in class information technology:
Improve our core banking platform uptime and reliability while reducing the mean time between failures for
an enhanced and efficiency customer experience.
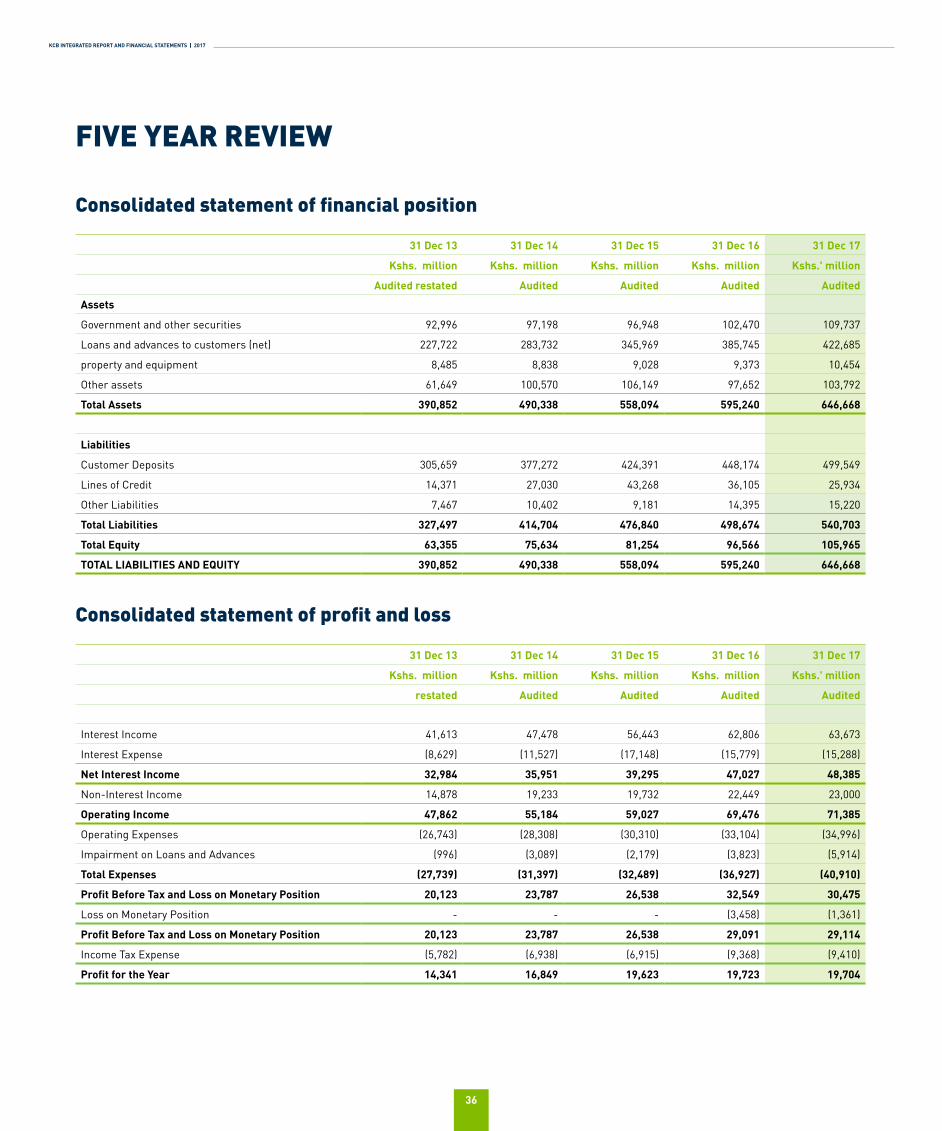
KCB INTEGRATED REPORT AND FINANCIAL STATEMENTS | 2017
36
FIVE YEAR REVIEW
Consolidated statement of financial position
31 Dec 13 31 Dec 14 31 Dec 15 31 Dec 16 31 Dec 17
Kshs. million Kshs. million Kshs. million Kshs. million Kshs.' million
Audited restated Audited Audited Audited Audited
Assets
Government and other securities 92,996 97,198 96,948 102,470 109,737
Loans and advances to customers (net) 227,722 283,732 345,969 385,745 422,685
property and equipment 8,485 8,838 9,028 9,373 10,454
Other assets 61,649 100,570 106,149 97,652 103,792
Total Assets 390,852 490,338 558,094 595,240 646,668
Liabilities
Customer Deposits 305,659 377,272 424,391 448,174 499,549
Lines of Credit 14,371 27,030 43,268 36,105 25,934
Other Liabilities 7,467 10,402 9,181 14,395 15,220
Total Liabilities 327,497 414,704 476,840 498,674 540,703
Total Equity 63,355 75,634 81,254 96,566 105,965
TOTAL LIABILITIES AND EQUITY 390,852 490,338 558,094 595,240 646,668
Consolidated statement of profit and loss
31 Dec 13 31 Dec 14 31 Dec 15 31 Dec 16 31 Dec 17
Kshs. million Kshs. million Kshs. million Kshs. million Kshs.' million
restated Audited Audited Audited Audited
Interest Income 41,613 47,478 56,443 62,806 63,673
Interest Expense (8,629) (11,527) (17,148) (15,779) (15,288)
Net Interest Income 32,984 35,951 39,295 47,027 48,385
Non-Interest Income 14,878 19,233 19,732 22,449 23,000
Operating Income 47,862 55,184 59,027 69,476 71,385
Operating Expenses (26,743) (28,308) (30,310) (33,104) (34,996)
Impairment on Loans and Advances (996) (3,089) (2,179) (3,823) (5,914)
Total Expenses (27,739) (31,397) (32,489) (36,927) (40,910)
Profit Before Tax and Loss on Monetary Position 20,123 23,787 26,538 32,549 30,475
Loss on Monetary Position - - - (3,458) (1,361)
Profit Before Tax and Loss on Monetary Position 20,123 23,787 26,538 29,091 29,114
Income Tax Expense (5,782) (6,938) (6,915) (9,368) (9,410)
Profit for the Year 14,341 16,849 19,623 19,723 19,704
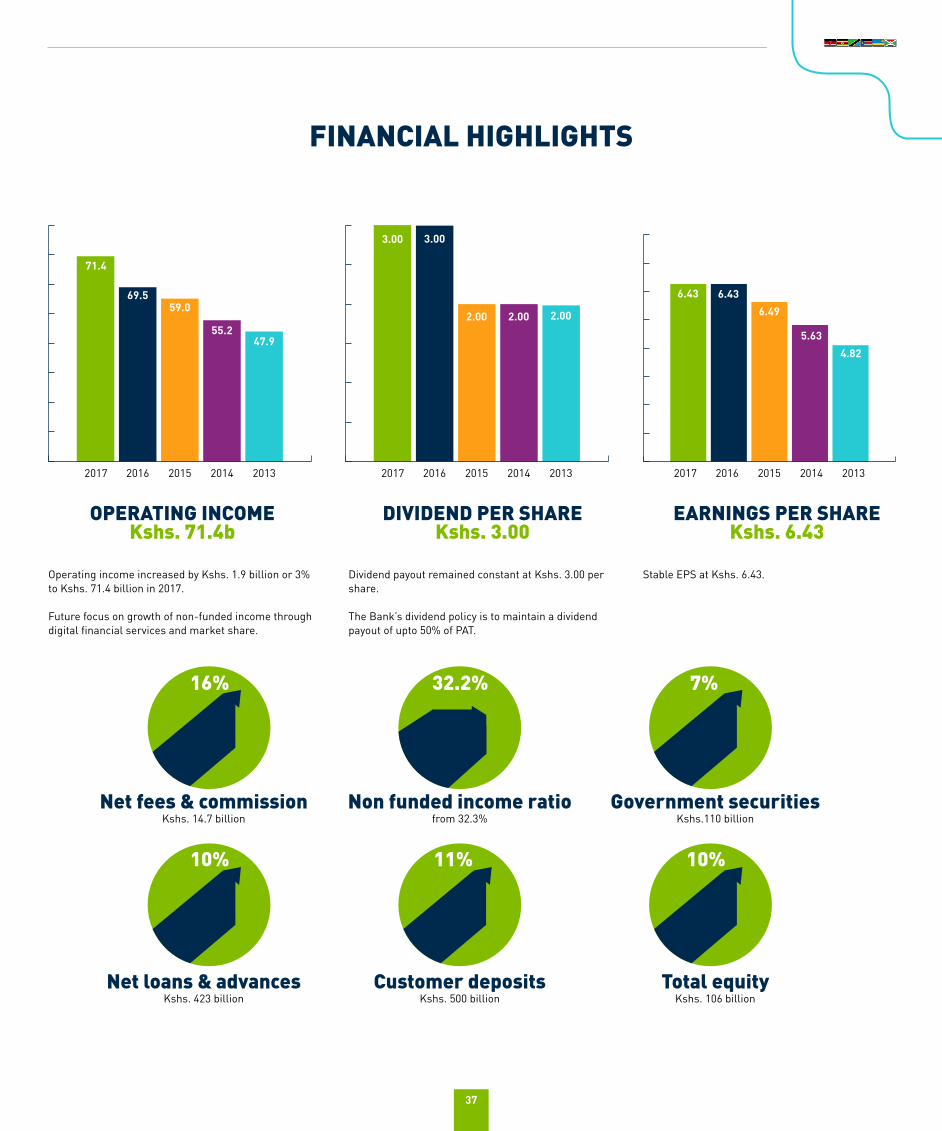
37
FINANCIAL HIGHLIGHTS
2017 20172017
71.4
6.43
3.00 3.00
2.00 2.00 2.00
2016 20162016
69.5 6.43
2015 20152015
59.0 6.49
2014 20142014
55.2 5.63
2013 20132013
47.94.82
Operating income increased by Kshs. 1.9 billion or 3% to Kshs. 71.4 billion in 2017.
Future focus on growth of non-funded income through digital financial services and market share.
Dividend payout remained constant at Kshs. 3.00 per share.
The Bank’s dividend policy is to maintain a dividend payout of upto 50% of PAT.
Stable EPS at Kshs. 6.43.
Government securitiesKshs.110 billion
Total equityKshs. 106 billion
Non funded income ratiofrom 32.3%
OPERATING INCOMEKshs. 71.4b
DIVIDEND PER SHAREKshs. 3.00
EARNINGS PER SHAREKshs. 6.43
Customer depositsKshs. 500 billion
Net fees & commissionKshs. 14.7 billion
Net loans & advancesKshs. 423 billion
10% 11% 10%
16% 32.2% 7%
KCB INTEGRATED REPORT AND FINANCIAL STATEMENTS | 2017
38
REPORT FROM THE CHIEF FINANCIAL OFFICER
Key highlights 2017The year 2017 will be remembered for its significant political and economic events across most of the markets that we operate in. We experienced a stormy operating environment that was defined by the pitched drumbeats of elections in Kenya and Rwanda as well as macro-economic concerns in South Sudan, Burundi and Rwanda.
Despite this, it is the region’s demonstrated resilience in the face of bleak economic predictions from market observers that set the tone for the 2017 performance.
For KCB Group, the deliberate decision to maintain a controlled lending appetite in Kenya – the Group’s largest market - despite an industry decline in private sector credit paid off. The better than expected performance of Uganda and a steady performance in Rwanda and Burundi marked a promising year for our subsidiaries in a difficult period.
It is against this background that the Group reported a profit before tax of Kshs. 29.1 billion in 2017 compared to a similar amount the previous year. This was largely driven by the stability of our retail and corporate businesses across all markets.
Improved lending coupled with prudent management of the Group’s cost of funds as a result of a steady healthy mix of customer deposit and better collaboration between business units resulted in a good year for the Group.
The Group’s Total income was up marginally from Kshs. 69.5 billion in 2016 to Kshs. 71.4 billion in 2017. This increase was mostly as a result of a 16% growth in fees and commissions largely driven by increase in non-branch channel activity.
The balance sheet also recorded a good growth of 8.6% to close the year at Kshs. 646.7 billion. This was primarily driven by the 10% growth in loans and advances.
The Group is now reaping from its investment in technology and innovation. We are on course with KCB’s robust channel strategy of transforming the bank into a nimble and responsive financial services provider that is centered on the customer. 87% of all our transactions are now conducted outside the
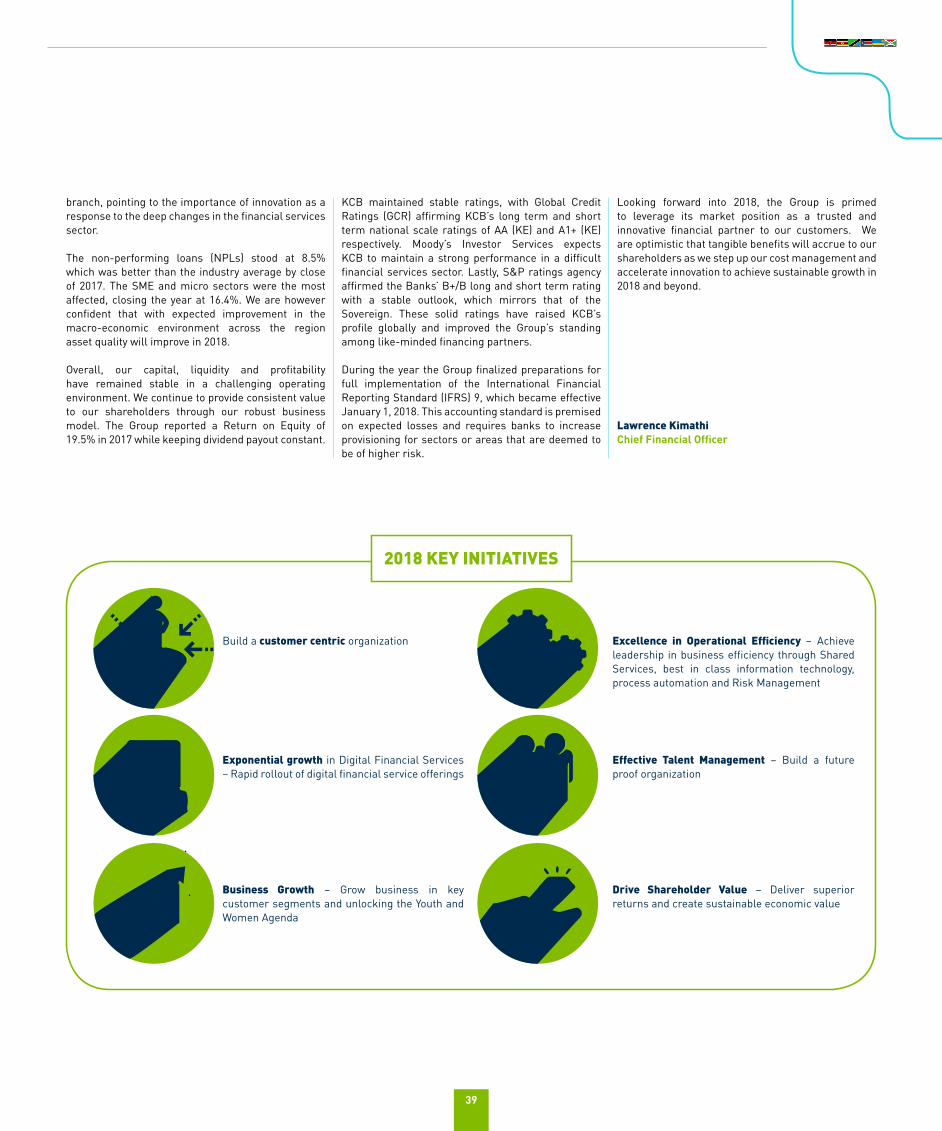
39
branch, pointing to the importance of innovation as a response to the deep changes in the financial services sector.
The non-performing loans (NPLs) stood at 8.5% which was better than the industry average by close of 2017. The SME and micro sectors were the most affected, closing the year at 16.4%. We are however confident that with expected improvement in the macro-economic environment across the region asset quality will improve in 2018.
Overall, our capital, liquidity and profitability have remained stable in a challenging operating environment. We continue to provide consistent value to our shareholders through our robust business model. The Group reported a Return on Equity of 19.5% in 2017 while keeping dividend payout constant.
KCB maintained stable ratings, with Global Credit Ratings (GCR) affirming KCB’s long term and short term national scale ratings of AA (KE) and A1+ (KE) respectively. Moody’s Investor Services expects KCB to maintain a strong performance in a difficult financial services sector. Lastly, S&P ratings agency affirmed the Banks’ B+/B long and short term rating with a stable outlook, which mirrors that of the Sovereign. These solid ratings have raised KCB’s profile globally and improved the Group’s standing among like-minded financing partners.
During the year the Group finalized preparations for full implementation of the International Financial Reporting Standard (IFRS) 9, which became effective January 1, 2018. This accounting standard is premised on expected losses and requires banks to increase provisioning for sectors or areas that are deemed to be of higher risk.
Looking forward into 2018, the Group is primed to leverage its market position as a trusted and innovative financial partner to our customers. We are optimistic that tangible benefits will accrue to our shareholders as we step up our cost management and accelerate innovation to achieve sustainable growth in 2018 and beyond.
Lawrence KimathiChief Financial Officer
Build a customer centric organization Excellence in Operational Efficiency – Achieve leadership in business efficiency through Shared Services, best in class information technology, process automation and Risk Management
Exponential growth in Digital Financial Services – Rapid rollout of digital financial service offerings
Effective Talent Management – Build a future proof organization
Business Growth – Grow business in key customer segments and unlocking the Youth and Women Agenda
Drive Shareholder Value – Deliver superior returns and create sustainable economic value
2018 KEY INITIATIVES
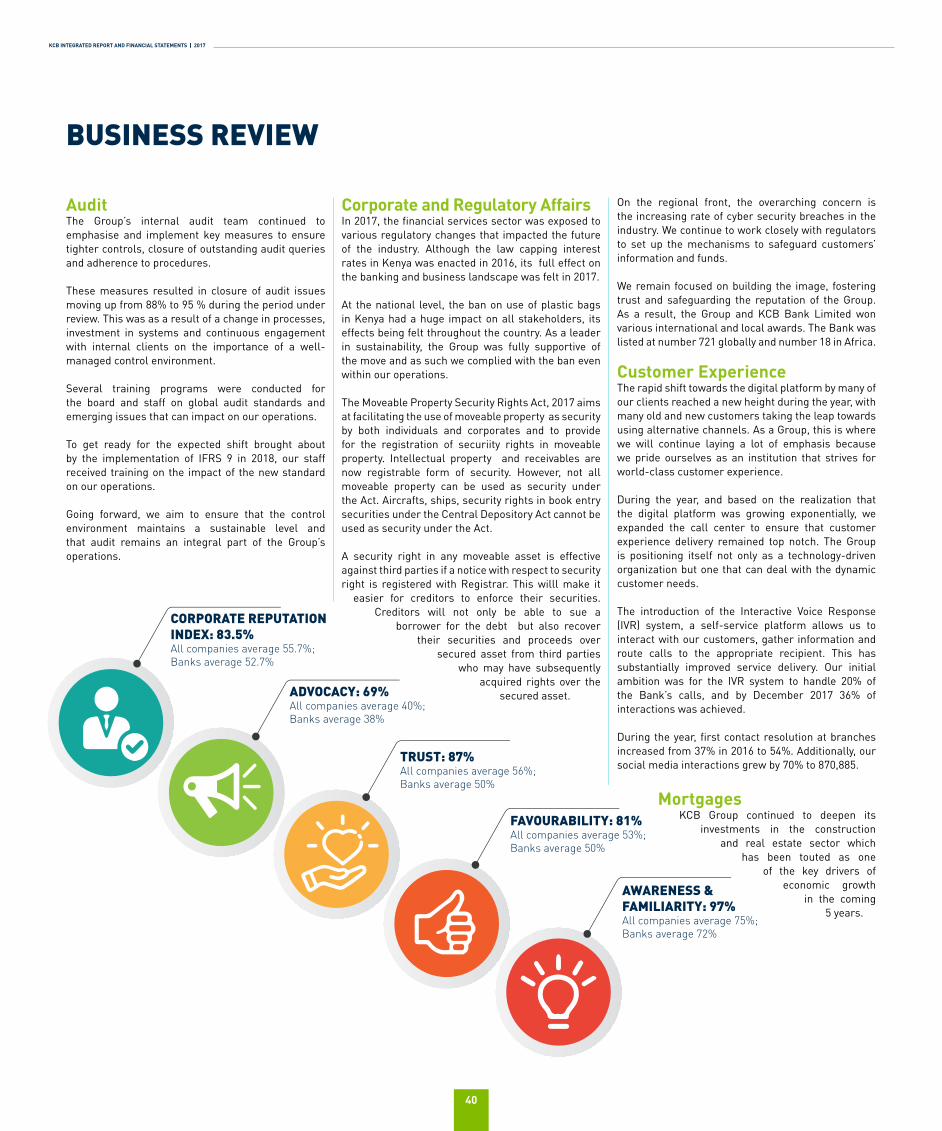
KCB INTEGRATED REPORT AND FINANCIAL STATEMENTS | 2017
40
AuditThe Group’s internal audit team continued to emphasise and implement key measures to ensure tighter controls, closure of outstanding audit queries and adherence to procedures.
These measures resulted in closure of audit issues moving up from 88% to 95 % during the period under review. This was as a result of a change in processes, investment in systems and continuous engagement with internal clients on the importance of a well-managed control environment.
Several training programs were conducted for the board and staff on global audit standards and emerging issues that can impact on our operations.
To get ready for the expected shift brought about by the implementation of IFRS 9 in 2018, our staff received training on the impact of the new standard on our operations.
Going forward, we aim to ensure that the control environment maintains a sustainable level and that audit remains an integral part of the Group’s operations.
Corporate and Regulatory AffairsIn 2017, the financial services sector was exposed to various regulatory changes that impacted the future of the industry. Although the law capping interest rates in Kenya was enacted in 2016, its full effect on the banking and business landscape was felt in 2017.
At the national level, the ban on use of plastic bags in Kenya had a huge impact on all stakeholders, its effects being felt throughout the country. As a leader in sustainability, the Group was fully supportive of the move and as such we complied with the ban even within our operations.
The Moveable Property Security Rights Act, 2017 aims at facilitating the use of moveable property as security by both individuals and corporates and to provide for the registration of securiity rights in moveable property. Intellectual property and receivables are now registrable form of security. However, not all moveable property can be used as security under the Act. Aircrafts, ships, security rights in book entry securities under the Central Depository Act cannot be used as security under the Act.
A security right in any moveable asset is effective against third parties if a notice with respect to security right is registered with Registrar. This willl make it
easier for creditors to enforce their securities. Creditors will not only be able to sue a
borrower for the debt but also recover their securities and proceeds over
secured asset from third parties who may have subsequently
acquired rights over the secured asset.
On the regional front, the overarching concern is the increasing rate of cyber security breaches in the industry. We continue to work closely with regulators to set up the mechanisms to safeguard customers’ information and funds.
We remain focused on building the image, fostering trust and safeguarding the reputation of the Group. As a result, the Group and KCB Bank Limited won various international and local awards. The Bank was listed at number 721 globally and number 18 in Africa.
Customer ExperienceThe rapid shift towards the digital platform by many of our clients reached a new height during the year, with many old and new customers taking the leap towards using alternative channels. As a Group, this is where we will continue laying a lot of emphasis because we pride ourselves as an institution that strives for world-class customer experience.
During the year, and based on the realization that the digital platform was growing exponentially, we expanded the call center to ensure that customer experience delivery remained top notch. The Group is positioning itself not only as a technology-driven organization but one that can deal with the dynamic customer needs.
The introduction of the Interactive Voice Response (IVR) system, a self-service platform allows us to interact with our customers, gather information and route calls to the appropriate recipient. This has substantially improved service delivery. Our initial ambition was for the IVR system to handle 20% of the Bank’s calls, and by December 2017 36% of interactions was achieved.
During the year, first contact resolution at branches increased from 37% in 2016 to 54%. Additionally, our social media interactions grew by 70% to 870,885.
MortgagesKCB Group continued to deepen its
investments in the construction and real estate sector which
has been touted as one of the key drivers of
economic growth in the coming
5 years.
BUSINESS REVIEW
AWARENESS &FAMILIARITY: 97%All companies average 75%;Banks average 72%
FAVOURABILITY: 81%All companies average 53%;Banks average 50%
TRUST: 87%All companies average 56%;Banks average 50%
ADVOCACY: 69%All companies average 40%;Banks average 38%
CORPORATE REPUTATIONINDEX: 83.5%All companies average 55.7%;Banks average 52.7%
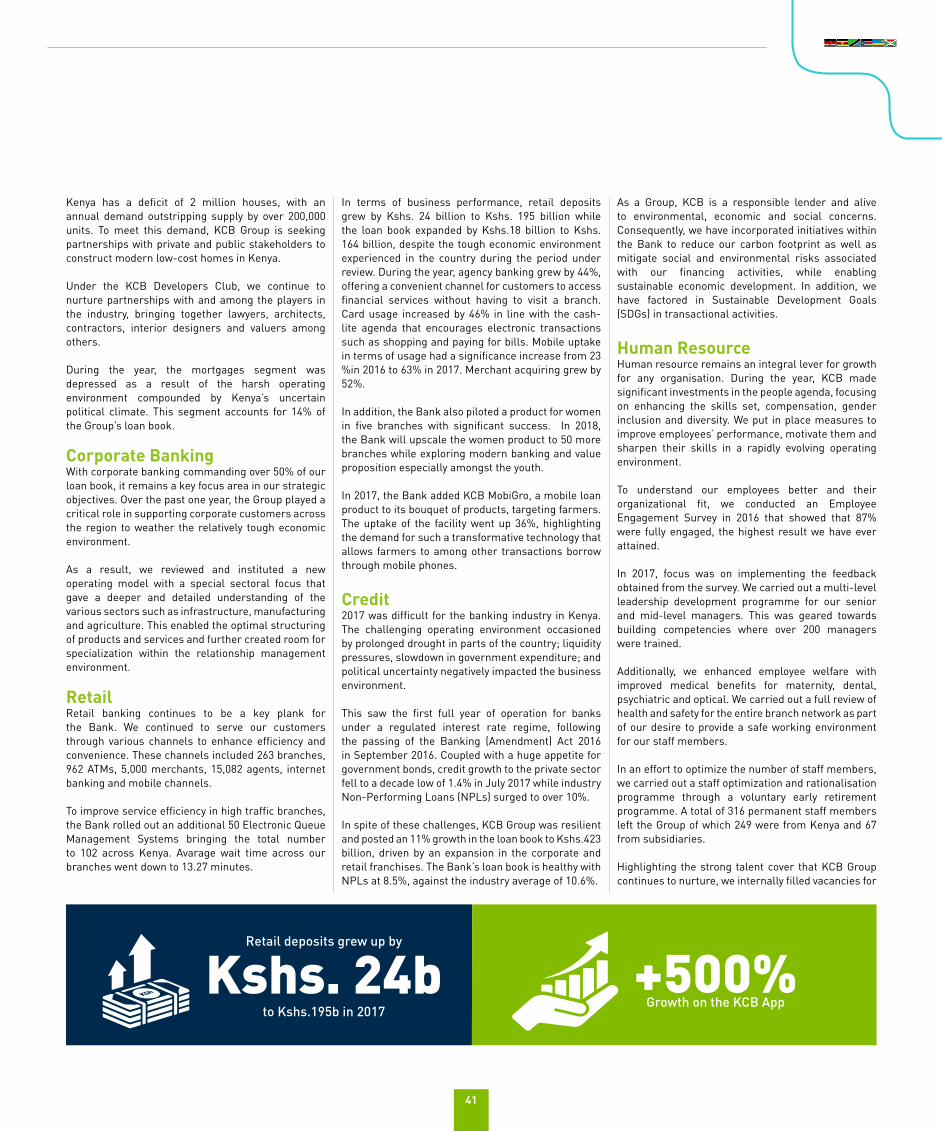
41
Kenya has a deficit of 2 million houses, with an annual demand outstripping supply by over 200,000 units. To meet this demand, KCB Group is seeking partnerships with private and public stakeholders to construct modern low-cost homes in Kenya.
Under the KCB Developers Club, we continue to nurture partnerships with and among the players in the industry, bringing together lawyers, architects, contractors, interior designers and valuers among others.
During the year, the mortgages segment was depressed as a result of the harsh operating environment compounded by Kenya’s uncertain political climate. This segment accounts for 14% of the Group’s loan book.
Corporate BankingWith corporate banking commanding over 50% of our loan book, it remains a key focus area in our strategic objectives. Over the past one year, the Group played a critical role in supporting corporate customers across the region to weather the relatively tough economic environment.
As a result, we reviewed and instituted a new operating model with a special sectoral focus that gave a deeper and detailed understanding of the various sectors such as infrastructure, manufacturing and agriculture. This enabled the optimal structuring of products and services and further created room for specialization within the relationship management environment.
RetailRetail banking continues to be a key plank for the Bank. We continued to serve our customers through various channels to enhance efficiency and convenience. These channels included 263 branches, 962 ATMs, 5,000 merchants, 15,082 agents, internet banking and mobile channels. To improve service efficiency in high traffic branches, the Bank rolled out an additional 50 Electronic Queue Management Systems bringing the total number to 102 across Kenya. Avarage wait time across our branches went down to 13.27 minutes.
In terms of business performance, retail deposits grew by Kshs. 24 billion to Kshs. 195 billion while the loan book expanded by Kshs.18 billion to Kshs. 164 billion, despite the tough economic environment experienced in the country during the period under review. During the year, agency banking grew by 44%, offering a convenient channel for customers to access financial services without having to visit a branch. Card usage increased by 46% in line with the cash-lite agenda that encourages electronic transactions such as shopping and paying for bills. Mobile uptake in terms of usage had a significance increase from 23 %in 2016 to 63% in 2017. Merchant acquiring grew by 52%.
In addition, the Bank also piloted a product for women in five branches with significant success. In 2018, the Bank will upscale the women product to 50 more branches while exploring modern banking and value proposition especially amongst the youth.
In 2017, the Bank added KCB MobiGro, a mobile loan product to its bouquet of products, targeting farmers. The uptake of the facility went up 36%, highlighting the demand for such a transformative technology that allows farmers to among other transactions borrow through mobile phones.
Credit 2017 was difficult for the banking industry in Kenya. The challenging operating environment occasioned by prolonged drought in parts of the country; liquidity pressures, slowdown in government expenditure; and political uncertainty negatively impacted the business environment.
This saw the first full year of operation for banks under a regulated interest rate regime, following the passing of the Banking (Amendment) Act 2016 in September 2016. Coupled with a huge appetite for government bonds, credit growth to the private sector fell to a decade low of 1.4% in July 2017 while industry Non-Performing Loans (NPLs) surged to over 10%.
In spite of these challenges, KCB Group was resilient and posted an 11% growth in the loan book to Kshs.423 billion, driven by an expansion in the corporate and retail franchises. The Bank’s loan book is healthy with NPLs at 8.5%, against the industry average of 10.6%.
As a Group, KCB is a responsible lender and alive to environmental, economic and social concerns. Consequently, we have incorporated initiatives within the Bank to reduce our carbon footprint as well as mitigate social and environmental risks associated with our financing activities, while enabling sustainable economic development. In addition, we have factored in Sustainable Development Goals (SDGs) in transactional activities.
Human ResourceHuman resource remains an integral lever for growth for any organisation. During the year, KCB made significant investments in the people agenda, focusing on enhancing the skills set, compensation, gender inclusion and diversity. We put in place measures to improve employees’ performance, motivate them and sharpen their skills in a rapidly evolving operating environment.
To understand our employees better and their organizational fit, we conducted an Employee Engagement Survey in 2016 that showed that 87% were fully engaged, the highest result we have ever attained.
In 2017, focus was on implementing the feedback obtained from the survey. We carried out a multi-level leadership development programme for our senior and mid-level managers. This was geared towards building competencies where over 200 managers were trained.
Additionally, we enhanced employee welfare with improved medical benefits for maternity, dental, psychiatric and optical. We carried out a full review of health and safety for the entire branch network as part of our desire to provide a safe working environment for our staff members.
In an effort to optimize the number of staff members, we carried out a staff optimization and rationalisation programme through a voluntary early retirement programme. A total of 316 permanent staff members left the Group of which 249 were from Kenya and 67 from subsidiaries.
Highlighting the strong talent cover that KCB Group continues to nurture, we internally filled vacancies for
Retail deposits grew up by
Kshs. 24bto Kshs.195b in 2017
+500% Growth on the KCB App
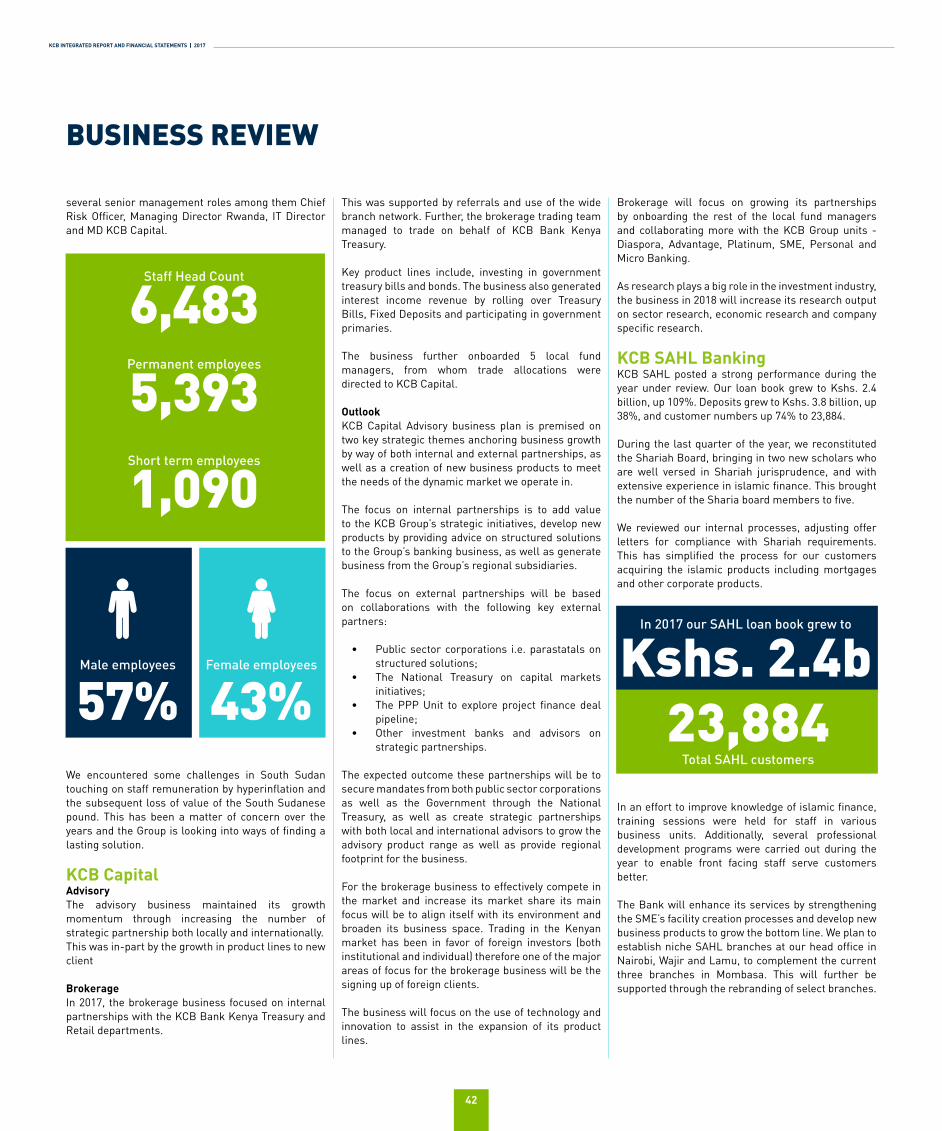
KCB INTEGRATED REPORT AND FINANCIAL STATEMENTS | 2017
42
several senior management roles among them Chief Risk Officer, Managing Director Rwanda, IT Director and MD KCB Capital.
We encountered some challenges in South Sudan touching on staff remuneration by hyperinflation and the subsequent loss of value of the South Sudanese pound. This has been a matter of concern over the years and the Group is looking into ways of finding a lasting solution.
KCB Capital AdvisoryThe advisory business maintained its growth momentum through increasing the number of strategic partnership both locally and internationally.This was in-part by the growth in product lines to new client
Brokerage In 2017, the brokerage business focused on internal partnerships with the KCB Bank Kenya Treasury and Retail departments.
This was supported by referrals and use of the wide branch network. Further, the brokerage trading team managed to trade on behalf of KCB Bank Kenya Treasury.
Key product lines include, investing in government treasury bills and bonds. The business also generated interest income revenue by rolling over Treasury Bills, Fixed Deposits and participating in government primaries.
The business further onboarded 5 local fund managers, from whom trade allocations were directed to KCB Capital.
OutlookKCB Capital Advisory business plan is premised on two key strategic themes anchoring business growth by way of both internal and external partnerships, as well as a creation of new business products to meet the needs of the dynamic market we operate in. The focus on internal partnerships is to add value to the KCB Group’s strategic initiatives, develop new products by providing advice on structured solutions to the Group’s banking business, as well as generate business from the Group’s regional subsidiaries.
The focus on external partnerships will be based on collaborations with the following key external partners:
• Public sector corporations i.e. parastatals on structured solutions;
• The National Treasury on capital markets initiatives;
• The PPP Unit to explore project finance deal pipeline;
• Other investment banks and advisors on strategic partnerships.
The expected outcome these partnerships will be to secure mandates from both public sector corporations as well as the Government through the National Treasury, as well as create strategic partnerships with both local and international advisors to grow the advisory product range as well as provide regional footprint for the business.
For the brokerage business to effectively compete in the market and increase its market share its main focus will be to align itself with its environment and broaden its business space. Trading in the Kenyan market has been in favor of foreign investors (both institutional and individual) therefore one of the major areas of focus for the brokerage business will be the signing up of foreign clients.
The business will focus on the use of technology and innovation to assist in the expansion of its product lines.
Brokerage will focus on growing its partnerships by onboarding the rest of the local fund managers and collaborating more with the KCB Group units - Diaspora, Advantage, Platinum, SME, Personal and Micro Banking.
As research plays a big role in the investment industry, the business in 2018 will increase its research output on sector research, economic research and company specific research.
KCB SAHL BankingKCB SAHL posted a strong performance during the year under review. Our loan book grew to Kshs. 2.4 billion, up 109%. Deposits grew to Kshs. 3.8 billion, up 38%, and customer numbers up 74% to 23,884.
During the last quarter of the year, we reconstituted the Shariah Board, bringing in two new scholars who are well versed in Shariah jurisprudence, and with extensive experience in islamic finance. This brought the number of the Sharia board members to five.
We reviewed our internal processes, adjusting offer letters for compliance with Shariah requirements. This has simplified the process for our customers acquiring the islamic products including mortgages and other corporate products.
In an effort to improve knowledge of islamic finance, training sessions were held for staff in various business units. Additionally, several professional development programs were carried out during the year to enable front facing staff serve customers better.
The Bank will enhance its services by strengthening the SME’s facility creation processes and develop new business products to grow the bottom line. We plan to establish niche SAHL branches at our head office in Nairobi, Wajir and Lamu, to complement the current three branches in Mombasa. This will further be supported through the rebranding of select branches.
BUSINESS REVIEW
In 2017 our SAHL loan book grew to
Kshs. 2.4b23,884
Total SAHL customers
Staff Head Count
6,483Permanent employees
5,393Short term employees
1,090
Female employees
43%Male employees
57%
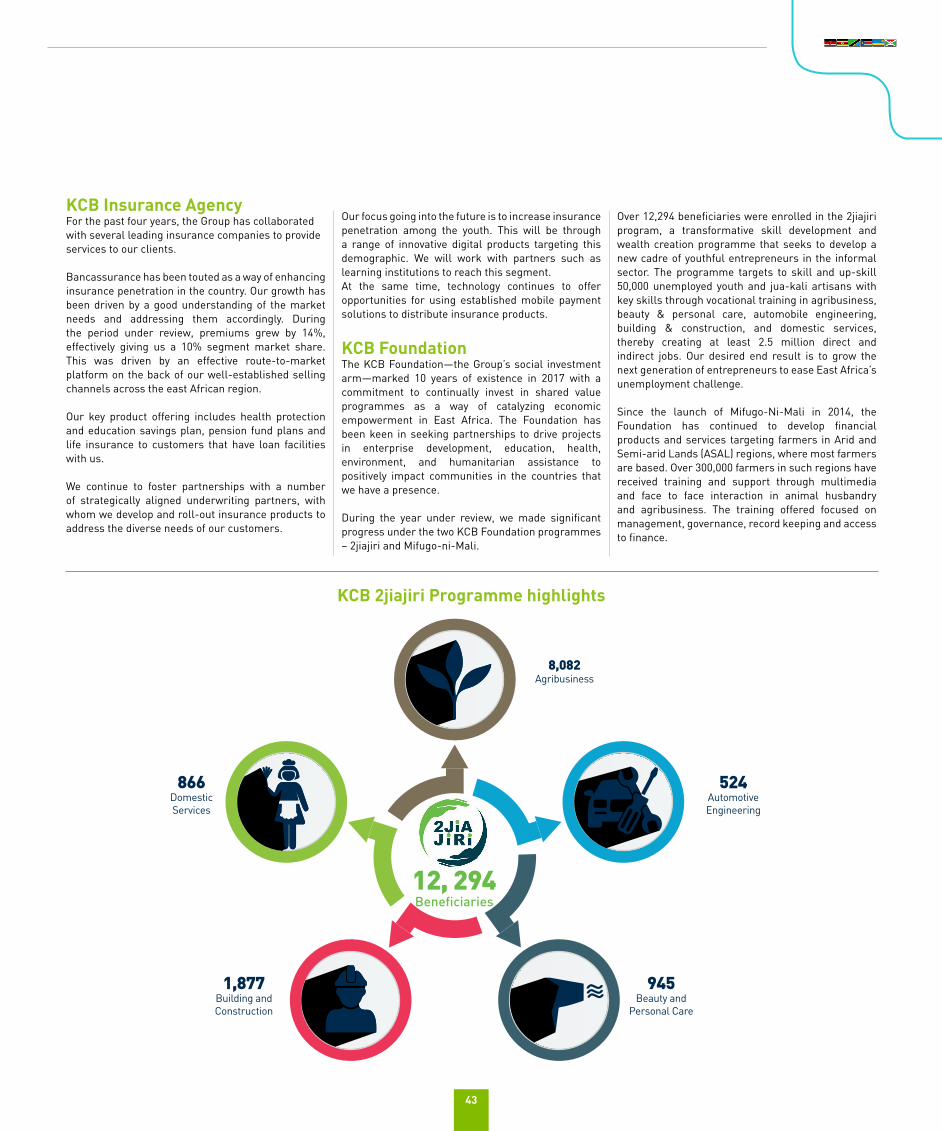
43
KCB Insurance Agency For the past four years, the Group has collaborated with several leading insurance companies to provide services to our clients.
Bancassurance has been touted as a way of enhancing insurance penetration in the country. Our growth has been driven by a good understanding of the market needs and addressing them accordingly. During the period under review, premiums grew by 14%, effectively giving us a 10% segment market share. This was driven by an effective route-to-market platform on the back of our well-established selling channels across the east African region.
Our key product offering includes health protection and education savings plan, pension fund plans and life insurance to customers that have loan facilities with us.
We continue to foster partnerships with a number of strategically aligned underwriting partners, with whom we develop and roll-out insurance products to address the diverse needs of our customers.
Our focus going into the future is to increase insurance penetration among the youth. This will be through a range of innovative digital products targeting this demographic. We will work with partners such as learning institutions to reach this segment.At the same time, technology continues to offer opportunities for using established mobile payment solutions to distribute insurance products.
KCB Foundation The KCB Foundation—the Group’s social investment arm—marked 10 years of existence in 2017 with a commitment to continually invest in shared value programmes as a way of catalyzing economic empowerment in East Africa. The Foundation has been keen in seeking partnerships to drive projects in enterprise development, education, health, environment, and humanitarian assistance to positively impact communities in the countries that we have a presence.
During the year under review, we made significant progress under the two KCB Foundation programmes – 2jiajiri and Mifugo-ni-Mali.
Over 12,294 beneficiaries were enrolled in the 2jiajiri program, a transformative skill development and wealth creation programme that seeks to develop a new cadre of youthful entrepreneurs in the informal sector. The programme targets to skill and up-skill 50,000 unemployed youth and jua-kali artisans with key skills through vocational training in agribusiness, beauty & personal care, automobile engineering, building & construction, and domestic services, thereby creating at least 2.5 million direct and indirect jobs. Our desired end result is to grow the next generation of entrepreneurs to ease East Africa’s unemployment challenge.
Since the launch of Mifugo-Ni-Mali in 2014, the Foundation has continued to develop financial products and services targeting farmers in Arid and Semi-arid Lands (ASAL) regions, where most farmers are based. Over 300,000 farmers in such regions have received training and support through multimedia and face to face interaction in animal husbandry and agribusiness. The training offered focused on management, governance, record keeping and access to finance.
KCB 2jiajiri Programme highlights
8,082 Agribusiness
524 AutomotiveEngineering
866 Domestic Services
945Beauty and
Personal Care
1,877Building and Construction
12, 294Beneficiaries

KCB INTEGRATED REPORT AND FINANCIAL STATEMENTS | 2017
44
Twenty-year-old Ramirez Omondi’s passion for vehicles inevitably geared him towards the auto-mobile engineering industry and years later, his is a story of hard work, passion and a gentle nudge from KCB Foundation.
Growing up, Ramirez has always been around cars. His fascination started from watching his dad, a motorcycle engineer, at work. He always offered him a hand, learning a few tricks along the way.
For him, this was the perfect launch pad for success, as it has taught him the value of hard work; he clearly sees the difference hard work makes.
He took the work at his father’s garage seriously and gradually, he realised that he wanted to change the misconception around garages, mechanics and auto-mobile engineers.
“The general perception that mechanics are not learned, are unscrupulous, fraudulent and generally only after your money and not solving your car problems really bothered me and I purposed to change that,” he says.
“Why can’t a mechanic be polite, well-mannered, well-groomed and carry out his work professionally?” he wondered.
So when his uncle informed him of the KCB Foundation programme called 2jiajiri, he quickly enrolled to pursue his dream.
“Since I joined 2jiajiri, I know that my dream of opening my own garage, Ramirez Auto Limited is going to become a reality. I am committed to giving young people an opportunity to learn and grow their talents, pursue their dreams and create employment,” says Ramirez.
He is enrolled at the Toyota Automotive Academy through the support of the KCB Foundation.
Since I joined 2jiajiri, my dream of opening
my own garage, is becoming a reality.”
Stories
Turning passion into a career
BUSINESS REVIEW
Ramirez Omondi, KCB Foundation Beneficiary
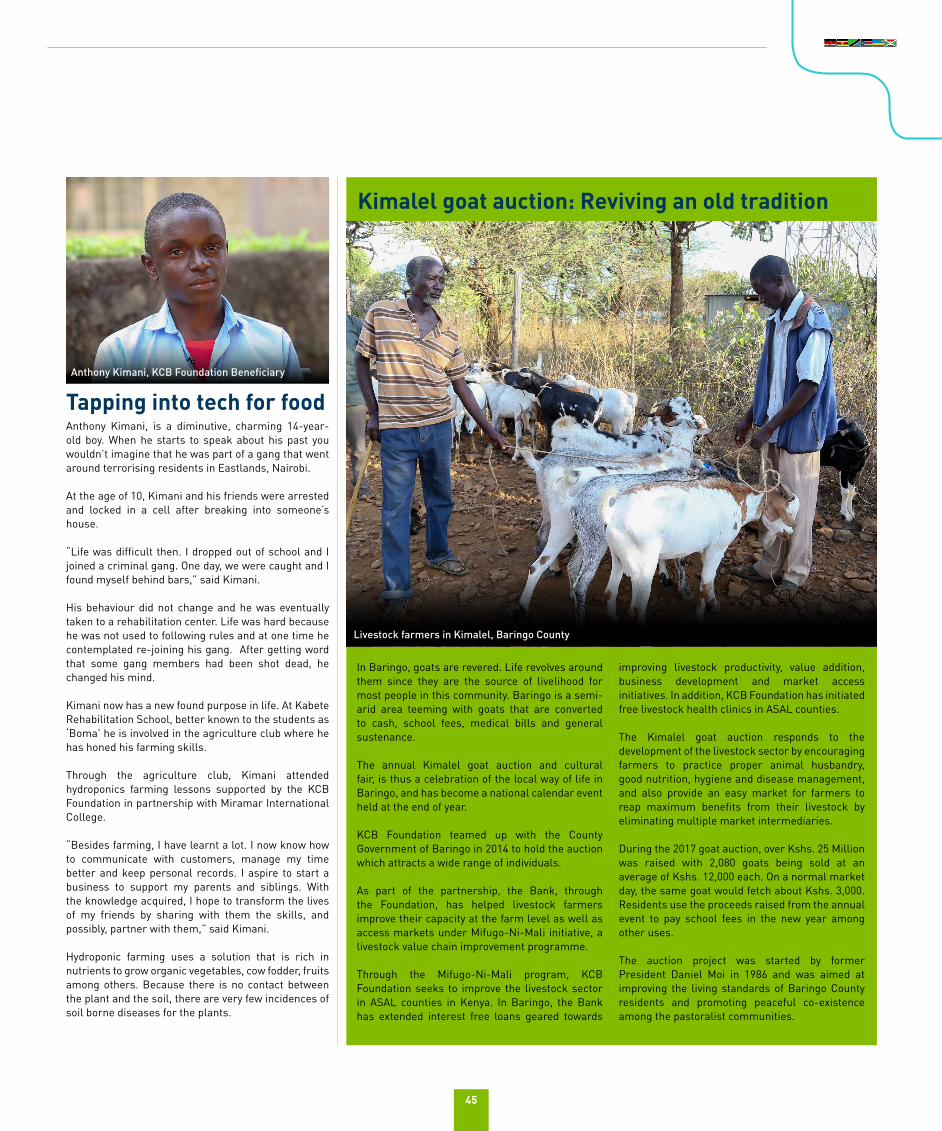
45
In Baringo, goats are revered. Life revolves around them since they are the source of livelihood for most people in this community. Baringo is a semi-arid area teeming with goats that are converted to cash, school fees, medical bills and general sustenance.
The annual Kimalel goat auction and cultural fair, is thus a celebration of the local way of life in Baringo, and has become a national calendar event held at the end of year.
KCB Foundation teamed up with the County Government of Baringo in 2014 to hold the auction which attracts a wide range of individuals.
As part of the partnership, the Bank, through the Foundation, has helped livestock farmers improve their capacity at the farm level as well as access markets under Mifugo-Ni-Mali initiative, a livestock value chain improvement programme.
Through the Mifugo-Ni-Mali program, KCB Foundation seeks to improve the livestock sector in ASAL counties in Kenya. In Baringo, the Bank has extended interest free loans geared towards
improving livestock productivity, value addition, business development and market access initiatives. In addition, KCB Foundation has initiated free livestock health clinics in ASAL counties.
The Kimalel goat auction responds to the development of the livestock sector by encouraging farmers to practice proper animal husbandry, good nutrition, hygiene and disease management, and also provide an easy market for farmers to reap maximum benefits from their livestock by eliminating multiple market intermediaries.
During the 2017 goat auction, over Kshs. 25 Million was raised with 2,080 goats being sold at an average of Kshs. 12,000 each. On a normal market day, the same goat would fetch about Kshs. 3,000. Residents use the proceeds raised from the annual event to pay school fees in the new year among other uses.
The auction project was started by former President Daniel Moi in 1986 and was aimed at improving the living standards of Baringo County residents and promoting peaceful co-existence among the pastoralist communities.
Tapping into tech for food Anthony Kimani, is a diminutive, charming 14-year-old boy. When he starts to speak about his past you wouldn’t imagine that he was part of a gang that went around terrorising residents in Eastlands, Nairobi.
At the age of 10, Kimani and his friends were arrested and locked in a cell after breaking into someone’s house.
“Life was difficult then. I dropped out of school and I joined a criminal gang. One day, we were caught and I found myself behind bars,” said Kimani.
His behaviour did not change and he was eventually taken to a rehabilitation center. Life was hard because he was not used to following rules and at one time he contemplated re-joining his gang. After getting word that some gang members had been shot dead, he changed his mind.
Kimani now has a new found purpose in life. At Kabete Rehabilitation School, better known to the students as ‘Boma’ he is involved in the agriculture club where he has honed his farming skills.
Through the agriculture club, Kimani attended hydroponics farming lessons supported by the KCB Foundation in partnership with Miramar International College.
“Besides farming, I have learnt a lot. I now know how to communicate with customers, manage my time better and keep personal records. I aspire to start a business to support my parents and siblings. With the knowledge acquired, I hope to transform the lives of my friends by sharing with them the skills, and possibly, partner with them,” said Kimani.
Hydroponic farming uses a solution that is rich in nutrients to grow organic vegetables, cow fodder, fruits among others. Because there is no contact between the plant and the soil, there are very few incidences of soil borne diseases for the plants.
Kimalel goat auction: Reviving an old tradition
Anthony Kimani, KCB Foundation Beneficiary
Livestock farmers in Kimalel, Baringo County
KCB INTEGRATED REPORT AND FINANCIAL STATEMENTS | 2017
46
Information Technology: Anchoring the digital bank Today, money has to move easily, faster and safer than ever before. Over the past one year, we have aligned the Group’s IT and business strategy with this reality in mind. The primary objective has been to anchor the business to the best-in-class and fit-for-purpose technology. In 2017, we enabled transactions worth over Kshs. 236 billion through mobile phones.
The Bank now has over 13.6 million customers on our mobile platform. The number of transactions on digital channels was over 87% of total transactions. To enable efficiency and convenience, we continue to invest in systems and people to drive this transformation while introducing modern touch points that offer customers simple solutions while improving their experience. Such include mobile USSD and the KCB App, cards, social media, chat boxes and smartphones.
With the advances in technology, new risks continue to emerge. The Group’s systems including the mobile applications have been extensively tested and validated by our internal and external data security experts. As part of our sustainability agenda, the Group has partnered with suppliers who are credited by the National Environment Management Authority (NEMA) on e-waste disposal practices. The next phase of our IT journey is to demonstrate a return on investment and value for the Group over the next two years.
Our fintech journey The financial services sector is at a tipping point. At KCB Group, we recognize the profound impact disruptive technologies have had on our business in the last decade, and likelihood for more disruption in the years to come.
During the period under review, we enhanced our investments in fintech to enhance digital access to our customers across East Africa. Mobile money continues to be an effective gateway for financial services to be offered quickly and easily.
Going forward, we will enhance innovation using current technology to deliver simple solutions to customers everywhere. We have developed a growth strategy anchored on partnerships and simplicity. Our focus is on innovation that considers all the possible customer touch points to enable them pay, borrow, save simply.
With a large banked population today, it is harder to convince a customer to keep money with us let alone open an account. Using multiple channels and platforms, our goal is to enable customers ‘pay anyone or get paid by anyone’ anywhere, anytime. This will have the effect of having deposits within KCB and grow our income when the customer transacts.
BUSINESS REVIEW
We will enhance innovation using today’s technology to deliver simple
solutions to customers everywhere.”
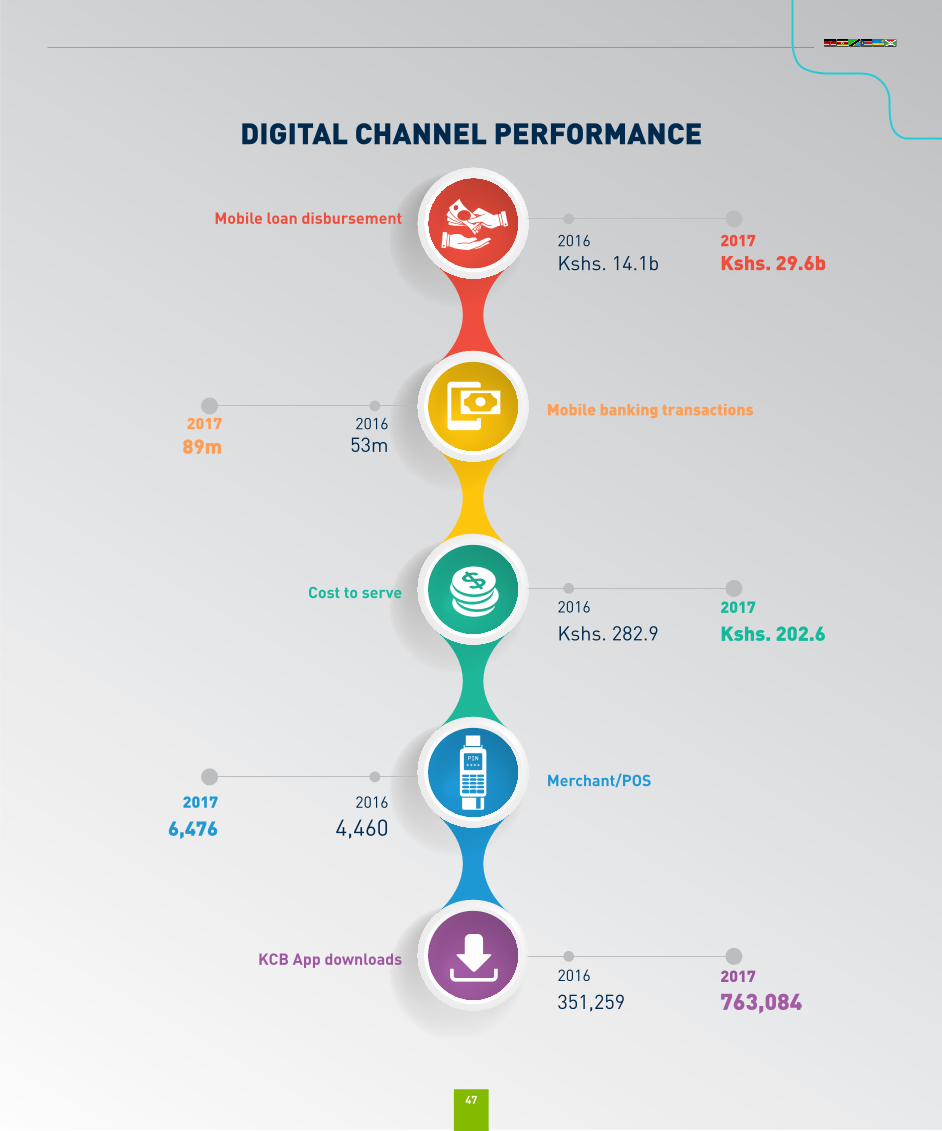
47
DIGITAL CHANNEL PERFORMANCE
2017
Kshs. 29.6b
201789m
2017
6,476
2017
Kshs. 202.6
2017
763,084
2016
Kshs. 14.1b
201653m
2016
4,460
2016
Kshs. 282.9
2016
351,259
47
Mobile loan disbursement
Mobile banking transactions
Cost to serve
Merchant/POS
KCB App downloads
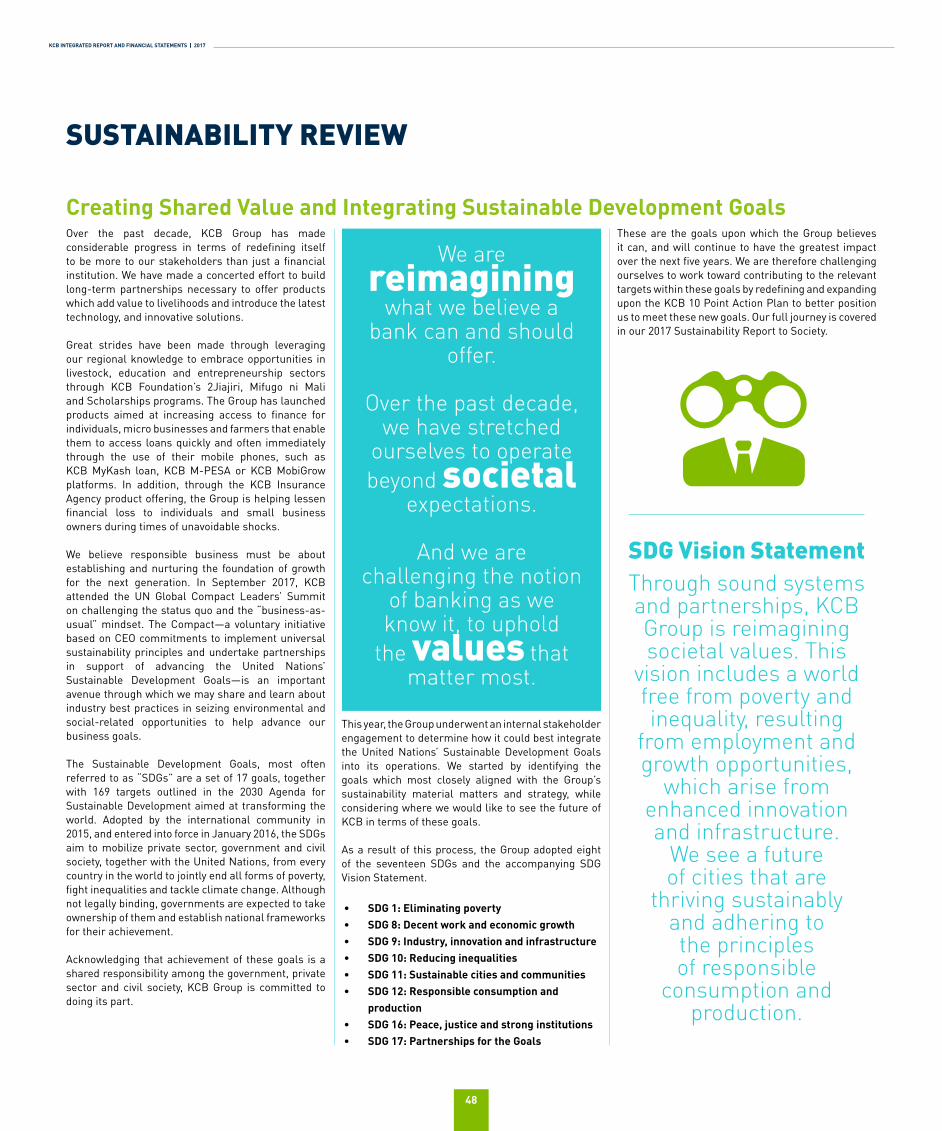
KCB INTEGRATED REPORT AND FINANCIAL STATEMENTS | 2017
48
Over the past decade, KCB Group has made considerable progress in terms of redefining itself to be more to our stakeholders than just a financial institution. We have made a concerted effort to build long-term partnerships necessary to offer products which add value to livelihoods and introduce the latest technology, and innovative solutions.
Great strides have been made through leveraging our regional knowledge to embrace opportunities in livestock, education and entrepreneurship sectors through KCB Foundation’s 2Jiajiri, Mifugo ni Mali and Scholarships programs. The Group has launched products aimed at increasing access to finance for individuals, micro businesses and farmers that enable them to access loans quickly and often immediately through the use of their mobile phones, such as KCB MyKash loan, KCB M-PESA or KCB MobiGrow platforms. In addition, through the KCB Insurance Agency product offering, the Group is helping lessen financial loss to individuals and small business owners during times of unavoidable shocks.
We believe responsible business must be about establishing and nurturing the foundation of growth for the next generation. In September 2017, KCB attended the UN Global Compact Leaders’ Summit on challenging the status quo and the “business-as-usual” mindset. The Compact—a voluntary initiative based on CEO commitments to implement universal sustainability principles and undertake partnerships in support of advancing the United Nations’ Sustainable Development Goals—is an important avenue through which we may share and learn about industry best practices in seizing environmental and social-related opportunities to help advance our business goals.
The Sustainable Development Goals, most often referred to as “SDGs” are a set of 17 goals, together with 169 targets outlined in the 2030 Agenda for Sustainable Development aimed at transforming the world. Adopted by the international community in 2015, and entered into force in January 2016, the SDGs aim to mobilize private sector, government and civil society, together with the United Nations, from every country in the world to jointly end all forms of poverty, fight inequalities and tackle climate change. Although not legally binding, governments are expected to take ownership of them and establish national frameworks for their achievement.
Acknowledging that achievement of these goals is a shared responsibility among the government, private sector and civil society, KCB Group is committed to doing its part.
This year, the Group underwent an internal stakeholder engagement to determine how it could best integrate the United Nations’ Sustainable Development Goals into its operations. We started by identifying the goals which most closely aligned with the Group’s sustainability material matters and strategy, while considering where we would like to see the future of KCB in terms of these goals.
As a result of this process, the Group adopted eight of the seventeen SDGs and the accompanying SDG Vision Statement.
• SDG 1: Eliminating poverty • SDG 8: Decent work and economic growth• SDG 9: Industry, innovation and infrastructure• SDG 10: Reducing inequalities • SDG 11: Sustainable cities and communities• SDG 12: Responsible consumption and
production• SDG 16: Peace, justice and strong institutions• SDG 17: Partnerships for the Goals
These are the goals upon which the Group believes it can, and will continue to have the greatest impact over the next five years. We are therefore challenging ourselves to work toward contributing to the relevant targets within these goals by redefining and expanding upon the KCB 10 Point Action Plan to better position us to meet these new goals. Our full journey is covered in our 2017 Sustainability Report to Society.
SUSTAINABILITY REVIEW
Creating Shared Value and Integrating Sustainable Development Goals
We are reimagining
what we believe a bank can and should
offer.
Over the past decade, we have stretched
ourselves to operate beyond societal
expectations.
And we are challenging the notion
of banking as we know it, to uphold
the values that matter most.
SDG Vision StatementThrough sound systems and partnerships, KCB Group is reimagining societal values. This
vision includes a world free from poverty and inequality, resulting
from employment and growth opportunities,
which arise from enhanced innovation and infrastructure.
We see a future of cities that are
thriving sustainably and adhering to the principles of responsible
consumption and production.
49
services and credit. In terms of helping integrate small business owners into value chains, flagship KCB Foundation program, Mifugo ni Mali works with farmers and livestock owners to do just that. KCB’s MobiGrow platform also helps link farmers to other relevant players across the agricultural value chains.
KCB Group believes that reducing the number of people living in poverty cannot be achieved without reducing existing inequalities. We therefore believe that all individuals have the right to access some form of appropriate
financial services, which address their needs. Providing access to such services for all through many of the aforementioned programs can provide the necessary support enabling micro and small business owners to grow their businesses, increase their income, employment and livelihoods of those they touch, regardless of age or sex. KCB Foundation activities similarly support this aim. Internally, KCB has also worked to ensure equality for all within its workplaces, especially with respect to female leadership under the KCB Women in Leadership Network. The relevant policies are also in place within our credit and human resource systems to manage this strategic direction.
In spite of the efficiency gains that can be realized by high city density, such rapid urbanization exerts pressure on fresh water supplies, sewage, the living environment and public health. Proper city planning is therefore necessary to ensure
access to adequate, safe and affordable housing and transportation for all. Air quality and waste management must also be kept in check. Meanwhile, sustainable communities require individuals who are protected in one way, shape or form, from direct economic and health losses due to disasters and otherwise unforeseeable events. KCB Insurance Agency products help cushion the blow for families affected by such uncontrollable losses. In addition, through partnerships with government and other stakeholders, KCB Mortgages team is actively involved in an affordable housing project in which shelter is provided to everyone. The project uses local materials to manage costs and time taken to complete projects.
Since the launch of its Green Agenda in 2009, KCB has taken the initiative to become a responsible consumer and producer. The 24 point blueprint challenged the
Group to considerably cut back on paper and power consumption. Following the launch of our social and environmental management system in 2015, the Group has also begun working with its corporate clients to identify ways in which they can also become responsible consumers (for those who are not already) and helping them embrace greener practices.
Over the past decade, the region has seen many regulatory changes affecting the way financial institutions do business. The Group has fully embraced these changes and remains at the forefront in adopting best practices
in corporate and risk management. The Board and management of the Group continue to comply with the Prudential Guidelines and the Corporate Governance Guidelines for issuers of listed securities as prescribed by the Central Bank of Kenya as well as the Capital Markets Authority Code of Corporate Governance Practices. KCB adopts a zero tolerance position to all forms of corruption, bribery and unethical business practices at the workplace, and requires all persons associated with the Group to exhibit the behaviours and standards defined in the Group Code of Ethical Conduct. KCB Group has also updated an anti-money laundering system to track watch and sanction lists under UN sanctions in addition to monitoring all transactions.
Above all, attaining the Sustainable Development Goals will require partnerships. They cannot be achieved alone. KCB understands this, and as such, has worked to forge relevant partnerships which further add-value to promoting the Goals. In
2014, KCB became a participant in the Global Compact. The following year, through the Kenya banking industry’s umbrella body, Kenya Bankers’ Association, it adopted the Sustainable Finance Initiative Guiding Principles. And in 2016, the Group joined the Global Banking Alliance for Women. In addition, our partnerships with Safaricom, MasterCard Foundation, the Ministry of Labour, Social Security and Services, Ministry of Public Service, Youth and Gender Affairs, Ministry of Education, Ministry of Industrialization and Enterprise Development, Kenyan schools and UNEP Financial Initiative, to name a few, have also help deliver innovative services and products to our stakeholders.
KCB Group is committed to do its part in ending poverty in all its forms. We believe that eliminating poverty has the trickle down benefit of helping achieve many of the other SDGs as well, especially those related to hunger (SDG No. 2), health (SDG No. 3) and
education (SDG No. 4). Our programs aimed at enhancing access to finance for those who would otherwise be left behind, are one way in which we contribute to this goal. We have partnered with the Government of Kenya to help deliver its national social protection system. Through Inua Jamii, we run three cash transfer programmes for orphans and vulnerable children, older persons, and persons living with severe disabilities. KCB Foundation activities are also spearheading our efforts to help place vulnerable individuals in a better position to increase their incomes through programs such as 2Jiajiri and Mifugo ni Mali, as well as its scholarships program. Meanwhile, KCB Insurance Agency products aim to empower and improve the quality of life for customers through the provision of affordable, value-adding and appropriate insurance solutions.
We realize that the less time someone spends standing in a queue, or traveling to a bank, the more time they have to do other productive tasks. The Group’s product line is aimed at simplifying our customers’ world to enable their progress. In addition, KCB
Foundation flagship initiatives—Mifugo ni Mali, 2Jiajiri and Scholarships—strive to help individuals achieve higher levels of economic productivity, full and productive employment, and reduce the proportion of youth not in employment, education or training. Internally, KCB is working to expand its opportunities within the Group for current employees through training and mentorship to better prepare and encourage staff to grow within the organization.
For many people, when they first read the word infrastructure, roads, bridges and waterways often come to mind. In the financial services industry however, infrastructure relates to the established structures and processes in place which enable customers to access
finance or any of the other products and services offered by the institution. In this way, KCB plays an important role in bringing this service to as many people as possible across the region. Financial service solutions such as KCB MyKash, KCB M-PESA, KCB MobiGrow, KCB Agent (Mtaani), Sahl Banking, and KCB Micro, have enabled us to enhance the way small business owners access financial
Our commitment to Sustainable Development Goals
49
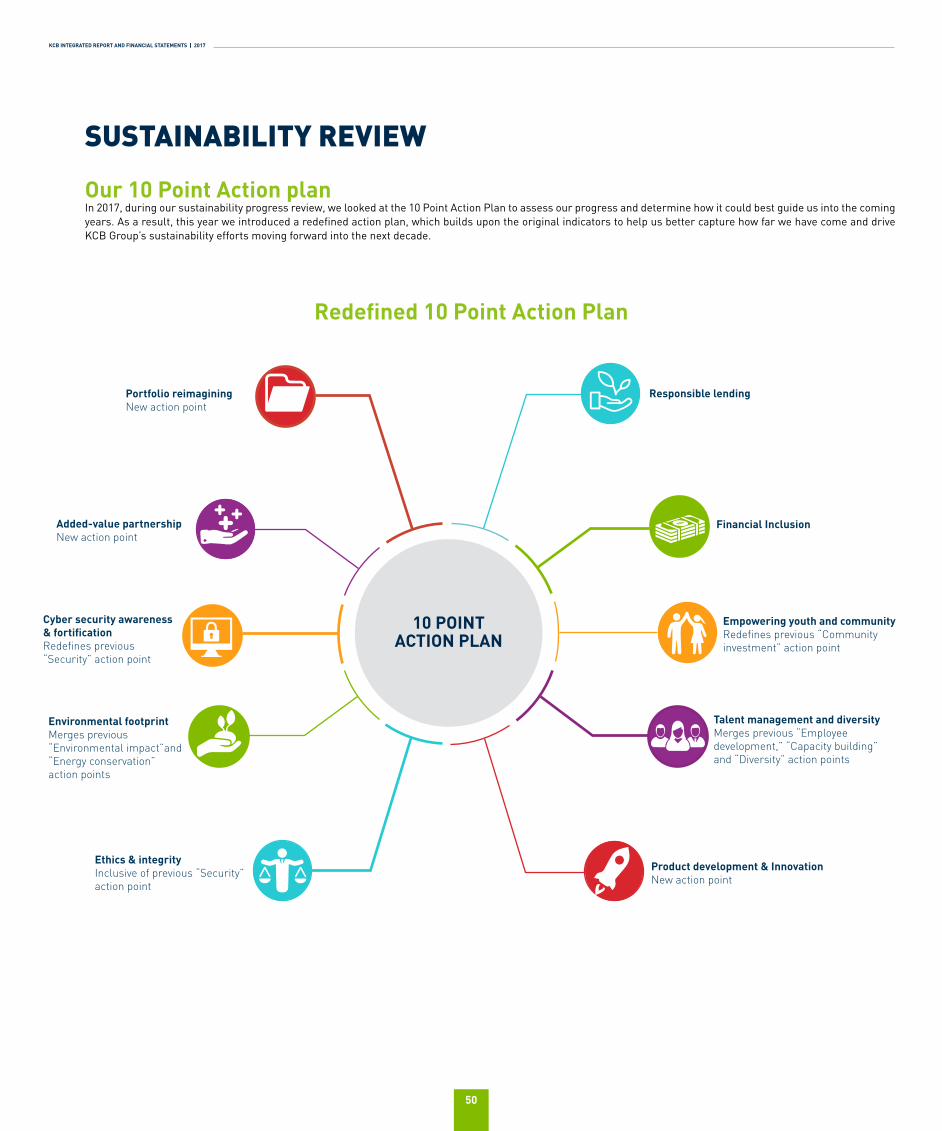
KCB INTEGRATED REPORT AND FINANCIAL STATEMENTS | 2017
50
Our 10 Point Action plan In 2017, during our sustainability progress review, we looked at the 10 Point Action Plan to assess our progress and determine how it could best guide us into the coming years. As a result, this year we introduced a redefined action plan, which builds upon the original indicators to help us better capture how far we have come and drive KCB Group’s sustainability efforts moving forward into the next decade.
Redefined 10 Point Action Plan
SUSTAINABILITY REVIEW
Responsible lendingPortfolio reimaginingNew action point
Added-value partnershipNew action point
Environmental footprintMerges previous “Environmental impact”and “Energy conservation” action points
Cyber security awareness & fortificationRedefines previous “Security” action point
Financial Inclusion
Empowering youth and communityRedefines previous “Community investment” action point
Ethics & integrityInclusive of previous “Security” action point
Talent management and diversityMerges previous “Employee development,” “Capacity building” and “Diversity” action points
Product development & InnovationNew action point
10 POINT ACTION PLAN
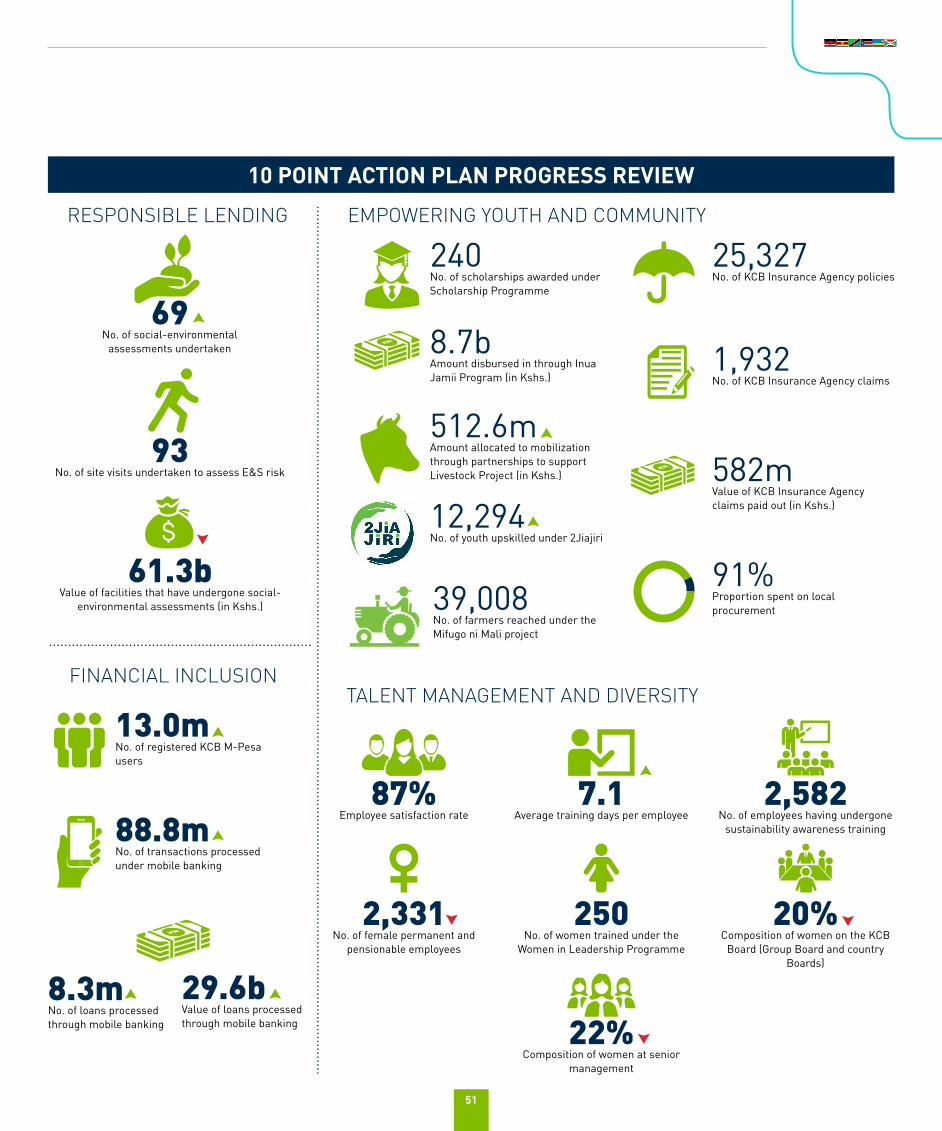
51
88.8m No. of transactions processed under mobile banking
12,294 No. of youth upskilled under 2Jiajiri
69 No. of social-environmental
assessments undertaken
8.3m No. of loans processed through mobile banking
8.7b Amount disbursed in through Inua Jamii Program (in Kshs.)
512.6m Amount allocated to mobilization through partnerships to support Livestock Project (in Kshs.)
10 POINT ACTION PLAN PROGRESS REVIEW
582m Value of KCB Insurance Agency claims paid out (in Kshs.)
13.0m No. of registered KCB M-Pesa users
240 No. of scholarships awarded under Scholarship Programme
25,327 No. of KCB Insurance Agency policies
1,932 No. of KCB Insurance Agency claims
39,008 No. of farmers reached under the Mifugo ni Mali project
93 No. of site visits undertaken to assess E&S risk
29.6b Value of loans processed through mobile banking
61.3b Value of facilities that have undergone social-
environmental assessments (in Kshs.)
91% Proportion spent on local procurement
RESPONSIBLE LENDING
TALENT MANAGEMENT AND DIVERSITY
EMPOWERING YOUTH AND COMMUNITY
FINANCIAL INCLUSION
87% Employee satisfaction rate
2,331 No. of female permanent and
pensionable employees
22% Composition of women at senior
management
250 No. of women trained under the
Women in Leadership Programme
20% Composition of women on the KCB
Board (Group Board and country Boards)
7.1 Average training days per employee
2,582 No. of employees having undergone
sustainability awareness training
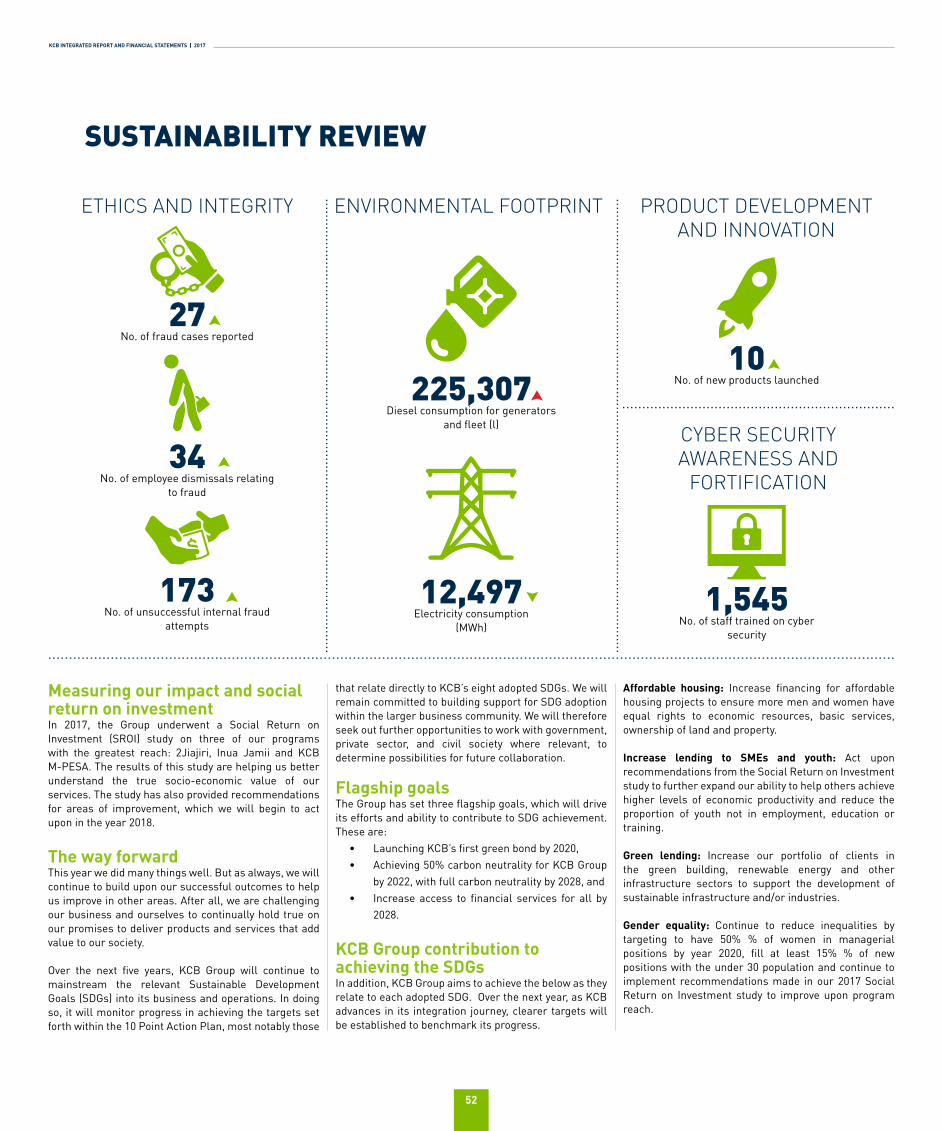
KCB INTEGRATED REPORT AND FINANCIAL STATEMENTS | 2017
52
Measuring our impact and social return on investmentIn 2017, the Group underwent a Social Return on Investment (SROI) study on three of our programs with the greatest reach: 2Jiajiri, Inua Jamii and KCB M-PESA. The results of this study are helping us better understand the true socio-economic value of our services. The study has also provided recommendations for areas of improvement, which we will begin to act upon in the year 2018.
The way forwardThis year we did many things well. But as always, we will continue to build upon our successful outcomes to help us improve in other areas. After all, we are challenging our business and ourselves to continually hold true on our promises to deliver products and services that add value to our society.
Over the next five years, KCB Group will continue to mainstream the relevant Sustainable Development Goals (SDGs) into its business and operations. In doing so, it will monitor progress in achieving the targets set forth within the 10 Point Action Plan, most notably those
that relate directly to KCB’s eight adopted SDGs. We will remain committed to building support for SDG adoption within the larger business community. We will therefore seek out further opportunities to work with government, private sector, and civil society where relevant, to determine possibilities for future collaboration.
Flagship goalsThe Group has set three flagship goals, which will drive its efforts and ability to contribute to SDG achievement. These are:
• Launching KCB’s first green bond by 2020, • Achieving 50% carbon neutrality for KCB Group
by 2022, with full carbon neutrality by 2028, and• Increase access to financial services for all by
2028.
KCB Group contribution to achieving the SDGsIn addition, KCB Group aims to achieve the below as they relate to each adopted SDG. Over the next year, as KCB advances in its integration journey, clearer targets will be established to benchmark its progress.
Affordable housing: Increase financing for affordable housing projects to ensure more men and women have equal rights to economic resources, basic services, ownership of land and property.
Increase lending to SMEs and youth: Act upon recommendations from the Social Return on Investment study to further expand our ability to help others achieve higher levels of economic productivity and reduce the proportion of youth not in employment, education or training.
Green lending: Increase our portfolio of clients in the green building, renewable energy and other infrastructure sectors to support the development of sustainable infrastructure and/or industries.
Gender equality: Continue to reduce inequalities by targeting to have 50% % of women in managerial positions by year 2020, fill at least 15% % of new positions with the under 30 population and continue to implement recommendations made in our 2017 Social Return on Investment study to improve upon program reach.
SUSTAINABILITY REVIEW
10 No. of new products launched
1,545 No. of staff trained on cyber
security
27 No. of fraud cases reported
34 No. of employee dismissals relating
to fraud
173 No. of unsuccessful internal fraud
attempts
225,307 Diesel consumption for generators
and fleet (l)
12,497 Electricity consumption
(MWh)
ETHICS AND INTEGRITY ENVIRONMENTAL FOOTPRINT PRODUCT DEVELOPMENT AND INNOVATION
CYBER SECURITY AWARENESS AND
FORTIFICATION
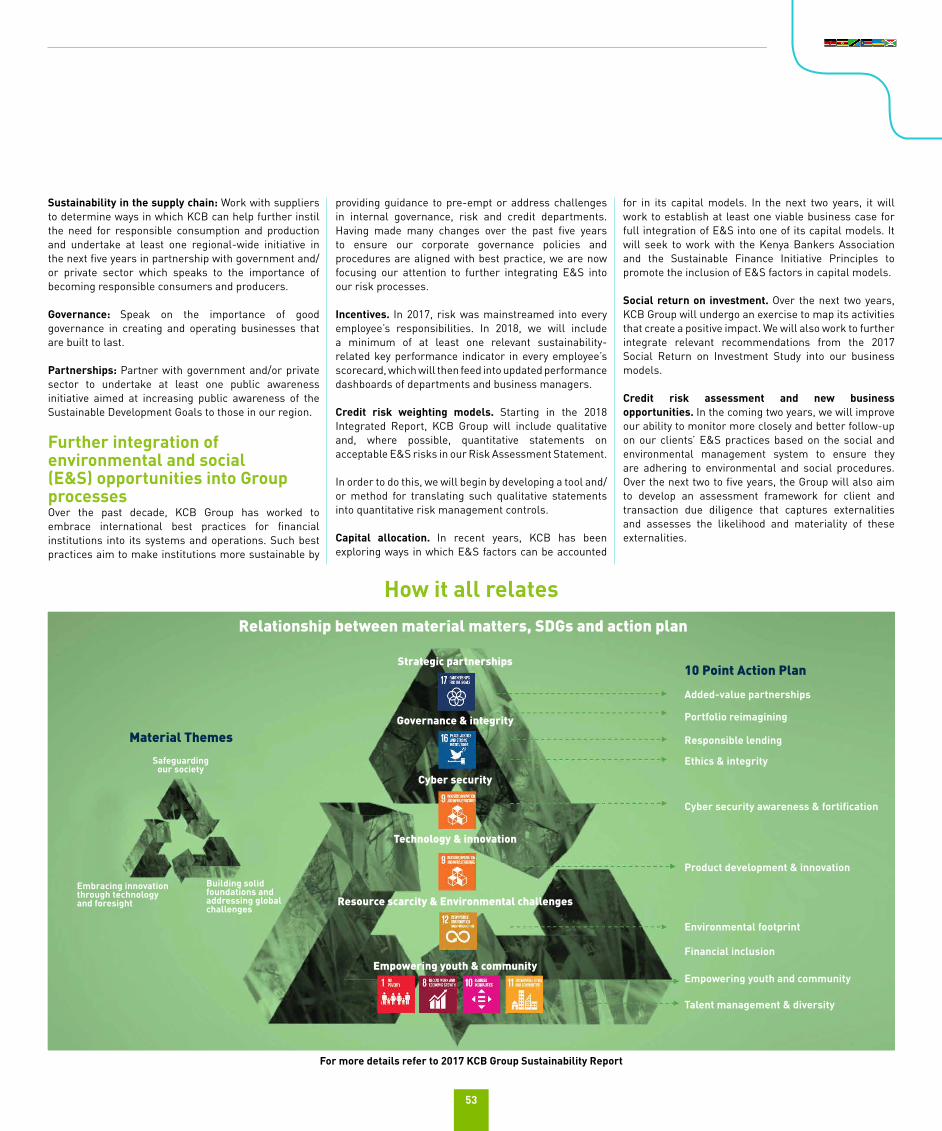
53
Sustainability in the supply chain: Work with suppliers to determine ways in which KCB can help further instil the need for responsible consumption and production and undertake at least one regional-wide initiative in the next five years in partnership with government and/or private sector which speaks to the importance of becoming responsible consumers and producers.
Governance: Speak on the importance of good governance in creating and operating businesses that are built to last.
Partnerships: Partner with government and/or private sector to undertake at least one public awareness initiative aimed at increasing public awareness of the Sustainable Development Goals to those in our region.
Further integration ofenvironmental and social (E&S) opportunities into Group processesOver the past decade, KCB Group has worked to embrace international best practices for financial institutions into its systems and operations. Such best practices aim to make institutions more sustainable by
providing guidance to pre-empt or address challenges in internal governance, risk and credit departments. Having made many changes over the past five years to ensure our corporate governance policies and procedures are aligned with best practice, we are now focusing our attention to further integrating E&S into our risk processes.
Incentives. In 2017, risk was mainstreamed into every employee’s responsibilities. In 2018, we will include a minimum of at least one relevant sustainability-related key performance indicator in every employee’s scorecard, which will then feed into updated performance dashboards of departments and business managers.
Credit risk weighting models. Starting in the 2018 Integrated Report, KCB Group will include qualitative and, where possible, quantitative statements on acceptable E&S risks in our Risk Assessment Statement.
In order to do this, we will begin by developing a tool and/or method for translating such qualitative statements into quantitative risk management controls.
Capital allocation. In recent years, KCB has been exploring ways in which E&S factors can be accounted
for in its capital models. In the next two years, it will work to establish at least one viable business case for full integration of E&S into one of its capital models. It will seek to work with the Kenya Bankers Association and the Sustainable Finance Initiative Principles to promote the inclusion of E&S factors in capital models.
Social return on investment. Over the next two years, KCB Group will undergo an exercise to map its activities that create a positive impact. We will also work to further integrate relevant recommendations from the 2017 Social Return on Investment Study into our business models.
Credit risk assessment and new business opportunities. In the coming two years, we will improve our ability to monitor more closely and better follow-up on our clients’ E&S practices based on the social and environmental management system to ensure they are adhering to environmental and social procedures. Over the next two to five years, the Group will also aim to develop an assessment framework for client and transaction due diligence that captures externalities and assesses the likelihood and materiality of these externalities.
How it all relates
Added-value partnerships
Strategic partnerships
Governance & integrity
Cyber security
Technology & innovation
Resource scarcity & Environmental challenges
Empowering youth & community
Building solid foundations and addressing global challenges
Embracing innovation through technology and foresight
Safeguarding our society
Responsible lending
Portfolio reimagining
Ethics & integrity
Cyber security awareness & fortification
Product development & innovation
Environmental footprint
Financial inclusion
Empowering youth and community
Talent management & diversity
Relationship between material matters, SDGs and action plan
For more details refer to 2017 KCB Group Sustainability Report
10 Point Action Plan
Material Themes
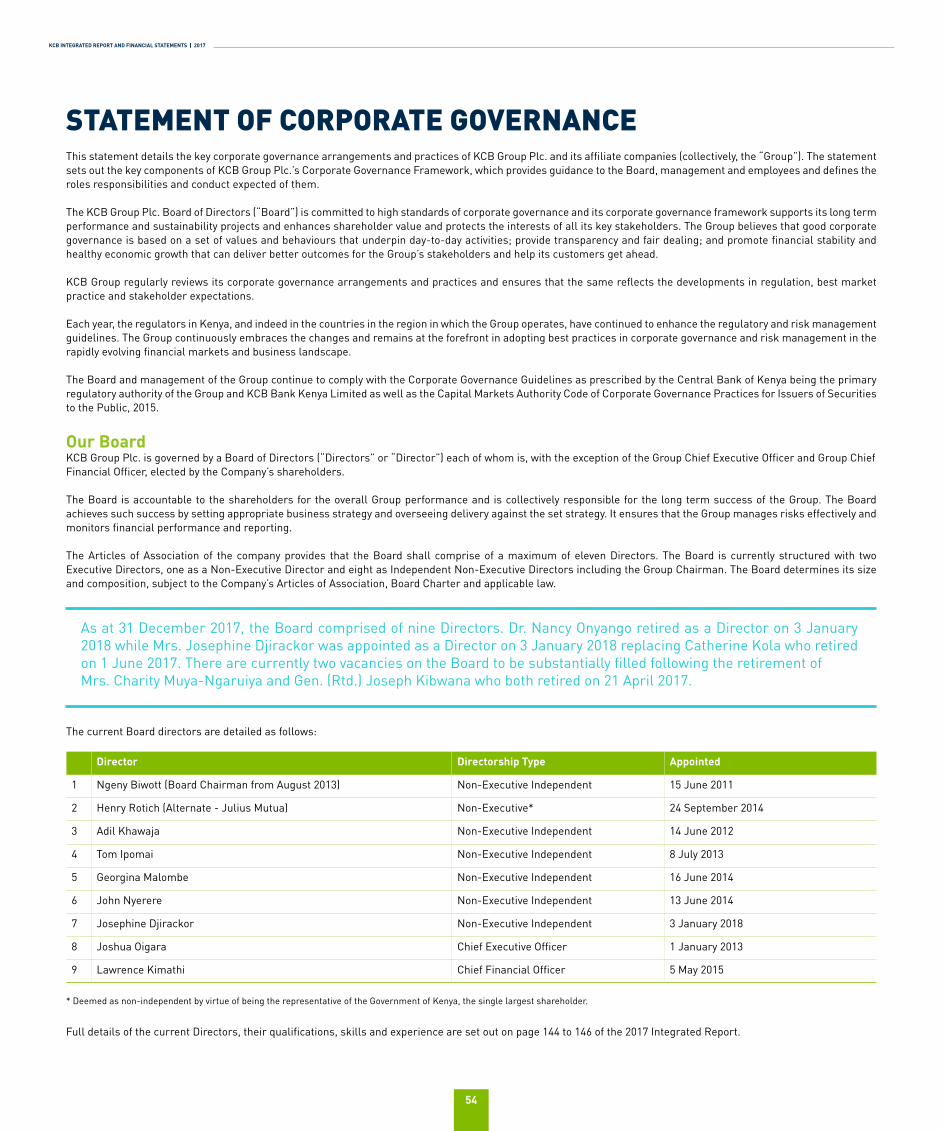
KCB INTEGRATED REPORT AND FINANCIAL STATEMENTS | 2017
54
This statement details the key corporate governance arrangements and practices of KCB Group Plc. and its affiliate companies (collectively, the “Group”). The statement sets out the key components of KCB Group Plc.’s Corporate Governance Framework, which provides guidance to the Board, management and employees and defines the roles responsibilities and conduct expected of them.
The KCB Group Plc. Board of Directors (“Board”) is committed to high standards of corporate governance and its corporate governance framework supports its long term performance and sustainability projects and enhances shareholder value and protects the interests of all its key stakeholders. The Group believes that good corporate governance is based on a set of values and behaviours that underpin day-to-day activities; provide transparency and fair dealing; and promote financial stability and healthy economic growth that can deliver better outcomes for the Group’s stakeholders and help its customers get ahead.
KCB Group regularly reviews its corporate governance arrangements and practices and ensures that the same reflects the developments in regulation, best market practice and stakeholder expectations.
Each year, the regulators in Kenya, and indeed in the countries in the region in which the Group operates, have continued to enhance the regulatory and risk management guidelines. The Group continuously embraces the changes and remains at the forefront in adopting best practices in corporate governance and risk management in the rapidly evolving financial markets and business landscape.
The Board and management of the Group continue to comply with the Corporate Governance Guidelines as prescribed by the Central Bank of Kenya being the primary regulatory authority of the Group and KCB Bank Kenya Limited as well as the Capital Markets Authority Code of Corporate Governance Practices for Issuers of Securities to the Public, 2015.
Our BoardKCB Group Plc. is governed by a Board of Directors (“Directors” or “Director”) each of whom is, with the exception of the Group Chief Executive Officer and Group Chief Financial Officer, elected by the Company’s shareholders.
The Board is accountable to the shareholders for the overall Group performance and is collectively responsible for the long term success of the Group. The Board achieves such success by setting appropriate business strategy and overseeing delivery against the set strategy. It ensures that the Group manages risks effectively and monitors financial performance and reporting.
The Articles of Association of the company provides that the Board shall comprise of a maximum of eleven Directors. The Board is currently structured with two Executive Directors, one as a Non-Executive Director and eight as Independent Non-Executive Directors including the Group Chairman. The Board determines its size and composition, subject to the Company’s Articles of Association, Board Charter and applicable law.
STATEMENT OF CORPORATE GOVERNANCE
Director Directorship Type Appointed
1 Ngeny Biwott (Board Chairman from August 2013) Non-Executive Independent 15 June 2011
2 Henry Rotich (Alternate - Julius Mutua) Non-Executive* 24 September 2014
3 Adil Khawaja Non-Executive Independent 14 June 2012
4 Tom Ipomai Non-Executive Independent 8 July 2013
5 Georgina Malombe Non-Executive Independent 16 June 2014
6 John Nyerere Non-Executive Independent 13 June 2014
7 Josephine Djirackor Non-Executive Independent 3 January 2018
8 Joshua Oigara Chief Executive Officer 1 January 2013
9 Lawrence Kimathi Chief Financial Officer 5 May 2015
The current Board directors are detailed as follows:
Full details of the current Directors, their qualifications, skills and experience are set out on page 144 to 146 of the 2017 Integrated Report.
* Deemed as non-independent by virtue of being the representative of the Government of Kenya, the single largest shareholder.
As at 31 December 2017, the Board comprised of nine Directors. Dr. Nancy Onyango retired as a Director on 3 January 2018 while Mrs. Josephine Djirackor was appointed as a Director on 3 January 2018 replacing Catherine Kola who retired on 1 June 2017. There are currently two vacancies on the Board to be substantially filled following the retirement of Mrs. Charity Muya-Ngaruiya and Gen. (Rtd.) Joseph Kibwana who both retired on 21 April 2017.
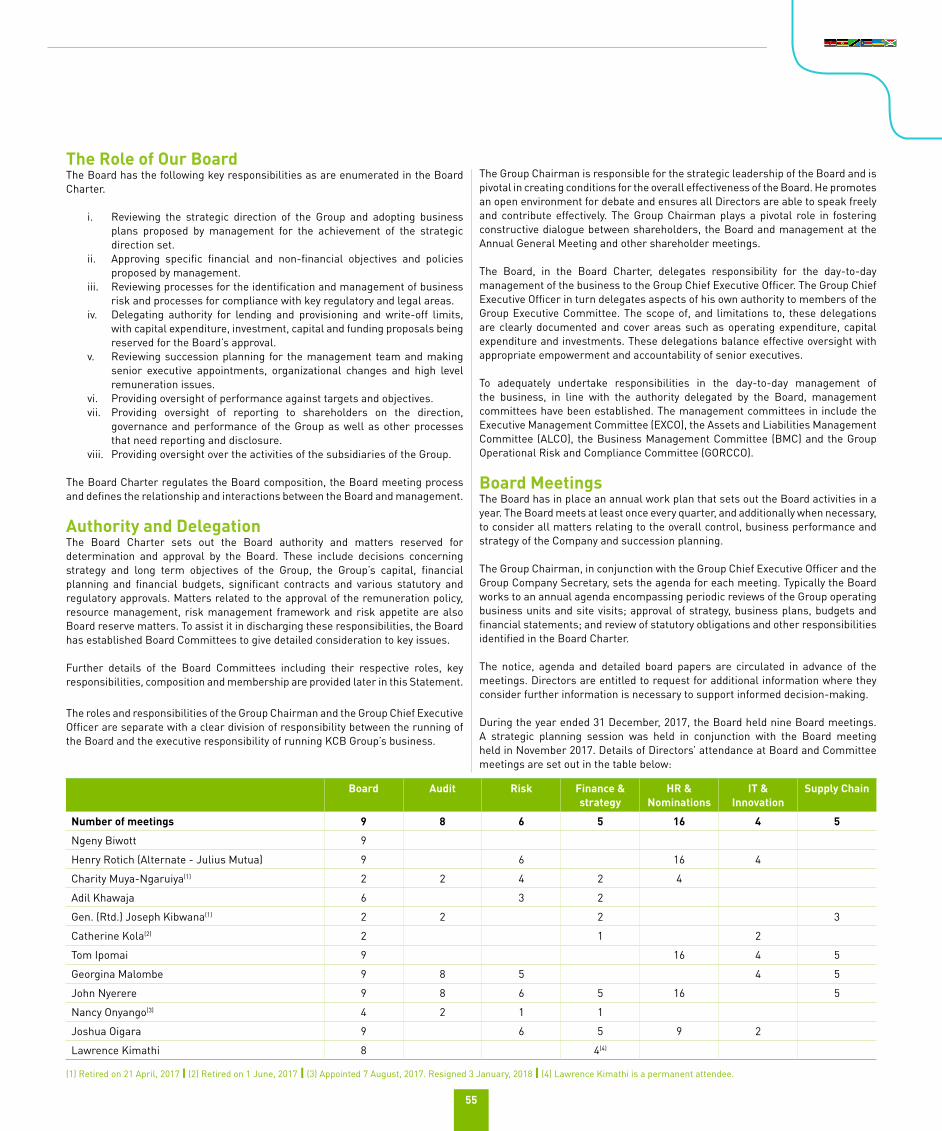
55
The Role of Our BoardThe Board has the following key responsibilities as are enumerated in the Board Charter.
i. Reviewing the strategic direction of the Group and adopting business plans proposed by management for the achievement of the strategic direction set.
ii. Approving specific financial and non-financial objectives and policies proposed by management.
iii. Reviewing processes for the identification and management of business risk and processes for compliance with key regulatory and legal areas.
iv. Delegating authority for lending and provisioning and write-off limits, with capital expenditure, investment, capital and funding proposals being reserved for the Board’s approval.
v. Reviewing succession planning for the management team and making senior executive appointments, organizational changes and high level remuneration issues.
vi. Providing oversight of performance against targets and objectives.vii. Providing oversight of reporting to shareholders on the direction,
governance and performance of the Group as well as other processes that need reporting and disclosure.
viii. Providing oversight over the activities of the subsidiaries of the Group.
The Board Charter regulates the Board composition, the Board meeting process and defines the relationship and interactions between the Board and management.
Authority and DelegationThe Board Charter sets out the Board authority and matters reserved for determination and approval by the Board. These include decisions concerning strategy and long term objectives of the Group, the Group’s capital, financial planning and financial budgets, significant contracts and various statutory and regulatory approvals. Matters related to the approval of the remuneration policy, resource management, risk management framework and risk appetite are also Board reserve matters. To assist it in discharging these responsibilities, the Board has established Board Committees to give detailed consideration to key issues.
Further details of the Board Committees including their respective roles, key responsibilities, composition and membership are provided later in this Statement.
The roles and responsibilities of the Group Chairman and the Group Chief Executive Officer are separate with a clear division of responsibility between the running of the Board and the executive responsibility of running KCB Group’s business.
The Group Chairman is responsible for the strategic leadership of the Board and is pivotal in creating conditions for the overall effectiveness of the Board. He promotes an open environment for debate and ensures all Directors are able to speak freely and contribute effectively. The Group Chairman plays a pivotal role in fostering constructive dialogue between shareholders, the Board and management at the Annual General Meeting and other shareholder meetings.
The Board, in the Board Charter, delegates responsibility for the day-to-day management of the business to the Group Chief Executive Officer. The Group Chief Executive Officer in turn delegates aspects of his own authority to members of the Group Executive Committee. The scope of, and limitations to, these delegations are clearly documented and cover areas such as operating expenditure, capital expenditure and investments. These delegations balance effective oversight with appropriate empowerment and accountability of senior executives.
To adequately undertake responsibilities in the day-to-day management of the business, in line with the authority delegated by the Board, management committees have been established. The management committees in include the Executive Management Committee (EXCO), the Assets and Liabilities Management Committee (ALCO), the Business Management Committee (BMC) and the Group Operational Risk and Compliance Committee (GORCCO).
Board MeetingsThe Board has in place an annual work plan that sets out the Board activities in a year. The Board meets at least once every quarter, and additionally when necessary, to consider all matters relating to the overall control, business performance and strategy of the Company and succession planning.
The Group Chairman, in conjunction with the Group Chief Executive Officer and the Group Company Secretary, sets the agenda for each meeting. Typically the Board works to an annual agenda encompassing periodic reviews of the Group operating business units and site visits; approval of strategy, business plans, budgets and financial statements; and review of statutory obligations and other responsibilities identified in the Board Charter.
The notice, agenda and detailed board papers are circulated in advance of the meetings. Directors are entitled to request for additional information where they consider further information is necessary to support informed decision-making.
During the year ended 31 December, 2017, the Board held nine Board meetings. A strategic planning session was held in conjunction with the Board meeting held in November 2017. Details of Directors’ attendance at Board and Committee meetings are set out in the table below:
Board Audit Risk Finance & strategy
HR & Nominations
IT & Innovation
Supply Chain
Number of meetings 9 8 6 5 16 4 5
Ngeny Biwott 9
Henry Rotich (Alternate - Julius Mutua) 9 6 16 4
Charity Muya-Ngaruiya(1) 2 2 4 2 4
Adil Khawaja 6 3 2
Gen. (Rtd.) Joseph Kibwana(1) 2 2 2 3
Catherine Kola(2) 2 1 2
Tom Ipomai 9 16 4 5
Georgina Malombe 9 8 5 4 5
John Nyerere 9 8 6 5 16 5
Nancy Onyango(3) 4 2 1 1
Joshua Oigara 9 6 5 9 2
Lawrence Kimathi 8 4(4)
(1) Retired on 21 April, 2017 | (2) Retired on 1 June, 2017 | (3) Appointed 7 August, 2017. Resigned 3 January, 2018 | (4) Lawrence Kimathi is a permanent attendee.
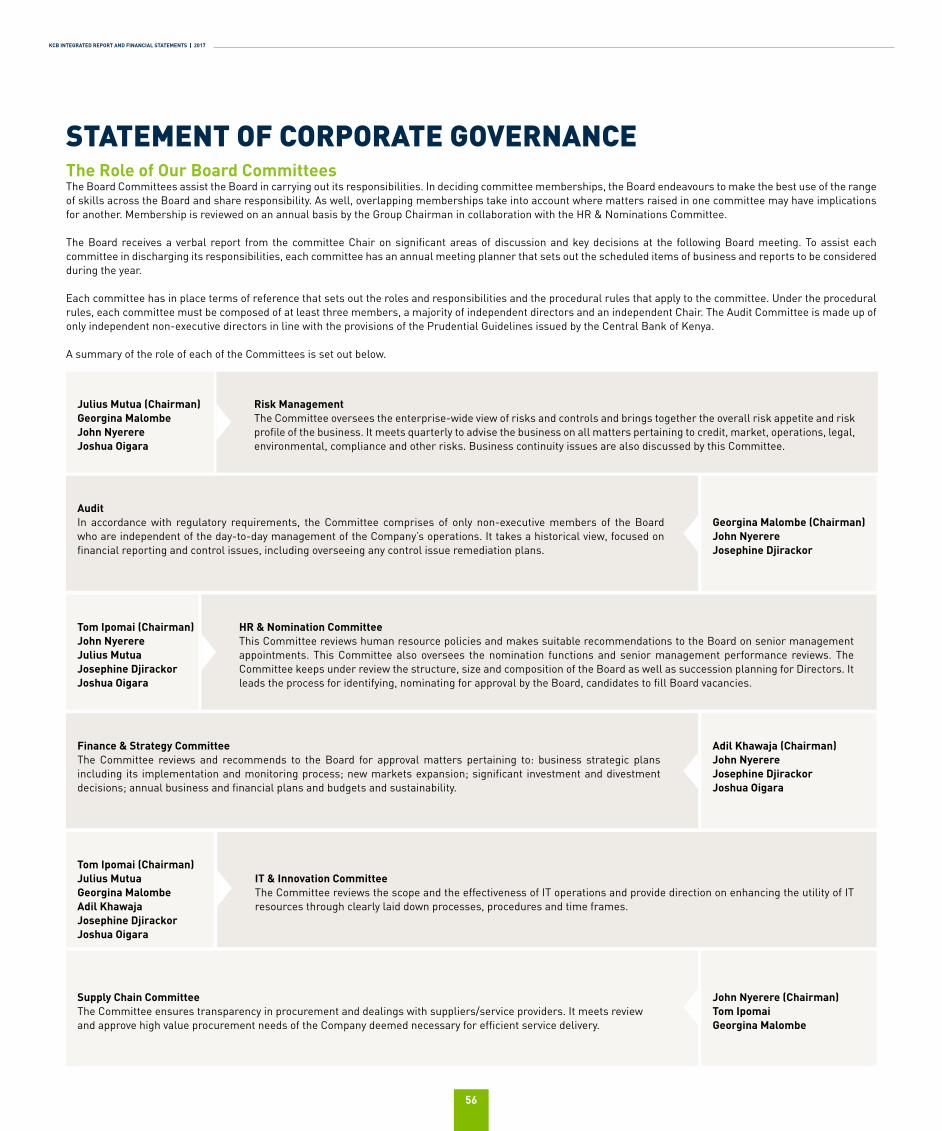
KCB INTEGRATED REPORT AND FINANCIAL STATEMENTS | 2017
56
STATEMENT OF CORPORATE GOVERNANCEThe Role of Our Board CommitteesThe Board Committees assist the Board in carrying out its responsibilities. In deciding committee memberships, the Board endeavours to make the best use of the range of skills across the Board and share responsibility. As well, overlapping memberships take into account where matters raised in one committee may have implications for another. Membership is reviewed on an annual basis by the Group Chairman in collaboration with the HR & Nominations Committee.
The Board receives a verbal report from the committee Chair on significant areas of discussion and key decisions at the following Board meeting. To assist each committee in discharging its responsibilities, each committee has an annual meeting planner that sets out the scheduled items of business and reports to be considered during the year.
Each committee has in place terms of reference that sets out the roles and responsibilities and the procedural rules that apply to the committee. Under the procedural rules, each committee must be composed of at least three members, a majority of independent directors and an independent Chair. The Audit Committee is made up of only independent non-executive directors in line with the provisions of the Prudential Guidelines issued by the Central Bank of Kenya.
A summary of the role of each of the Committees is set out below.
Julius Mutua (Chairman)Georgina MalombeJohn NyerereJoshua Oigara
Risk Management The Committee oversees the enterprise-wide view of risks and controls and brings together the overall risk appetite and risk profile of the business. It meets quarterly to advise the business on all matters pertaining to credit, market, operations, legal, environmental, compliance and other risks. Business continuity issues are also discussed by this Committee.
Georgina Malombe (Chairman)John NyerereJosephine Djirackor
HR & Nomination CommitteeThis Committee reviews human resource policies and makes suitable recommendations to the Board on senior management appointments. This Committee also oversees the nomination functions and senior management performance reviews. The Committee keeps under review the structure, size and composition of the Board as well as succession planning for Directors. It leads the process for identifying, nominating for approval by the Board, candidates to fill Board vacancies.
Adil Khawaja (Chairman)John NyerereJosephine DjirackorJoshua Oigara
IT & Innovation CommitteeThe Committee reviews the scope and the effectiveness of IT operations and provide direction on enhancing the utility of IT resources through clearly laid down processes, procedures and time frames.
John Nyerere (Chairman)Tom IpomaiGeorgina Malombe
AuditIn accordance with regulatory requirements, the Committee comprises of only non-executive members of the Board who are independent of the day-to-day management of the Company’s operations. It takes a historical view, focused on financial reporting and control issues, including overseeing any control issue remediation plans.
Tom Ipomai (Chairman)John NyerereJulius MutuaJosephine DjirackorJoshua Oigara
Finance & Strategy CommitteeThe Committee reviews and recommends to the Board for approval matters pertaining to: business strategic plans including its implementation and monitoring process; new markets expansion; significant investment and divestment decisions; annual business and financial plans and budgets and sustainability.
Tom Ipomai (Chairman)Julius MutuaGeorgina MalombeAdil KhawajaJosephine DjirackorJoshua Oigara
Supply Chain CommitteeThe Committee ensures transparency in procurement and dealings with suppliers/service providers. It meets review and approve high value procurement needs of the Company deemed necessary for efficient service delivery.
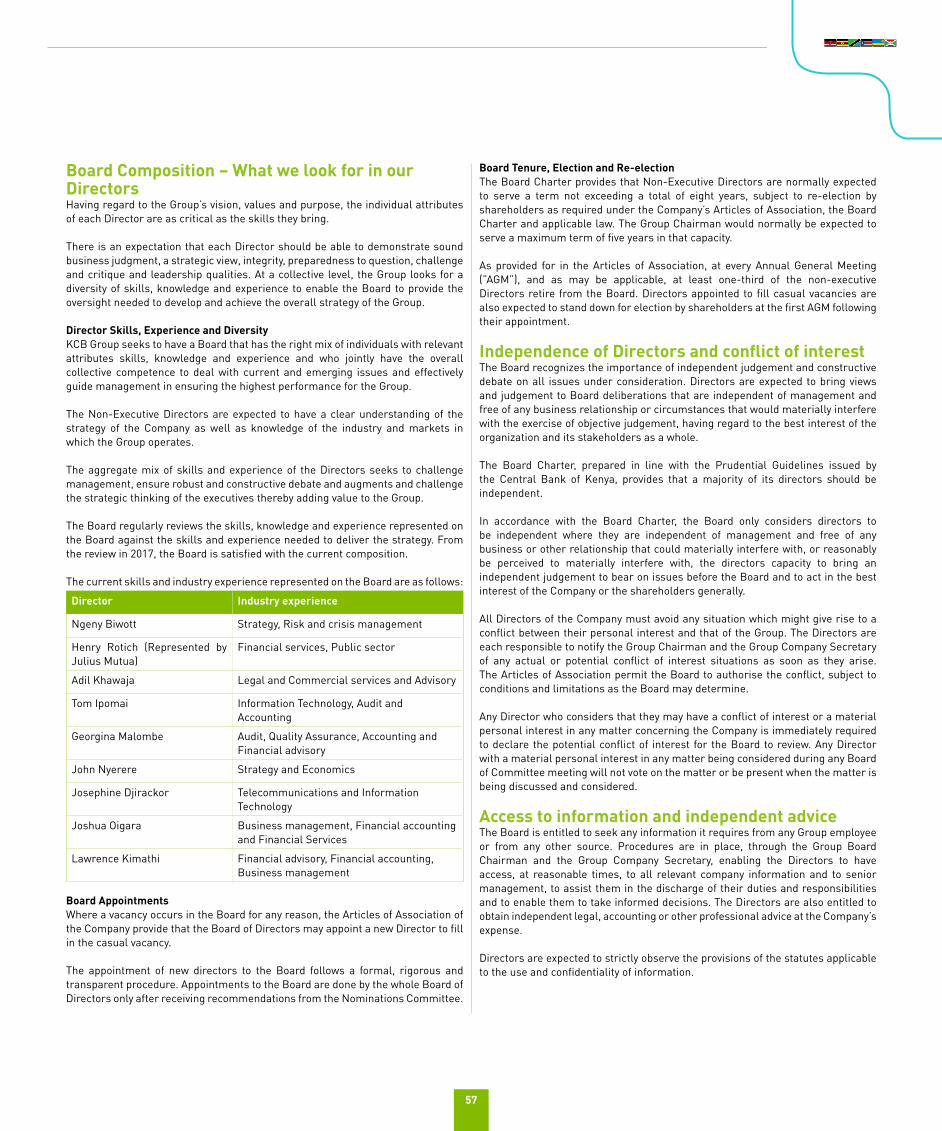
57
Board Composition – What we look for in our DirectorsHaving regard to the Group’s vision, values and purpose, the individual attributes of each Director are as critical as the skills they bring.
There is an expectation that each Director should be able to demonstrate sound business judgment, a strategic view, integrity, preparedness to question, challenge and critique and leadership qualities. At a collective level, the Group looks for a diversity of skills, knowledge and experience to enable the Board to provide the oversight needed to develop and achieve the overall strategy of the Group.
Director Skills, Experience and DiversityKCB Group seeks to have a Board that has the right mix of individuals with relevant attributes skills, knowledge and experience and who jointly have the overall collective competence to deal with current and emerging issues and effectively guide management in ensuring the highest performance for the Group.
The Non-Executive Directors are expected to have a clear understanding of the strategy of the Company as well as knowledge of the industry and markets in which the Group operates.
The aggregate mix of skills and experience of the Directors seeks to challenge management, ensure robust and constructive debate and augments and challenge the strategic thinking of the executives thereby adding value to the Group.
The Board regularly reviews the skills, knowledge and experience represented on the Board against the skills and experience needed to deliver the strategy. From the review in 2017, the Board is satisfied with the current composition.
The current skills and industry experience represented on the Board are as follows:
Director Industry experience
Ngeny Biwott Strategy, Risk and crisis management
Henry Rotich (Represented by Julius Mutua)
Financial services, Public sector
Adil Khawaja Legal and Commercial services and Advisory
Tom Ipomai Information Technology, Audit and Accounting
Georgina Malombe Audit, Quality Assurance, Accounting and Financial advisory
John Nyerere Strategy and Economics
Josephine Djirackor Telecommunications and Information Technology
Joshua Oigara Business management, Financial accounting and Financial Services
Lawrence Kimathi Financial advisory, Financial accounting, Business management
Board AppointmentsWhere a vacancy occurs in the Board for any reason, the Articles of Association of the Company provide that the Board of Directors may appoint a new Director to fill in the casual vacancy.
The appointment of new directors to the Board follows a formal, rigorous and transparent procedure. Appointments to the Board are done by the whole Board of Directors only after receiving recommendations from the Nominations Committee.
Board Tenure, Election and Re-electionThe Board Charter provides that Non-Executive Directors are normally expected to serve a term not exceeding a total of eight years, subject to re-election by shareholders as required under the Company’s Articles of Association, the Board Charter and applicable law. The Group Chairman would normally be expected to serve a maximum term of five years in that capacity.
As provided for in the Articles of Association, at every Annual General Meeting (”AGM”), and as may be applicable, at least one-third of the non-executive Directors retire from the Board. Directors appointed to fill casual vacancies are also expected to stand down for election by shareholders at the first AGM following their appointment.
Independence of Directors and conflict of interestThe Board recognizes the importance of independent judgement and constructive debate on all issues under consideration. Directors are expected to bring views and judgement to Board deliberations that are independent of management and free of any business relationship or circumstances that would materially interfere with the exercise of objective judgement, having regard to the best interest of the organization and its stakeholders as a whole.
The Board Charter, prepared in line with the Prudential Guidelines issued by the Central Bank of Kenya, provides that a majority of its directors should be independent.
In accordance with the Board Charter, the Board only considers directors to be independent where they are independent of management and free of any business or other relationship that could materially interfere with, or reasonably be perceived to materially interfere with, the directors capacity to bring an independent judgement to bear on issues before the Board and to act in the best interest of the Company or the shareholders generally.
All Directors of the Company must avoid any situation which might give rise to a conflict between their personal interest and that of the Group. The Directors are each responsible to notify the Group Chairman and the Group Company Secretary of any actual or potential conflict of interest situations as soon as they arise. The Articles of Association permit the Board to authorise the conflict, subject to conditions and limitations as the Board may determine.
Any Director who considers that they may have a conflict of interest or a material personal interest in any matter concerning the Company is immediately required to declare the potential conflict of interest for the Board to review. Any Director with a material personal interest in any matter being considered during any Board of Committee meeting will not vote on the matter or be present when the matter is being discussed and considered.
Access to information and independent adviceThe Board is entitled to seek any information it requires from any Group employee or from any other source. Procedures are in place, through the Group Board Chairman and the Group Company Secretary, enabling the Directors to have access, at reasonable times, to all relevant company information and to senior management, to assist them in the discharge of their duties and responsibilities and to enable them to take informed decisions. The Directors are also entitled to obtain independent legal, accounting or other professional advice at the Company’s expense.
Directors are expected to strictly observe the provisions of the statutes applicable to the use and confidentiality of information.
KCB INTEGRATED REPORT AND FINANCIAL STATEMENTS | 2017
58
STATEMENT OF CORPORATE GOVERNANCEDirector induction and professional developmentEach new Director is provided with a letter of appointment and participates in a comprehensive and tailored induction program. Typical induction programmes consist of a series of meetings with other Directors and senior executives to enable new Directors familiarise themselves with the business. Directors also receive comprehensive guidance from the Group Company Secretary on Directors’ duties and liabilities.
All Directors are expected to maintain the skills required to carry out their obligations. The Chairman regularly reviews the professional development needs of each Director. The program of continuing education ensures that the Board is kept up to date with developments in the industry both locally and globally. It includes sessions with local and overseas experts in the areas of general corporate governance and also in the particular fields relevant to the Group’s operations.
During the year 2017, amongst other individual professional development courses, the Board of Directors underwent training sessions on emerging areas in audit, information technology as well as a session on risk management by an international consultant.
Board performance evaluationThe Board reviews its performance and that of the Board Committees and individual directors annually. Every third year, the review is facilitated by an external consultant.
The review in respect of the 2017 financial year was conducted internally by the Group Chairman through the coordination of the Group Company Secretary. Each director completed a detailed questionnaire designed to obtain feedback on the Board’s performance in the following areas:
• Strategic objectives; • Risk governance; • Board composition and skills;• Board meetings and preparation;• Board interaction and support;• Performance of governance functions; and• Performance of the Chairman, respective Committees and individual
Directors.
The questionnaire also included a series of questions for each director to assess their own performance and the performance of each other individual director to identify development opportunities.
The Directors provided consistent and positive feedback on the areas under review in the board evaluation. For the 2017 financial year, the evaluation outcome found that the Board continues to operate effectively and is well positioned to address any challenges faced by the Group.
The Board evaluation was conducted in February 2018 and the results presented to the Central Bank of Kenya in March 2018 in line with regulatory requirements.
The Group Company SecretaryThe Group Company Secretary is appointed by the Board and is responsible for advising the Board and providing good information flows and practical support for directors. The Group Company Secretary places particular emphasis on supporting Non-Executive Directors in maintaining the highest standard of probity and corporate governance.
The Group Company Secretary is responsible for monitoring compliance with the Board’s procedures and implementing the governance framework to give practical effect to the Board’s decisions. The Company Secretary is also responsible for facilitating good information flows within the Board and its Committees and between the Directors and management as well as the induction of new Directors and the ongoing professional development of Directors. Each member of the Board has direct access to the Group Company Secretary.
The performance of the Group Company Secretary is assessed by the Board as part of the annual Board performance evaluation process.
Our engagement with our shareholdersKCB Group is committed to giving its shareholders appropriate information and facilities to enable them exercise their rights effectively. As a result, the Group seeks to provide shareholders with information that is timely, of high quality and relevant to their investment, and to listen and respond to shareholder feedback.
The Board recognizes the importance of maintaining transparency and accountability to its shareholders. The Board ensures that all the Company’s shareholders are treated equitably and the rights of all shareholders are protected. The Board has put in place a sustainable programme of engagement which offers all shareholders an opportunity to receive information directly and enable them share their views with the Board.
Communication and Periodic Continuous DisclosureKey shareholder communication include the Group’s Annual Integrated Report, the Group Sustainability Report and full year and half-yearly and quarterly financial results. The Group additionally posts all material information on its website www.kcbgroup.com. Shareholders are encouraged to visit for general information about the Group and to be able to view annual reports and results briefing presentations.
The Group additionally releases material information to the Capital Markets Authority and the Nairobi Securities Exchange as well as the Central Bank of Kenya in line with all disclosure requirements in the Capital Markets Act, the Banking Act, the Prudential Guidelines as well as all other relevant regulation.
Annual General MeetingsThe annual general meeting provides an opportunity for shareholders to engage with us in person. The Group encourages shareholders to attend and participate in its annual general meeting. As well as attending in person or voting by proxy, shareholders can use direct voting.
The Group makes use of the Annual General Meeting (AGM) as well as the published annual report as an opportunity to communicate with its shareholders. At the meeting, a reasonable opportunity is allowed for shareholders as a whole to ask questions about or make comments on the management of the Group.
Investment CommunityThe Group, through its Investor Relations team, works to facilitate two-way communication with the investor community and to foster participation at various meetings with shareholders.
The Investor Relations team has the primary responsibility for managing and developing the Group’s external relationships with existing and potential institutional equity investors. Supported by the Group Chief Executive Officer and the Group Chief Financial Officer, they achieve this through a combination of briefings to analysts and institutional investors (both at results briefings and throughout the year).
59
Their responsibilities include drafting certain market announcements, providing feedback to management and the Board on market views and perceptions about the Group, liaising with rating agencies, providing assistance to investors, brokers and analysts and coordinating roadshows, including for the half-year and full-year results announcements.
Outsourcing of Shares Registry ServicesDuring the year 2017, KCB Group Plc., in a bid to better serve its retail shareholders, outsourced its Shares Registry services to better manage it’s interaction with and service offering to its retail shareholders. This was done to ensure there is a better experience for the retail shareholders of the company especially on legacy matters. All shareholder queries, application for registration of transfer of shares of the Company, immobilization of shares and dividend queries as well as the collection of share certificates and dividend cheque are handled by the Company’s appointed shares registrar with effect from 1 November, 2017.
With effect from 1st November, 2017, IMAGE REGISTRARS LIMITED was appointed the KCB Group Plc.’s Shares Registrar.
The physical and postal address of Image Registrars Limited is as follows:
5th Floor, Barclays Plaza, Loita StreetP.O. Box 9287-00100, Nairobi.Telephone: 0709 170 000, 0724 699 667, 0735 565 666Mobile: 0724 699 667, 0735 565 666Email: [email protected]
Website: www.image.co.ke
Integrity of our financial reportingThe integrity of financial reporting to Shareholders is protected through the following elements.
• Board oversight and responsibility• Oversight from the Audit Committee• External Auditor
BoardThe Directors are responsible for assessing whether the financial statements and notes are in accordance with the Companies Act, 2015, comply with accounting standards and give a true and fair view of the financial position and performance of the Group. A Directors’ declaration to this effect is included in the annual financial report
Audit CommitteeThe Audit Committee assists the Board by providing oversight of the Group’s financial reporting responsibilities including external audit independence and performance. The Audit Committee responsibilities include the following:
• Reviewing the half-year and full-year statutory financial reports for recommendation to the Board.
• Reviewing significant accounting estimates and judgments used for the preparation of the financial reports.
• Reviewing and approving any new or proposed changes in Group accounting policies.
• Monitoring developments in statutory reporting and accounting and disclosure requirements
External AuditorThe audit or review by the external auditor provides a further level of protection of the integrity of the financial statements. The Audit Committee oversees the external audit function. This includes reviewing and approving the external audit plan and engagement, and assessing the performance of the external auditor.
Whereas the directors are responsible for preparing the accounts and for presenting a balanced and fair view of the financial position of the Company, the external auditor examines and gives their opinion on the reasonableness of the financial statements. Independence of the external auditor is important to the integrity of the audit function. The external auditor is invited to meetings with the Audit Committee from time to time without management or others being present. The external auditor report independently and directly to the Board at the end year Board meetings.
Directors remuneration The Human Resources & Nominations Committee of the Board is responsible for setting and administering the Non-executive Directors remuneration policy.
The aggregate amount of emoluments paid to Directors for services rendered during the Year 2017 is disclosed in Note 18 to the Financial Statements.
Neither at the end of the financial year, nor at any time during the year, did there exist any arrangement to which the Company is a party, under which Directors acquired benefits by means of acquisition of the Company’s shares.
Additional details are provided in the Directors’ Remuneration Report at page 65 to 69 of the Integrated Report
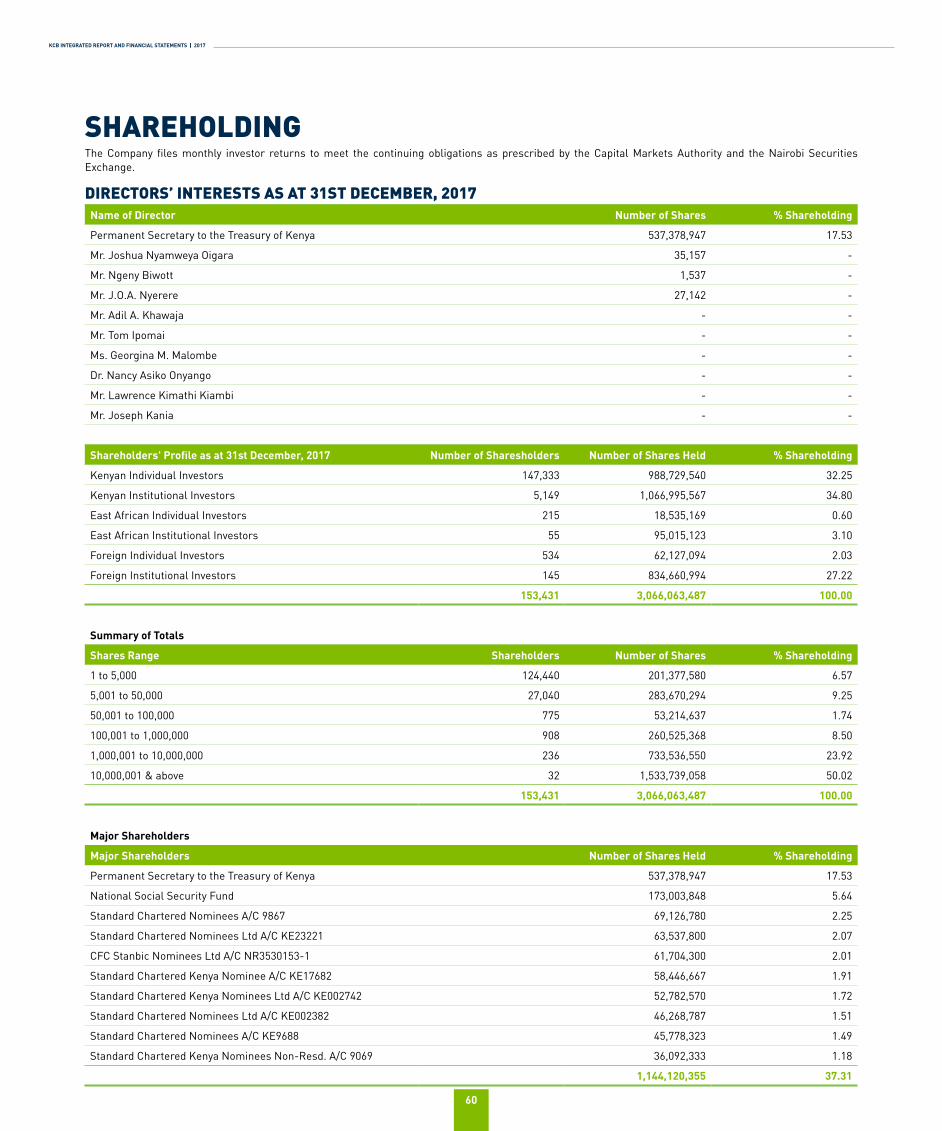
KCB INTEGRATED REPORT AND FINANCIAL STATEMENTS | 2017
60
SHAREHOLDINGThe Company files monthly investor returns to meet the continuing obligations as prescribed by the Capital Markets Authority and the Nairobi Securities Exchange.
DIRECTORS’ INTERESTS AS AT 31ST DECEMBER, 2017Name of Director Number of Shares % Shareholding
Permanent Secretary to the Treasury of Kenya 537,378,947 17.53
Mr. Joshua Nyamweya Oigara 35,157 -
Mr. Ngeny Biwott 1,537 -
Mr. J.O.A. Nyerere 27,142 -
Mr. Adil A. Khawaja - -
Mr. Tom Ipomai - -
Ms. Georgina M. Malombe - -
Dr. Nancy Asiko Onyango - -
Mr. Lawrence Kimathi Kiambi - -
Mr. Joseph Kania - -
Shareholders' Profile as at 31st December, 2017 Number of Sharesholders Number of Shares Held % Shareholding
Kenyan Individual Investors 147,333 988,729,540 32.25
Kenyan Institutional Investors 5,149 1,066,995,567 34.80
East African Individual Investors 215 18,535,169 0.60
East African Institutional Investors 55 95,015,123 3.10
Foreign Individual Investors 534 62,127,094 2.03
Foreign Institutional Investors 145 834,660,994 27.22
153,431 3,066,063,487 100.00
Summary of Totals
Shares Range Shareholders Number of Shares % Shareholding
1 to 5,000 124,440 201,377,580 6.57
5,001 to 50,000 27,040 283,670,294 9.25
50,001 to 100,000 775 53,214,637 1.74
100,001 to 1,000,000 908 260,525,368 8.50
1,000,001 to 10,000,000 236 733,536,550 23.92
10,000,001 & above 32 1,533,739,058 50.02
153,431 3,066,063,487 100.00
Major Shareholders
Major Shareholders Number of Shares Held % Shareholding
Permanent Secretary to the Treasury of Kenya 537,378,947 17.53
National Social Security Fund 173,003,848 5.64
Standard Chartered Nominees A/C 9867 69,126,780 2.25
Standard Chartered Nominees Ltd A/C KE23221 63,537,800 2.07
CFC Stanbic Nominees Ltd A/C NR3530153-1 61,704,300 2.01
Standard Chartered Kenya Nominee A/C KE17682 58,446,667 1.91
Standard Chartered Kenya Nominees Ltd A/C KE002742 52,782,570 1.72
Standard Chartered Nominees Ltd A/C KE002382 46,268,787 1.51
Standard Chartered Nominees A/C KE9688 45,778,323 1.49
Standard Chartered Kenya Nominees Non-Resd. A/C 9069 36,092,333 1.18
1,144,120,355 37.31
61
FINANCIAL STATEMENTS AND NOTESFOR THE YEAR ENDED 31 DECEMBER 2017

KCB INTEGRATED REPORT AND FINANCIAL STATEMENTS | 2017
62
Directors and Statutory Information
Report of the Directors
Director’s remuneration report
Statement of Directors’ Responsibilities
Report of the Independent Auditor
Consolidated Statement of Profit or Loss
Consolidated Statement of Other Comprehensive Income
Consolidated Statement of Financial Position
Company Statement of Profit or Loss
Company Statement of Other Comprehensive Income
Company Statement of Financial Position
Consolidated Statement of Changes in Equity
Company Statement of Changes in Equity
Consolidated Statement of Cash Flows
Company Statement of Cash Flows
Notes to the Financial Statements
63
64
65
70
71
74
75
76
77
78
79
80
82
84
85
86
TABLE OF CONTENTS
63
DIRECTORSMr. Ngeny Biwott - ChairmanMr. Joshua. N. Oigara - Chief Executive Officer & Managing DirectorMr. Henry K Rotich - Alternate Mr. Julius MutuaMrs. Catherine Kola - Retired 1 June 2017Mrs. Charity M. Muya-Ngaruiya - Retired 21 April 2017Mr. Adil A. Khawaja Gen. (Rtd) Joseph R.E. Kibwana - Retired 21 April 2017Mr. Tom D. Ipomai Mr. John Okoth A. NyerereMs. Georgina .M. Malombe Dr. Nancy A Onyango - Appointed 22 September 2017 and resigned 3 January 2018Mrs. Josephine Djirackor - Appointed 3 January 2018Mr. Lawrence Kimathi - Chief Financial Officer
SECRETARYMr. Joseph Kania PO Box 48400 - 00100Nairobi, Kenya
AUDITORSKPMG KenyaCertified Public Accountants8th Floor, ABC TowersABC Place, Waiyaki WayPO Box 40612 - 00100Nairobi, Kenya
REGISTERED OFFICES AND PRINCIPAL PLACES OF BUSINESS KCB Group PLC KCB Bank Tanzania LimitedKencom House Harambee PlazaMoi Avenue Ali Hassan Mwinyi Road/Kaunda Road JunctionP.O. Box 48400 - 00100 PO Box 804Nairobi, Kenya Dar es Salaam, Tanzania
KCB Bank South Sudan Limited KCB Bank Uganda LimitedKCB Plaza Commercial PlazaMinistry Road 7 Kampala RoadP.O. Box 47 PO Box 7399Juba, Southern Sudan Kampala, Uganda
KCB Bank Rwanda Limited KCB Bank Burundi Limited Avenue de la Paix Boulevard Patrice LumumbaPO Box 5620 PO Box 6119Kigali, Rwanda Bujumbura, Burundi
KCB Bank Kenya Ltd (Ethiopia Representative Office)Morning Star Mall 4th floor Bole MedhanialemAddis Ababa, Ethiopia
SOLICITORSVarious. A list is available at the Company
DIRECTORS AND STATUTORY INFORMATION FOR THE YEAR ENDED 31 DECEMBER 2017
KCB INTEGRATED REPORT AND FINANCIAL STATEMENTS | 2017
64
REPORT OF THE DIRECTORSFOR THE YEAR ENDED 31 DECEMBER 2017The Directors submit their report together with the audited financial statements for the year ended 31 December 2017, in accordance with the Kenyan Companies Act, 2015 which disclose the state of affairs of KCB Group PLC (the “Group”) and its subsidiaries.
1. Change of nameOn 17 January 2016, Kenya Commercial Bank Limited, with the sanction of a special resolution of the Company and with the approval of the Registrar of Companies, changed its name to KCB Group Limited. Subsequently, in compliance with the Kenyan Companies Act, 2015, KCB Group Limited changed its name to KCB Group PLC on 23 August 2016.
2. Principal activitiesThe company is licensed as a non-operating holding company under the Banking Act (Cap 488).
The principal activities of its main subsidiaries is provision of corporate, investment and retail banking services.
3. Transfer of assets and liabilities from KCB Group PLC On 1 January 2016, KCB Group PLC transferred its banking business and the related assets and liabilities to its wholly owned subsidiary, KCB Bank Kenya Limited, by operation of Section 9(3) of the Banking Act, in line with the approval of the shareholders of the company during the annual General Meeting held on 15 May 2015. The assets and liabilities were transferred to KCB Kenya Limited at their carrying amounts, without any fair value uplift, in exchange for equivalent share capital in the subsidiary. The agreement to transfer assets was signed by both companies and approved by the Central Bank of Kenya to take effect from 1 January 2016.
4. Results The The results of the Group and the Company are set out on pages 74 to 75 and 77 to 78 respectively.
5. DividendAn interim dividend of KShs 3,066 million was approved and paid during the year (2016 – Nil). The Directors recommend a final dividend of Kshs. 6,132 million, this together with the interim dividend this brings total dividend to Kshs.. 9,198 million. (2016: Kshs. 9,198 million) which represents KShs 3 per share in respect of the year ended 31 December 2017 (2016 – Kshs. 3 per share).
6. DirectorsThe Directors who served during the year and up to the date of this report are set out on page 63.
All the Directors are non-executive other than the Chief Executive Officer and the Chief Financial Officer.
7. Business overviewThe Group Consolidation includes the results of the entities owned by ‘KCB Group PLC’. The entities operate in Kenya, Tanzania, South Sudan, Rwanda, Uganda and Burundi mainly in the Banking Business. The profit before tax remained flat at Kshs. 29 billion mainly affected by the diminishing interest income on loans and the additional impairment on loans and advances.
The year 2018 will see other additional changes in the Banking sector as the implementation of IFRS 9 comes into effect. The implementation is expected to increase provisions across the banking industry; however the bank will be cushioned by the excess regulatory provisions that it currently holds.
Total Operating expenses were up 6% from Kshs. 33.1 billion to Kshs. 35 billion mainly attributable to expenses to support business growth. Customer deposits were up 11% from Kshs. 448 billion to Kshs. 500 billion attributable to customer number growth and improved customer confidence with the KCB brand.
Loans and advances improved by 10% from Kshs. 425 billion to Kshs. 386 billion .The improved liquidity is due to the increase in deposits and customer credit appetite attributed to this phenomenal growth.The Group will continue to innovate products to satisfy its customers ever changing needs. Going forward the focus is to improve the non-funded income ratio through alternative channels and technology.
The Group’s activities exposes it to a variety of financial risks, including credit risk, liquidity risk, market risks and operational risks. The Group’s overall risk management program focuses on the unpredictability of financial markets and seeks to minimize potential adverse effects on the Group’s financial performance. The Board of Directors has overall responsibility for the establishment and oversight of the Group’s risk management framework. The Board of Directors of the Group has established various committees including Credit, Audit, Risk, Human Resources, Procurement and Information Technology committees, which are tasked with developing and continuous monitoring of the Group risk management policies in their specified areas. The detailed description and analysis of the key risks is set out on note 4 of the financial statements. Information about the employees of the Group and Company is included in Note 15 of the Financial Statements. Information about social and community issues is included on page 48 to 53 of the Integrated Report.
8. Relevant audit informationThe Directors in office at the date of this report confirm that:
i. There is no relevant audit information of which the Group’s auditor is unaware; and
ii. Each director has taken all the steps that they ought to have taken as a director so as to be aware of any relevant audit information and to establish that the Group’s auditor is aware of that information.
9. AuditorsThe auditors of the Company, KPMG Kenya, have indicated their willingness to continue in office in accordance with Section 721 of the Kenyan Companies Act, 2015.
10. Approval of financial statementsThe financial statements were approved and authorised for issue by the Board of Directors on 7 March 2018.
By order of the Board
Mr. Joseph KaniaGROUP COMPANY SECRETARY
Date: 7 March 2018
65
STATEMENT OF DIRECTORS’ RESPONSIBILITIESFOR THE YEAR ENDED 31 DECEMBER 2017
The Directors are responsible for the preparation and presentation of the consolidated and separate financial statements of KCB Group PLC set out on pages 74 to 141 which comprise the consolidated and company statements of financial position at 31 December 2017, consolidated and company statements of profit or loss and consolidated and company statements of other comprehensive income, statements of changes in equity and statements of cash flows for the year then ended, and notes to the financial statements including a summary of significant accounting policies and other explanatory information.
The Directors’ responsibilities include: determining that the basis of accounting described in note 2 is an acceptable basis for preparing and presenting the financial statements in the circumstances, preparation and presentation of financial statements in accordance with International Financial Reporting Standards and in the manner required by the Kenyan Companies Act, 2015 and for such internal control as the Directors determine is necessary to enable the preparation of financial statements that are free from material misstatements, whether due to fraud or error.
Under the Kenyan Companies Act, 2015 the Directors are required to prepare financial statements for each financial year which give a true and fair view of the financial position of the Group and of the company as at the end of the financial year and of the profit or loss of the Group and of the company for that year. It also requires the Directors to ensure the company and its subsidiaries keep proper accounting records which disclose with reasonable accuracy the financial position of the Group and the company.
The Directors accept responsibility for the annual consolidated and separate financial statements, which have been prepared using appropriate accounting policies supported by reasonable and prudent judgments and estimates, in conformity with International Financial Reporting Standards and in the manner required by the Kenyan Companies Act, 2015. The Directors are of the opinion that the financial statements give a true and fair view of the state of the financial position of the Group and the Company and of its profit or loss.
The Directors further accept responsibility for the maintenance of accounting records which may be relied upon in the preparation of financial statements, as well as adequate systems of internal financial control.
The Directors have made an assessment of the Group and the Company’s ability to continue as a going concern and have no reason to believe the Group and the Company will not be a going concern for at least the next twelve months from the date of this statement.
Approval of the financial statementsThe financial statements, as indicated above, were approved and authorised for issue by the Board of Directors on 7 March 2018.
______________________________ _____________________________Ng’eny Biwott Joshua N. OigaraChairman Chief Executive Officer and Managing Director
_____________________________ _____________________________Georgina M Malombe Joseph KaniaDirector Secretary
Date: 7 March 2018
KCB INTEGRATED REPORT AND FINANCIAL STATEMENTS | 2017
66
REPORT OF THE INDEPENDENT AUDITOR TO THE MEMBERS OF KCB GROUP PLC
Report on the audit of the financial statements
OpinionWe have audited the consolidated and separate financial statements of KCB Group PLC (The Group and Company) set out on pages 74 to 141 which comprise the Consolidated and Company statements of financial position as at 31 December 2017, the Consolidated and Company statements of profit or loss, Consolidated and Company statements of other comprehensive income, Consolidated and Company statements of changes in equity and Consolidated and Company statements of cash flows for the year then ended, and notes to the financial statements, including a summary of significant accounting policies and other explanatory information.
In our opinion, the accompanying consolidated and separate financial statements give a true and fair view of the Consolidated and separate financial position of KCB Group PLC as at 31 December 2017, and the Consolidated and separate financial performance and cash flows for the year then ended in accordance with International Financial Reporting Standards and in the manner required by the Kenyan Companies Act, 2015.
Basis for opinionWe conducted our audit in accordance with International Standards on Auditing (ISAs). Our responsibilities under those standards are further described in the ‘Auditors Responsibilities for the Audit of the Financial Statements’ section of our report. We are independent of the Group and Company in accordance with the International Ethics Standards Board for Accountants’ Code of Ethics for Professional Accountants (IESBA Code) together with the ethical requirements that are relevant to our audit of the financial statements in Kenya, and we have fulfilled our other ethical responsibilities in accordance with the IESBA Code. We believe that the audit evidence we have obtained is sufficient and appropriate to provide a basis for our opinion.
Key audit mattersKey audit matters are those matters that, in our professional judgment, were of most significance in our audit of the consolidated financial statements of the current period. These matters were addressed in the context of our audit of the consolidated financial statements as a whole, and in forming our opinion thereon, and we do not provide a separate opinion on these matters.
Impairment of loans and advances to customers
See accounting policy note 3 (f) (iii) - Significant accounting policies and disclosure note 27 – Loans and advances to customers (Net).
The Key audit matter How the matter was addressed in our audit
Impairment of loans and advances to customers is a key audit matter due to the significance of the balances, and complexity and subjectivity over estimating timing and amount of impairment. The risk is that the amount of impairment may be misstated.
Our audit procedures in this area included, among others:
• Assessing the trends in the local credit environment, considering their likely impact on the Group’s exposures and using this information to focus our testing on the key risk areas;
The estimation of the impairment loss allowance on an individual basis requires management to make judgements to determine whether there is objective evidence of impairment and to make assumptions about the financial condition of borrowers and expected future cash flows.
The collective impairment loss allowance relates to losses incurred but not yet identified (IBNR loss allowance) on other loans. The audit matters include controls over the models used, accuracy of input and appropriateness of model overlays. The model overlays are required to address certain known data and system issues and to reflect economic conditions at the year end.
a. Assessing and testing the design and operating effectiveness of the controls over the Group’s loans impairment process;
b. Testing a sample of model overlays, including evaluating the rationale for adjustments, the source of data used, key assumptions and sensitivity of the overlays to these assumptions. We compared the assumptions used to selected externally available industry, financial and economic data.
c. Re-performing certain credit procedures as follows:• For individually significant non-performing loans, performing a credit
assessment to determine whether the grading was appropriate and assess the reasonableness of the amount and timing of estimated recoverable cash flows, including realisable value of collateral. Where available, we compared the assumptions and estimates made by management to the externally available;
• Performing a credit assessment of the performing loans to determine whether their grading was appropriate and testing the accuracy of key inputs into the models, assessing the appropriateness of the impairment calculation methodology and re-performing certain calculations.
• Assessing whether disclosures in the financial statements appropriately reflect the Group’s exposure to credit risk.
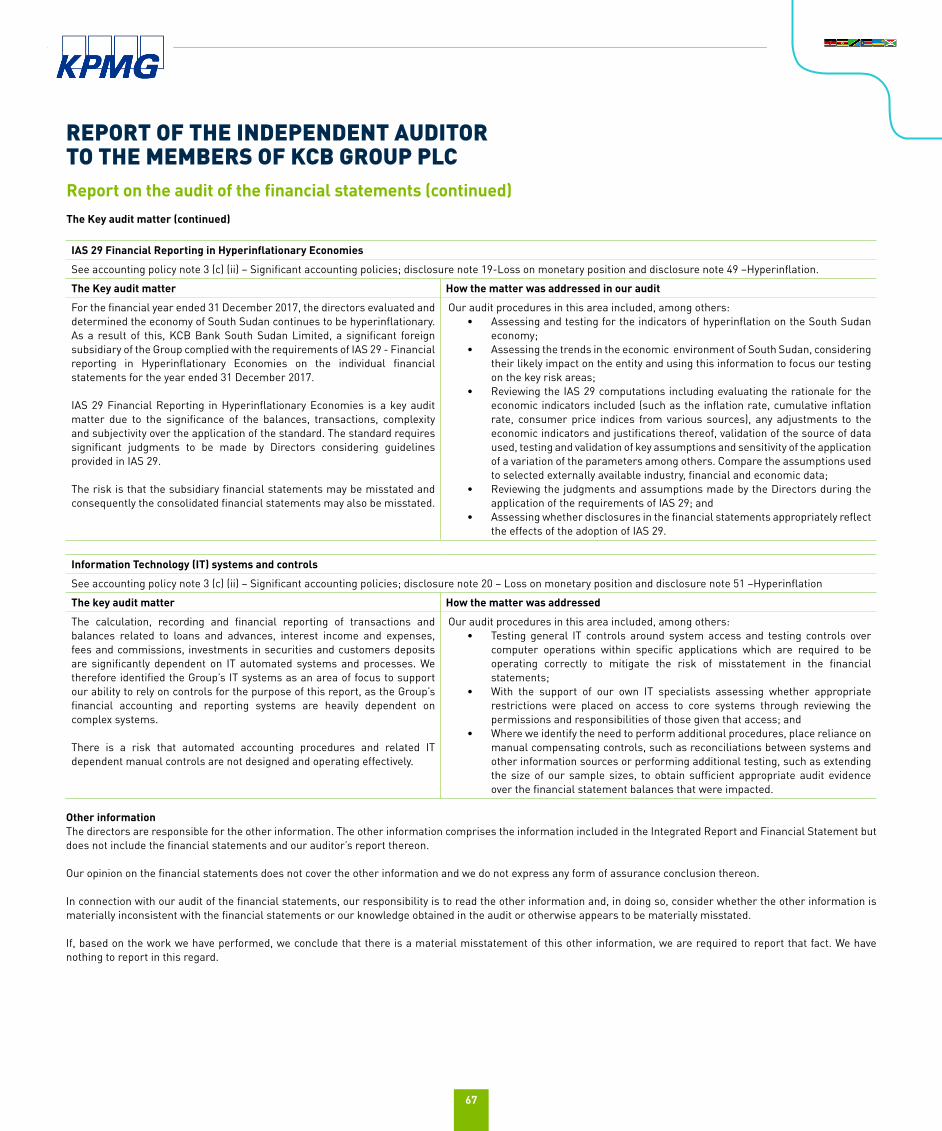
67
IAS 29 Financial Reporting in Hyperinflationary Economies
See accounting policy note 3 (c) (ii) – Significant accounting policies; disclosure note 19-Loss on monetary position and disclosure note 49 –Hyperinflation.
The Key audit matter How the matter was addressed in our audit
For the financial year ended 31 December 2017, the directors evaluated and determined the economy of South Sudan continues to be hyperinflationary. As a result of this, KCB Bank South Sudan Limited, a significant foreign subsidiary of the Group complied with the requirements of IAS 29 - Financial reporting in Hyperinflationary Economies on the individual financial statements for the year ended 31 December 2017.
IAS 29 Financial Reporting in Hyperinflationary Economies is a key audit matter due to the significance of the balances, transactions, complexity and subjectivity over the application of the standard. The standard requires significant judgments to be made by Directors considering guidelines provided in IAS 29.
The risk is that the subsidiary financial statements may be misstated and consequently the consolidated financial statements may also be misstated.
Our audit procedures in this area included, among others:• Assessing and testing for the indicators of hyperinflation on the South Sudan
economy;• Assessing the trends in the economic environment of South Sudan, considering
their likely impact on the entity and using this information to focus our testing on the key risk areas;
• Reviewing the IAS 29 computations including evaluating the rationale for the economic indicators included (such as the inflation rate, cumulative inflation rate, consumer price indices from various sources), any adjustments to the economic indicators and justifications thereof, validation of the source of data used, testing and validation of key assumptions and sensitivity of the application of a variation of the parameters among others. Compare the assumptions used to selected externally available industry, financial and economic data;
• Reviewing the judgments and assumptions made by the Directors during the application of the requirements of IAS 29; and
• Assessing whether disclosures in the financial statements appropriately reflect the effects of the adoption of IAS 29.
Information Technology (IT) systems and controls
See accounting policy note 3 (c) (ii) – Significant accounting policies; disclosure note 20 – Loss on monetary position and disclosure note 51 –Hyperinflation
The key audit matter How the matter was addressed
The calculation, recording and financial reporting of transactions and balances related to loans and advances, interest income and expenses, fees and commissions, investments in securities and customers deposits are significantly dependent on IT automated systems and processes. We therefore identified the Group’s IT systems as an area of focus to support our ability to rely on controls for the purpose of this report, as the Group’s financial accounting and reporting systems are heavily dependent on complex systems.
There is a risk that automated accounting procedures and related IT dependent manual controls are not designed and operating effectively.
Our audit procedures in this area included, among others:• Testing general IT controls around system access and testing controls over
computer operations within specific applications which are required to be operating correctly to mitigate the risk of misstatement in the financial statements;
• With the support of our own IT specialists assessing whether appropriate restrictions were placed on access to core systems through reviewing the permissions and responsibilities of those given that access; and
• Where we identify the need to perform additional procedures, place reliance on manual compensating controls, such as reconciliations between systems and other information sources or performing additional testing, such as extending the size of our sample sizes, to obtain sufficient appropriate audit evidence over the financial statement balances that were impacted.
Other information The directors are responsible for the other information. The other information comprises the information included in the Integrated Report and Financial Statement but does not include the financial statements and our auditor’s report thereon.
Our opinion on the financial statements does not cover the other information and we do not express any form of assurance conclusion thereon.
In connection with our audit of the financial statements, our responsibility is to read the other information and, in doing so, consider whether the other information is materially inconsistent with the financial statements or our knowledge obtained in the audit or otherwise appears to be materially misstated.
If, based on the work we have performed, we conclude that there is a material misstatement of this other information, we are required to report that fact. We have nothing to report in this regard.
Report on the audit of the financial statements (continued)The Key audit matter (continued)
REPORT OF THE INDEPENDENT AUDITORTO THE MEMBERS OF KCB GROUP PLC
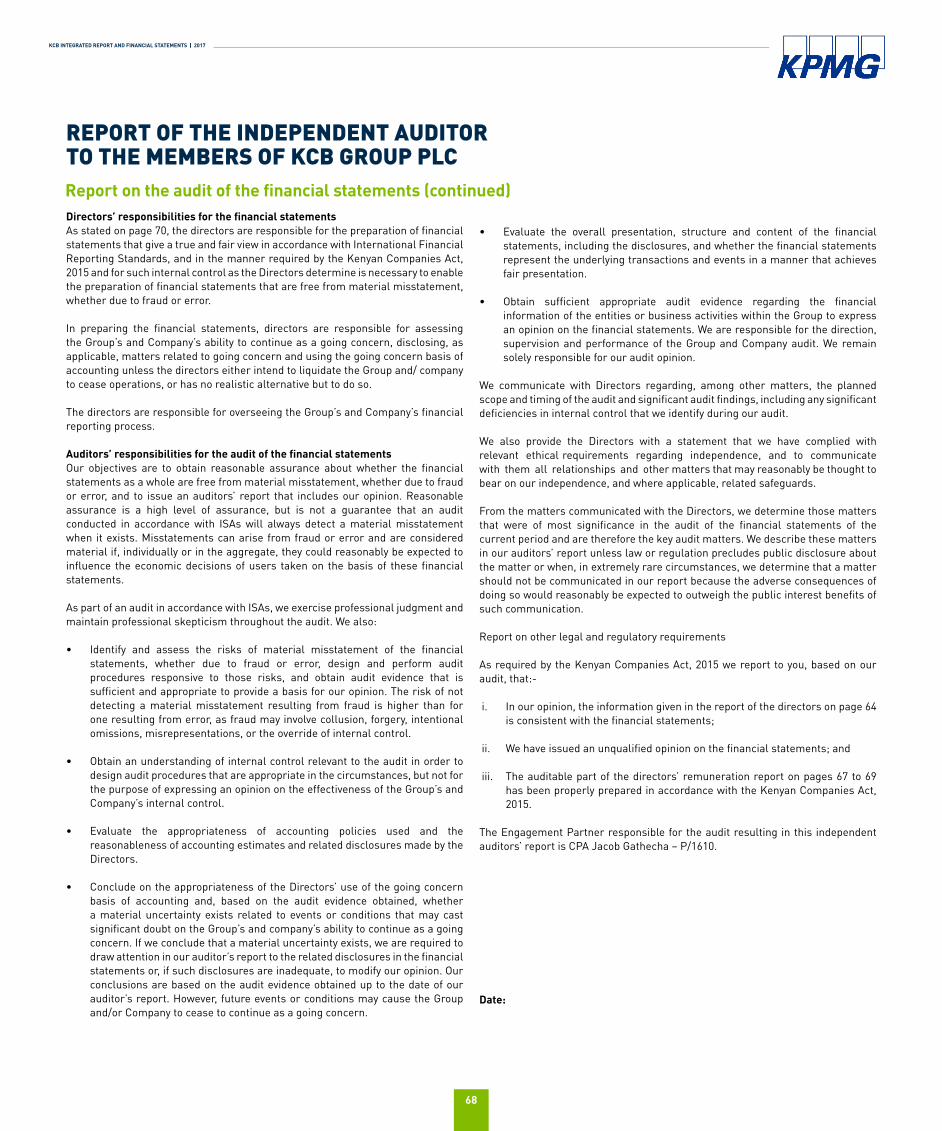
KCB INTEGRATED REPORT AND FINANCIAL STATEMENTS | 2017
68
REPORT OF THE INDEPENDENT AUDITORTO THE MEMBERS OF KCB GROUP PLC
Directors’ responsibilities for the financial statements As stated on page 70, the directors are responsible for the preparation of financial statements that give a true and fair view in accordance with International Financial Reporting Standards, and in the manner required by the Kenyan Companies Act, 2015 and for such internal control as the Directors determine is necessary to enable the preparation of financial statements that are free from material misstatement, whether due to fraud or error.
In preparing the financial statements, directors are responsible for assessing the Group’s and Company’s ability to continue as a going concern, disclosing, as applicable, matters related to going concern and using the going concern basis of accounting unless the directors either intend to liquidate the Group and/ company to cease operations, or has no realistic alternative but to do so.
The directors are responsible for overseeing the Group’s and Company’s financial reporting process.
Auditors’ responsibilities for the audit of the financial statements Our objectives are to obtain reasonable assurance about whether the financial statements as a whole are free from material misstatement, whether due to fraud or error, and to issue an auditors’ report that includes our opinion. Reasonable assurance is a high level of assurance, but is not a guarantee that an audit conducted in accordance with ISAs will always detect a material misstatement when it exists. Misstatements can arise from fraud or error and are considered material if, individually or in the aggregate, they could reasonably be expected to influence the economic decisions of users taken on the basis of these financial statements.
As part of an audit in accordance with ISAs, we exercise professional judgment and maintain professional skepticism throughout the audit. We also:
• Identify and assess the risks of material misstatement of the financial statements, whether due to fraud or error, design and perform audit procedures responsive to those risks, and obtain audit evidence that is sufficient and appropriate to provide a basis for our opinion. The risk of not detecting a material misstatement resulting from fraud is higher than for one resulting from error, as fraud may involve collusion, forgery, intentional omissions, misrepresentations, or the override of internal control.
• Obtain an understanding of internal control relevant to the audit in order to design audit procedures that are appropriate in the circumstances, but not for the purpose of expressing an opinion on the effectiveness of the Group’s and Company’s internal control.
• Evaluate the appropriateness of accounting policies used and the reasonableness of accounting estimates and related disclosures made by the Directors.
• Conclude on the appropriateness of the Directors’ use of the going concern basis of accounting and, based on the audit evidence obtained, whether a material uncertainty exists related to events or conditions that may cast significant doubt on the Group’s and company’s ability to continue as a going concern. If we conclude that a material uncertainty exists, we are required to draw attention in our auditor’s report to the related disclosures in the financial statements or, if such disclosures are inadequate, to modify our opinion. Our conclusions are based on the audit evidence obtained up to the date of our auditor’s report. However, future events or conditions may cause the Group and/or Company to cease to continue as a going concern.
• Evaluate the overall presentation, structure and content of the financial statements, including the disclosures, and whether the financial statements represent the underlying transactions and events in a manner that achieves fair presentation.
• Obtain sufficient appropriate audit evidence regarding the financial information of the entities or business activities within the Group to express an opinion on the financial statements. We are responsible for the direction, supervision and performance of the Group and Company audit. We remain solely responsible for our audit opinion.
We communicate with Directors regarding, among other matters, the planned scope and timing of the audit and significant audit findings, including any significant deficiencies in internal control that we identify during our audit.
We also provide the Directors with a statement that we have complied with relevant ethical requirements regarding independence, and to communicate with them all relationships and other matters that may reasonably be thought to bear on our independence, and where applicable, related safeguards.
From the matters communicated with the Directors, we determine those matters that were of most significance in the audit of the financial statements of the current period and are therefore the key audit matters. We describe these matters in our auditors’ report unless law or regulation precludes public disclosure about the matter or when, in extremely rare circumstances, we determine that a matter should not be communicated in our report because the adverse consequences of doing so would reasonably be expected to outweigh the public interest benefits of such communication.
Report on other legal and regulatory requirements
As required by the Kenyan Companies Act, 2015 we report to you, based on our audit, that:-
i. In our opinion, the information given in the report of the directors on page 64 is consistent with the financial statements;
ii. We have issued an unqualified opinion on the financial statements; and
iii. The auditable part of the directors’ remuneration report on pages 67 to 69 has been properly prepared in accordance with the Kenyan Companies Act, 2015.
The Engagement Partner responsible for the audit resulting in this independent auditors’ report is CPA Jacob Gathecha – P/1610.
Date:
Report on the audit of the financial statements (continued)
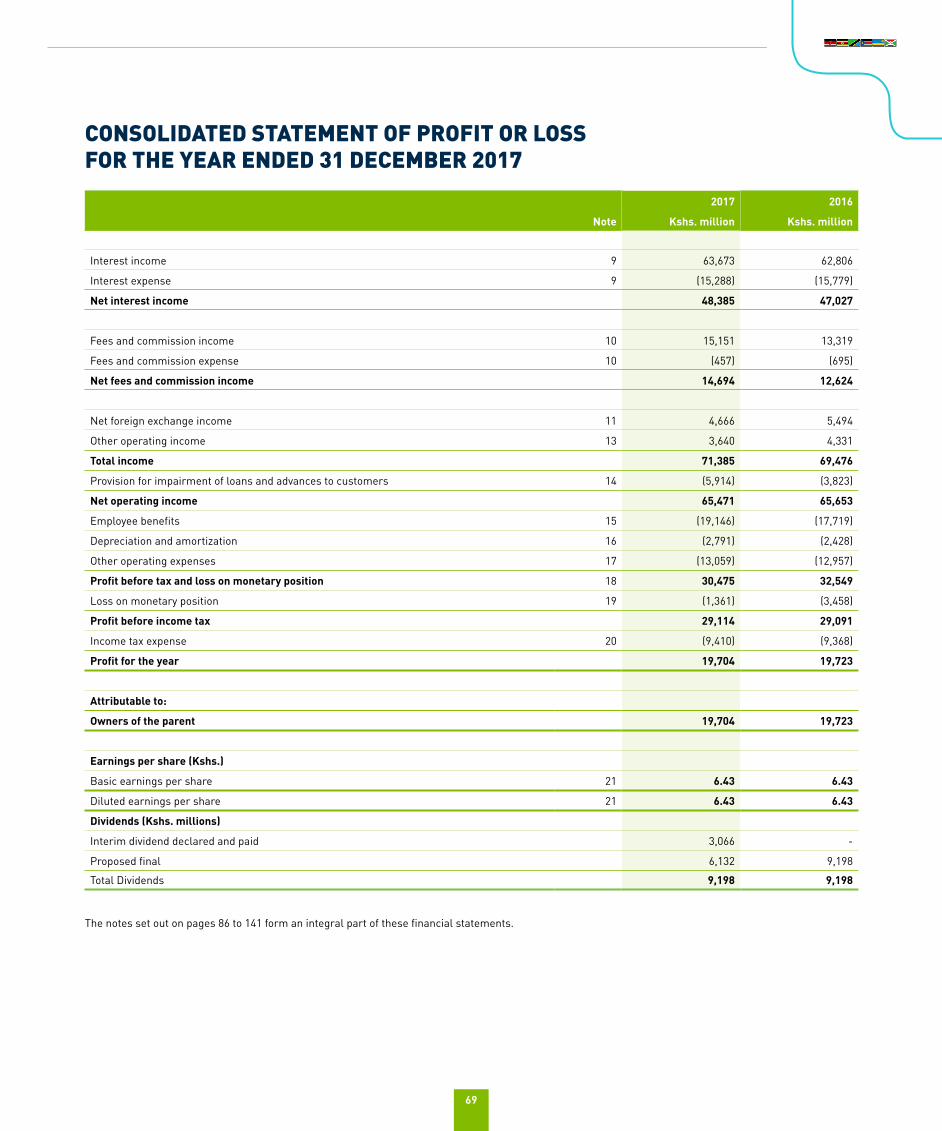
69
CONSOLIDATED STATEMENT OF PROFIT OR LOSSFOR THE YEAR ENDED 31 DECEMBER 2017
2017 2016
Note Kshs. million Kshs. million
Interest income 9 63,673 62,806
Interest expense 9 (15,288) (15,779)
Net interest income 48,385 47,027
Fees and commission income 10 15,151 13,319
Fees and commission expense 10 (457) (695)
Net fees and commission income 14,694 12,624
Net foreign exchange income 11 4,666 5,494
Other operating income 13 3,640 4,331
Total income 71,385 69,476
Provision for impairment of loans and advances to customers 14 (5,914) (3,823)
Net operating income 65,471 65,653
Employee benefits 15 (19,146) (17,719)
Depreciation and amortization 16 (2,791) (2,428)
Other operating expenses 17 (13,059) (12,957)
Profit before tax and loss on monetary position 18 30,475 32,549
Loss on monetary position 19 (1,361) (3,458)
Profit before income tax 29,114 29,091
Income tax expense 20 (9,410) (9,368)
Profit for the year 19,704 19,723
Attributable to:
Owners of the parent 19,704 19,723
Earnings per share (Kshs.)
Basic earnings per share 21 6.43 6.43
Diluted earnings per share 21 6.43 6.43
Dividends (Kshs. millions)
Interim dividend declared and paid 3,066 -
Proposed final 6,132 9,198
Total Dividends 9,198 9,198
The notes set out on pages 86 to 141 form an integral part of these financial statements.
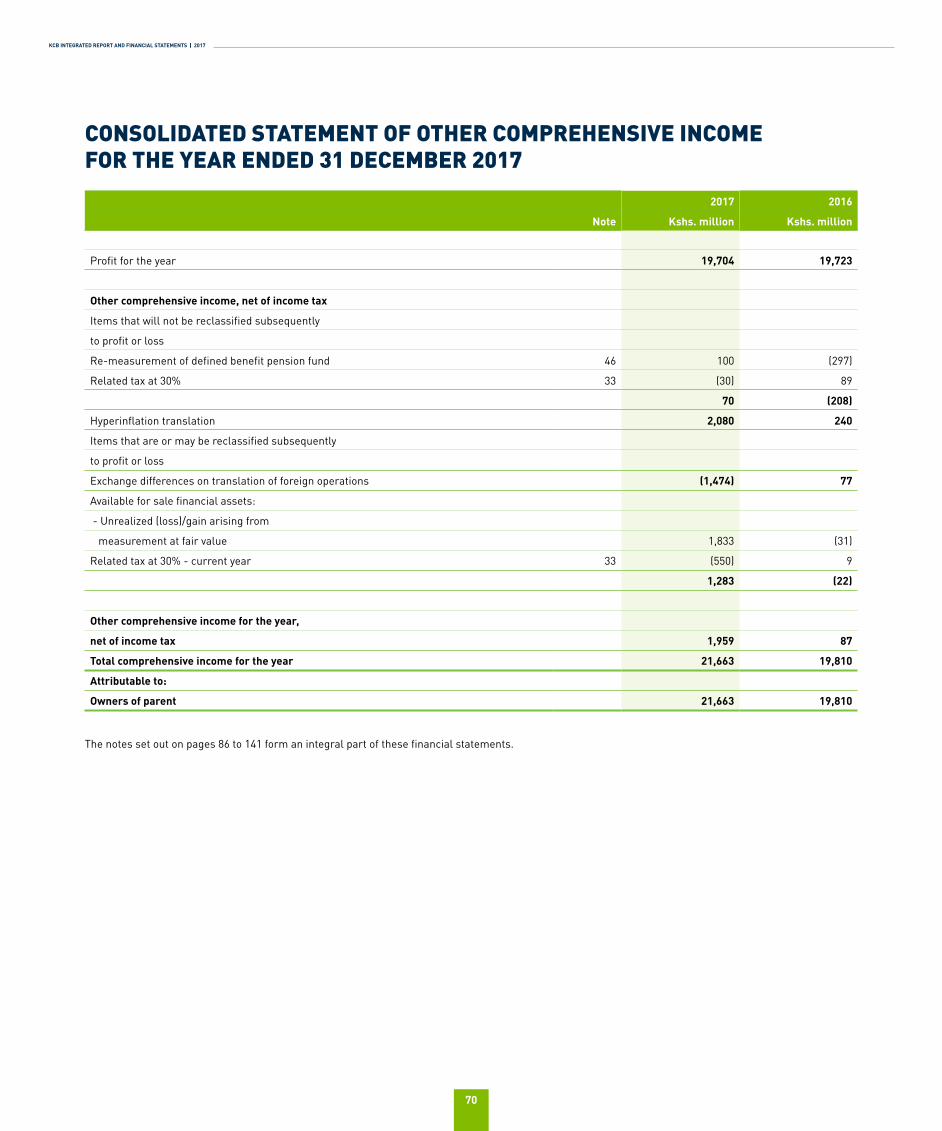
KCB INTEGRATED REPORT AND FINANCIAL STATEMENTS | 2017
70
CONSOLIDATED STATEMENT OF OTHER COMPREHENSIVE INCOMEFOR THE YEAR ENDED 31 DECEMBER 2017
2017 2016
Note Kshs. million Kshs. million
Profit for the year 19,704 19,723
Other comprehensive income, net of income tax
Items that will not be reclassified subsequently
to profit or loss
Re-measurement of defined benefit pension fund 46 100 (297)
Related tax at 30% 33 (30) 89
70 (208)
Hyperinflation translation 2,080 240
Items that are or may be reclassified subsequently
to profit or loss
Exchange differences on translation of foreign operations (1,474) 77
Available for sale financial assets:
- Unrealized (loss)/gain arising from
measurement at fair value 1,833 (31)
Related tax at 30% - current year 33 (550) 9
1,283 (22)
Other comprehensive income for the year,
net of income tax 1,959 87
Total comprehensive income for the year 21,663 19,810
Attributable to:
Owners of parent 21,663 19,810
The notes set out on pages 86 to 141 form an integral part of these financial statements.
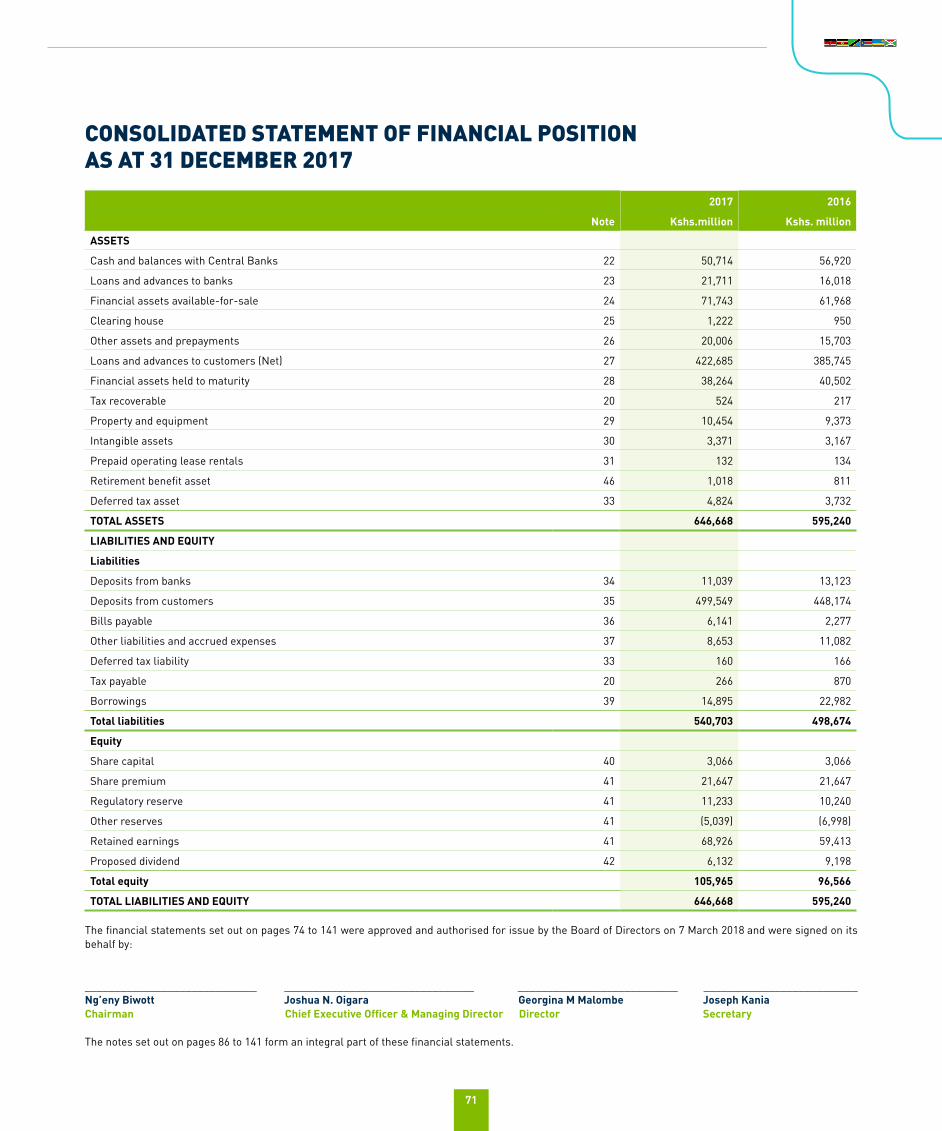
71
CONSOLIDATED STATEMENT OF FINANCIAL POSITIONAS AT 31 DECEMBER 2017
2017 2016
Note Kshs.million Kshs. million
ASSETS
Cash and balances with Central Banks 22 50,714 56,920
Loans and advances to banks 23 21,711 16,018
Financial assets available-for-sale 24 71,743 61,968
Clearing house 25 1,222 950
Other assets and prepayments 26 20,006 15,703
Loans and advances to customers (Net) 27 422,685 385,745
Financial assets held to maturity 28 38,264 40,502
Tax recoverable 20 524 217
Property and equipment 29 10,454 9,373
Intangible assets 30 3,371 3,167
Prepaid operating lease rentals 31 132 134
Retirement benefit asset 46 1,018 811
Deferred tax asset 33 4,824 3,732
TOTAL ASSETS 646,668 595,240
LIABILITIES AND EQUITY
Liabilities
Deposits from banks 34 11,039 13,123
Deposits from customers 35 499,549 448,174
Bills payable 36 6,141 2,277
Other liabilities and accrued expenses 37 8,653 11,082
Deferred tax liability 33 160 166
Tax payable 20 266 870
Borrowings 39 14,895 22,982
Total liabilities 540,703 498,674
Equity
Share capital 40 3,066 3,066
Share premium 41 21,647 21,647
Regulatory reserve 41 11,233 10,240
Other reserves 41 (5,039) (6,998)
Retained earnings 41 68,926 59,413
Proposed dividend 42 6,132 9,198
Total equity 105,965 96,566
TOTAL LIABILITIES AND EQUITY 646,668 595,240
The financial statements set out on pages 74 to 141 were approved and authorised for issue by the Board of Directors on 7 March 2018 and were signed on its behalf by:
_____________________________ ________________________________ ___________________________ __________________________Ng’eny Biwott Joshua N. Oigara Georgina M Malombe Joseph KaniaChairman Chief Executive Officer & Managing Director Director Secretary
The notes set out on pages 86 to 141 form an integral part of these financial statements.
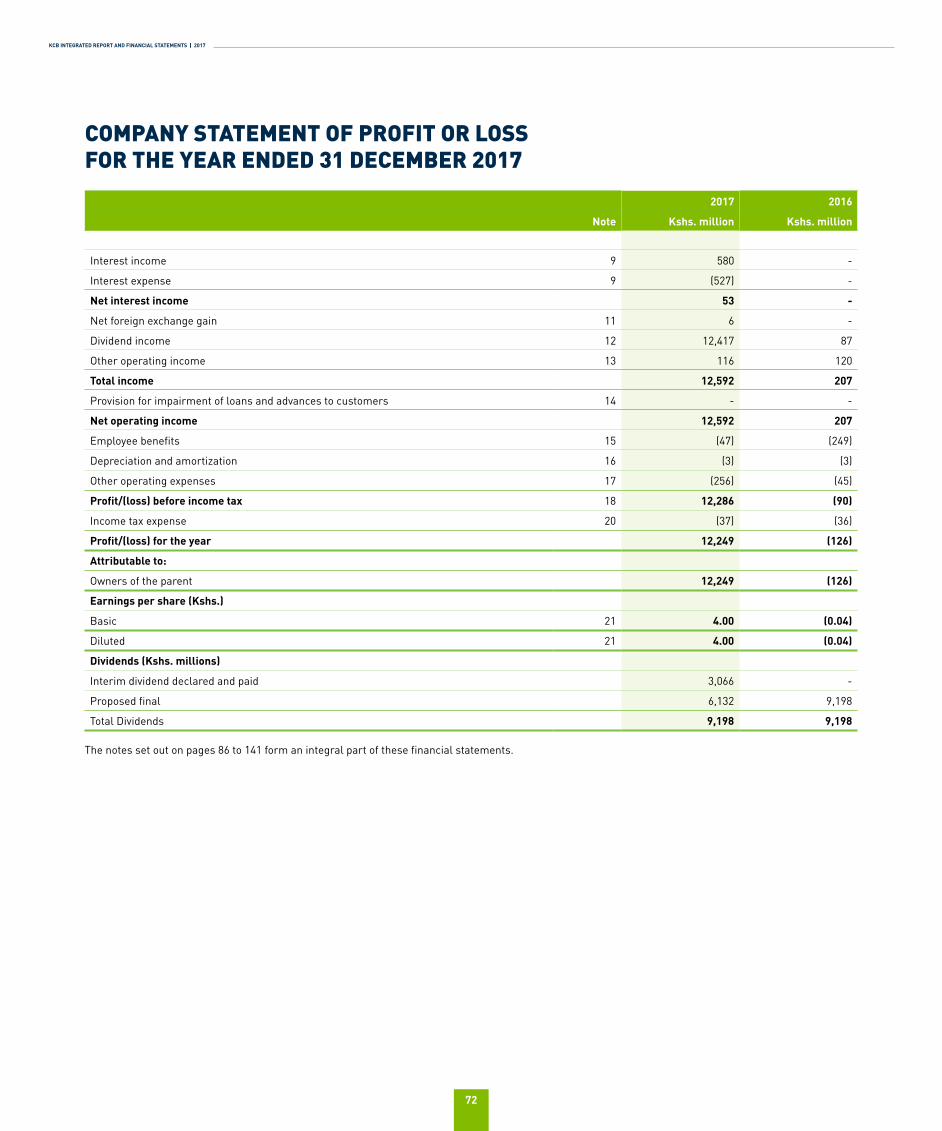
KCB INTEGRATED REPORT AND FINANCIAL STATEMENTS | 2017
72
COMPANY STATEMENT OF PROFIT OR LOSSFOR THE YEAR ENDED 31 DECEMBER 2017
2017 2016
Note Kshs. million Kshs. million
Interest income 9 580 -
Interest expense 9 (527) -
Net interest income 53 -
Net foreign exchange gain 11 6 -
Dividend income 12 12,417 87
Other operating income 13 116 120
Total income 12,592 207
Provision for impairment of loans and advances to customers 14 - -
Net operating income 12,592 207
Employee benefits 15 (47) (249)
Depreciation and amortization 16 (3) (3)
Other operating expenses 17 (256) (45)
Profit/(loss) before income tax 18 12,286 (90)
Income tax expense 20 (37) (36)
Profit/(loss) for the year 12,249 (126)
Attributable to:
Owners of the parent 12,249 (126)
Earnings per share (Kshs.)
Basic 21 4.00 (0.04)
Diluted 21 4.00 (0.04)
Dividends (Kshs. millions)
Interim dividend declared and paid 3,066 -
Proposed final 6,132 9,198
Total Dividends 9,198 9,198
The notes set out on pages 86 to 141 form an integral part of these financial statements.
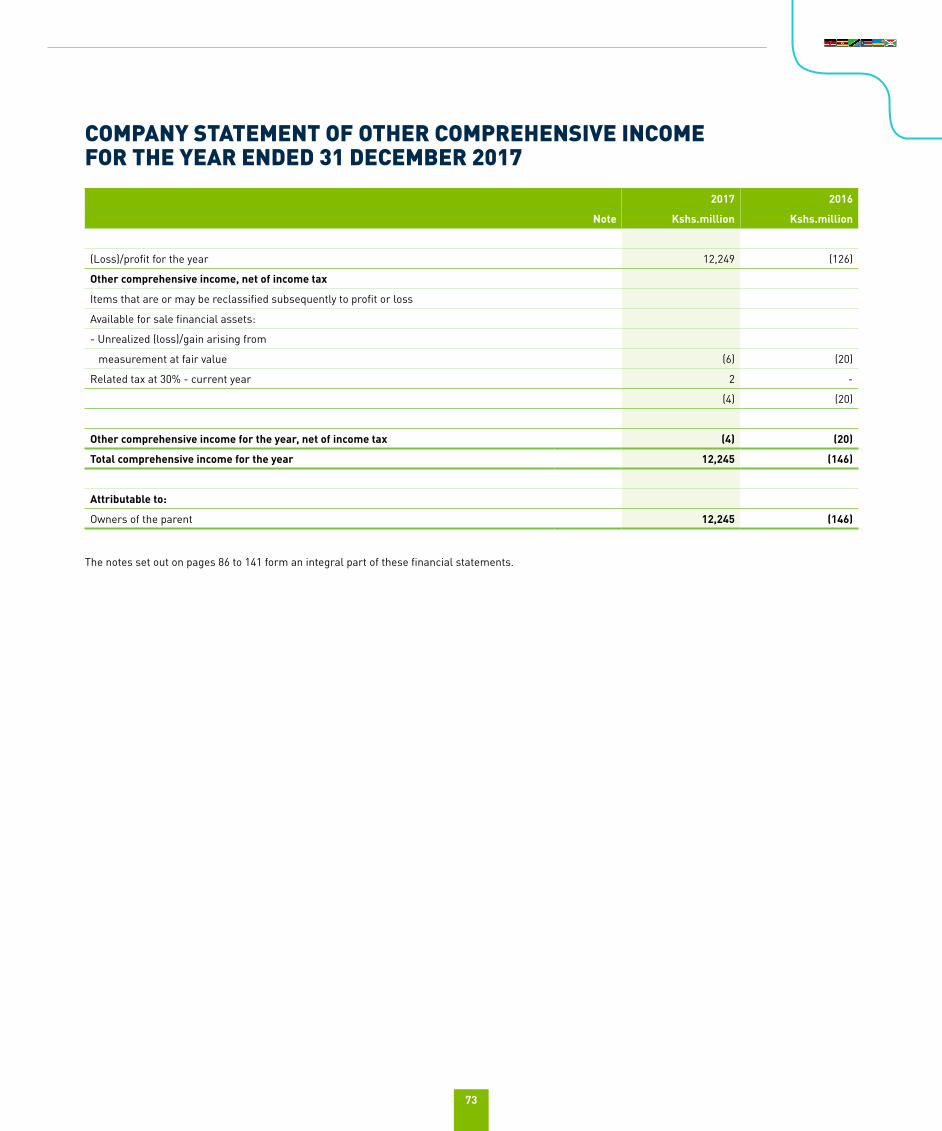
73
COMPANY STATEMENT OF OTHER COMPREHENSIVE INCOMEFOR THE YEAR ENDED 31 DECEMBER 2017
2017 2016
Note Kshs.million Kshs.million
(Loss)/profit for the year 12,249 (126)
Other comprehensive income, net of income tax
Items that are or may be reclassified subsequently to profit or loss
Available for sale financial assets:
- Unrealized (loss)/gain arising from
measurement at fair value (6) (20)
Related tax at 30% - current year 2 -
(4) (20)
Other comprehensive income for the year, net of income tax (4) (20)
Total comprehensive income for the year 12,245 (146)
Attributable to:
Owners of the parent 12,245 (146)
The notes set out on pages 86 to 141 form an integral part of these financial statements.
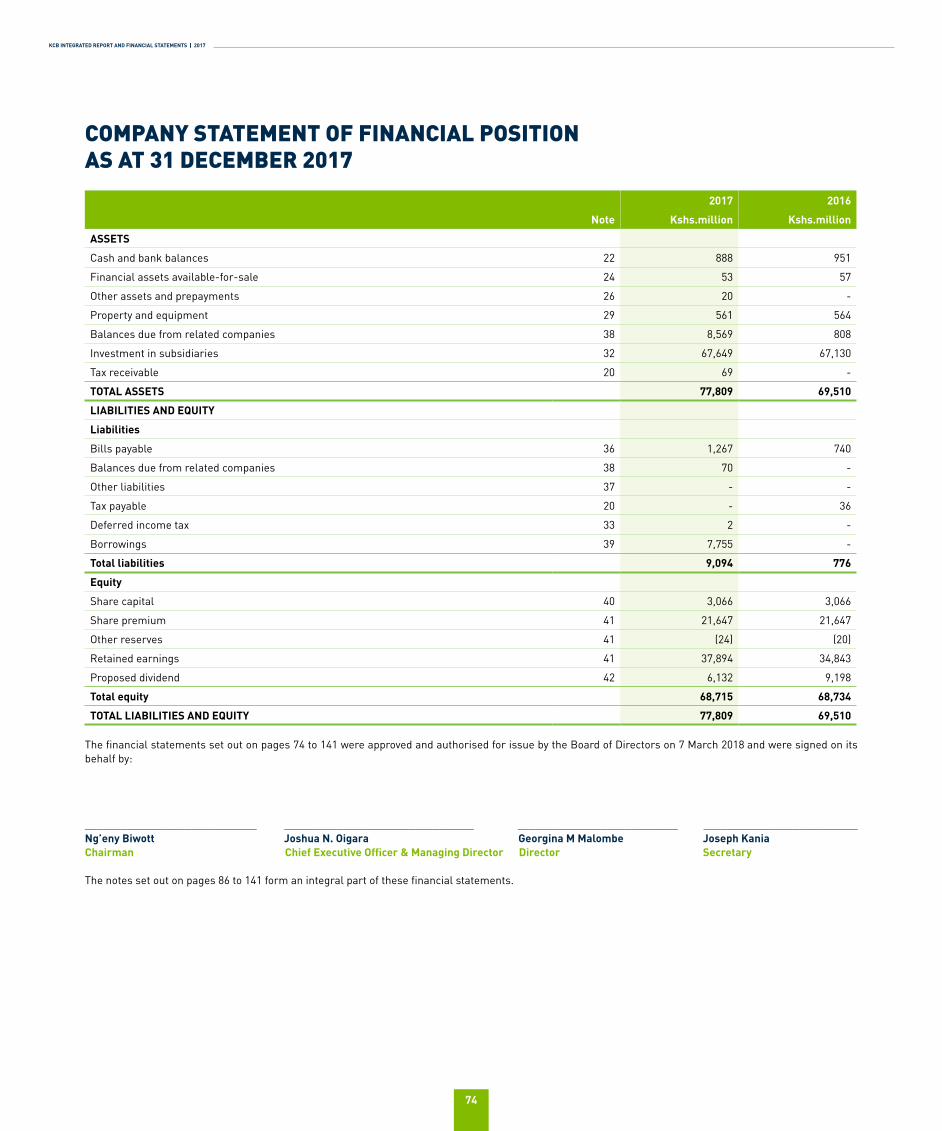
KCB INTEGRATED REPORT AND FINANCIAL STATEMENTS | 2017
74
COMPANY STATEMENT OF FINANCIAL POSITIONAS AT 31 DECEMBER 2017
2017 2016
Note Kshs.million Kshs.million
ASSETS
Cash and bank balances 22 888 951
Financial assets available-for-sale 24 53 57
Other assets and prepayments 26 20 -
Property and equipment 29 561 564
Balances due from related companies 38 8,569 808
Investment in subsidiaries 32 67,649 67,130
Tax receivable 20 69 -
TOTAL ASSETS 77,809 69,510
LIABILITIES AND EQUITY
Liabilities
Bills payable 36 1,267 740
Balances due from related companies 38 70 -
Other liabilities 37 - -
Tax payable 20 - 36
Deferred income tax 33 2 -
Borrowings 39 7,755 -
Total liabilities 9,094 776
Equity
Share capital 40 3,066 3,066
Share premium 41 21,647 21,647
Other reserves 41 (24) (20)
Retained earnings 41 37,894 34,843
Proposed dividend 42 6,132 9,198
Total equity 68,715 68,734
TOTAL LIABILITIES AND EQUITY 77,809 69,510
The financial statements set out on pages 74 to 141 were approved and authorised for issue by the Board of Directors on 7 March 2018 and were signed on its behalf by:
_____________________________ ________________________________ ___________________________ __________________________Ng’eny Biwott Joshua N. Oigara Georgina M Malombe Joseph KaniaChairman Chief Executive Officer & Managing Director Director Secretary
The notes set out on pages 86 to 141 form an integral part of these financial statements.
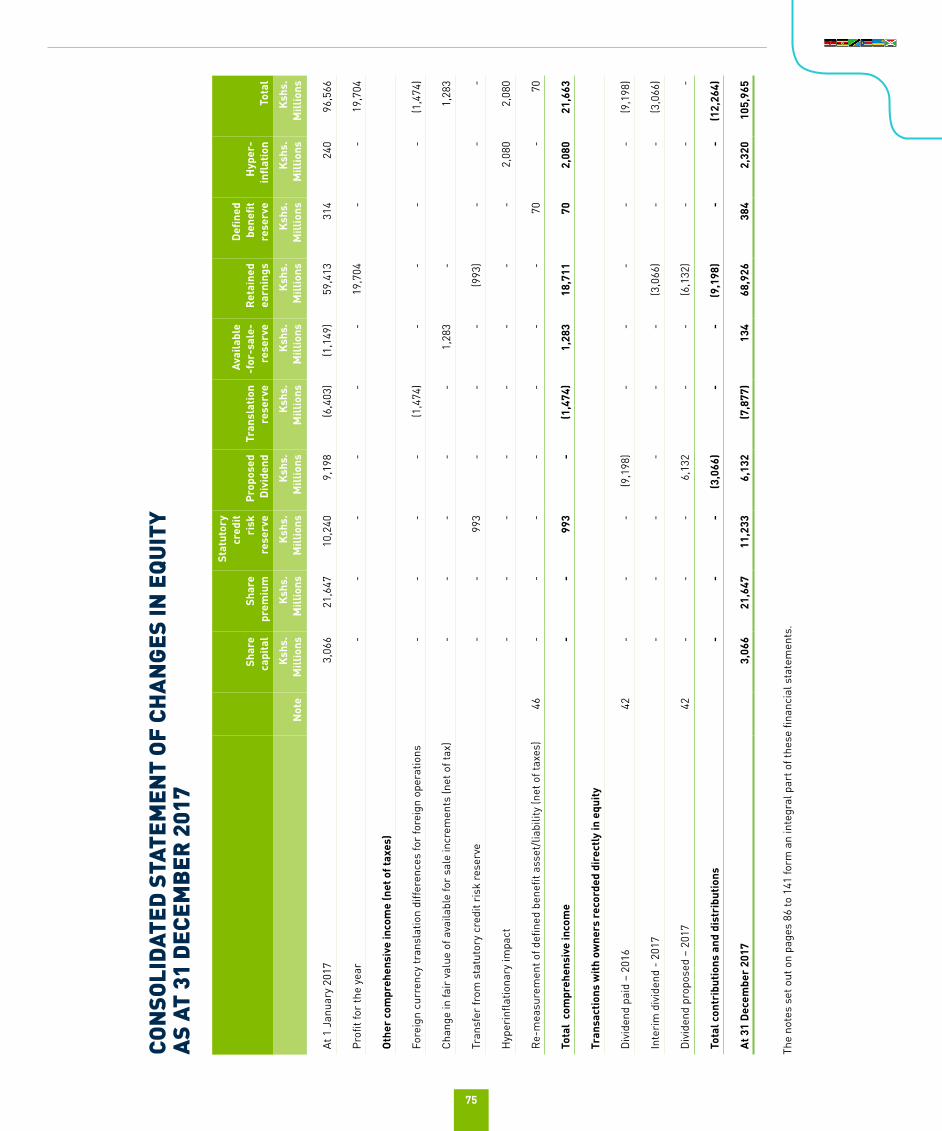
75
CON
SOLI
DAT
ED S
TATE
MEN
T O
F CH
AN
GES
IN E
QU
ITY
AS
AT 3
1 D
ECEM
BER
201
7
Sha
re
capi
tal
Sha
re
prem
ium
Sta
tuto
ry
cred
it ri
sk
rese
rve
Pro
pose
d D
ivid
end
Tr
ansl
atio
n re
serv
e
Ava
ilabl
e -f
or-s
ale-
re
serv
e R
etai
ned
earn
ings
Defi
ned
bene
fit
rese
rve
Hyp
er-
infl
atio
n T
otal
N
ote
Ksh
s.
Mill
ions
K
shs.
M
illio
ns
Ksh
s.
Mill
ions
K
shs.
M
illio
ns
Ksh
s.
Mill
ions
K
shs.
M
illio
ns
Ksh
s.
Mill
ions
K
shs.
M
illio
ns
Ksh
s.
Mill
ions
K
shs.
M
illio
ns
At 1
Jan
uary
201
73,
066
21,6
4710
,240
9,19
8(6
,403
)(1
,149
)59
,413
314
240
96,5
66
Profi
t for
the
year
--
--
--
19,7
04-
-19
,704
Oth
er c
ompr
ehen
sive
inco
me
(net
of t
axes
)
Fore
ign
curr
ency
tran
slat
ion
diffe
renc
es fo
r fo
reig
n op
erat
ions
--
--
(1,4
74)
--
--
(1,4
74)
Chan
ge in
fair
val
ue o
f ava
ilabl
e fo
r sa
le in
crem
ents
(net
of t
ax)
--
--
-1,
283
-1,
283
Tran
sfer
from
sta
tuto
ry c
redi
t ris
k re
serv
e-
-99
3-
--
(993
)-
--
Hyp
erin
flatio
nary
impa
ct-
--
--
--
-2,
080
2,08
0
Re-
mea
sure
men
t of d
efine
d be
nefit
ass
et/l
iabi
lity
(net
of t
axes
)46
--
--
--
-70
-70
Tota
l co
mpr
ehen
sive
inco
me
--
993
-(1
,474
)1,
283
18,7
1170
2,08
021
,663
Tran
sact
ions
with
ow
ners
rec
orde
d di
rect
ly in
equ
ity
Div
iden
d pa
id –
201
642
--
-(9
,198
)-
--
--
(9,1
98)
Inte
rim
div
iden
d -
2017
--
--
--
(3,0
66)
--
(3,0
66)
Div
iden
d pr
opos
ed –
201
742
--
-6,
132
--
(6,1
32)
--
-
Tota
l con
trib
utio
ns a
nd d
istr
ibut
ions
--
-(3
,066
)-
-(9
,198
)-
-(1
2,26
4)
At 3
1 D
ecem
ber
2017
3,06
621
,647
11,2
336,
132
(7,8
77)
134
68,9
2638
42,
320
105,
965
The
note
s se
t out
on
page
s 86
to 1
41 fo
rm a
n in
tegr
al p
art o
f the
se fi
nanc
ial s
tate
men
ts.
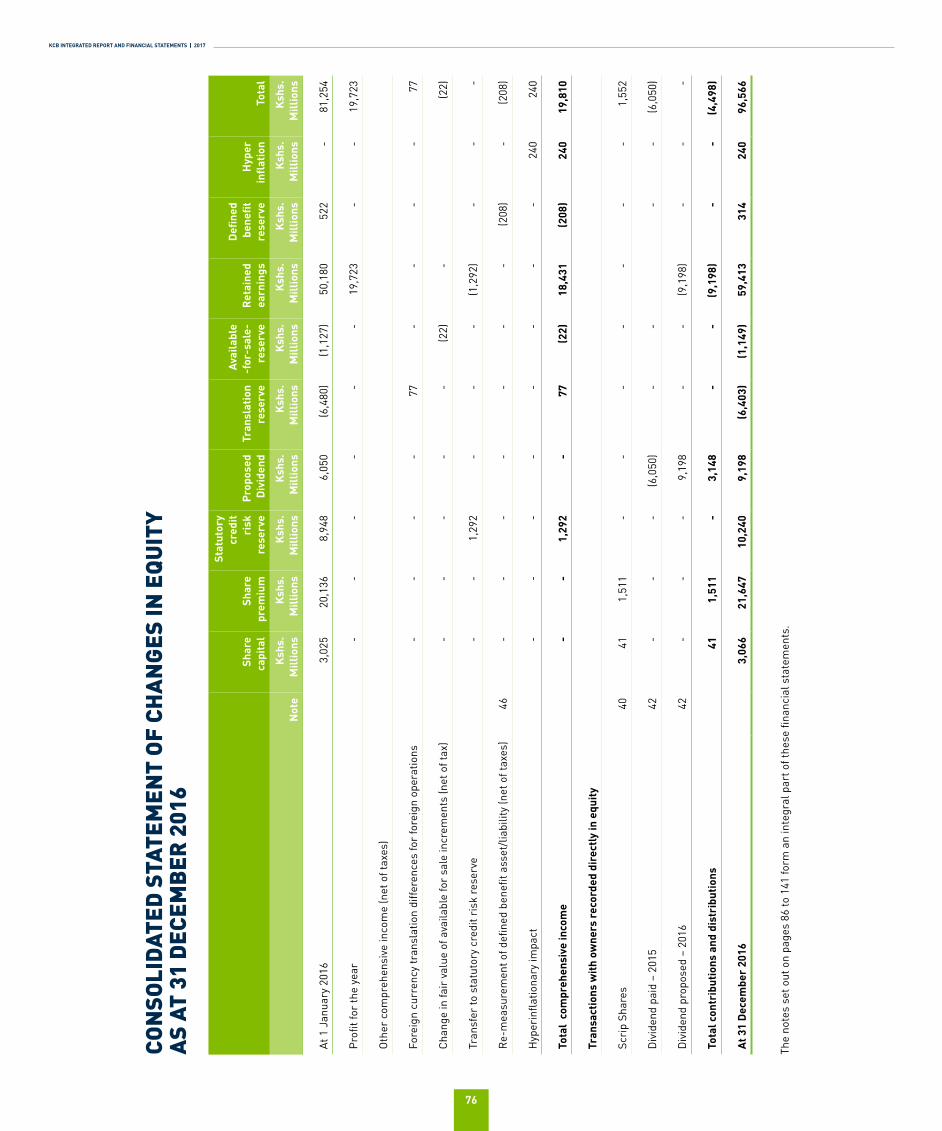
KCB INTEGRATED REPORT AND FINANCIAL STATEMENTS | 2017
76
CON
SOLI
DAT
ED S
TATE
MEN
T O
F CH
AN
GES
IN E
QU
ITY
AS
AT 3
1 D
ECEM
BER
201
6
Shar
e ca
pita
lSh
are
prem
ium
Stat
utor
y cr
edit
risk
re
serv
ePr
opos
ed
Div
iden
dTr
ansl
atio
n re
serv
e
Avai
labl
e -f
or-s
ale-
re
serv
eR
etai
ned
earn
ings
Defi
ned
bene
fit
rese
rve
Hyp
er
infl
atio
nTo
tal
Not
eK
shs.
M
illio
nsK
shs.
M
illio
nsK
shs.
M
illio
nsK
shs.
M
illio
nsK
shs.
M
illio
nsK
shs.
M
illio
nsK
shs.
M
illio
nsK
shs.
M
illio
nsK
shs.
M
illio
nsK
shs.
M
illio
ns
At 1
Jan
uary
201
63,
025
20,1
368,
948
6,05
0(6
,480
)(1
,127
)50
,180
522
-81
,254
Profi
t for
the
year
--
--
--
19,7
23-
-19
,723
Oth
er c
ompr
ehen
sive
inco
me
(net
of t
axes
)
Fore
ign
curr
ency
tran
slat
ion
diffe
renc
es fo
r fo
reig
n op
erat
ions
--
--
77-
--
-77
Chan
ge in
fair
val
ue o
f ava
ilabl
e fo
r sa
le in
crem
ents
(net
of t
ax)
--
--
-(2
2)-
(22)
Tran
sfer
to s
tatu
tory
cre
dit r
isk
rese
rve
--
1,29
2-
--
(1,2
92)
--
-
Re-
mea
sure
men
t of d
efine
d be
nefit
ass
et/l
iabi
lity
(net
of t
axes
)46
--
--
--
-(2
08)
-(2
08)
Hyp
erin
flatio
nary
impa
ct-
--
--
--
-24
024
0
Tota
l co
mpr
ehen
sive
inco
me
--
1,29
2-
77(2
2)18
,431
(208
)24
019
,810
Tran
sact
ions
with
ow
ners
rec
orde
d di
rect
ly in
equ
ity
Scri
p Sh
ares
4041
1,51
1-
--
--
--
1,55
2
Div
iden
d pa
id –
201
542
--
-(6
,050
)-
--
-(6
,050
)
Div
iden
d pr
opos
ed –
201
642
--
-9,
198
--
(9,1
98)
--
-
Tota
l con
trib
utio
ns a
nd d
istr
ibut
ions
411,
511
-3,
148
--
(9,1
98)
--
(4,4
98)
At 3
1 D
ecem
ber
2016
3,06
621
,647
10,2
409,
198
(6,4
03)
(1,1
49)
59,4
1331
424
096
,566
The
note
s se
t out
on
page
s 86
to 1
41 fo
rm a
n in
tegr
al p
art o
f the
se fi
nanc
ial s
tate
men
ts.
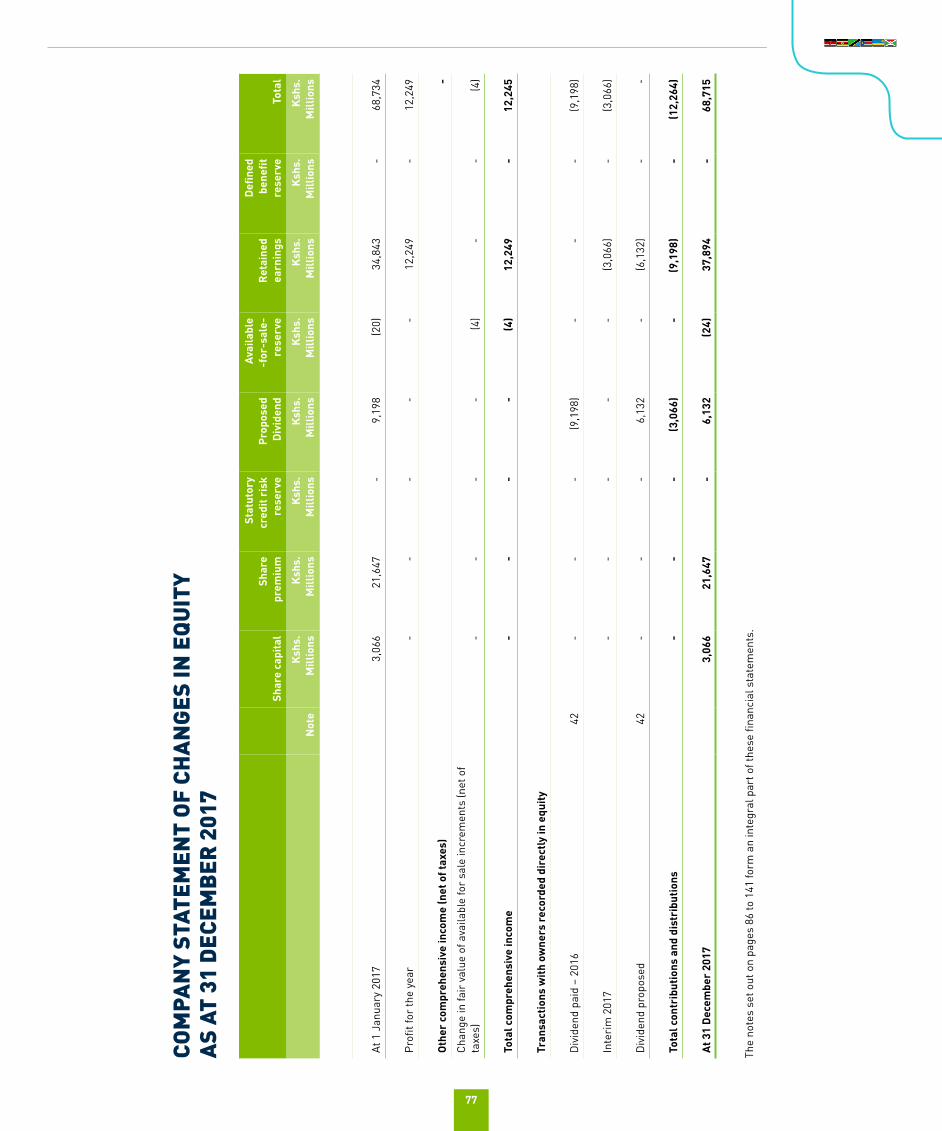
77
COM
PAN
Y ST
ATEM
ENT
OF
CHA
NG
ES IN
EQ
UIT
YA
S AT
31
DEC
EMB
ER 2
017
Shar
e ca
pita
lSh
are
prem
ium
Stat
utor
y cr
edit
risk
re
serv
ePr
opos
ed
Div
iden
d
Avai
labl
e -f
or-s
ale-
re
serv
eR
etai
ned
earn
ings
Defi
ned
bene
fit
rese
rve
Tota
l
Not
eK
shs.
M
illio
nsK
shs.
M
illio
nsK
shs.
M
illio
nsK
shs.
M
illio
nsK
shs.
M
illio
nsK
shs.
M
illio
nsK
shs.
M
illio
nsK
shs.
M
illio
ns
At 1
Jan
uary
201
73,
066
21,6
47-
9,19
8(2
0)34
,843
-68
,734
Profi
t for
the
year
--
--
-12
,249
-12
,249
Oth
er c
ompr
ehen
sive
inco
me
(net
of t
axes
)-
Chan
ge in
fair
val
ue o
f ava
ilabl
e fo
r sa
le in
crem
ents
(net
of
taxe
s)-
--
-(4
)-
-(4
)
Tota
l com
preh
ensi
ve in
com
e-
--
-(4
)12
,249
-12
,245
Tran
sact
ions
with
ow
ners
rec
orde
d di
rect
ly in
equ
ity
Div
iden
d pa
id –
201
642
--
-(9
,198
)-
--
(9,1
98)
Inte
rim
201
7-
--
--
(3,0
66)
-(3
,066
)
Div
iden
d pr
opos
ed
42-
--
6,13
2-
(6,1
32)
--
Tota
l con
trib
utio
ns a
nd d
istr
ibut
ions
--
-(3
,066
)-
(9,1
98)
-(1
2,26
4)
At 3
1 D
ecem
ber
2017
3,06
621
,647
-6,
132
(24)
37,8
94-
68,7
15
The
note
s se
t out
on
page
s 86
to 1
41 fo
rm a
n in
tegr
al p
art o
f the
se fi
nanc
ial s
tate
men
ts.
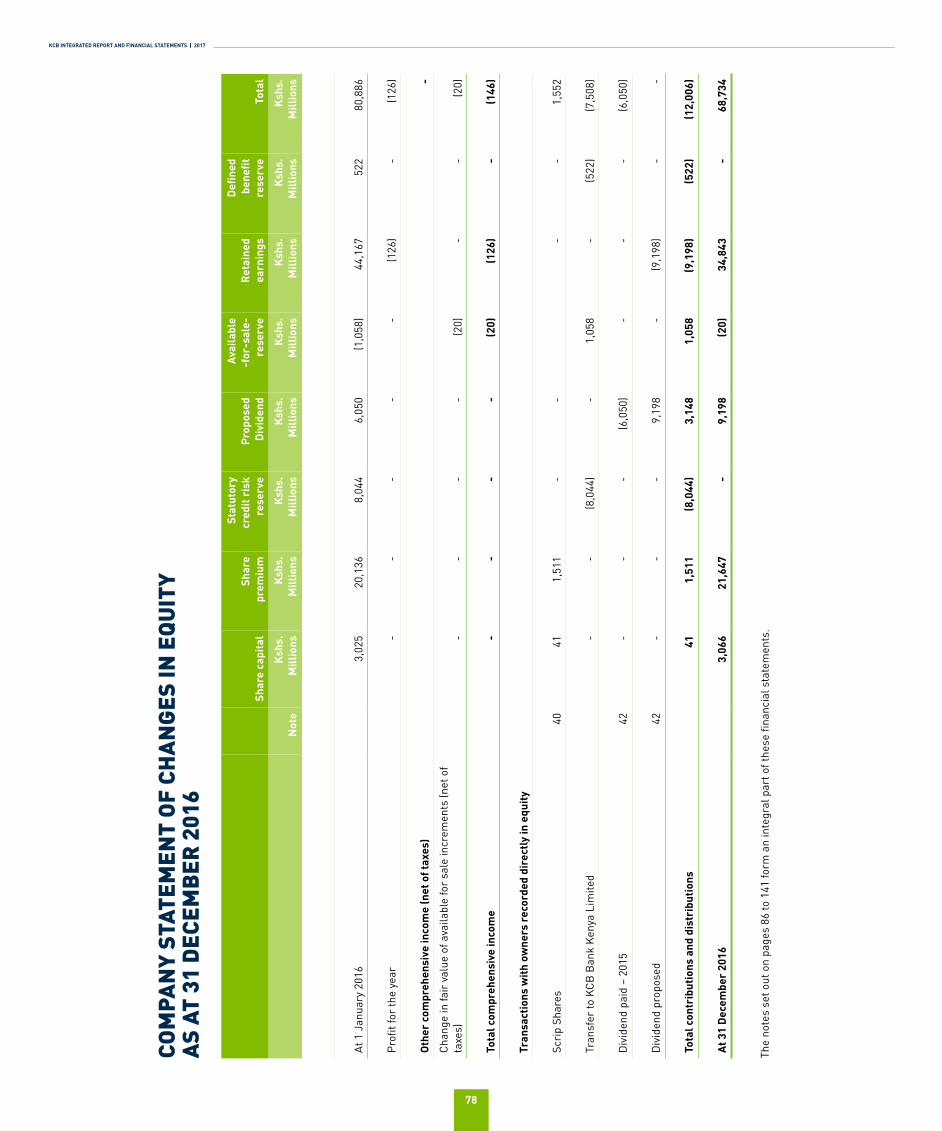
KCB INTEGRATED REPORT AND FINANCIAL STATEMENTS | 2017
78
COM
PAN
Y ST
ATEM
ENT
OF
CHA
NG
ES IN
EQ
UIT
Y A
S AT
31
DEC
EMB
ER 2
016
Shar
e ca
pita
lSh
are
prem
ium
Stat
utor
y cr
edit
risk
re
serv
ePr
opos
ed
Div
iden
d
Avai
labl
e -f
or-s
ale-
re
serv
eR
etai
ned
earn
ings
Defi
ned
bene
fit
rese
rve
Tota
l
Not
eK
shs.
M
illio
nsK
shs.
M
illio
nsK
shs.
M
illio
nsK
shs.
M
illio
nsK
shs.
M
illio
nsK
shs.
M
illio
nsK
shs.
M
illio
nsK
shs.
M
illio
ns
At 1
Jan
uary
201
63,
025
20,1
368,
044
6,05
0(1
,058
)44
,167
522
80,8
86
Profi
t for
the
year
--
--
-(1
26)
-(1
26)
Oth
er c
ompr
ehen
sive
inco
me
(net
of t
axes
)-
Chan
ge in
fair
val
ue o
f ava
ilabl
e fo
r sa
le in
crem
ents
(net
of
taxe
s)-
--
-(2
0)-
-(2
0)
Tota
l com
preh
ensi
ve in
com
e-
--
-(2
0)(1
26)
-(1
46)
Tran
sact
ions
with
ow
ners
rec
orde
d di
rect
ly in
equ
ity
Scri
p Sh
ares
4041
1,51
1-
--
-1,
552
Tran
sfer
to K
CB B
ank
Ken
ya L
imite
d-
-(8
,044
)-
1,05
8-
(522
)(7
,508
)
Div
iden
d pa
id –
201
542
--
-(6
,050
)-
--
(6,0
50)
Div
iden
d pr
opos
ed
42-
--
9,19
8-
(9,1
98)
--
Tota
l con
trib
utio
ns a
nd d
istr
ibut
ions
411,
511
(8,0
44)
3,14
81,
058
(9,1
98)
(522
)(1
2,00
6)
At 3
1 D
ecem
ber
2016
3,06
621
,647
-9,
198
(20)
34,8
43-
68,7
34
The
note
s se
t out
on
page
s 86
to 1
41 fo
rm a
n in
tegr
al p
art o
f the
se fi
nanc
ial s
tate
men
ts.
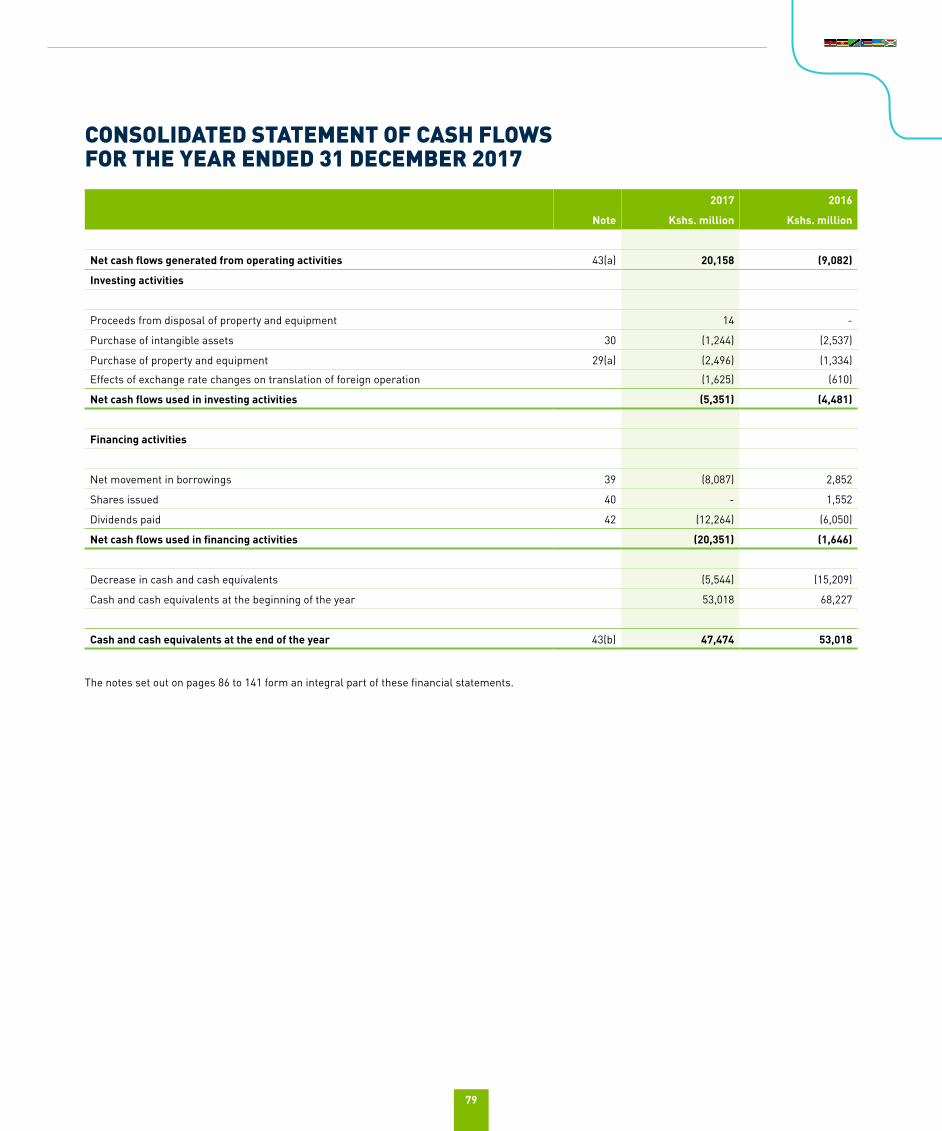
79
CONSOLIDATED STATEMENT OF CASH FLOWSFOR THE YEAR ENDED 31 DECEMBER 2017
2017 2016
Note Kshs. million Kshs. million
Net cash flows generated from operating activities 43(a) 20,158 (9,082)
Investing activities
Proceeds from disposal of property and equipment 14 -
Purchase of intangible assets 30 (1,244) (2,537)
Purchase of property and equipment 29(a) (2,496) (1,334)
Effects of exchange rate changes on translation of foreign operation (1,625) (610)
Net cash flows used in investing activities (5,351) (4,481)
Financing activities
Net movement in borrowings 39 (8,087) 2,852
Shares issued 40 - 1,552
Dividends paid 42 (12,264) (6,050)
Net cash flows used in financing activities (20,351) (1,646)
Decrease in cash and cash equivalents (5,544) (15,209)
Cash and cash equivalents at the beginning of the year 53,018 68,227
Cash and cash equivalents at the end of the year 43(b) 47,474 53,018
The notes set out on pages 86 to 141 form an integral part of these financial statements.
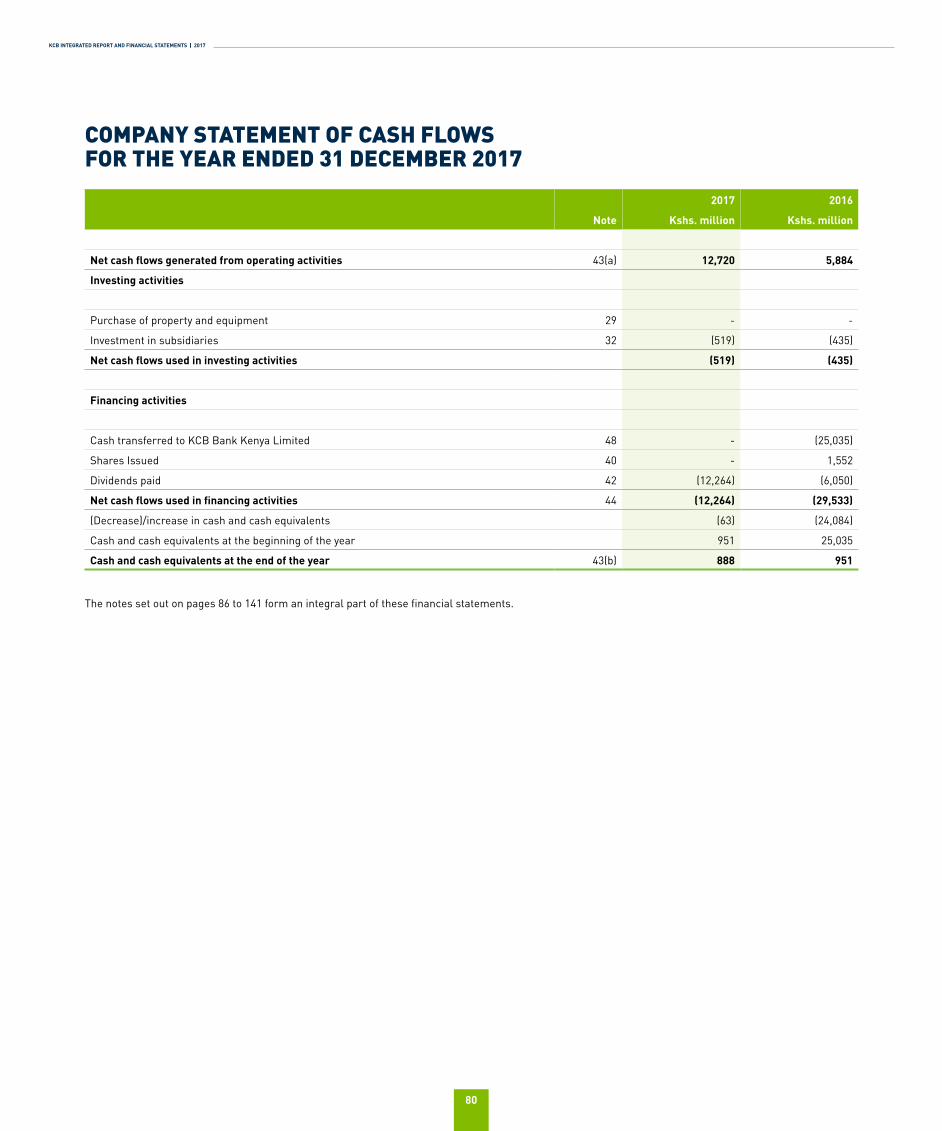
KCB INTEGRATED REPORT AND FINANCIAL STATEMENTS | 2017
80
COMPANY STATEMENT OF CASH FLOWS FOR THE YEAR ENDED 31 DECEMBER 2017
2017 2016
Note Kshs. million Kshs. million
Net cash flows generated from operating activities 43(a) 12,720 5,884
Investing activities
Purchase of property and equipment 29 - -
Investment in subsidiaries 32 (519) (435)
Net cash flows used in investing activities (519) (435)
Financing activities
Cash transferred to KCB Bank Kenya Limited 48 - (25,035)
Shares Issued 40 - 1,552
Dividends paid 42 (12,264) (6,050)
Net cash flows used in financing activities 44 (12,264) (29,533)
(Decrease)/increase in cash and cash equivalents (63) (24,084)
Cash and cash equivalents at the beginning of the year 951 25,035
Cash and cash equivalents at the end of the year 43(b) 888 951
The notes set out on pages 86 to 141 form an integral part of these financial statements.
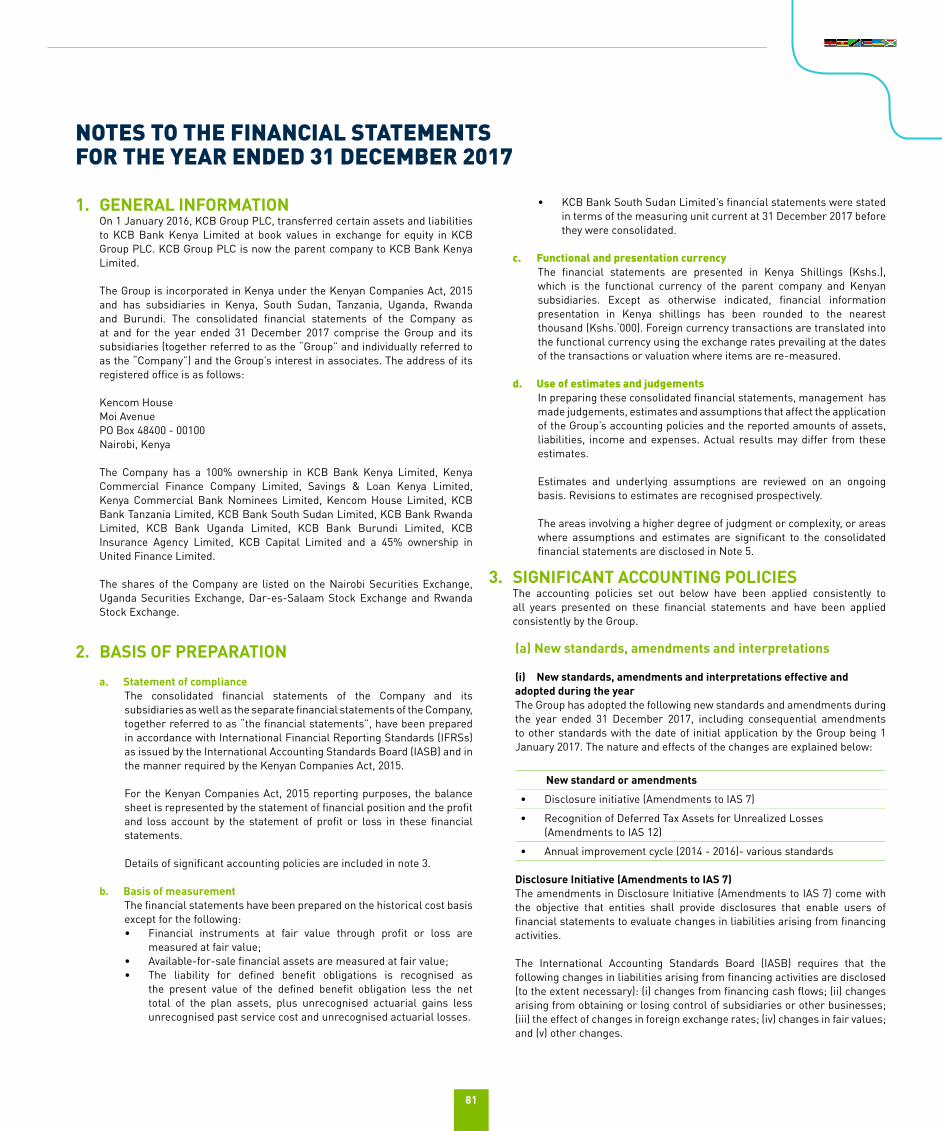
81
NOTES TO THE FINANCIAL STATEMENTS FOR THE YEAR ENDED 31 DECEMBER 2017
1. GENERAL INFORMATIONOn 1 January 2016, KCB Group PLC, transferred certain assets and liabilities to KCB Bank Kenya Limited at book values in exchange for equity in KCB Group PLC. KCB Group PLC is now the parent company to KCB Bank Kenya Limited.
The Group is incorporated in Kenya under the Kenyan Companies Act, 2015 and has subsidiaries in Kenya, South Sudan, Tanzania, Uganda, Rwanda and Burundi. The consolidated financial statements of the Company as at and for the year ended 31 December 2017 comprise the Group and its subsidiaries (together referred to as the “Group” and individually referred to as the “Company”) and the Group’s interest in associates. The address of its registered office is as follows:
Kencom HouseMoi Avenue PO Box 48400 - 00100 Nairobi, Kenya
The Company has a 100% ownership in KCB Bank Kenya Limited, Kenya Commercial Finance Company Limited, Savings & Loan Kenya Limited, Kenya Commercial Bank Nominees Limited, Kencom House Limited, KCB Bank Tanzania Limited, KCB Bank South Sudan Limited, KCB Bank Rwanda Limited, KCB Bank Uganda Limited, KCB Bank Burundi Limited, KCB Insurance Agency Limited, KCB Capital Limited and a 45% ownership in United Finance Limited.
The shares of the Company are listed on the Nairobi Securities Exchange, Uganda Securities Exchange, Dar-es-Salaam Stock Exchange and Rwanda Stock Exchange.
2. BASIS OF PREPARATION
a. Statement of complianceThe consolidated financial statements of the Company and its subsidiaries as well as the separate financial statements of the Company, together referred to as “the financial statements”, have been prepared in accordance with International Financial Reporting Standards (IFRSs) as issued by the International Accounting Standards Board (IASB) and in the manner required by the Kenyan Companies Act, 2015.
For the Kenyan Companies Act, 2015 reporting purposes, the balance sheet is represented by the statement of financial position and the profit and loss account by the statement of profit or loss in these financial statements.
Details of significant accounting policies are included in note 3.
b. Basis of measurement The financial statements have been prepared on the historical cost basis except for the following:• Financial instruments at fair value through profit or loss are
measured at fair value; • Available-for-sale financial assets are measured at fair value;• The liability for defined benefit obligations is recognised as
the present value of the defined benefit obligation less the net total of the plan assets, plus unrecognised actuarial gains less unrecognised past service cost and unrecognised actuarial losses.
• KCB Bank South Sudan Limited’s financial statements were stated in terms of the measuring unit current at 31 December 2017 before they were consolidated.
c. Functional and presentation currency
The financial statements are presented in Kenya Shillings (Kshs.), which is the functional currency of the parent company and Kenyan subsidiaries. Except as otherwise indicated, financial information presentation in Kenya shillings has been rounded to the nearest thousand (Kshs.‘000). Foreign currency transactions are translated into the functional currency using the exchange rates prevailing at the dates of the transactions or valuation where items are re-measured.
d. Use of estimates and judgementsIn preparing these consolidated financial statements, management has made judgements, estimates and assumptions that affect the application of the Group’s accounting policies and the reported amounts of assets, liabilities, income and expenses. Actual results may differ from these estimates.
Estimates and underlying assumptions are reviewed on an ongoing basis. Revisions to estimates are recognised prospectively.
The areas involving a higher degree of judgment or complexity, or areas where assumptions and estimates are significant to the consolidated financial statements are disclosed in Note 5.
3. SIGNIFICANT ACCOUNTING POLICIESThe accounting policies set out below have been applied consistently to all years presented on these financial statements and have been applied consistently by the Group.
(a) New standards, amendments and interpretations
(i) New standards, amendments and interpretations effective and adopted during the yearThe Group has adopted the following new standards and amendments during the year ended 31 December 2017, including consequential amendments to other standards with the date of initial application by the Group being 1 January 2017. The nature and effects of the changes are explained below:
New standard or amendments
• Disclosure initiative (Amendments to IAS 7)
• Recognition of Deferred Tax Assets for Unrealized Losses (Amendments to IAS 12)
• Annual improvement cycle (2014 - 2016)- various standards
Disclosure Initiative (Amendments to IAS 7) The amendments in Disclosure Initiative (Amendments to IAS 7) come with the objective that entities shall provide disclosures that enable users of financial statements to evaluate changes in liabilities arising from financing activities.
The International Accounting Standards Board (IASB) requires that the following changes in liabilities arising from financing activities are disclosed (to the extent necessary): (i) changes from financing cash flows; (ii) changes arising from obtaining or losing control of subsidiaries or other businesses; (iii) the effect of changes in foreign exchange rates; (iv) changes in fair values; and (v) other changes.
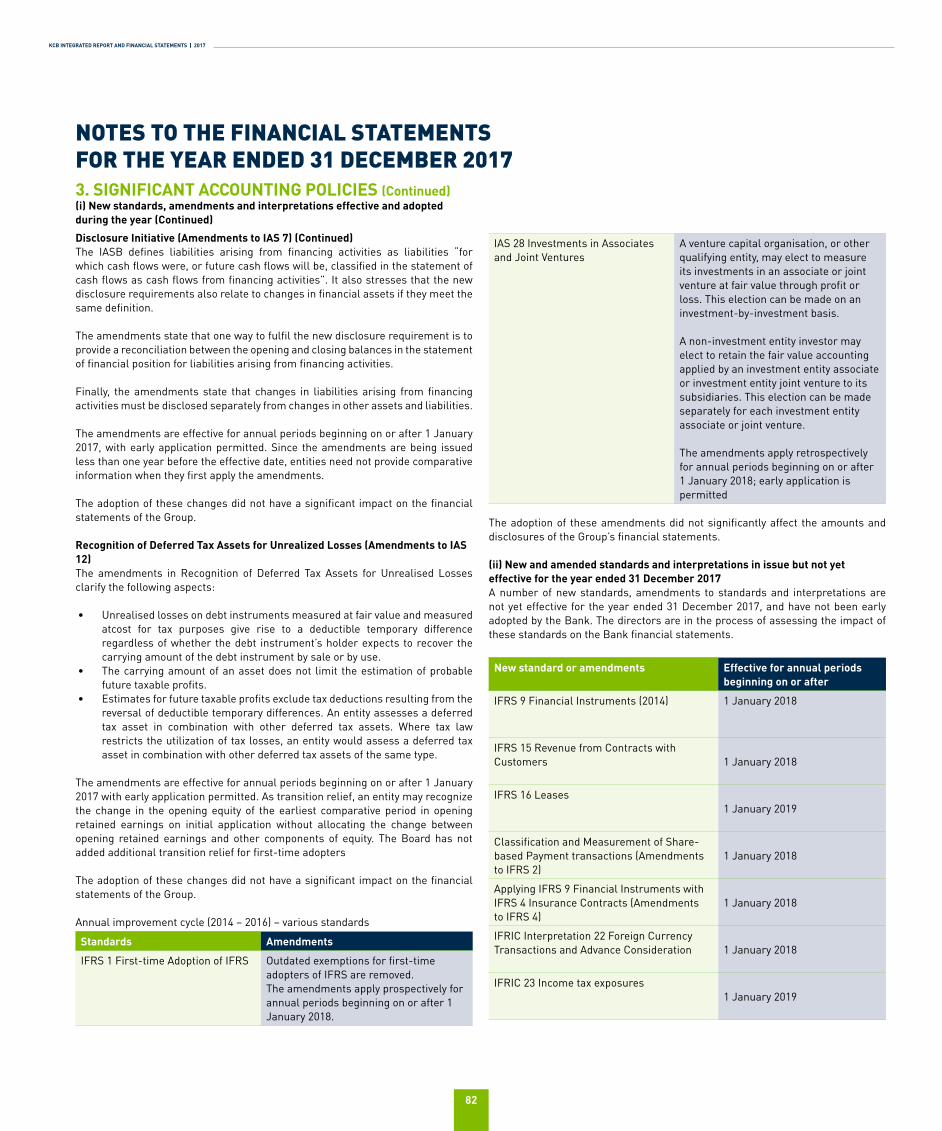
KCB INTEGRATED REPORT AND FINANCIAL STATEMENTS | 2017
82
NOTES TO THE FINANCIAL STATEMENTS FOR THE YEAR ENDED 31 DECEMBER 20173. SIGNIFICANT ACCOUNTING POLICIES (Continued)(i) New standards, amendments and interpretations effective and adopted during the year (Continued)
Disclosure Initiative (Amendments to IAS 7) (Continued)The IASB defines liabilities arising from financing activities as liabilities “for which cash flows were, or future cash flows will be, classified in the statement of cash flows as cash flows from financing activities”. It also stresses that the new disclosure requirements also relate to changes in financial assets if they meet the same definition.
The amendments state that one way to fulfil the new disclosure requirement is to provide a reconciliation between the opening and closing balances in the statement of financial position for liabilities arising from financing activities.
Finally, the amendments state that changes in liabilities arising from financing activities must be disclosed separately from changes in other assets and liabilities.
The amendments are effective for annual periods beginning on or after 1 January 2017, with early application permitted. Since the amendments are being issued less than one year before the effective date, entities need not provide comparative information when they first apply the amendments.
The adoption of these changes did not have a significant impact on the financial statements of the Group.
Recognition of Deferred Tax Assets for Unrealized Losses (Amendments to IAS 12)The amendments in Recognition of Deferred Tax Assets for Unrealised Losses clarify the following aspects:
• Unrealised losses on debt instruments measured at fair value and measured atcost for tax purposes give rise to a deductible temporary difference regardless of whether the debt instrument’s holder expects to recover the carrying amount of the debt instrument by sale or by use.
• The carrying amount of an asset does not limit the estimation of probable future taxable profits.
• Estimates for future taxable profits exclude tax deductions resulting from the reversal of deductible temporary differences. An entity assesses a deferred tax asset in combination with other deferred tax assets. Where tax law restricts the utilization of tax losses, an entity would assess a deferred tax asset in combination with other deferred tax assets of the same type.
The amendments are effective for annual periods beginning on or after 1 January 2017 with early application permitted. As transition relief, an entity may recognize the change in the opening equity of the earliest comparative period in opening retained earnings on initial application without allocating the change between opening retained earnings and other components of equity. The Board has not added additional transition relief for first-time adopters
The adoption of these changes did not have a significant impact on the financial statements of the Group.
Annual improvement cycle (2014 – 2016) – various standards
Standards Amendments
IFRS 1 First-time Adoption of IFRS Outdated exemptions for first-time adopters of IFRS are removed.The amendments apply prospectively for annual periods beginning on or after 1 January 2018.
IAS 28 Investments in Associates and Joint Ventures
A venture capital organisation, or other qualifying entity, may elect to measure its investments in an associate or joint venture at fair value through profit or loss. This election can be made on an investment-by-investment basis.
A non-investment entity investor may elect to retain the fair value accounting applied by an investment entity associate or investment entity joint venture to its subsidiaries. This election can be made separately for each investment entity associate or joint venture.
The amendments apply retrospectively for annual periods beginning on or after 1 January 2018; early application is permitted
The adoption of these amendments did not significantly affect the amounts and disclosures of the Group’s financial statements.
(ii) New and amended standards and interpretations in issue but not yet effective for the year ended 31 December 2017A number of new standards, amendments to standards and interpretations are not yet effective for the year ended 31 December 2017, and have not been early adopted by the Bank. The directors are in the process of assessing the impact of these standards on the Bank financial statements.
New standard or amendments Effective for annual periods beginning on or after
IFRS 9 Financial Instruments (2014) 1 January 2018
IFRS 15 Revenue from Contracts with Customers 1 January 2018
IFRS 16 Leases 1 January 2019
Classification and Measurement of Share-based Payment transactions (Amendments to IFRS 2)
1 January 2018
Applying IFRS 9 Financial Instruments with IFRS 4 Insurance Contracts (Amendments to IFRS 4)
1 January 2018
IFRIC Interpretation 22 Foreign Currency Transactions and Advance Consideration 1 January 2018
IFRIC 23 Income tax exposures1 January 2019
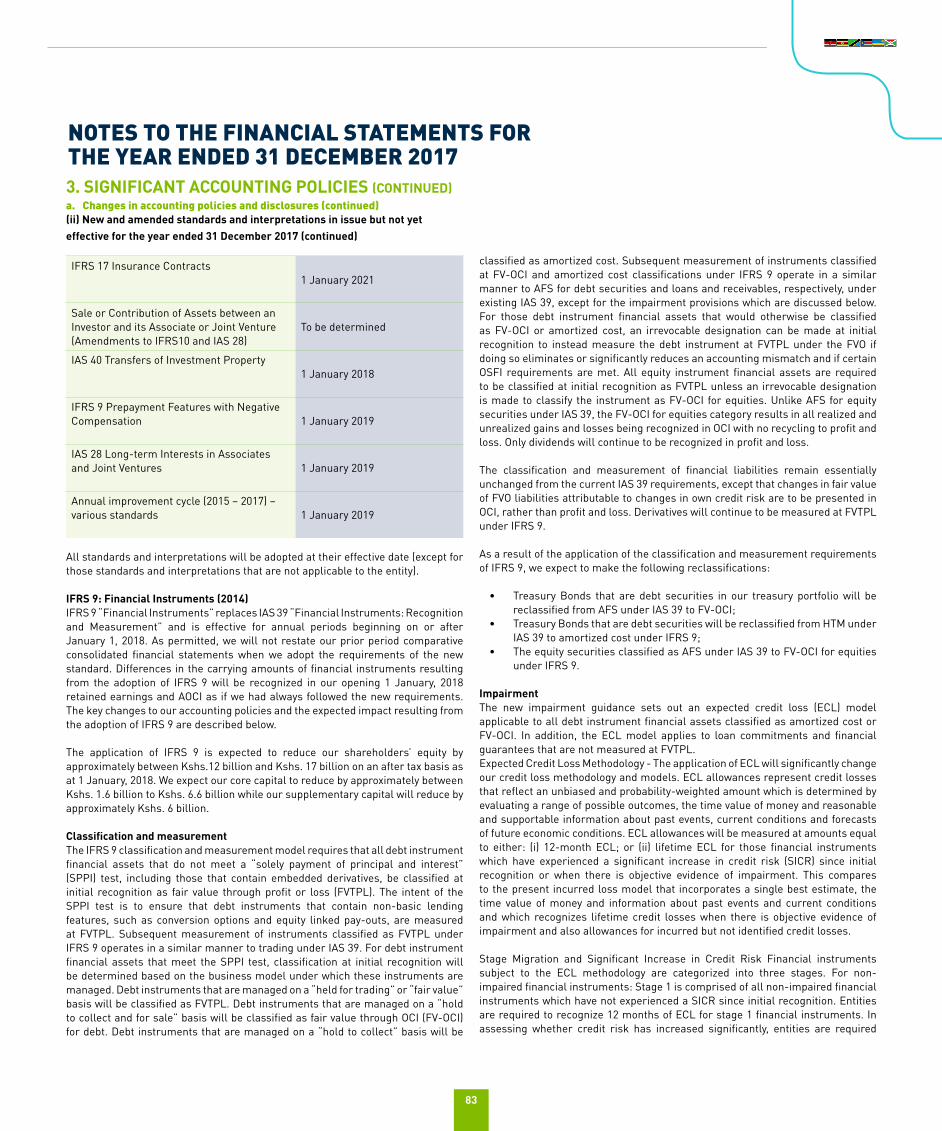
83
IFRS 17 Insurance Contracts1 January 2021
Sale or Contribution of Assets between an Investor and its Associate or Joint Venture (Amendments to IFRS10 and IAS 28)
To be determined
IAS 40 Transfers of Investment Property1 January 2018
IFRS 9 Prepayment Features with Negative Compensation 1 January 2019
IAS 28 Long-term Interests in Associates and Joint Ventures 1 January 2019
Annual improvement cycle (2015 – 2017) – various standards 1 January 2019
All standards and interpretations will be adopted at their effective date (except for those standards and interpretations that are not applicable to the entity). IFRS 9: Financial Instruments (2014)IFRS 9 “Financial Instruments” replaces IAS 39 “Financial Instruments: Recognition and Measurement” and is effective for annual periods beginning on or after January 1, 2018. As permitted, we will not restate our prior period comparative consolidated financial statements when we adopt the requirements of the new standard. Differences in the carrying amounts of financial instruments resulting from the adoption of IFRS 9 will be recognized in our opening 1 January, 2018 retained earnings and AOCI as if we had always followed the new requirements. The key changes to our accounting policies and the expected impact resulting from the adoption of IFRS 9 are described below.
The application of IFRS 9 is expected to reduce our shareholders’ equity by approximately between Kshs.12 billion and Kshs. 17 billion on an after tax basis as at 1 January, 2018. We expect our core capital to reduce by approximately between Kshs. 1.6 billion to Kshs. 6.6 billion while our supplementary capital will reduce by approximately Kshs. 6 billion.
Classification and measurement The IFRS 9 classification and measurement model requires that all debt instrument financial assets that do not meet a “solely payment of principal and interest” (SPPI) test, including those that contain embedded derivatives, be classified at initial recognition as fair value through profit or loss (FVTPL). The intent of the SPPI test is to ensure that debt instruments that contain non-basic lending features, such as conversion options and equity linked pay-outs, are measured at FVTPL. Subsequent measurement of instruments classified as FVTPL under IFRS 9 operates in a similar manner to trading under IAS 39. For debt instrument financial assets that meet the SPPI test, classification at initial recognition will be determined based on the business model under which these instruments are managed. Debt instruments that are managed on a “held for trading” or “fair value” basis will be classified as FVTPL. Debt instruments that are managed on a “hold to collect and for sale” basis will be classified as fair value through OCI (FV-OCI) for debt. Debt instruments that are managed on a “hold to collect” basis will be
classified as amortized cost. Subsequent measurement of instruments classified at FV-OCI and amortized cost classifications under IFRS 9 operate in a similar manner to AFS for debt securities and loans and receivables, respectively, under existing IAS 39, except for the impairment provisions which are discussed below. For those debt instrument financial assets that would otherwise be classified as FV-OCI or amortized cost, an irrevocable designation can be made at initial recognition to instead measure the debt instrument at FVTPL under the FVO if doing so eliminates or significantly reduces an accounting mismatch and if certain OSFI requirements are met. All equity instrument financial assets are required to be classified at initial recognition as FVTPL unless an irrevocable designation is made to classify the instrument as FV-OCI for equities. Unlike AFS for equity securities under IAS 39, the FV-OCI for equities category results in all realized and unrealized gains and losses being recognized in OCI with no recycling to profit and loss. Only dividends will continue to be recognized in profit and loss. The classification and measurement of financial liabilities remain essentially unchanged from the current IAS 39 requirements, except that changes in fair value of FVO liabilities attributable to changes in own credit risk are to be presented in OCI, rather than profit and loss. Derivatives will continue to be measured at FVTPL under IFRS 9.
As a result of the application of the classification and measurement requirements of IFRS 9, we expect to make the following reclassifications:
• Treasury Bonds that are debt securities in our treasury portfolio will be reclassified from AFS under IAS 39 to FV-OCI;
• Treasury Bonds that are debt securities will be reclassified from HTM under IAS 39 to amortized cost under IFRS 9;
• The equity securities classified as AFS under IAS 39 to FV-OCI for equities under IFRS 9.
Impairment The new impairment guidance sets out an expected credit loss (ECL) model applicable to all debt instrument financial assets classified as amortized cost or FV-OCI. In addition, the ECL model applies to loan commitments and financial guarantees that are not measured at FVTPL.Expected Credit Loss Methodology - The application of ECL will significantly change our credit loss methodology and models. ECL allowances represent credit losses that reflect an unbiased and probability-weighted amount which is determined by evaluating a range of possible outcomes, the time value of money and reasonable and supportable information about past events, current conditions and forecasts of future economic conditions. ECL allowances will be measured at amounts equal to either: (i) 12-month ECL; or (ii) lifetime ECL for those financial instruments which have experienced a significant increase in credit risk (SICR) since initial recognition or when there is objective evidence of impairment. This compares to the present incurred loss model that incorporates a single best estimate, the time value of money and information about past events and current conditions and which recognizes lifetime credit losses when there is objective evidence of impairment and also allowances for incurred but not identified credit losses.
Stage Migration and Significant Increase in Credit Risk Financial instruments subject to the ECL methodology are categorized into three stages. For non-impaired financial instruments: Stage 1 is comprised of all non-impaired financial instruments which have not experienced a SICR since initial recognition. Entities are required to recognize 12 months of ECL for stage 1 financial instruments. In assessing whether credit risk has increased significantly, entities are required
3. SIGNIFICANT ACCOUNTING POLICIES (CONTINUED)a. Changes in accounting policies and disclosures (continued)(ii) New and amended standards and interpretations in issue but not yet effective for the year ended 31 December 2017 (continued)
NOTES TO THE FINANCIAL STATEMENTS FOR THE YEAR ENDED 31 DECEMBER 2017
KCB INTEGRATED REPORT AND FINANCIAL STATEMENTS | 2017
84
3. SIGNIFICANT ACCOUNTING POLICIES (CONTINUED)a. Changes in accounting policies and disclosures (continued)(ii) New and amended standards and interpretations in issue but not yet effective for the year ended 31 December 2017 (continued)
Impairment (continued) to compare the risk of a default occurring on the financial instrument as at the reporting date, with the risk of a default occurring on the financial instrument as at the date of initial recognition.
Stage 2 is comprised of all non-impaired financial instruments which have experienced a SICR since initial recognition. Entities are required to recognize lifetime ECL for stage 2 financial instruments. In subsequent reporting periods, if the credit risk of the financial instrument improves such that there is no longer a SICR since initial recognition, then entities shall revert to recognizing 12 months of ECL. In contrast to stage 1 and stage 2, inherent within the incurred loss methodology under IAS 39, allowances are provided for non-impaired financial instruments for credit losses that are incurred but not yet identified. For impaired financial instruments: Financial instruments are classified as stage 3 when there is objective evidence of impairment as a result of one or more loss events that have occurred after initial recognition with a negative impact on the estimated future cash flows of a loan or a portfolio of loans. The ECL model requires that lifetime ECL be recognized for impaired financial instruments, which is similar to the current requirements under IAS 39 for impaired financial instruments.
For our corporate portfolios, the individually assessed allowances for impaired instruments recognized under IAS 39 will generally be replaced by stage 3 allowances under IFRS 9, while the collective allowances for non-impaired financial instruments will generally be replaced by either stage 1 or stage 2 allowances under IFRS 9. For our retail portfolios, the portion of our collective allowances that relate to impaired financial instruments under IAS 39 will generally be replaced by stage 3 allowances, while the non-impaired portion of our collective allowances will generally be replaced by either stage 1 or stage 2 allowances under IFRS 9.
IFRS 15 Revenue from Contracts with Customers (Effective 31 December 2018)This standard replaces IAS 11 Construction Contracts, IAS 18 Revenue, IFRIC 13 Customer Loyalty Programmes, IFRIC 15 Agreements for the Construction of Real Estate, IFRIC 18 Transfer of Assets from Customers and SIC-31 Revenue – Barter of Transactions Involving Advertising Services.
The standard contains a single model that applies to contracts with customers and two approaches to recognising revenue: at a point in time or over time. The standard specifies how and when an IFRS reporter will recognise revenue as well as requiring such entities to provide users of financial statements with more informative, relevant disclosures.
The standard provides a single, principles based five-step model to be applied to all contracts with customers in recognising revenue being: Identify the contract(s) with a customer; identify the performance obligations in the contract; determine the transaction price; Allocate the transaction price to the performance obligations in the contract; and recognise revenue when (or as) the entity satisfies a performance obligation.
IFRS 15 is effective for annual reporting periods beginning on or after 1 January 2018, with early adoption permitted. The Group is assessing the potential impact on its financial statements resulting from the application of IFRS 15.
IFRS 16: LeasesOn 13 January 2016 the IASB issued IFRS 16 Leases which sets out the principles for the recognition, measurement, presentation and disclosure of leases for both parties to a contract, i.e. the customer (‘lessee’) and the supplier (‘lessor’). The
standard defines a lease as a contract that conveys to the customer (‘lessee’) the right to use an asset for a period of time in exchange for consideration. A company assesses whether a contract contains a lease on the basis of whether the customer has the right to control the use of an identified asset for a period of time.
The standard eliminates the classification of leases as either operating leases or finance leases for a lessee and introduces a single lessee accounting model.
All leases are treated in a similar way to finance leases. Applying that model significantly affects the accounting and presentation of leases and consequently, the lessee is required to recognise:
i. Assets and liabilities for all leases with a term of more than 12 months, unless the underlying asset is of low value. A company recognises the present value of the unavoidable lease payments and shows them either as lease assets (right-of-use assets) or together with property, plant and equipment. If lease payments are made over time, a company also recognises a financial liability representing its obligation to make future lease payments;
ii. Depreciation of lease assets and interest on lease liabilities in profit or loss over the lease term; and
iii. Separate the total amount of cash paid into a principal portion (presented within financing activities) and interest (typically presented within either operating or financing activities) in the statement of cash flows.
IFRS 16 substantially carries forward the lessor accounting requirements in IAS 17. Accordingly, a lessor continues to classify its leases as operating leases or finance leases, and to account for those two types of leases differently. However, compared to IAS 17, IFRS 16 requires a lessor to disclose additional information about how it manages the risks related to its residual interest in assets subject to leases.
The standard does not require a Bank to recognise assets and liabilities for:
i. short-term leases (i.e. leases of 12 months or less), and;ii. leases of low-value assets
The new Standard is effective for annual periods beginning on or after 1 January 2019. Early application is permitted insofar as the recently issued revenue standard, IFRS 15 Revenue from Contracts with Customers is also applied.
The Group is assessing the potential impact on its financial statements resulting from the application of this standard
Classification and Measurement of Share-based Payment Transactions (Amendments to IFRS 2) The following clarifications and amendments are contained in the pronouncement:
• Accounting for cash-settled share-based payment transactions that include a performance condition
Up until this point, IFRS 2 contained no guidance on how vesting conditions affect the fair value of liabilities for cash-settled share-based payments. IASB has now added guidance that introduces accounting requirements for cash-settled share-based payments that follows the same approach as used for equity-settled share-based payments.
NOTES TO THE FINANCIAL STATEMENTS FOR THE YEAR ENDED 31 DECEMBER 2017
85
• Classification of share-based payment transactions with net settlement features
IASB has introduced an exception into IFRS 2 so that a share-based payment where the entity settles the share-based payment arrangement net is classified as equity-settled in its entirety provided the share-based payment would have been classified as equity-settled had it not included the net settlement feature. Accounting for modifications of share-based payment transactions from cash-settled to equity-settled.
Up until this point, IFRS 2 did not specifically address situations where a cash-settled share-based payment changes to an equity-settled share-based payment because of modifications of the terms and conditions. The IASB has introduced the following clarifications:
• On such modifications, the original liability recognised in respect of the cash-settled share-based payment is derecognised and the equity-settled share-based payment is recognised at the modification date fair value to the extent services have been rendered up to the modification date.
• Any difference between the carrying amount of the liability as at the modification date and the amount recognised in equity at the same date would be recognised in profit and loss immediately.
The amendments are effective for annual periods beginning on or after 1 January 2018. Earlier application is permitted. The amendments are to be applied prospectively. However, retrospective application is allowed if this is possible without the use of hindsight. If an entity applies the amendments retrospectively, it must do so for all of the amendments described above.
The Group is assessing the potential impact on its financial statements resulting from the application of IFRS 2. Applying IFRS 9 Financial Instruments with IFRS 4 Insurance Contracts (Amendments to IFRS 4)The amendments in Applying IFRS 9 ‘Financial Instruments’ with IFRS 4 ‘Insurance Contracts’ (Amendments to IFRS 4) provide two options for entities that issue insurance contracts within the scope of IFRS 4:
• an option that permits entities to reclassify, from profit or loss to other comprehensive income, some of the income or expenses arising from designated financial assets; this is the so-called overlay approach;
• an optional temporary exemption from applying IFRS 9 for entities whose predominant activity is issuing contracts within the scope of IFRS 4; this is the so-called deferral approach.
The application of both approaches is optional and an entity is permitted to stop applying them before the new insurance contracts standard is applied.
An entity applies the overlay approach retrospectively to qualifying financial assets when it first applies IFRS 9. Application of the overlay approach requires disclosure of sufficient information to enable users of financial statements to understand how the amount reclassified in the reporting period is calculated and the effect of that reclassification on the financial statements.
An entity applies the deferral approach for annual periods beginning on or after 1 January 2018. Predominance is assessed at the reporting entity level at the annual reporting date that immediately precedes 1 April 2016. Application of the deferral approach needs to be disclosed together with information that enables users of
financial statements to understand how the insurer qualified for the temporary exemption and to compare insurers applying the temporary exemption with entities applying IFRS 9. The deferral can only be made use of for the three years following 1 January 2018. Predominance is only reassessed if there is a change in the entity’s activities.
The adoption of these changes is not expected to have a significant impact on the financial statements of the Group since the Group does not issue insurance contracts within the scope of IFRS 4.
IFRIC Interpretation 22 Foreign Currency Transactions and Advance ConsiderationThis Interpretation applies to a foreign currency transaction (or part of it) when an entity recognises a non-monetary asset or non-monetary liability arising from the payment or receipt of advance consideration before the entity recognises the related asset, expense or income (or part of it).
This Interpretation stipulates that the date of the transaction for the purpose of determining the exchange rate to use on initial recognition of the related asset, expense or income (or part of it) is the date on which an entity initially recognises the non-monetary asset or non-monetary liability arising from the payment or receipt of advance consideration.
This Interpretation does not apply to income taxes, insurance contracts and circumstances when an entity measures the related asset, expense or income on initial recognition:
a. at fair value; orb. at the fair value of the consideration paid or received at a date other than
the date of initial recognition of the non-monetary asset or non-monetary liability arising from advance consideration (for example, the measurement of goodwill applying IFRS 3 Business Combinations).
The amendments apply retrospectively for annual periods beginning on or after 1 January 2018, with early application permitted.
The adoption of these changes will not have an impact on the amounts and disclosures of the Group’s financial statements.
IFRIC 23 Clarification on accounting for Income tax exposuresIFRIC 23 clarifies the accounting for income tax treatments that have yet to be accepted by tax authorities, whilst also aiming to enhance transparency.
IFRIC 23 explains how to recognise and measure deferred and current income tax assets and liabilities where there is uncertainty over a tax treatment.
An uncertain tax treatment is any tax treatment applied by an entity where there is uncertainty over whether that treatment will be accepted by the tax authority.
If an entity concludes that it is probable that the tax authority will accept an uncertain tax treatment that has been taken or is expected to be taken on a tax return, it should determine its accounting for income taxes consistently with that tax treatment. If an entity concludes that it is not probable that the treatment will be accepted, it should reflect the effect of the uncertainty in its income tax accounting in the period in which that determination is made. Uncertainty is reflected in the overall measurement of tax and separate provision is not allowed.
3. SIGNIFICANT ACCOUNTING POLICIES (CONTINUED)(a)Changes in accounting policies and disclosures (continued)Classification and Measurement of Share-based Payment Transactions (Amendments to IFRS 2) (continued)
NOTES TO THE FINANCIAL STATEMENTS FOR THE YEAR ENDED 31 DECEMBER 2017
KCB INTEGRATED REPORT AND FINANCIAL STATEMENTS | 2017
86
The entity is required to measure the impact of the uncertainty using the method that best predicts the resolution of the uncertainty (that is, the entity should use either the most likely amount method or the expected value method when measuring an uncertainty).
The entity will also need to provide disclosures, under existing disclosure requirements, about
a. judgments made;b. assumptions and other estimates used; andc. potential impact of uncertainties not reflected.
The new Standard is effective for annual periods beginning on or after 1 January 2019.
The Group is assessing the potential impact on its financial statements resulting from the application of IFRIC 23.
IFRS 17 Insurance ContractsIFRS 17 Insurance Contracts sets out the requirements that an entity should apply in reporting information about insurance contracts it issues and reinsurance contracts it holds. An entity shall apply IFRS 17 Insurance Contracts to:
a. insurance contracts, including reinsurance contracts, it issues;b. reinsurance contracts it holds; andc. investment contracts with discretionary participation features it issues,
provided the entity also issues insurance contracts
IFRS 17 requires an entity that issues insurance contracts to report them on the statement of financial position as the total of:
a. the fulfilment cash flows - the current estimates of amounts that the entity expects to collect from premiums and pay out for claims, benefits and expenses, including an adjustment for the timing and risk of those amounts; and
b. the contractual service margin - the expected profit for providing insurance coverage. The expected profit for providing insurance coverage is recognised in profit or loss over time as the insurance coverage is provided.
IFRS 17 requires an entity to recognise profits as it delivers insurance services, rather than when it receives premiums, as well as to provide information about insurance contract profits that the company expects to recognise in the future. IFRS 17 requires an entity to distinguish between groups of contracts expected to be profit making and groups of contracts expected to be loss making. Any expected losses arising from loss-making, or onerous, contracts are accounted for in profit or loss as soon as the company determines that losses are expected. IFRS 17 requires the entity to update the fulfilment cash flows at each reporting date, using current estimates of the amount, timing and uncertainty of cash flows and of discount rates. The entity:
a. accounts for changes to estimates of future cash flows from one reporting date to another either as an amount in profit or loss or as an adjustment to the expected profit for providing insurance coverage, depending on the type of change and the reason for it; and
b. chooses where to present the effects of some changes in discount rates—either in profit or loss or in other comprehensive income.
IFRS 17 also requires disclosures to enable users of financial statements to understand the amounts recognised in the entity’s statement of financial position and statement of profit or loss and other comprehensive income, and to assess the risks the company faces from issuing insurance contracts.
IFRS 17 replaces IFRS 4 Insurance Contracts. IFRS 17 is effective for financial periods commencing on or after 1 January 2021. An entity shall apply the standard retrospectively unless impracticable. A company can choose to apply IFRS 17 before that date, but only if it also applies IFRS 9 Financial Instruments and IFRS 15 Revenue from Contracts with Customers.
The adoption of the standard will not have an impact on the financial statements of the Group.
Sale or Contribution of Assets between an Investor and its Associate or Joint Venture (Amendments to IFRS 10 and IAS 28)The amendments require the full gain to be recognised when assets transferred between an investor and its associate or joint venture meet the definition of a ‘business’ under IFRS 3 Business Combinations. Where the assets transferred do not meet the definition of a business, a partial gain to the extent of unrelated investors’ interests in the associate or joint venture is recognised. The definition of a business is key to determining the extent of the gain to be recognised.
The effective date for these changes has now been postponed until the completion of a broader review.
The Group is assessing the potential impact on its financial statements resulting from the application of the standard.
The Group did not early adopt new or amended standards in the year ended 31 December 2017
Transfers of Investment property (Amendments to IAS 40)The IASB has amended the requirements in IAS 40 Investment property on when a company should transfer a property asset to, or from, investment property.
The adoption of this standard will not have an impact on the financial statements of the Company.
Prepayment Features with Negative Compensation (Amendments to IFRS 9)The amendments clarify that financial assets containing prepayment features with negative compensation can now be measured at amortised cost or at fair value through other comprehensive income (FVOCI) if they meet the other relevant requirements of IFRS 9.
The adoption of these changes will not affect the amounts and disclosures of the Company’s financial statements.
The amendments apply for annual periods beginning on or after 1 January 2019 with retrospective application, early adoption is permitted.
Long-term Interests in Associates and Joint Ventures (Amendment to IAS 28)The amendments clarify that an entity applies IFRS 9 to long-term interests in an associate and joint venture that form part of the net investment in the associate or joint venture but to which the equity method is not applied.
The adoption of these changes will not affect the amounts and disclosures of the Company’s financial statements.
3. SIGNIFICANT ACCOUNTING POLICIES (CONTINUED)(a)Changes in accounting policies and disclosures (continued)IFRIC 23 Clarification on accounting for Income tax exposures (continued)
NOTES TO THE FINANCIAL STATEMENTS FOR THE YEAR ENDED 31 DECEMBER 2017
87
Long-term Interests in Associates and Joint Ventures (Amendment to IAS 28) (continued)
The amendments apply for annual periods beginning on or after 1 January 2019. Early adoption is permitted.
Annual improvement cycle (2015 – 2017) – various standards
Standards Amendments
IFRS 3 Business Combinations and IFRS 11 Joint Arrangements
Clarifies how a company accounts for increasing its interest in a joint operation that meets the definition of a business. • If a party maintains (or obtains)
joint control, then the previously held interest is not remeasured.
• If a party obtains control, then the transaction is a business combination achieved in stages and the acquiring party remeasures the previously held interest at fair value.
IAS 12 Income taxes Clarify that all income tax consequences of dividends (including payments on financial instruments classified as equity) are recognised consistently with the transactions that generated the distributable profits – i.e. in profit or loss, OCI or equity.
IAS 23 Borrowing costs Clarify that the general borrowings pool used to calculate eligible borrowing costs excludes only borrowings that specifically finance qualifying assets that are still under development or construction. Borrowings that were intended to specifically finance qualifying assets that are now ready for their intended use or sale – or any non-qualifying assets – are included in that general pool.As the costs of retrospective application might outweigh the benefits, the changes are applied prospectively to borrowing costs incurred on or after the date an entity adopts the amendments.
The amendments are effective for annual reporting periods beginning on or after 1 January 2019 with earlier application permitted. The adoption of these amendments is not expected to affect the amounts and disclosures of the Group financial statements.
(b) Basis of consolidation
(i) SubsidiariesThe consolidated financial statements comprise the financial statements of the Group and its subsidiaries as at 31 December 2017. The subsidiaries are shown in Note 32.
Subsidiaries are entities controlled by the Group. Control exists when the Group has the power to govern the financial and operating policies of an entity so as to obtain benefits from its activities. In assessing control, potential voting rights that presently are exercisable are taken into account. The financial statements of subsidiaries are included in the consolidated financial statements from the date that control commences until the date that control ceases. The financial statements have been prepared using uniform accounting policies for like transactions and other events in similar circumstances.
Losses within a subsidiary are attributed to the non-controlling interest even if that results in a deficit balance. A change in the ownership interest of a subsidiary,
without a loss of control, is accounted for as an equity transaction. If the Group loses control over a subsidiary, it:
• Derecognises the assets (including goodwill) and liabilities of the subsidiary;• Derecognises the carrying amount of any non-controlling interest;• Derecognises the cumulative translation differences, recorded in equity;• Recognises the fair value of the consideration received;• Recognises the fair value of any investment retained. Subsequently, it is
accounted as an equity accounted investee or as an available-for-sale financial asset depending on the level of influence retained; and
• Recognises any surplus or deficit in profit or loss.
(ii) AssociateThe Group has an investment in an associate which is dormant.
Associates are entities in which the Group has significant influence, but not control, over the financial and operational policies. The Group’s investment in its associate is accounted for using the equity method and is recognized initially at cost.
The cost of the investment includes transaction costs. Subsequent to initial recognition, the financial statement includes the Group’s share of the profit or loss and other comprehensive income of equity accounted investee until the date in which significant influence ceases.
When the Group’s share of losses exceeds its interest in an equity accounted investee, the carrying amount of the investment including any long-term interests that form part thereof, is reduced to zero, and the recognition of further losses is discontinued except to the extent that the Group has an obligation or has made payments on behalf of the investee.
The Company’s investment in associate is accounted for at cost in its separate financial statements.
(iii) Loss of controlWhen the Group loses control over a subsidiary, it derecognizes the assets and liabilities of the subsidiary, and any related non-controlling interest and other components of equity.
3. SIGNIFICANT ACCOUNTING POLICIES (CONTINUED)(b) Basis of consolidation (continued)
NOTES TO THE FINANCIAL STATEMENTS FOR THE YEAR ENDED 31 DECEMBER 2017
KCB INTEGRATED REPORT AND FINANCIAL STATEMENTS | 2017
88
(iii) Loss of control (continued)Any resulting gain or loss is recognised in profit or loss. Any interest retained in the former subsidiary is measured at fair value when control is lost.
(iv) Transactions eliminated on consolidationIntra-group balances and transactions, and any unrealised income and expenses (except for foreign currency transaction gains or losses) arising from intra-group transactions, are eliminated in preparing the consolidated financial statements. Unrealised losses are eliminated in the same way as unrealised gains, but only to the extent that there is no evidence of impairment.
(c) Foreign currency translation
(i) Transactions and balancesForeign exchange gains and losses resulting from the settlement of such transactions and from the translation at year-end exchange rates of monetary assets and liabilities denominated in foreign currencies are recognized as profit or loss, except when deferred in other comprehensive income as qualifying cash flow hedges and qualifying net investment hedges.
Foreign exchange gains and losses that relate to borrowings and cash and cash equivalents are presented in the income statement within “finance income or costs”. All other foreign exchange gains and losses are presented in the statement of profit or loss for the year within “other gains/losses-net”.
Changes in the fair value of monetary securities denominated in foreign currency classified as available for sale are analysed between translation differences resulting from changes in the amortised cost of the security and other changes in the carrying amount of the security.
Translation differences related to changes in amortised cost are recognised in profit or loss, and other changes in carrying amount are recognised in other comprehensive income.Translation differences on non-monetary financial assets and liabilities such as equities held at fair value through profit or loss are recognised in profit or loss as part of the fair value gain or loss.
Translation differences on non-monetary financial assets, such as equities classified as available for sale, are included in other comprehensive income.
(ii) Group CompaniesThe results and financial position of all the group entities (one of which has the currency of a hyper-inflationary economy as at 31 December 2017) that have a functional currency different from the presentation currency are translated into the presentation currency as follows:
i. assets and liabilities of foreign subsidiaries are translated into Kenya Shillings at the rate of exchange ruling at the reporting date;
ii. income and expenses for each statement of comprehensive income are translated at the weighted average exchange rates for the period; and
iii. exchange differences arising on translation are recognised in other comprehensive income and accumulated in equity in the translation reserve. On disposal of a foreign entity, the deferred cumulative amount recognised in equity relating to that particular foreign operation is reclassified from equity to profit or loss when the gain or loss on disposal is recognised.
The financial statements for KCB Bank South Sudan Limited have been presented in line with IAS 29 for hyperinflationary economies. Judgment has been used in the various assumptions used such as the consumer price indices for the various years due to limitation of data available. Refer to Note 49.
(d) Recognition of income and expenseRevenue is recognised to the extent that it is probable that the economic benefits will flow to the Group and the revenue can be reliably measured. The following specific criteria must be met before revenue is recognised: (i) Interest income and expense Interest income and expense are recognised in profit or loss using the effective interest method. The ‘effective interest rate’ is the rate that discounts the estimated future cash payments and receipts through the expected life of the financial asset or financial liability (or, where appropriate, a shorter period) to the carrying asset or financial liability. When calculating effective interest rate, the Group estimates future cash-flows considering all contractual terms of the financial instrument, but not future credit losses.
The calculation of the effective interest rate includes transaction costs and fees and points paid or received that are an integral part of the effective interest rate. Transaction costs include incremental costs that are directly attributable to the acquisition or issue of a financial asset or liability.
Interest income and expense recognized in profit or loss include
• Interest on financial assets and financial liabilities measured at amortised cost calculated on an effective interest basis.
• Interest on available for sale investment securities calculated on an effective interest basis.
Interest income and expense on all trading assets and liabilities are considered to be incidental to the Group’s trading operations and are presented together with all other changes in the fair value through profit and loss in the income statement.
(ii) Dividend incomeDividend income is recognised when the Group’s right to receive payment is established, which in the case of quoted securities is the ex-dividend date.
(iii) Fees and commission incomeFees and commission income and expense are recognised on an accrual basis when the service has been provided. Commission and fees arising from negotiation of transactions with third parties, or participating in the negotiation of a transaction for a third party is recognised on completion of the underlying transaction. Fees and commission that are integral to the effective interest rate on a financial asset or liability are included in the measurement of the effective interest rate.
Other fees and commission income including account servicing fees, investment management fees, sales commission, placement fees and syndication fees, are recognised as the related services are performed. Other fees and commission expense relate mainly to transaction and services fee, which are expensed as the services are received.
(iv) Rental incomeRental income in respect of operating leases is accounted for on a straight-line basis over the lease terms on ongoing leases.
(v) Net trading incomeNet trading income comprises gains less losses related to trading assets and liabilities and includes all realised and unrealised fair value changes, interest and foreign exchange differences.
3. SIGNIFICANT ACCOUNTING POLICIES (CONTINUED)(b) Basis of consolidation(continued)
NOTES TO THE FINANCIAL STATEMENTS FOR THE YEAR ENDED 31 DECEMBER 2017
89
(e) Income tax Tax on the operating results for the year comprises current tax and deferred tax. Current tax and deferred tax are recognised in profit or loss except to the extent that they relate to items recognised directly in equity or in other comprehensive income.
Current tax is the expected tax payable or receivable on the taxable income or loss for the year, using tax rates enacted or substantively enacted at the reporting date, and any adjustments to tax payable in respect of previous years. Current tax is provided on the results in the year as shown in the financial statements adjusted in accordance with tax legislation.
Deferred tax is recognized in respect of temporary differences between carrying amounts of assets and liabilities for financial reporting purposes and the amounts used for taxation purposes. Deferred tax is not recognised for:
• temporary differences on the initial recognition of assets or liabilities in a transaction that is not a business combination and that affects neither accounting nor taxable profit or loss;
• temporary differences related to investments in subsidiaries to the extent that it is probable that they will not reverse in the foreseeable future; and
• taxable temporary differences arising on the initial recognition of goodwill.
Deferred tax assets and liabilities are offset if there is a legally enforceable right to offset current tax liabilities and assets, and they relate to taxes levied by the same tax authority on the same taxable entity, or on different tax entities, but they intend to settle current tax liabilities and assets on a net basis or their tax assets and liabilities will be realised simultaneously.
A deferred tax asset is recognised for unused tax losses and deductible temporary differences to the extent that it is probable that future taxable profit will be available against which the tax asset can be utilised. Deferred tax assets are reviewed at each reporting date and are reduced to the extent that it is no longer probable that the related tax benefit will be realised. Deferred tax is calculated on the basis of the tax rates enacted at the reporting date.
In determining the amount of current and deferred tax, the Group considers the impact of tax exposures, including whether additional taxes and interest may be due. This assessment relies on estimates and assumptions and may involve a series of judgments about future events. New information may become available that causes the Group to change its judgment regarding the adequacy of existing tax liabilities; such changes to tax liabilities would impact tax expense in the period in which such a determination is made.
(f) Financial assets and liabilities
(i) RecognitionThe Group initially recognises loans and advances, deposits and debt securities on the date at which they are originated. All other financial assets and liabilities (including assets designated at fair value through profit and loss) are initially recognised on the trade date at which the Group becomes a party to the contractual provision of the instrument.
A financial asset or liability is initially measured at fair value plus (for an item not subsequently measured at fair value through profit or loss) transaction costs that are directly attributable to its acquisition or issue.
Subsequent to initial recognition, financial liabilities (deposits and debt securities) are measured at their amortized cost using the effective interest method except where the group designates liabilities at fair value through profit and loss.
(ii) ClassificationFinancial assets The Group classifies its financial assets in one of the following categories:
• loans and receivables; • held to maturity; • available-for-sale; or
Management determines the classification of its investments at initial recognition.
Financial liabilities The Group classifies its financial liabilities, other than financial guarantees and loan commitments, as measured at amortized cost or fair value through profit or loss.
Loans and receivablesLoans and receivables are non-derivative financial assets with fixed or determinable payments that are not quoted in an active market. They arise when the Group provides money directly to a debtor with no intention of trading the receivable. These include mortgage and advances to customers, staff loans and placements with other banks. Loans and advances are subsequently measured at their amortised cost using the effective interest method.
Held-to-maturityHeld-to-maturity investments are non-derivative financial assets with fixed or determinable payments and fixed maturities that the Group’s management has the positive intention and ability to hold to maturity. If the Group were to sell other than an insignificant amount of held-to-maturity assets, the entire category would be tainted and reclassified as available for sale. These include treasury bills, treasury bonds and government stock. Subsequent to initial recognition, held to maturity financial assets are measured at amortised cost using the effective interest method, less any impairment losses. Available-for-saleAvailable-for-sale financial assets are those non-derivative financial assets that are designated as available for sale or are not classified as (a) loans and receivables (b) held-to-maturity or (c) financial assets at fair value through profit and loss.
Subsequent to initial recognition, they are measured at fair value and changes therein, other than impairment losses and foreign currency differences on available for sale debt instruments are recognized in other comprehensive income and presented in the fair value reserve in equity. When an investment is derecognized, the gain or loss accumulated in equity is re-classified to profit or loss.
Other financial liabilitiesThe Group classifies financial liabilities other than financial guarantees and loan commitments at fair value less any directly attributable transaction costs. Subsequent to initial recognition these liabilities are measured at amortised cost using the effective interest rate method. (iii) Identification and measurement of impairment of financial assetsAt each reporting date the Group assesses whether there is objective evidence that financial assets not carried at fair value through profit or loss are impaired. Financial assets are impaired when objective evidence demonstrates that a loss event has occurred after the initial recognition of the asset, and that the loss event has an impact on the future cash flows on the asset than can be estimated reliably.
The Group considers evidence of impairment at both a specific asset and collective level. All individually significant financial assets are assessed for specific impairment. All significant assets found not to be specifically impaired are then
3. SIGNIFICANT ACCOUNTING POLICIES (CONTINUED)
NOTES TO THE FINANCIAL STATEMENTS FOR THE YEAR ENDED 31 DECEMBER 2017
KCB INTEGRATED REPORT AND FINANCIAL STATEMENTS | 2017
90
(iii) Identification and measurement of impairment of financial assets (continued)collectively assessed for any impairment that has been incurred but not yet identified. Assets that are not individually significant are then collectively assessed for impairment by grouping together financial assets (carried at amortised cost) with similar risk characteristics.
Objective evidence that financial assets (including equity securities) are impaired can include default or delinquency by a borrower, restructuring of a loan or advance by the Group on terms that the Group would otherwise not consider, indications that a borrower or issuer will enter bankruptcy, the disappearance of an active market for a security, or other observable data relating to a group of assets such as adverse changes in the payment status of borrowers or issuers in the group, or economic conditions that correlate with defaults in the group.
In assessing collective impairment the Group uses historical trends of the probability of default, timing of recoveries and the amount of loss incurred, adjusted for management’s judgement as to whether current economic and credit conditions are such that the actual losses are likely to be greater or less than suggested by historical trends. Default rate, loss rates and the expected timing of future recoveries are regularly benchmarked against actual outcomes to ensure that they remain appropriate.
Impairment losses on assets carried at amortised cost are measured as the difference between the carrying amount of the financial assets and the present value of estimated cash flows discounted at the assets’ original effective interest rate. Losses are recognised in profit or loss and reflected in an allowance account
against loans and advances. Interest on the impaired asset continues to be recognised through the unwinding of the discount.
When a subsequent event causes the amount of impairment loss to decrease, the impairment loss is reversed through profit or loss.
Impairment losses on available-for-sale investment securities are recognised by transferring the difference between the amortised acquisition cost and current fair value out of equity to the profit or loss. Changes in cumulative impairment losses attributable to the effective interest method are reflected as a component of interest income. When a subsequent event causes the amount of impairment loss on an available-for-sale debt security to decrease, the impairment loss is reversed through profit or loss. However, any subsequent recovery in the fair value of an impaired available-for-sale equity security is recognised in other comprehensive income directly in equity. (iv) DerecognitionThe Group derecognises a financial asset when the contractual rights to the cash flows from the financial asset expire, or when it transfers the rights to receive the contractual cash flows on the financial asset in a transaction in which substantially all the risks and rewards of ownership of the financial asset are transferred. Any interest in transferred financial assets that is created or retained by the Group is recognised as a separate asset or liability.
The Group derecognises a financial liability when its contractual obligations are discharged or cancelled or expire.
The Group enters into transactions whereby it transfers assets recognised on its statement of financial position, but retains either all or substantially all of the risks and rewards of the transferred assets or a portion of them. If all or substantially all
risks and rewards are retained, then the transferred assets are not derecognised from the statement of financial position. Transfers of assets with retention of all or substantially all risks and rewards include, for example, securities lending and repurchase transactions.
(v) Offsetting Financial assets and liabilities are offset and the net amount presented in the statement of financial position when, and only when, the Group has a legal right to set off the amounts and it intends either to settle them on a net basis or to realise the asset and settle the liability simultaneously.
Income and expenses are presented on a net basis only when permitted under IFRS, or for gains and losses arising from a group of similar transactions such as in the Group’s trading activity.
(g) Impairment for non-financial assetsThe carrying amounts of the Group’s non-financial assets, other than deferred tax assets, are reviewed at each reporting date to determine whether there is any indication of impairment. If any such indication exists then the assets’ recoverable amount is estimated.
The recoverable amount of an asset or cash-generating unit is the greater of its value in use and its fair value less costs to sell. In assessing value in use, the estimated future cash flows are discounted to their present value using a pre-tax discount rate that reflects current market assessments of the time value of money and the risks specific to the asset.An impairment loss is recognised if the carrying amount of an asset or its cash-generating unit exceeds its recoverable amount. A cash-generating unit is the smallest identifiable asset group that generates cash flows that largely are independent from other assets and groups. Impairment losses are recognised in the profit or loss. Impairment losses recognised in respect of cash-generating units are allocated first to reduce the carrying amount of any goodwill allocated to the units and then to reduce the carrying amount of the other assets in the unit (group of units) on a pro-rata basis.
(h) Cash and cash equivalentsCash and cash equivalents comprise balances with less than three months maturity from the date of acquisition, including: notes and coins on hand, unrestricted balances deposited with the Central Bank of Kenya and highly liquid assets, subject to insignificant risk of changes in their fair value and are used in the Group in the management of short term commitments.
Cash and cash equivalents are measured at amortized cost using effective interest method in the statement of financial position.
(i) Property and equipment
(i) Recognition and measurementItems of property and equipment are measured at cost, less accumulated depreciation and accumulated impairment losses. Costs include expenditure that is directly attributable to the acquisition of the asset. Purchased software that is integral to the functionality of the related equipment is capitalized as part of that equipment.
Property and equipment is derecognised upon disposal or when no future economic benefits are expected to arise from the continued use of the asset. Gains and losses arising on disposal of an item of property and equipment are determined by comparing the net proceeds from disposal with the carrying amount of the item and are recognised net within ‘other operating income’ in profit or loss.
3. SIGNIFICANT ACCOUNTING POLICIES (CONTINUED)(f) Financial assets and liabilities (continued)
NOTES TO THE FINANCIAL STATEMENTS FOR THE YEAR ENDED 31 DECEMBER 2017
91
(ii) DepreciationDepreciation is recognised in profit or loss on a straight line basis over the estimated useful lives of each part of property and equipment. The annual depreciation rates in use are:
Freehold land NilLeasehold improvements Rates based on the shorter of the lease term or estimated useful lives Motor vehicles 25%Furniture and fittings 10%Office equipment 20%Computers 20%
The residual values, useful lives and methods of depreciation are reviewed, and adjusted if appropriate, at each reporting date. Changes in the expected useful life, residual values or methods of depreciation are accounted for as changes in accounting estimates.
(iii) Subsequent costsSubsequent expenditure is capitalized only when it is probable that future economic benefits of the expenditure will flow to the Group. Recurrence repairs and maintenance are expensed as incurred.
(j) Intangible assets Intangible assets acquired separately are measured on initial recognition at cost. The cost of intangible assets acquired in a business combination is the fair value as at the date of acquisition. Following initial recognition, intangible assets are measured at cost less any accumulated amortization and any accumulated impairment losses. Internally generated intangible assets, excluding capitalized development costs, are not capitalized and expenditure is recognised in profit or loss in the year in which the expenditure is incurred.Intangible assets with finite lives are amortized on a straight-line basis in profit or loss over their estimated useful economic lives, from the date that they are available for use.
The amortization method, useful life and the residual value are reviewed at each reporting date and adjusted if appropriate. Changes in the expected useful life, residual value or amortization method are accounted for as changes in accounting estimates. The amortization expense on intangible assets with finite lives is recognised in profit or loss in the expense category consistent with the function of the intangible asset.
The useful lives of intangible assets are assessed to be either finite or indefinite. Costs associated with maintaining computer software programmes are recognised as an expense as incurred. However, expenditure that enhances or extends the benefits of computer software programmes beyond their original specifications and lives is recognised as a capital improvement and added to the original cost of the software. Computer software development costs recognised as assets are amortized using the straight-line method over a period of five years.
There are no intangible assets with indefinite useful lives. (k) LeasesLeases, where a significant portion of the risks and rewards of ownership are retained by the lessor, are classified as operating leases. Payments made under operating leases are charged to the profit and loss account on a straight-line basis over the period of the lease.
Where the Group is a lessor, it presents assets subject to operating leases in Statement of Financial Position according to the nature of the asset. Lease income from operating leases is recognised in income on a straight line basis over the lease term. Costs, including depreciation, incurred in earning the lease income are recognised as an expense.
Leases where substantially all the risks and rewards of ownership of an asset are transferred to the lessee are classified as finance leases. Upon recognition, the leased asset is measured at an amount equal to the lower of its fair value and the present value of the minimum lease payments. Subsequent to initial recognition, the asset is accounted for in accordance with the accounting policy applicable to that asset as follows:
(i) Operating leaseThe total payments made under operating leases are charged to profit or loss on a straight-line basis over the period of the lease. When an operating lease is terminated before the lease period has expired, any payment required to be made to the lessor by way of penalty is recognised as an expense in the period in which termination taKshs. place.
(ii) Finance leaseWhen assets are held subject to a finance lease, the present value of the lease payments is recognised as a receivable. The difference between the gross receivable and the present value of the receivable is recognised as unearned finance income. Lease income is recognised over the term of the lease using the net investment method, which reflects a constant periodic rate of return.
(l) Employee benefitsThe Group operates both a defined contribution plan and defined benefit plan.
(i) Defined contribution plansA defined contribution plan is a post-employment benefit plan under which the Group pays fixed contributions into a separate entity and has no legal or constructive obligation to pay further amounts. Obligations for contributions to defined contribution plans are recognised as staff costs in profit or loss in the periods during which related services are rendered. Prepaid contributions are recognised as an asset to the extent that a cash refund or a reduction in future payments is available.
The Group also contributes to the statutory defined contribution in the various countries in which it operates. The Group’s contribution to these schemes are charged to the income statement. (ii) Defined benefit plans The Group’s net obligation in respect of defined benefit plan is calculated separately for each plan by estimating the amount of future benefit that employees have earned in the current and prior periods, discounting that amount and deducting the fair value of any plan assets. The calculation of defined benefit obligation is performed annually by a qualified actuary using the projected unit credit method. When the calculation results in a potential asset for the Group, the recognised asset is limited to the present value of the economic benefits available in the form of any refunds from the plan or deductions in future contributions to the plan. To calculate the present value of economic benefits, consideration is given to any applicable minimum funding requirements.
Remeasurements of the net defined benefit liability, which compromise actuarial gains and losses, the return on plan assets (excluding interest) and the effect of the asset ceiling (if any, excluding interest) are recognised immediately in other comprehensive income. The Group determines the net interest (income) on the net
3. SIGNIFICANT ACCOUNTING POLICIES (CONTINUED)(i) Property and equipment (continued)
NOTES TO THE FINANCIAL STATEMENTS FOR THE YEAR ENDED 31 DECEMBER 2017
KCB INTEGRATED REPORT AND FINANCIAL STATEMENTS | 2017
92
(ii) Defined benefit plans (continued)defined benefit liability (asset) for the period by applying the discount rate used to measure the defined obligation at the beginning of the annual period to the then-net defined benefit liability (asset), taking into account any changes in the net defined benefit liability (asset) during a period as a result of contributions and benefit payments. Net interest expense and other expenses related to the defined benefit plans are recognised in profit or loss.
When the benefits of a plan are changed or when a plan is curtailed, the resulting change in benefit that employees have earned in return for their service or the gain or loss on curtailment is recognised immediately in profit or loss. The Group recognises gains and losses on settlement of a defined benefit plan when the settlement occurs.
(iii) Other long term employee benefitsThe Group’s net obligation in respect of long-term employee benefits other than pension plans is the amount of future benefit that employees have earned in return for their service in the current and prior periods. That benefit is discounted to determine its present value. Remeasurements are recognised in profit or loss in the periods in which they arise.
(iv) Short-term benefitsShort-term benefits consist of salaries, bonuses and any non-monetary benefits such as medical aid contributions and free services. They exclude equity based benefits and termination benefits. Short-term employee benefit obligations are measured on an undiscounted basis and are expensed as the related service is provided.
A liability is recognised for the amount expected to be paid under short-term cash bonus or profit-sharing plans if the Group has a present legal or constructive obligation to pay this amount as a result of past service provided by the employee and the obligation can be estimated reliably. (v) Termination benefitsTermination benefits are expensed at the earlier of when the Group can no longer withdraw the offer of those benefits and when the Group recognises costs for a restructuring. If benefits are not expected to be settled wholly within 12 months of the end of the reporting period, then they are discounted.
(m) Fiduciary assetsWhen the Group acts in a fiduciary capacity such as a nominee or agent, assets and income arising thereon with related undertakings to return such assets to customers are excluded from these financial statements.
(n) Contingent liabilitiesLetters of credit, acceptances, guarantees and performance bonds are disclosed as contingent liabilities. Estimates of the outcome and the financial effect of contingent liabilities is made by management based on the information available up to the date that the financial statements are approved for issue by the Directors.
(o) Earnings per shareBasic and diluted earnings per share (EPS) data for ordinary shares are presented in the financial statements. Basic EPS is calculated by dividing the profit or loss attributable to ordinary shareholders of the Company by the weighted average number of ordinary shares outstanding during the period. Diluted EPS is determined by adjusting the profit or loss attributable to ordinary shareholders and the weighted average number of ordinary shares outstanding for the effects of all dilutive potential ordinary shares, if any.
(p) DividendsDividends are recognised as a liability in the period in which they are declared.
(q) Sale and repurchase agreementsSecurities sold under sale and repurchase agreements (Repos) are retained in the financial statements with the counterparty liability included in amounts due to banking institutions.
Securities purchased from the Central Bank of Kenya under agreement to resell (reverse Repos), are disclosed as treasury bills as they are held to maturity after which they are repurchased and are not negotiable or discounted during the tenure.
The difference between sale and repurchase price is treated as interest and accrued over the life of the agreements using the effective interest method.
(r) Related partiesIn the normal course of business, the Company has entered into transactions with related parties. The related party transactions are at arm’s length.
(s) Operating segmentsAn operating segment is a component of the Group that engages in business activities from which it may earn revenues and incur expenses, including revenues and expenses that relate to transactions with any of the Group’s other components, whose operating results are reviewed regularly by the Group’s Management Committee (being the chief operating decision maker) to make decisions about resources allocated to each segment and assess its performance, and for which discrete financial information is available.
(t) Share capital and reserveOrdinary shares are classified as share capital in equity. Any premium received over and above the par value of the shares is classified as share premium.
4. FINANCIAL RISK MANAGEMENTThe Group’s activities expose it to a variety of financial risks, including credit risk, liquidity risk, market risks and operational risks. The Group’s overall risk management program focuses on the unpredictability of financial markets and seeks to minimize potential adverse effects on the Group’s financial performance. The Board of Directors has overall responsibility for the establishment and oversight of the Group’s risk management framework. The Board of Directors of the Group has established the Credit, Audit, Risk, Human Resources and Procurement and Information Technology committees, which are responsible for developing and monitoring the Group risk management policies in their specified areas. All Board committees have both executive and non-executive members and report regularly to the Board of Directors on their activities.
The Group’s risk management policies are established to identify and analyze the risks faced by the Group, to set appropriate risk limits and controls and to monitor risks and adherence to limits.
Risk management policies and systems are reviewed regularly to reflect changes in market conditions, products and services offered. The Group, through its training and management standards and procedures, aims to develop a disciplined and constructive control environment in which all employees understand their roles and obligations.
The Risk Committee is responsible for monitoring compliance with the Group’s risk management policies and procedures and for reviewing the adequacy of
3. SIGNIFICANT ACCOUNTING POLICIES (CONTINUED)(l) Employee benefits (continued)
NOTES TO THE FINANCIAL STATEMENTS FOR THE YEAR ENDED 31 DECEMBER 2017
93
the risk management framework in relation to the risks faced by the Group. The Committee is assisted in these functions by a Risk and Compliance department which undertake reviews of risk management controls and procedures, the results of which are reported to the Risk Committee.
(a) Credit riskCredit risk is the risk of suffering financial loss, should any of the Group’s customers, clients or market counterparties fail to fulfil their contractual obligations to the Group. Credit risk arises mainly from commercial and consumer loans and advances, credit cards, and loan commitments arising from such lending activities, but can also arise from credit enhancement provided, financial guarantees, letters of credit, endorsements and acceptances. For risk management reporting purposes, the Group considers and consolidates all elements of credit risk exposure.
The Company is also exposed to other credit risks arising from investments in debt securities and other exposures arising from its trading activities (‘trading exposures’), including non-equity trading portfolio assets and settlement balances with market counterparties and reverse repurchase loans.
(i) Governance and oversightThe Board of Directors has delegated responsibility for the management of credit risk to its Board Credit Committee. Credit Division, reporting to the Board Credit Committee, is responsible for the day-to-day management of credit risk, while the Group Risk Committee is responsible for independent credit risk oversight., including:
• Formulating credit policies in consultation with business units, covering collateral requirements, credit assessment, risk grading and reporting, documentary and legal procedures, and compliance with regulatory and statutory requirements;
• Periodically reviewing the credit risk strategy, credit risk management policies, and the underlying credit risk management process of the Group as a whole, including the Group’s tolerance or appetite for credit risk;
• Establishing the authorization structure for the approval and renewal of credit facilities. Authorization limits are allocated to business unit credit managers. Larger facilities require approval by the Board;
• Reviewing and assessing credit risk. The credit department assesses all credit exposures in excess of designated limits, prior to facilities being committed to customers by the business unit concerned. Renewals and reviews of facilities are subject to the same review process;
• Limiting concentrations of exposure to counterparties, geographies and industries (for loans and advances), and by issuer, credit rating band, market liquidity and country (for investment securities);
• Developing and maintaining the Group’s risk grading in order to categorize exposures according to the degree of risk of financial loss faced and to focus management on the attendant risks. The risk grading system is used in determining where impairment provisions may be required against specific credit exposures;
• Regular audits of business units and the Group’s credit processes are undertaken by Internal Audit Department.
The Credit Risk Management Committee is responsible for reviewing the Group’s credit risk strategy and overseeing the implementation of the Credit Risk Management policies, standards and practices as well as providing advice, guidance and specialist skills to business units to promote best practice throughout the Group in the management of credit risk. The committee also regularly reviews and reports on the quality of the Company’s loan portfolio and compliance of business units with agreed exposure limits, including those for selected industries and product types.
(ii) Management and monitoringThe credit risk management framework enables the Company to manage credit risk within the limits of its evolving risk appetite, develop risk-response strategies and optimise risk-taking by anticipating and acting on potential opportunities or threats. Specifically, it relies on the Company’s well-established dual control structure, sound credit processes and clear delegation of decision-making authority, amongst other considerations, for the approval of loans.
Credit risk exposures are managed through the Company’s robust credit assessment, structuring and monitoring process. The latter, under the responsibility of the Credit Division, involves the daily monitoring of credit limit excesses as well as the review of all exposures, the frequency of which is increased in accordance to the size and likelihood of potential credit losses to ensure the timely detection of possible default loans. Exposures showing signs of deterioration are placed on early alert list for closer monitoring where appropriate. The risk division is responsible for independent risk portfolio monitoring and risk measurement methodologies.
(iii) Credit risk measurementCredit risk measurement consists of appraising the track record of customers as appropriate for the prediction of the likely future behaviour of existing accounts for ongoing credit risk management. Ultimately, the Company assesses whether individual business areas provide sufficient contribution to the targeted risk-return profile, with the aim to ensure that capital allocation generates an optimum return for the Company. This is achieved by channeling risk capital away from low-return to high-return business areas, in a manner commensurate with the risks assumed.
The Group’s rating grades reflect the range of parameters developed to predict the default probabilities of each rating class in line with international best Practices and in compliance with regulatory requirements. The suitability of the classification of the debt and of the collectible amount is examined by Credit Division.
The Group’s ratings scale is as follows:
Grade 1 - Normal riskGrade 2 - Watch riskGrade 3 - Sub-standard riskGrade 4 - Doubtful risk Grade 5 – Loss
The Group also assesses the probability of default of customer or counterparty using internal rating scale tailored to the various categories of counter party as described below;
Retail Retail credit comprising mainly residential mortgages, unsecured loans and credit cards are managed on a portfolio basis and assessed, based on credit scoring models, records from the Credit Reference Bureaus, customers’ behavioral records, as well as the application of relevant risk acceptance criteria. To ensure the robustness and adequacy of the scoring models, the Risk Division independently conducts formal validation of those models. In collaboration with the Credit Division, Risk regularly analyses default trends, identifies the underlying root causes and subsequently and where applicable results in appraisal of the credit scoring parameters.
Corporate Large corporate credits are assessed using credit softwares which evaluates the counterparty’s financial standing and specific non-quantitative factors such as industry risk, access to funding, market standing and management strength. The
4. FINANCIAL RISK MANAGEMENT (CONTINUED)
NOTES TO THE FINANCIAL STATEMENTS FOR THE YEAR ENDED 31 DECEMBER 2017
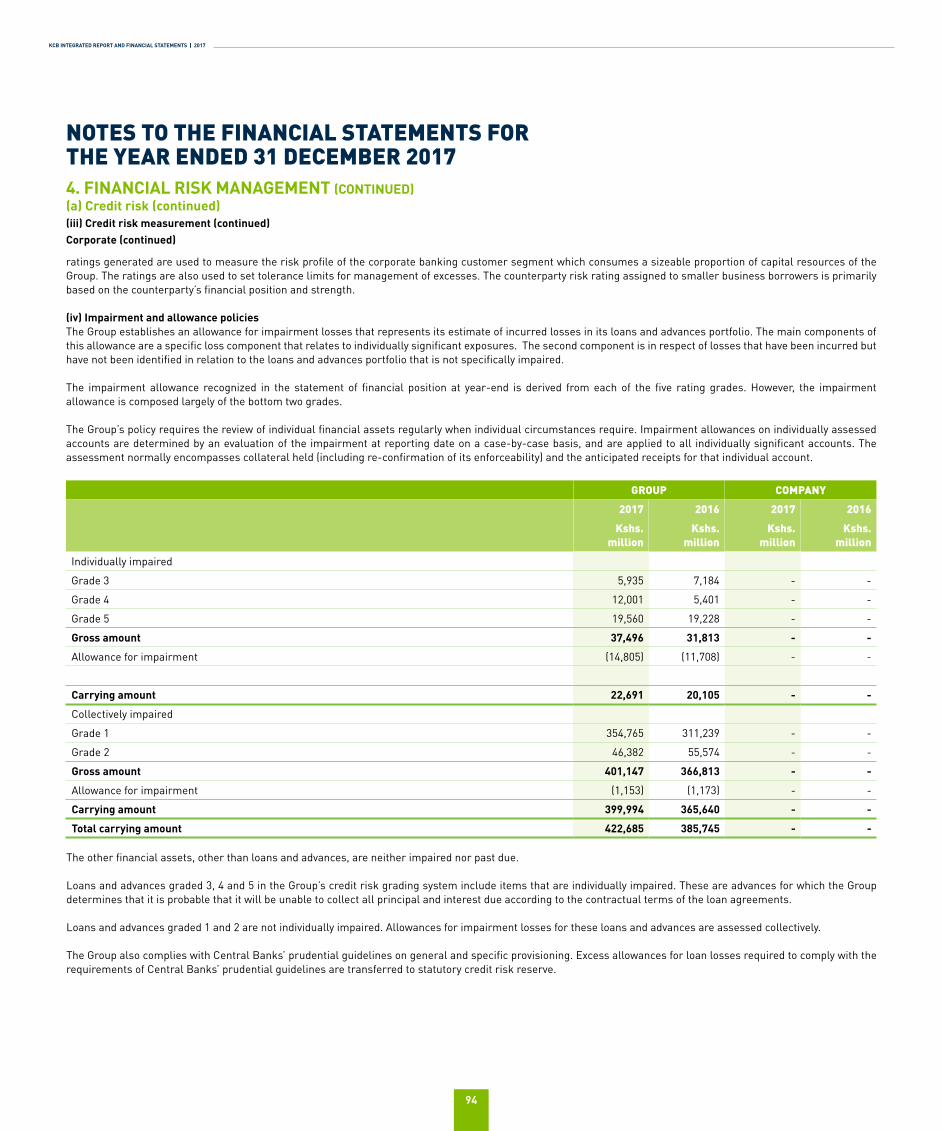
KCB INTEGRATED REPORT AND FINANCIAL STATEMENTS | 2017
94
ratings generated are used to measure the risk profile of the corporate banking customer segment which consumes a sizeable proportion of capital resources of the Group. The ratings are also used to set tolerance limits for management of excesses. The counterparty risk rating assigned to smaller business borrowers is primarily based on the counterparty’s financial position and strength.
(iv) Impairment and allowance policiesThe Group establishes an allowance for impairment losses that represents its estimate of incurred losses in its loans and advances portfolio. The main components of this allowance are a specific loss component that relates to individually significant exposures. The second component is in respect of losses that have been incurred but have not been identified in relation to the loans and advances portfolio that is not specifically impaired.
The impairment allowance recognized in the statement of financial position at year-end is derived from each of the five rating grades. However, the impairment allowance is composed largely of the bottom two grades.
The Group’s policy requires the review of individual financial assets regularly when individual circumstances require. Impairment allowances on individually assessed accounts are determined by an evaluation of the impairment at reporting date on a case-by-case basis, and are applied to all individually significant accounts. The assessment normally encompasses collateral held (including re-confirmation of its enforceability) and the anticipated receipts for that individual account.
GROUP COMPANY
2017 2016 2017 2016
Kshs. million
Kshs. million
Kshs. million
Kshs. million
Individually impaired
Grade 3 5,935 7,184 - -
Grade 4 12,001 5,401 - -
Grade 5 19,560 19,228 - -
Gross amount 37,496 31,813 - -
Allowance for impairment (14,805) (11,708) - -
Carrying amount 22,691 20,105 - -
Collectively impaired
Grade 1 354,765 311,239 - -
Grade 2 46,382 55,574 - -
Gross amount 401,147 366,813 - -
Allowance for impairment (1,153) (1,173) - -
Carrying amount 399,994 365,640 - -
Total carrying amount 422,685 385,745 - -
The other financial assets, other than loans and advances, are neither impaired nor past due.
Loans and advances graded 3, 4 and 5 in the Group’s credit risk grading system include items that are individually impaired. These are advances for which the Group determines that it is probable that it will be unable to collect all principal and interest due according to the contractual terms of the loan agreements.
Loans and advances graded 1 and 2 are not individually impaired. Allowances for impairment losses for these loans and advances are assessed collectively.
The Group also complies with Central Banks’ prudential guidelines on general and specific provisioning. Excess allowances for loan losses required to comply with the requirements of Central Banks’ prudential guidelines are transferred to statutory credit risk reserve.
4. FINANCIAL RISK MANAGEMENT (CONTINUED)(a) Credit risk (continued)(iii) Credit risk measurement (continued)Corporate (continued)
NOTES TO THE FINANCIAL STATEMENTS FOR THE YEAR ENDED 31 DECEMBER 2017
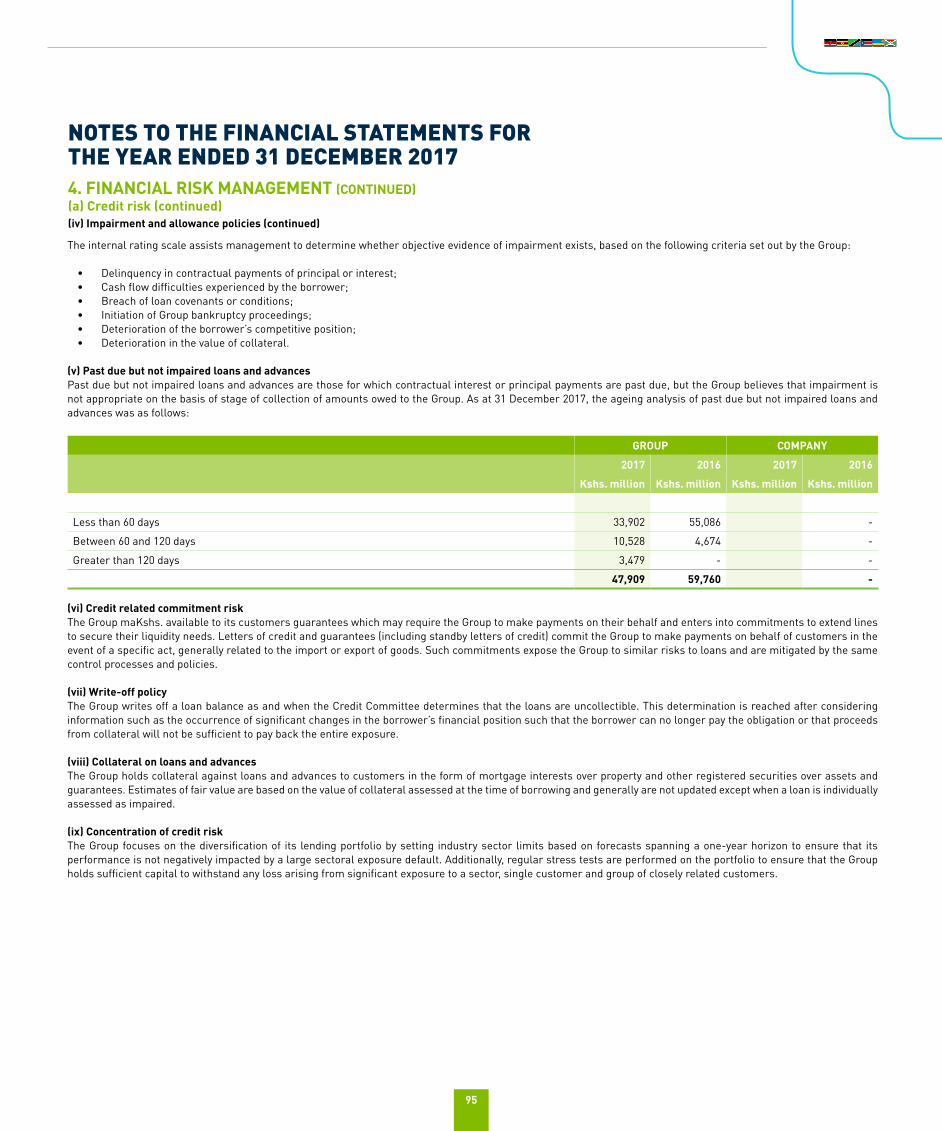
95
The internal rating scale assists management to determine whether objective evidence of impairment exists, based on the following criteria set out by the Group:
• Delinquency in contractual payments of principal or interest;• Cash flow difficulties experienced by the borrower;• Breach of loan covenants or conditions;• Initiation of Group bankruptcy proceedings;• Deterioration of the borrower’s competitive position;• Deterioration in the value of collateral.
(v) Past due but not impaired loans and advancesPast due but not impaired loans and advances are those for which contractual interest or principal payments are past due, but the Group believes that impairment is not appropriate on the basis of stage of collection of amounts owed to the Group. As at 31 December 2017, the ageing analysis of past due but not impaired loans and advances was as follows:
GROUP COMPANY
2017 2016 2017 2016
Kshs. million Kshs. million Kshs. million Kshs. million
Less than 60 days 33,902 55,086 -
Between 60 and 120 days 10,528 4,674 -
Greater than 120 days 3,479 - -
47,909 59,760 -
(vi) Credit related commitment riskThe Group maKshs. available to its customers guarantees which may require the Group to make payments on their behalf and enters into commitments to extend lines to secure their liquidity needs. Letters of credit and guarantees (including standby letters of credit) commit the Group to make payments on behalf of customers in the event of a specific act, generally related to the import or export of goods. Such commitments expose the Group to similar risks to loans and are mitigated by the same control processes and policies.
(vii) Write-off policyThe Group writes off a loan balance as and when the Credit Committee determines that the loans are uncollectible. This determination is reached after considering information such as the occurrence of significant changes in the borrower’s financial position such that the borrower can no longer pay the obligation or that proceeds from collateral will not be sufficient to pay back the entire exposure.
(viii) Collateral on loans and advancesThe Group holds collateral against loans and advances to customers in the form of mortgage interests over property and other registered securities over assets and guarantees. Estimates of fair value are based on the value of collateral assessed at the time of borrowing and generally are not updated except when a loan is individually assessed as impaired.
(ix) Concentration of credit riskThe Group focuses on the diversification of its lending portfolio by setting industry sector limits based on forecasts spanning a one-year horizon to ensure that its performance is not negatively impacted by a large sectoral exposure default. Additionally, regular stress tests are performed on the portfolio to ensure that the Group holds sufficient capital to withstand any loss arising from significant exposure to a sector, single customer and group of closely related customers.
4. FINANCIAL RISK MANAGEMENT (CONTINUED)(a) Credit risk (continued)(iv) Impairment and allowance policies (continued)
NOTES TO THE FINANCIAL STATEMENTS FOR THE YEAR ENDED 31 DECEMBER 2017
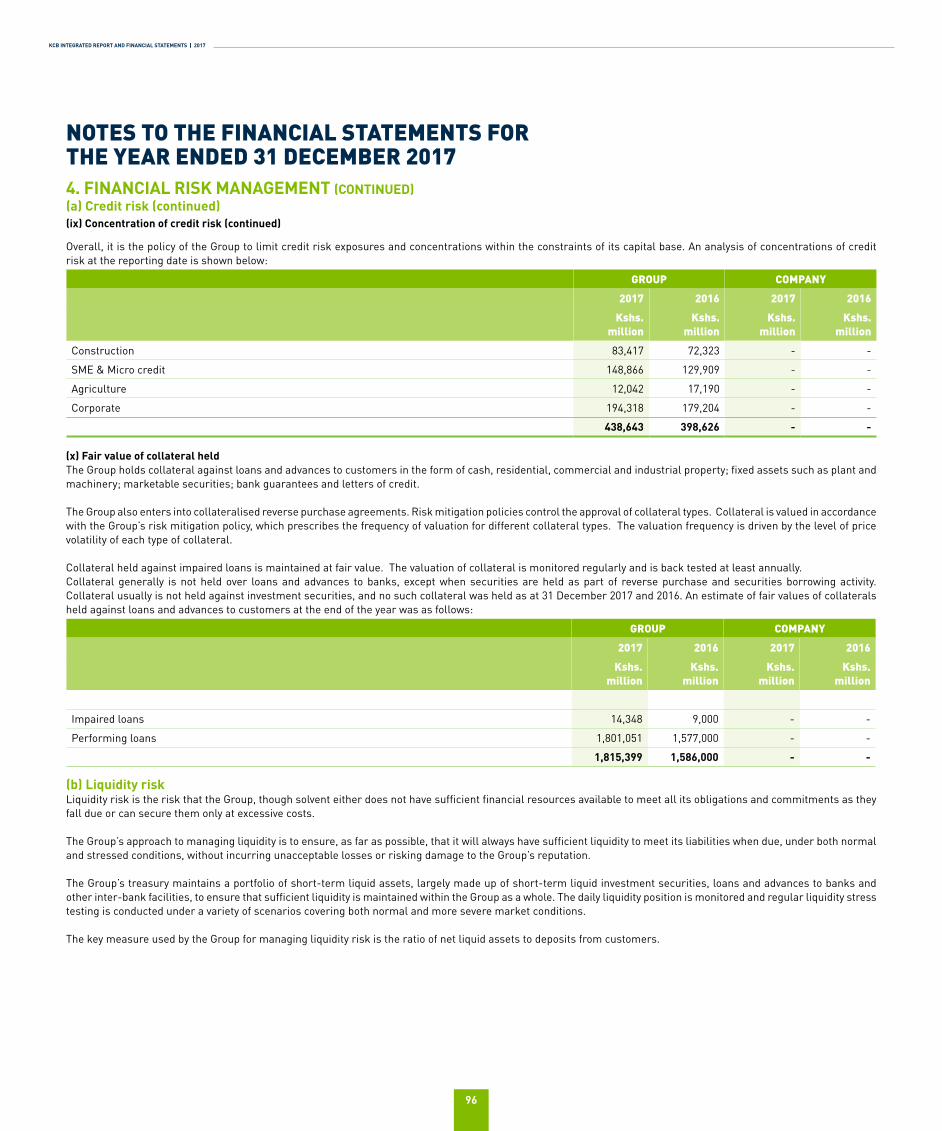
KCB INTEGRATED REPORT AND FINANCIAL STATEMENTS | 2017
96
Overall, it is the policy of the Group to limit credit risk exposures and concentrations within the constraints of its capital base. An analysis of concentrations of credit risk at the reporting date is shown below:
GROUP COMPANY
2017 2016 2017 2016
Kshs. million
Kshs. million
Kshs. million
Kshs. million
Construction 83,417 72,323 - -
SME & Micro credit 148,866 129,909 - -
Agriculture 12,042 17,190 - -
Corporate 194,318 179,204 - -
438,643 398,626 - -
(x) Fair value of collateral held The Group holds collateral against loans and advances to customers in the form of cash, residential, commercial and industrial property; fixed assets such as plant and machinery; marketable securities; bank guarantees and letters of credit.
The Group also enters into collateralised reverse purchase agreements. Risk mitigation policies control the approval of collateral types. Collateral is valued in accordance with the Group’s risk mitigation policy, which prescribes the frequency of valuation for different collateral types. The valuation frequency is driven by the level of price volatility of each type of collateral.
Collateral held against impaired loans is maintained at fair value. The valuation of collateral is monitored regularly and is back tested at least annually.Collateral generally is not held over loans and advances to banks, except when securities are held as part of reverse purchase and securities borrowing activity. Collateral usually is not held against investment securities, and no such collateral was held as at 31 December 2017 and 2016. An estimate of fair values of collaterals held against loans and advances to customers at the end of the year was as follows:
GROUP COMPANY
2017 2016 2017 2016
Kshs. million
Kshs. million
Kshs. million
Kshs. million
Impaired loans 14,348 9,000 - -
Performing loans 1,801,051 1,577,000 - -
1,815,399 1,586,000 - -
(b) Liquidity riskLiquidity risk is the risk that the Group, though solvent either does not have sufficient financial resources available to meet all its obligations and commitments as they fall due or can secure them only at excessive costs.
The Group’s approach to managing liquidity is to ensure, as far as possible, that it will always have sufficient liquidity to meet its liabilities when due, under both normal and stressed conditions, without incurring unacceptable losses or risking damage to the Group’s reputation.
The Group’s treasury maintains a portfolio of short-term liquid assets, largely made up of short-term liquid investment securities, loans and advances to banks and other inter-bank facilities, to ensure that sufficient liquidity is maintained within the Group as a whole. The daily liquidity position is monitored and regular liquidity stress testing is conducted under a variety of scenarios covering both normal and more severe market conditions.
The key measure used by the Group for managing liquidity risk is the ratio of net liquid assets to deposits from customers.
4. FINANCIAL RISK MANAGEMENT (CONTINUED)(a) Credit risk (continued)(ix) Concentration of credit risk (continued)
NOTES TO THE FINANCIAL STATEMENTS FOR THE YEAR ENDED 31 DECEMBER 2017
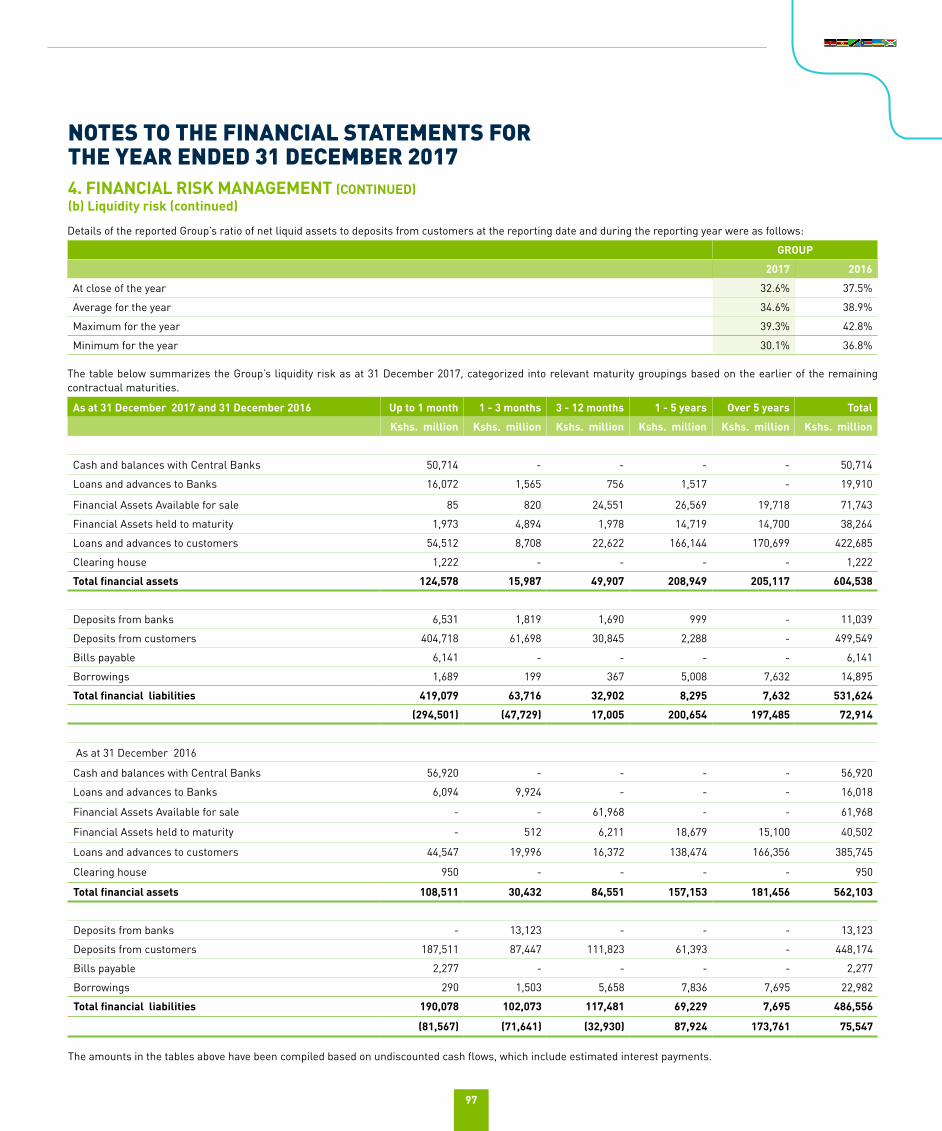
97
Details of the reported Group’s ratio of net liquid assets to deposits from customers at the reporting date and during the reporting year were as follows:
GROUP
2017 2016
At close of the year 32.6% 37.5%
Average for the year 34.6% 38.9%
Maximum for the year 39.3% 42.8%
Minimum for the year 30.1% 36.8%
The table below summarizes the Group’s liquidity risk as at 31 December 2017, categorized into relevant maturity groupings based on the earlier of the remaining contractual maturities.
As at 31 December 2017 and 31 December 2016 Up to 1 month 1 - 3 months 3 - 12 months 1 - 5 years Over 5 years Total
Kshs. million Kshs. million Kshs. million Kshs. million Kshs. million Kshs. million
Cash and balances with Central Banks 50,714 - - - - 50,714
Loans and advances to Banks 16,072 1,565 756 1,517 - 19,910
Financial Assets Available for sale 85 820 24,551 26,569 19,718 71,743
Financial Assets held to maturity 1,973 4,894 1,978 14,719 14,700 38,264
Loans and advances to customers 54,512 8,708 22,622 166,144 170,699 422,685
Clearing house 1,222 - - - - 1,222
Total financial assets 124,578 15,987 49,907 208,949 205,117 604,538
Deposits from banks 6,531 1,819 1,690 999 - 11,039
Deposits from customers 404,718 61,698 30,845 2,288 - 499,549
Bills payable 6,141 - - - - 6,141
Borrowings 1,689 199 367 5,008 7,632 14,895
Total financial liabilities 419,079 63,716 32,902 8,295 7,632 531,624
(294,501) (47,729) 17,005 200,654 197,485 72,914
As at 31 December 2016
Cash and balances with Central Banks 56,920 - - - - 56,920
Loans and advances to Banks 6,094 9,924 - - - 16,018
Financial Assets Available for sale - - 61,968 - - 61,968
Financial Assets held to maturity - 512 6,211 18,679 15,100 40,502
Loans and advances to customers 44,547 19,996 16,372 138,474 166,356 385,745
Clearing house 950 - - - - 950
Total financial assets 108,511 30,432 84,551 157,153 181,456 562,103
Deposits from banks - 13,123 - - - 13,123
Deposits from customers 187,511 87,447 111,823 61,393 - 448,174
Bills payable 2,277 - - - - 2,277
Borrowings 290 1,503 5,658 7,836 7,695 22,982
Total financial liabilities 190,078 102,073 117,481 69,229 7,695 486,556
(81,567) (71,641) (32,930) 87,924 173,761 75,547
The amounts in the tables above have been compiled based on undiscounted cash flows, which include estimated interest payments.
4. FINANCIAL RISK MANAGEMENT (CONTINUED)(b) Liquidity risk (continued)
NOTES TO THE FINANCIAL STATEMENTS FOR THE YEAR ENDED 31 DECEMBER 2017
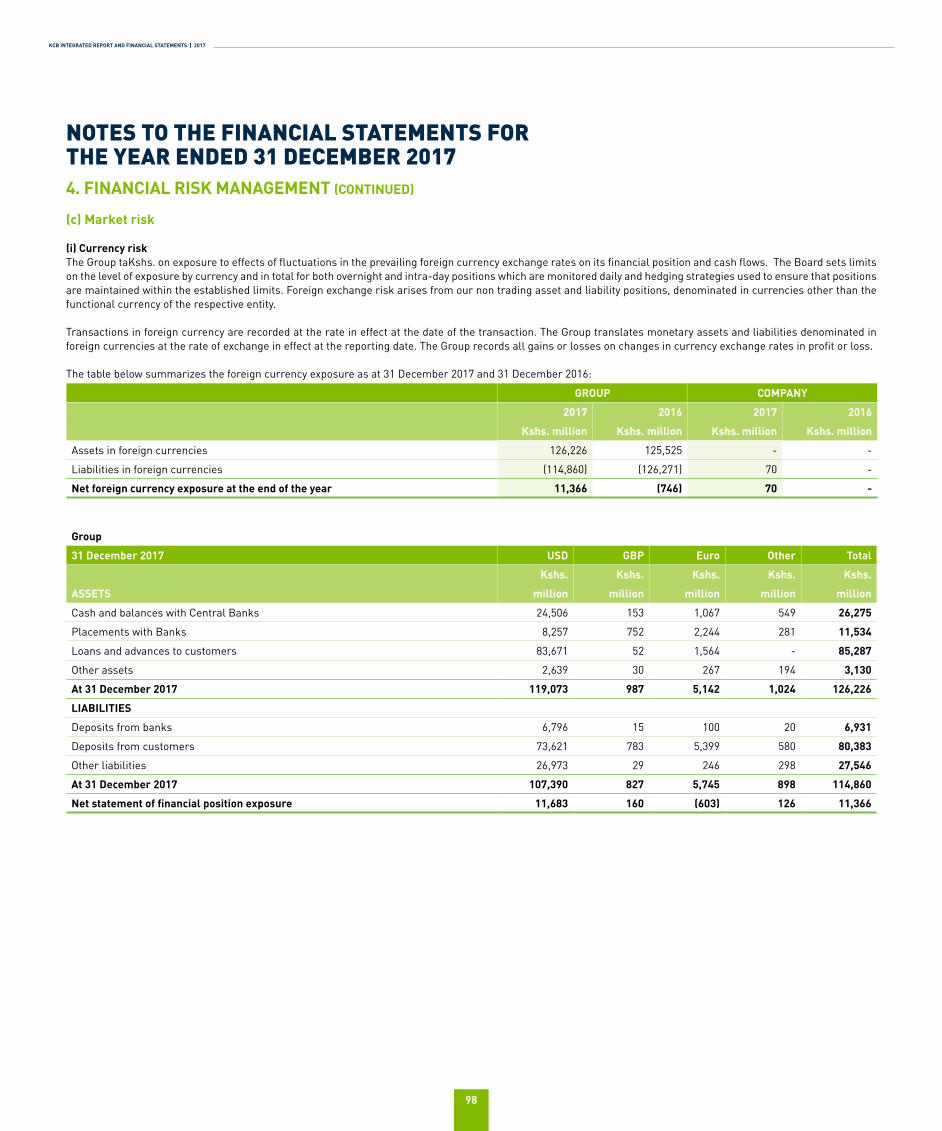
KCB INTEGRATED REPORT AND FINANCIAL STATEMENTS | 2017
98
(c) Market risk
(i) Currency risk The Group taKshs. on exposure to effects of fluctuations in the prevailing foreign currency exchange rates on its financial position and cash flows. The Board sets limits on the level of exposure by currency and in total for both overnight and intra-day positions which are monitored daily and hedging strategies used to ensure that positions are maintained within the established limits. Foreign exchange risk arises from our non trading asset and liability positions, denominated in currencies other than the functional currency of the respective entity.
Transactions in foreign currency are recorded at the rate in effect at the date of the transaction. The Group translates monetary assets and liabilities denominated in foreign currencies at the rate of exchange in effect at the reporting date. The Group records all gains or losses on changes in currency exchange rates in profit or loss.
The table below summarizes the foreign currency exposure as at 31 December 2017 and 31 December 2016:
GROUP COMPANY
2017 2016 2017 2016
Kshs. million Kshs. million Kshs. million Kshs. million
Assets in foreign currencies 126,226 125,525 - -
Liabilities in foreign currencies (114,860) (126,271) 70 -
Net foreign currency exposure at the end of the year 11,366 (746) 70 -
Group
31 December 2017 USD GBP Euro Other Total
Kshs. Kshs. Kshs. Kshs. Kshs.
ASSETS million million million million million
Cash and balances with Central Banks 24,506 153 1,067 549 26,275
Placements with Banks 8,257 752 2,244 281 11,534
Loans and advances to customers 83,671 52 1,564 - 85,287
Other assets 2,639 30 267 194 3,130
At 31 December 2017 119,073 987 5,142 1,024 126,226
LIABILITIES
Deposits from banks 6,796 15 100 20 6,931
Deposits from customers 73,621 783 5,399 580 80,383
Other liabilities 26,973 29 246 298 27,546
At 31 December 2017 107,390 827 5,745 898 114,860
Net statement of financial position exposure 11,683 160 (603) 126 11,366
4. FINANCIAL RISK MANAGEMENT (CONTINUED)
NOTES TO THE FINANCIAL STATEMENTS FOR THE YEAR ENDED 31 DECEMBER 2017
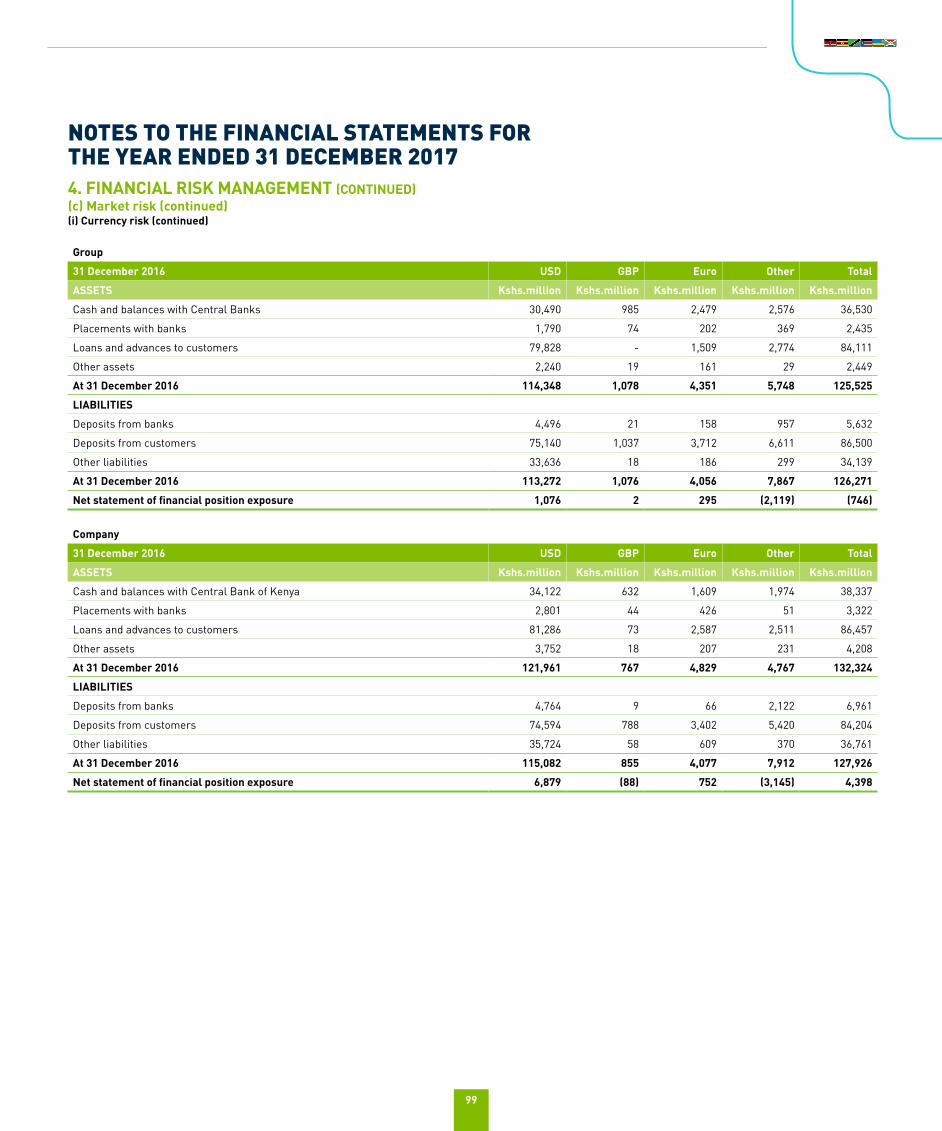
99
Group
31 December 2016 USD GBP Euro Other Total
ASSETS Kshs.million Kshs.million Kshs.million Kshs.million Kshs.million
Cash and balances with Central Banks 30,490 985 2,479 2,576 36,530
Placements with banks 1,790 74 202 369 2,435
Loans and advances to customers 79,828 - 1,509 2,774 84,111
Other assets 2,240 19 161 29 2,449
At 31 December 2016 114,348 1,078 4,351 5,748 125,525
LIABILITIES
Deposits from banks 4,496 21 158 957 5,632
Deposits from customers 75,140 1,037 3,712 6,611 86,500
Other liabilities 33,636 18 186 299 34,139
At 31 December 2016 113,272 1,076 4,056 7,867 126,271
Net statement of financial position exposure 1,076 2 295 (2,119) (746)
Company
31 December 2016 USD GBP Euro Other Total
ASSETS Kshs.million Kshs.million Kshs.million Kshs.million Kshs.million
Cash and balances with Central Bank of Kenya 34,122 632 1,609 1,974 38,337
Placements with banks 2,801 44 426 51 3,322
Loans and advances to customers 81,286 73 2,587 2,511 86,457
Other assets 3,752 18 207 231 4,208
At 31 December 2016 121,961 767 4,829 4,767 132,324
LIABILITIES
Deposits from banks 4,764 9 66 2,122 6,961
Deposits from customers 74,594 788 3,402 5,420 84,204
Other liabilities 35,724 58 609 370 36,761
At 31 December 2016 115,082 855 4,077 7,912 127,926
Net statement of financial position exposure 6,879 (88) 752 (3,145) 4,398
4. FINANCIAL RISK MANAGEMENT (CONTINUED)(c) Market risk (continued)(i) Currency risk (continued)
NOTES TO THE FINANCIAL STATEMENTS FOR THE YEAR ENDED 31 DECEMBER 2017
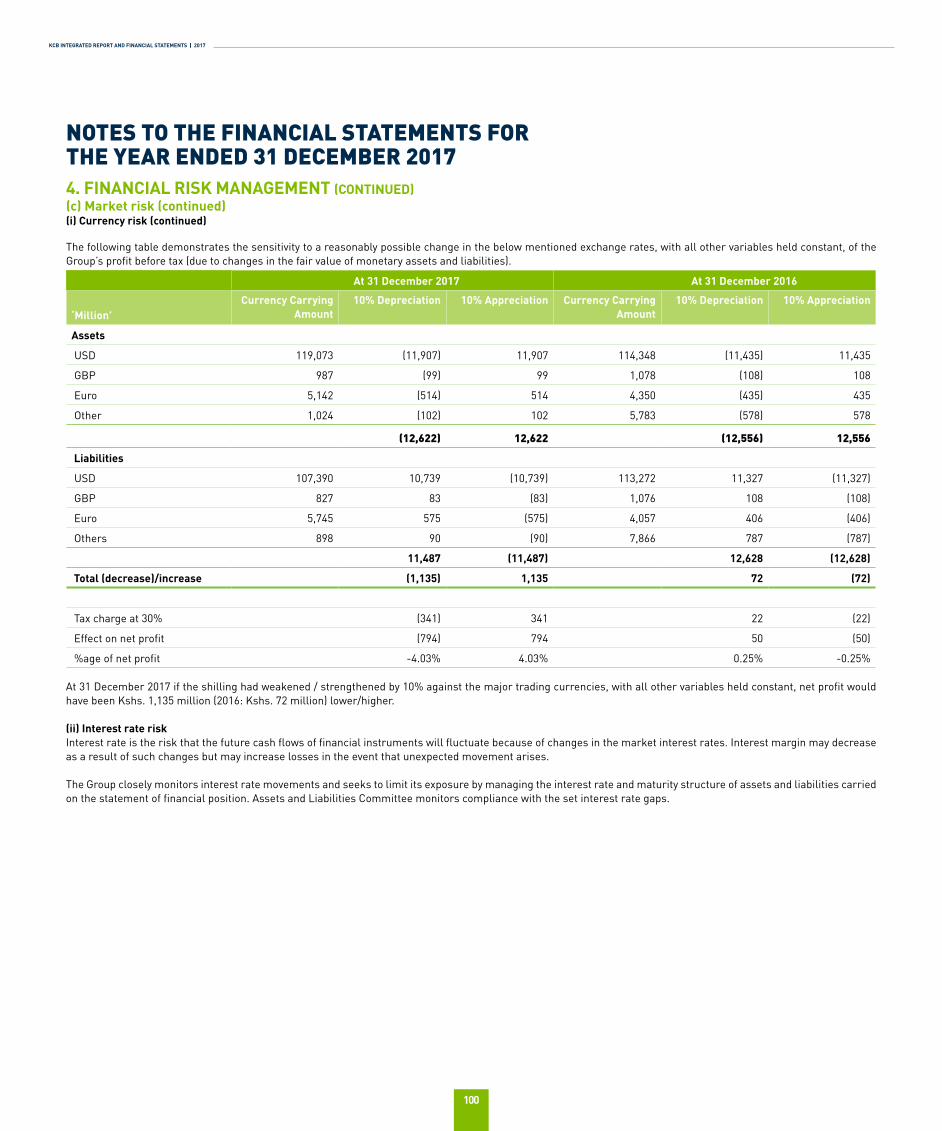
KCB INTEGRATED REPORT AND FINANCIAL STATEMENTS | 2017
100
The following table demonstrates the sensitivity to a reasonably possible change in the below mentioned exchange rates, with all other variables held constant, of the Group’s profit before tax (due to changes in the fair value of monetary assets and liabilities).
At 31 December 2017 At 31 December 2016
‘Million’Currency Carrying
Amount10% Depreciation 10% Appreciation Currency Carrying
Amount10% Depreciation 10% Appreciation
Assets
USD 119,073 (11,907) 11,907 114,348 (11,435) 11,435
GBP 987 (99) 99 1,078 (108) 108
Euro 5,142 (514) 514 4,350 (435) 435
Other 1,024 (102) 102 5,783 (578) 578
(12,622) 12,622 (12,556) 12,556
Liabilities
USD 107,390 10,739 (10,739) 113,272 11,327 (11,327)
GBP 827 83 (83) 1,076 108 (108)
Euro 5,745 575 (575) 4,057 406 (406)
Others 898 90 (90) 7,866 787 (787)
11,487 (11,487) 12,628 (12,628)
Total (decrease)/increase (1,135) 1,135 72 (72)
Tax charge at 30% (341) 341 22 (22)
Effect on net profit (794) 794 50 (50)
%age of net profit -4.03% 4.03% 0.25% -0.25%
At 31 December 2017 if the shilling had weakened / strengthened by 10% against the major trading currencies, with all other variables held constant, net profit would have been Kshs. 1,135 million (2016: Kshs. 72 million) lower/higher.
(ii) Interest rate riskInterest rate is the risk that the future cash flows of financial instruments will fluctuate because of changes in the market interest rates. Interest margin may decrease as a result of such changes but may increase losses in the event that unexpected movement arises. The Group closely monitors interest rate movements and seeks to limit its exposure by managing the interest rate and maturity structure of assets and liabilities carried on the statement of financial position. Assets and Liabilities Committee monitors compliance with the set interest rate gaps.
4. FINANCIAL RISK MANAGEMENT (CONTINUED)(c) Market risk (continued)(i) Currency risk (continued)
NOTES TO THE FINANCIAL STATEMENTS FOR THE YEAR ENDED 31 DECEMBER 2017
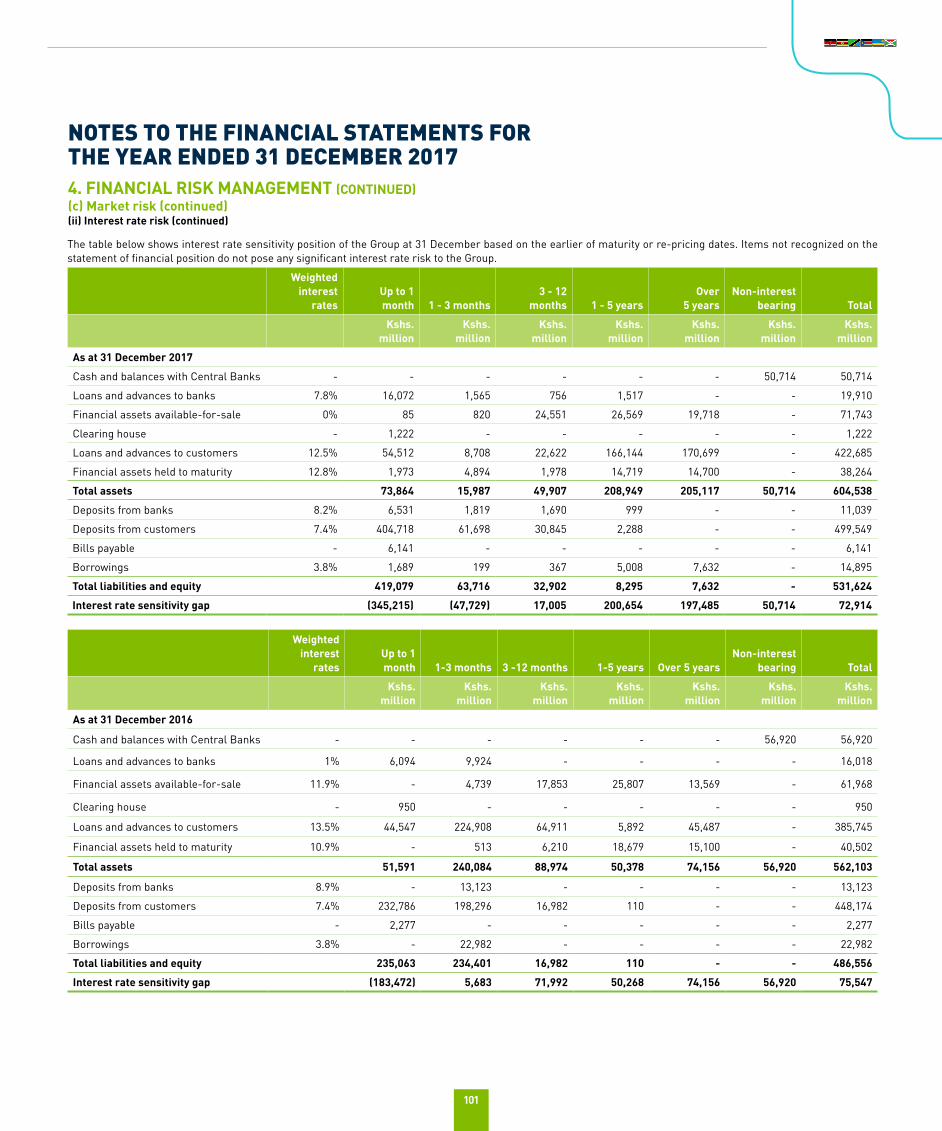
101
The table below shows interest rate sensitivity position of the Group at 31 December based on the earlier of maturity or re-pricing dates. Items not recognized on the statement of financial position do not pose any significant interest rate risk to the Group.
Weighted interest
rates Up to 1month 1 - 3 months
3 - 12 months 1 - 5 years
Over5 years
Non-interestbearing Total
Kshs.million
Kshs.million
Kshs.million
Kshs.million
Kshs.million
Kshs.million
Kshs.million
As at 31 December 2017
Cash and balances with Central Banks - - - - - - 50,714 50,714
Loans and advances to banks 7.8% 16,072 1,565 756 1,517 - - 19,910
Financial assets available-for-sale 0% 85 820 24,551 26,569 19,718 - 71,743
Clearing house - 1,222 - - - - - 1,222
Loans and advances to customers 12.5% 54,512 8,708 22,622 166,144 170,699 - 422,685
Financial assets held to maturity 12.8% 1,973 4,894 1,978 14,719 14,700 - 38,264
Total assets 73,864 15,987 49,907 208,949 205,117 50,714 604,538
Deposits from banks 8.2% 6,531 1,819 1,690 999 - - 11,039
Deposits from customers 7.4% 404,718 61,698 30,845 2,288 - - 499,549
Bills payable - 6,141 - - - - - 6,141
Borrowings 3.8% 1,689 199 367 5,008 7,632 - 14,895
Total liabilities and equity 419,079 63,716 32,902 8,295 7,632 - 531,624
Interest rate sensitivity gap (345,215) (47,729) 17,005 200,654 197,485 50,714 72,914
Weighted interest
rates Up to 1month 1-3 months 3 -12 months 1-5 years Over 5 years
Non-interestbearing Total
Kshs.million
Kshs.million
Kshs.million
Kshs.million
Kshs.million
Kshs.million
Kshs.million
As at 31 December 2016
Cash and balances with Central Banks - - - - - - 56,920 56,920
Loans and advances to banks 1% 6,094 9,924 - - - - 16,018
Financial assets available-for-sale 11.9% - 4,739 17,853 25,807 13,569 - 61,968
Clearing house - 950 - - - - - 950
Loans and advances to customers 13.5% 44,547 224,908 64,911 5,892 45,487 - 385,745
Financial assets held to maturity 10.9% - 513 6,210 18,679 15,100 - 40,502
Total assets 51,591 240,084 88,974 50,378 74,156 56,920 562,103
Deposits from banks 8.9% - 13,123 - - - - 13,123
Deposits from customers 7.4% 232,786 198,296 16,982 110 - - 448,174
Bills payable - 2,277 - - - - - 2,277
Borrowings 3.8% - 22,982 - - - - 22,982
Total liabilities and equity 235,063 234,401 16,982 110 - - 486,556
Interest rate sensitivity gap (183,472) 5,683 71,992 50,268 74,156 56,920 75,547
4. FINANCIAL RISK MANAGEMENT (CONTINUED)(c) Market risk (continued)(ii) Interest rate risk (continued)
NOTES TO THE FINANCIAL STATEMENTS FOR THE YEAR ENDED 31 DECEMBER 2017
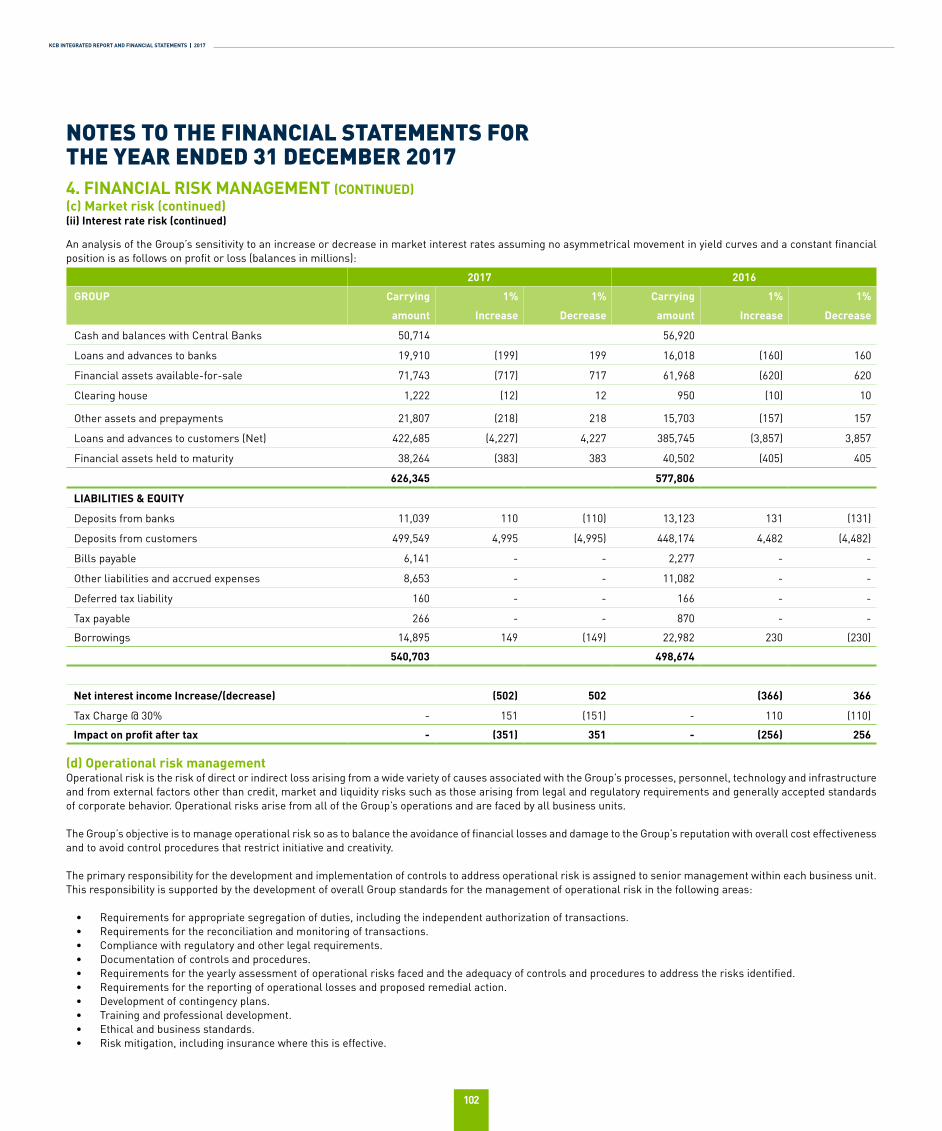
KCB INTEGRATED REPORT AND FINANCIAL STATEMENTS | 2017
102
An analysis of the Group’s sensitivity to an increase or decrease in market interest rates assuming no asymmetrical movement in yield curves and a constant financial position is as follows on profit or loss (balances in millions):
2017 2016
GROUP Carrying 1% 1% Carrying 1% 1%
amount Increase Decrease amount Increase Decrease
Cash and balances with Central Banks 50,714 56,920
Loans and advances to banks 19,910 (199) 199 16,018 (160) 160
Financial assets available-for-sale 71,743 (717) 717 61,968 (620) 620
Clearing house 1,222 (12) 12 950 (10) 10
Other assets and prepayments 21,807 (218) 218 15,703 (157) 157
Loans and advances to customers (Net) 422,685 (4,227) 4,227 385,745 (3,857) 3,857
Financial assets held to maturity 38,264 (383) 383 40,502 (405) 405
626,345 577,806
LIABILITIES & EQUITY
Deposits from banks 11,039 110 (110) 13,123 131 (131)
Deposits from customers 499,549 4,995 (4,995) 448,174 4,482 (4,482)
Bills payable 6,141 - - 2,277 - -
Other liabilities and accrued expenses 8,653 - - 11,082 - -
Deferred tax liability 160 - - 166 - -
Tax payable 266 - - 870 - -
Borrowings 14,895 149 (149) 22,982 230 (230)
540,703 498,674
Net interest income Increase/(decrease) (502) 502 (366) 366
Tax Charge @ 30% - 151 (151) - 110 (110)
Impact on profit after tax - (351) 351 - (256) 256
(d) Operational risk managementOperational risk is the risk of direct or indirect loss arising from a wide variety of causes associated with the Group’s processes, personnel, technology and infrastructure and from external factors other than credit, market and liquidity risks such as those arising from legal and regulatory requirements and generally accepted standards of corporate behavior. Operational risks arise from all of the Group’s operations and are faced by all business units.
The Group’s objective is to manage operational risk so as to balance the avoidance of financial losses and damage to the Group’s reputation with overall cost effectiveness and to avoid control procedures that restrict initiative and creativity.
The primary responsibility for the development and implementation of controls to address operational risk is assigned to senior management within each business unit. This responsibility is supported by the development of overall Group standards for the management of operational risk in the following areas:
• Requirements for appropriate segregation of duties, including the independent authorization of transactions.• Requirements for the reconciliation and monitoring of transactions.• Compliance with regulatory and other legal requirements. • Documentation of controls and procedures.• Requirements for the yearly assessment of operational risks faced and the adequacy of controls and procedures to address the risks identified.• Requirements for the reporting of operational losses and proposed remedial action.• Development of contingency plans.• Training and professional development.• Ethical and business standards.• Risk mitigation, including insurance where this is effective.
4. FINANCIAL RISK MANAGEMENT (CONTINUED)(c) Market risk (continued)(ii) Interest rate risk (continued)
NOTES TO THE FINANCIAL STATEMENTS FOR THE YEAR ENDED 31 DECEMBER 2017
103
Compliance with Group’s standards is supported by a program of regular reviews undertaken by both the Internal Audit and Compliance department. The results of internal audit reviews are discussed with the management of the business unit to which they relate, with summaries submitted to the Audit Committee and senior management of the Group.
5. CRITICAL ACCOUNTING ESTIMATES AND JUDGMENTS In preparing these consolidated financial statements, management has made judgments, estimates and assumptions that affect the application of the Group’s accounting policies and the reported amounts of assets, liabilities, income and expenses. Actual results may differ from these estimates.
Estimates and the underlying assumptions are reviewed on an ongoing basis. Revisions to estimates are recognized prospectively.
(a) JudgmentsThe Directors have made judgements in the process of applying accounting policies that would have significant effects on the amounts recognized in the consolidated financial statements. Judgement was made in determining whether the economy of South Sudan in which KCB Bank South Sudan Limited operates was hyper inflationary as at 31 December 2017 (See Note 19 and Note 49)
(b) Assumptions and estimation uncertaintiesThe information relating to assumptions and estimation uncertainties that have a significant risk of resulting in material adjustment in the financial statements are set out below.
(i) Impairment losses on loans and advancesThe estimation of potential credit losses is inherently uncertain and depends upon many factors, including general economic conditions, changes in individual customers’ circumstances, structural changes within industries that alter competitive positions and other external factors such as legal and regulatory requirements.
Impairment is measured for all accounts that are identified as non-performing. All relevant considerations that have a bearing on the expected future cash flows are taken into account which include but not limited to future business prospects for the customer, realizable value of securities, the Group’s position relative to other claimants and the existence of any court injunctions placed by the borrower. Subjective judgments are made in this process of cash flow determination both in value and timing and may vary from one person to another and team to team. Judgments may also change with time as new information becomes available.
The Group reviews its loans and advances at each reporting date to assess whether an allowance for impairment should be recognized in profit or loss. In particular, judgment by the Directors is required in the estimation of the amount and timing of future cash flows when determining the level of allowance required. Such estimates are based on the assumptions about a number of factors and actual results may differ, resulting in future changes in the allowance.
The Group also makes a collective impairment measurement for exposures which, although not specifically identified as non-performing, have an inherent risk of default. The portfolio constitutes a large number of loan and advances account cutting across various industries. Assets with similar risk characteristics are grouped together for the purpose of determining the collective impairment within the group.
(ii) Fair value of financial instrumentsFair value is the price that would be received to sell an asset or paid to transfer a liability in orderly transaction between market participants at the measurement date.
All financial instruments are initially recognized at fair value, which is normally the transaction price. Subsequent to initial recognition, some of the Group’s financial instruments are carried at fair value. The fair values of quoted financial instruments in active markets are based on current prices with no subjective judgments. If the market for a financial instrument does not exist or is not active including for unlisted securities, the Group establishes fair value by using valuation techniques.
These include the use of recent arm’s length transactions, discounted cash flow analysis, option pricing models and other valuation techniques commonly used by market participants. Where representative prices are unreliable because of illiquid markets, the determination of fair value may require estimation of certain parameters, which are calibrated against industry standards and observable market data, or the use of valuation models that are based on observable market data.
The fair value for the majority of the Group’s financial instruments is based on observable market prices or derived from observable market parameters. Changes in assumptions about these factors could affect the reported fair value of financial instruments. (iii) Retirement benefitsThe cost of the defined benefit pension plan is determined using actuarial valuation. The actuarial valuation involves making assumptions about discount rates, expected rates of return on assets, future salary increases, mortality rates and future pension increases. Due to the long term nature of these plans, such estimates are subject to significant uncertainty and a change in any of the assumptions will alter the carrying amount of pension obligations.
The assumptions used in determining the net cost (income) for pensions include the discount rate. The Group determines the appropriate discount rate at the end of each year. This is the interest rate that should be used to determine the present value of estimated future cash outflows expected to be required to settle the pension obligations.
In determining the appropriate discount rate, the Group considers the interest rates of high-quality corporate bonds that are denominated in the currency in which the benefits will be paid and that have terms to maturity approximating the terms of the related pension liability. Other key assumptions for pension obligations are based in part on current market conditions.
(iv) Property and equipmentProperty and equipment is depreciated over its useful life taking into account residual values, where appropriate. The actual lives of the assets and residual values are assessed annually and may vary depending on a number of factors. In reassessing asset lives, factors such as technological innovation, product life cycles and maintenance programs are taken into account which involves extensive subjective judgment. Residual value assessments consider issues such as future market conditions, the remaining life of the asset and projected disposal values. The rates used are set out on accounting policy 2.3(ii).
(v) Income taxesSignificant estimates are required in determining the provision for income taxes. There are many transactions and calculations for which the ultimate tax
4. FINANCIAL RISK MANAGEMENT (CONTINUED)(d) Operational risk management (continued)
NOTES TO THE FINANCIAL STATEMENTS FOR THE YEAR ENDED 31 DECEMBER 2017
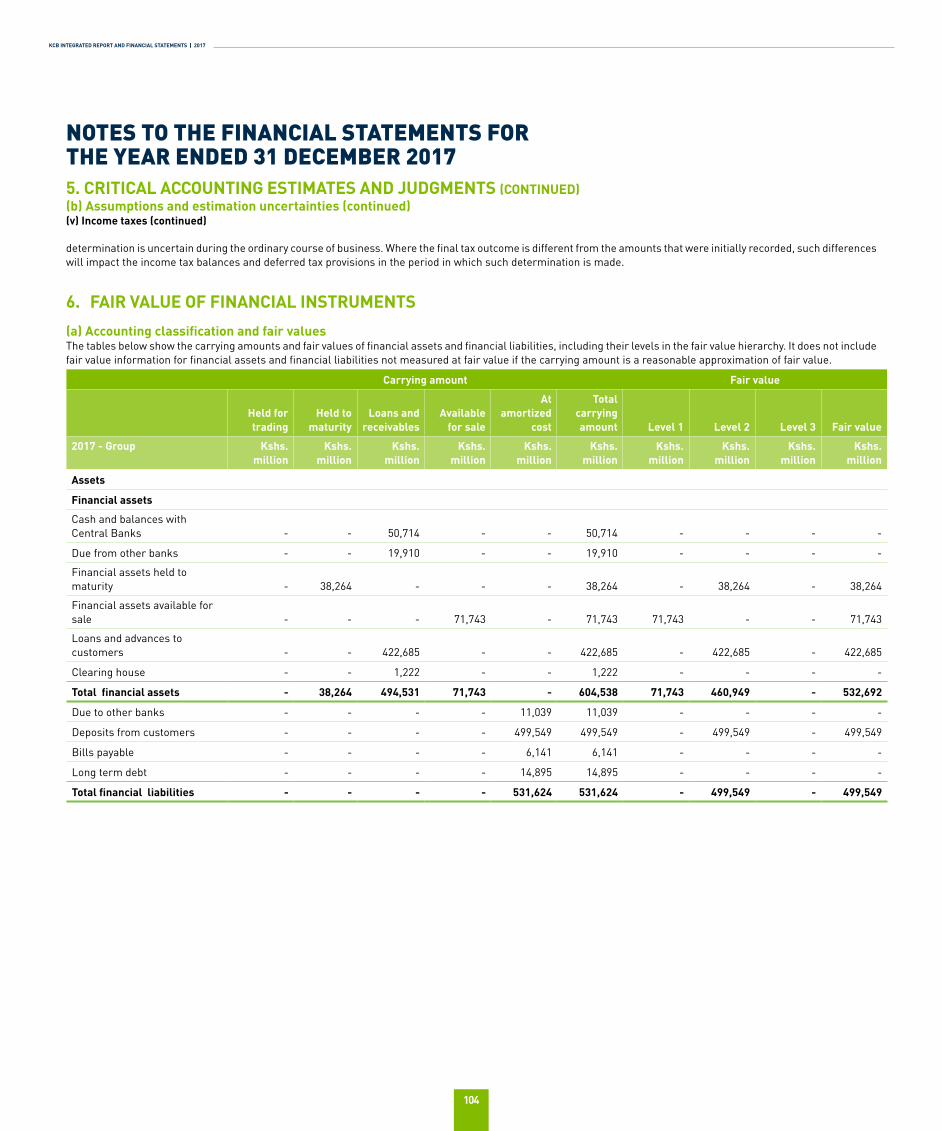
KCB INTEGRATED REPORT AND FINANCIAL STATEMENTS | 2017
104
determination is uncertain during the ordinary course of business. Where the final tax outcome is different from the amounts that were initially recorded, such differences will impact the income tax balances and deferred tax provisions in the period in which such determination is made.
6. FAIR VALUE OF FINANCIAL INSTRUMENTS
(a) Accounting classification and fair valuesThe tables below show the carrying amounts and fair values of financial assets and financial liabilities, including their levels in the fair value hierarchy. It does not include fair value information for financial assets and financial liabilities not measured at fair value if the carrying amount is a reasonable approximation of fair value.
Carrying amount Fair value
Held for trading
Held to maturity
Loans and receivables
Available for sale
At amortized
cost
Total carrying amount Level 1 Level 2 Level 3 Fair value
2017 - Group Kshs. million
Kshs. million
Kshs. million
Kshs. million
Kshs. million
Kshs. million
Kshs. million
Kshs. million
Kshs. million
Kshs. million
Assets
Financial assets
Cash and balances with Central Banks - - 50,714 - - 50,714 - - - -
Due from other banks - - 19,910 - - 19,910 - - - -
Financial assets held to maturity - 38,264 - - - 38,264 - 38,264 - 38,264
Financial assets available for sale - - - 71,743 - 71,743 71,743 - - 71,743
Loans and advances to customers - - 422,685 - - 422,685 - 422,685 - 422,685
Clearing house - - 1,222 - - 1,222 - - - -
Total financial assets - 38,264 494,531 71,743 - 604,538 71,743 460,949 - 532,692
Due to other banks - - - - 11,039 11,039 - - - -
Deposits from customers - - - - 499,549 499,549 - 499,549 - 499,549
Bills payable - - - - 6,141 6,141 - - - -
Long term debt - - - - 14,895 14,895 - - - -
Total financial liabilities - - - - 531,624 531,624 - 499,549 - 499,549
5. CRITICAL ACCOUNTING ESTIMATES AND JUDGMENTS (CONTINUED)(b) Assumptions and estimation uncertainties (continued)(v) Income taxes (continued)
NOTES TO THE FINANCIAL STATEMENTS FOR THE YEAR ENDED 31 DECEMBER 2017
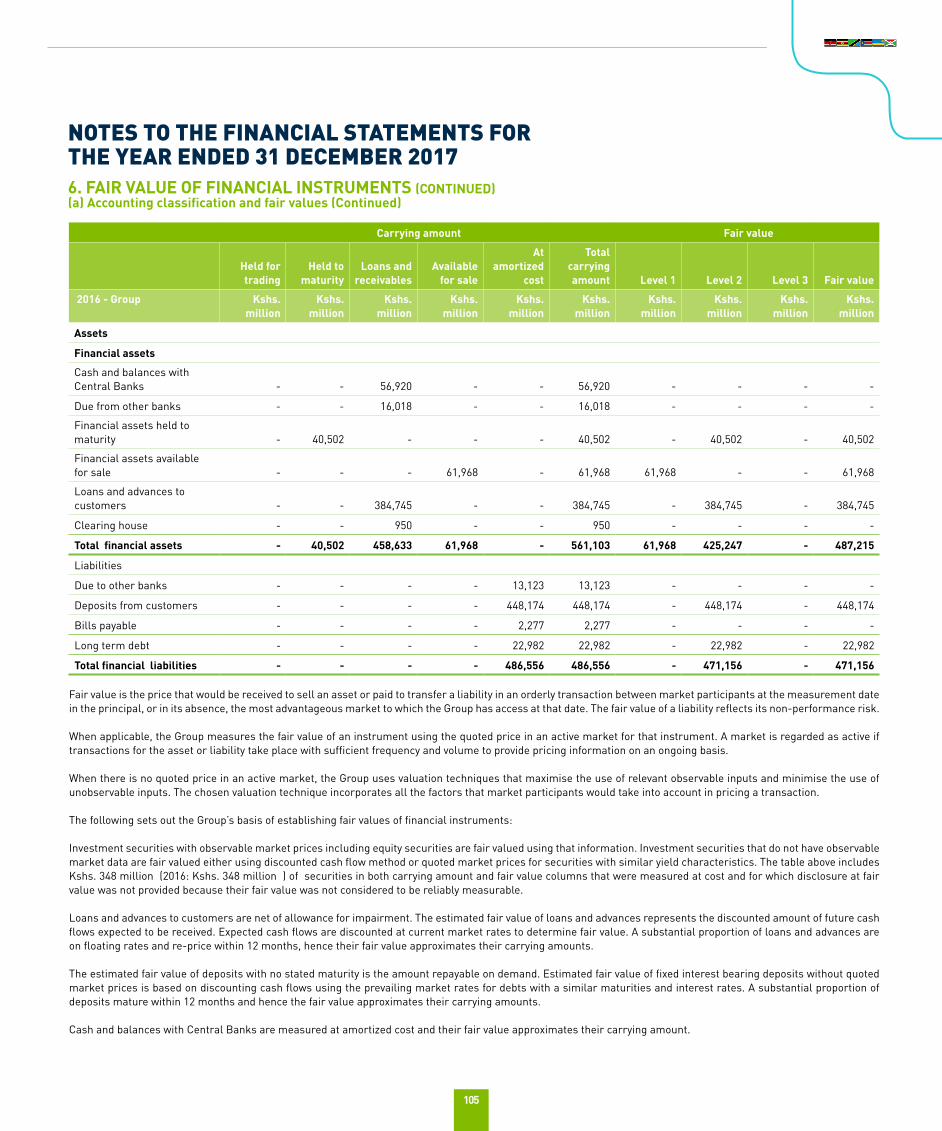
105
Carrying amount Fair value
Held for trading
Held to maturity
Loans and receivables
Available for sale
At amortized
cost
Total carrying amount Level 1 Level 2 Level 3 Fair value
2016 - Group Kshs. million
Kshs. million
Kshs. million
Kshs. million
Kshs. million
Kshs. million
Kshs. million
Kshs. million
Kshs. million
Kshs. million
Assets
Financial assets
Cash and balances with Central Banks - - 56,920 - - 56,920 - - - -
Due from other banks - - 16,018 - - 16,018 - - - -
Financial assets held to maturity - 40,502 - - - 40,502 - 40,502 - 40,502
Financial assets available for sale - - - 61,968 - 61,968 61,968 - - 61,968
Loans and advances to customers - - 384,745 - - 384,745 - 384,745 - 384,745
Clearing house - - 950 - - 950 - - - -
Total financial assets - 40,502 458,633 61,968 - 561,103 61,968 425,247 - 487,215
Liabilities
Due to other banks - - - - 13,123 13,123 - - - -
Deposits from customers - - - - 448,174 448,174 - 448,174 - 448,174
Bills payable - - - - 2,277 2,277 - - - -
Long term debt - - - - 22,982 22,982 - 22,982 - 22,982
Total financial liabilities - - - - 486,556 486,556 - 471,156 - 471,156
Fair value is the price that would be received to sell an asset or paid to transfer a liability in an orderly transaction between market participants at the measurement date in the principal, or in its absence, the most advantageous market to which the Group has access at that date. The fair value of a liability reflects its non-performance risk.
When applicable, the Group measures the fair value of an instrument using the quoted price in an active market for that instrument. A market is regarded as active if transactions for the asset or liability take place with sufficient frequency and volume to provide pricing information on an ongoing basis.
When there is no quoted price in an active market, the Group uses valuation techniques that maximise the use of relevant observable inputs and minimise the use of unobservable inputs. The chosen valuation technique incorporates all the factors that market participants would take into account in pricing a transaction.
The following sets out the Group’s basis of establishing fair values of financial instruments:
Investment securities with observable market prices including equity securities are fair valued using that information. Investment securities that do not have observable market data are fair valued either using discounted cash flow method or quoted market prices for securities with similar yield characteristics. The table above includes Kshs. 348 million (2016: Kshs. 348 million ) of securities in both carrying amount and fair value columns that were measured at cost and for which disclosure at fair value was not provided because their fair value was not considered to be reliably measurable.
Loans and advances to customers are net of allowance for impairment. The estimated fair value of loans and advances represents the discounted amount of future cash flows expected to be received. Expected cash flows are discounted at current market rates to determine fair value. A substantial proportion of loans and advances are on floating rates and re-price within 12 months, hence their fair value approximates their carrying amounts.
The estimated fair value of deposits with no stated maturity is the amount repayable on demand. Estimated fair value of fixed interest bearing deposits without quoted market prices is based on discounting cash flows using the prevailing market rates for debts with a similar maturities and interest rates. A substantial proportion of deposits mature within 12 months and hence the fair value approximates their carrying amounts.
Cash and balances with Central Banks are measured at amortized cost and their fair value approximates their carrying amount.
6. FAIR VALUE OF FINANCIAL INSTRUMENTS (CONTINUED)(a) Accounting classification and fair values (Continued)
NOTES TO THE FINANCIAL STATEMENTS FOR THE YEAR ENDED 31 DECEMBER 2017
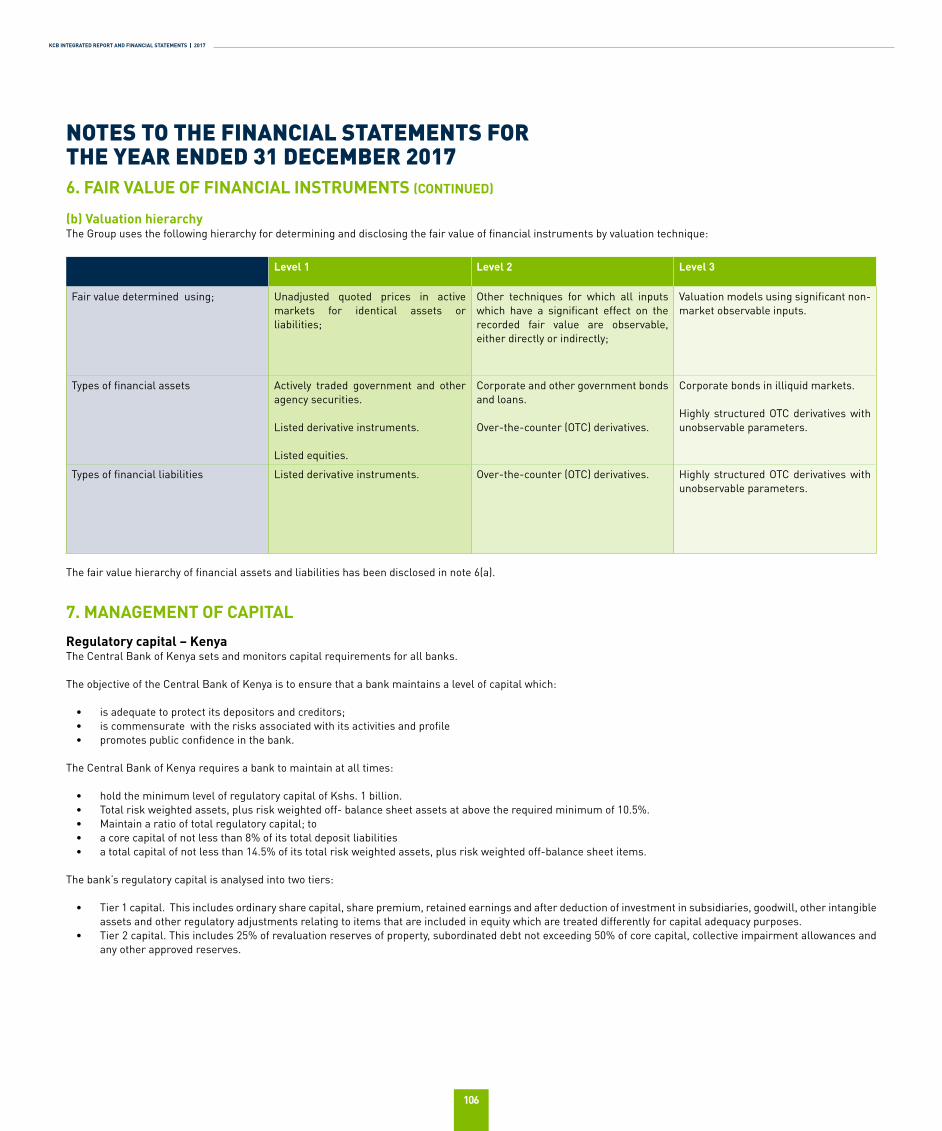
KCB INTEGRATED REPORT AND FINANCIAL STATEMENTS | 2017
106
(b) Valuation hierarchyThe Group uses the following hierarchy for determining and disclosing the fair value of financial instruments by valuation technique:
Level 1 Level 2 Level 3
Fair value determined using; Unadjusted quoted prices in active markets for identical assets or liabilities;
Other techniques for which all inputs which have a significant effect on the recorded fair value are observable, either directly or indirectly;
Valuation models using significant non-market observable inputs.
Types of financial assets Actively traded government and other agency securities.
Listed derivative instruments.
Listed equities.
Corporate and other government bonds and loans.
Over-the-counter (OTC) derivatives.
Corporate bonds in illiquid markets.
Highly structured OTC derivatives with unobservable parameters.
Types of financial liabilities Listed derivative instruments. Over-the-counter (OTC) derivatives. Highly structured OTC derivatives with unobservable parameters.
The fair value hierarchy of financial assets and liabilities has been disclosed in note 6(a).
7. MANAGEMENT OF CAPITAL
Regulatory capital – Kenya The Central Bank of Kenya sets and monitors capital requirements for all banks.
The objective of the Central Bank of Kenya is to ensure that a bank maintains a level of capital which:
• is adequate to protect its depositors and creditors; • is commensurate with the risks associated with its activities and profile • promotes public confidence in the bank.
The Central Bank of Kenya requires a bank to maintain at all times:
• hold the minimum level of regulatory capital of Kshs. 1 billion.• Total risk weighted assets, plus risk weighted off- balance sheet assets at above the required minimum of 10.5%.• Maintain a ratio of total regulatory capital; to• a core capital of not less than 8% of its total deposit liabilities• a total capital of not less than 14.5% of its total risk weighted assets, plus risk weighted off-balance sheet items.
The bank’s regulatory capital is analysed into two tiers:
• Tier 1 capital. This includes ordinary share capital, share premium, retained earnings and after deduction of investment in subsidiaries, goodwill, other intangible assets and other regulatory adjustments relating to items that are included in equity which are treated differently for capital adequacy purposes.
• Tier 2 capital. This includes 25% of revaluation reserves of property, subordinated debt not exceeding 50% of core capital, collective impairment allowances and any other approved reserves.
6. FAIR VALUE OF FINANCIAL INSTRUMENTS (CONTINUED)
NOTES TO THE FINANCIAL STATEMENTS FOR THE YEAR ENDED 31 DECEMBER 2017
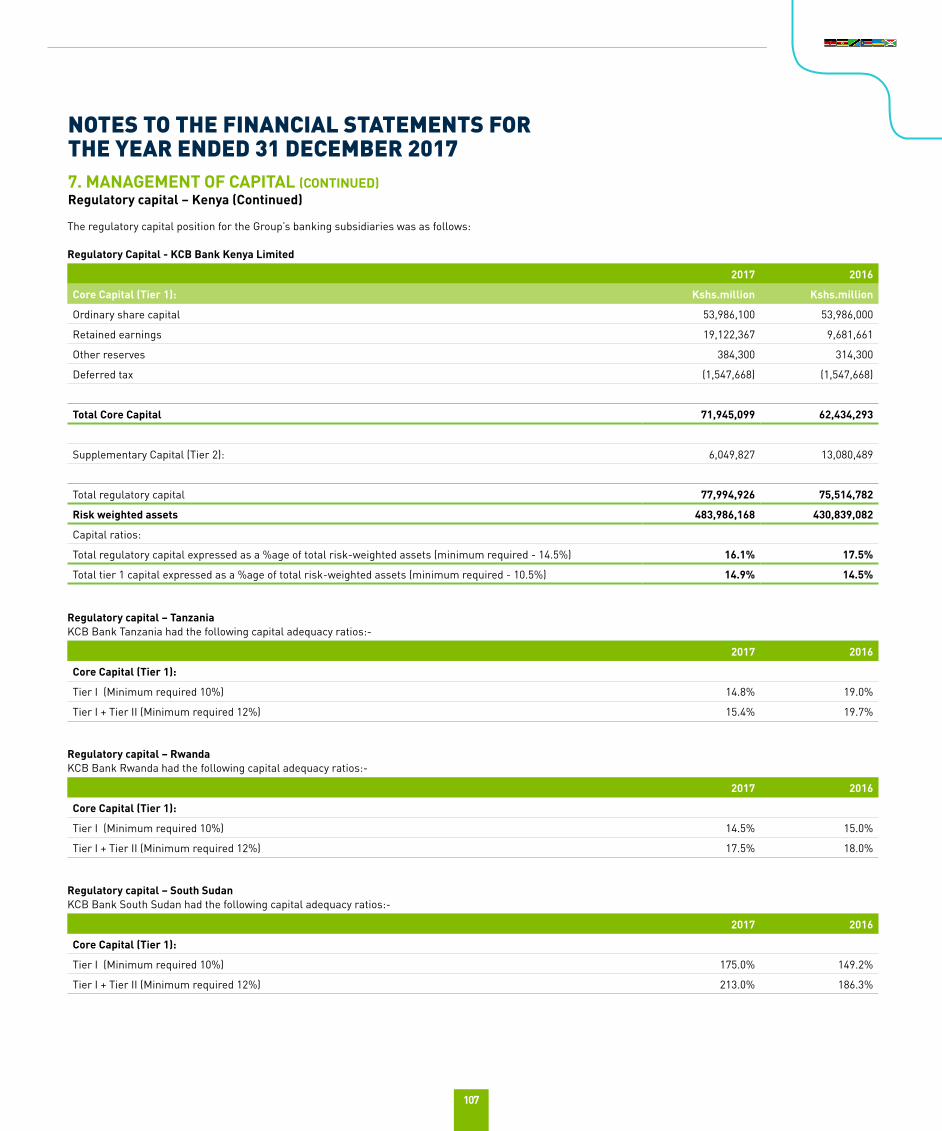
107
The regulatory capital position for the Group’s banking subsidiaries was as follows:
Regulatory Capital - KCB Bank Kenya Limited
2017 2016
Core Capital (Tier 1): Kshs.million Kshs.million
Ordinary share capital 53,986,100 53,986,000
Retained earnings 19,122,367 9,681,661
Other reserves 384,300 314,300
Deferred tax (1,547,668) (1,547,668)
Total Core Capital 71,945,099 62,434,293
Supplementary Capital (Tier 2): 6,049,827 13,080,489
Total regulatory capital 77,994,926 75,514,782
Risk weighted assets 483,986,168 430,839,082
Capital ratios:
Total regulatory capital expressed as a %age of total risk-weighted assets (minimum required - 14.5%) 16.1% 17.5%
Total tier 1 capital expressed as a %age of total risk-weighted assets (minimum required - 10.5%) 14.9% 14.5%
Regulatory capital – TanzaniaKCB Bank Tanzania had the following capital adequacy ratios:-
2017 2016
Core Capital (Tier 1):
Tier I (Minimum required 10%) 14.8% 19.0%
Tier I + Tier II (Minimum required 12%) 15.4% 19.7%
Regulatory capital – RwandaKCB Bank Rwanda had the following capital adequacy ratios:-
2017 2016
Core Capital (Tier 1):
Tier I (Minimum required 10%) 14.5% 15.0%
Tier I + Tier II (Minimum required 12%) 17.5% 18.0%
Regulatory capital – South SudanKCB Bank South Sudan had the following capital adequacy ratios:-
2017 2016
Core Capital (Tier 1):
Tier I (Minimum required 10%) 175.0% 149.2%
Tier I + Tier II (Minimum required 12%) 213.0% 186.3%
7. MANAGEMENT OF CAPITAL (CONTINUED)Regulatory capital – Kenya (Continued)
NOTES TO THE FINANCIAL STATEMENTS FOR THE YEAR ENDED 31 DECEMBER 2017
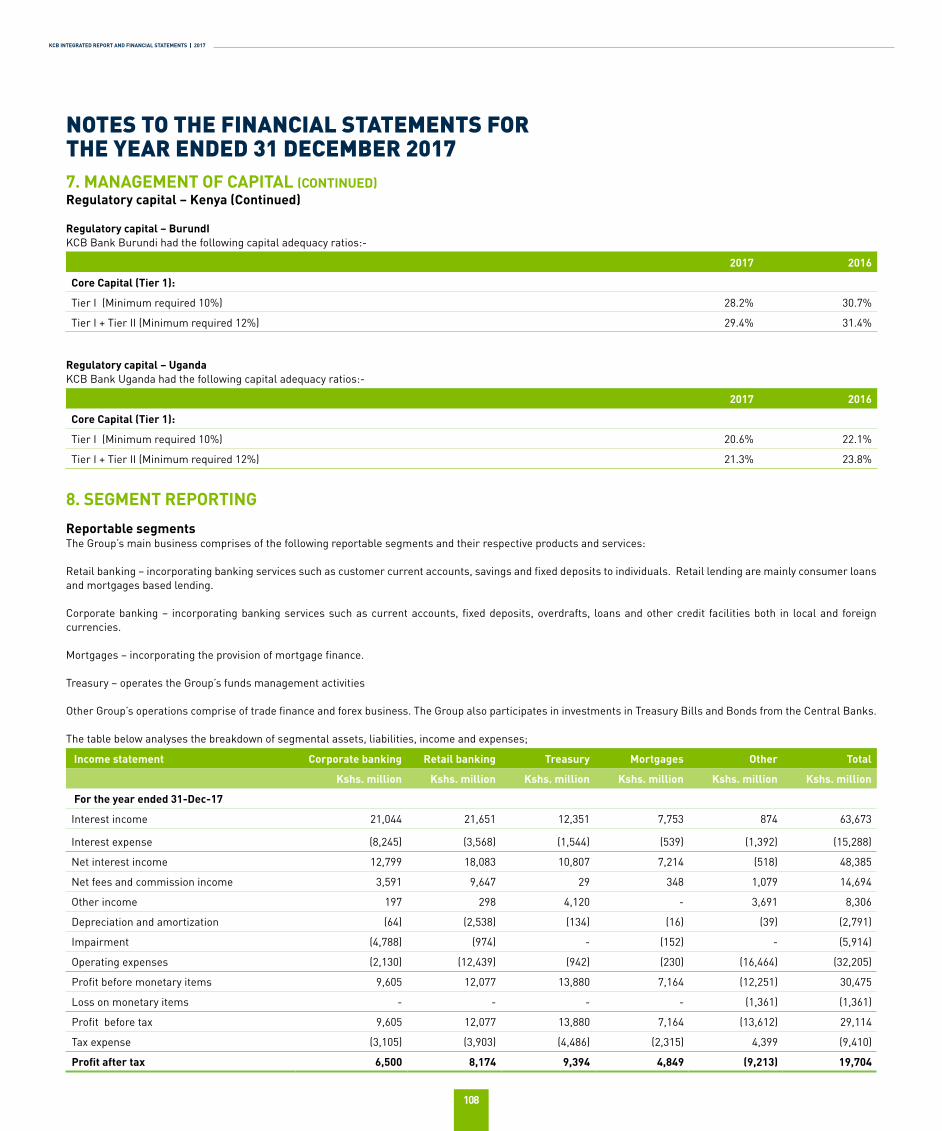
KCB INTEGRATED REPORT AND FINANCIAL STATEMENTS | 2017
108
Regulatory capital – BurundIKCB Bank Burundi had the following capital adequacy ratios:-
2017 2016
Core Capital (Tier 1):
Tier I (Minimum required 10%) 28.2% 30.7%
Tier I + Tier II (Minimum required 12%) 29.4% 31.4%
Regulatory capital – UgandaKCB Bank Uganda had the following capital adequacy ratios:-
2017 2016
Core Capital (Tier 1):
Tier I (Minimum required 10%) 20.6% 22.1%
Tier I + Tier II (Minimum required 12%) 21.3% 23.8%
8. SEGMENT REPORTING
Reportable segmentsThe Group’s main business comprises of the following reportable segments and their respective products and services:
Retail banking – incorporating banking services such as customer current accounts, savings and fixed deposits to individuals. Retail lending are mainly consumer loans and mortgages based lending. Corporate banking – incorporating banking services such as current accounts, fixed deposits, overdrafts, loans and other credit facilities both in local and foreign currencies.
Mortgages – incorporating the provision of mortgage finance.
Treasury – operates the Group’s funds management activities
Other Group’s operations comprise of trade finance and forex business. The Group also participates in investments in Treasury Bills and Bonds from the Central Banks.
The table below analyses the breakdown of segmental assets, liabilities, income and expenses;
Income statement Corporate banking Retail banking Treasury Mortgages Other Total
Kshs. million Kshs. million Kshs. million Kshs. million Kshs. million Kshs. million
For the year ended 31-Dec-17
Interest income 21,044 21,651 12,351 7,753 874 63,673
Interest expense (8,245) (3,568) (1,544) (539) (1,392) (15,288)
Net interest income 12,799 18,083 10,807 7,214 (518) 48,385
Net fees and commission income 3,591 9,647 29 348 1,079 14,694
Other income 197 298 4,120 - 3,691 8,306
Depreciation and amortization (64) (2,538) (134) (16) (39) (2,791)
Impairment (4,788) (974) - (152) - (5,914)
Operating expenses (2,130) (12,439) (942) (230) (16,464) (32,205)
Profit before monetary items 9,605 12,077 13,880 7,164 (12,251) 30,475
Loss on monetary items - - - - (1,361) (1,361)
Profit before tax 9,605 12,077 13,880 7,164 (13,612) 29,114
Tax expense (3,105) (3,903) (4,486) (2,315) 4,399 (9,410)
Profit after tax 6,500 8,174 9,394 4,849 (9,213) 19,704
7. MANAGEMENT OF CAPITAL (CONTINUED)Regulatory capital – Kenya (Continued)
NOTES TO THE FINANCIAL STATEMENTS FOR THE YEAR ENDED 31 DECEMBER 2017
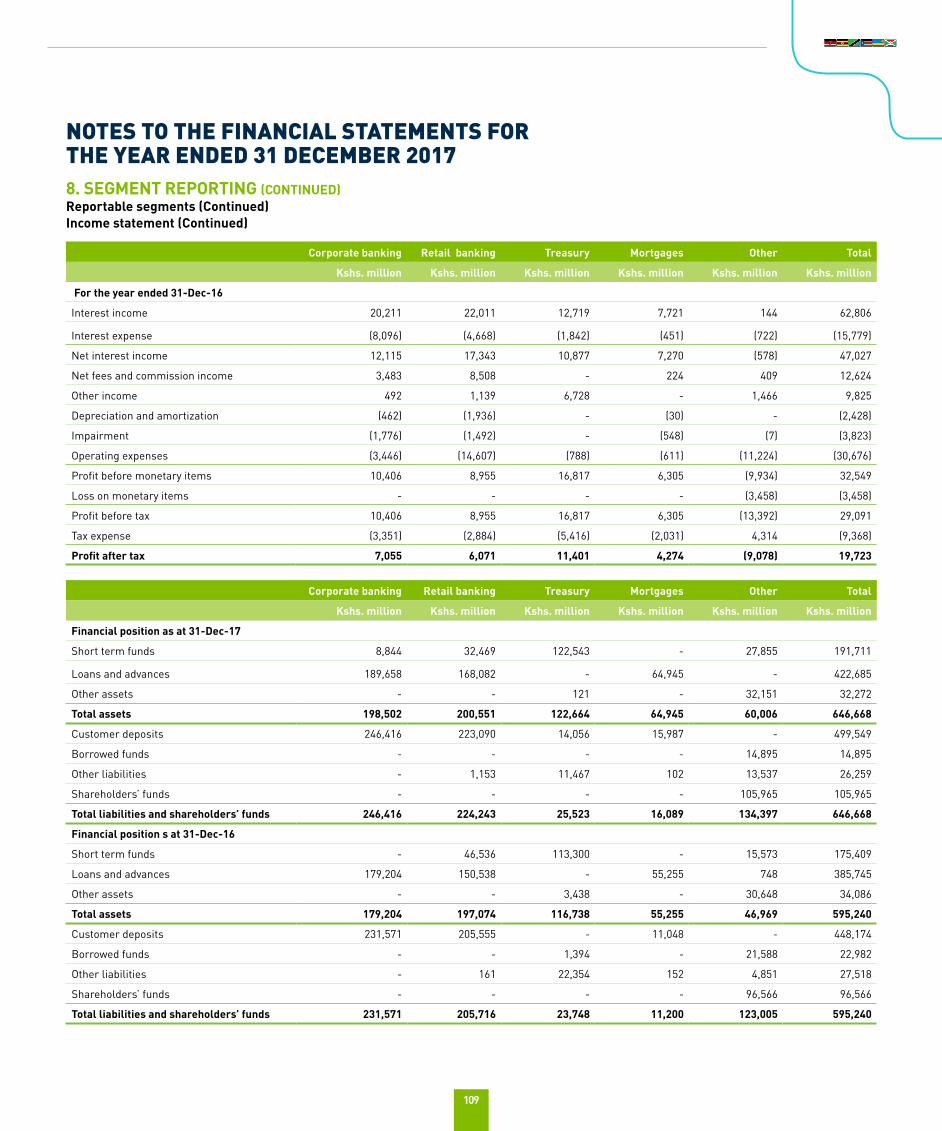
109
Corporate banking Retail banking Treasury Mortgages Other Total
Kshs. million Kshs. million Kshs. million Kshs. million Kshs. million Kshs. million
For the year ended 31-Dec-16
Interest income 20,211 22,011 12,719 7,721 144 62,806
Interest expense (8,096) (4,668) (1,842) (451) (722) (15,779)
Net interest income 12,115 17,343 10,877 7,270 (578) 47,027
Net fees and commission income 3,483 8,508 - 224 409 12,624
Other income 492 1,139 6,728 - 1,466 9,825
Depreciation and amortization (462) (1,936) - (30) - (2,428)
Impairment (1,776) (1,492) - (548) (7) (3,823)
Operating expenses (3,446) (14,607) (788) (611) (11,224) (30,676)
Profit before monetary items 10,406 8,955 16,817 6,305 (9,934) 32,549
Loss on monetary items - - - - (3,458) (3,458)
Profit before tax 10,406 8,955 16,817 6,305 (13,392) 29,091
Tax expense (3,351) (2,884) (5,416) (2,031) 4,314 (9,368)
Profit after tax 7,055 6,071 11,401 4,274 (9,078) 19,723
Corporate banking Retail banking Treasury Mortgages Other Total
Kshs. million Kshs. million Kshs. million Kshs. million Kshs. million Kshs. million
Financial position as at 31-Dec-17
Short term funds 8,844 32,469 122,543 - 27,855 191,711
Loans and advances 189,658 168,082 - 64,945 - 422,685
Other assets - - 121 - 32,151 32,272
Total assets 198,502 200,551 122,664 64,945 60,006 646,668
Customer deposits 246,416 223,090 14,056 15,987 - 499,549
Borrowed funds - - - - 14,895 14,895
Other liabilities - 1,153 11,467 102 13,537 26,259
Shareholders’ funds - - - - 105,965 105,965
Total liabilities and shareholders’ funds 246,416 224,243 25,523 16,089 134,397 646,668
Financial position s at 31-Dec-16
Short term funds - 46,536 113,300 - 15,573 175,409
Loans and advances 179,204 150,538 - 55,255 748 385,745
Other assets - - 3,438 - 30,648 34,086
Total assets 179,204 197,074 116,738 55,255 46,969 595,240
Customer deposits 231,571 205,555 - 11,048 - 448,174
Borrowed funds - - 1,394 - 21,588 22,982
Other liabilities - 161 22,354 152 4,851 27,518
Shareholders’ funds - - - - 96,566 96,566
Total liabilities and shareholders’ funds 231,571 205,716 23,748 11,200 123,005 595,240
8. SEGMENT REPORTING (CONTINUED)Reportable segments (Continued)Income statement (Continued)
NOTES TO THE FINANCIAL STATEMENTS FOR THE YEAR ENDED 31 DECEMBER 2017
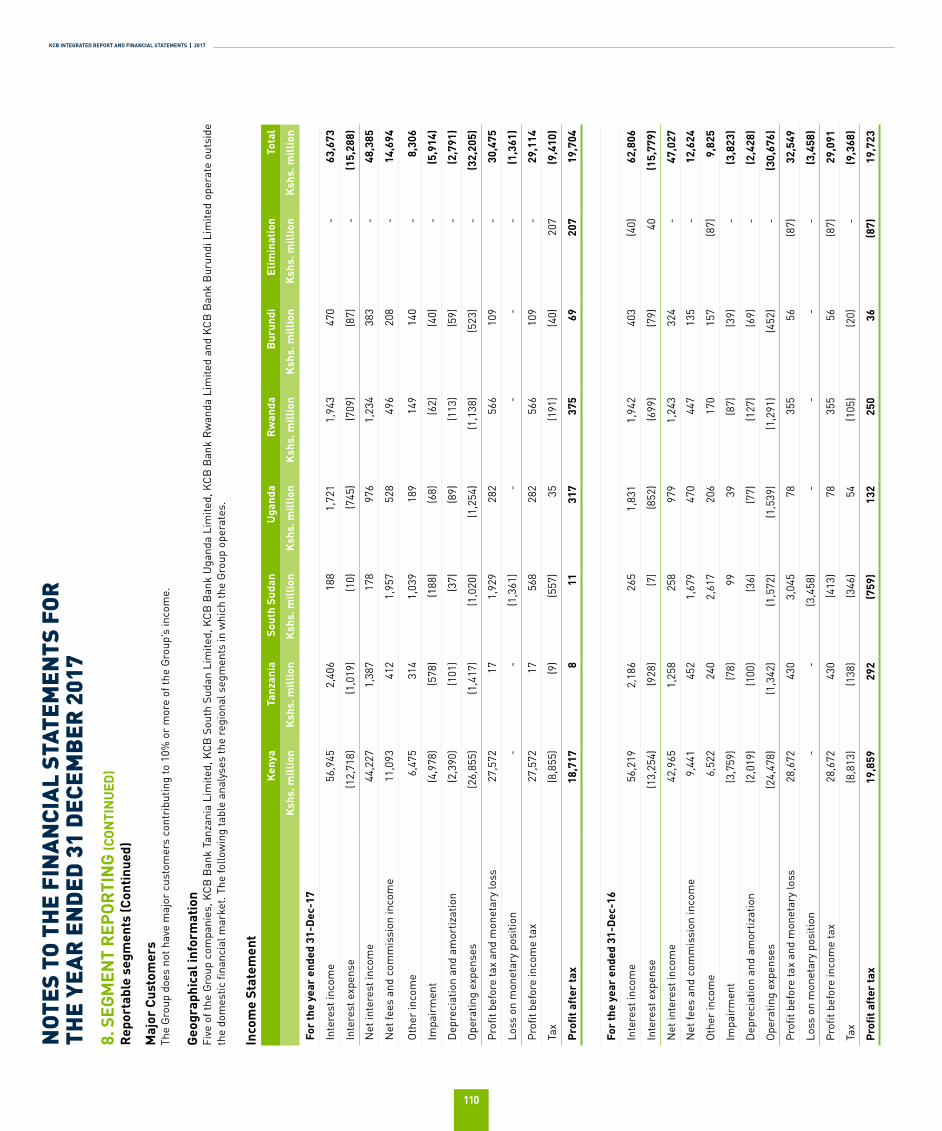
KCB INTEGRATED REPORT AND FINANCIAL STATEMENTS | 2017
110
Maj
or C
usto
mer
sTh
e G
roup
doe
s no
t hav
e m
ajor
cus
tom
ers
cont
ribu
ting
to 1
0% o
r m
ore
of th
e G
roup
’s in
com
e.
Geog
raph
ical
info
rmat
ion
Five
of t
he G
roup
com
pani
es, K
CB B
ank
Tanz
ania
Lim
ited,
KCB
Sou
th S
udan
Lim
ited,
KCB
Ban
k U
gand
a Li
mite
d, K
CB B
ank
Rw
anda
Lim
ited
and
KCB
Ban
k B
urun
di L
imite
d op
erat
e ou
tsid
e th
e do
mes
tic fi
nanc
ial m
arke
t. Th
e fo
llow
ing
tabl
e an
alys
es th
e re
gion
al s
egm
ents
in w
hich
the
Gro
up o
pera
tes.
Inco
me
Stat
emen
tK
enya
Tanz
ania
Sout
h Su
dan
Uga
nda
Rw
anda
Bur
undi
Elim
inat
ion
Tota
l
Ksh
s. m
illio
nK
shs.
mill
ion
Ksh
s. m
illio
nK
shs.
mill
ion
Ksh
s. m
illio
nK
shs.
mill
ion
Ksh
s. m
illio
nK
shs.
mill
ion
For
the
year
end
ed 3
1-D
ec-1
7
Inte
rest
inco
me
56,
945
2,4
06
1
88
1
,721
1,
943
47
0
-
63,6
73
Inte
rest
exp
ense
(
12,7
18)
(1,0
19)
(1
0)
(7
45)
(709
)
(87)
-
(15,
288)
Net
inte
rest
inco
me
44,
227
1,3
87
1
78
976
1,
234
38
3
-
48,3
85
Net
fees
and
com
mis
sion
inco
me
11,
093
4
12
1,9
57
528
4
96
20
8
-
14,6
94
Oth
er in
com
e
6,47
5
314
1
,039
1
89
149
140
-
8
,306
Impa
irm
ent
(4,9
78)
(57
8)
(
188)
(68
)
(62)
(4
0)
-
(5,9
14)
Dep
reci
atio
n an
d am
ortiz
atio
n
(2
,390
)
(
101)
(3
7)
(
89)
(113
)
(59)
-
(2
,791
)
Ope
ratin
g ex
pens
es
(26
,855
)
(1
,417
)
(1
,020
)
(1,2
54)
(1
,138
)
(
523)
-
(32,
205)
Profi
t bef
ore
tax
and
mon
etar
y lo
ss
2
7,57
2
17
1
,929
2
82
566
109
-
30
,475
Loss
on
mon
etar
y po
sitio
n
-
-
(1,3
61)
-
-
-
-
(1,3
61)
Profi
t bef
ore
inco
me
tax
27,
572
17
5
68
282
5
66
10
9
-
29,1
14
Tax
(8,8
55)
(9)
(55
7)
35
(191
)
(40)
207
(9
,410
)
Profi
t aft
er ta
x
18,
717
8
1
1
3
17
375
69
207
19
,704
For
the
year
end
ed 3
1-D
ec-1
6
Inte
rest
inco
me
56,
219
2,1
86
2
65
1
,831
1,
942
40
3
(
40)
62,8
06
Inte
rest
exp
ense
(
13,2
54)
(92
8)
(7
)
(8
52)
(699
)
(79)
4
0
(15,
779)
Net
inte
rest
inco
me
42,
965
1,2
58
2
58
979
1,
243
32
4
-
47,0
27
Net
fees
and
com
mis
sion
inco
me
9,
441
4
52
1,6
79
470
4
47
13
5
-
12,6
24
Oth
er in
com
e
6,52
2
240
2
,617
2
06
170
157
(87
)
9
,825
Impa
irm
ent
(3,7
59)
(7
8)
99
39
(8
7)
(39)
-
(3
,823
)
Dep
reci
atio
n an
d am
ortiz
atio
n
(2
,019
)
(
100)
(3
6)
(
77)
(127
)
(69)
-
(2
,428
)
Ope
ratin
g ex
pens
es
(24
,478
)
(1
,342
)
(1
,572
)
(1,5
39)
(1
,291
)
(
452)
-
(30,
676)
Profi
t bef
ore
tax
and
mon
etar
y lo
ss
2
8,67
2
430
3
,045
78
355
56
(87
)
32
,549
Loss
on
mon
etar
y po
sitio
n
-
-
(3,4
58)
-
-
-
-
(3,4
58)
Profi
t bef
ore
inco
me
tax
28,
672
4
30
(41
3)
78
355
56
(87
)
29
,091
Tax
(8,8
13)
(13
8)
(
346)
5
4
(1
05)
(2
0)
-
(9,3
68)
Profi
t aft
er ta
x
19,
859
29
2
(
759)
132
2
50
3
6
(
87)
19,7
23
8. S
EGM
ENT
REP
ORTI
NG
(CON
TIN
UED
)R
epor
tabl
e se
gmen
ts (C
ontin
ued)
NOT
ES T
O T
HE
FIN
AN
CIA
L ST
ATEM
ENTS
FO
R
THE
YEA
R E
ND
ED 3
1 D
ECEM
BER
201
7
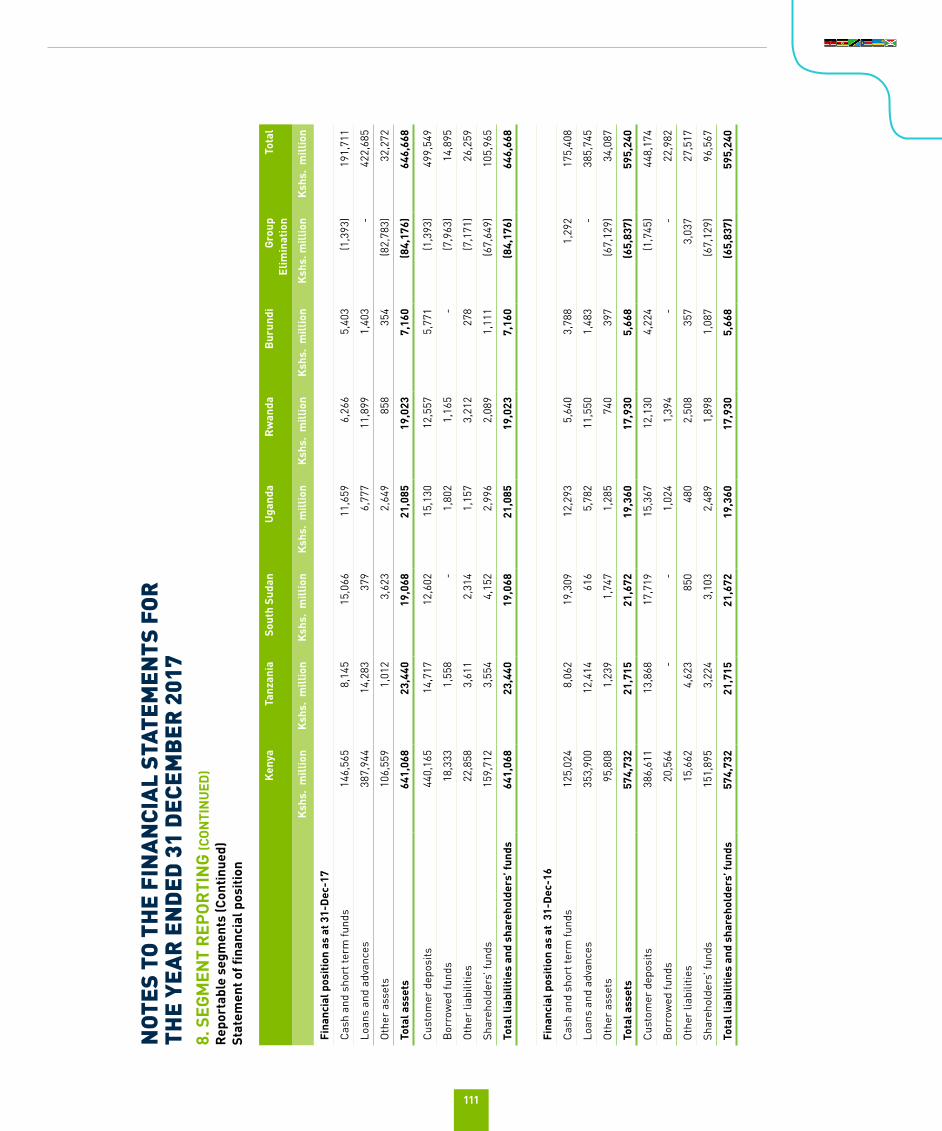
111
Ken
yaTa
nzan
iaSo
uth
Suda
nU
gand
aR
wan
daB
urun
diGr
oup
Elim
inat
ion
Tota
l
Ksh
s. m
illio
nK
shs.
mill
ion
Ksh
s. m
illio
nK
shs.
mill
ion
Ksh
s. m
illio
nK
shs.
mill
ion
Ksh
s. m
illio
nK
shs.
mill
ion
Fina
ncia
l pos
ition
as
at 3
1-D
ec-1
7
Cash
and
sho
rt te
rm fu
nds
146,
565
8,14
515
,066
11,6
596,
266
5,40
3(1
,393
)19
1,71
1
Loan
s an
d ad
vanc
es38
7,94
414
,283
379
6,77
711
,899
1,40
3-
422,
685
Oth
er a
sset
s10
6,55
91,
012
3,62
32,
649
858
354
(82,
783)
32,2
72
Tota
l ass
ets
641,
068
23,4
4019
,068
21,0
8519
,023
7,16
0(8
4,17
6)64
6,66
8
Cust
omer
dep
osits
440,
165
14,7
1712
,602
15,1
3012
,557
5,77
1(1
,393
)49
9,54
9
Bor
row
ed fu
nds
18,3
331,
558
-1,
802
1,16
5-
(7,9
63)
14,8
95
Oth
er li
abili
ties
22,8
583,
611
2,31
41,
157
3,21
227
8(7
,171
)26
,259
Shar
ehol
ders
’ fun
ds15
9,71
23,
554
4,15
22,
996
2,08
91,
111
(67,
649)
105,
965
Tota
l lia
bilit
ies
and
shar
ehol
ders
’ fun
ds64
1,06
823
,440
19,0
6821
,085
19,0
237,
160
(84,
176)
646,
668
Fina
ncia
l pos
ition
as
at 3
1-D
ec-1
6
Cash
and
sho
rt te
rm fu
nds
125,
024
8,06
219
,309
12,2
935,
640
3,78
81,
292
175,
408
Loan
s an
d ad
vanc
es35
3,90
012
,414
616
5,78
211
,550
1,48
3-
385,
745
Oth
er a
sset
s95
,808
1,23
91,
747
1,28
574
039
7(6
7,12
9)34
,087
Tota
l ass
ets
574,
732
21,7
1521
,672
19,3
6017
,930
5,66
8(6
5,83
7)59
5,24
0
Cust
omer
dep
osits
386,
611
13,8
6817
,719
15,3
6712
,130
4,22
4(1
,745
)44
8,17
4
Bor
row
ed fu
nds
20,5
64-
-1,
024
1,39
4-
-22
,982
Oth
er li
abili
ties
15,6
624,
623
850
480
2,50
835
73,
037
27,5
17
Shar
ehol
ders
’ fun
ds15
1,89
53,
224
3,10
32,
489
1,89
81,
087
(67,
129)
96,5
67
Tota
l lia
bilit
ies
and
shar
ehol
ders
’ fun
ds57
4,73
221
,715
21,6
7219
,360
17,9
305,
668
(65,
837)
595,
240
8. S
EGM
ENT
REP
ORTI
NG
(CON
TIN
UED
)R
epor
tabl
e se
gmen
ts (C
ontin
ued)
Stat
emen
t of fi
nanc
ial p
ositi
on
NOT
ES T
O T
HE
FIN
AN
CIA
L ST
ATEM
ENTS
FO
R
THE
YEA
R E
ND
ED 3
1 D
ECEM
BER
201
7
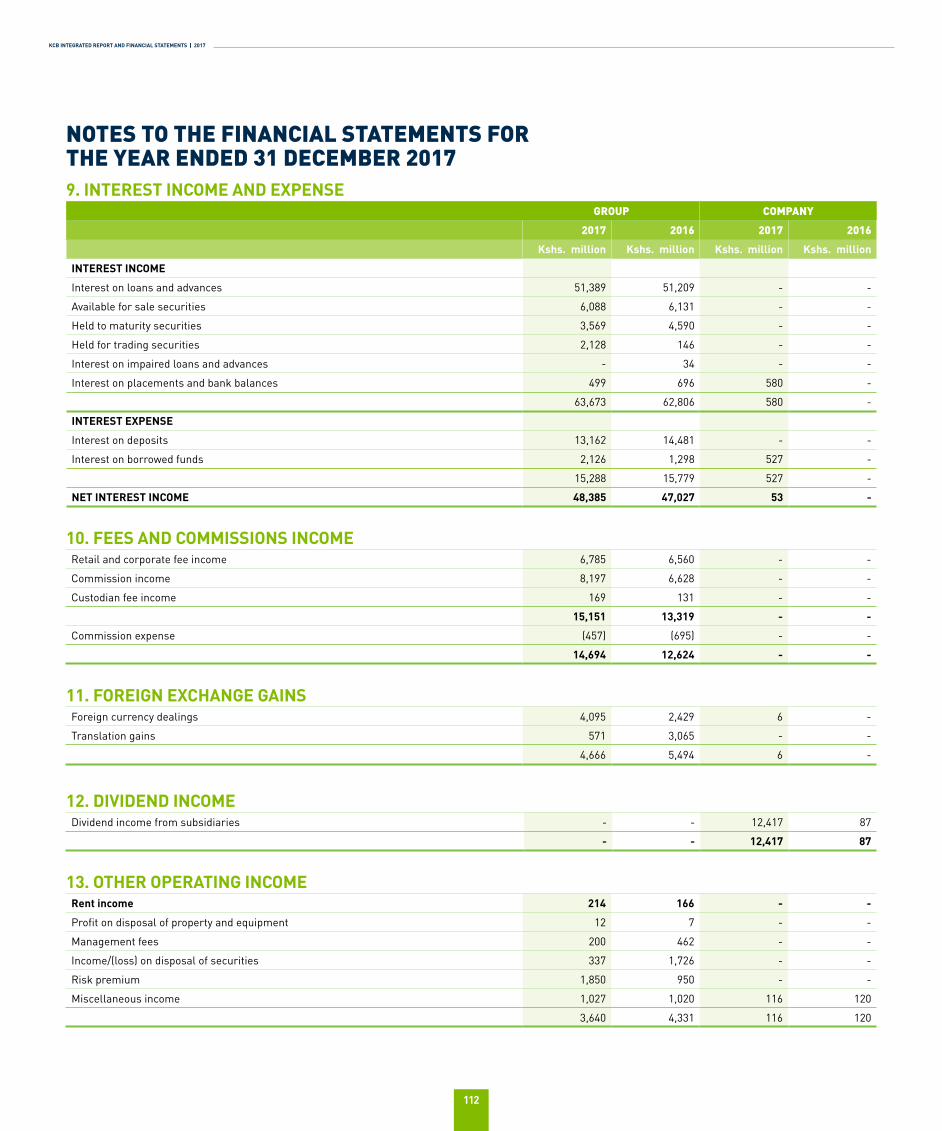
KCB INTEGRATED REPORT AND FINANCIAL STATEMENTS | 2017
112
9. INTEREST INCOME AND EXPENSEGROUP COMPANY
2017 2016 2017 2016
Kshs. million Kshs. million Kshs. million Kshs. million
INTEREST INCOME
Interest on loans and advances 51,389 51,209 - -
Available for sale securities 6,088 6,131 - -
Held to maturity securities 3,569 4,590 - -
Held for trading securities 2,128 146 - -
Interest on impaired loans and advances - 34 - -
Interest on placements and bank balances 499 696 580 -
63,673 62,806 580 -
INTEREST EXPENSE
Interest on deposits 13,162 14,481 - -
Interest on borrowed funds 2,126 1,298 527 -
15,288 15,779 527 -
NET INTEREST INCOME 48,385 47,027 53 -
10. FEES AND COMMISSIONS INCOMERetail and corporate fee income 6,785 6,560 - -
Commission income 8,197 6,628 - -
Custodian fee income 169 131 - -
15,151 13,319 - -
Commission expense (457) (695) - -
14,694 12,624 - -
11. FOREIGN EXCHANGE GAINSForeign currency dealings 4,095 2,429 6 -
Translation gains 571 3,065 - -
4,666 5,494 6 -
12. DIVIDEND INCOMEDividend income from subsidiaries - - 12,417 87
- - 12,417 87
13. OTHER OPERATING INCOMERent income 214 166 - -
Profit on disposal of property and equipment 12 7 - -
Management fees 200 462 - -
Income/(loss) on disposal of securities 337 1,726 - -
Risk premium 1,850 950 - -
Miscellaneous income 1,027 1,020 116 120
3,640 4,331 116 120
NOTES TO THE FINANCIAL STATEMENTS FOR THE YEAR ENDED 31 DECEMBER 2017
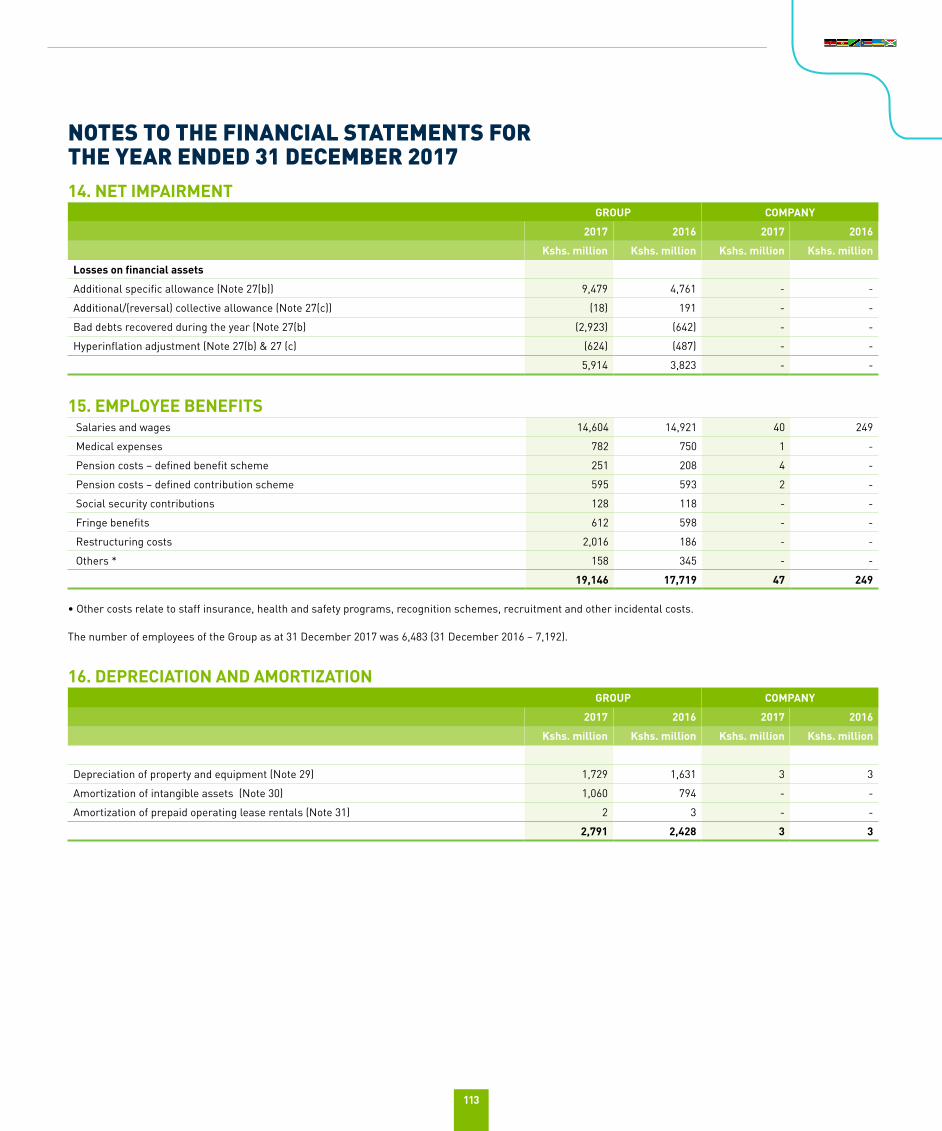
113
14. NET IMPAIRMENTGROUP COMPANY
2017 2016 2017 2016
Kshs. million Kshs. million Kshs. million Kshs. million
Losses on financial assets
Additional specific allowance (Note 27(b)) 9,479 4,761 - -
Additional/(reversal) collective allowance (Note 27(c)) (18) 191 - -
Bad debts recovered during the year (Note 27(b) (2,923) (642) - -
Hyperinflation adjustment (Note 27(b) & 27 (c) (624) (487) - -
5,914 3,823 - -
15. EMPLOYEE BENEFITS Salaries and wages 14,604 14,921 40 249
Medical expenses 782 750 1 -
Pension costs – defined benefit scheme 251 208 4 -
Pension costs – defined contribution scheme 595 593 2 -
Social security contributions 128 118 - -
Fringe benefits 612 598 - -
Restructuring costs 2,016 186 - -
Others * 158 345 - -
19,146 17,719 47 249
• Other costs relate to staff insurance, health and safety programs, recognition schemes, recruitment and other incidental costs.
The number of employees of the Group as at 31 December 2017 was 6,483 (31 December 2016 – 7,192).
16. DEPRECIATION AND AMORTIZATIONGROUP COMPANY
2017 2016 2017 2016
Kshs. million Kshs. million Kshs. million Kshs. million
Depreciation of property and equipment (Note 29) 1,729 1,631 3 3
Amortization of intangible assets (Note 30) 1,060 794 - -
Amortization of prepaid operating lease rentals (Note 31) 2 3 - -
2,791 2,428 3 3
NOTES TO THE FINANCIAL STATEMENTS FOR THE YEAR ENDED 31 DECEMBER 2017
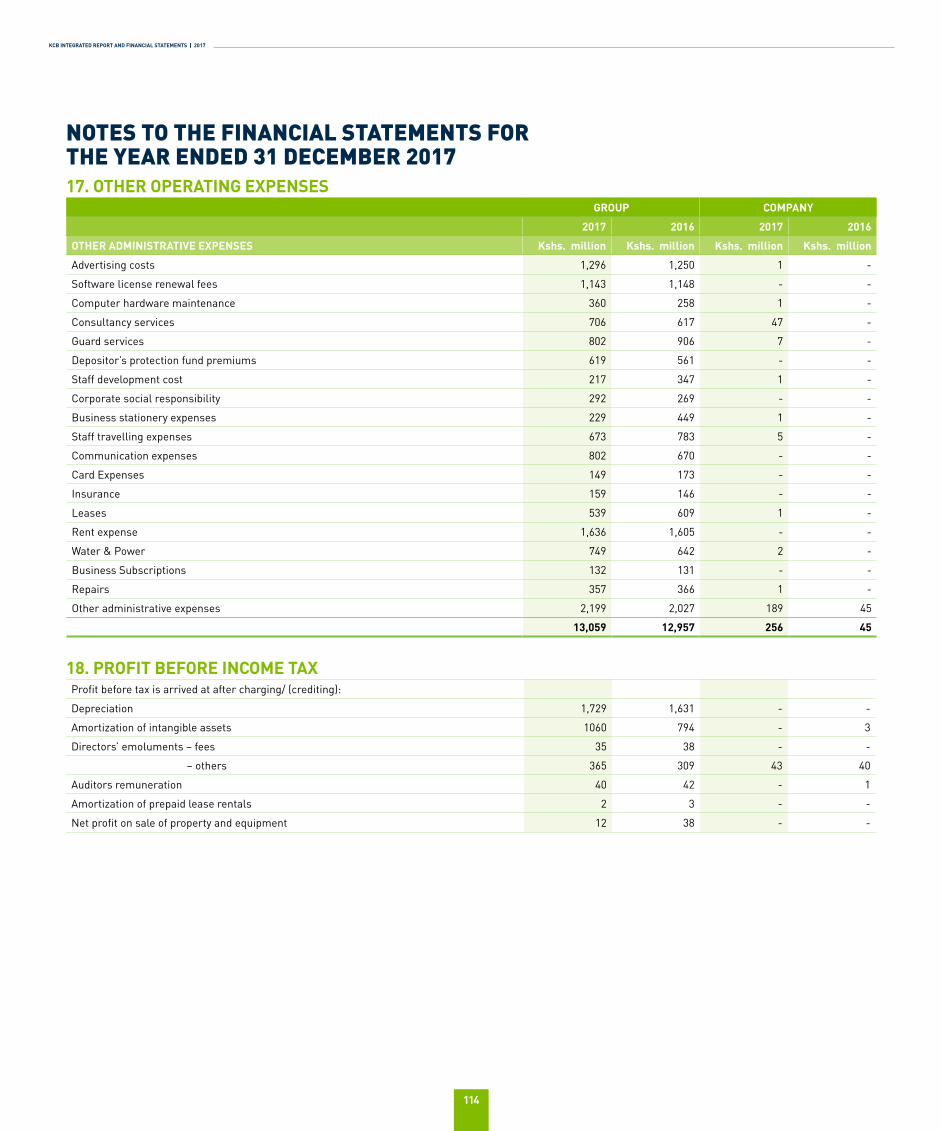
KCB INTEGRATED REPORT AND FINANCIAL STATEMENTS | 2017
114
17. OTHER OPERATING EXPENSESGROUP COMPANY
2017 2016 2017 2016
OTHER ADMINISTRATIVE EXPENSES Kshs. million Kshs. million Kshs. million Kshs. million
Advertising costs 1,296 1,250 1 -
Software license renewal fees 1,143 1,148 - -
Computer hardware maintenance 360 258 1 -
Consultancy services 706 617 47 -
Guard services 802 906 7 -
Depositor’s protection fund premiums 619 561 - -
Staff development cost 217 347 1 -
Corporate social responsibility 292 269 - -
Business stationery expenses 229 449 1 -
Staff travelling expenses 673 783 5 -
Communication expenses 802 670 - -
Card Expenses 149 173 - -
Insurance 159 146 - -
Leases 539 609 1 -
Rent expense 1,636 1,605 - -
Water & Power 749 642 2 -
Business Subscriptions 132 131 - -
Repairs 357 366 1 -
Other administrative expenses 2,199 2,027 189 45
13,059 12,957 256 45
18. PROFIT BEFORE INCOME TAXProfit before tax is arrived at after charging/ (crediting):
Depreciation 1,729 1,631 - -
Amortization of intangible assets 1060 794 - 3
Directors’ emoluments – fees 35 38 - -
– others 365 309 43 40
Auditors remuneration 40 42 - 1
Amortization of prepaid lease rentals 2 3 - -
Net profit on sale of property and equipment 12 38 - -
NOTES TO THE FINANCIAL STATEMENTS FOR THE YEAR ENDED 31 DECEMBER 2017
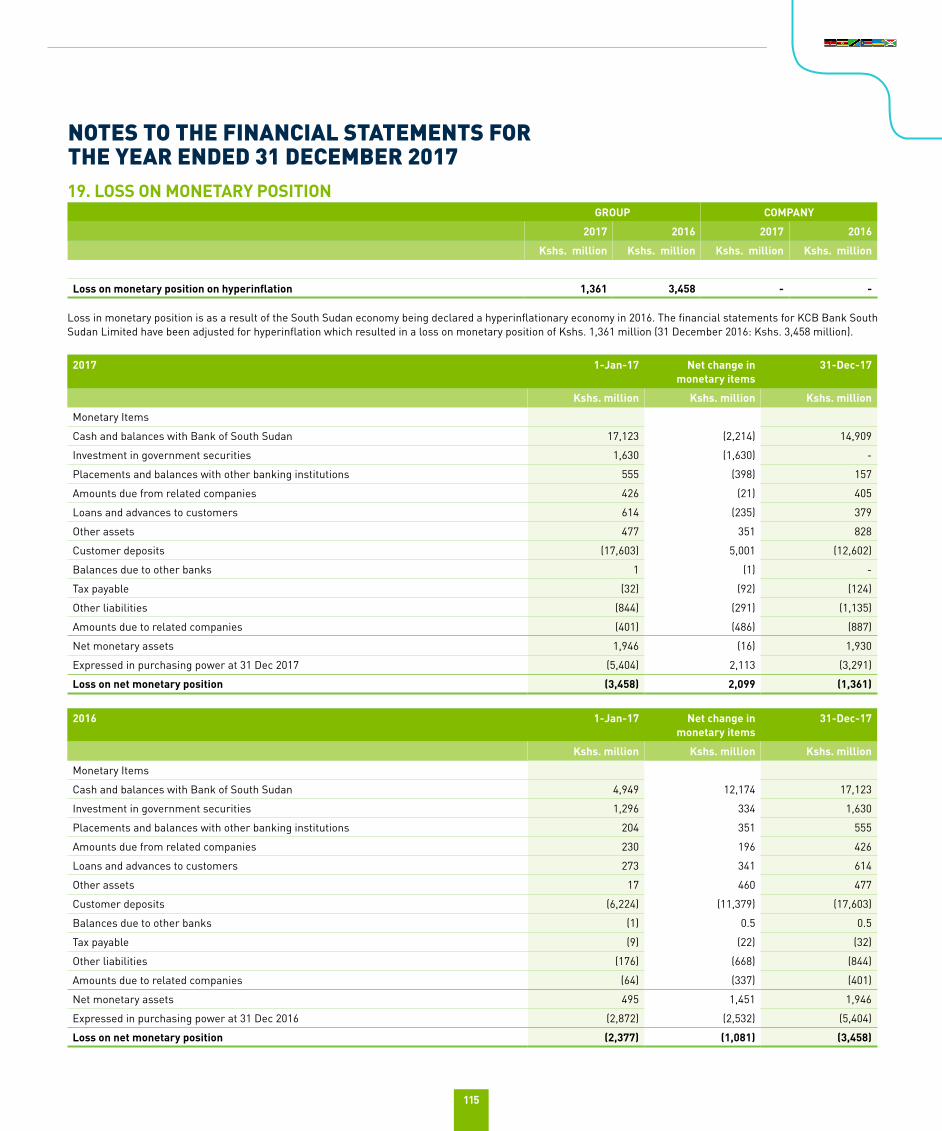
115
19. LOSS ON MONETARY POSITIONGROUP COMPANY
2017 2016 2017 2016
Kshs. million Kshs. million Kshs. million Kshs. million
Loss on monetary position on hyperinflation 1,361 3,458 - -
Loss in monetary position is as a result of the South Sudan economy being declared a hyperinflationary economy in 2016. The financial statements for KCB Bank South Sudan Limited have been adjusted for hyperinflation which resulted in a loss on monetary position of Kshs. 1,361 million (31 December 2016: Kshs. 3,458 million).
2017 1-Jan-17 Net change in monetary items
31-Dec-17
Kshs. million Kshs. million Kshs. million
Monetary Items
Cash and balances with Bank of South Sudan 17,123 (2,214) 14,909
Investment in government securities 1,630 (1,630) -
Placements and balances with other banking institutions 555 (398) 157
Amounts due from related companies 426 (21) 405
Loans and advances to customers 614 (235) 379
Other assets 477 351 828
Customer deposits (17,603) 5,001 (12,602)
Balances due to other banks 1 (1) -
Tax payable (32) (92) (124)
Other liabilities (844) (291) (1,135)
Amounts due to related companies (401) (486) (887)
Net monetary assets 1,946 (16) 1,930
Expressed in purchasing power at 31 Dec 2017 (5,404) 2,113 (3,291)
Loss on net monetary position (3,458) 2,099 (1,361)
2016 1-Jan-17 Net change in monetary items
31-Dec-17
Kshs. million Kshs. million Kshs. million
Monetary Items
Cash and balances with Bank of South Sudan 4,949 12,174 17,123
Investment in government securities 1,296 334 1,630
Placements and balances with other banking institutions 204 351 555
Amounts due from related companies 230 196 426
Loans and advances to customers 273 341 614
Other assets 17 460 477
Customer deposits (6,224) (11,379) (17,603)
Balances due to other banks (1) 0.5 0.5
Tax payable (9) (22) (32)
Other liabilities (176) (668) (844)
Amounts due to related companies (64) (337) (401)
Net monetary assets 495 1,451 1,946
Expressed in purchasing power at 31 Dec 2016 (2,872) (2,532) (5,404)
Loss on net monetary position (2,377) (1,081) (3,458)
NOTES TO THE FINANCIAL STATEMENTS FOR THE YEAR ENDED 31 DECEMBER 2017
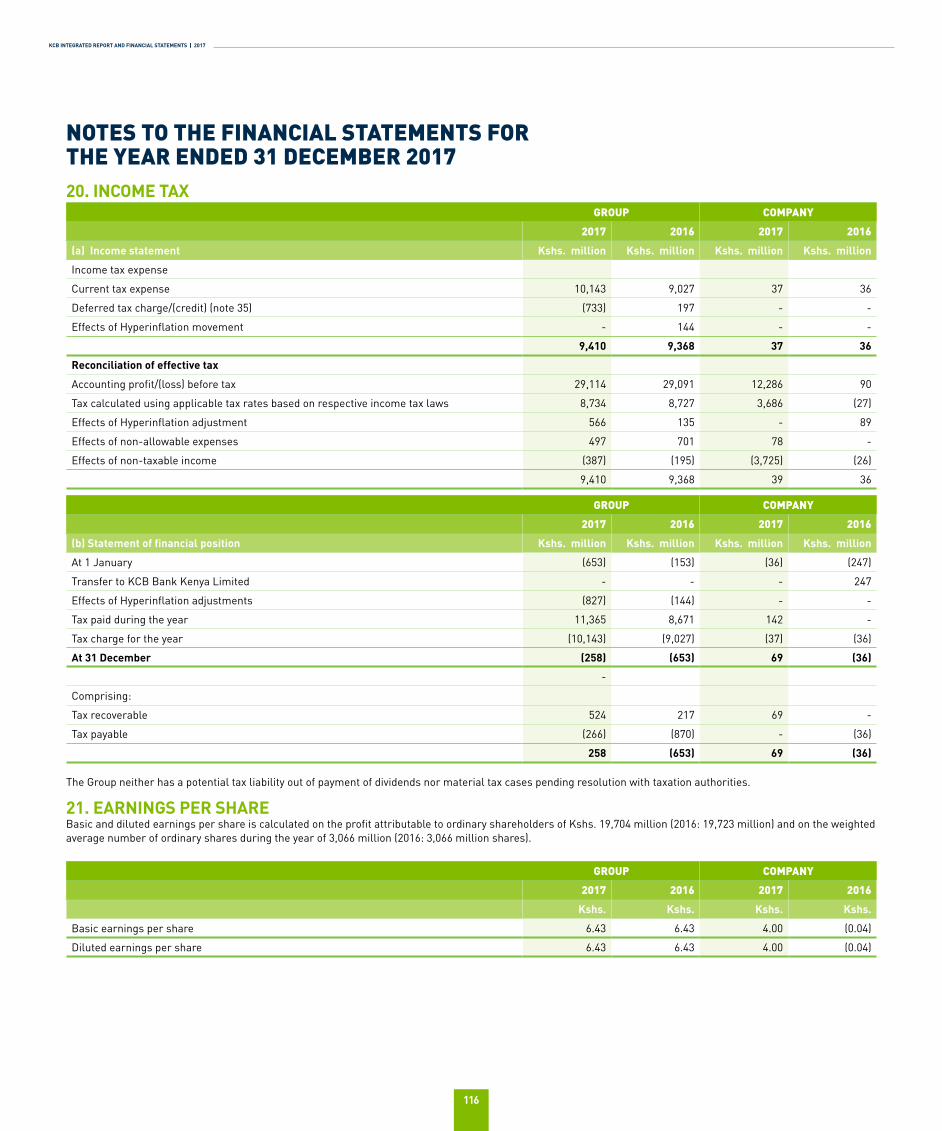
KCB INTEGRATED REPORT AND FINANCIAL STATEMENTS | 2017
116
20. INCOME TAXGROUP COMPANY
2017 2016 2017 2016
(a) Income statement Kshs. million Kshs. million Kshs. million Kshs. million
Income tax expense
Current tax expense 10,143 9,027 37 36
Deferred tax charge/(credit) (note 35) (733) 197 - -
Effects of Hyperinflation movement - 144 - -
9,410 9,368 37 36
Reconciliation of effective tax
Accounting profit/(loss) before tax 29,114 29,091 12,286 90
Tax calculated using applicable tax rates based on respective income tax laws 8,734 8,727 3,686 (27)
Effects of Hyperinflation adjustment 566 135 - 89
Effects of non-allowable expenses 497 701 78 -
Effects of non-taxable income (387) (195) (3,725) (26)
9,410 9,368 39 36
GROUP COMPANY
2017 2016 2017 2016
(b) Statement of financial position Kshs. million Kshs. million Kshs. million Kshs. million
At 1 January (653) (153) (36) (247)
Transfer to KCB Bank Kenya Limited - - - 247
Effects of Hyperinflation adjustments (827) (144) - -
Tax paid during the year 11,365 8,671 142 -
Tax charge for the year (10,143) (9,027) (37) (36)
At 31 December (258) (653) 69 (36)
-
Comprising:
Tax recoverable 524 217 69 -
Tax payable (266) (870) - (36)
258 (653) 69 (36)
The Group neither has a potential tax liability out of payment of dividends nor material tax cases pending resolution with taxation authorities.
21. EARNINGS PER SHAREBasic and diluted earnings per share is calculated on the profit attributable to ordinary shareholders of Kshs. 19,704 million (2016: 19,723 million) and on the weighted average number of ordinary shares during the year of 3,066 million (2016: 3,066 million shares).
GROUP COMPANY
2017 2016 2017 2016
Kshs. Kshs. Kshs. Kshs.
Basic earnings per share 6.43 6.43 4.00 (0.04)
Diluted earnings per share 6.43 6.43 4.00 (0.04)
NOTES TO THE FINANCIAL STATEMENTS FOR THE YEAR ENDED 31 DECEMBER 2017
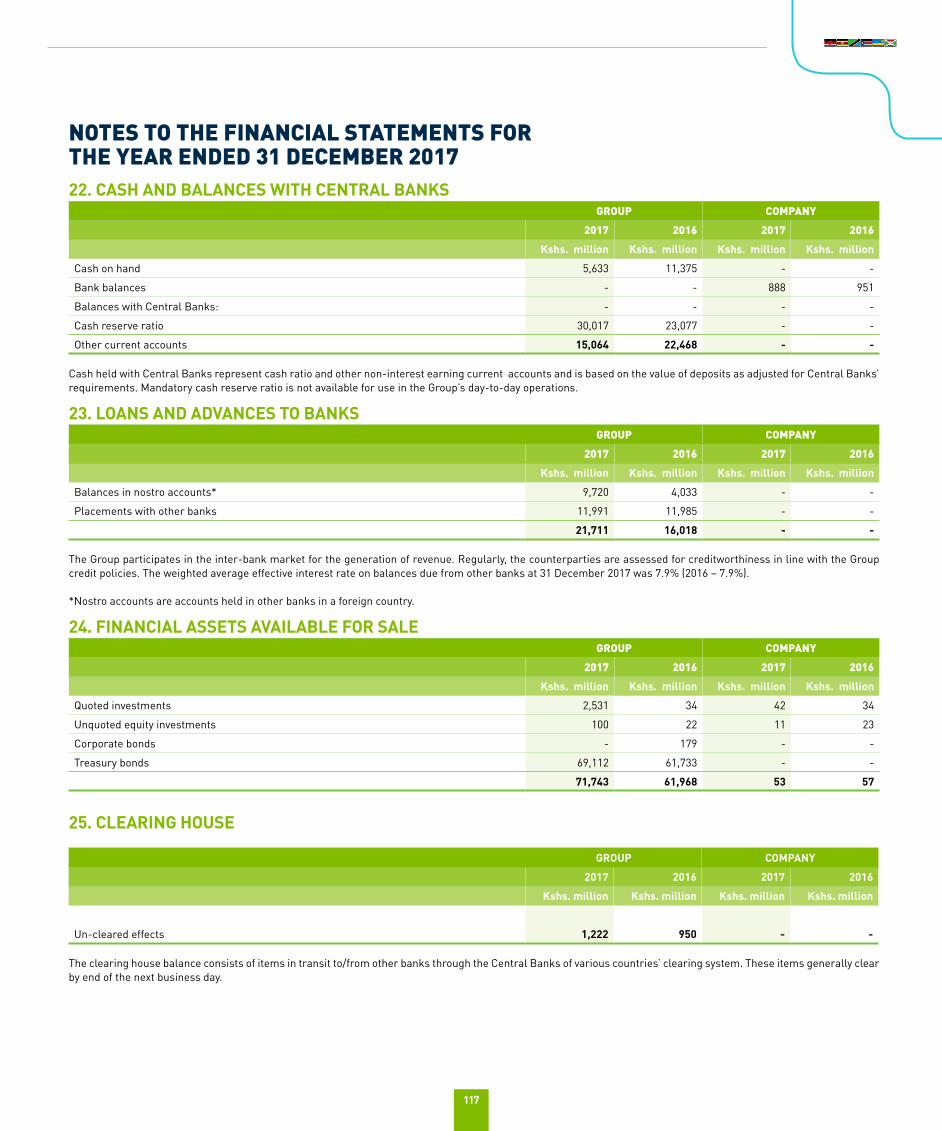
117
22. CASH AND BALANCES WITH CENTRAL BANKSGROUP COMPANY
2017 2016 2017 2016
Kshs. million Kshs. million Kshs. million Kshs. million
Cash on hand 5,633 11,375 - -
Bank balances - - 888 951
Balances with Central Banks: - - - -
Cash reserve ratio 30,017 23,077 - -
Other current accounts 15,064 22,468 - -
Cash held with Central Banks represent cash ratio and other non-interest earning current accounts and is based on the value of deposits as adjusted for Central Banks’ requirements. Mandatory cash reserve ratio is not available for use in the Group’s day-to-day operations.
23. LOANS AND ADVANCES TO BANKSGROUP COMPANY
2017 2016 2017 2016
Kshs. million Kshs. million Kshs. million Kshs. million
Balances in nostro accounts* 9,720 4,033 - -
Placements with other banks 11,991 11,985 - -
21,711 16,018 - -
The Group participates in the inter-bank market for the generation of revenue. Regularly, the counterparties are assessed for creditworthiness in line with the Group credit policies. The weighted average effective interest rate on balances due from other banks at 31 December 2017 was 7.9% (2016 – 7.9%).
*Nostro accounts are accounts held in other banks in a foreign country.
24. FINANCIAL ASSETS AVAILABLE FOR SALEGROUP COMPANY
2017 2016 2017 2016
Kshs. million Kshs. million Kshs. million Kshs. million
Quoted investments 2,531 34 42 34
Unquoted equity investments 100 22 11 23
Corporate bonds - 179 - -
Treasury bonds 69,112 61,733 - -
71,743 61,968 53 57
25. CLEARING HOUSE
GROUP COMPANY
2017 2016 2017 2016
Kshs. million Kshs. million Kshs. million Kshs. million
Un-cleared effects 1,222 950 - -
The clearing house balance consists of items in transit to/from other banks through the Central Banks of various countries’ clearing system. These items generally clear by end of the next business day.
NOTES TO THE FINANCIAL STATEMENTS FOR THE YEAR ENDED 31 DECEMBER 2017
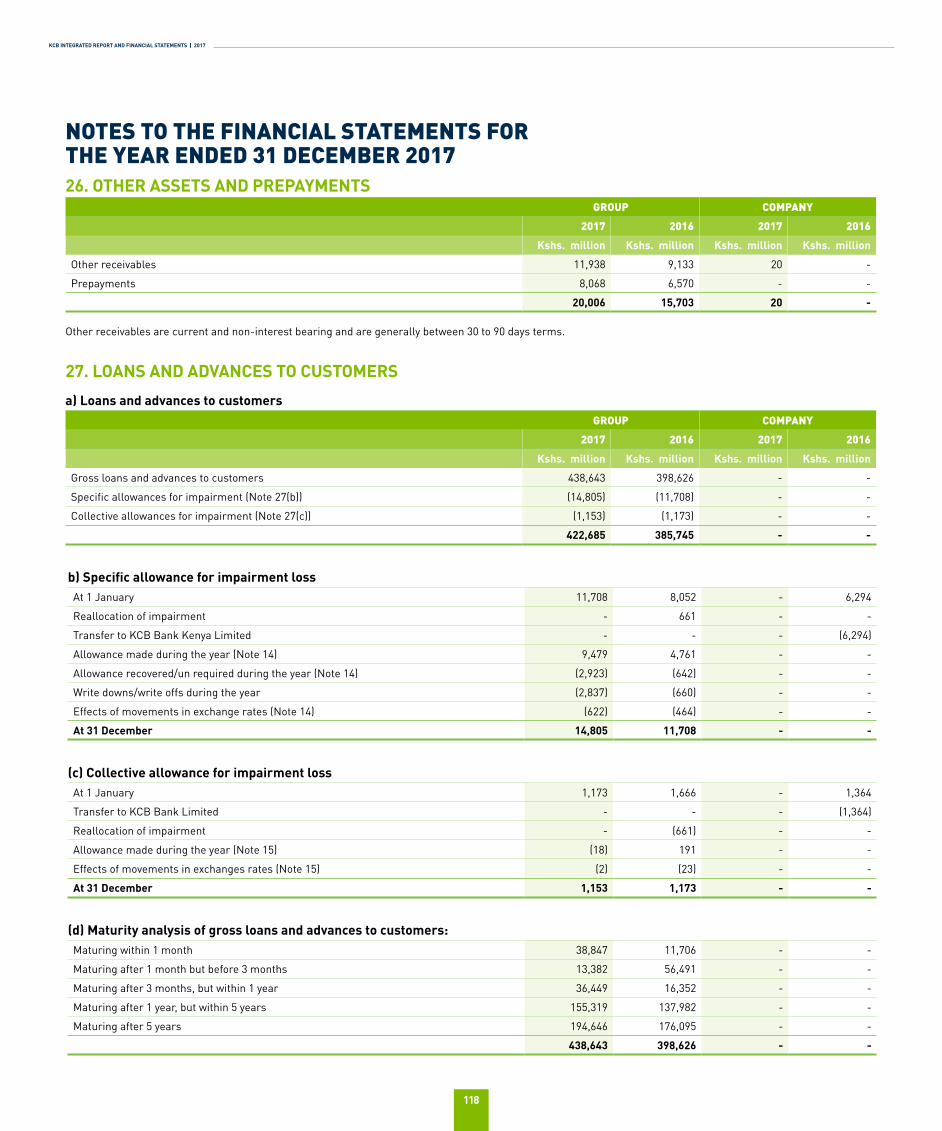
KCB INTEGRATED REPORT AND FINANCIAL STATEMENTS | 2017
118
26. OTHER ASSETS AND PREPAYMENTSGROUP COMPANY
2017 2016 2017 2016
Kshs. million Kshs. million Kshs. million Kshs. million
Other receivables 11,938 9,133 20 -
Prepayments 8,068 6,570 - -
20,006 15,703 20 -
Other receivables are current and non-interest bearing and are generally between 30 to 90 days terms.
27. LOANS AND ADVANCES TO CUSTOMERS
a) Loans and advances to customers GROUP COMPANY
2017 2016 2017 2016
Kshs. million Kshs. million Kshs. million Kshs. million
Gross loans and advances to customers 438,643 398,626 - -
Specific allowances for impairment (Note 27(b)) (14,805) (11,708) - -
Collective allowances for impairment (Note 27(c)) (1,153) (1,173) - -
422,685 385,745 - -
b) Specific allowance for impairment lossAt 1 January 11,708 8,052 - 6,294
Reallocation of impairment - 661 - -
Transfer to KCB Bank Kenya Limited - - - (6,294)
Allowance made during the year (Note 14) 9,479 4,761 - -
Allowance recovered/un required during the year (Note 14) (2,923) (642) - -
Write downs/write offs during the year (2,837) (660) - -
Effects of movements in exchange rates (Note 14) (622) (464) - -
At 31 December 14,805 11,708 - -
(c) Collective allowance for impairment lossAt 1 January 1,173 1,666 - 1,364
Transfer to KCB Bank Limited - - - (1,364)
Reallocation of impairment - (661) - -
Allowance made during the year (Note 15) (18) 191 - -
Effects of movements in exchanges rates (Note 15) (2) (23) - -
At 31 December 1,153 1,173 - -
(d) Maturity analysis of gross loans and advances to customers:Maturing within 1 month 38,847 11,706 - -
Maturing after 1 month but before 3 months 13,382 56,491 - -
Maturing after 3 months, but within 1 year 36,449 16,352 - -
Maturing after 1 year, but within 5 years 155,319 137,982 - -
Maturing after 5 years 194,646 176,095 - -
438,643 398,626 - -
NOTES TO THE FINANCIAL STATEMENTS FOR THE YEAR ENDED 31 DECEMBER 2017
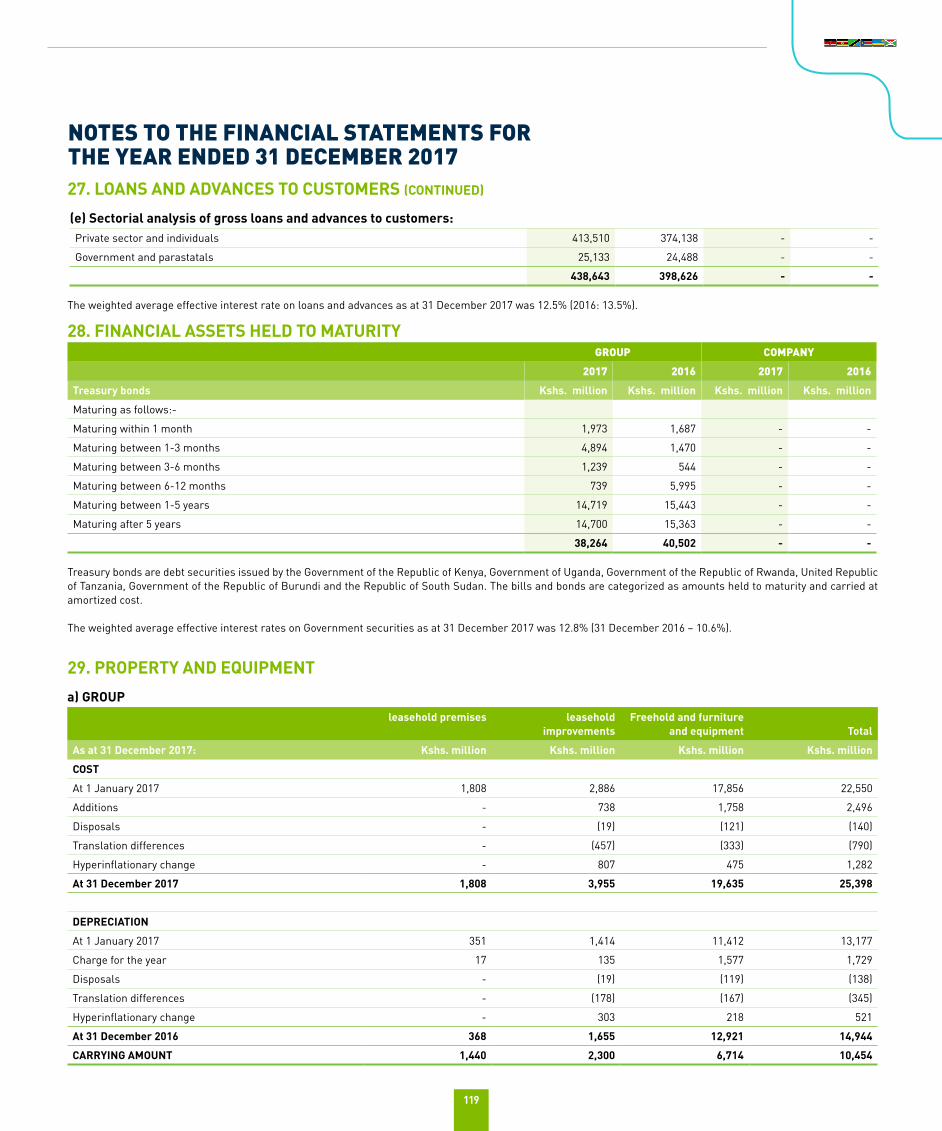
119
27. LOANS AND ADVANCES TO CUSTOMERS (CONTINUED)
(e) Sectorial analysis of gross loans and advances to customers:Private sector and individuals 413,510 374,138 - -
Government and parastatals 25,133 24,488 - -
438,643 398,626 - -
The weighted average effective interest rate on loans and advances as at 31 December 2017 was 12.5% (2016: 13.5%).
28. FINANCIAL ASSETS HELD TO MATURITYGROUP COMPANY
2017 2016 2017 2016
Treasury bonds Kshs. million Kshs. million Kshs. million Kshs. million
Maturing as follows:-
Maturing within 1 month 1,973 1,687 - -
Maturing between 1-3 months 4,894 1,470 - -
Maturing between 3-6 months 1,239 544 - -
Maturing between 6-12 months 739 5,995 - -
Maturing between 1-5 years 14,719 15,443 - -
Maturing after 5 years 14,700 15,363 - -
38,264 40,502 - -
Treasury bonds are debt securities issued by the Government of the Republic of Kenya, Government of Uganda, Government of the Republic of Rwanda, United Republic of Tanzania, Government of the Republic of Burundi and the Republic of South Sudan. The bills and bonds are categorized as amounts held to maturity and carried at amortized cost.
The weighted average effective interest rates on Government securities as at 31 December 2017 was 12.8% (31 December 2016 – 10.6%).
29. PROPERTY AND EQUIPMENT
a) GROUPleasehold premises leasehold
improvementsFreehold and furniture
and equipment Total
As at 31 December 2017: Kshs. million Kshs. million Kshs. million Kshs. million
COST
At 1 January 2017 1,808 2,886 17,856 22,550
Additions - 738 1,758 2,496
Disposals - (19) (121) (140)
Translation differences - (457) (333) (790)
Hyperinflationary change - 807 475 1,282
At 31 December 2017 1,808 3,955 19,635 25,398
DEPRECIATION
At 1 January 2017 351 1,414 11,412 13,177
Charge for the year 17 135 1,577 1,729
Disposals - (19) (119) (138)
Translation differences - (178) (167) (345)
Hyperinflationary change - 303 218 521
At 31 December 2016 368 1,655 12,921 14,944
CARRYING AMOUNT 1,440 2,300 6,714 10,454
NOTES TO THE FINANCIAL STATEMENTS FOR THE YEAR ENDED 31 DECEMBER 2017
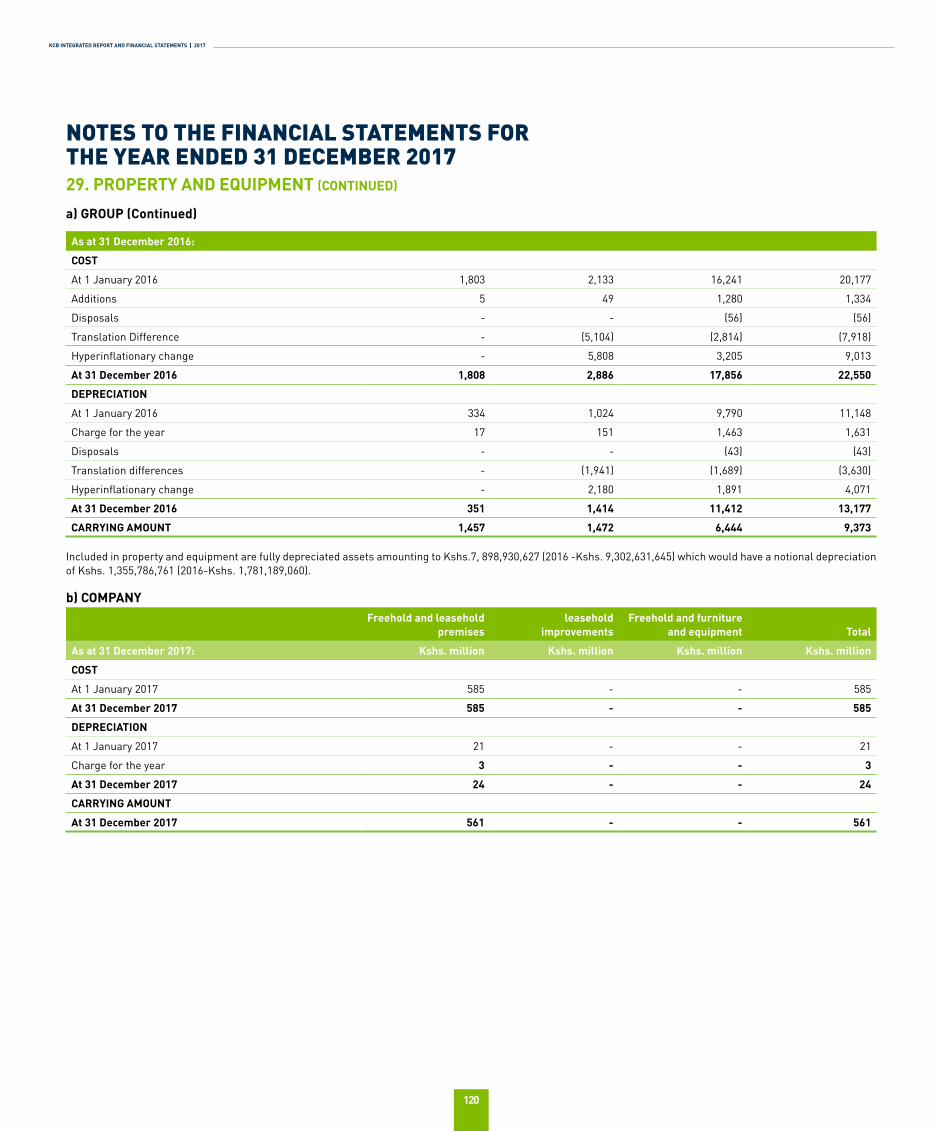
KCB INTEGRATED REPORT AND FINANCIAL STATEMENTS | 2017
120
As at 31 December 2016:
COST
At 1 January 2016 1,803 2,133 16,241 20,177
Additions 5 49 1,280 1,334
Disposals - - (56) (56)
Translation Difference - (5,104) (2,814) (7,918)
Hyperinflationary change - 5,808 3,205 9,013
At 31 December 2016 1,808 2,886 17,856 22,550
DEPRECIATION
At 1 January 2016 334 1,024 9,790 11,148
Charge for the year 17 151 1,463 1,631
Disposals - - (43) (43)
Translation differences - (1,941) (1,689) (3,630)
Hyperinflationary change - 2,180 1,891 4,071
At 31 December 2016 351 1,414 11,412 13,177
CARRYING AMOUNT 1,457 1,472 6,444 9,373
Included in property and equipment are fully depreciated assets amounting to Kshs.7, 898,930,627 (2016 -Kshs. 9,302,631,645) which would have a notional depreciation of Kshs. 1,355,786,761 (2016-Kshs. 1,781,189,060).
b) COMPANYFreehold and leasehold
premisesleasehold
improvementsFreehold and furniture
and equipment Total
As at 31 December 2017: Kshs. million Kshs. million Kshs. million Kshs. million
COST
At 1 January 2017 585 - - 585
At 31 December 2017 585 - - 585
DEPRECIATION
At 1 January 2017 21 - - 21
Charge for the year 3 - - 3
At 31 December 2017 24 - - 24
CARRYING AMOUNT
At 31 December 2017 561 - - 561
29. PROPERTY AND EQUIPMENT (CONTINUED)
a) GROUP (Continued)
NOTES TO THE FINANCIAL STATEMENTS FOR THE YEAR ENDED 31 DECEMBER 2017
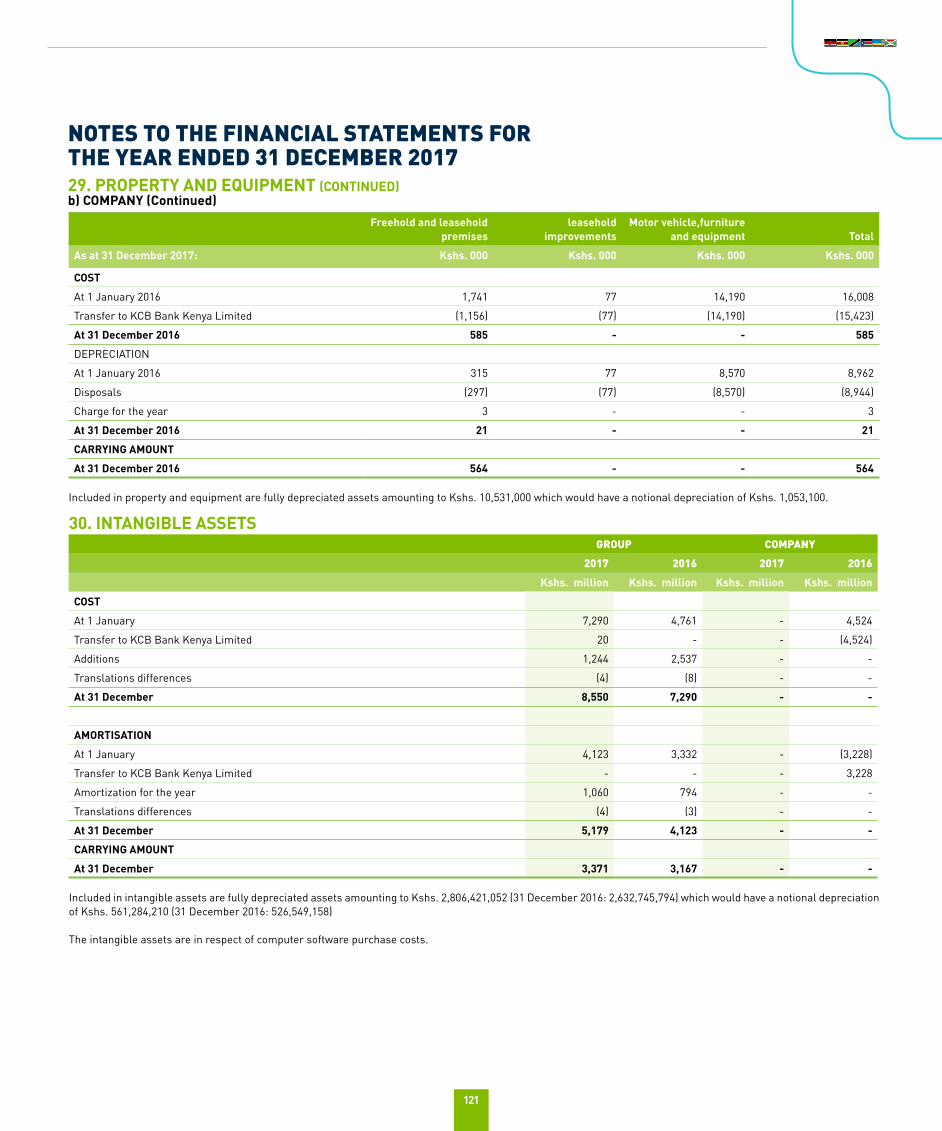
121
Freehold and leasehold premises
leasehold improvements
Motor vehicle,furniture and equipment Total
As at 31 December 2017: Kshs. 000 Kshs. 000 Kshs. 000 Kshs. 000
COST
At 1 January 2016 1,741 77 14,190 16,008
Transfer to KCB Bank Kenya Limited (1,156) (77) (14,190) (15,423)
At 31 December 2016 585 - - 585
DEPRECIATION
At 1 January 2016 315 77 8,570 8,962
Disposals (297) (77) (8,570) (8,944)
Charge for the year 3 - - 3
At 31 December 2016 21 - - 21
CARRYING AMOUNT
At 31 December 2016 564 - - 564
Included in property and equipment are fully depreciated assets amounting to Kshs. 10,531,000 which would have a notional depreciation of Kshs. 1,053,100.
30. INTANGIBLE ASSETSGROUP COMPANY
2017 2016 2017 2016
Kshs. million Kshs. million Kshs. million Kshs. million
COST
At 1 January 7,290 4,761 - 4,524
Transfer to KCB Bank Kenya Limited 20 - - (4,524)
Additions 1,244 2,537 - -
Translations differences (4) (8) - -
At 31 December 8,550 7,290 - -
AMORTISATION
At 1 January 4,123 3,332 - (3,228)
Transfer to KCB Bank Kenya Limited - - - 3,228
Amortization for the year 1,060 794 - -
Translations differences (4) (3) - -
At 31 December 5,179 4,123 - -
CARRYING AMOUNT
At 31 December 3,371 3,167 - -
Included in intangible assets are fully depreciated assets amounting to Kshs. 2,806,421,052 (31 December 2016: 2,632,745,794) which would have a notional depreciation of Kshs. 561,284,210 (31 December 2016: 526,549,158)
The intangible assets are in respect of computer software purchase costs.
29. PROPERTY AND EQUIPMENT (CONTINUED)b) COMPANY (Continued)
NOTES TO THE FINANCIAL STATEMENTS FOR THE YEAR ENDED 31 DECEMBER 2017
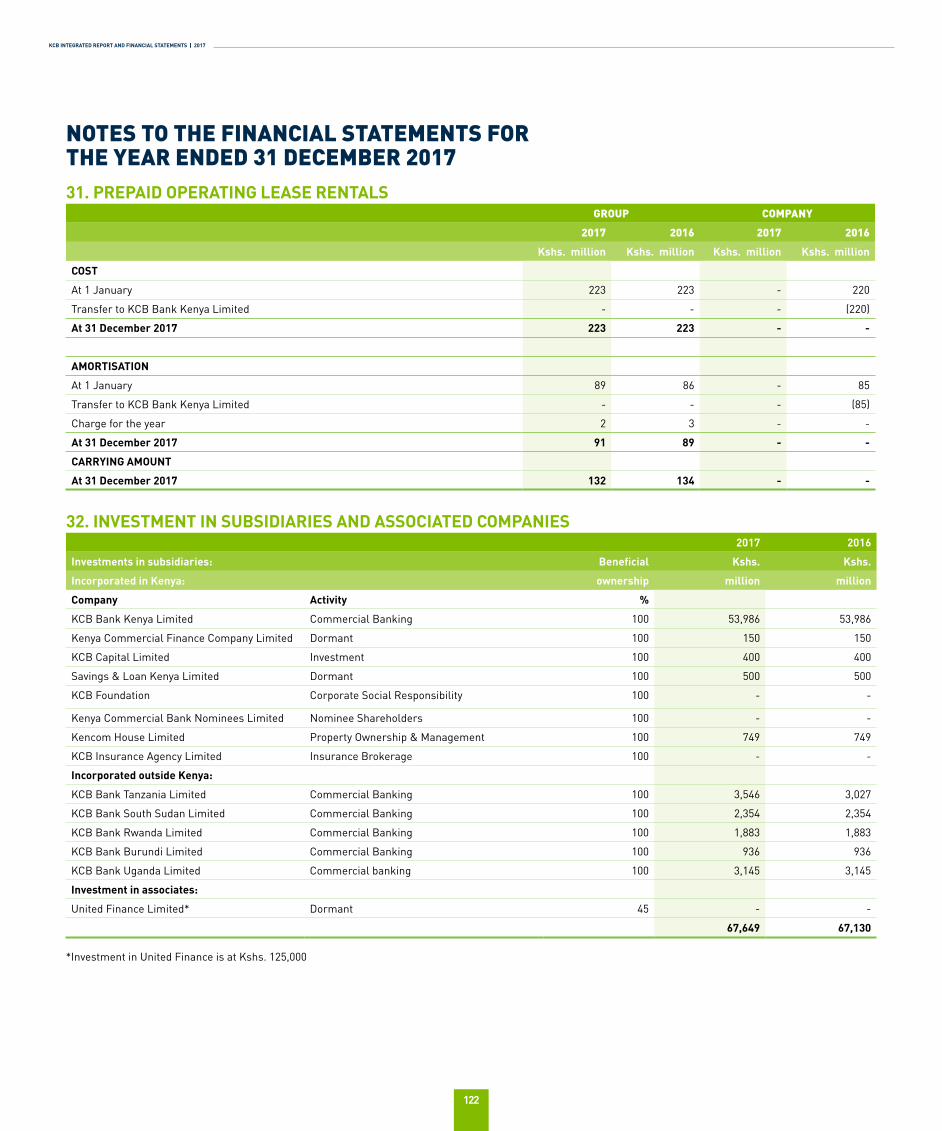
KCB INTEGRATED REPORT AND FINANCIAL STATEMENTS | 2017
122
31. PREPAID OPERATING LEASE RENTALSGROUP COMPANY
2017 2016 2017 2016
Kshs. million Kshs. million Kshs. million Kshs. million
COST
At 1 January 223 223 - 220
Transfer to KCB Bank Kenya Limited - - - (220)
At 31 December 2017 223 223 - -
AMORTISATION
At 1 January 89 86 - 85
Transfer to KCB Bank Kenya Limited - - - (85)
Charge for the year 2 3 - -
At 31 December 2017 91 89 - -
CARRYING AMOUNT
At 31 December 2017 132 134 - -
32. INVESTMENT IN SUBSIDIARIES AND ASSOCIATED COMPANIES2017 2016
Investments in subsidiaries: Beneficial Kshs. Kshs.
Incorporated in Kenya: ownership million million
Company Activity %
KCB Bank Kenya Limited Commercial Banking 100 53,986 53,986
Kenya Commercial Finance Company Limited Dormant 100 150 150
KCB Capital Limited Investment 100 400 400
Savings & Loan Kenya Limited Dormant 100 500 500
KCB Foundation Corporate Social Responsibility 100 - -
Kenya Commercial Bank Nominees Limited Nominee Shareholders 100 - -
Kencom House Limited Property Ownership & Management 100 749 749
KCB Insurance Agency Limited Insurance Brokerage 100 - -
Incorporated outside Kenya:
KCB Bank Tanzania Limited Commercial Banking 100 3,546 3,027
KCB Bank South Sudan Limited Commercial Banking 100 2,354 2,354
KCB Bank Rwanda Limited Commercial Banking 100 1,883 1,883
KCB Bank Burundi Limited Commercial Banking 100 936 936
KCB Bank Uganda Limited Commercial banking 100 3,145 3,145
Investment in associates:
United Finance Limited* Dormant 45 - -
67,649 67,130
*Investment in United Finance is at Kshs. 125,000
NOTES TO THE FINANCIAL STATEMENTS FOR THE YEAR ENDED 31 DECEMBER 2017
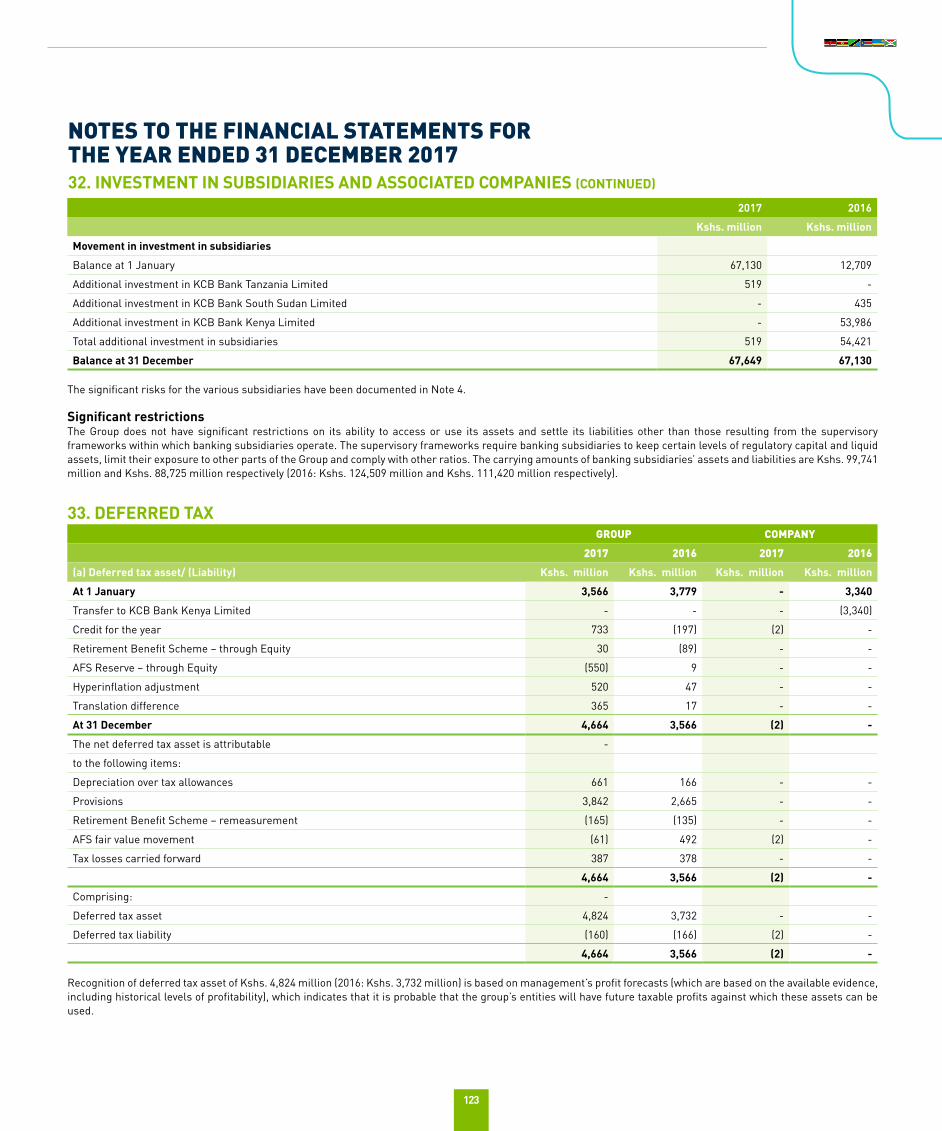
123
2017 2016
Kshs. million Kshs. million
Movement in investment in subsidiaries
Balance at 1 January 67,130 12,709
Additional investment in KCB Bank Tanzania Limited 519 -
Additional investment in KCB Bank South Sudan Limited - 435
Additional investment in KCB Bank Kenya Limited - 53,986
Total additional investment in subsidiaries 519 54,421
Balance at 31 December 67,649 67,130
The significant risks for the various subsidiaries have been documented in Note 4.
Significant restrictionsThe Group does not have significant restrictions on its ability to access or use its assets and settle its liabilities other than those resulting from the supervisory frameworks within which banking subsidiaries operate. The supervisory frameworks require banking subsidiaries to keep certain levels of regulatory capital and liquid assets, limit their exposure to other parts of the Group and comply with other ratios. The carrying amounts of banking subsidiaries’ assets and liabilities are Kshs. 99,741 million and Kshs. 88,725 million respectively (2016: Kshs. 124,509 million and Kshs. 111,420 million respectively).
33. DEFERRED TAXGROUP COMPANY
2017 2016 2017 2016
(a) Deferred tax asset/ (Liability) Kshs. million Kshs. million Kshs. million Kshs. million
At 1 January 3,566 3,779 - 3,340
Transfer to KCB Bank Kenya Limited - - - (3,340)
Credit for the year 733 (197) (2) -
Retirement Benefit Scheme – through Equity 30 (89) - -
AFS Reserve – through Equity (550) 9 - -
Hyperinflation adjustment 520 47 - -
Translation difference 365 17 - -
At 31 December 4,664 3,566 (2) -
The net deferred tax asset is attributable -
to the following items:
Depreciation over tax allowances 661 166 - -
Provisions 3,842 2,665 - -
Retirement Benefit Scheme – remeasurement (165) (135) - -
AFS fair value movement (61) 492 (2) -
Tax losses carried forward 387 378 - -
4,664 3,566 (2) -
Comprising: -
Deferred tax asset 4,824 3,732 - -
Deferred tax liability (160) (166) (2) -
4,664 3,566 (2) -
Recognition of deferred tax asset of Kshs. 4,824 million (2016: Kshs. 3,732 million) is based on management’s profit forecasts (which are based on the available evidence, including historical levels of profitability), which indicates that it is probable that the group’s entities will have future taxable profits against which these assets can be used.
32. INVESTMENT IN SUBSIDIARIES AND ASSOCIATED COMPANIES (CONTINUED)
NOTES TO THE FINANCIAL STATEMENTS FOR THE YEAR ENDED 31 DECEMBER 2017
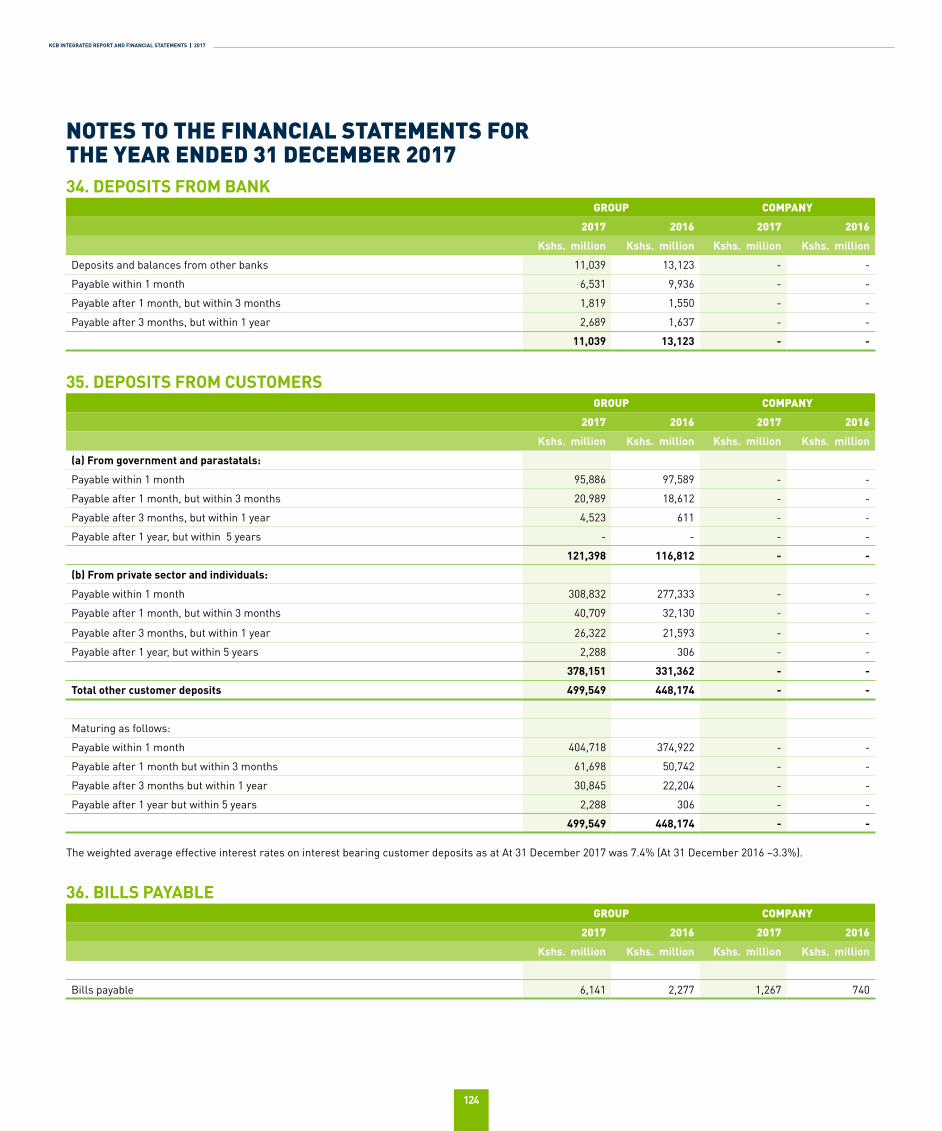
KCB INTEGRATED REPORT AND FINANCIAL STATEMENTS | 2017
124
34. DEPOSITS FROM BANKGROUP COMPANY
2017 2016 2017 2016
Kshs. million Kshs. million Kshs. million Kshs. million
Deposits and balances from other banks 11,039 13,123 - -
Payable within 1 month 6,531 9,936 - -
Payable after 1 month, but within 3 months 1,819 1,550 - -
Payable after 3 months, but within 1 year 2,689 1,637 - -
11,039 13,123 - -
35. DEPOSITS FROM CUSTOMERSGROUP COMPANY
2017 2016 2017 2016
Kshs. million Kshs. million Kshs. million Kshs. million
(a) From government and parastatals:
Payable within 1 month 95,886 97,589 - -
Payable after 1 month, but within 3 months 20,989 18,612 - -
Payable after 3 months, but within 1 year 4,523 611 - -
Payable after 1 year, but within 5 years - - - -
121,398 116,812 - -
(b) From private sector and individuals:
Payable within 1 month 308,832 277,333 - -
Payable after 1 month, but within 3 months 40,709 32,130 - -
Payable after 3 months, but within 1 year 26,322 21,593 - -
Payable after 1 year, but within 5 years 2,288 306 - -
378,151 331,362 - -
Total other customer deposits 499,549 448,174 - -
Maturing as follows:
Payable within 1 month 404,718 374,922 - -
Payable after 1 month but within 3 months 61,698 50,742 - -
Payable after 3 months but within 1 year 30,845 22,204 - -
Payable after 1 year but within 5 years 2,288 306 - -
499,549 448,174 - -
The weighted average effective interest rates on interest bearing customer deposits as at At 31 December 2017 was 7.4% (At 31 December 2016 –3.3%).
36. BILLS PAYABLEGROUP COMPANY
2017 2016 2017 2016
Kshs. million Kshs. million Kshs. million Kshs. million
Bills payable 6,141 2,277 1,267 740
NOTES TO THE FINANCIAL STATEMENTS FOR THE YEAR ENDED 31 DECEMBER 2017
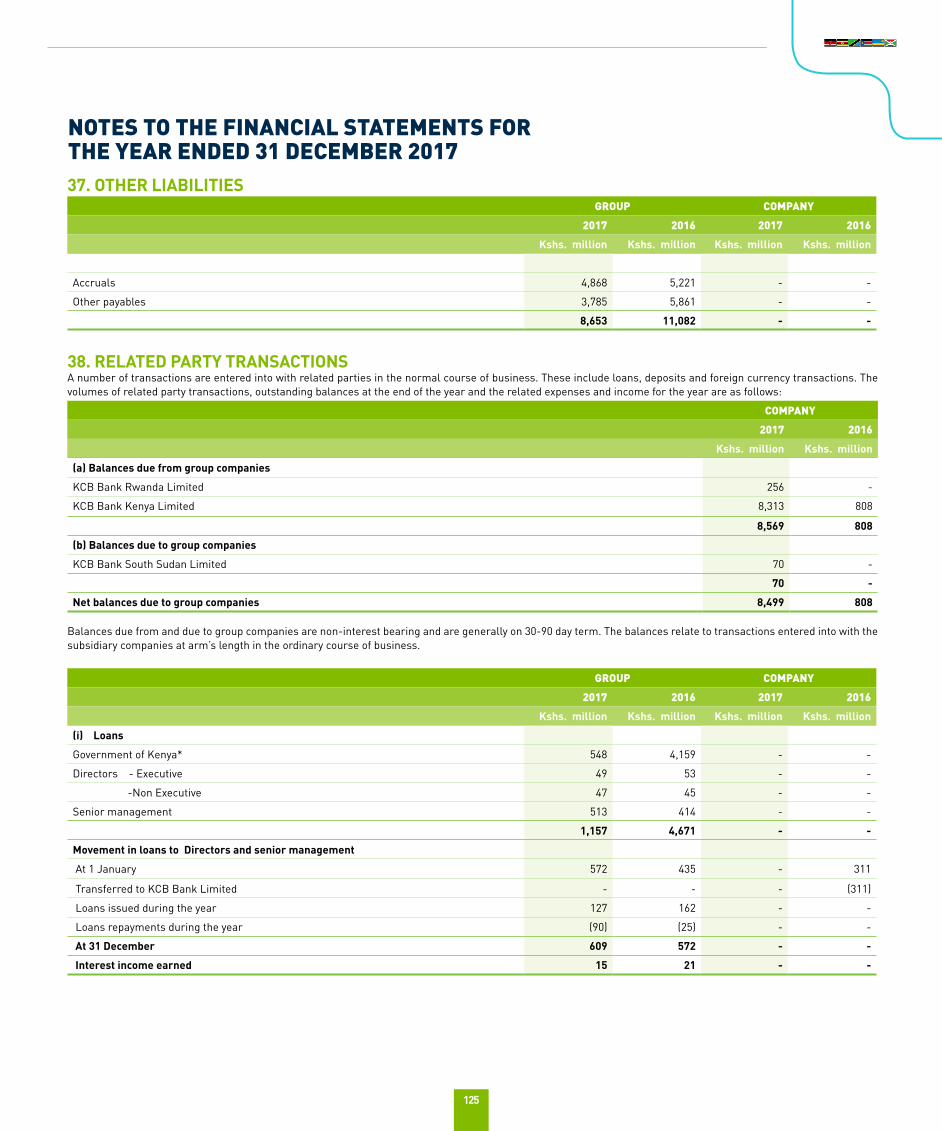
125
37. OTHER LIABILITIESGROUP COMPANY
2017 2016 2017 2016
Kshs. million Kshs. million Kshs. million Kshs. million
Accruals 4,868 5,221 - -
Other payables 3,785 5,861 - -
8,653 11,082 - -
38. RELATED PARTY TRANSACTIONSA number of transactions are entered into with related parties in the normal course of business. These include loans, deposits and foreign currency transactions. The volumes of related party transactions, outstanding balances at the end of the year and the related expenses and income for the year are as follows:
COMPANY
2017 2016
Kshs. million Kshs. million
(a) Balances due from group companies
KCB Bank Rwanda Limited 256 -
KCB Bank Kenya Limited 8,313 808
8,569 808
(b) Balances due to group companies
KCB Bank South Sudan Limited 70 -
70 -
Net balances due to group companies 8,499 808
Balances due from and due to group companies are non-interest bearing and are generally on 30-90 day term. The balances relate to transactions entered into with the subsidiary companies at arm’s length in the ordinary course of business.
GROUP COMPANY
2017 2016 2017 2016
Kshs. million Kshs. million Kshs. million Kshs. million
(i) Loans
Government of Kenya* 548 4,159 - -
Directors - Executive 49 53 - -
-Non Executive 47 45 - -
Senior management 513 414 - -
1,157 4,671 - -
Movement in loans to Directors and senior management
At 1 January 572 435 - 311
Transferred to KCB Bank Limited - - - (311)
Loans issued during the year 127 162 - -
Loans repayments during the year (90) (25) - -
At 31 December 609 572 - -
Interest income earned 15 21 - -
NOTES TO THE FINANCIAL STATEMENTS FOR THE YEAR ENDED 31 DECEMBER 2017
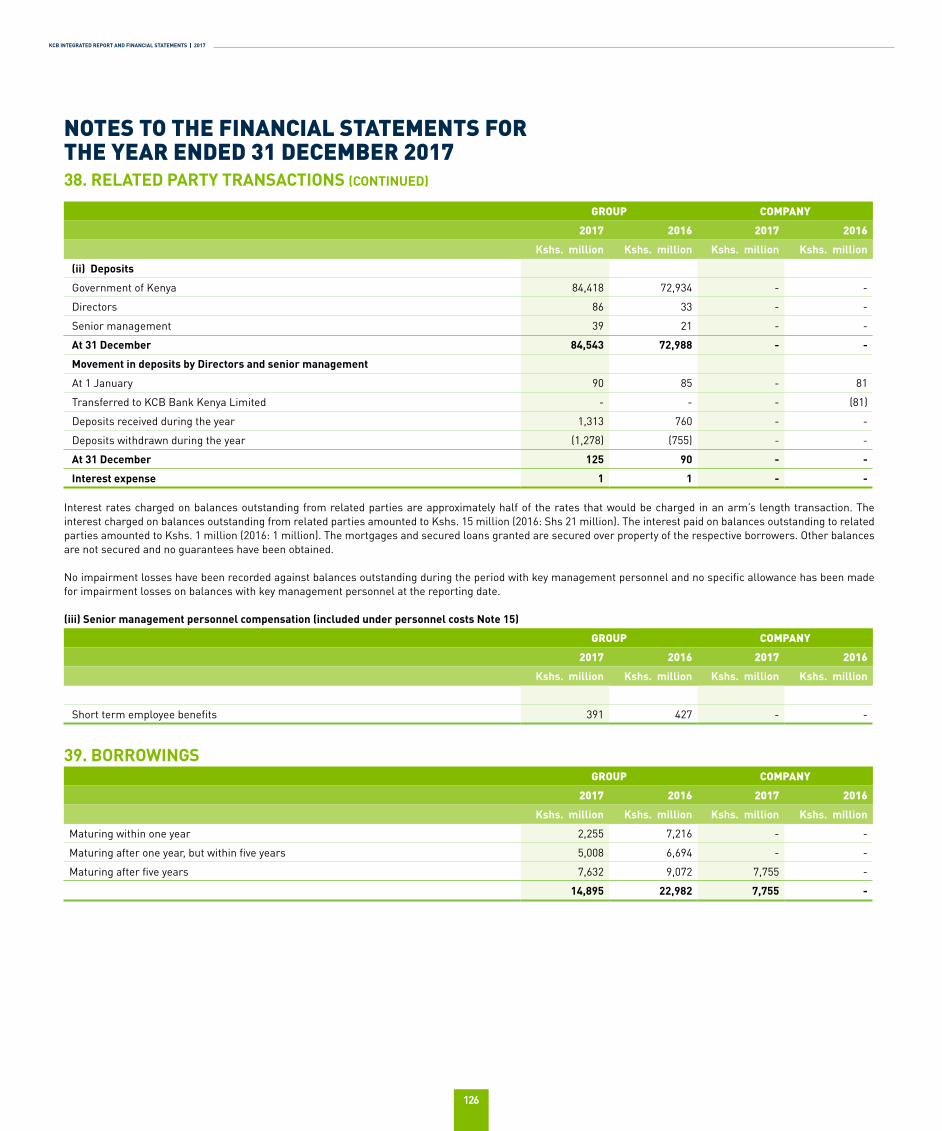
KCB INTEGRATED REPORT AND FINANCIAL STATEMENTS | 2017
126
GROUP COMPANY
2017 2016 2017 2016
Kshs. million Kshs. million Kshs. million Kshs. million
(ii) Deposits
Government of Kenya 84,418 72,934 - -
Directors 86 33 - -
Senior management 39 21 - -
At 31 December 84,543 72,988 - -
Movement in deposits by Directors and senior management
At 1 January 90 85 - 81
Transferred to KCB Bank Kenya Limited - - - (81)
Deposits received during the year 1,313 760 - -
Deposits withdrawn during the year (1,278) (755) - -
At 31 December 125 90 - -
Interest expense 1 1 - -
Interest rates charged on balances outstanding from related parties are approximately half of the rates that would be charged in an arm’s length transaction. The interest charged on balances outstanding from related parties amounted to Kshs. 15 million (2016: Shs 21 million). The interest paid on balances outstanding to related parties amounted to Kshs. 1 million (2016: 1 million). The mortgages and secured loans granted are secured over property of the respective borrowers. Other balances are not secured and no guarantees have been obtained.
No impairment losses have been recorded against balances outstanding during the period with key management personnel and no specific allowance has been made for impairment losses on balances with key management personnel at the reporting date.
(iii) Senior management personnel compensation (included under personnel costs Note 15)
GROUP COMPANY
2017 2016 2017 2016
Kshs. million Kshs. million Kshs. million Kshs. million
Short term employee benefits 391 427 - -
39. BORROWINGSGROUP COMPANY
2017 2016 2017 2016
Kshs. million Kshs. million Kshs. million Kshs. million
Maturing within one year 2,255 7,216 - -
Maturing after one year, but within five years 5,008 6,694 - -
Maturing after five years 7,632 9,072 7,755 -
14,895 22,982 7,755 -
38. RELATED PARTY TRANSACTIONS (CONTINUED)
NOTES TO THE FINANCIAL STATEMENTS FOR THE YEAR ENDED 31 DECEMBER 2017
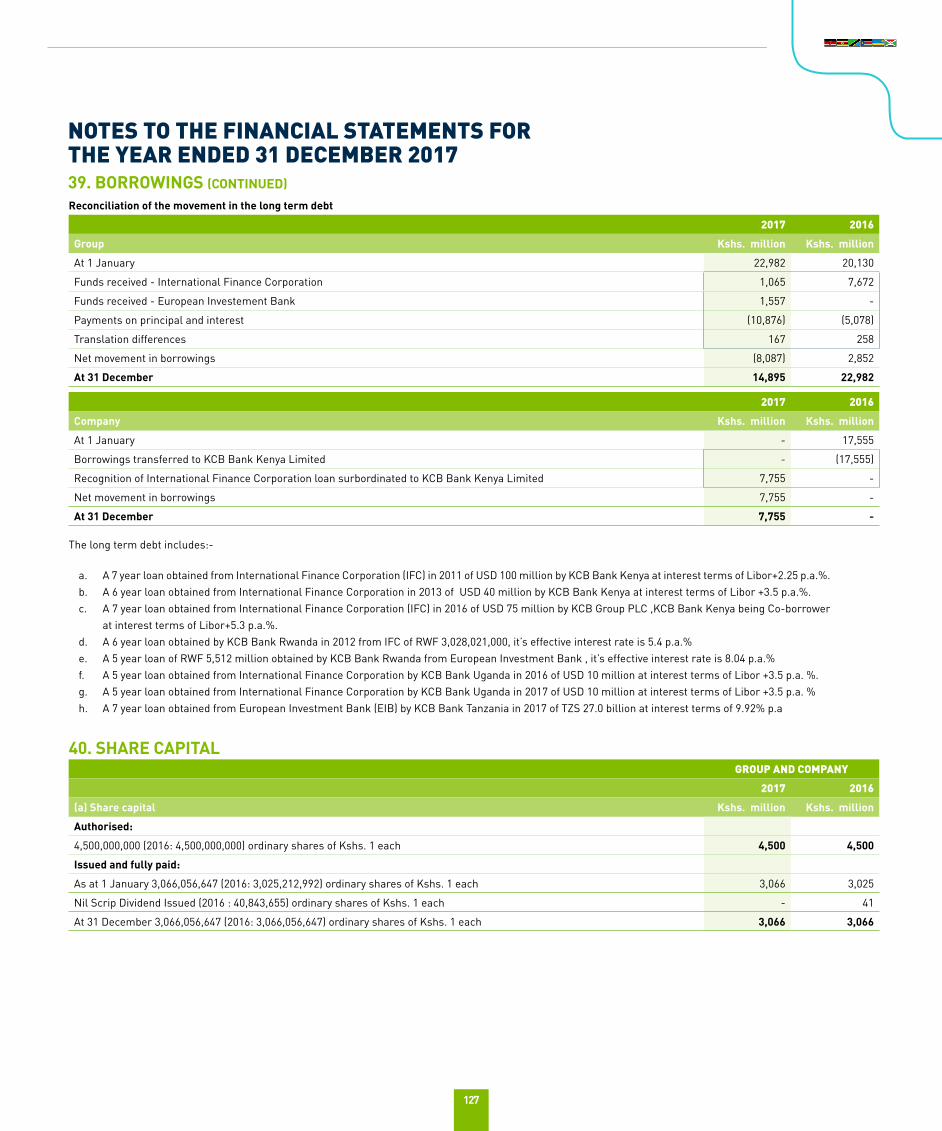
127
Reconciliation of the movement in the long term debt
2017 2016
Group Kshs. million Kshs. million
At 1 January 22,982 20,130
Funds received - International Finance Corporation 1,065 7,672
Funds received - European Investement Bank 1,557 -
Payments on principal and interest (10,876) (5,078)
Translation differences 167 258
Net movement in borrowings (8,087) 2,852
At 31 December 14,895 22,982
2017 2016
Company Kshs. million Kshs. million
At 1 January - 17,555
Borrowings transferred to KCB Bank Kenya Limited - (17,555)
Recognition of International Finance Corporation loan surbordinated to KCB Bank Kenya Limited 7,755 -
Net movement in borrowings 7,755 -
At 31 December 7,755 -
The long term debt includes:-
a. A 7 year loan obtained from International Finance Corporation (IFC) in 2011 of USD 100 million by KCB Bank Kenya at interest terms of Libor+2.25 p.a.%.b. A 6 year loan obtained from International Finance Corporation in 2013 of USD 40 million by KCB Bank Kenya at interest terms of Libor +3.5 p.a.%. c. A 7 year loan obtained from International Finance Corporation (IFC) in 2016 of USD 75 million by KCB Group PLC ,KCB Bank Kenya being Co-borrower
at interest terms of Libor+5.3 p.a.%.d. A 6 year loan obtained by KCB Bank Rwanda in 2012 from IFC of RWF 3,028,021,000, it’s effective interest rate is 5.4 p.a.%e. A 5 year loan of RWF 5,512 million obtained by KCB Bank Rwanda from European Investment Bank , it’s effective interest rate is 8.04 p.a.%f. A 5 year loan obtained from International Finance Corporation by KCB Bank Uganda in 2016 of USD 10 million at interest terms of Libor +3.5 p.a. %. g. A 5 year loan obtained from International Finance Corporation by KCB Bank Uganda in 2017 of USD 10 million at interest terms of Libor +3.5 p.a. %h. A 7 year loan obtained from European Investment Bank (EIB) by KCB Bank Tanzania in 2017 of TZS 27.0 billion at interest terms of 9.92% p.a
40. SHARE CAPITALGROUP AND COMPANY
2017 2016
(a) Share capital Kshs. million Kshs. million
Authorised:
4,500,000,000 (2016: 4,500,000,000) ordinary shares of Kshs. 1 each 4,500 4,500
Issued and fully paid:
As at 1 January 3,066,056,647 (2016: 3,025,212,992) ordinary shares of Kshs. 1 each 3,066 3,025
Nil Scrip Dividend Issued (2016 : 40,843,655) ordinary shares of Kshs. 1 each - 41
At 31 December 3,066,056,647 (2016: 3,066,056,647) ordinary shares of Kshs. 1 each 3,066 3,066
39. BORROWINGS (CONTINUED)
NOTES TO THE FINANCIAL STATEMENTS FOR THE YEAR ENDED 31 DECEMBER 2017
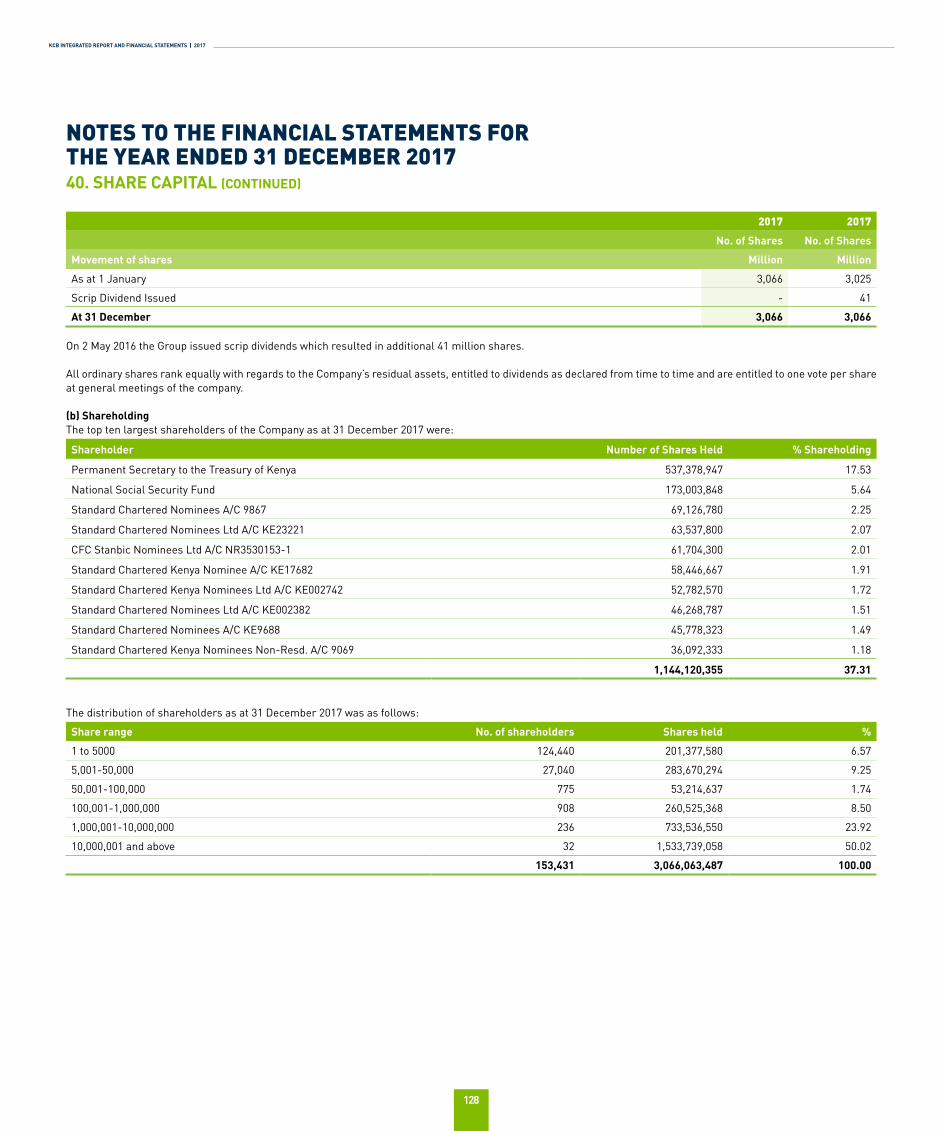
KCB INTEGRATED REPORT AND FINANCIAL STATEMENTS | 2017
128
2017 2017
No. of Shares No. of Shares
Movement of shares Million Million
As at 1 January 3,066 3,025
Scrip Dividend Issued - 41
At 31 December 3,066 3,066
On 2 May 2016 the Group issued scrip dividends which resulted in additional 41 million shares.
All ordinary shares rank equally with regards to the Company’s residual assets, entitled to dividends as declared from time to time and are entitled to one vote per share at general meetings of the company.
(b) ShareholdingThe top ten largest shareholders of the Company as at 31 December 2017 were:
Shareholder Number of Shares Held % Shareholding
Permanent Secretary to the Treasury of Kenya 537,378,947 17.53
National Social Security Fund 173,003,848 5.64
Standard Chartered Nominees A/C 9867 69,126,780 2.25
Standard Chartered Nominees Ltd A/C KE23221 63,537,800 2.07
CFC Stanbic Nominees Ltd A/C NR3530153-1 61,704,300 2.01
Standard Chartered Kenya Nominee A/C KE17682 58,446,667 1.91
Standard Chartered Kenya Nominees Ltd A/C KE002742 52,782,570 1.72
Standard Chartered Nominees Ltd A/C KE002382 46,268,787 1.51
Standard Chartered Nominees A/C KE9688 45,778,323 1.49
Standard Chartered Kenya Nominees Non-Resd. A/C 9069 36,092,333 1.18
1,144,120,355 37.31
The distribution of shareholders as at 31 December 2017 was as follows:
Share range No. of shareholders Shares held %
1 to 5000 124,440 201,377,580 6.57
5,001-50,000 27,040 283,670,294 9.25
50,001-100,000 775 53,214,637 1.74
100,001-1,000,000 908 260,525,368 8.50
1,000,001-10,000,000 236 733,536,550 23.92
10,000,001 and above 32 1,533,739,058 50.02
153,431 3,066,063,487 100.00
NOTES TO THE FINANCIAL STATEMENTS FOR THE YEAR ENDED 31 DECEMBER 201740. SHARE CAPITAL (CONTINUED)
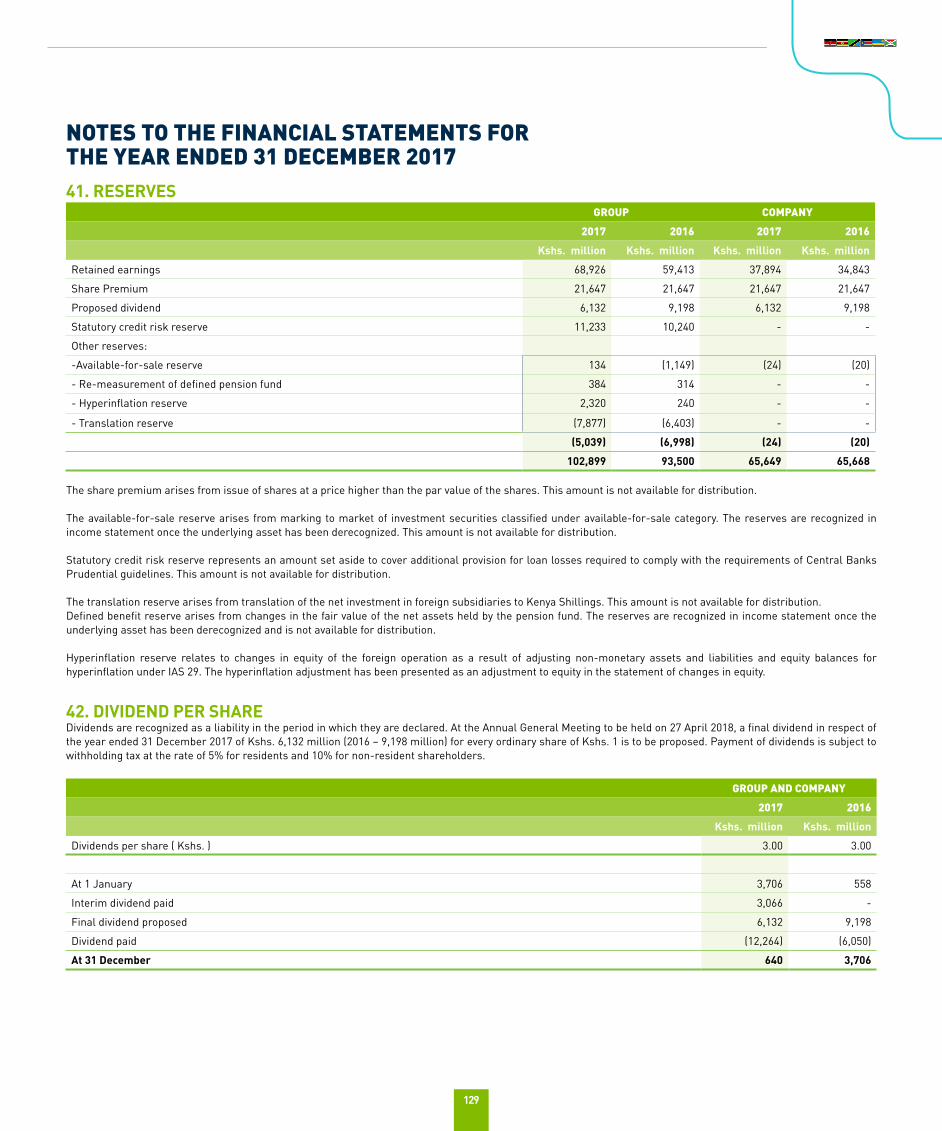
129
41. RESERVESGROUP COMPANY
2017 2016 2017 2016
Kshs. million Kshs. million Kshs. million Kshs. million
Retained earnings 68,926 59,413 37,894 34,843
Share Premium 21,647 21,647 21,647 21,647
Proposed dividend 6,132 9,198 6,132 9,198
Statutory credit risk reserve 11,233 10,240 - -
Other reserves:
-Available-for-sale reserve 134 (1,149) (24) (20)
- Re-measurement of defined pension fund 384 314 - -
- Hyperinflation reserve 2,320 240 - -
- Translation reserve (7,877) (6,403) - -
(5,039) (6,998) (24) (20)
102,899 93,500 65,649 65,668
The share premium arises from issue of shares at a price higher than the par value of the shares. This amount is not available for distribution.
The available-for-sale reserve arises from marking to market of investment securities classified under available-for-sale category. The reserves are recognized in income statement once the underlying asset has been derecognized. This amount is not available for distribution.
Statutory credit risk reserve represents an amount set aside to cover additional provision for loan losses required to comply with the requirements of Central Banks Prudential guidelines. This amount is not available for distribution.
The translation reserve arises from translation of the net investment in foreign subsidiaries to Kenya Shillings. This amount is not available for distribution.Defined benefit reserve arises from changes in the fair value of the net assets held by the pension fund. The reserves are recognized in income statement once the underlying asset has been derecognized and is not available for distribution.
Hyperinflation reserve relates to changes in equity of the foreign operation as a result of adjusting non-monetary assets and liabilities and equity balances for hyperinflation under IAS 29. The hyperinflation adjustment has been presented as an adjustment to equity in the statement of changes in equity.
42. DIVIDEND PER SHAREDividends are recognized as a liability in the period in which they are declared. At the Annual General Meeting to be held on 27 April 2018, a final dividend in respect of the year ended 31 December 2017 of Kshs. 6,132 million (2016 – 9,198 million) for every ordinary share of Kshs. 1 is to be proposed. Payment of dividends is subject to withholding tax at the rate of 5% for residents and 10% for non-resident shareholders.
GROUP AND COMPANY
2017 2016
Kshs. million Kshs. million
Dividends per share ( Kshs. ) 3.00 3.00
At 1 January 3,706 558
Interim dividend paid 3,066 -
Final dividend proposed 6,132 9,198
Dividend paid (12,264) (6,050)
At 31 December 640 3,706
NOTES TO THE FINANCIAL STATEMENTS FOR THE YEAR ENDED 31 DECEMBER 2017
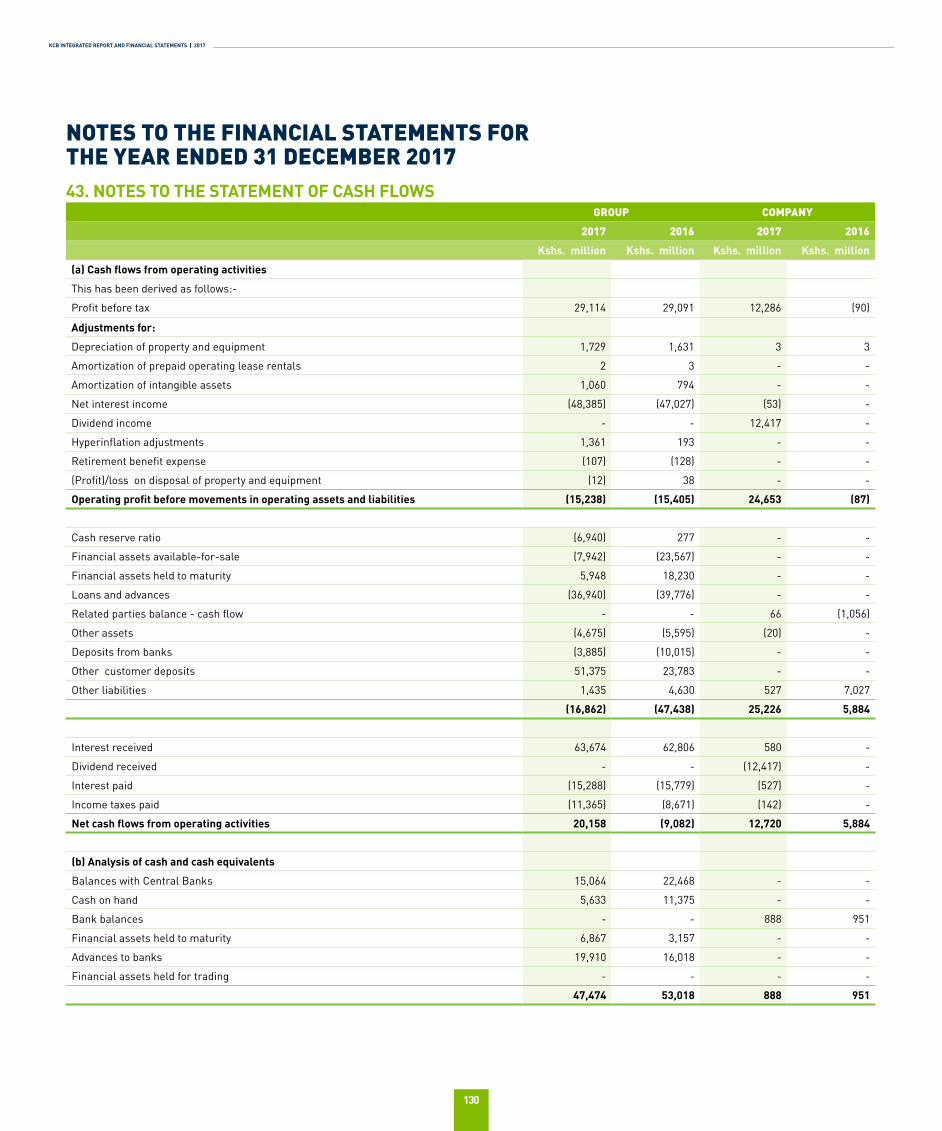
KCB INTEGRATED REPORT AND FINANCIAL STATEMENTS | 2017
130
43. NOTES TO THE STATEMENT OF CASH FLOWSGROUP COMPANY
2017 2016 2017 2016
Kshs. million Kshs. million Kshs. million Kshs. million
(a) Cash flows from operating activities
This has been derived as follows:-
Profit before tax 29,114 29,091 12,286 (90)
Adjustments for:
Depreciation of property and equipment 1,729 1,631 3 3
Amortization of prepaid operating lease rentals 2 3 - -
Amortization of intangible assets 1,060 794 - -
Net interest income (48,385) (47,027) (53) -
Dividend income - - 12,417 -
Hyperinflation adjustments 1,361 193 - -
Retirement benefit expense (107) (128) - -
(Profit)/loss on disposal of property and equipment (12) 38 - -
Operating profit before movements in operating assets and liabilities (15,238) (15,405) 24,653 (87)
Cash reserve ratio (6,940) 277 - -
Financial assets available-for-sale (7,942) (23,567) - -
Financial assets held to maturity 5,948 18,230 - -
Loans and advances (36,940) (39,776) - -
Related parties balance - cash flow - - 66 (1,056)
Other assets (4,675) (5,595) (20) -
Deposits from banks (3,885) (10,015) - -
Other customer deposits 51,375 23,783 - -
Other liabilities 1,435 4,630 527 7,027
(16,862) (47,438) 25,226 5,884
Interest received 63,674 62,806 580 -
Dividend received - - (12,417) -
Interest paid (15,288) (15,779) (527) -
Income taxes paid (11,365) (8,671) (142) -
Net cash flows from operating activities 20,158 (9,082) 12,720 5,884
(b) Analysis of cash and cash equivalents
Balances with Central Banks 15,064 22,468 - -
Cash on hand 5,633 11,375 - -
Bank balances - - 888 951
Financial assets held to maturity 6,867 3,157 - -
Advances to banks 19,910 16,018 - -
Financial assets held for trading - - - -
47,474 53,018 888 951
NOTES TO THE FINANCIAL STATEMENTS FOR THE YEAR ENDED 31 DECEMBER 2017
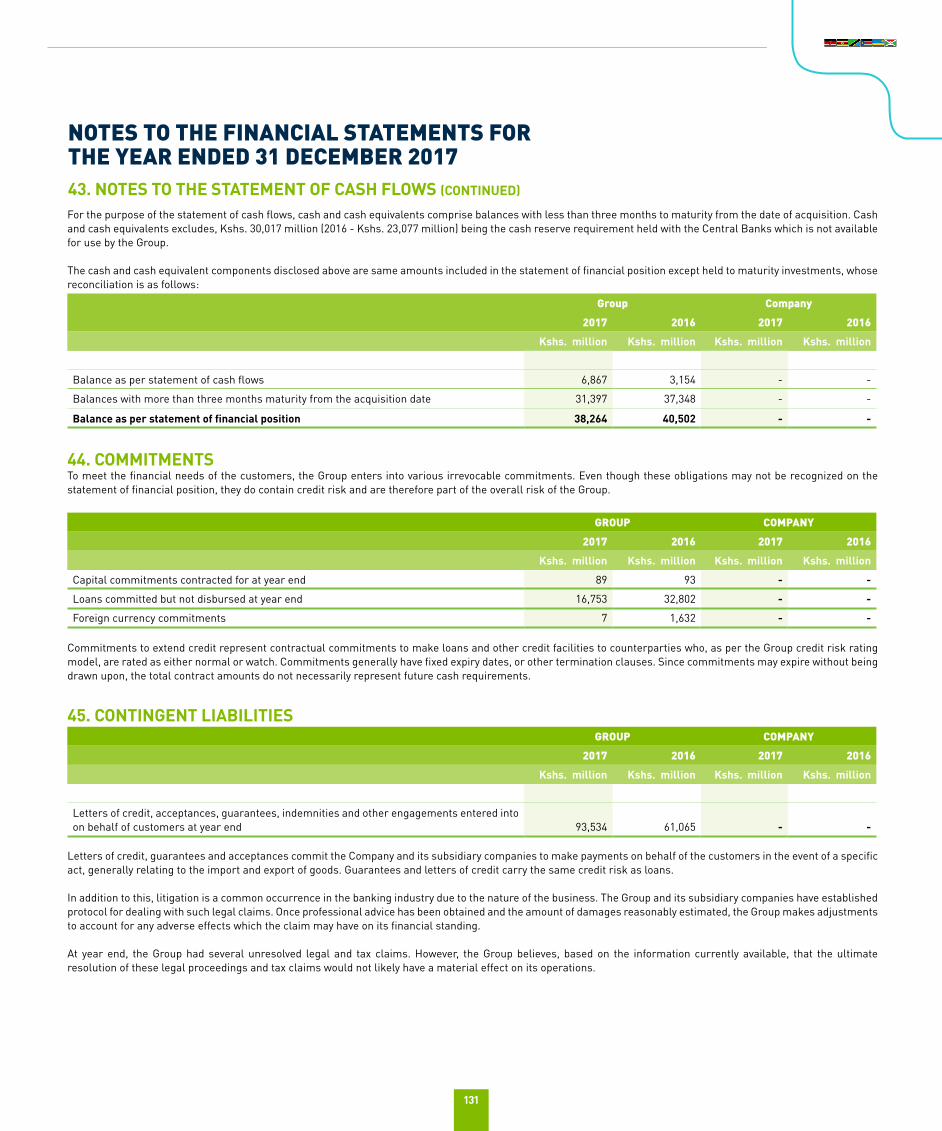
131
For the purpose of the statement of cash flows, cash and cash equivalents comprise balances with less than three months to maturity from the date of acquisition. Cash and cash equivalents excludes, Kshs. 30,017 million (2016 - Kshs. 23,077 million) being the cash reserve requirement held with the Central Banks which is not available for use by the Group.
The cash and cash equivalent components disclosed above are same amounts included in the statement of financial position except held to maturity investments, whose reconciliation is as follows:
Group Company
2017 2016 2017 2016
Kshs. million Kshs. million Kshs. million Kshs. million
Balance as per statement of cash flows 6,867 3,154 - -
Balances with more than three months maturity from the acquisition date 31,397 37,348 - -
Balance as per statement of financial position 38,264 40,502 - -
44. COMMITMENTSTo meet the financial needs of the customers, the Group enters into various irrevocable commitments. Even though these obligations may not be recognized on the statement of financial position, they do contain credit risk and are therefore part of the overall risk of the Group.
GROUP COMPANY
2017 2016 2017 2016
Kshs. million Kshs. million Kshs. million Kshs. million
Capital commitments contracted for at year end 89 93 - -
Loans committed but not disbursed at year end 16,753 32,802 - -
Foreign currency commitments 7 1,632 - -
Commitments to extend credit represent contractual commitments to make loans and other credit facilities to counterparties who, as per the Group credit risk rating model, are rated as either normal or watch. Commitments generally have fixed expiry dates, or other termination clauses. Since commitments may expire without being drawn upon, the total contract amounts do not necessarily represent future cash requirements.
45. CONTINGENT LIABILITIESGROUP COMPANY
2017 2016 2017 2016
Kshs. million Kshs. million Kshs. million Kshs. million
Letters of credit, acceptances, guarantees, indemnities and other engagements entered into on behalf of customers at year end
93,534
61,065
-
-
Letters of credit, guarantees and acceptances commit the Company and its subsidiary companies to make payments on behalf of the customers in the event of a specific act, generally relating to the import and export of goods. Guarantees and letters of credit carry the same credit risk as loans.
In addition to this, litigation is a common occurrence in the banking industry due to the nature of the business. The Group and its subsidiary companies have established protocol for dealing with such legal claims. Once professional advice has been obtained and the amount of damages reasonably estimated, the Group makes adjustments to account for any adverse effects which the claim may have on its financial standing.
At year end, the Group had several unresolved legal and tax claims. However, the Group believes, based on the information currently available, that the ultimate resolution of these legal proceedings and tax claims would not likely have a material effect on its operations.
43. NOTES TO THE STATEMENT OF CASH FLOWS (CONTINUED)
NOTES TO THE FINANCIAL STATEMENTS FOR THE YEAR ENDED 31 DECEMBER 2017
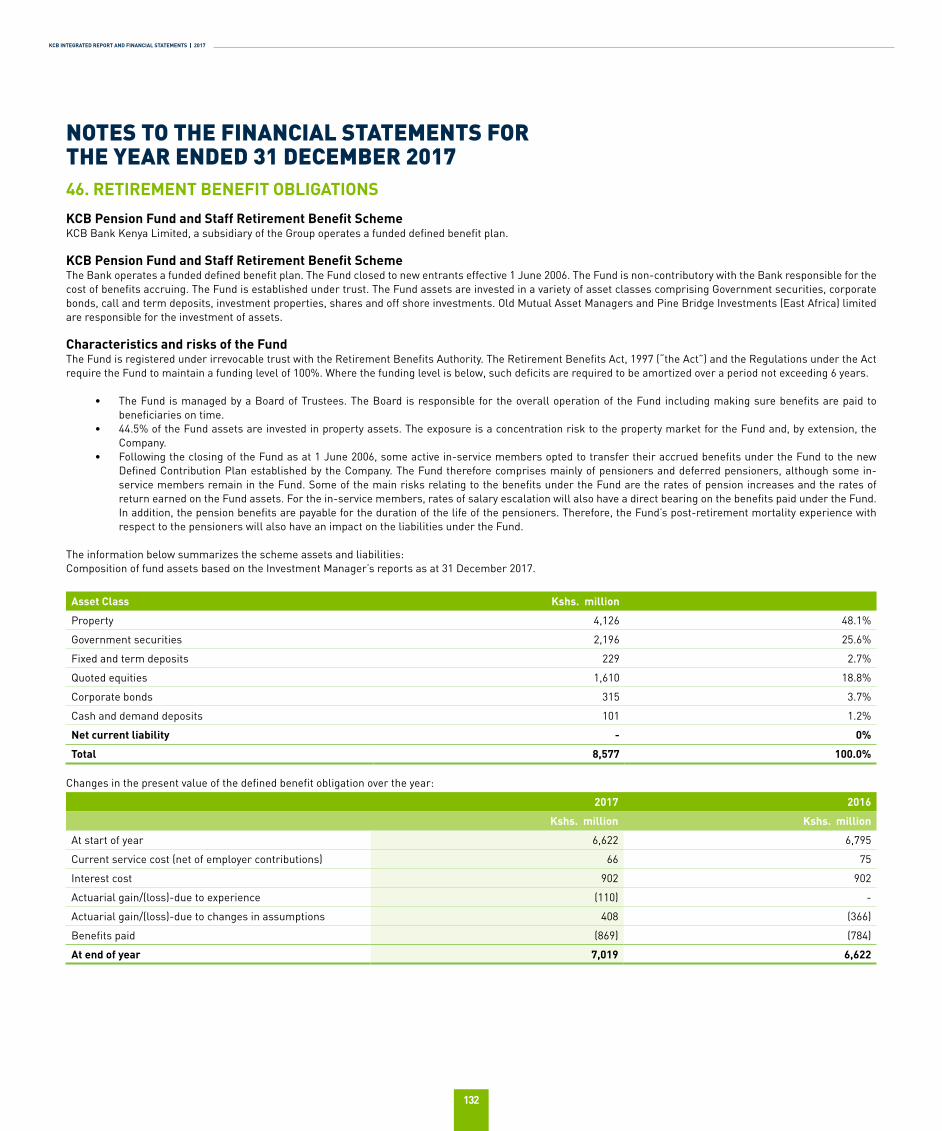
KCB INTEGRATED REPORT AND FINANCIAL STATEMENTS | 2017
132
46. RETIREMENT BENEFIT OBLIGATIONS
KCB Pension Fund and Staff Retirement Benefit SchemeKCB Bank Kenya Limited, a subsidiary of the Group operates a funded defined benefit plan.
KCB Pension Fund and Staff Retirement Benefit SchemeThe Bank operates a funded defined benefit plan. The Fund closed to new entrants effective 1 June 2006. The Fund is non-contributory with the Bank responsible for the cost of benefits accruing. The Fund is established under trust. The Fund assets are invested in a variety of asset classes comprising Government securities, corporate bonds, call and term deposits, investment properties, shares and off shore investments. Old Mutual Asset Managers and Pine Bridge Investments (East Africa) limited are responsible for the investment of assets.
Characteristics and risks of the FundThe Fund is registered under irrevocable trust with the Retirement Benefits Authority. The Retirement Benefits Act, 1997 (“the Act”) and the Regulations under the Act require the Fund to maintain a funding level of 100%. Where the funding level is below, such deficits are required to be amortized over a period not exceeding 6 years.
• The Fund is managed by a Board of Trustees. The Board is responsible for the overall operation of the Fund including making sure benefits are paid to beneficiaries on time.
• 44.5% of the Fund assets are invested in property assets. The exposure is a concentration risk to the property market for the Fund and, by extension, the Company.
• Following the closing of the Fund as at 1 June 2006, some active in-service members opted to transfer their accrued benefits under the Fund to the new Defined Contribution Plan established by the Company. The Fund therefore comprises mainly of pensioners and deferred pensioners, although some in-service members remain in the Fund. Some of the main risks relating to the benefits under the Fund are the rates of pension increases and the rates of return earned on the Fund assets. For the in-service members, rates of salary escalation will also have a direct bearing on the benefits paid under the Fund. In addition, the pension benefits are payable for the duration of the life of the pensioners. Therefore, the Fund’s post-retirement mortality experience with respect to the pensioners will also have an impact on the liabilities under the Fund.
The information below summarizes the scheme assets and liabilities:Composition of fund assets based on the Investment Manager’s reports as at 31 December 2017.
Asset Class Kshs. million
Property 4,126 48.1%
Government securities 2,196 25.6%
Fixed and term deposits 229 2.7%
Quoted equities 1,610 18.8%
Corporate bonds 315 3.7%
Cash and demand deposits 101 1.2%
Net current liability - 0%
Total 8,577 100.0%
Changes in the present value of the defined benefit obligation over the year:
2017 2016
Kshs. million Kshs. million
At start of year 6,622 6,795
Current service cost (net of employer contributions) 66 75
Interest cost 902 902
Actuarial gain/(loss)-due to experience (110) -
Actuarial gain/(loss)-due to changes in assumptions 408 (366)
Benefits paid (869) (784)
At end of year 7,019 6,622
NOTES TO THE FINANCIAL STATEMENTS FOR THE YEAR ENDED 31 DECEMBER 2017
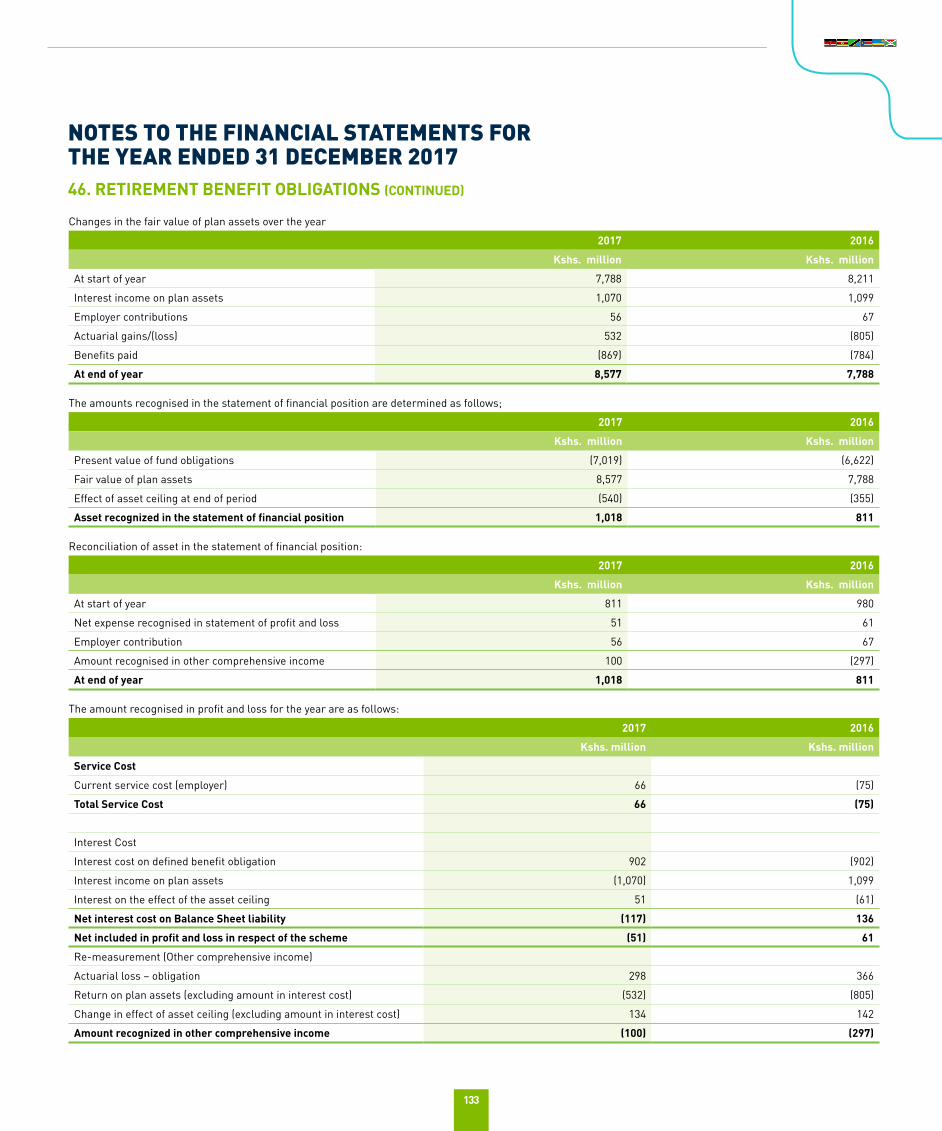
133
Changes in the fair value of plan assets over the year
2017 2016
Kshs. million Kshs. million
At start of year 7,788 8,211
Interest income on plan assets 1,070 1,099
Employer contributions 56 67
Actuarial gains/(loss) 532 (805)
Benefits paid (869) (784)
At end of year 8,577 7,788
The amounts recognised in the statement of financial position are determined as follows;
2017 2016
Kshs. million Kshs. million
Present value of fund obligations (7,019) (6,622)
Fair value of plan assets 8,577 7,788
Effect of asset ceiling at end of period (540) (355)
Asset recognized in the statement of financial position 1,018 811
Reconciliation of asset in the statement of financial position:
2017 2016
Kshs. million Kshs. million
At start of year 811 980
Net expense recognised in statement of profit and loss 51 61
Employer contribution 56 67
Amount recognised in other comprehensive income 100 (297)
At end of year 1,018 811
The amount recognised in profit and loss for the year are as follows:
2017 2016
Kshs. million Kshs. million
Service Cost
Current service cost (employer) 66 (75)
Total Service Cost 66 (75)
Interest Cost
Interest cost on defined benefit obligation 902 (902)
Interest income on plan assets (1,070) 1,099
Interest on the effect of the asset ceiling 51 (61)
Net interest cost on Balance Sheet liability (117) 136
Net included in profit and loss in respect of the scheme (51) 61
Re-measurement (Other comprehensive income)
Actuarial loss – obligation 298 366
Return on plan assets (excluding amount in interest cost) (532) (805)
Change in effect of asset ceiling (excluding amount in interest cost) 134 142
Amount recognized in other comprehensive income (100) (297)
46. RETIREMENT BENEFIT OBLIGATIONS (CONTINUED)
NOTES TO THE FINANCIAL STATEMENTS FOR THE YEAR ENDED 31 DECEMBER 2017
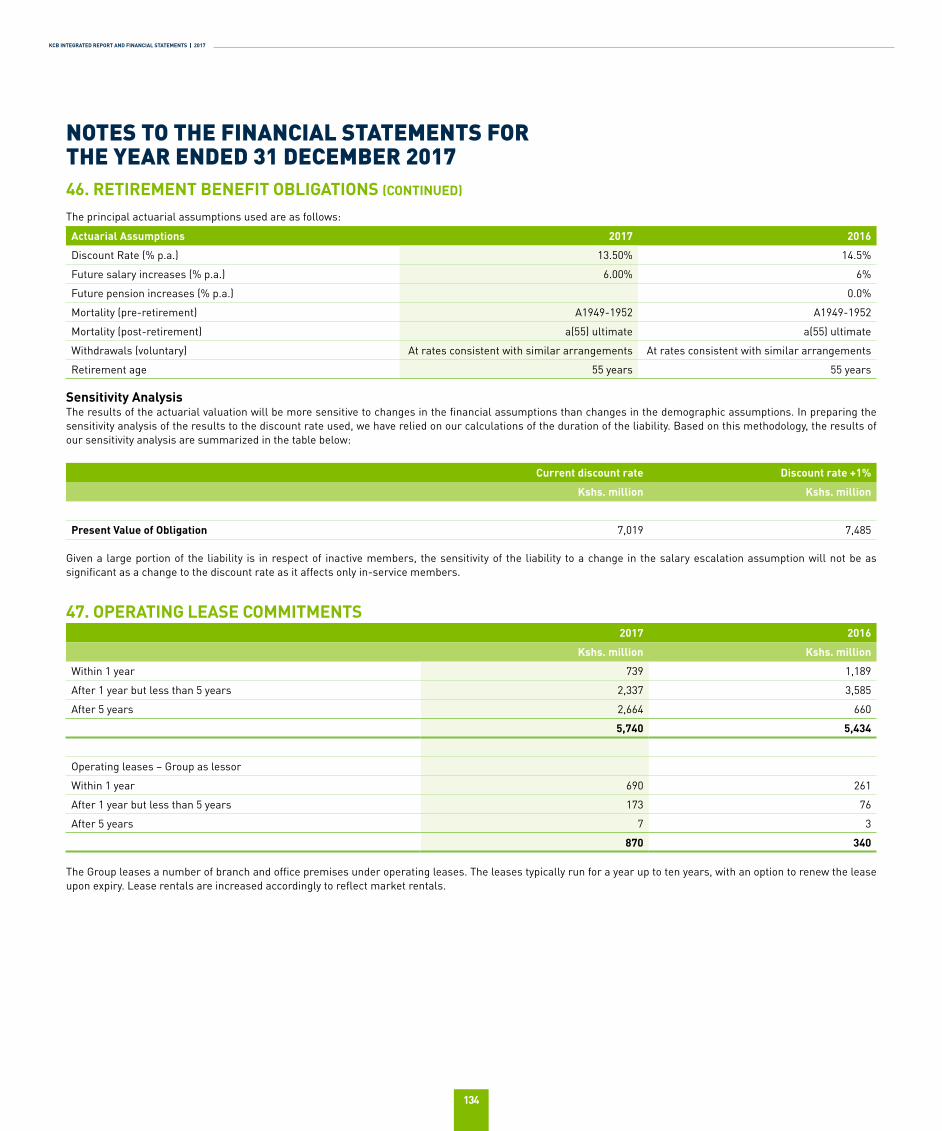
KCB INTEGRATED REPORT AND FINANCIAL STATEMENTS | 2017
134
46. RETIREMENT BENEFIT OBLIGATIONS (CONTINUED)
NOTES TO THE FINANCIAL STATEMENTS FOR THE YEAR ENDED 31 DECEMBER 2017
The principal actuarial assumptions used are as follows:
Actuarial Assumptions 2017 2016
Discount Rate (% p.a.) 13.50% 14.5%
Future salary increases (% p.a.) 6.00% 6%
Future pension increases (% p.a.) 0.0%
Mortality (pre-retirement) A1949-1952 A1949-1952
Mortality (post-retirement) a(55) ultimate a(55) ultimate
Withdrawals (voluntary) At rates consistent with similar arrangements At rates consistent with similar arrangements
Retirement age 55 years 55 years
Sensitivity AnalysisThe results of the actuarial valuation will be more sensitive to changes in the financial assumptions than changes in the demographic assumptions. In preparing the sensitivity analysis of the results to the discount rate used, we have relied on our calculations of the duration of the liability. Based on this methodology, the results of our sensitivity analysis are summarized in the table below:
Current discount rate Discount rate +1%
Kshs. million Kshs. million
Present Value of Obligation 7,019 7,485
Given a large portion of the liability is in respect of inactive members, the sensitivity of the liability to a change in the salary escalation assumption will not be as significant as a change to the discount rate as it affects only in-service members.
47. OPERATING LEASE COMMITMENTS2017 2016
Kshs. million Kshs. million
Within 1 year 739 1,189
After 1 year but less than 5 years 2,337 3,585
After 5 years 2,664 660
5,740 5,434
Operating leases – Group as lessor
Within 1 year 690 261
After 1 year but less than 5 years 173 76
After 5 years 7 3
870 340
The Group leases a number of branch and office premises under operating leases. The leases typically run for a year up to ten years, with an option to renew the lease upon expiry. Lease rentals are increased accordingly to reflect market rentals.
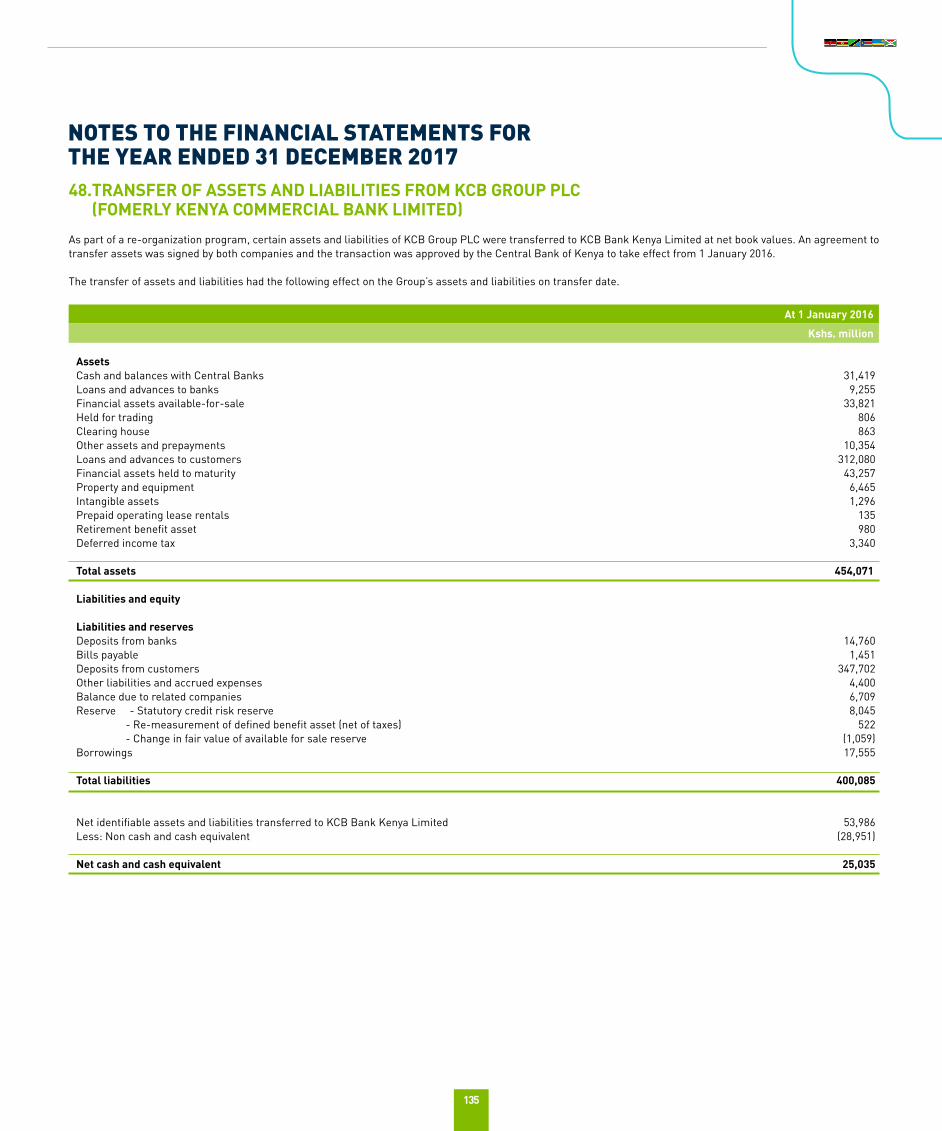
135
48.TRANSFER OF ASSETS AND LIABILITIES FROM KCB GROUP PLC (FOMERLY KENYA COMMERCIAL BANK LIMITED)
As part of a re-organization program, certain assets and liabilities of KCB Group PLC were transferred to KCB Bank Kenya Limited at net book values. An agreement to transfer assets was signed by both companies and the transaction was approved by the Central Bank of Kenya to take effect from 1 January 2016.
The transfer of assets and liabilities had the following effect on the Group’s assets and liabilities on transfer date.
At 1 January 2016
Kshs. million
Assets Cash and balances with Central Banks 31,419 Loans and advances to banks 9,255Financial assets available-for-sale 33,821Held for trading 806Clearing house 863Other assets and prepayments 10,354Loans and advances to customers 312,080Financial assets held to maturity 43,257Property and equipment 6,465Intangible assets 1,296Prepaid operating lease rentals 135Retirement benefit asset 980Deferred income tax 3,340
Total assets 454,071
Liabilities and equity
Liabilities and reservesDeposits from banks 14,760Bills payable 1,451Deposits from customers 347,702Other liabilities and accrued expenses 4,400Balance due to related companies 6,709Reserve - Statutory credit risk reserve 8,045 - Re-measurement of defined benefit asset (net of taxes) 522 - Change in fair value of available for sale reserve (1,059)Borrowings 17,555
Total liabilities 400,085
Net identifiable assets and liabilities transferred to KCB Bank Kenya Limited 53,986Less: Non cash and cash equivalent (28,951)
Net cash and cash equivalent 25,035
NOTES TO THE FINANCIAL STATEMENTS FOR THE YEAR ENDED 31 DECEMBER 2017
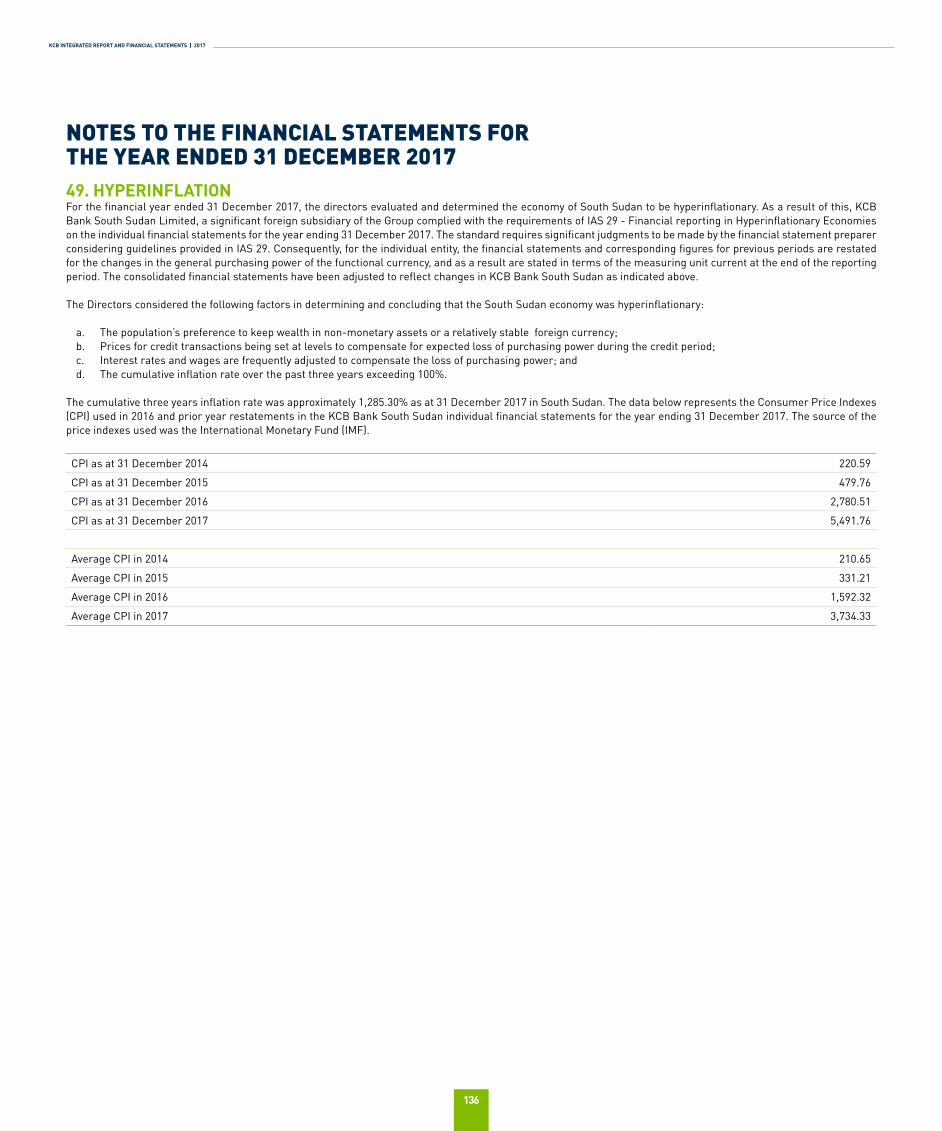
KCB INTEGRATED REPORT AND FINANCIAL STATEMENTS | 2017
136
NOTES TO THE FINANCIAL STATEMENTS FOR THE YEAR ENDED 31 DECEMBER 201749. HYPERINFLATIONFor the financial year ended 31 December 2017, the directors evaluated and determined the economy of South Sudan to be hyperinflationary. As a result of this, KCB Bank South Sudan Limited, a significant foreign subsidiary of the Group complied with the requirements of IAS 29 - Financial reporting in Hyperinflationary Economies on the individual financial statements for the year ending 31 December 2017. The standard requires significant judgments to be made by the financial statement preparer considering guidelines provided in IAS 29. Consequently, for the individual entity, the financial statements and corresponding figures for previous periods are restated for the changes in the general purchasing power of the functional currency, and as a result are stated in terms of the measuring unit current at the end of the reporting period. The consolidated financial statements have been adjusted to reflect changes in KCB Bank South Sudan as indicated above.
The Directors considered the following factors in determining and concluding that the South Sudan economy was hyperinflationary:
a. The population’s preference to keep wealth in non-monetary assets or a relatively stable foreign currency;b. Prices for credit transactions being set at levels to compensate for expected loss of purchasing power during the credit period;c. Interest rates and wages are frequently adjusted to compensate the loss of purchasing power; andd. The cumulative inflation rate over the past three years exceeding 100%.
The cumulative three years inflation rate was approximately 1,285.30% as at 31 December 2017 in South Sudan. The data below represents the Consumer Price Indexes (CPI) used in 2016 and prior year restatements in the KCB Bank South Sudan individual financial statements for the year ending 31 December 2017. The source of the price indexes used was the International Monetary Fund (IMF).
CPI as at 31 December 2014 220.59
CPI as at 31 December 2015 479.76
CPI as at 31 December 2016 2,780.51
CPI as at 31 December 2017 5,491.76
Average CPI in 2014 210.65
Average CPI in 2015 331.21
Average CPI in 2016 1,592.32
Average CPI in 2017 3,734.33
137
NOTICE OF THE 47TH ANNUAL GENERAL MEETING
KCB GROUP PLC. (Incorporated in Kenya under the Companies Act, 2015, Laws of Kenya)
(Registration Number C 9/88)
NOTICE IS HEREBY GIVEN that the 47TH ANNUAL GENERAL MEETING of the shareholders of KCB GROUP PLC will be held in the Kasarani Indoor Sports Arena, Nairobi, on Friday, 27 April, 2018 at 10:00 a.m. when the following business will be transacted, namely:
AGENDA
1. Constitution of the MeetingTo read the notice convening the meeting and determine if a quorum is present.
2. Ordinary Business
a. Report and Financial Statements for the Year ended 31 December, 2017To receive, consider and, if thought fit, adopt the Audited Consolidated Financial Statements for the year ended 31 December, 2017 together with the reports of the Directors, the Group Chairman, the Group Chief Executive Officer and the Auditors’ thereon.
b. DividendTo confirm the interim dividend of KShs. 1.00 per ordinary share paid on 31 October, 2017 and to declare a final dividend of KShs. 2.00 per ordinary share, payable, net of withholding tax, on or about 29 June, 2018 to shareholders on the Register of Members at the close of business on 30 April, 2018.
c. Election of Directors(a) In accordance with Articles 94 and 95 of the Company’s Articles of Association, the following Directors retire by rotation, and being eligible, offer themselves for re-election:
i) Mr. Ngeny Biwottii) Mr. Tom Ipomai
(b) In accordance with Article 101 of the Company’s Articles of Association, having been appointed by the Board to fill in a casual vacancy, Mrs. Josephine Djirackor retires from the Board and being eligible offers herself for re-election.
(c) In accordance with the provisions of Section 769 of the Companies Act, 2015, the following directors, being members of the Board Audit Committee be elected to continue to serve as members of the said Committee:
i) Ms. Georgina Malombeii) Mr. John Nyerereiii) Mrs. Josephine Djirackor
d. Remuneration of DirectorsTo receive, consider and, if thought fit, approve the Directors’ Remuneration Report and to authorize the Board to fix the remuneration of Directors.
e. Appointment of AuditorsTo re-appoint Messrs. KPMG Kenya, Certified Public Accountants, as the Auditors of the Company until conclusion of the next Annual General Meeting.
f. Remuneration of the AuditorsTo authorize Directors to fix the remuneration of the Auditors.
BY ORDER OF THE BOARD
JOSEPH KANIAGROUP COMPANY SECRETARY5 April, 2018
KCB INTEGRATED REPORT AND FINANCIAL STATEMENTS | 2017
138
Note:
1. A member entitled to attend and vote at the meeting and who is unable to attend is entitled to appoint a proxy to attend and vote on his or her behalf. A proxy need not be a member of the Company. To be valid, a proxy form, which is provided by the Company, must be completed and signed by the member and must be lodged at the offices of Company’s share registrar, Image Registrars Limited, 5th Floor, Barclays Plaza, Loita Street, P.O. Box 9287, GPO 00100, Nairobi, to arrive not later than 10:00 a.m. on 25 April, 2018 i.e. 48 hours before the meeting or any adjournment thereof.
If the appointer is a body corporate, the instrument appointing the proxy shall be given under its common seal or under the hand of an officer or duly authorized attorney of such corporation or Government office.
2. In accordance with Article 129, a copy of this Notice, Proxy Form and the entire Annual Report & Accounts may be viewed on and downloaded from the Company’s website at www.kcbgroup.com.
3. Registration of members and proxies for the Annual General Meeting will commence at 8:00 a.m. on 27 April, 2018. Members and proxies should carry their national ID cards and a copy of the relevant Central Depository and Settlement Corporation (CDSC) account statement for ease of registration process.
4. Transport will be provided to Shareholders from Kencom House to the Kasarani Indoor Sports Arena, from 6:30 a.m. to 10:00 a.m. and back to Kencom House at the close of the meeting.
139
BOARD OF DIRECTORS PROFILE
NAME: NGENY BIWOTT DESIGNATION: GROUP CHAIRMAN
EDUCATION AND PROFESSIONAL BACKGROUND: Ngeny Biwott has over 39 years’ experience in the aviation industry and holds an MSc Degree in Civil Emergency, Risk and Crisis Management from University of Hertfordshire. In addition, he obtained specialised certification in risk and strategy from Cranfield University, the University of Southern California, and the Langley NASA Research Centre College.
DATE OF APPOINTMENT TO DESIGNATION: Appointed Group Chairman in August 2013
DATE OF APPOINTMENT TO BOARD: June 2011
NAME: ADIL KHAWAJA DESIGNATION: DIRECTOR
EDUCATION AND PROFESSIONAL BACKGROUND: Adil Khawaja holds an LLB (Hons.) degree from the University of Sheffield England, a diploma in Law from the Kenya School of Law and is a Certified Public Secretary of Kenya (CPSK). He is a member of the London Court of International Arbitration (LCIA) and is currently the Managing Partner of law firm, Hamilton Harrison and Mathews, Advocates.
DATE OF APPOINTMENT TO BOARD: June 2012
CURRENT KCB GROUP BOARD APPOINTMENTS: Adil is a member of the IT & Innovation Committee and serves as Chairman of the Finance & Strategy committee. He also serves as Chairman of the KCB Bank Kenya Limited Board and is also the Chairman of KCB Insurance Agency Limited.
SOCIETY/MEMBERSHIP: Adil serves as trustee of Kenya Wild life Services (KWS).
NAME: TOM IPOMAI DESIGNATION: DIRECTOR
EDUCATION AND PROFESSIONAL BACKGROUND: Tom Ipomai is a corporate finance specialist. He holds a degree in Computer Science from the University of Nairobi (1st Class Honours) and a Master of Philosophy (MPhil) in Management Studies from the University of Cambridge (Jesus College). He is a Certified Chartered Accountant (ACCA). Previously, Tom worked for the Central Bank of Kenya, Barclays Bank in the UK, Kenya and Zambia and with Deloitte in its Corporate Finance Advisory division. Tom runs a boutique consulting firm.
DATE OF APPOINTMENT TO BOARD: June 2012
CURRENT KCB GROUP BOARD APPOINTMENTS: Tom is the Chairman of the IT & Innovation and the HR & Nominations committees. He is a member of the Supply Chain committee. He also serves as a member of the KCB Bank Kenya Limited Board and is Chairman of KCB Bank Rwanda Board.
NAME: HENRY ROTICH DESIGNATION: DIRECTOR
EDUCATION AND PROFESSIONAL BACKGROUND: Henry Rotich is Kenya’s Cabinet Secretary for the National Treasury. He holds a Master’s Degree in Public Administration (MPA) from the Harvard Kennedy School, Harvard University. In addition, he holds a Master’s degree in Economics and a Bachelor’s degree in Economics (First Class Honours), both from the University of Nairobi.
DATE OF APPOINTMENT TO BOARD: The office of the Cabinet Secretary of the National Treasury is an institutional director of KCB Group Plc.
ALTERNATE APPOINTED: Julius Mutua serves as alternate on the Board (Appointed September 2014)He serves as the Chairman of the Risk Management Committee and a member of the HR & Nomination and IT & Innovation committees. He is the Chairman of KCB Bank Burundi Limited and also a member of the Boards of KCB Bank Kenya Limited and KCB Capital Limited and is a trustee of KCB Foundation.
KCB INTEGRATED REPORT AND FINANCIAL STATEMENTS | 2017
140
NAME: GEORGINA MALOMBE DESIGNATION: DIRECTOR
EDUCATION AND PROFESSIONAL BACKGROUND: Georgina Malombe is an audit professional. She holds a Bachelors degree in Agribusiness Management from Egerton University and a Master of Business Administration, Finance Option from the University of Nairobi. She is a Certified Public Accountant (CPA (K)) and professional trainer. She also holds a Certificate in Arbitration. Her key technical competencies include Audit Quality Assurance, Auditing, Accounting, Finance and Financial Reporting. Previously, she worked for The Registration of Accountants Board as the Executive Officer, The Institute of Certified Public Accountants of Kenya (ICPAK) as Manager, Public Policy and Governance as well as the Head of Compliance and Regulatory Affairs. Malombe is currently the Managing Partner of audit firm, Gemal and Company.
DATE OF APPOINTMENT TO BOARD: June 2014
CURRENT KCB GROUP BOARD APPOINTMENTS: Georgina is a member of the Group Supply Chain, IT and Innovation and Risk committees and serves as Chairman of the Audit committee. She is also a member of the KCB Bank Tanzania Limited Board.
OTHER BOARD/SOCIETY/MEMBERSHIP: Georgina currently serves in the Board of the Association of Women Accountants of Kenya (AWAK) as the Vice Chairperson. She is also a member of Professional Trainers Association of Kenya (PTAK).
NAME: JOHN NYERERE DESIGNATION: DIRECTOR
EDUCATION AND PROFESSIONAL BACKGROUND: John Nyerere is a HHH (Fulbright) fellow and holds an MBA, Bachelor of Arts (Hons.) Economics, MBA General Management and Bachelor of Arts Economics and Sociology. He lectures on business management at the United States International University. He has experience in corporate planning, operations management and transformation leadership and his key technical competencies include strategy development and economics.
DATE OF APPOINTMENT TO BOARD: June 2014
CURRENT KCB GROUP BOARD APPOINTMENTS: John is a member of the Audit, Risk Management, HR & Nominations, and Finance & Strategy committees and is the Chairman of the Supply Chain committee. He also serves as a member of KCB Bank Tanzania Limited and KCB Foundation Boards and is the Chairman of KCB Capital Limited.
NAME: DR. NANCY ASIKO ONYANGODESIGNATION: DIRECTOR
EDUCATION AND PROFESSIONAL BACKGROUND: Nancy is currently Director of Internal Audit at the International Monetary Fund (IMF) based in Washington, D.C. Previously, She was an advisor for the Finance Sector Deepening (FSD) Africa and a member of the board of Fairtrade Africa. She was previously the Governance, Risk & Compliance – Africa Leader for Ernest & Young. Prior to which she was a partner with PriceWaterhouseCoopers. She worked with PwC for 26 years and set up and led the Governance, Risk & Compliance Assurance Services Practice. Nancy holds a Bachelors of Commerce degree (1st Class Honours), a Masters in Business Administration (MBA) in Management Information Systems and a Doctorate of Business Administration (DBA) in Strategic leadership & Organizational Change. She is a member of the Institute of Certified Public Accountants (ICPAK) as well as a Certified Information Systems Auditor (CISA) amongst other professional memberships.
DATE OF APPOINTMENT TO BOARD: September 2017
DATE OF RESIGNATION TO BOARD: January 2018
141
NAME: JOSEPHINE DJIRACKOR DESIGNATION: DIRECTOR
EDUCATION AND PROFESSIONAL BACKGROUND:Josephine Djirackor has over 30 years’ experience in the telecommunications industry and holds an MSc (Hons) Degree in Radio Communication Engineering from the ST. Petersburg State University of Telecommunications Russia. In 2017 she participated in a Global Solutions Program and obtained specialised certification in the use of exponential technology to solve global challenges from Singularity University NASA Ames Research Centre San Francisco.
DATE OF APPOINTMENT TO BOARD: January 2018
CURRENT KCB GROUP BOARD APPOINTMENTS: Josephine is a member of the Audit, IT & Innovation, HR & Nominations and Finance & Strategy committees. She is also a member of the KCB Capital Limited and KCB Insurance Limited Boards.
OTHER BOARD/SOCIETY/MEMBERSHIP: Josephine currently serves in the Board of the Global Mentors Network (GMN) as the Vice Chairperson.
NAME: JOSHUA OIGARA DESIGNATION: CHIEF EXECUTIVE OFFICER & MANAGING DIRECTOR
EDUCATION AND PROFESSIONAL BACKGROUND: Joshua Oigara holds a Masters degree in Business Administration with a distinction in International Business Management from Edith Cowan University, Australia, a Bachelor of Commerce Degree, Accounting Option, from the University of Nairobi and is an Advanced Management Program Graduate from INSEAD, Fontainebleau, France. He is a graduate of the Program for Management Development (JuMP), Fuqua School of Business, Duke University, North Carolina, USA as well as a Certified Public Accountant of Kenya, CPA (K), having studied at the School of Accountancy, Strathmore University, Kenya.
DATE OF APPOINTMENT TO BOARD: He was appointed KCB Group CEO in January 2013
CURRENT KCB GROUP BOARD APPOINTMENTS: Joshua is a member of the Risk Management, HR & Nomination, IT & Innovation and Finance & Strategy committees and serves as a member of the KCB Bank Kenya Limited, KCB Capital Limited and KCB Insurance Agency Limited Boards and is a trustee of the KCB Foundation.
NAME: LAWRENCE K KIAMBI DESIGNATION: GROUP CHIEF FINANCIAL OFFICER
EDUCATION AND PROFESSIONAL BACKGROUND: Lawrence holds a Bachelor of Science degree from the United States International University - Africa (USIU) majoring in accounting. He is also a Certified Public Accountant of Kenya (CPAK), having graduated from Strathmore University. Lawrence has vast experience in finance having held various finance leadership roles locally and internationally in a number of multinational organizations. DATE OF APPOINTMENT TO BOARD: May 2015
CURRENT KCB GROUP BOARD APPOINTMENTS: Lawrence serves as a trustee of the KCB Staff Pension Fund (Defined Benefit Scheme).
NAME: JOSEPH KANIA DESIGNATION: GROUP COMPANY SECRETARY
EDUCATION AND PROFESSIONAL BACKGROUND: Joseph has over 25 years’ experience as an Advocate of the High Court and 10 years’ experience as a Company Secretary. He holds an LLB degree from the University of Nairobi and is an Advocate of the High Court of Kenya. He is a Notary Public, Commissioner of Oaths as well as a Certified Public Secretary of Kenya. He previously served as Company Secretary at Housing Finance Limited. Other roles held include Senior Legal Officer at the Industrial and Commercial Development Corporation and the Legal Officer at Senator Cards/Southern Credit Corporation.
DATE OF APPOINTMENT: June 2013
BOARD OF DIRECTORS PROFILE
KCB INTEGRATED REPORT AND FINANCIAL STATEMENTS | 2017
142
PROXY FORMTHE GROUP COMPANY SECRETARY,KCB GROUP PLC.,KENCOM HOUSE, MOI AVENUE,P. O. BOX 48400 – 00100,NAIROBI, KENYA
I/We _____________________________________________________________________________________________________________
holder of ID/Passport No. ____________________________________________________________________________________________
and of P. O. Box ____________________________________________________________________________________________________
being a Member/Members of KCB Group Plc., hereby appoint
_________________________________________________________________________________________________________________
ID/Passport No. ___________________________________________________________________________________________________
or failing him, the duly appointed Chairman of the meeting to be my/our proxy, to vote on my/our behalf at the 47th Annual General Meeting to be held on 27 April, 2018 at 10.00 am or at any adjournment.
Signed this ______________________ day of __________________, 2018
Signature(s) ______________________________________________________________________________________________________
________________________________________________________________________________________________________________
Note: 1. If a member is unable to attend personally, this Proxy Form should be completed and returned to reach the Company’s share registrar,
Image Registrars Limited, 5th Floor, Barclays Plaza, Loita Street, P.O. Box 9287, GPO 00100, Nairobi, to arrive not later than 10:00 a.m. on 25 April, 2018 i.e. 48 hours before the meeting or any adjournment thereof.
2. A person appointed as a proxy need not be a member of the Company
3. In case of a member being a corporate body, the Proxy Form must be under its common seal or under the hand of an officer or duly authorized attorney of such corporate body.

143
NOTES
KCB INTEGRATED REPORT AND FINANCIAL STATEMENTS | 2017
144
NOTES
145
NOTES

KCB INTEGRATED REPORT AND FINANCIAL STATEMENTS | 2017
146

147
www.kcbgroup.com