Embed Size (px)
Citation preview

8/8/2019 Integrated Pollution Prevention and Control European Environment Comission
http://slidepdf.com/reader/full/integrated-pollution-prevention-and-control-european-environment-comission 1/178

8/8/2019 Integrated Pollution Prevention and Control European Environment Comission
http://slidepdf.com/reader/full/integrated-pollution-prevention-and-control-european-environment-comission 2/178

8/8/2019 Integrated Pollution Prevention and Control European Environment Comission
http://slidepdf.com/reader/full/integrated-pollution-prevention-and-control-european-environment-comission 3/178
Executive summary
Chlor-Alkali Manufacturing industry i
EXECUTIVE SUMMARY
This reference document on best available techniques in the chlor-alkali industry reflects an
information exchange carried out according to Article 16(2) of Council Directive 96/61/EC.The document has to be seen in the light of the preface which describes the objectives of thedocument and its use.
The chlor-alkali industry
The chlor-alkali industry is the industry that produces chlorine (Cl2) and alkali, sodiumhydroxide (NaOH) or potassium hydroxide (KOH), by electrolysis of a salt solution. The main
technologies applied for chlor-alkali production are mercury, diaphragm and membrane cellelectrolysis, mainly using sodium chloride (NaCl) as feed or to a lesser extent using potassiumchloride (KCl) for the production of potassium hydroxide.
The diaphragm cell process (Griesheim cell, 1885) and the mercury cell process (Castner-Kellner cell, 1892) were both introduced in the late 1800s. The membrane cell process wasdeveloped much more recently (1970). Each of these processes represents a different method of keeping the chlorine produced at the anode separate from the caustic soda and hydrogen
produced, directly or indirectly, at the cathode. Currently, 95% of world chlorine production isobtained by the chlor-alkali process.
The geographic distribution of chlor-alkali processes world-wide differs appreciably(production capacity of chlorine):
- western Europe, predominance of mercury cell process (June 2000): 55%- United States, predominance of diaphragm cell process: 75%- Japan, predominance of membrane cell process: >90%
The remaining chlorine production capacity in western Europe consists of (June 2000)diaphragm cell process 22%, membrane cell process 20% and other processes 3%.
Chlorine production since the 1940s has risen enormously, on the back of the burgeoning
demand for plastics, notably PVC and polyurethanes. The production of chloroaromatics (e.g.chlorobenzene for phenol synthesis), propylene oxide (chlorohydrin process), solventscontaining chlorinated hydrocarbons, and inorganic chlorine compounds are also importantfactors behind the increased use of chlorine after 1940. The chlorine production of a country isan indicator of the state of development of its chemical industry.
Global production capacity of chlorine in 1995 was about 44 million tonnes, the EU accountingfor about 24% of that capacity. In June 2000 the chlorine production capacity in westernEurope was 11.3 million tonnes. Of world chlor-alkali capacity, 65% is concentrated in three
regions; North America, western Europe and Japan. After a fall at the beginning of the 1990s, production in western Europe now seems to be stabilised at around 9 millions tonnes per year (9.2 million tonnes in 1999).
The chlor-alkali sector in Europe has developed over time and is scattered geographically. Theinevitable co-production of chlorine and sodium hydroxide in almost equal amounts has always been a problem for the chlor-alkali industry. Both products are used for very different end useswith differing market dynamics and it is only by rare chance that demand for the two coincides.
Europe is approximately in balance in chlorine, and has traditionally been the world’s secondlargest exporter of caustic; currently it is a net importer.
Chlorine is largely used in the synthesis of chlorinated organic compounds. VCM for thesynthesis of PVC still remains the driver of chlor-alkali production in most European countries.
8/8/2019 Integrated Pollution Prevention and Control European Environment Comission
http://slidepdf.com/reader/full/integrated-pollution-prevention-and-control-european-environment-comission 4/178
Executive summary
ii Chlor-Alkali Manufacturing industry
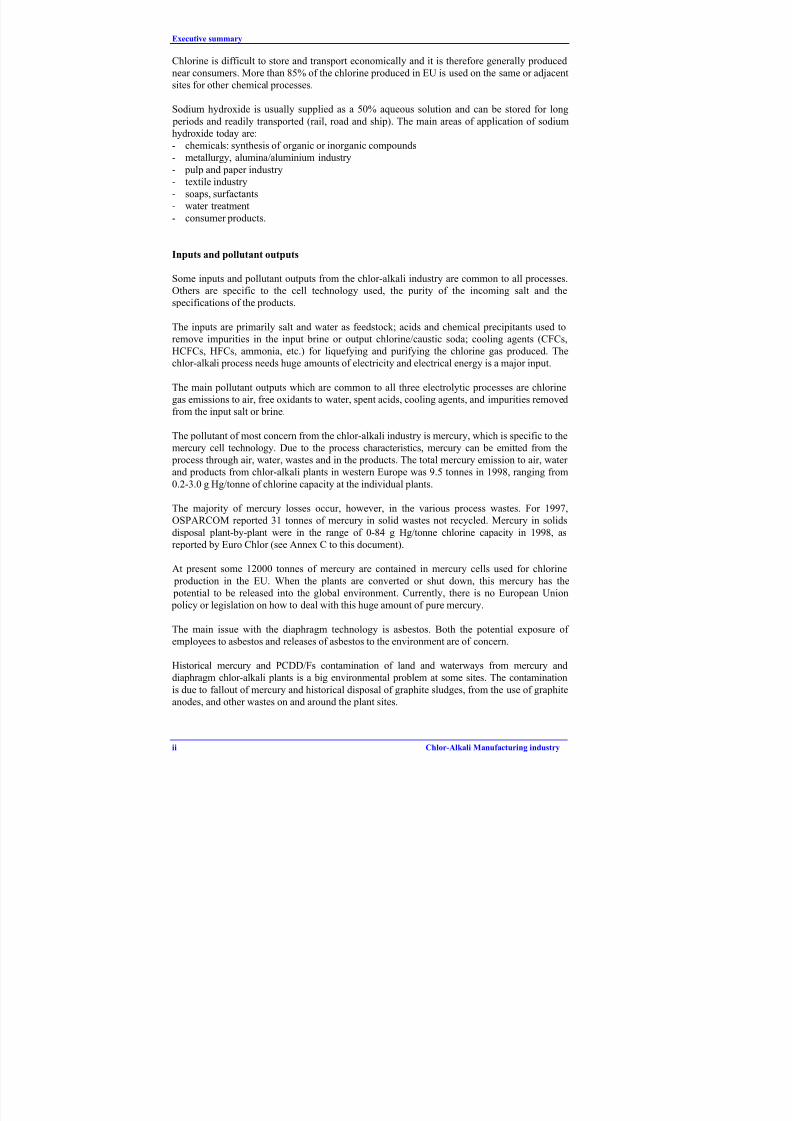
Chlorine is difficult to store and transport economically and it is therefore generally producednear consumers. More than 85% of the chlorine produced in EU is used on the same or adjacentsites for other chemical processes.
Sodium hydroxide is usually supplied as a 50% aqueous solution and can be stored for long
periods and readily transported (rail, road and ship). The main areas of application of sodium
hydroxide today are:- chemicals: synthesis of organic or inorganic compounds- metallurgy, alumina/aluminium industry
- pulp and paper industry- textile industry- soaps, surfactants- water treatment
- consumer products.
Inputs and pollutant outputs
Some inputs and pollutant outputs from the chlor-alkali industry are common to all processes.Others are specific to the cell technology used, the purity of the incoming salt and thespecifications of the products.
The inputs are primarily salt and water as feedstock; acids and chemical precipitants used toremove impurities in the input brine or output chlorine/caustic soda; cooling agents (CFCs,HCFCs, HFCs, ammonia, etc.) for liquefying and purifying the chlorine gas produced. Thechlor-alkali process needs huge amounts of electricity and electrical energy is a major input.
The main pollutant outputs which are common to all three electrolytic processes are chlorinegas emissions to air, free oxidants to water, spent acids, cooling agents, and impurities removed
from the input salt or brine.
The pollutant of most concern from the chlor-alkali industry is mercury, which is specific to themercury cell technology. Due to the process characteristics, mercury can be emitted from the process through air, water, wastes and in the products. The total mercury emission to air, water and products from chlor-alkali plants in western Europe was 9.5 tonnes in 1998, ranging from
0.2-3.0 g Hg/tonne of chlorine capacity at the individual plants.
The majority of mercury losses occur, however, in the various process wastes. For 1997,OSPARCOM reported 31 tonnes of mercury in solid wastes not recycled. Mercury in solids
disposal plant-by-plant were in the range of 0-84 g Hg/tonne chlorine capacity in 1998, asreported by Euro Chlor (see Annex C to this document).
At present some 12000 tonnes of mercury are contained in mercury cells used for chlorine
production in the EU. When the plants are converted or shut down, this mercury has the potential to be released into the global environment. Currently, there is no European Union policy or legislation on how to deal with this huge amount of pure mercury.
The main issue with the diaphragm technology is asbestos. Both the potential exposure of employees to asbestos and releases of asbestos to the environment are of concern.
Historical mercury and PCDD/Fs contamination of land and waterways from mercury anddiaphragm chlor-alkali plants is a big environmental problem at some sites. The contamination
is due to fallout of mercury and historical disposal of graphite sludges, from the use of graphiteanodes, and other wastes on and around the plant sites.

8/8/2019 Integrated Pollution Prevention and Control European Environment Comission
http://slidepdf.com/reader/full/integrated-pollution-prevention-and-control-european-environment-comission 5/178

8/8/2019 Integrated Pollution Prevention and Control European Environment Comission
http://slidepdf.com/reader/full/integrated-pollution-prevention-and-control-european-environment-comission 6/178
Executive summary
iv Chlor-Alkali Manufacturing industry
If the sulphuric acid is reconcentrated on-site in closed loop evaporators, the consumptioncan be reduced to 0.1 kg of acid per tonne of chlorine produced.
• Minimising the discharge of free oxidants to water by applying:
− fixed bed catalytic reduction
− chemical reduction
− any other method with equally efficient performance.
The emission level of free oxidants to water associated with BAT is less than 10 mg/l. Theoverall environmental impact should be considered when the destruction method is chosen.
• Use of carbon tetrachloride-free chlorine liquefaction and purification processes.
• Hydrogen should be used as a chemical or as fuel in order to conserve resources.
Membrane cell plants
Best available techniques specific to membrane cell plants include the following measures:
• Minimising the discharge of chlorate and bromate to water by applying:
− acid conditions in the anolyte (pH 1-2) to minimise the formation of chlorate (ClO3-) and
bromate (BrO3-)
− chlorate destruction in the brine circuit to remove chlorate before purging.
The acidity of the anolyte is a design parameter of membrane cell plants and cannot beadjusted without affecting the operation of the membrane cell. If this is not the chosen,option a chlorate decomposer may be necessary to remove chlorate before purging. Thechlorate level associated with BAT in the brine circuit is 1-5 g/l and the associated bromate
level is 2-10 mg/l (note that the bromate level depends on the bromide level in the salt).
• Appropriate handling of spent membranes and gaskets.
Mercury cell plants
Best available techniques specific to mercury cell plants is considered to be conversion tomembrane cell technology.
During the remaining life of mercury cell plants all possible measures should be taken to
protect the environment as a whole. The best performing mercury cell plants are achieving totalmercury losses to air, water and with products in the range of 0.2-0.5 g Hg/tonne of chlorinecapacity as a yearly average. The majority of mercury losses are in the various wastes from the process. Measures should be taken to minimise current and future mercury emissions fromhandling, storage, treatment and disposal of mercury-contaminated wastes. Decommissioning
of mercury cell plants should be carried out in a way that prevents environmental impact duringand after the shutdown process as well as safeguarding human health. Chapter 4.2 gives moredetails about available techniques for prevention and/or reduction of emissions, handling andtreatments of wastes, energy use, decommissioning of mercury cell plants and conversion to
membrane cell technology.

8/8/2019 Integrated Pollution Prevention and Control European Environment Comission
http://slidepdf.com/reader/full/integrated-pollution-prevention-and-control-european-environment-comission 7/178
Executive summary
Chlor-Alkali Manufacturing industry v
Asbestos diaphragm cell plants
Best available techniques specific to asbestos diaphragm cell plants is considered to beconversion to membrane cell technology or, when the energy use criterion is fulfilled, the useof non-asbestos diaphragms.
During the remaining life of asbestos diaphragm cell plants all possible measures should betaken to protect the environment as a whole. Chapter 4.3 gives more details about availabletechniques for prevention and/or reduction of emissions, wastes and energy use in asbestos
diaphragm cell plants.

8/8/2019 Integrated Pollution Prevention and Control European Environment Comission
http://slidepdf.com/reader/full/integrated-pollution-prevention-and-control-european-environment-comission 8/178
Preface
vi Chlor-Alkali Manufacturing industry
PREFACE
1. Status of this document
Unless otherwise stated, references to “the Directive” in this document means the Council
Directive 96/61/EC on integrated pollution prevention and control.
This document forms part of a series presenting the results of an exchange of information between EU Member States and industries concerned on best available techniques (BAT),
associated monitoring, and developments in them. It is published by the European Commission pursuant to Article 16(2) of the Directive, and must therefore be taken into account inaccordance with Annex IV of the Directive when determining "best available techniques".
2. Relevant legal obligations of the IPPC Directive and the definition of BAT
In order to help the reader understand the legal context in which this document has beendrafted, some of the most relevant provisions of the IPPC Directive, including the definition of
the term “best available techniques”, are described in this preface. This description is inevitably
incomplete and is given for information only. It has no legal value and does not in any way alter or prejudice the actual provisions of the Directive.
The purpose of the Directive is to achieve integrated prevention and control of pollution arising
from the activities listed in its Annex I, leading to a high level of protection of the environmentas a whole. The legal basis of the Directive relates to environmental protection. Itsimplementation should also take account of other Community objectives such as thecompetitiveness of the Community’s industry thereby contributing to sustainable development.
More specifically, it provides for a permitting system for certain categories of industrialinstallations requiring both operators and regulators to take an integrated, overall look at the
polluting and consuming potential of the installation. The overall aim of such an integratedapproach must be to improve the management and control of industrial processes so as toensure a high level of protection for the environment as a whole. Central to this approach is thegeneral principle given in Article 3 that operators should take all appropriate preventativemeasures against pollution, in particular through the application of best available techniquesenabling them to improve their environmental performance.
The term “best available techniques” is defined in Article 2(11) of the Directive as “the mosteffective and advanced stage in the development of activities and their methods of operationwhich indicate the practical suitability of particular techniques for providing in principle the
basis for emission limit values designed to prevent and, where that is not practicable, generallyto reduce emissions and the impact on the environment as a whole.” Article 2(11) goes on toclarify further this definition as follows:
“techniques” includes both the technology used and the way in which the installation isdesigned, built, maintained, operated and decommissioned;
“available” techniques are those developed on a scale which allows implementation in the
relevant industrial sector, under economically and technically viable conditions, taking intoconsideration the costs and advantages, whether or not the techniques are used or producedinside the Member State in question, as long as they are reasonably accessible to the operator;
“best” means most effective in achieving a high general level of protection of the environment
as a whole.
8/8/2019 Integrated Pollution Prevention and Control European Environment Comission
http://slidepdf.com/reader/full/integrated-pollution-prevention-and-control-european-environment-comission 9/178
Preface
Chlor-Alkali Manufacturing industry vii
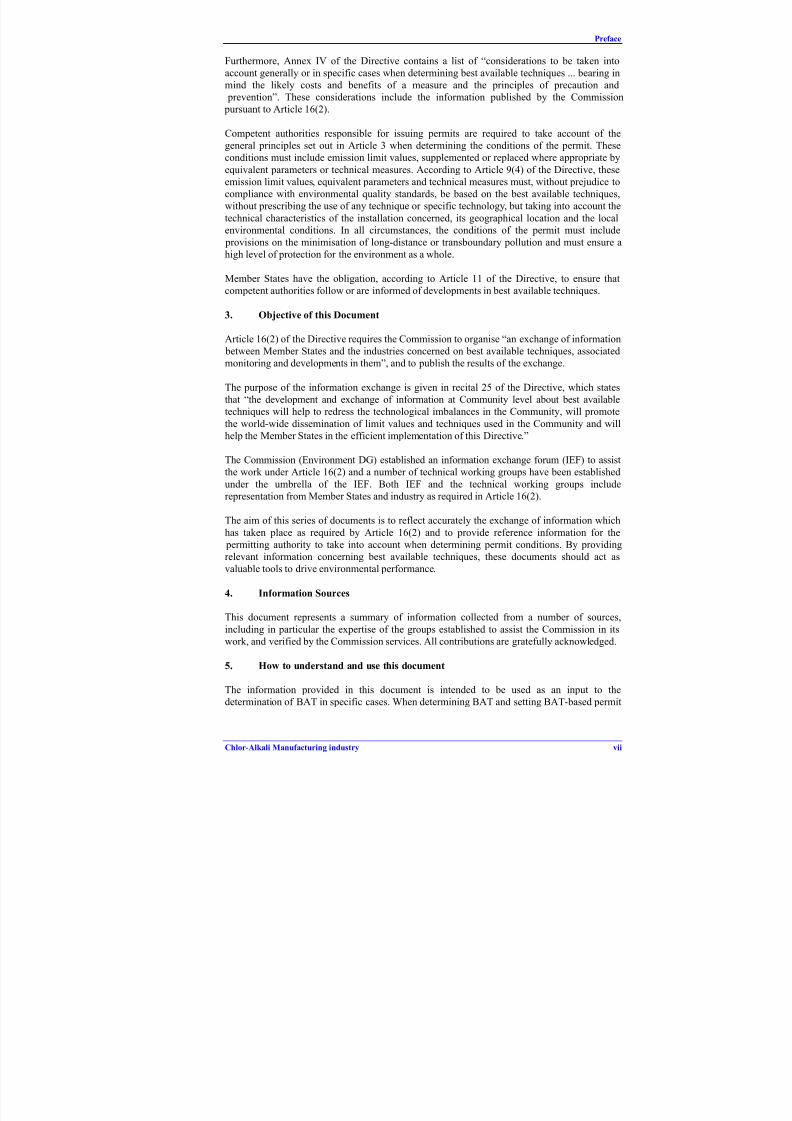
Furthermore, Annex IV of the Directive contains a list of “considerations to be taken intoaccount generally or in specific cases when determining best available techniques ... bearing inmind the likely costs and benefits of a measure and the principles of precaution and prevention”. These considerations include the information published by the Commission pursuant to Article 16(2).
Competent authorities responsible for issuing permits are required to take account of thegeneral principles set out in Article 3 when determining the conditions of the permit. Theseconditions must include emission limit values, supplemented or replaced where appropriate by
equivalent parameters or technical measures. According to Article 9(4) of the Directive, theseemission limit values, equivalent parameters and technical measures must, without prejudice tocompliance with environmental quality standards, be based on the best available techniques,without prescribing the use of any technique or specific technology, but taking into account the
technical characteristics of the installation concerned, its geographical location and the localenvironmental conditions. In all circumstances, the conditions of the permit must include provisions on the minimisation of long-distance or transboundary pollution and must ensure ahigh level of protection for the environment as a whole.
Member States have the obligation, according to Article 11 of the Directive, to ensure thatcompetent authorities follow or are informed of developments in best available techniques.
3. Objective of this Document
Article 16(2) of the Directive requires the Commission to organise “an exchange of information between Member States and the industries concerned on best available techniques, associatedmonitoring and developments in them”, and to publish the results of the exchange.
The purpose of the information exchange is given in recital 25 of the Directive, which statesthat “the development and exchange of information at Community level about best available
techniques will help to redress the technological imbalances in the Community, will promotethe world-wide dissemination of limit values and techniques used in the Community and willhelp the Member States in the efficient implementation of this Directive.”
The Commission (Environment DG) established an information exchange forum (IEF) to assistthe work under Article 16(2) and a number of technical working groups have been established
under the umbrella of the IEF. Both IEF and the technical working groups includerepresentation from Member States and industry as required in Article 16(2).
The aim of this series of documents is to reflect accurately the exchange of information which
has taken place as required by Article 16(2) and to provide reference information for the permitting authority to take into account when determining permit conditions. By providing
relevant information concerning best available techniques, these documents should act asvaluable tools to drive environmental performance.
4. Information Sources
This document represents a summary of information collected from a number of sources,
including in particular the expertise of the groups established to assist the Commission in itswork, and verified by the Commission services. All contributions are gratefully acknowledged.
5. How to understand and use this document
The information provided in this document is intended to be used as an input to thedetermination of BAT in specific cases. When determining BAT and setting BAT-based permit

8/8/2019 Integrated Pollution Prevention and Control European Environment Comission
http://slidepdf.com/reader/full/integrated-pollution-prevention-and-control-european-environment-comission 10/178
Preface
viii Chlor-Alkali Manufacturing industry
conditions, account should always be taken of the overall goal to achieve a high level of protection for the environment as a whole.The rest of this section describes the type of information that is provided in each section of thedocument.
Chapters 1 and 2 provide general information on the industrial sector concerned and on the
industrial processes used within the sector. Chapter 3 provides data and information concerningcurrent emission and consumption levels reflecting the situation in existing installations at thetime of writing.
Chapter 4 describes in more detail the emission reduction and other techniques that areconsidered to be most relevant for determining BAT and BAT-based permit conditions. Thisinformation includes the consumption and emission levels considered achievable by using the
technique, some idea of the costs and the cross-media issues associated with the technique, andthe extent to which the technique is applicable to the range of installations requiring IPPC permits, for example new, existing, large or small installations. Techniques that are generallyseen as obsolete are not included.
Chapter 5 presents the techniques and the emission and consumption levels that are consideredto be compatible with BAT in a general sense. The purpose is thus to provide generalindications regarding the emission and consumption levels that can be considered as anappropriate reference point to assist in the determination of BAT-based permit conditions or for
the establishment of general binding rules under Article 9(8). It should be stressed, however,that this document does not propose emission limit values. The determination of appropriate permit conditions will involve taking account of local, site-specific factors such as the technicalcharacteristics of the installation concerned, its geographical location and the local
environmental conditions. In the case of existing installations, the economic and technicalviability of upgrading them also needs to be taken into account. Even the single objective of ensuring a high level of protection for the environment as a whole will often involve making
trade-off judgements between different types of environmental impact, and these judgementswill often be influenced by local considerations.
Although an attempt is made to address some of these issues, it is not possible for them to beconsidered fully in this document. The techniques and levels presented in chapter 5 willtherefore not necessarily be appropriate for all installations. On the other hand, the obligation to
ensure a high level of environmental protection including the minimisation of long-distance or transboundary pollution implies that permit conditions cannot be set on the basis of purely localconsiderations. It is therefore of the utmost importance that the information contained in thisdocument is fully taken into account by permitting authorities.
Since the best available techniques change over time, this document will be reviewed and
updated as appropriate. All comments and suggestions should be made to the European IPPCBureau at the Institute for Prospective Technological Studies at the following address:
Edificio Expo-WTC, C/Inca Garcilaso, s/n, E-41092 Seville, SpainTelephone: +34 95 4488 284Fax: +34 95 4488 426
e-mail: [email protected]: http://eippcb.jrc.es
8/8/2019 Integrated Pollution Prevention and Control European Environment Comission
http://slidepdf.com/reader/full/integrated-pollution-prevention-and-control-european-environment-comission 11/178
Chlor-Alkali Manufacturing industry ix
Reference Document on Best Available Techniques in the
Chlor-Alkali Manufacturing industry
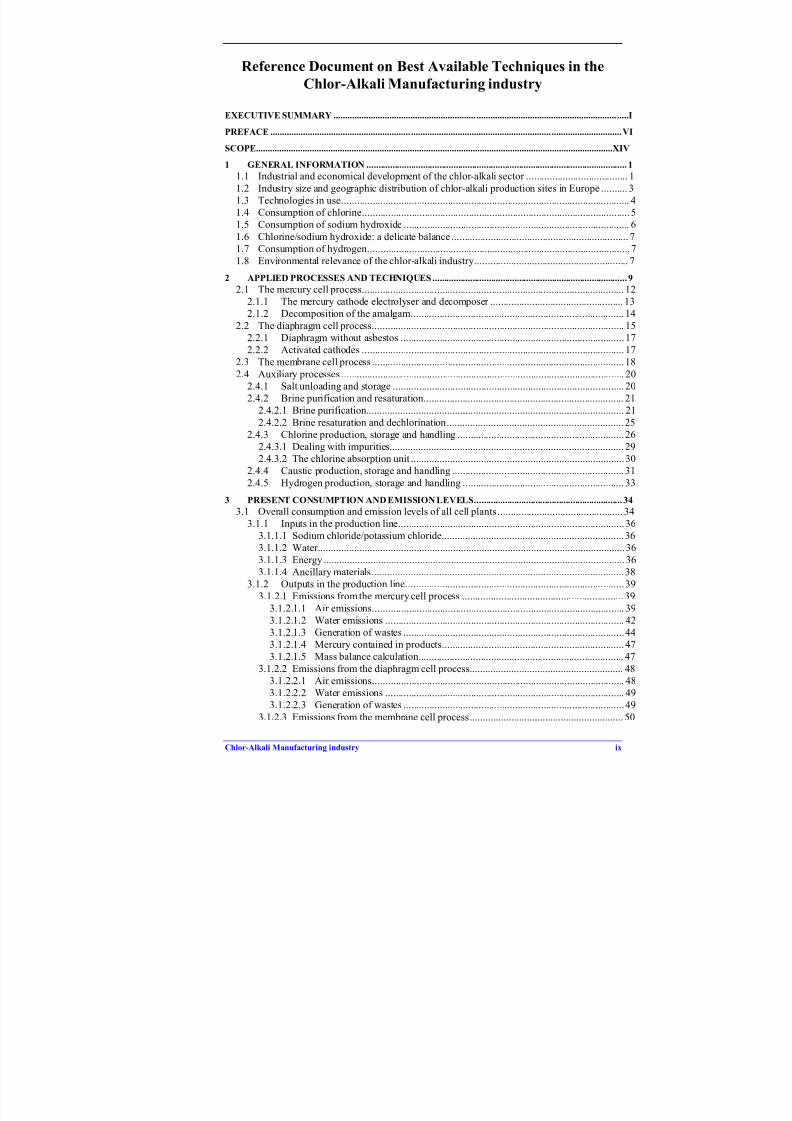
EXECUTIVE SUMMARY ............................................................. ............................................................ .....I
PREFACE ............................................................ ............................................................ ..............................VI
SCOPE.........................................................................................................................................................XIV
1 GENERAL INFORMATION ............................................................................................................... 1
1.1 Industrial and economical development of the chlor-alkali sector ....................................... 1
1.2 Industry size and geographic distribution of chlor-alkali production sites in Europe .......... 31.3 Technologies in use............................................................................................................... 41.4 Consumption of chlorine....................................................................................................... 51.5 Consumption of sodium hydroxide ....................................................................................... 6
1.6 Chlorine/sodium hydroxide: a delicate balance .................................................................... 71.7 Consumption of hydrogen.....................................................................................................71.8 Environmental relevance of the chlor-alkali industry........................................................... 7
2 APPLIED PROCESSES AND TECHNIQUES................................................................................... 92.1 The mercury cell process..................................................................................................... 12
2.1.1 The mercury cathode electrolyser and decomposer ................................................... 132.1.2 Decomposition of the amalgam.................................................................................. 14
2.2 The diaphragm cell process................................................................................................. 152.2.1 Diaphragm without asbestos ......................................................................................172.2.2 Activated cathodes ..................................................................................................... 17
2.3 The membrane cell process .................................................................................................18
2.4 Auxiliary processes ............................................................................................................. 202.4.1 Salt unloading and storage ......................................................................................... 202.4.2 Brine purification and resaturation............................................................................. 21
2.4.2.1 Brine purification................................................................................................... 212.4.2.2 Brine resaturation and dechlorination.................................................................... 252.4.3 Chlorine production, storage and handling ................................................................26
2.4.3.1 Dealing with impurities.......................................................................................... 292.4.3.2 The chlorine absorption unit .................................................................................. 30
2.4.4 Caustic production, storage and handling .................................................................. 31
2.4.5 Hydrogen production, storage and handling .............................................................. 33
3 PRESENT CONSUMPTION AND EMISSION LEVELS............................................................... 34
3.1 Overall consumption and emission levels of all cell plants................................................343.1.1 Inputs in the production line.......................................................................................36
3.1.1.1 Sodium chloride/potassium chloride......................................................................363.1.1.2 Water......................................................................................................................36
3.1.1.3 Energy .................................................................................................................... 363.1.1.4 Ancillary materials.................................................................................................38
3.1.2 Outputs in the production line....................................................................................393.1.2.1 Emissions from the mercury cell process .............................................................. 39
3.1.2.1.1 Air emissions................................................................................................. 393.1.2.1.2 Water emissions ............................................................................................ 423.1.2.1.3 Generation of wastes .....................................................................................443.1.2.1.4 Mercury contained in products......................................................................473.1.2.1.5 Mass balance calculation............................................................................... 47
3.1.2.2 Emissions from the diaphragm cell process........................................................... 483.1.2.2.1 Air emissions................................................................................................. 48
3.1.2.2.2 Water emissions ............................................................................................ 493.1.2.2.3 Generation of wastes .....................................................................................49
3.1.2.3 Emissions from the membrane cell process........................................................... 50
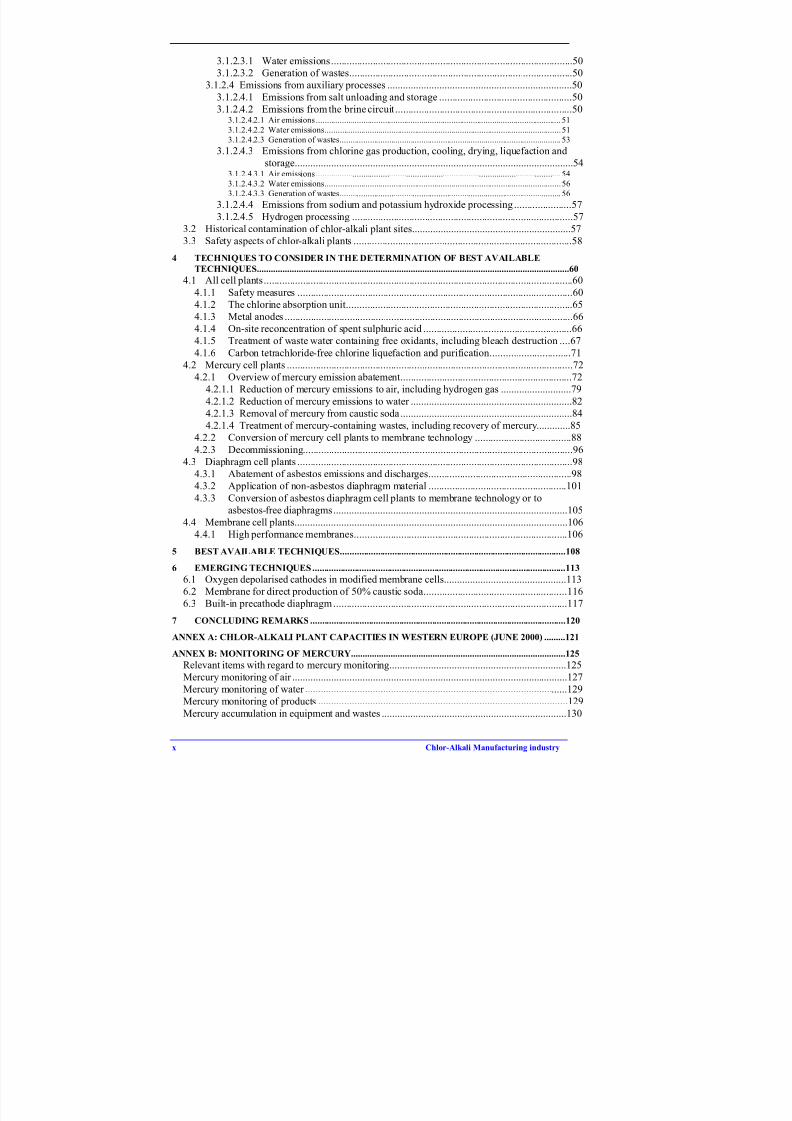
8/8/2019 Integrated Pollution Prevention and Control European Environment Comission
http://slidepdf.com/reader/full/integrated-pollution-prevention-and-control-european-environment-comission 12/178
x Chlor-Alkali Manufacturing industry
3.1.2.3.1 Water emissions.............................................................................................503.1.2.3.2 Generation of wastes......................................................................................50
3.1.2.4 Emissions from auxiliary processes .......................................................................503.1.2.4.1 Emissions from salt unloading and storage ...................................................503.1.2.4.2 Emissions from the brine circuit ....................................................................50
3.1.2.4.2.1 Air emissions .................................................................................................................. 51
3.1.2.4.2.2 Water emissions..............................................................................................................51
3.1.2.4.2.3 Generation of wastes....................................................................................................... 533.1.2.4.3 Emissions from chlorine gas production, cooling, drying, liquefaction and
storage...........................................................................................................543.1.2.4.3.1 Air emissions .................................................................................................................. 54
3.1.2.4.3.2 Water emissions..............................................................................................................56
3.1.2.4.3.3 Generation of wastes....................................................................................................... 56
3.1.2.4.4 Emissions from sodium and potassium hydroxide processing......................57
3.1.2.4.5 Hydrogen processing .....................................................................................573.2 Historical contamination of chlor-alkali plant sites.............................................................573.3 Safety aspects of chlor-alkali plants ....................................................................................58
4 TECHNIQUES TO CONSIDER IN THE DETERMINATION OF BEST AVAILABLE
TECHNIQUES......................................................................................................................................60
4.1 All cell plants.......................................................................................................................604.1.1 Safety measures ..........................................................................................................604.1.2 The chlorine absorption unit.......................................................................................654.1.3 Metal anodes ...............................................................................................................664.1.4 On-site reconcentration of spent sulphuric acid .........................................................664.1.5 Treatment of waste water containing free oxidants, including bleach destruction ....67
4.1.6 Carbon tetrachloride-free chlorine liquefaction and purification...............................714.2 Mercury cell plants ..............................................................................................................72
4.2.1 Overview of mercury emission abatement..................................................................724.2.1.1 Reduction of mercury emissions to air, including hydrogen gas ...........................79
4.2.1.2 Reduction of mercury emissions to water ..............................................................82
4.2.1.3 Removal of mercury from caustic soda ..................................................................844.2.1.4 Treatment of mercury-containing wastes, including recovery of mercury.............85
4.2.2 Conversion of mercury cell plants to membrane technology .....................................88
4.2.3 Decommissioning........................................................................................................964.3 Diaphragm cell plants ..........................................................................................................98
4.3.1 Abatement of asbestos emissions and discharges.......................................................984.3.2 Application of non-asbestos diaphragm material .....................................................101
4.3.3 Conversion of asbestos diaphragm cell plants to membrane technology or toasbestos-free diaphragms..........................................................................................105
4.4 Membrane cell plants.........................................................................................................1064.4.1 High performance membranes..................................................................................106
5 BEST AVAILABLE TECHNIQUES................................................................................................1086 EMERGING TECHNIQUES............................................................................................................113
6.1 Oxygen depolarised cathodes in modified membrane cells...............................................1136.2 Membrane for direct production of 50% caustic soda.......................................................1166.3 Built-in precathode diaphragm..........................................................................................117
7 CONCLUDING REMARKS .............................................................................................................120
ANNEX A: CHLOR-ALKALI PLANT CAPACITIES IN WESTERN EUROPE (JUNE 2000) .........121
ANNEX B: MONITORING OF MERCURY............................................................................................125
Relevant items with regard to mercury monitoring....................................................................125Mercury monitoring of air ..........................................................................................................127
Mercury monitoring of water .....................................................................................................129Mercury monitoring of products ................................................................................................129
Mercury accumulation in equipment and wastes .......................................................................130

8/8/2019 Integrated Pollution Prevention and Control European Environment Comission
http://slidepdf.com/reader/full/integrated-pollution-prevention-and-control-european-environment-comission 13/178

8/8/2019 Integrated Pollution Prevention and Control European Environment Comission
http://slidepdf.com/reader/full/integrated-pollution-prevention-and-control-european-environment-comission 14/178
xii Chlor-Alkali Manufacturing industry
List of tables
Table 1.1: Distribution of processes and capacities of chlor-alkali plants in western Europe (June 2000).. 4
Table 2.1: Main characteristics of the different electrolysis processes ...................................................... 11
Table 2.2: Example of brine specifications for the membrane process operating at a current density up to
4 kA/m2
................................................... ............................................................ ...................... 23
Table 2.3: Possible trade-off in chlorine gas liquefaction ................................................................... ....... 28
Table 3.1: Overview of inputs and outputs of the chlor-alkali manufacturing processes ........................... 35Table 3.2: Comparison of typical energy use by the mercury, diaphragm and membrane cell chlor-alkali
technologies, assuming production of 50% caustic soda and before liquefaction of chlorine... 37
Table 3.3: Consumption and use of chemical auxiliaries in chlor-alkali plants using a brine recirculation
process................................................................... ...................................................... .............. 38
Table 3.4: Waste generation and final treatment at Akzo Nobel Bohus in 1998/99................................... 46
Table 3.5: Yearly waste generation and final treatment at Hydro Polymers AB........................................ 46
Table 3.6: Releases into water from the brine circuit using a recirculation process................................... 51
Table 3.7: Application of carbon tetrachloride in the chlor-alkali industry in western Europe.................. 55
Table 4.1: List of some preventative and corrective or emergency measures to avoid accidents at loading
areas of a chlor-alkali plant ................................................................ ....................................... 62
Table 4.2: List of some preventative and corrective or emergency measures to avoid accidents associated
with storage of liquid chlorine....................................................................................... ............ 63
Table 4.3: Overview of measures, corresponding mercury levels and emissions from the Hydro Polymers
(Stenungsund, Sweden) mercury cell chlor-alkali plant in 1997........................................ ....... 77
Table 4.4: Overview of measures, corresponding mercury levels and emissions from the Akzo Nobel
(Bohus, Sweden) mercury cell chlor-alkali plant in 1997. ........................................ ................ 78
Table 4.5: Treatment possibilities for mercury-containing wastes.............................. ............................... 85
Table 4.6: Some available techniques with typical performances for treatment of mercury containing
wastes... ............................................................ ............................................................ ............. 86
Table 4.7: Data from the conversion of the Borregaard chlor-alkali plant to membrane technology......... 93
Table 4.8: Comparison of reported conversion costs .............................................. ................................... 94
Table 6.1: Precathode technology at CHLORALP (Le Pont de Claix-France) ........................................ 119

8/8/2019 Integrated Pollution Prevention and Control European Environment Comission
http://slidepdf.com/reader/full/integrated-pollution-prevention-and-control-european-environment-comission 15/178
Chlor-Alkali Manufacturing industry xiii
List of figures
Figure 1.1: Development of chlorine production in western Europe ........................................................ ....1
Figure 1.2: Chlorine production in western Europe in 1999.........................................................................2
Figure 1.3: Geographic distribution of chlor-alkali plants within the European Union 1999.......................3
Figure 1.4: Comparison of the total chlorine capacity by technology between western Europe, United
States and world-wide..................................................................................................................5
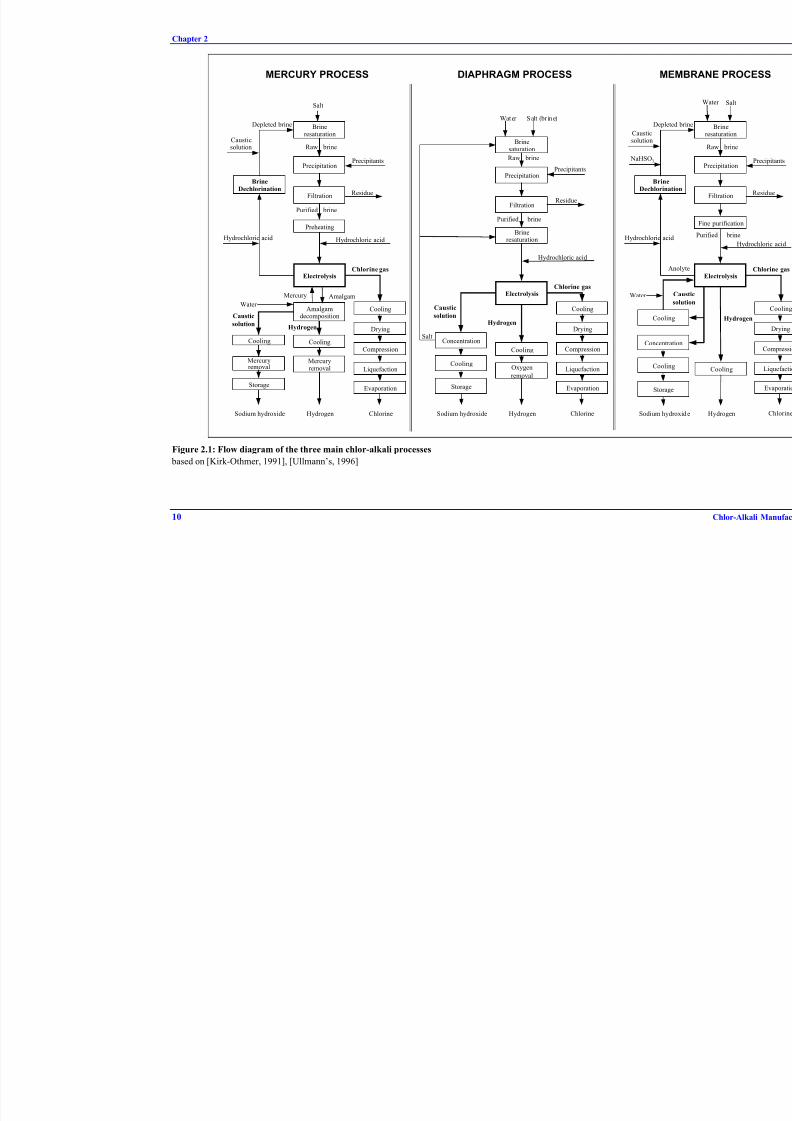
Figure 1.5: Chlorine applications in western Europe....................................................................................6Figure 2.1: Flow diagram of the three main chlor-alkali processes ............................................................10
Figure 2.2: Simplified scheme of chlorine electrolysis cells.......................................................................11
Figure 2.3: Flow diagram of mercury cell technology................................................................................13
Figure 2.4: Mercury cells with horizontal decomposer...............................................................................14
Figure 2.5: Mercury cells with vertical decomposer...................................................................................15
Figure 2.6: Typical diaphragm electrolysis cell..........................................................................................16
Figure 2.7: Flow diagram of integration of membrane or mercury and diaphragm processes ....................17
Figure 2.8: Diagram of a membrane process .......................................................... ....................................19
Figure 2.9: Exploded view of a monopolar membrane electrolyser........................................... .................19
Figure 2.10: View of a membrane cell room equipped with bipolar electrolysers......................................20
Figure 2.11: Possible lay-out for the brine purification system used in membrane process........................22
Figure 2.12: View of chelate resin towers in a secondary brine purification system ..................................24Figure 2.13: View of polishing filters in a secondary brine purification system.........................................24
Figure 2.14: The flow of chlorine from the electrolysers to storage..... ......................................................26
Figure 2.15: View of caustic production and storage ......................................................... ........................31
Figure 2.16: The flow to storage of caustic soda from the different technologies ......................................32
Figure 3.1: Solid waste sources in the mercury process..............................................................................45
Figure 4.1: Schematic diagram of a catalytic reduction fixed bed reactor process .....................................69
Figure 4.2: Mercury plant conversion to membrane technology.................................................................89
Figure 4.3: Example of handling of asbestos from Dow in Stade (Germany)...........................................101
Figure 6.1: The influence of oxygen depolarised cathodes on the electrode potentials, NaCl..................113
Figure 6.2: Principle of the Gas Pocket Electrode for pressure compensation .........................................114
Figure 6.3: Structure of Fx-50 membrane producing 50% caustic soda ...................................................116
Figure 6.4: The built in precathode diaphragm operating principle..........................................................117

8/8/2019 Integrated Pollution Prevention and Control European Environment Comission
http://slidepdf.com/reader/full/integrated-pollution-prevention-and-control-european-environment-comission 16/178

8/8/2019 Integrated Pollution Prevention and Control European Environment Comission
http://slidepdf.com/reader/full/integrated-pollution-prevention-and-control-european-environment-comission 17/178
Chapter 1
Chlor-Alkali Manufacturing industry 1
1 GENERAL INFORMATION
1.1 Industrial and economical development of the chlor-alkali
sector
In 1800, Cruickshank was the first to prepare chlorine electrochemically. The process was,however, of little significance until the development of a suitable generator and of syntheticgraphite for anodes in 1892. These two developments made possible the electrolytic productionof chlorine, the chlor-alkali process, on an industrial scale. About the same time, both the
diaphragm cell process (Griesheim cell, 1885) and the mercury cell process (Castner-Kellner cell, 1892) were introduced. The membrane cell process was developed much more recently(1970). Currently, 95% of world chlorine production is obtained by the chlor-alkali process.[Ullmann’s, 1996]
Since 1970 graphite anodes have been largely superseded by activated titanium anodes in thediaphragm and mercury cell processes. The newer membrane cell process uses only activatedtitanium anodes. [Ullmann’s, 1996]
Production of chlorine was very low in the 1800s and chlorine was only used for bleaching. In1887, annual world production was 115 tonnes [Le Chlore, 1996]. Chlorine production sincethe 1940s has risen enormously, on the back of the burgeoning demand for plastics, notablyPVC [J. Ind. Ecology, 1997] and polyurethanes. The production of chloroaromatics (e.g.
chlorobenzene for phenol synthesis), propylene oxide (chlorohydrin process), solventscontaining chlorinated hydrocarbons, and inorganic chlorine compounds are also importantfactors behind the increased use of chlorine after 1940.
After a fall at the beginning of the 1990s, production in western Europe now seems to be
stabilised at around 9 millions tonnes per year (9.2 million tonnes in 1999). This placed it behind the United States, with production of 11.2 million tonnes in 1994, but ahead of Japan,with 4.2 million tonnes production capacity in 1995. The world-wide chlorine production was38 million tonnes in 1994. The global demand for both chlorine and caustic has been forecast to
increase, although mainly in Latin America and Asia.
Figure 1.1 gives an overview of how production has developed since 1960 in western Europe.
0
2000
4000
6000
8000
10000
12000
1955 1960 1965 1970 1975 1980 1985 1990 1995 2000
C h l o r i n e ( k t )
Figure 1.1: Development of chlorine production in western Europe[Le Chlore, 1996]

8/8/2019 Integrated Pollution Prevention and Control European Environment Comission
http://slidepdf.com/reader/full/integrated-pollution-prevention-and-control-european-environment-comission 18/178
Chapter 1
2 Chlor-Alkali Manufacturing industry
Figure 1.2 shows the annual chlorine production in western Europe per country in 1999.Denmark and Luxembourg do not have any chlor-alkali plants and Ireland, with only 6000tonnes production capacity, is not shown. In June 2000, there were 79 chlorine production plants corresponding to 93 process units in 15 west European countries (EU countries,
Switzerland and Norway). A detailed list is given in Annex A.
39%
16%
8% 8% 8% 7% 7%
3% 3%1%
0
500
1000
1500
2000
2500
3000
3500
4000
G E R M
A N Y
F R A N
C E U K I T A L Y
B E L G I U M
N E T H
E R L A N D
S
S P A I N
F I N / S W
E D E N
/ A U S T R
I A
N O R W
A Y / S W I T Z E R L A N
D
P O R T
U G A L / G R E
E C E
c h l o r i n e ( k t )
Chorine production 1999 (thousands of tonnes)
Germany
France
UK
Italy
Belgium
Spain
Netherlands
Fin/Sweden/Austria
Norway/Switzerland
Portugal/Greece
3607
1504
747
706
706
653
619
319
262
98
---------
9219
Figure 1.2: Chlorine production in western Europe in 1999
[Euro Chlor]
Sustained growth in the USA and Europe resulted in expansion to meet demand. Although therehave been some fluctuations, utilisation of plant capacity has remained at between 80% and
95% in both areas since the late 1980s. At the moment there is no overcapacity and new plantinvestment seems to be under way [Euro Chlor report, 1997]. Global production capacity of chlorine in 1995 was about 44 million tonnes, the EU accounting for about 24% of thatcapacity. Of world chlor-alkali capacity, 65% is concentrated in three regions; North America,western Europe and Japan [Beal, 1995].
The chlor-alkali process is one of the largest consumers of electrical energy. The chlorine production of a country is an indicator of the state of development of its chemical industry.
The total value of western European chlor-alkali sector production is 3 billion euros, accordingto [SRI Consulting, 1997]. SRI Consulting estimates that the turnover in 1995 generated bychlor-alkali related products amounted to some 230 billion euros, that is about 60% of theturnover of the west European chemical industry.
Euro Chlor estimates that there are 46000 employees involved in the direct production of chlorine in the EU. When chlorine derivatives and chlorine-dependent industry are included thenumber of employees is approximately two million.
8/8/2019 Integrated Pollution Prevention and Control European Environment Comission
http://slidepdf.com/reader/full/integrated-pollution-prevention-and-control-european-environment-comission 19/178
Chapter 1
Chlor-Alkali Manufacturing industry 3
1.2 Industry size and geographic distribution of chlor-alkali
production sites in Europe
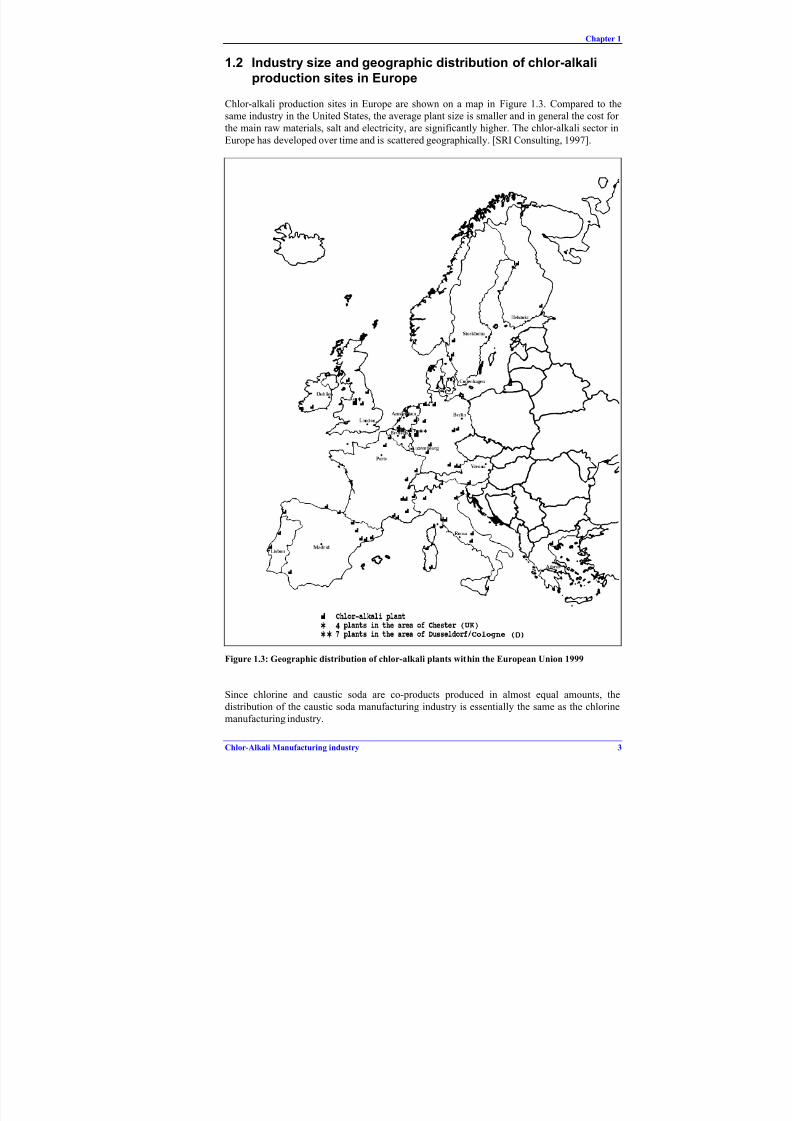
Chlor-alkali production sites in Europe are shown on a map in Figure 1.3. Compared to thesame industry in the United States, the average plant size is smaller and in general the cost for the main raw materials, salt and electricity, are significantly higher. The chlor-alkali sector in
Europe has developed over time and is scattered geographically. [SRI Consulting, 1997].
Figure 1.3: Geographic distribution of chlor-alkali plants within the European Union 1999
Since chlorine and caustic soda are co-products produced in almost equal amounts, thedistribution of the caustic soda manufacturing industry is essentially the same as the chlorinemanufacturing industry.
8/8/2019 Integrated Pollution Prevention and Control European Environment Comission
http://slidepdf.com/reader/full/integrated-pollution-prevention-and-control-european-environment-comission 20/178
Chapter 1
4 Chlor-Alkali Manufacturing industry
1.3 Technologies in use
The main technologies applied for chlor-alkali production are mercury, diaphragm and
membrane cell electrolysis, mainly using sodium chloride as feed or to a lesser extent using potassium chloride for the production of potassium hydroxide. Other electrochemical processesin which chlorine is produces include the electrolysis of hydrochloric acid and the electrolysis
of molten alkali-metal and alkaline-earth-metal chlorides, in which the chlorine is a by-product, but these account for less than 3% of the total chlorine production capacity.
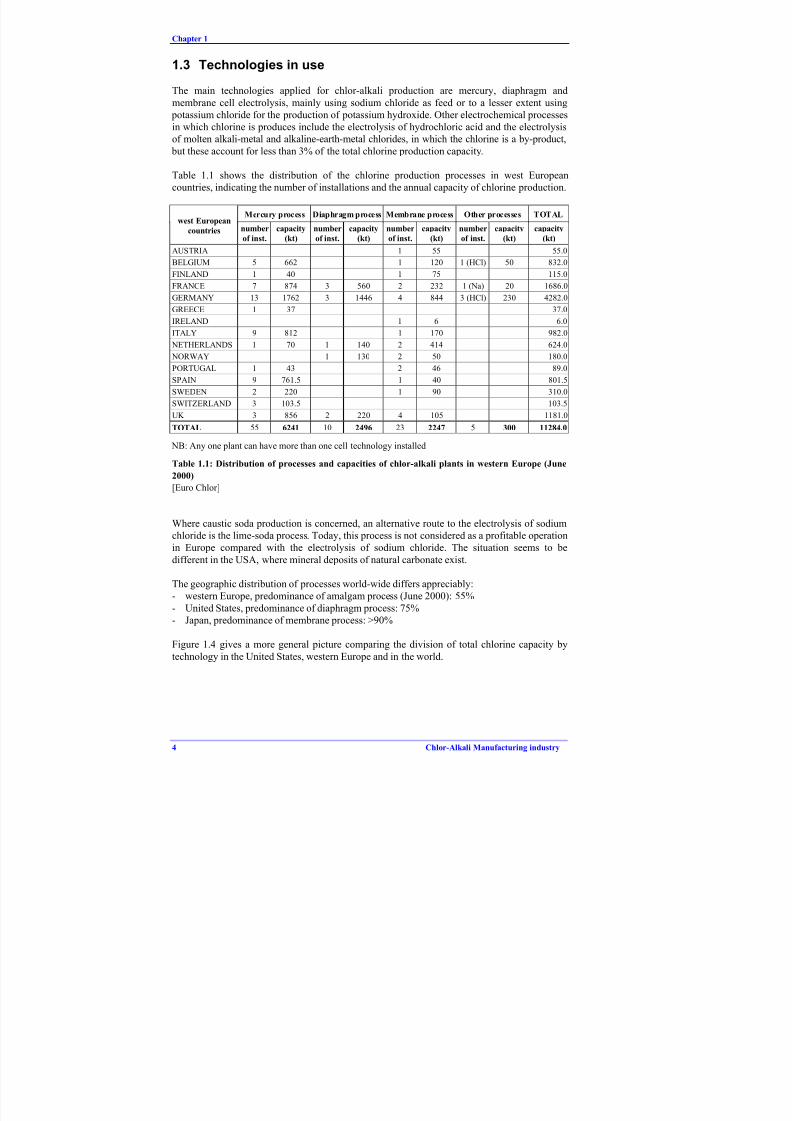
Table 1.1 shows the distribution of the chlorine production processes in west Europeancountries, indicating the number of installations and the annual capacity of chlorine production.
Mercury process Diaphragm process Membrane process Other processes TOTALwest European
countries number
of inst.
capacity
(kt)
number
of inst.
capacity
(kt)
number
of inst.
capacity
(kt)
number
of inst.
capacity
(kt)
capacity
(kt)
AUSTRIA 1 55 55.0
BELGIUM 5 662 1 120 1 (HCl) 50 832.0
FINLAND 1 40 1 75 115.0FRANCE 7 874 3 560 2 232 1 (Na) 20 1686.0
GERMANY 13 1762 3 1446 4 844 3 (HCl) 230 4282.0
GREECE 1 37 37.0
IRELAND 1 6 6.0
ITALY 9 812 1 170 982.0
NETHERLANDS 1 70 1 140 2 414 624.0
NORWAY 1 130 2 50 180.0
PORTUGAL 1 43 2 46 89.0
SPAIN 9 761.5 1 40 801.5
SWEDEN 2 220 1 90 310.0
SWITZERLAND 3 103.5 103.5
UK 3 856 2 220 4 105 1181.0TOTAL 55 6241 10 2496 23 2247 5 300 11284.0
NB: Any one plant can have more than one cell technology installed
Table 1.1: Distribution of processes and capacities of chlor-alkali plants in western Europe (June
2000)
[Euro Chlor]
Where caustic soda production is concerned, an alternative route to the electrolysis of sodiumchloride is the lime-soda process. Today, this process is not considered as a profitable operationin Europe compared with the electrolysis of sodium chloride. The situation seems to be
different in the USA, where mineral deposits of natural carbonate exist.
The geographic distribution of processes world-wide differs appreciably:- western Europe, predominance of amalgam process (June 2000): 55%
- United States, predominance of diaphragm process: 75%- Japan, predominance of membrane process: >90%
Figure 1.4 gives a more general picture comparing the division of total chlorine capacity by
technology in the United States, western Europe and in the world.

8/8/2019 Integrated Pollution Prevention and Control European Environment Comission
http://slidepdf.com/reader/full/integrated-pollution-prevention-and-control-european-environment-comission 21/178
Chapter 1
Chlor-Alkali Manufacturing industry 5
0 %
1 0%
2 0%
3 0%
4 0%
5 0%
6 0%
7 0%
8 0%
9 0%
1 0 0 %
W O R L D W ES TE R N
E U R O P E
UNIT ED
STATES
O T H E R S
M E R C U R Y
DIAPHRAGM
MEMBRANE
Figure 1.4: Comparison of the total chlorine capacity by technology between western Europe,
United States and world-wide
[Lindley, 1997]
Since 1975, the membrane cell process has been developed to a high degree of sophistication. Ithas ecological advantages over the two older processes and has become the most economically
advantageous process in recent years. Despite these advantages, the change of technology tomembrane cells has been slow in western Europe because most existing chlorine plants wereinstalled in the 1970s with a plant life of 40-60 years and there has been no need for new production capacity. Nor has there been a legislative drive to change technology.
1.4 Consumption of chlorine
Chlorine is largely used in the synthesis of chlorinated organic compounds. VCM for thesynthesis of PVC still remains the driver of chlor-alkali production in most European countries.
Chlorine is difficult to store and transport economically and, therefore, chlorine is generally produced near consumers. When other solutions cannot be found, chlorine is transported by pipe, road and rail.
The uses of chlorine can be divided into:
- organic uses, which account for about 80% of consumption:synthesis of VCM, chloromethane, phosgene, organic chlorinated solvents such as trichloro-ethene, tetrachloro-ethene, oxygenated derivatives, precursors or intermediates for thesynthesis of pesticides or pharmaceutical products.
- inorganic uses, which account for about 15% of consumption:
synthesis of sodium hypochlorite, hydrochloric acid, metal chlorides, bromine.
- direct uses, which account for less than 4% of consumption:water treatment, pulp and paper
Western European exports of elemental chlorine to outside the region are negligible. More than
85% of the chlorine produced in EU is used on the same or adjacent sites for other chemical processes. The production of chlorine and caustic is completely inter-related with the
downstream businesses, including the PVC industry and the intermediates used to manufacturePVC. [Lindley, 1997]
8/8/2019 Integrated Pollution Prevention and Control European Environment Comission
http://slidepdf.com/reader/full/integrated-pollution-prevention-and-control-european-environment-comission 22/178
Chapter 1
6 Chlor-Alkali Manufacturing industry
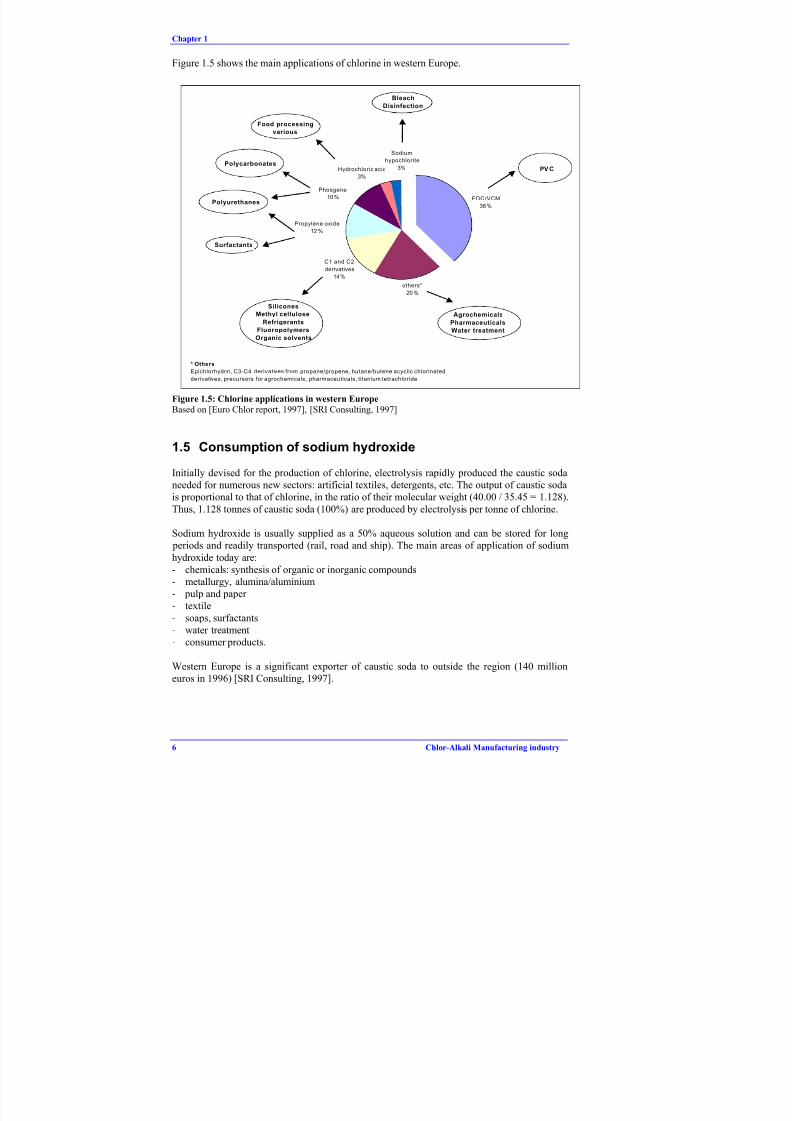
Figure 1.5 shows the main applications of chlorine in western Europe.
EDC/VCM
38%
others*
20 %
C1 and C2
derivatives
14%
Hydrochloric acid
3%
Propylene oxide
12 %
Phosgene
10%
Sodium
hypochlorite
3% PV C
Surfactants
Polyurethanes
Polycarbonates
Food processing
various
Bleach
Disinfection
Agrochemicals
Pharmaceuticals
Water treatment
Silicones
Methyl cellulose
Refrigerants
Fluoropolymers
Organic solvents
* Others
Epichlorhydrin, C3-C4 derivatives from propane/propene, butane/butene acyclic chlorinated
derivatives, precursors for agrochemicals, pharmaceuticals, titanium tetrachloride
Figure 1.5: Chlorine applications in western Europe
Based on [Euro Chlor report, 1997], [SRI Consulting, 1997]
1.5 Consumption of sodium hydroxide
Initially devised for the production of chlorine, electrolysis rapidly produced the caustic sodaneeded for numerous new sectors: artificial textiles, detergents, etc. The output of caustic sodais proportional to that of chlorine, in the ratio of their molecular weight (40.00 / 35.45 = 1.128).
Thus, 1.128 tonnes of caustic soda (100%) are produced by electrolysis per tonne of chlorine.
Sodium hydroxide is usually supplied as a 50% aqueous solution and can be stored for long periods and readily transported (rail, road and ship). The main areas of application of sodium
hydroxide today are:- chemicals: synthesis of organic or inorganic compounds- metallurgy, alumina/aluminium- pulp and paper - textile
- soaps, surfactants- water treatment- consumer products.
Western Europe is a significant exporter of caustic soda to outside the region (140 millioneuros in 1996) [SRI Consulting, 1997].
8/8/2019 Integrated Pollution Prevention and Control European Environment Comission
http://slidepdf.com/reader/full/integrated-pollution-prevention-and-control-european-environment-comission 23/178
Chapter 1
Chlor-Alkali Manufacturing industry 7
1.6 Chlorine/sodium hydroxide: a delicate balance
The co-production of chlorine and sodium hydroxide in fixed proportions, 1.128 tonnes of
caustic (as 100% NaOH) per tonne chlorine produced, has always been a problem for the chlor-alkali industry. Both products are used for very different end uses with differing marketdynamics and it is only by rare chance that demand for the two coincides. Depending on which
demand is dominant, either can be regarded as a by-product and the price varies accordingly.Price fluctuations can be extreme: in the spot market in cases of oversupply, caustic prices can
be as low as $ 20-30 per tonne whereas, in short supply, prices can be $ 300 and higher per tonne [Euro Chlor report, 1997].
Chlorine itself is difficult to transport long distances; however it can be, and is, readily
exported as EDC, a precursor for PVC. Caustic soda is a globally traded commodity. Becauseof the favourable economics of production in the US Gulf (cheap electricity, salt and ethylene)the USA is the largest exporter of EDC and caustic soda. Europe is approximately in balance inchlorine, and has traditionally been the world’s second largest exporter of caustic; currently it is
a net importer. Australia (alkali for the alumina industry) and south-east Asia (EDC andcaustic) are the main importing areas.
New capacity in the Middle East and south-east Asia may upset these traditional trade patterns.Moreover, chlorine growth in Europe is likely to be lower than in most other parts of the world.
Whilst globally the chlorine growth may average 2-3% per year over the next 10 years, it isforecast to be less than 1% per year in Europe.
1.7 Consumption of hydrogen
Hydrogen is also a co-product of the electrolysis of brine (28 kg for 1 tonne of chlorine).
Hydrogen is generally used on-site as a combustible or sent as a fuel to other companies. It can
also be used on integrated sites for certain applications in particular because of its high purity:synthesis of ammonia, methanol, hydrochloric acid, hydrogen peroxide, etc.
1.8 Environmental relevance of the chlor-alkali industry
Inputs and pollutant outputs from the chlor-alkali industry are quite specific to the celltechnology used, the purity of the incoming salt and the specifications of the products. Becauseof the huge amount of electricity needed in the process, energy can be considered as a rawmaterial. The chlor-alkali process is one of the largest consumers of electrical energy.
Historical mercury and PCDD/Fs contamination of land and waterways from mercury anddiaphragm chlor-alkali plants is a big environmental problem at some sites.
For many years, the mercury cell has been a significant source of environmental pollution,
because some mercury is lost from the process to air, water, products and wastes. Inorganicmercury can be metabolised to form highly toxic methyl mercury by anaerobic bacteria, andthis organic mercury is bio-accumulated1 in the food chain.
It is recognised that the main part of the mercury losses is in the different wastes from the process. Considerable emissions of mercury can also occur with run-off water. The soil at many
1
In the 1950s a chemical plant producing acetaldehyde discharged a spent catalyst containing organicmercury into Minimata Bay, Japan. A number of people (mostly fishermen) became seriously ill and
some were disabled. This event was at the origin of environmental regulations in Japan and caused
changes into mercury free technologies in some industrial sectors.
8/8/2019 Integrated Pollution Prevention and Control European Environment Comission
http://slidepdf.com/reader/full/integrated-pollution-prevention-and-control-european-environment-comission 24/178
Chapter 1
8 Chlor-Alkali Manufacturing industry
sites is contaminated with mercury due to deposition of diffuse emissions and/or historicaldisposal of mercury contaminated wastes. The mercury leaks from the soil and ends up in therun-off water. Another big entry is the ‘Difference to Balance’. The annual mercury balance for a site is never zero. This is because mercury accumulates in plant equipment and structures
during the life of the plant.
The chlor-alkali industry was the largest domestic user of mercury in the years 1989 to 1990 inthe USA and this could be expected to be the same in Europe [J. Ind. Ecology, 1997]. Based on
the European Atmospheric Emission Inventory of Heavy Metals and Persistent OrganicPollutants [UBA (D)-TNO report, 1997] in the 15 EU countries, the highest emitters of mercuryto air in 1990 include: coal burning electric utilities (highest figure of 90.5 tonnes), municipaland hazardous waste incinerators and cement industry (37.7 tonnes). Chlor-alkali emissions to
air are reported to be 28.4 tonnes. A USEPA report, dated 1998, identifies the same sources of emissions: municipal waste incinerators, medical waste incinerators, hazardous wasteincinerators and industrial boilers. In addition, certain manufacturing processes, most notablychlor-alkali and cement plants, are listed although their emissions are substantially lower thanthose of incineration sources.
According to Euro Chlor, the total mercury emission to air, water and products from chlor-alkali plants in western Europe was 9.5 tonnes in 1998, ranging between 0.2-3.0 g Hg/tonne of chlorine capacity at the individual plants.
Decision 90/3 of 14 June 1990 of the Commission for the Protection of the MarineEnvironment of the North-East Atlantic (PARCOM2) recommends that existing mercury cellchlor-alkali plants should be phased out as soon as practicable. The objective is that they should
be phased out completely by 2010.
As regards the diaphragm technology, due to the potential exposure of employees to asbestosand releases to the environment, the use of good practices is needed and some efforts are being
made to replace the asbestos with other diaphragm material.
With the inputs/outputs of the chlor-alkali sector, it is also relevant to point out the specialimportance of safety aspects related to production, handling and storage of chlorine.
2Since 1992 OSPARCOM. Publications can be found at http://www.ospar.org

8/8/2019 Integrated Pollution Prevention and Control European Environment Comission
http://slidepdf.com/reader/full/integrated-pollution-prevention-and-control-european-environment-comission 25/178
Chapter 2
Chlor-Alkali Manufacturing industry 9
2 APPLIED PROCESSES AND TECHNIQUES
In this chapter the applied processes and techniques are qualitatively described. Chapter 3
covers the quantitative aspects of consumption and emission levels.
The chemical, thermodynamic and kinetic principles are not explained. For this, reference is
made to literature relevant to the subject [Ullmann’s, 1996] or [Kirk-Othmer, 1991].
The chlor-alkali industry produces chlorine and caustic solution (sodium or potassiumhydroxide) simultaneously by means of decomposition of a solution of salt in water. Along withthe chlorine and the caustic solution, hydrogen is produced. An industrial chlor-alkali production unit comprises a series of operations, structured as shown in Figure 2.1.
In the chlor-alkali electrolysis process, a chloride-salt solution is decomposed electrolytically by direct current. Most of the time sodium chloride is used in the process in western Europeand less frequently potassium chloride (about 3-4% of the chlorine production capacity). Other
processes such as the electrolysis of hydrochloric acid or the electrolysis of molten sodiumchloride are applied, but these only account for about 3% of total chlorine production capacityin Europe.
The electrolysis of molten sodium salts which is applied to obtain sodium and for which
chlorine is only a co-product is described in the BAT Reference document on non-ferrousmetals, as sodium is an alkali metal.
There are three basic processes for the electrolytic production of chlorine, the nature of the
cathode reaction depending on the specific process. These three processes are the diaphragmcell process (Griesheim cell, 1885), the mercury cell process (Castner–Kellner cell, 1892), andthe membrane cell process (1970). Each process represents a different method of keeping thechlorine produced at the anode separate from the caustic soda and hydrogen produced, directly
or indirectly, at the cathode [Ullmann’s, 1996].
The basic principle in the electrolysis of a sodium chloride solution is the following:- At the anode, chloride ions are oxidised and chlorine (Cl2) is formed.
- At the cathode: In the mercury process a sodium/mercury amalgam is formed and hydrogen(H2) and hydroxide ions (OH-) are formed by the reaction of the sodium in the amalgam withwater in the denuder. In membrane and diaphragm cells, water decomposes to form hydrogen(H2) and hydroxide ions (OH-) at the cathode.
For all processes the dissolving of salt, sodium chloride, is: NaCl → Na+ + Cl-
The anode reaction for all processes is:2 Cl-(aq) → Cl2(g) + 2 e-
The cathode reaction is:2 Na+(aq) +2 H2O + 2e-
→ H2(g) + 2 Na+(aq) + 2 OH-(aq)
The overall reaction is:
2 Na+(aq) + 2 Cl-(aq) + 2 H2O → 2 Na+(aq) + 2 OH-(aq) + Cl2(g) + H2(g)
8/8/2019 Integrated Pollution Prevention and Control European Environment Comission
http://slidepdf.com/reader/full/integrated-pollution-prevention-and-control-european-environment-comission 26/178
8/8/2019 Integrated Pollution Prevention and Control European Environment Comission
http://slidepdf.com/reader/full/integrated-pollution-prevention-and-control-european-environment-comission 27/178
Chapter 2
Chlor-Alkali Manufacturing industry 11
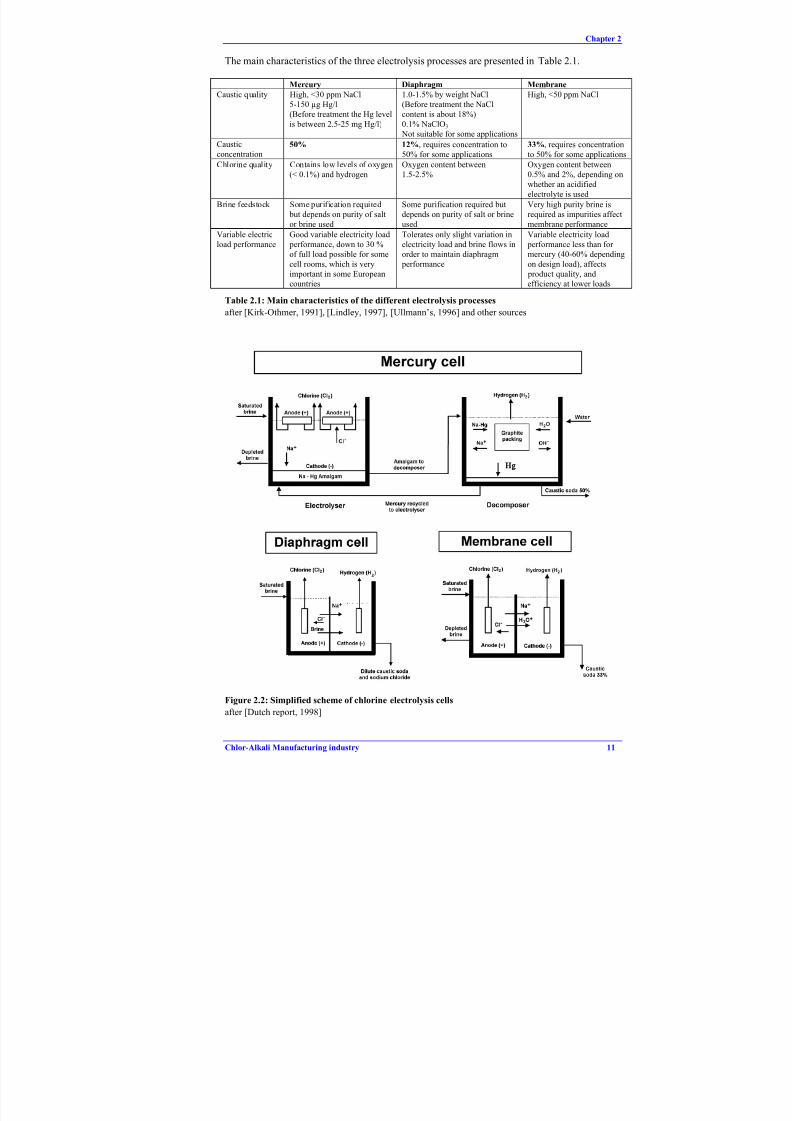
The main characteristics of the three electrolysis processes are presented in Table 2.1.
Mercury Diaphragm Membrane
Caustic quality High, <30 ppm NaCl
5-150 µg Hg/l
(Before treatment the Hg level
is between 2.5-25 mg Hg/l)
1.0-1.5% by weight NaCl
(Before treatment the NaCl
content is about 18%)
0.1% NaClO3
Not suitable for some applications
High, <50 ppm NaCl
Caustic
concentration50% 12%, requires concentration to
50% for some applications
33%, requires concentration
to 50% for some applications
Chlorine quality Contains low levels of oxygen
(< 0.1%) and hydrogen
Oxygen content between
1.5-2.5%
Oxygen content between
0.5% and 2%, depending on
whether an acidified
electrolyte is used
Brine feedstock Some purification required
but depends on purity of salt
or brine used
Some purification required but
depends on purity of salt or brine
used
Very high purity brine is
required as impurities affect
membrane performance
Variable electric
load performance
Good variable electricity load
performance, down to 30 %
of full load possible for some
cell rooms, which is very
important in some Europeancountries
Tolerates only slight variation in
electricity load and brine flows in
order to maintain diaphragm
performance
Variable electricity load
performance less than for
mercury (40-60% depending
on design load), affects
product quality, andefficiency at lower loads
Table 2.1: Main characteristics of the different electrolysis processes
after [Kirk-Othmer, 1991], [Lindley, 1997], [Ullmann’s, 1996] and other sources
Figure 2.2: Simplified scheme of chlorine electrolysis cells
after [Dutch report, 1998]
8/8/2019 Integrated Pollution Prevention and Control European Environment Comission
http://slidepdf.com/reader/full/integrated-pollution-prevention-and-control-european-environment-comission 28/178
Chapter 2
12 Chlor-Alkali Manufacturing industry
2.1 The mercury cell process
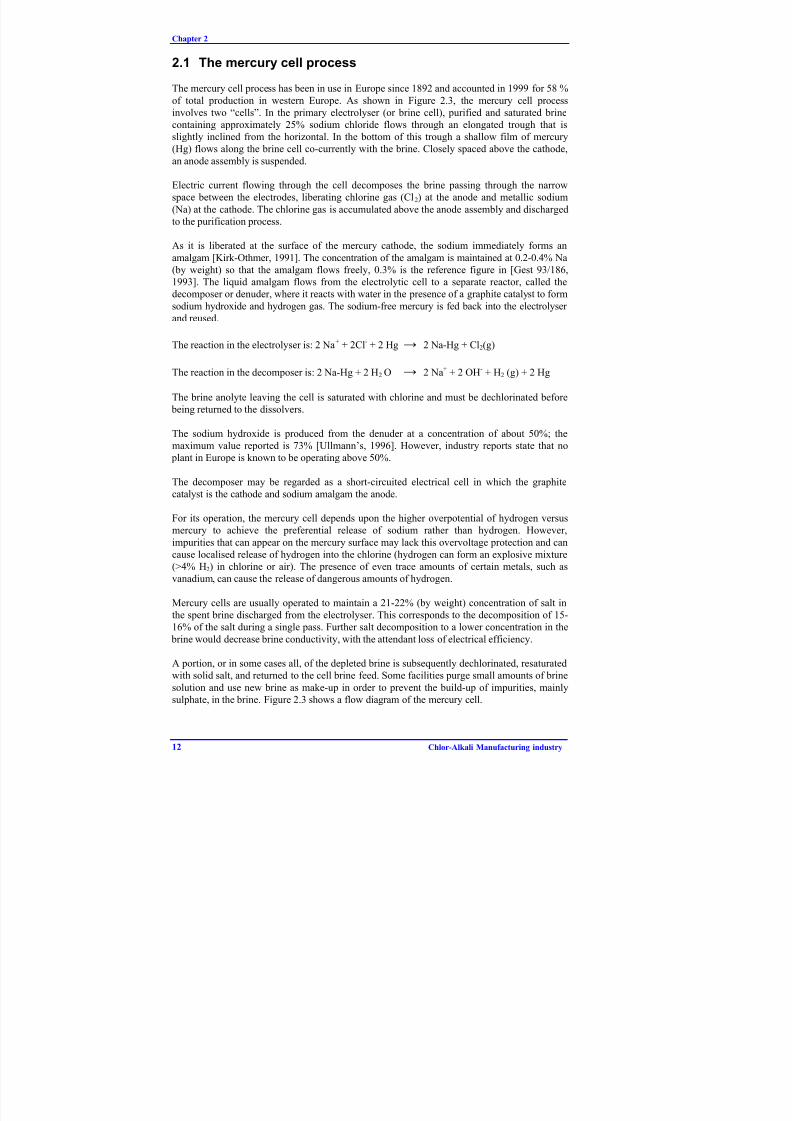
The mercury cell process has been in use in Europe since 1892 and accounted in 1999 for 58 %
of total production in western Europe. As shown in Figure 2.3, the mercury cell processinvolves two “cells”. In the primary electrolyser (or brine cell), purified and saturated brinecontaining approximately 25% sodium chloride flows through an elongated trough that is
slightly inclined from the horizontal. In the bottom of this trough a shallow film of mercury(Hg) flows along the brine cell co-currently with the brine. Closely spaced above the cathode,
an anode assembly is suspended.
Electric current flowing through the cell decomposes the brine passing through the narrowspace between the electrodes, liberating chlorine gas (Cl2) at the anode and metallic sodium
(Na) at the cathode. The chlorine gas is accumulated above the anode assembly and dischargedto the purification process.
As it is liberated at the surface of the mercury cathode, the sodium immediately forms an
amalgam [Kirk-Othmer, 1991]. The concentration of the amalgam is maintained at 0.2-0.4% Na(by weight) so that the amalgam flows freely, 0.3% is the reference figure in [Gest 93/186,1993]. The liquid amalgam flows from the electrolytic cell to a separate reactor, called thedecomposer or denuder, where it reacts with water in the presence of a graphite catalyst to form
sodium hydroxide and hydrogen gas. The sodium-free mercury is fed back into the electrolyser and reused.
The reaction in the electrolyser is: 2 Na+ + 2Cl- + 2 Hg → 2 Na-Hg + Cl2(g)
The reaction in the decomposer is: 2 Na-Hg + 2 H2 O → 2 Na+ + 2 OH- + H2 (g) + 2 Hg
The brine anolyte leaving the cell is saturated with chlorine and must be dechlorinated before being returned to the dissolvers.
The sodium hydroxide is produced from the denuder at a concentration of about 50%; themaximum value reported is 73% [Ullmann’s, 1996]. However, industry reports state that no plant in Europe is known to be operating above 50%.
The decomposer may be regarded as a short-circuited electrical cell in which the graphitecatalyst is the cathode and sodium amalgam the anode.
For its operation, the mercury cell depends upon the higher overpotential of hydrogen versusmercury to achieve the preferential release of sodium rather than hydrogen. However,
impurities that can appear on the mercury surface may lack this overvoltage protection and can
cause localised release of hydrogen into the chlorine (hydrogen can form an explosive mixture(>4% H2) in chlorine or air). The presence of even trace amounts of certain metals, such asvanadium, can cause the release of dangerous amounts of hydrogen.
Mercury cells are usually operated to maintain a 21-22% (by weight) concentration of salt inthe spent brine discharged from the electrolyser. This corresponds to the decomposition of 15-16% of the salt during a single pass. Further salt decomposition to a lower concentration in the
brine would decrease brine conductivity, with the attendant loss of electrical efficiency.
A portion, or in some cases all, of the depleted brine is subsequently dechlorinated, resaturatedwith solid salt, and returned to the cell brine feed. Some facilities purge small amounts of brine
solution and use new brine as make-up in order to prevent the build-up of impurities, mainlysulphate, in the brine. Figure 2.3 shows a flow diagram of the mercury cell.
8/8/2019 Integrated Pollution Prevention and Control European Environment Comission
http://slidepdf.com/reader/full/integrated-pollution-prevention-and-control-european-environment-comission 29/178
Chapter 2
Chlor-Alkali Manufacturing industry 13
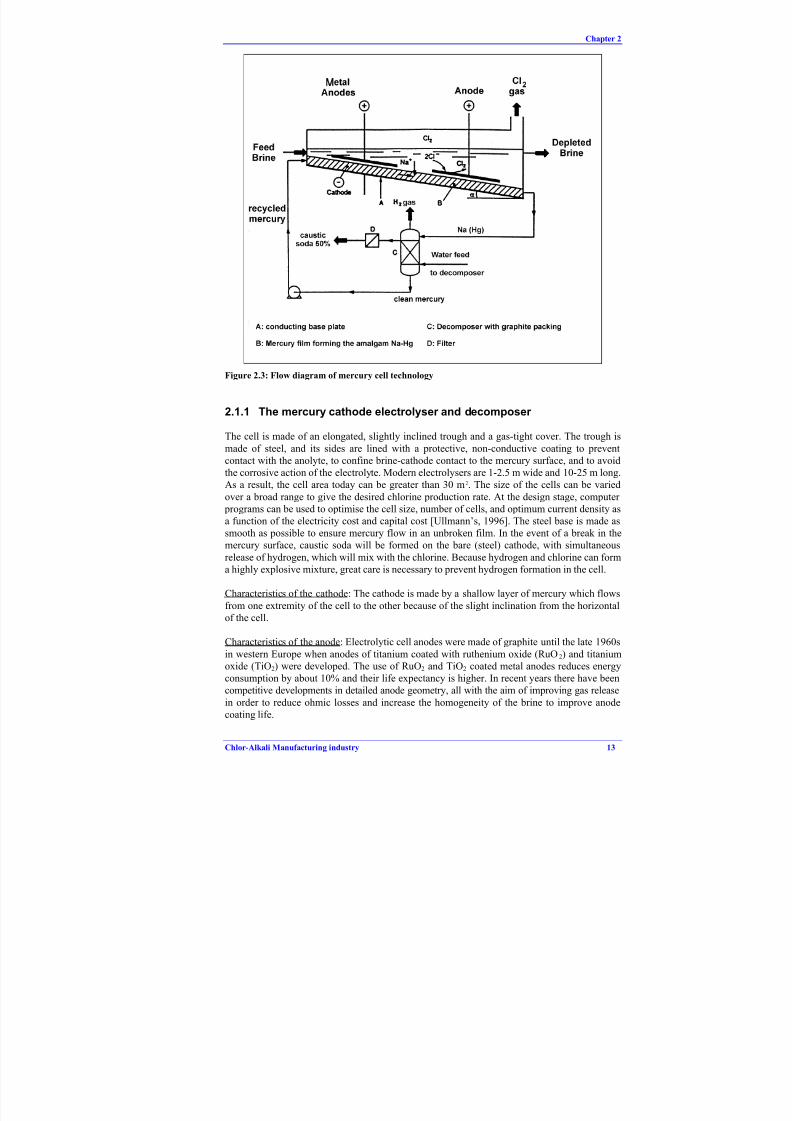
Figure 2.3: Flow diagram of mercury cell technology
2.1.1 The mercury cathode electrolyser and decomposer
The cell is made of an elongated, slightly inclined trough and a gas-tight cover. The trough is
made of steel, and its sides are lined with a protective, non-conductive coating to preventcontact with the anolyte, to confine brine-cathode contact to the mercury surface, and to avoidthe corrosive action of the electrolyte. Modern electrolysers are 1-2.5 m wide and 10-25 m long.As a result, the cell area today can be greater than 30 m2. The size of the cells can be varied
over a broad range to give the desired chlorine production rate. At the design stage, computer programs can be used to optimise the cell size, number of cells, and optimum current density asa function of the electricity cost and capital cost [Ullmann’s, 1996]. The steel base is made assmooth as possible to ensure mercury flow in an unbroken film. In the event of a break in themercury surface, caustic soda will be formed on the bare (steel) cathode, with simultaneous
release of hydrogen, which will mix with the chlorine. Because hydrogen and chlorine can forma highly explosive mixture, great care is necessary to prevent hydrogen formation in the cell.
Characteristics of the cathode: The cathode is made by a shallow layer of mercury which flows
from one extremity of the cell to the other because of the slight inclination from the horizontalof the cell.
Characteristics of the anode: Electrolytic cell anodes were made of graphite until the late 1960s
in western Europe when anodes of titanium coated with ruthenium oxide (RuO2) and titaniumoxide (TiO2) were developed. The use of RuO2 and TiO2 coated metal anodes reduces energyconsumption by about 10% and their life expectancy is higher. In recent years there have been
competitive developments in detailed anode geometry, all with the aim of improving gas releasein order to reduce ohmic losses and increase the homogeneity of the brine to improve anodecoating life.
8/8/2019 Integrated Pollution Prevention and Control European Environment Comission
http://slidepdf.com/reader/full/integrated-pollution-prevention-and-control-european-environment-comission 30/178
Chapter 2
14 Chlor-Alkali Manufacturing industry
An “end box” is attached to each end of the electrolyser. The end box incorporatescompartments for collecting the chlorine gas and weirs for separating the mercury and brinestreams, washing the mercury and permitting the removal of thick mercury “butter” that isformed by impurities. [Kirk-Othmer, 1991]
The whole electrolyser is insulated from the floor to prevent stray ground currents. Usually,
several electrolysers are placed in series by means of electrically connecting the cathode of oneelectrolyser to the anodes of the next electrolyser. Individual cells can be by-passed for maintenance and replacement.
The electrolyser is operated at a temperature of approximately 70-80 ºC. At this temperature,the conductivity of the brine solution and the fluidity of the mercury are higher compared tooperation at ambient temperature. The temperature can be achieved by preheating the saturated
brine with steam and is increased in the electrolyser by the heat of resistance.
The decomposer operates at a temperature of approximately 90-130 ºC, which is caused by thechemical reactions in the decomposer and the input of warm amalgam from the electrolyser.
2.1.2 Decomposition of the amalgam
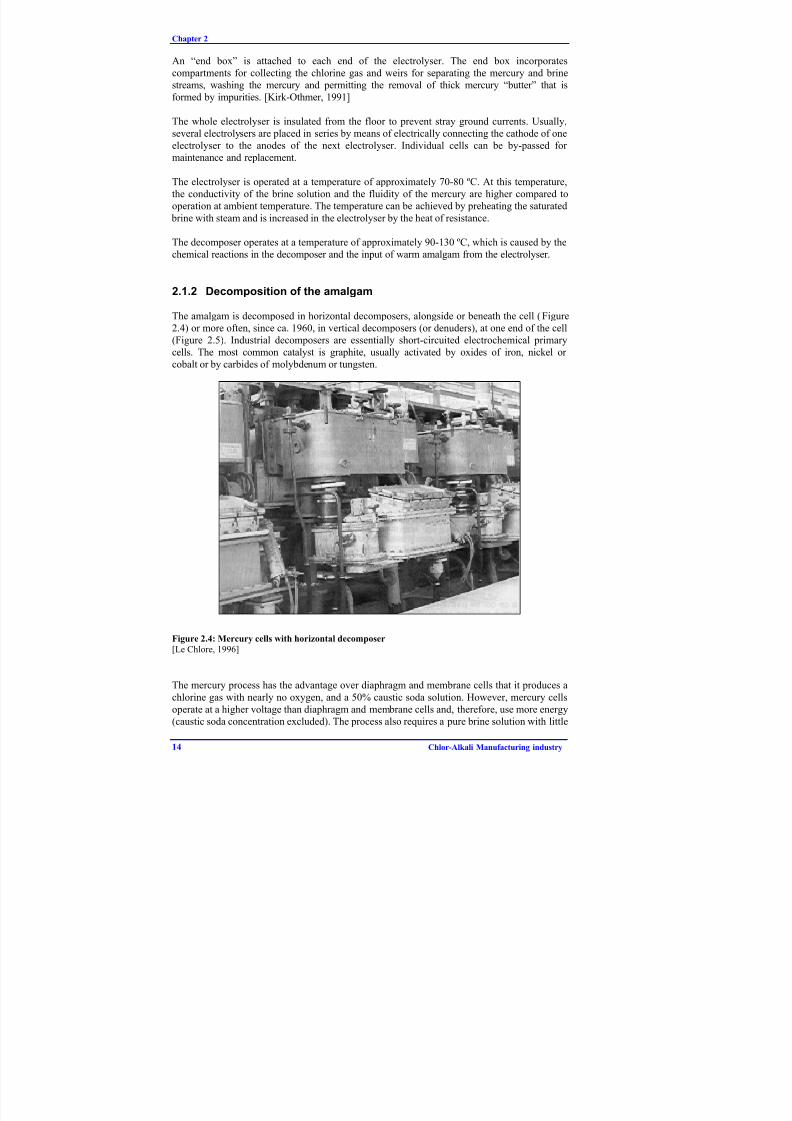
The amalgam is decomposed in horizontal decomposers, alongside or beneath the cell (Figure2.4) or more often, since ca. 1960, in vertical decomposers (or denuders), at one end of the cell(Figure 2.5). Industrial decomposers are essentially short-circuited electrochemical primarycells. The most common catalyst is graphite, usually activated by oxides of iron, nickel or cobalt or by carbides of molybdenum or tungsten.
Figure 2.4: Mercury cells with horizontal decomposer
[Le Chlore, 1996]
The mercury process has the advantage over diaphragm and membrane cells that it produces a
chlorine gas with nearly no oxygen, and a 50% caustic soda solution. However, mercury cellsoperate at a higher voltage than diaphragm and membrane cells and, therefore, use more energy(caustic soda concentration excluded). The process also requires a pure brine solution with little
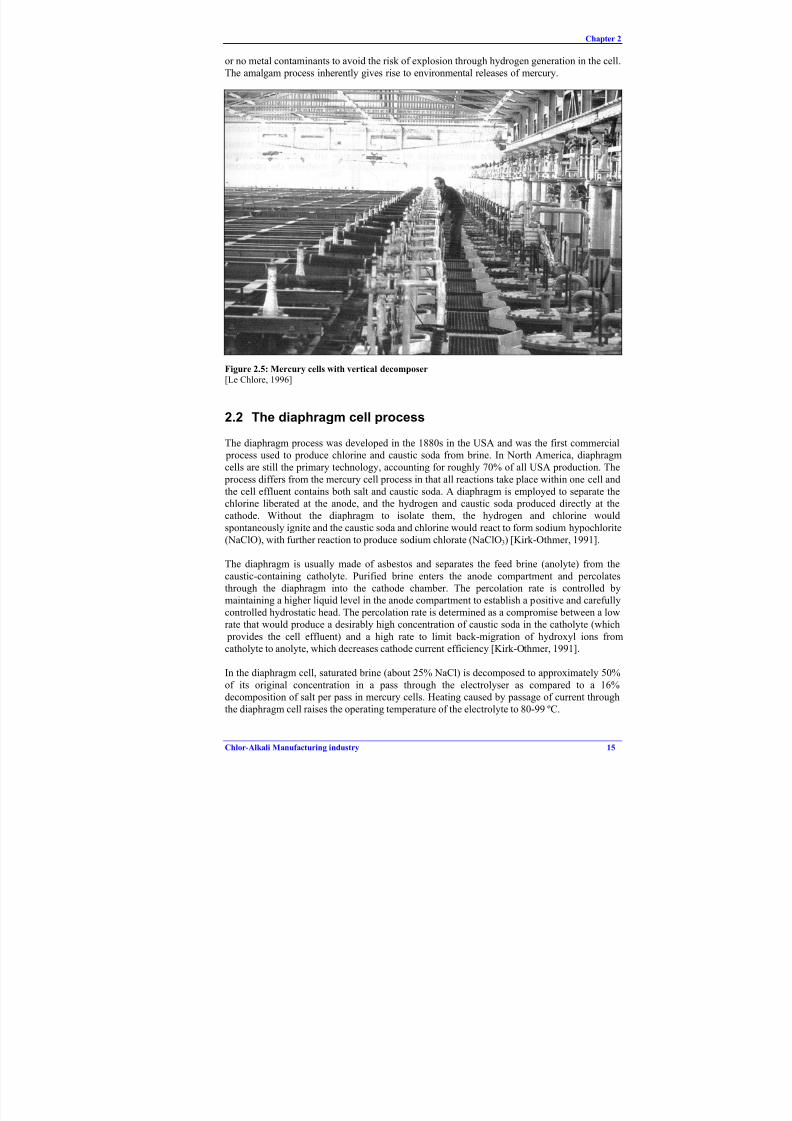
8/8/2019 Integrated Pollution Prevention and Control European Environment Comission
http://slidepdf.com/reader/full/integrated-pollution-prevention-and-control-european-environment-comission 31/178
Chapter 2
Chlor-Alkali Manufacturing industry 15
or no metal contaminants to avoid the risk of explosion through hydrogen generation in the cell.The amalgam process inherently gives rise to environmental releases of mercury.
Figure 2.5: Mercury cells with vertical decomposer
[Le Chlore, 1996]
2.2 The diaphragm cell process
The diaphragm process was developed in the 1880s in the USA and was the first commercial process used to produce chlorine and caustic soda from brine. In North America, diaphragmcells are still the primary technology, accounting for roughly 70% of all USA production. The
process differs from the mercury cell process in that all reactions take place within one cell andthe cell effluent contains both salt and caustic soda. A diaphragm is employed to separate thechlorine liberated at the anode, and the hydrogen and caustic soda produced directly at thecathode. Without the diaphragm to isolate them, the hydrogen and chlorine would
spontaneously ignite and the caustic soda and chlorine would react to form sodium hypochlorite(NaClO), with further reaction to produce sodium chlorate (NaClO3) [Kirk-Othmer, 1991].
The diaphragm is usually made of asbestos and separates the feed brine (anolyte) from the
caustic-containing catholyte. Purified brine enters the anode compartment and percolatesthrough the diaphragm into the cathode chamber. The percolation rate is controlled bymaintaining a higher liquid level in the anode compartment to establish a positive and carefullycontrolled hydrostatic head. The percolation rate is determined as a compromise between a lowrate that would produce a desirably high concentration of caustic soda in the catholyte (which
provides the cell effluent) and a high rate to limit back-migration of hydroxyl ions fromcatholyte to anolyte, which decreases cathode current efficiency [Kirk-Othmer, 1991].
In the diaphragm cell, saturated brine (about 25% NaCl) is decomposed to approximately 50%
of its original concentration in a pass through the electrolyser as compared to a 16%
decomposition of salt per pass in mercury cells. Heating caused by passage of current throughthe diaphragm cell raises the operating temperature of the electrolyte to 80-99 ºC.

8/8/2019 Integrated Pollution Prevention and Control European Environment Comission
http://slidepdf.com/reader/full/integrated-pollution-prevention-and-control-european-environment-comission 32/178
Chapter 2
16 Chlor-Alkali Manufacturing industry
When graphite anodes were used, the diaphragm became inoperable after 90-100 days due to plugging of the diaphragm by particles of graphite. Nowadays, all plants in the European Unionuse metal anodes and the lifetime of the diaphragm is over one year. Their service life has alsoincreased because their compositions have changed. At the beginning the diaphragms weremade of asbestos only and were rapidly clogged by calcium and magnesium ions coming from
the brine. Asbestos was chosen because of its good chemical stability and because it is a
relatively inexpensive and abundant material. Beginning in the early1970s, asbestosdiaphragms began to be replaced by diaphragms containing 75% asbestos and 25% of fibrousfluorocarbon polymer of high chemical resistance. These diaphragms, trade named Modified
Diaphragms, are more stable. The polymer stabilises the asbestos, which in itself lowers cellvoltage and also allows for the use of the expandable anode [Le Chlore, 1995][Ullmann’s,1996]. Chrysotile asbestos (“white asbestos”) is the only form of asbestos used in diaphragmcells.
Figure 2.6: Typical diaphragm electrolysis cell
[USEPA, 1995]
Both diaphragm and membrane cells for the production of chlorine and sodium hydroxide areclassified as either monopolar or bipolar. The designation does not refer to the electrochemicalreactions that take place, which of course require two poles or electrodes for all cells, but to theelectrolyser construction or assembly. There are many more chlor-alkali production facilitieswith monopolar cells than with bipolar cells. The monopolar electrolyser is assembled so that
the anodes and cathodes are arranged in parallel. As a result of this configuration, all cells have
the same voltage of about three to four volts; up to 200 cells can be constructed in one circuit.Bipolar electrolysers have unit assemblies of the anode of one cell unit directly connected tothe cathode of the next cell unit, thus minimising intercell voltage loss. These units are
assembled in series.
All diaphragm cells produce cell liquor that contains ca. 11% caustic soda and 18% sodiumchloride. This solution is evaporated to 50% NaOH by weight at which point all of the salt,
except a residual 1.0-1.5% by weight, precipitates out. The salt generated is very pure and istypically used to make more brine. This high quality sodium chloride is sometimes used as araw material for an amalgam or membrane process. A flow diagram of a possible integrated siteis shown in Figure 2.7 on page 17.
Low concentrations of oxygen in chlorine are formed by electrolytic decomposition of water and hypochlorous acid (from the reaction of chlorine with water).
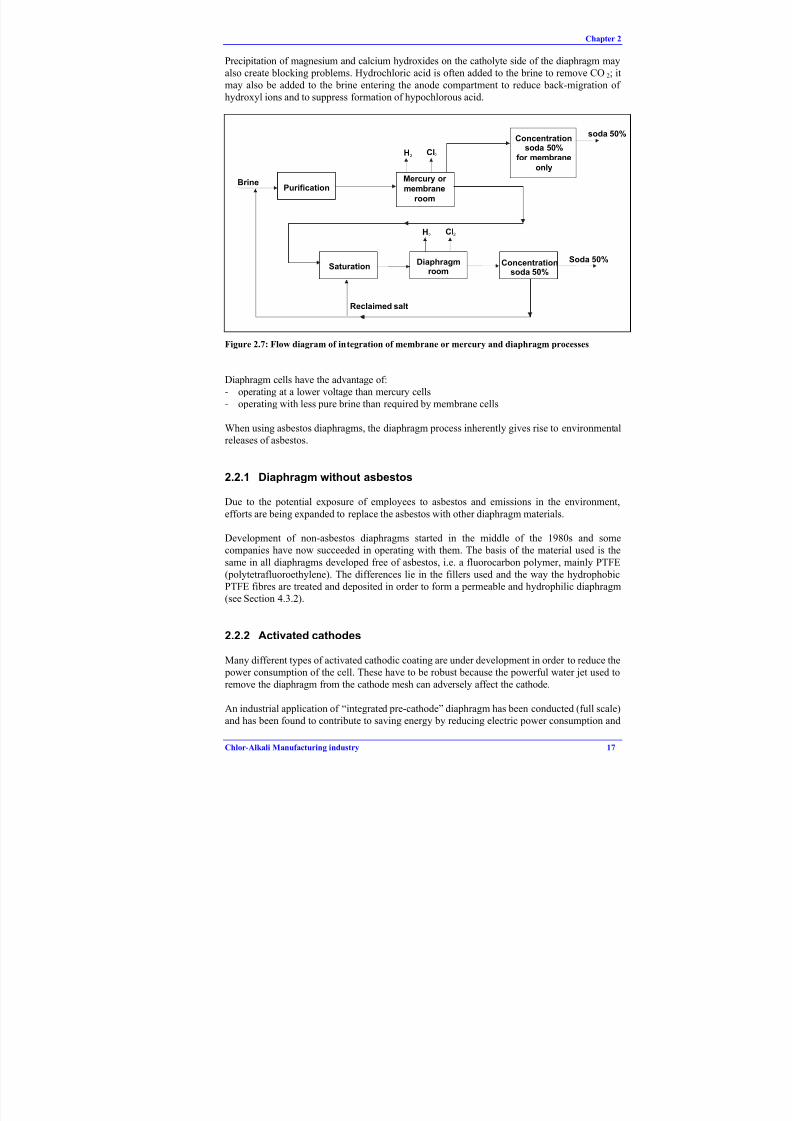
8/8/2019 Integrated Pollution Prevention and Control European Environment Comission
http://slidepdf.com/reader/full/integrated-pollution-prevention-and-control-european-environment-comission 33/178
Chapter 2
Chlor-Alkali Manufacturing industry 17
Precipitation of magnesium and calcium hydroxides on the catholyte side of the diaphragm mayalso create blocking problems. Hydrochloric acid is often added to the brine to remove CO 2; itmay also be added to the brine entering the anode compartment to reduce back-migration of hydroxyl ions and to suppress formation of hypochlorous acid.
H2 Cl2
H2 Cl2
Mercury or
membrane
room
Purification
Concentrationsoda 50%
for membrane
only
soda 50%
Brine
SaturationDiaphragm
roomConcentration
soda 50%
Reclaimed salt
Soda 50%
Figure 2.7: Flow diagram of integration of membrane or mercury and diaphragm processes
Diaphragm cells have the advantage of:- operating at a lower voltage than mercury cells- operating with less pure brine than required by membrane cells
When using asbestos diaphragms, the diaphragm process inherently gives rise to environmentalreleases of asbestos.
2.2.1 Diaphragm without asbestos
Due to the potential exposure of employees to asbestos and emissions in the environment,
efforts are being expanded to replace the asbestos with other diaphragm materials.
Development of non-asbestos diaphragms started in the middle of the 1980s and some
companies have now succeeded in operating with them. The basis of the material used is thesame in all diaphragms developed free of asbestos, i.e. a fluorocarbon polymer, mainly PTFE(polytetrafluoroethylene). The differences lie in the fillers used and the way the hydrophobicPTFE fibres are treated and deposited in order to form a permeable and hydrophilic diaphragm(see Section 4.3.2).
2.2.2 Activated cathodes
Many different types of activated cathodic coating are under development in order to reduce the power consumption of the cell. These have to be robust because the powerful water jet used toremove the diaphragm from the cathode mesh can adversely affect the cathode.
An industrial application of “integrated pre-cathode” diaphragm has been conducted (full scale)and has been found to contribute to saving energy by reducing electric power consumption and

8/8/2019 Integrated Pollution Prevention and Control European Environment Comission
http://slidepdf.com/reader/full/integrated-pollution-prevention-and-control-european-environment-comission 34/178
Chapter 2
18 Chlor-Alkali Manufacturing industry
improving current efficiency. The life time of the diaphragm has also been found to beimproved by introduction of the pre-cathode (see Section 0).
2.3 The membrane cell process
In the 1970s, the development of ion-exchange membranes enabled a new technology to produce chlorine: the membrane electrolysis process. The first ion exchange membranes were
developed at the beginning of the 1970s by Du Pont (Nafion), followed by Asahi Glass(Flemion) which installed the first industrial membrane plant in Japan in 1975 due to the pressure of Japanese environmental regulations. Non-chlor-alkali related mercury pollution inMinamata drove the authorities to prohibit all mercury processes and Japan was the first
country to install the membrane process on a massive scale in the mid-1980s.3
Today, it is the most promising and fast-developing technique for the production of chlor-alkaliand it will undoubtedly replace the other two techniques in time. This can be deduced from the
fact that since 1987 practically 100% of the new chlor-alkali plants world-wide apply themembrane process. The replacement of existing mercury and diaphragm cell capacity withmembrane cells is taking place at a much slower rate because of the long lifetime of the former and because of the high capital costs of replacement.
In this process, the anode and cathode are separated by a water-impermeable ion-conductingmembrane. Brine solution flows through the anode compartment where chloride ions areoxidised to chlorine gas. The sodium ions migrate through the membrane to the cathodecompartment which contains flowing caustic soda solution. The demineralized water added to
the catholyte circuit is hydrolysed, releasing hydrogen gas and hydroxide ions. The sodium andhydroxide ions combine to produce caustic soda which is typically brought to a concentrationof 32-35% by recirculating the solution before it is discharged from the cell. The membrane prevents the migration of chloride ions from the anode compartment to the cathode
compartment; therefore, the caustic soda solution produced does not contain salt as in thediaphragm cell process. Depleted brine is discharged from the anode compartment andresaturated with salt. If needed, to reach a concentration of 50% caustic soda, the caustic liquor produced has to be concentrated by evaporation (using steam).
The cathode material used in membrane cells is either stainless steel or nickel. The cathodes areoften coated with a catalyst that is more stable than the substrate and that increases surface areaand reduces over-voltage. Coating materials include Ni-S, Ni-Al, and Ni-NiO mixtures, as wellas mixtures of nickel and platinum group metals. The anodes used are metal.
The membranes used in the chlor-alkali industry are commonly made of perfluorinated polymers. The membranes may have from one up to three layers, but generally consist of twolayers. One of these layers consists of perfluorinated polymer with substituted carboxylic
groups and is adjacent to the cathodic side. The other layer consists of perfluorinated polymer with substituted sulphonic groups and is adjacent to the anodic side. To give the membranemechanical strength, the membrane is generally reinforced with PTFE fibres. The membranesmust remain stable while being exposed to chlorine on one side and a strong caustic solution onthe other. The general economic lifetime of chlor-alkali membranes is approximately three
years, but ranges between 2-5 years [Euro Chlor report, 1997].
Membrane cells have the advantage of producing a very pure caustic soda solution and of usingless electricity than the other processes. In addition, the membrane process does not use highly
3
There are 2 mercury plants in Japan (Toagosei Co. and Nippon Soda Co.) producing potassium hydroxide (total capacity of both: 45 000 tonnes/year) which are allowed to operate because of the high grade KOH produced which is needed for the
optical glass industry. The reason why membrane technology cannot achieve the same performances, however, is not known
(source: Asahi Glass Co).

8/8/2019 Integrated Pollution Prevention and Control European Environment Comission
http://slidepdf.com/reader/full/integrated-pollution-prevention-and-control-european-environment-comission 35/178
Chapter 2
Chlor-Alkali Manufacturing industry 19
toxic materials such as mercury and asbestos. Disadvantages of the membrane process are thatthe caustic soda produced may need to be evaporated to increase concentration and, for someapplications, the chlorine gas produced needs to be processed to remove oxygen. Furthermore,the brine entering a membrane cell must be of a very high purity, which often requires costlyadditional purification steps prior to electrolysis (see paragraph on brine purification).
Figure 2.8: Diagram of a membrane process
Membranes cells can be configured either as monopolar or bipolar. As in the case of thediaphragm cell process, the bipolar cells have less voltage loss between the cells than themonopolar cells.4 However, the number of cells connected together in the same circuit is
limited.
Figure 2.9: Exploded view of a monopolar membrane electrolyser
[Source: De Nora]
4 It has been estimated that approximately 30 kWh are lost each year per tonne chlorine produced. Energy losses from monopolar
electrolysers are about 150 kWh per tonne chlorine produced compared to bipolar ones.

8/8/2019 Integrated Pollution Prevention and Control European Environment Comission
http://slidepdf.com/reader/full/integrated-pollution-prevention-and-control-european-environment-comission 36/178
Chapter 2
20 Chlor-Alkali Manufacturing industry
Figure 2.10: View of a membrane cell room equipped with bipolar electrolysers
(Source: Hoechst-Uhde)
2.4 Auxiliary processes
Apart from the cells, which remain the heart of the chlorine production line, there are other processing steps or equipment, common to amalgam, diaphragm and membrane technologies.These are:- salt unloading and storage
- brine purification and resaturation- chlorine processing- caustic processing
- hydrogen processing.
2.4.1 Salt unloading and storage
The brine used in the mercury cell and membrane processes is normally saturated with solid
salt, although some installations use solution-mined brine on a once-through basis (i.e. no brinerecirculation).
Brine is generally produced by the dissolving of fresh salt in water or depleted brine from
mercury and membrane processes. The basic raw material is usually solid salt: rock salt, solar salt, or vacuum-evaporated salt from purifying and evaporating solution-mined brine.
Generally the salt is stored in a sealed area equipped with a roof. Because of its high purity the
vacuum salt in particular needs to be protected.
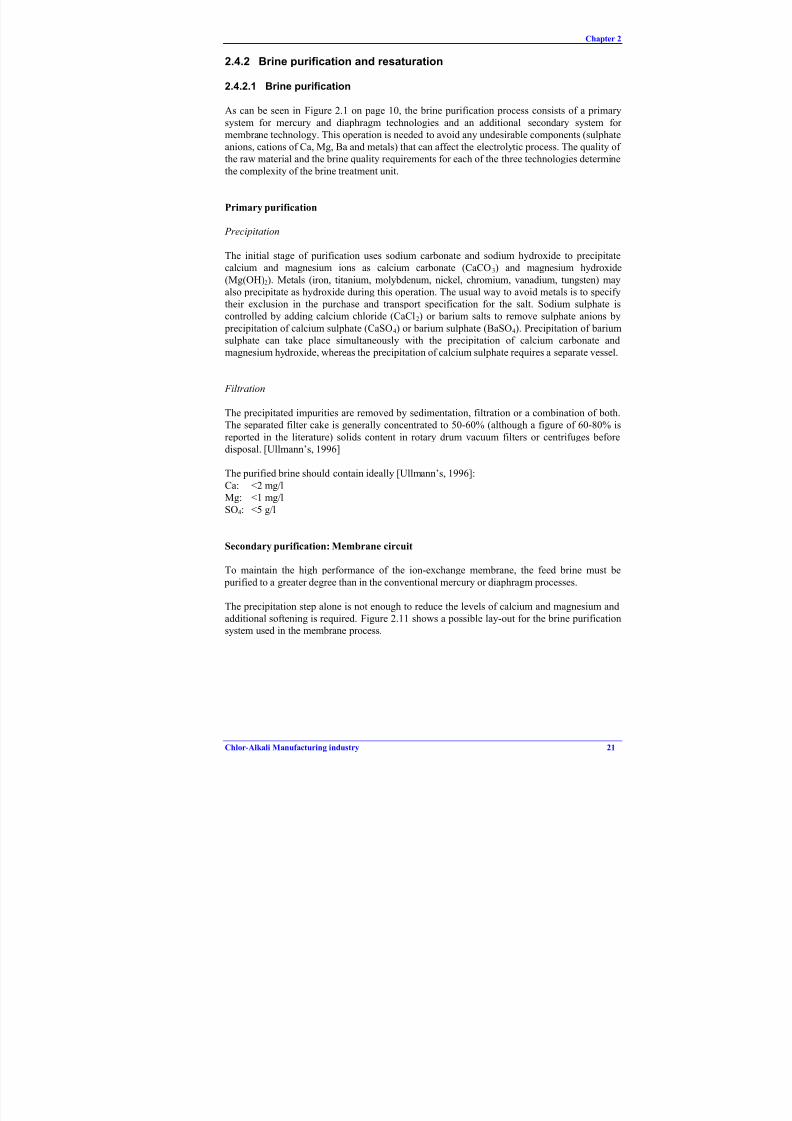
8/8/2019 Integrated Pollution Prevention and Control European Environment Comission
http://slidepdf.com/reader/full/integrated-pollution-prevention-and-control-european-environment-comission 37/178
Chapter 2
Chlor-Alkali Manufacturing industry 21
2.4.2 Brine purification and resaturation
2.4.2.1 Brine purification
As can be seen in Figure 2.1 on page 10, the brine purification process consists of a primary
system for mercury and diaphragm technologies and an additional secondary system for
membrane technology. This operation is needed to avoid any undesirable components (sulphateanions, cations of Ca, Mg, Ba and metals) that can affect the electrolytic process. The quality of the raw material and the brine quality requirements for each of the three technologies determine
the complexity of the brine treatment unit.
Primary purification
Precipitation
The initial stage of purification uses sodium carbonate and sodium hydroxide to precipitatecalcium and magnesium ions as calcium carbonate (CaCO3) and magnesium hydroxide
(Mg(OH)2). Metals (iron, titanium, molybdenum, nickel, chromium, vanadium, tungsten) mayalso precipitate as hydroxide during this operation. The usual way to avoid metals is to specifytheir exclusion in the purchase and transport specification for the salt. Sodium sulphate iscontrolled by adding calcium chloride (CaCl2) or barium salts to remove sulphate anions by
precipitation of calcium sulphate (CaSO4) or barium sulphate (BaSO4). Precipitation of bariumsulphate can take place simultaneously with the precipitation of calcium carbonate andmagnesium hydroxide, whereas the precipitation of calcium sulphate requires a separate vessel.
Filtration
The precipitated impurities are removed by sedimentation, filtration or a combination of both.The separated filter cake is generally concentrated to 50-60% (although a figure of 60-80% is
reported in the literature) solids content in rotary drum vacuum filters or centrifuges beforedisposal. [Ullmann’s, 1996]
The purified brine should contain ideally [Ullmann’s, 1996]:
Ca: <2 mg/lMg: <1 mg/lSO4: <5 g/l
Secondary purification: Membrane circuit
To maintain the high performance of the ion-exchange membrane, the feed brine must be
purified to a greater degree than in the conventional mercury or diaphragm processes.
The precipitation step alone is not enough to reduce the levels of calcium and magnesium andadditional softening is required. Figure 2.11 shows a possible lay-out for the brine purificationsystem used in the membrane process.

8/8/2019 Integrated Pollution Prevention and Control European Environment Comission
http://slidepdf.com/reader/full/integrated-pollution-prevention-and-control-european-environment-comission 38/178

8/8/2019 Integrated Pollution Prevention and Control European Environment Comission
http://slidepdf.com/reader/full/integrated-pollution-prevention-and-control-european-environment-comission 39/178
Chapter 2
Chlor-Alkali Manufacturing industry 23
General Table
Impurities Unit Upper Limit Condition Influence Remarks
Ca + Mg ppb 20 Ca: CE, Mg: V
Sr ppm 0.04 (SiO2=10ppm) CE Sr and SiO2 seem to be co-precipitated within the
membrane. (synergistic effect)
0.04 ppm in Sr content in purified brine is easily kept
under normal operation of Chelating Resin Tower.
If SiO2 content is kept less than 1 ppm, then Sr isallowable up to 0.1 ppm.
SiO2 ppm 10 CE
Ba ppm 0.5
0.05
(Iodine=0.2)
(Iodine=0.5)
CE, (V) Ba and Iodine seem to be co-precipitated within the
membrane. (synergetic effect)
When SO4 content is kept 6 g/l, Ba content should be
0.05ppm or less.
Iodine ppm 0.5
0.2
(Ba=0.05)
(Ba=0.5)
CE Iodine originates from underground salt and water. If
solar salt and ordinary surface water are used,
Iodine content should be 0.1 ppm or less.
Fe ppm 1 V
Ni ppm 0.01 V
Heavy
Metals
ppm 0.1
Al ppm 0.1 CE, (V)
SO4 g/l 6 CE We are evaluating to raise the upper limit to 8 g/l.
ClO3 g/l 20 CE
Additional Table for Plants to be operated with care
Impurities Unit Upper Limit Condition Influence Remarks
Mn ppm 0.1 The limit is 0.05 ppm in some plants due to caustic
user needs.
Cr ppm 1 Mainly due to caustic user needs
Cu ppm 0.01 Mainly due to caustic user needs
Hg ppm 10 Mainly due to caustic user needs and risk of cathode
damage
F ppm 0.5
SS ppm 1 Suspended Solid
TOC ppm 1 Total Organic Carbon
CE: Current Efficiency should decrease
V: Cell voltage should increase
Table 2.2: Example of brine specifications for the membrane process operating at a current density
up to 4 kA/m2
(Source: Asahi Glass Co)
Control of nitrogen trichloride (NCl3)
Apart from sulphates and hardness ions, the brine may contain ammonium ions or organicnitrogen which are converted to nitrogen trichloride in the electrolytic cell. If concentrated inliquid form in downstream processes, NCl3 may explode with disastrous results.
Nitrogen compounds in the brine is the main source of NCl3. Rock salt, in particular solution-mined salt using surface waters, will contain varying levels of ammonium and nitrate salts,whereas the use of vacuum salt in the brine recycle circuit will give very low levels of NCl3,except where ferrocyanides are added to avoid caking. Also, the water quality may vary, in
particular if surface water is used. The total concentration of nitrogen compounds in the brineshould be checked regularly. Chlorination at a pH higher than 8.5 or hypochlorite treatment of the brine is however, capable of destroying a large proportion of the ammonium salt impurity.
[Gest 76/55, 1990]
Methods to remove NCl3 from chlorine after it is formed are described in Section 4.1.6.

8/8/2019 Integrated Pollution Prevention and Control European Environment Comission
http://slidepdf.com/reader/full/integrated-pollution-prevention-and-control-european-environment-comission 40/178
Chapter 2
24 Chlor-Alkali Manufacturing industry
Figure 2.12: View of chelate resin towers in a secondary brine purification system
(photograph supplied by Asahi Glass Co)
Figure 2.13: View of polishing filters in a secondary brine purification system
(photograph supplied by Asahi Glass Co)

8/8/2019 Integrated Pollution Prevention and Control European Environment Comission
http://slidepdf.com/reader/full/integrated-pollution-prevention-and-control-european-environment-comission 41/178
Chapter 2
Chlor-Alkali Manufacturing industry 25
2.4.2.2 Brine resaturation and dechlorination
Mercury and membrane systems usually operate with brine recirculation and resaturation.There are, however, 3 waste brine mercury plants and 1 waste brine membrane plant operatingin western Europe.
Some diaphragm cell lines have a once-through brine circuit, whilst others employ brinesaturation using the salt recovered from the caustic evaporators.
In recirculation circuits, the depleted brine leaving the electrolysers is first dechlorinated:
• Partially for the mercury process (leaving active chlorine in the brine keeps the mercury inionic form and reduces the presence of metallic mercury in the purification sludge)
• Totally for the membrane process (necessary here because the active chlorine can damagethe ion exchange resins of the secondary brine purification unit).
For this purpose, the brine is sent to an air blown packed column or is sprayed into a vacuumsystem to extract the major part of the dissolved chlorine.
No such dechlorination treatment is required for the diaphragm system since any chlorine passing through the diaphragm reacts with caustic soda in the catholyte compartment to formhypochlorite or chlorate.
For the membrane process, there is a preliminary stage of hydrochloric acid addition (to reach
pH 2-2.5) in order to achieve better chlorine extraction. A further stage is also necessary toeliminate the chlorine completely; this is done by passing the brine through an activated carbon bed or by injection of a reducing agent (e.g. sulphite).
If the saturation is made with impure salt (followed by a primary purification step on the total brine flow), the pH of the brine is then brought to an alkaline value with caustic soda, to reduce
the solubilisation of impurities from the salt. If the saturation is made with pure salt (withsubsequent primary purification on a small part of the flow), there is no alkalisation step at that
level (only in the purification phase).
Depleted brine from the mercury and membrane cells, with a concentration of 210-250 g/l,depending on the technology, current density and heat balance of the cell, is resaturated bycontact with solid salt to achieve a saturated brine concentration of 310-315 g/l.
In the case of diaphragm cells, the catholyte liquor (10-12% NaOH, 15% NaCl) goes directly tothe caustic evaporators where solid salt and 50% caustic are recovered together. Fresh brine can be saturated with recycled solid salt from the caustic evaporators before entering the diaphragm
electrolysers.
Resaturators can be either open or closed vessels.
The pH of the brine sent to the electrolysers may be adjusted to an acidic value (pH 4) withhydrochloric acid in order to protect the anode coating, to keep the formation of chlorate at alow level and to decrease the oxygen content in the chlorine gas. Hydrochloric acid can also beadded in the anodic compartments of membrane cells to further reduce the content of oxygen inthe chlorine, especially for electrolysers with older membranes (poorer performances) The
(bi)carbonates introduced with the salt are decomposed by these acid additions, producinggaseous carbon dioxide.

8/8/2019 Integrated Pollution Prevention and Control European Environment Comission
http://slidepdf.com/reader/full/integrated-pollution-prevention-and-control-european-environment-comission 42/178
Chapter 2
26 Chlor-Alkali Manufacturing industry
2.4.3 Chlorine production, storage and handling
Generally, before the chlorine can be used, it goes through a series of processes for cooling,cleaning, drying, compression and liquefaction. In some applications, it can be used as a dry gas
without need for liquefaction. Very occasionally it can be used directly from the electrolysers.A general flow of chlorine from the electrolysers to storage is presented in Figure 2.14.
MERCURY DIAPHRAGM MEMBRANE
COOLING
DEMISTER
DRYING
(Sulphuric acid)
DEMISTER
COMPRESSION
LIQUEFACTION
USERS
STORAGE
Figure 2.14: The flow of chlorine from the electrolysers to storage
[Euro Chlor report, 1997]
The chlorine process usually takes hot, wet cell gas and converts it to a cold, dry gas. Chlorinegas leaving the electrolysers is at approximately 80-90 ºC and saturated with water vapour. It
also contains brine mist, impurities such as N2, H2, O2, CO2 and traces of chlorinatedhydrocarbons. Electrolysers are operated at essentially atmospheric pressure with only a fewmilli-atmospheres differential pressure between the anolyte and the catholyte.
Cooling
In the primary cooling process, the total volume of gas to be handled is reduced and a largeamount of moisture is condensed. Cooling is accomplished in either one stage with chilled
water or in two stages with chilled water only in the second stage. Care is taken to avoidexcessive cooling because, at around 10 ºC, chlorine can combine with water to form a solidmaterial known as chlorine hydrate. Maintaining temperatures above 10 ºC prevents blockagesin process equipment.

8/8/2019 Integrated Pollution Prevention and Control European Environment Comission
http://slidepdf.com/reader/full/integrated-pollution-prevention-and-control-european-environment-comission 43/178
Chapter 2
Chlor-Alkali Manufacturing industry 27
Two methods are most frequently used to cool chlorine gas:1) Indirect cooling through a titanium surface (usually in a single-pass vertical shell-and-tube
exchanger). The resultant condensate is either fed back into the brine system of the mercury process or dechlorinated by evaporation in the case of the diaphragm process. This methodcauses less chlorine to be condensed or absorbed and generates less chlorine-saturated water
for disposal. [Brien-White, 1995]
2) Direct contact with water. The chlorine gas is cooled by passing it directly into the bottomof a tower in which the packing is divided into two Sections, for 2-stage cooling. Water issprayed into the top and flows counter-current to the chlorine. The cooling water should be
free of traces of ammonium salts to avoid the formation of nitrogen trichloride. This methodhas the advantage of better mass-transfer characteristics and higher thermal efficiency.
Closed circuit direct cooling of chlorine combines the advantages of the two methods. The
chlorine-laden water from the cooling tower is cooled in titanium plate coolers and recycled.The surplus condensate is treated exactly like the condensate from indirect cooling.
Following primary cooling, chlorine gas is demisted of water droplets and brine impurities.
Impurities are removed mechanically by using special filters, or by means of an electrostatic
precipitator. Chlorine is then passed to the drying towers.
Drying
Chlorine from the cooling system is more or less saturated with water vapour. The water content is typically 1-3%. This must be reduced in order to avoid downstream corrosion andminimise the formation of hydrates [Brien-White, 1995].
Drying of chlorine is carried out almost exclusively with concentrated sulphuric acid[Ullmann’s, 1996]. Drying is accomplished in counter-current sulphuric acid contact towers
which reduce the moisture content to less than 20 ppm [Stenhammar]. Dry chlorine leaving thetop of the drying tower passes through high efficiency demisters to prevent the entrainment of sulphuric acid droplets. The spent acid usually becomes a waste product or requiresreprocessing if it is reused. For example, it has to be dechlorinated by air blowing and may bereconcentrated before being sold or used for effluent treatment.
Compression
After drying, chlorine gas might be scrubbed with liquid chlorine or treated with ultra-violet
irradiation to reduce levels of nitrogen trichloride and then it may be compressed in a variety of compressors:
- sulphuric acid liquid ring compressors at low pressures (~4 bar)- mono- or multi-stage centrifugal compressors (5 bar or higher)
- reciprocating compressors (>11 bar)- screw compressors (various pressures)
Because of heat build-up from compression, multistage units with coolers between stages are
usually necessary. Compressor seals are generally fitted with a pressurised purge to inhibitleakage of chlorine to the atmosphere [UK Guidance note, 1993].
To avoid noise, which is quite important even for low pressures, chlorine compressors should be sound insulated.

8/8/2019 Integrated Pollution Prevention and Control European Environment Comission
http://slidepdf.com/reader/full/integrated-pollution-prevention-and-control-european-environment-comission 44/178
Chapter 2
28 Chlor-Alkali Manufacturing industry
Liquefaction
Liquefaction can be accomplished at different pressure and temperature levels, at ambienttemperature and high pressure (for example 18 ºC and 7-12 bar), at low temperature and low
pressure (for example -35 ºC and 1 bar) or any other intermediate combination of temperature
and pressure.
The chosen liquefaction pressure and temperature influence the choice of cooling media and the
safety precautions necessary to operate safely. However, the efficiency of liquefaction islimited because hydrogen is concentrated in the residual gas and its concentration needs to bekept below the explosive limits.
The choice of the cooling medium in a certain stage of the liquefaction depends on thetemperature of the chlorine. When the temperature is sufficiently high, water can be used as anindirect cooling medium. When the temperature is relatively low, other cooling media such asHCFCs or HFCs (indirect cooling), ammonia (indirect cooling) or liquid chlorine (direct
cooling) are used.
The temperature of the chlorine gas in a certain stage depends mainly on the initial temperatureand on the pressure increase during compression. A large pressure increase generally enableswater cooling, but implies an increased hazard risk. Chlorine temperature has to be kept well
below the point where it reacts spontaneously and uncontrollably with iron (approx. 120 oC).
Construction materials must be chosen to suit the conditions under which chlorine is beinghandled:
- Wet or dry- Gas or liquid- Temperature
- Pressure
In terms of safety, it is very important to avoid, during compression and liquefaction, any possibility of mixing chlorine with oils or greases which are reactive as regards chlorine.
Table 2.3 shows the possible trade-off between different types of chlorine gas liquefaction,
cooling methods applied and safety aspects.
Liquefaction system Cooling medium Safety aspect Storage
High pressure (7-16 bar)
and high temperatures
Water High precautionsLowest energy costs but high
material costsMedium pressure (2-6 bar)
and medium temperatures
(between -10 and -20 ºC)
Water-HCFC/
HFC or ammoniaModerate precautions
Moderate energy and
material costs
Normal pressure (~1 bar)
and low temperatures
(below -40 ºC)
Mainly
HCFC/HFC or
ammonia
Precautions 1
Cryogenic storage of liquid
chlorine is possible. High
energy and lower material
costs
1. Attention must be paid to the increased solubility of other gases at low temperatures, especially carbon dioxide
Table 2.3: Possible trade-off in chlorine gas liquefaction
based on [Ullmann’s, 1996], [Dutch report, 1998]
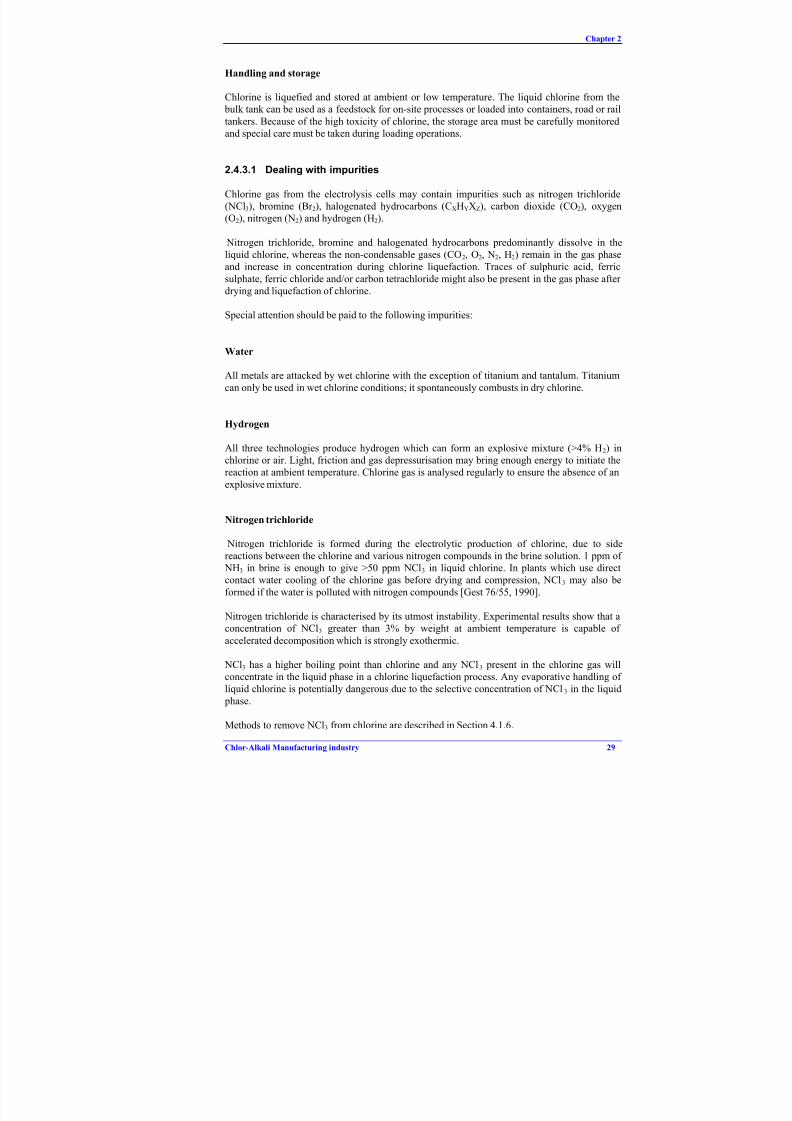
8/8/2019 Integrated Pollution Prevention and Control European Environment Comission
http://slidepdf.com/reader/full/integrated-pollution-prevention-and-control-european-environment-comission 45/178
Chapter 2
Chlor-Alkali Manufacturing industry 29
Handling and storage
Chlorine is liquefied and stored at ambient or low temperature. The liquid chlorine from the bulk tank can be used as a feedstock for on-site processes or loaded into containers, road or rail
tankers. Because of the high toxicity of chlorine, the storage area must be carefully monitored
and special care must be taken during loading operations.
2.4.3.1 Dealing with impurities
Chlorine gas from the electrolysis cells may contain impurities such as nitrogen trichloride(NCl3), bromine (Br 2), halogenated hydrocarbons (CXHYXZ), carbon dioxide (CO2), oxygen(O2), nitrogen (N2) and hydrogen (H2).
Nitrogen trichloride, bromine and halogenated hydrocarbons predominantly dissolve in theliquid chlorine, whereas the non-condensable gases (CO2, O2, N2, H2) remain in the gas phaseand increase in concentration during chlorine liquefaction. Traces of sulphuric acid, ferric
sulphate, ferric chloride and/or carbon tetrachloride might also be present in the gas phase after drying and liquefaction of chlorine.
Special attention should be paid to the following impurities:
Water
All metals are attacked by wet chlorine with the exception of titanium and tantalum. Titanium
can only be used in wet chlorine conditions; it spontaneously combusts in dry chlorine.
Hydrogen
All three technologies produce hydrogen which can form an explosive mixture (>4% H2) inchlorine or air. Light, friction and gas depressurisation may bring enough energy to initiate thereaction at ambient temperature. Chlorine gas is analysed regularly to ensure the absence of an
explosive mixture.
Nitrogen trichloride
Nitrogen trichloride is formed during the electrolytic production of chlorine, due to side
reactions between the chlorine and various nitrogen compounds in the brine solution. 1 ppm of NH3 in brine is enough to give >50 ppm NCl3 in liquid chlorine. In plants which use directcontact water cooling of the chlorine gas before drying and compression, NCl3 may also be
formed if the water is polluted with nitrogen compounds [Gest 76/55, 1990].
Nitrogen trichloride is characterised by its utmost instability. Experimental results show that aconcentration of NCl3 greater than 3% by weight at ambient temperature is capable of
accelerated decomposition which is strongly exothermic.
NCl3 has a higher boiling point than chlorine and any NCl3 present in the chlorine gas willconcentrate in the liquid phase in a chlorine liquefaction process. Any evaporative handling of
liquid chlorine is potentially dangerous due to the selective concentration of NCl3 in the liquid phase.
Methods to remove NCl3 from chlorine are described in Section 4.1.6.
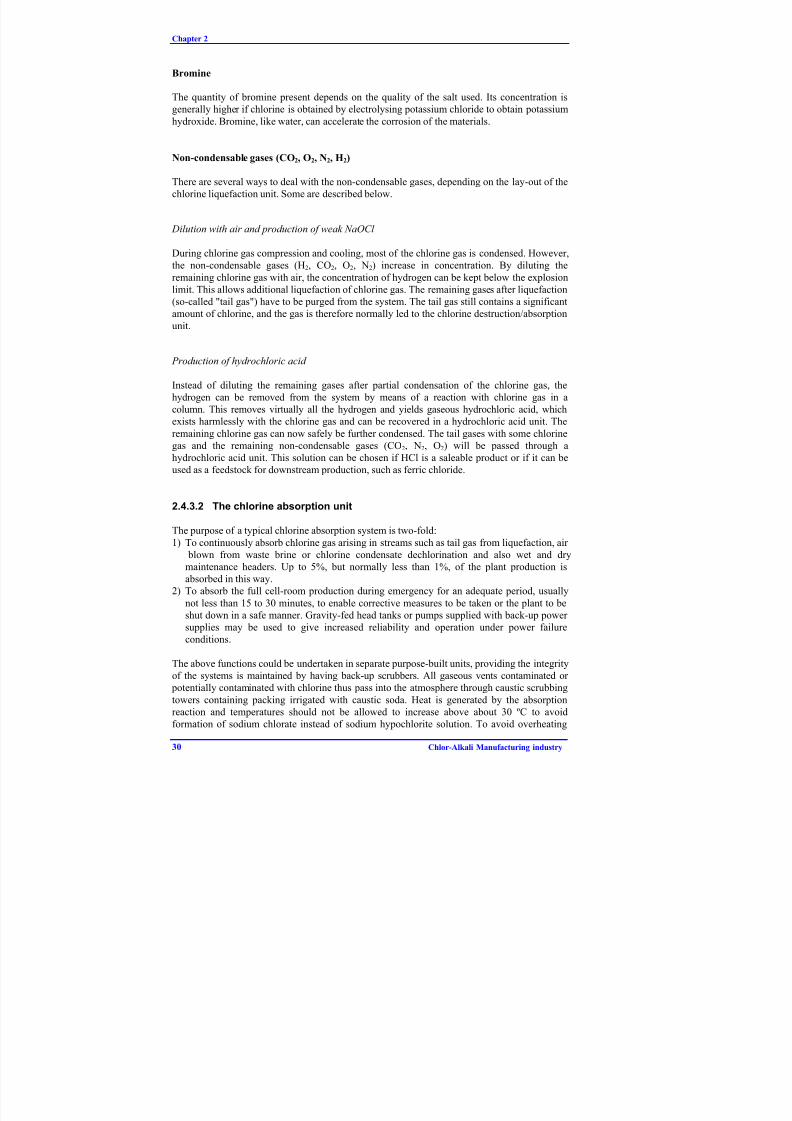
8/8/2019 Integrated Pollution Prevention and Control European Environment Comission
http://slidepdf.com/reader/full/integrated-pollution-prevention-and-control-european-environment-comission 46/178
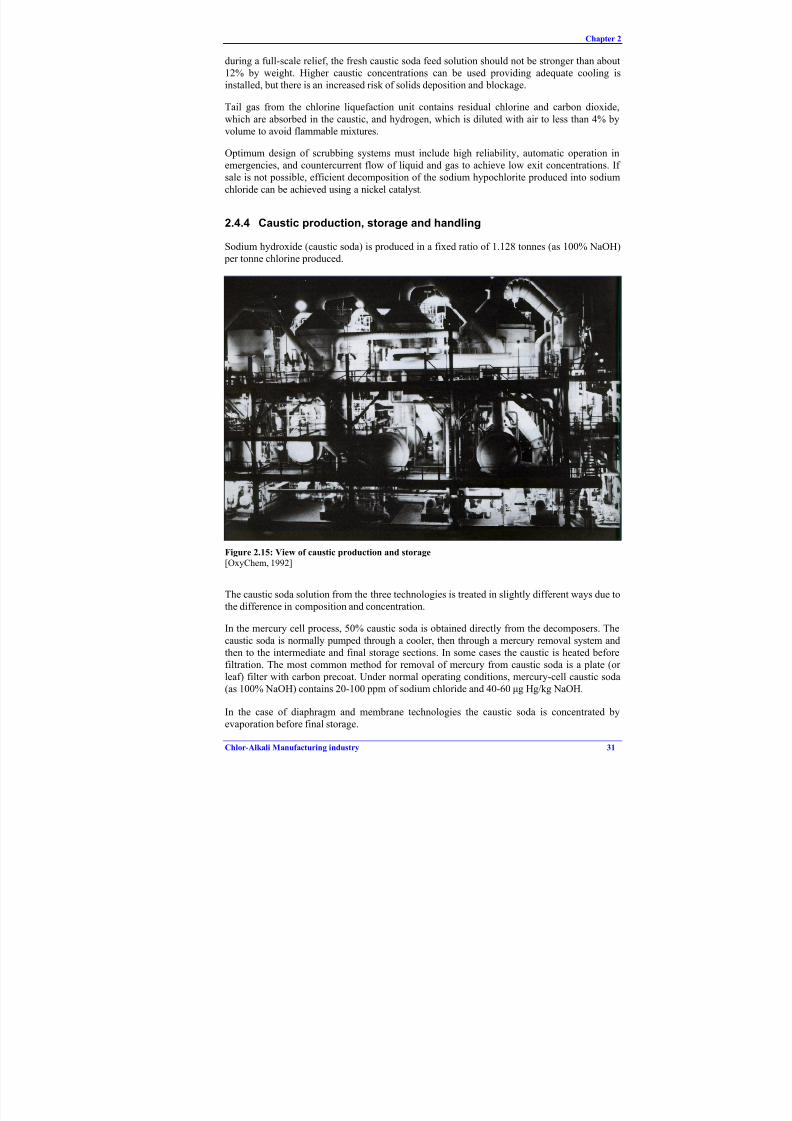
8/8/2019 Integrated Pollution Prevention and Control European Environment Comission
http://slidepdf.com/reader/full/integrated-pollution-prevention-and-control-european-environment-comission 47/178
Chapter 2
Chlor-Alkali Manufacturing industry 31
during a full-scale relief, the fresh caustic soda feed solution should not be stronger than about12% by weight. Higher caustic concentrations can be used providing adequate cooling isinstalled, but there is an increased risk of solids deposition and blockage.
Tail gas from the chlorine liquefaction unit contains residual chlorine and carbon dioxide,
which are absorbed in the caustic, and hydrogen, which is diluted with air to less than 4% byvolume to avoid flammable mixtures.
Optimum design of scrubbing systems must include high reliability, automatic operation inemergencies, and countercurrent flow of liquid and gas to achieve low exit concentrations. If sale is not possible, efficient decomposition of the sodium hypochlorite produced into sodium
chloride can be achieved using a nickel catalyst.
2.4.4 Caustic production, storage and handling
Sodium hydroxide (caustic soda) is produced in a fixed ratio of 1.128 tonnes (as 100% NaOH) per tonne chlorine produced.
Figure 2.15: View of caustic production and storage[OxyChem, 1992]
The caustic soda solution from the three technologies is treated in slightly different ways due tothe difference in composition and concentration.
In the mercury cell process, 50% caustic soda is obtained directly from the decomposers. The
caustic soda is normally pumped through a cooler, then through a mercury removal system andthen to the intermediate and final storage sections. In some cases the caustic is heated beforefiltration. The most common method for removal of mercury from caustic soda is a plate (or leaf) filter with carbon precoat. Under normal operating conditions, mercury-cell caustic soda
(as 100% NaOH) contains 20-100 ppm of sodium chloride and 40-60 µg Hg/kg NaOH.
In the case of diaphragm and membrane technologies the caustic soda is concentrated byevaporation before final storage.

8/8/2019 Integrated Pollution Prevention and Control European Environment Comission
http://slidepdf.com/reader/full/integrated-pollution-prevention-and-control-european-environment-comission 48/178
Chapter 2
32 Chlor-Alkali Manufacturing industry
Figure 2.16: The flow to storage of caustic soda from the different technologies
Based on [OxyChem, 1992]
Steam is used as the source of evaporative energy. The presence of salt in the diaphragm cellliquor requires that the evaporator is equipped with scraper blades or other devices to draw off
the precipitated salt. This high quality sodium chloride can then be used to enrich depleted brine, sometimes it is used as a raw material for an amalgam or membrane process. The residuallevel of sodium chloride in sodium hydroxide from diaphragm cell is about 1% and sodiumchlorate 0.1%. For this reason, it is unsuitable for certain end applications such as the
manufacture of rayon.
Salt and sodium chlorate in the caustic soda from diaphragm cells can be reduced by ammoniaextraction to increase marketability, but at increased cost.
The caustic soda from membrane cells is of high quality, although the caustic soda produced(usually around 33% NaOH) needs concentration to 50% NaOH for some applications. The saltcontent of the membrane-cell caustic soda lies between 20-100 ppm (in 100% NaOH), but is onaverage slightly higher than mercury cell caustic (see Table 2.1).
In some plants the caustic soda is further concentrated to a 73% solution and to 100% as solidcaustic prills or flakes.
Some chlor-alkali production facilities can combine the caustic production process frommercury and membrane cells in order to minimise energy costs. It is possible to feed 33%caustic from the membrane cells to the decomposer to produce 50% caustic without the needfor evaporation.
8/8/2019 Integrated Pollution Prevention and Control European Environment Comission
http://slidepdf.com/reader/full/integrated-pollution-prevention-and-control-european-environment-comission 49/178
Chapter 2
Chlor-Alkali Manufacturing industry 33
Storage and handling
Because of its highly reactive and corrosive properties, caustic soda may corrode containers andhandling equipment. Construction materials must be suited to the caustic soda handled and
stored.
Sodium hydroxide solutions require steam or electrical heating where temperatures can fall below the upper freezing point. Frozen pipelines present both safety and environmental risks
when attempts are made to unblock them. Safety measures are set out in Chapter 4.
Storage tanks may be lined in order to minimise iron contamination of the product or to avoidstress corrosion cracking the tank. Tanks are usually included in procedures to prevent overflow
or spillage of caustic soda. Such procedures include containment and mitigation.
It should be noted that dissolved hydrogen gas can be released into the vapour space above theliquid in storage tanks. Tanks are normally vented from the highest point. Testing for an
explosive mixture of hydrogen in air normally precedes any maintenance activity in the area.
2.4.5 Hydrogen production, storage and handling
Hydrogen is produced in a fixed ratio of 28 kg per tonne chlorine produced. Hydrogen leavingthe cells is highly concentrated (>99.9% by volume) and normally cooled to remove water vapour, sodium hydroxide and salt. The solution of condensed salt water and sodium hydroxideis either recycled as brine make-up or treated with other waste water streams. In the mercury
cell process, hydrogen has to be treated to remove mercury. Primary cooling at ambienttemperature is carried out at the electrolyser, allowing mercury vapour to condense into themain mercury circuit. Further cooling takes place at a later stage using large heat exchangers
and condensate is sent for mercury recovery.
Hydrogen may be distributed to users using booster fans or fed to the main compression plant.The main hydrogen compression plant usually comprises a number of compressors and a gasholder (surge chamber). The hydrogen gas holder is incorporated into the system to minimise
fluctuations in the gas pressure from the primary stage. The hydrogen product gas stream isalways kept pressurised to avoid ingress of air. All electrical equipment taken into the hydrogencompression plant area must be "intrinsically safe", i.e. the equipment will not produce a spark.A relief valve is normally provided within the system to relieve high pressure to atmosphere.
Hydrogen is normally analysed for oxygen content; the compression will shut downautomatically in critical situations [Euro Chlor report, 1997].
The hydrogen is in general used for on-site energy production. It is burnt as a fuel, either by the
company operating the chlorine plant or by another company to whom it has been sold as a fuel.Some or all of it can also be used on site in the case of integrated sites or sold to other companies as chemical feedstock (production of hydroxylamines, hydrochloric acid, hydrogen peroxide, sodium sulphite, for example).
8/8/2019 Integrated Pollution Prevention and Control European Environment Comission
http://slidepdf.com/reader/full/integrated-pollution-prevention-and-control-european-environment-comission 50/178
Chapter 3
34 Chlor-Alkali Manufacturing industry
3 PRESENT CONSUMPTION AND EMISSION LEVELS
In this chapter, the quantitative consumption and emission levels are given for the three chlor-
alkali processes (amalgam, diaphragm, membrane). Some information on the inputs and pollutant outputs from the auxiliary processes such as brine purification, chlorine processing,caustic soda processing and hydrogen is also included. Reported emissions are taken from
plants that operate with a number of process-integrated and end-of-pipe techniques to reduceemissions. The figures given are either directly from the plants or from the Member States.
Mercury emissions at European level have been provided by Euro Chlor. Other figures are fromOSPARCOM5 reports or from the literature. Emissions resulting from impurities contained inthe products are outside the scope of this document.
3.1 Overall consumption and emission levels of all cell plants
Inputs and pollutant outputs of the chlor-alkali industry are quite specific to the cell technologyused but also depend on the specifications of the products (O2 or CO2 content, for example), the
purity of the incoming salt and the geographical location of the plant. The inputs are primarilysalt and water as feedstock; acids and chemical precipitants used to remove impurities in the
input brine or output chlorine/caustic soda; cooling agents (CFCs, HCFCs, HFCs, ammonia,etc.) for liquefying and purifying the chlorine gas produced. The chlor-alkali process needshuge amounts of electricity and electrical energy is a major input. The main pollutant outputswhich are common to all three electrolytic processes are chlorine gas emissions, spent acids,cooling agents, impurities removed from the input salt or brine. The major pollutant in terms of
environmental impact, originating from the amalgam technology, is mercury. Due to the process characteristics, mercury can be emitted from the process through air, water, wastes andin the products. The diaphragm cell and membrane techniques are more concerned with spentmaterials generation because of the replacement of the cell materials needed for the process. In
the diaphragm process, deterioration of the asbestos-based diaphragms is the main reason for
cell renewal. In view of the potential exposure of employees to asbestos and releases into theenvironment, special care must be taken. In addition, the improvement in cell componentmaterials such as metal anodes and modified diaphragms, which are more stable, has helped to
reduce the formation of undesirable and polluted by-products.
Mercury outputs have decreased in the last twenty years as amalgam cell plant operators have been more active in reducing mercury emissions, although the attention paid to this may vary
from one country to another. According to Euro Chlor, mercury emissions to air and water per tonne chlorine capacity in western Europe were 27 g in 1977, 8 g in 1987 and around 2 g in1997. Furthermore, the industry moved away in the 1990s from the mercury process to the moreefficient (in terms of material and energy inputs and outputs) membrane cell process (first
European membrane plant in 1983 at Akzo in Rotterdam).
Table 3.1 gives an overview of the inputs and outputs of the three chlor-alkali technologies,using a brine recirculation process. The information is collected from available sources and isnot complete. Chlorine liquefaction is not included, nor are emissions from cooling systems.
5 Commission for the Protection of the Marine Environment of the North-East Atlantic. Publications can
be found at http://www.ospar.org
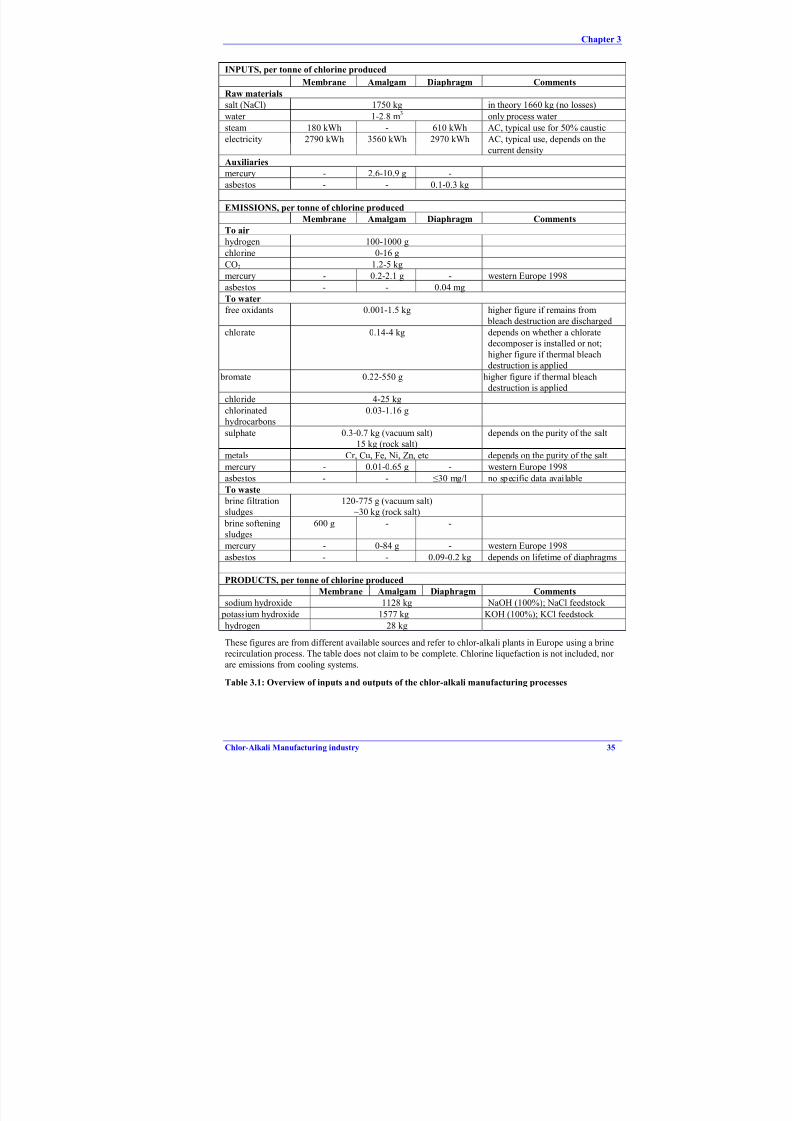
8/8/2019 Integrated Pollution Prevention and Control European Environment Comission
http://slidepdf.com/reader/full/integrated-pollution-prevention-and-control-european-environment-comission 51/178
Chapter 3
Chlor-Alkali Manufacturing industry 35
INPUTS, per tonne of chlorine produced
Membrane Amalgam Diaphragm Comments
Raw materials
salt (NaCl) 1750 kg in theory 1660 kg (no losses)
water 1-2.8 m3
only process water
steam 180 kWh - 610 kWh AC, typical use for 50% caustic
electricity 2790 kWh 3560 kWh 2970 kWh AC, typical use, depends on thecurrent density
Auxiliaries
mercury - 2.6-10.9 g -
asbestos - - 0.1-0.3 kg
EMISSIONS, per tonne of chlorine produced
Membrane Amalgam Diaphragm Comments
To air
hydrogen 100-1000 g
chlorine 0-16 g
CO2 1.2-5 kg
mercury - 0.2-2.1 g - western Europe 1998asbestos - - 0.04 mg
To water
free oxidants 0.001-1.5 kg higher figure if remains from
bleach destruction are discharged
chlorate 0.14-4 kg depends on whether a chlorate
decomposer is installed or not;
higher figure if thermal bleach
destruction is applied
bromate 0.22-550 g higher figure if thermal bleach
destruction is applied
chloride 4-25 kg
chlorinated
hydrocarbons
0.03-1.16 g
sulphate 0.3-0.7 kg (vacuum salt)
15 kg (rock salt)
depends on the purity of the salt
metals Cr, Cu, Fe, Ni, Zn, etc depends on the purity of the salt
mercury - 0.01-0.65 g - western Europe 1998
asbestos - - ≤30 mg/l no specific data available
To waste
brine filtration
sludges
120-775 g (vacuum salt)
~30 kg (rock salt)
brine softening
sludges
600 g - -
mercury - 0-84 g - western Europe 1998
asbestos - - 0.09-0.2 kg depends on lifetime of diaphragms
PRODUCTS, per tonne of chlorine produced
Membrane Amalgam Diaphragm Comments
sodium hydroxide 1128 kg NaOH (100%); NaCl feedstock
potassium hydroxide 1577 kg KOH (100%); KCl feedstock
hydrogen 28 kg
These figures are from different available sources and refer to chlor-alkali plants in Europe using a brine
recirculation process. The table does not claim to be complete. Chlorine liquefaction is not included, nor
are emissions from cooling systems.
Table 3.1: Overview of inputs and outputs of the chlor-alkali manufacturing processes
8/8/2019 Integrated Pollution Prevention and Control European Environment Comission
http://slidepdf.com/reader/full/integrated-pollution-prevention-and-control-european-environment-comission 52/178
Chapter 3
36 Chlor-Alkali Manufacturing industry
3.1.1 Inputs in the production line
3.1.1.1 Sodium chloride/potassium chloride
Different types of salt are used to produce the brine for electrolysis. These types are vacuum-crystallised salt from solution-mined brine, rock salt and solar salt. The stoichiometric salt
consumption is 1.66 tonnes per tonne chlorine produced. In fact, 1.75 tonnes per tonne of chlorine produced is closer to reality because of impurities control of the brine by purge.
Another particular case which can occur concerns diaphragm plants which prefer to sell the saltfrom caustic evaporators and buy new feedstock, for economic reasons.
In plants which operate with waste brine using a once-through brine process, the consumptionof salt is about 3 times as much as in plants using a brine recirculation process, i.e. about 5
tonnes of salt per tonne of chlorine produced. Chlor-alkali plants using a waste brine processare located close to big underground salt deposits which can be found in Spain, Italy, Portugaland the United Kingdom.
In plants using KCl, the amount of salt needed is a bit more than for plants using NaClfeedstock, due to the higher molecular weight of KCl. Consumption in this case is about 2.1-2.2tonnes of salt/tonne of chlorine produced. Plants using KCl do not use the waste brine process.
3.1.1.2 Water
Water is used in the process for:- purges
- preparation of the brine- the caustic circuit: for maintaining the water balance in the reaction to form NaOH in the
membrane and mercury cells
- the chlorine absorption unit: the quantity used will depend on the amount of chlorinereleased to absorption.
Water can also be used for cooling. However, cooling systems are not considered in thisdocument. Apart from the water needed for cooling, generally 2-2.5 m3 of water is consumed per tonne of chlorine produced for plants using a brine recirculation process. For waste brine
processes, about 10 m3 of water per tonne of chlorine produced is required.
3.1.1.3 Energy
Energy is used both as electricity and as heat. About half of the energy expended is convertedinto the enthalpy of the products. The rest is converted into heat transferred to the air in the building and the products, which have to be cooled. The heat is partly recirculated through preheating of the brine. Surplus heat might also be used for heating surrounding buildings or
for the concentration of caustic soda. Insulation of the cells and salt dissolvers reduces the needfor ventilation of the cell room and increases the amount of heat transferable. The hydrogen produced in chlor-alkali plants can be used as a raw material in the synthesis of chemicals or asa fuel. [UN/ECE, 1985].
The operation of a chlor-alkali plant is dependent on the availability of huge quantities of direct-current (DC) electric power, which is usually obtained from a high voltage source of alternating current (AC). The lower voltage required for an electrolyser circuit is produced by a
series of step-down transformers. Silicon diode rectifiers convert the alternative currentelectricity to direct current for electrolysis [Kirk-Othmer, 1991].
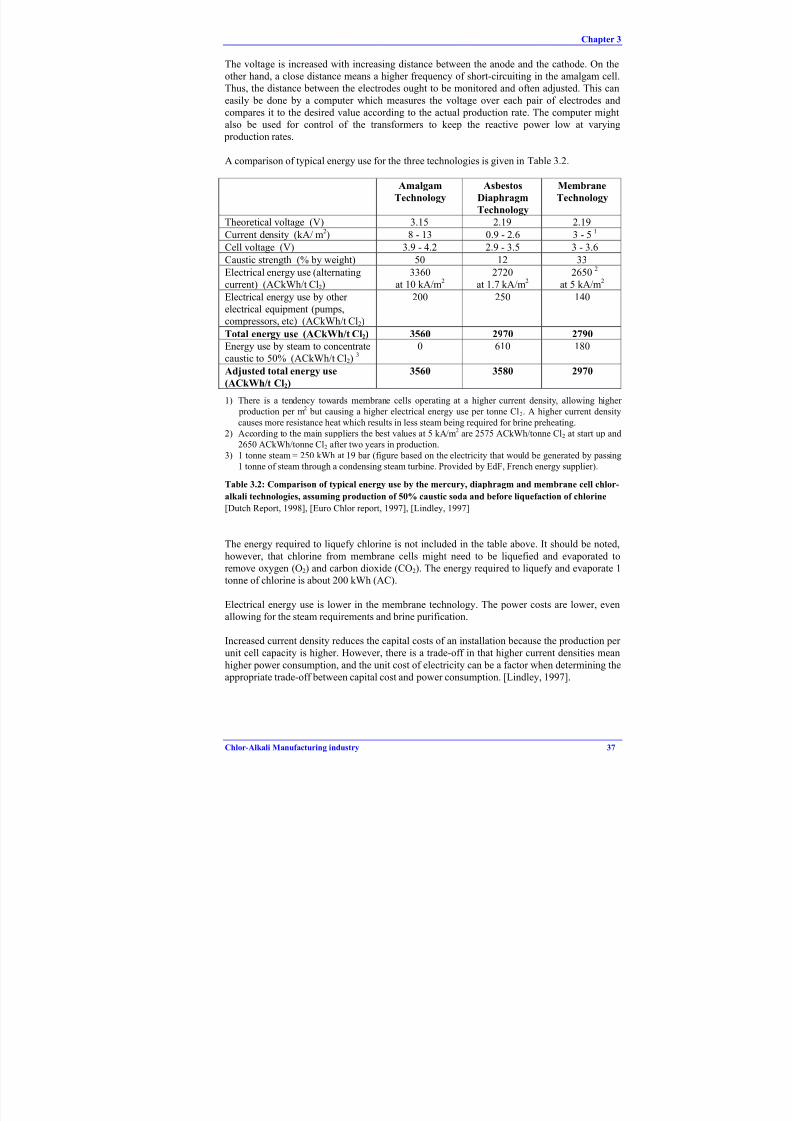
8/8/2019 Integrated Pollution Prevention and Control European Environment Comission
http://slidepdf.com/reader/full/integrated-pollution-prevention-and-control-european-environment-comission 53/178
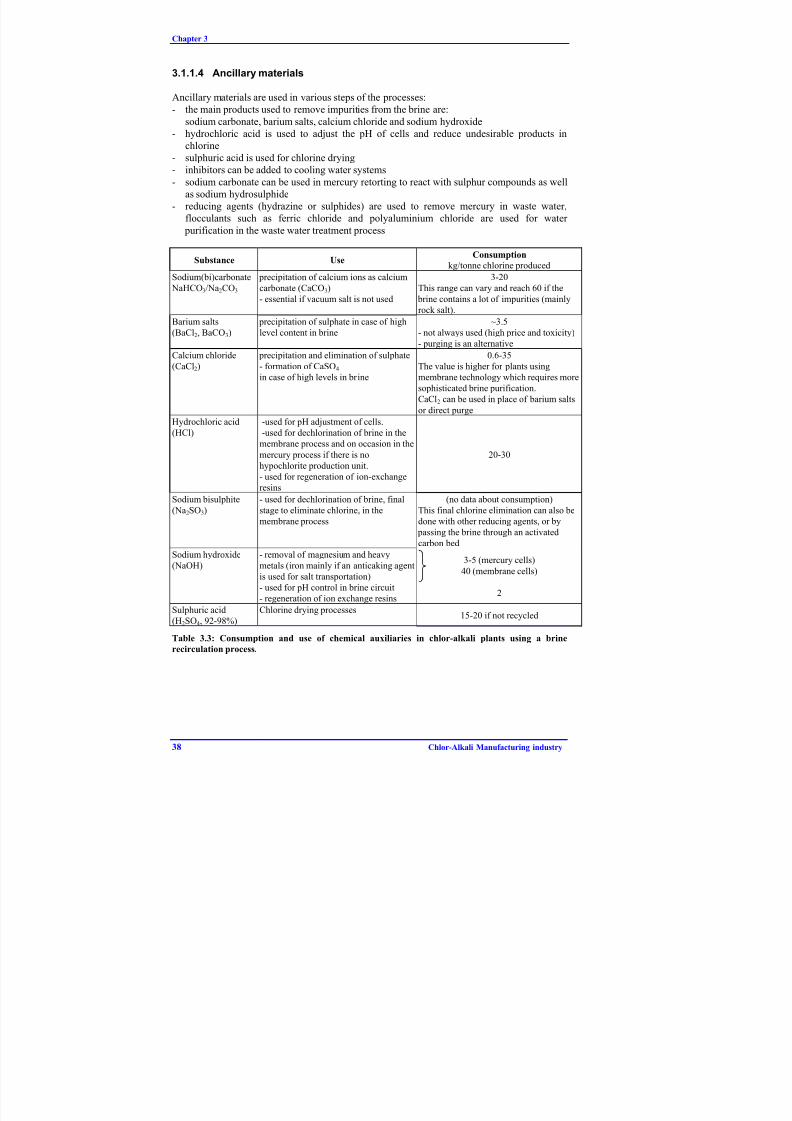
8/8/2019 Integrated Pollution Prevention and Control European Environment Comission
http://slidepdf.com/reader/full/integrated-pollution-prevention-and-control-european-environment-comission 54/178
Chapter 3
38 Chlor-Alkali Manufacturing industry
3.1.1.4 Ancillary materials
Ancillary materials are used in various steps of the processes:- the main products used to remove impurities from the brine are:
sodium carbonate, barium salts, calcium chloride and sodium hydroxide
- hydrochloric acid is used to adjust the pH of cells and reduce undesirable products inchlorine- sulphuric acid is used for chlorine drying- inhibitors can be added to cooling water systems
- sodium carbonate can be used in mercury retorting to react with sulphur compounds as wellas sodium hydrosulphide
- reducing agents (hydrazine or sulphides) are used to remove mercury in waste water,flocculants such as ferric chloride and polyaluminium chloride are used for water
purification in the waste water treatment process
Substance UseConsumption
kg/tonne chlorine produced
Sodium(bi)carbonate NaHCO3/Na2CO3
precipitation of calcium ions as calciumcarbonate (CaCO3)
- essential if vacuum salt is not used
3-20This range can vary and reach 60 if the
brine contains a lot of impurities (mainly
rock salt).
Barium salts
(BaCl2, BaCO3)
precipitation of sulphate in case of high
level content in brine
~3.5
- not always used (high price and toxicity)
- purging is an alternative
Calcium chloride
(CaCl2)
precipitation and elimination of sulphate
- formation of CaSO4
in case of high levels in brine
0.6-35
The value is higher for plants using
membrane technology which requires more
sophisticated brine purification.
CaCl2 can be used in place of barium salts
or direct purge
Hydrochloric acid
(HCl)
-used for pH adjustment of cells.
-used for dechlorination of brine in the
membrane process and on occasion in the
mercury process if there is no
hypochlorite production unit.
- used for regeneration of ion-exchange
resins
20-30
Sodium bisulphite
(Na2SO3)
- used for dechlorination of brine, final
stage to eliminate chlorine, in the
membrane process
(no data about consumption)
This final chlorine elimination can also be
done with other reducing agents, or by
passing the brine through an activated
carbon bed
Sodium hydroxide(NaOH)
- removal of magnesium and heavymetals (iron mainly if an anticaking agent
is used for salt transportation)
- used for pH control in brine circuit
- regeneration of ion exchange resins
3-5 (mercury cells)
40 (membrane cells)
2
Sulphuric acid
(H2SO4, 92-98%)
Chlorine drying processes15-20 if not recycled
Table 3.3: Consumption and use of chemical auxiliaries in chlor-alkali plants using a brine
recirculation process.

8/8/2019 Integrated Pollution Prevention and Control European Environment Comission
http://slidepdf.com/reader/full/integrated-pollution-prevention-and-control-european-environment-comission 55/178
Chapter 3
Chlor-Alkali Manufacturing industry 39
3.1.2 Outputs in the production line
Main products
The products are obtained more or less in a fixed ratio, independent of the technology used:Per 1000 kg of chlorine produced,
- 1128 kg of NaOH (100 %) is produced if NaCl is used as a raw material- 1577 kg of KOH (100%) is produced if KCl is used as a raw material (the molecular weight
of KOH is higher than that of NaOH)- 28 kg of hydrogen is produced
Chlorine emissions
Because chlorine is a hazardous gas, leakage from electrolytic cells is avoided. However, small
amounts of chlorine might be emitted through leakage and handling of the cell covers. Severalchlorine detectors are normally placed in the electrolysis hall, giving immediate indication of any significant leakage. Chlorine concentration in the electrolysis hall can be below odour detection level if the cells are operated in a slight vacuum. Estimated emissions vary from closeto zero to 16 g chlorine per tonne of chlorine produced.
3.1.2.1 Emissions from the mercury cell process
At present some 12000 tonnes of mercury are contained in mercury cells used for chlorine
production in the EU. This is based on an average of 1.8 kg of mercury per tonne of annualchlorine capacity and an EU mercury cell chlorine capacity of 6.9 millions tonnes of chlorine per year [Lindley, 1997]. This mercury is contained and recycled within the chemical process. Nevertheless, due to the process characteristics, mercury emissions into air, water and also in
wastes are generated. Products, mainly caustic soda, and to a lesser extent hydrogen, containcertain amounts of mercury. As regards the mercury level in chlorine, it is virtually zero and nomercury removal processes are used for this product. Any attempt to draw a balance generallyresults in a difference between inputs and outputs of mercury, either positive or negative. This
item is specifically addressed in Section 3.1.2.1.5.
3.1.2.1.1 Air emissions
Air emissions consist of mercury and, in small quantities, chlorine gas from the cells (seeSection 3.1.2). Other fugitive emissions are described in the paragraphs concerning outputsfrom the auxiliary processes.
Releases of mercury are specific to the amalgam technology. Air emissions consist of mercury
vapour coming from:- cell-room ventilation- process exhausts- brine purification
- stack of caustic evaporators- hydrogen burnt or vented to atmosphere- mercury retorting- maintenance outside cell room

8/8/2019 Integrated Pollution Prevention and Control European Environment Comission
http://slidepdf.com/reader/full/integrated-pollution-prevention-and-control-european-environment-comission 56/178
Chapter 3
40 Chlor-Alkali Manufacturing industry
Cell-room ventilation
Ventilation air from the cell room is one of the main sources of mercury emissions to air.Compared to process exhaust, it can be more than ten times as much. The cell room with thehot mercury cells (approx. 80 ºC) is usually ventilated by means of natural ventilation. The heat
produced during electrolysis requires the air to be changed 10-25 times per hour, depending on
the type of building [Ullmann’s, 1996]. Ventilation air flows in the range of 20000-120000 Nm3/tonne chlorine capacity were found. This correspond to total ventilation air flows between300000-2000000 Nm3/h, depending on weather conditions, season, design and size of the plant.
With good mercury housekeeping the ventilation air contain mercury levels of 2-20 µg/Nm3.[Dutch report, 1998]
Some 2-8 µg/Nm3 of mercury were reported, with an air flow of 300000-600000 Nm3/h. This
plant (chlorine capacity of 120000 tonnes/year) was commissioned in the late 1960s and hasdeveloped a very efficient mercury housekeeping since 1978. In 1997, the mercury emitted toair from the cell room was estimated at 19.6 kg, corresponding to 0.17-0.21 g/tonne chlorinecapacity.
Mercury losses are influenced by the basic design of the cell room, the area of the cells, theleak tightness, the type of decomposers (see Figure 2.4 and Figure 2.5), the accessibility of thecells and the construction materials. Mercury emissions are also influenced by the use of operating and maintenance techniques which minimise the possibility of mercury emission.
Mercury spillage can occur during essential operations involving cells or decomposers, such asopening the cells for anode changing or cleaning, assembling or dismantling equipment, or replacing defective pipes. Optimisation by keeping the cells closed as far as possible reducesthe emissions due to maintenance operations. The existence of a maintenance plan has been
shown to increase the lifetime of cells six-fold and reduce the frequency of opening to onlyonce every two or three years (see Chapter 4). The frequency of cell opening can be higher for potassium chloride electrolysis, depending on the purity of the available salt.
Mercury emissions are also significantly reduced by good housekeeping practices which are backed up by people with the motivation to work in such a way. The lowest values of mercuryemissions have been observed in companies which have a specific and stringent cleaning andhousekeeping programme.
Another source of emissions into air is the evaporation of mercury deposited in the equipmentand in the building, for instance in cracks in the floor and in porous concrete and bricks.
In 1997, mercury emissions from western European cell rooms were in the range of 0.17-1.93
g/t chlorine production capacity, as reported by Euro Chlor.
Process exhaust
Process exhaust refers to all gaseous streams by which mercury can be emitted to atmosphereapart from cell-room ventilation air and product hydrogen. One of the most significant sourcesof mercury emission is the purge of inlet and outlet boxes (“end boxes”). Today, they are
usually connected to a separate ventilation system. The vacuum cleaning equipment is also asignificant mercury source and it is normally also connected to a ventilation system.
Mercury is removed by:- scrubbing with hypochlorite, chlorinated brine or using a calomel reaction, or
- using a sulphurised charcoal system.
8/8/2019 Integrated Pollution Prevention and Control European Environment Comission
http://slidepdf.com/reader/full/integrated-pollution-prevention-and-control-european-environment-comission 57/178
Chapter 3
Chlor-Alkali Manufacturing industry 41
Emissions of mercury from process exhaust can be reduced to very low levels in existing plants, depending on the removal technology used.
In 1997, mercury emissions from process exhaust were in the range of 0.01-1.0 g/tonne chlorine production capacity, as reported by Euro Chlor.
The brine circuit
Mercury may be released in vapours from brine systems if presence of oxidising species is notmaintained. Depleted brine from the mercury cells normally contains up to 25 ppm of ionicmercury. It is maintained in this form by control of dechlorination to leave a residual oxidising
environment which prevents metallic mercury from being formed and emitted to atmospherefrom salt dissolvers, brine resaturators or brine filters and treatment vessels.
Caustic soda after the decomposer
The mercury contained in the caustic soda after the decomposer (in the range of 2.5 to 25 mg/l)can be emitted from the vents from pumping tanks or from the vents from caustic filters,
depending on the type of denuder (vertical ones have a very low flow) and temperature.Releases of mercury from this source are included in the figures given for the mercury contentin the process exhausts.
Normally, the caustic soda is filtered with activated carbon to remove mercury before handling.The predominant technique, which achieves low levels, is the plate filter with carbon precoat[Euro Chlor report, 1997]. The 50 % caustic produced is usually directly marketable after filtration. Any remaining mercury is in the range of 0.009 to 0.05 g per tonne chlorine capacityafter filtration. When concentrated caustic soda (100 %) is required, the 50 % solution has to be
concentrated in a caustic evaporator after mercury filtration. The mercury then evaporates fromthe caustic as a result of the heat treatment in the caustic evaporator.
Hydrogen produced in the decomposer
Hydrogen is formed from the exothermic reaction of sodium amalgam with water. It is referredto as “strong hydrogen”, indicating its high concentration. The hydrogen gas stream is nearly
saturated with mercury when it leaves the decomposer at a temperature of 90-130 ºC. Mercuryvapour is entrained in the process stream and passes through a heat exchanger to decreasetemperature to ambient. After cooling, mercury vapour condenses and is collected. The mercuryis recovered directly as a metal inside the decomposer and can be recycled. Hydrogen may becompressed and cooled, to reduce the mercury content further.
A two-stage method (cooling followed by chemical or catalytic treatment) for the removal of mercury from hydrogen appears to be particularly effective. The hydrogen gas is usually cooledto 20 ºC with a heat exchanger and cooled with a second heat exchanger to 5 ºC (two-stage
cooling). The quantity of mercury released will depend on whether the cooling step is followed by a chemical reaction (for instance, with CuO) or with a catalyst reaction (e.g. sulphurisedcarbon). The range can then vary. For a plant which reports a total mercury emission in air of 19.9 kg in 1997 (capacity of 120000 tonnes of chlorine), 0.23 kg of mercury was emitted from
hydrogen production after cooling and treatment with sulphurised carbon, i.e. 1% of totalemissions. Mercury releases from hydrogen can be considered a potentially important emission
source of mercury, when the hydrogen gas is not properly purified.

8/8/2019 Integrated Pollution Prevention and Control European Environment Comission
http://slidepdf.com/reader/full/integrated-pollution-prevention-and-control-european-environment-comission 58/178
Chapter 3
42 Chlor-Alkali Manufacturing industry
A further hydrogen stream is produced from mercury cells during the wash operations performed on the mercury, on its entrance to, and exit from, the cell. It is called “weak hydrogen”. The quantities of hydrogen are much smaller, and are diluted with air to maintainthe concentrations below explosive limits. This hydrogen stream also contains mercury, whichmay be treated by addition of chlorine or hypochlorite. The chlorine reacts with mercury to
form Hg2Cl2 which deposits as a solid. Alternatively, the mercury can be adsorbed on activated
carbon. The cleaned gas is vented to atmosphere. The mercuric chloride residue is washed with brine, which reacts to form HgCl42- and is recycled to the electrolysis plant. During electrolysis,
the HgCl42- complex produces mercury metal and chlorine [UK Guidance note, 1993].
Any remaining mercury is emitted if hydrogen is burnt as fuel. In the event of irregular operation, hydrogen is blown off or flared, usually after (at least partial) mercury removal.Hydrogen blow-off before mercury removal is rare and only occurs in emergencies. It has been
estimated at 0.005 g of mercury released per tonne of chlorine produced by BASF in Antwerp(Belgium). This figure is of course only representative of one company and may vary. Thissource of emission should nevertheless not be omitted.
Other fugitive mercury releases from the amalgam process
Mercury from storage
Storage and handling of mercury-contaminated material may lead to diffuse emissions of
mercury from the store houses. Emissions depend mainly on the type of storage (open/closed),the storage temperature and the amount of mercury-contaminated material in storage. Reportedemissions from one plant are around 0.1 g Hg/tonne chlorine capacity. [Dutch report, 1998]
If mercury is stored, the emission will also depend on the type of containers (big containers of
600 kg avoid mercury handling and reduce emissions compared to bottles). Reported emissionsfrom BASF in Antwerp (Belgium) are in the range of 0.004-0.005 mg/Nm3 (period of
measurement: January 1997 to April 1998, the storage contains bottles of 35 kg of mercury andthe consumption of mercury is 2.636 g/tonne chlorine produced).
Generally, storage of contaminated materials should be separate from storage of mercury, andthere should be no emission from the latter [Euro Chlor].
Mercury from the recovery retort
In the mercury recovery retort, mercury-containing waste is distilled in order to reduce themercury content of the waste. The flue gas leaving the retort contains a small amount of mercury. In some cases these gases are passed through a mercury filter before they are emitted;
in others, the flue gases are directly emitted to the atmosphere. Emissions from the mercuryrecovery retorts should be controlled to ensure that they are insignificant.
3.1.2.1.2 Water emissions
Waste water emissions consist of mercury and other substances in waste water streams, whichare described in the paragraphs concerning outputs from the auxiliary processes.
The releases of mercury are specific to the amalgam technology. Mercury emitted frommercury cell facilities mainly arises from:
- the process: bleed from brine purification, condensate from hydrogen drying, condensatefrom caustic soda concentration units, brine leakage, ion-exchange eluate from process-water treatment
8/8/2019 Integrated Pollution Prevention and Control European Environment Comission
http://slidepdf.com/reader/full/integrated-pollution-prevention-and-control-european-environment-comission 59/178
Chapter 3
Chlor-Alkali Manufacturing industry 43
- the wash water from the cell cleaning operations: inlet and outlet boxes- the rinsing water from the electrolysis hall: cleaning of the floors, tanks, pipes and
dismantled apparatus
- the rinsing water from maintenance areas outside the electrolysis hall, if they are cleanedwith water
Brine purge, filter washings and waste liquor from the brine purification plant
The depleted brine from the cells contains some dissolved mercury. The largest part of thismercury is recirculated into the cells . Part of the mercury is discharged through the purge of the brine circuit. This waste water is normally treated to remove mercury before discharge into
the environment.
The mercury-contaminated filter-cakes are normally pumped with mercury-containing waste-waters to the purification stage and the sludge therefrom is either distilled at the plant, stored or
sent to a deposit.
Mercury-contaminated wash water from the inlet and outlet boxes and from the electrolysis
hall
The wash water from the inlet boxes flushes entrained caustic from the recycled mercury. Thiswater contains mercury, but can be used as feed water to the decomposer. Wash water from the
outlet boxes flushes entrained brine from the amalgam. This water also contains mercury, butcan also be reused as feed water to the electrolytic cells.
Condensate from hydrogen drying
Mercury can be released during hydrogen drying. The hydrogen which is formed in thedecomposer contains significant amounts of water and mercury. A large part of this water iscondensed by cooling the hydrogen. The condensate contains mercury, but can be used as feed
water to the decomposer.
Filtered caustic liquor
Filtered 50% (by weight) caustic liquor contains some mercury. Akzo Nobel in Bohus(Sweden) reported an average mercury content of 8 µg/l NaOH and 33 µg/l KOH for 1998.Small quantities of mercury thus appear in the effluents of user plants.
Mercury contamination of rainwater effluents from mercury process plants
There can be considerable emissions of mercury with run-off water. The soil at many sites is
contaminated with mercury due to deposition of diffuse emissions and/or historical disposal of mercury contaminated wastes. The mercury leaks from the soil and ends up in the run-off water.
Rainwater is normally collected and treated with the other water streams of the plant. In some plants the rainwater is collected in sewer systems.

8/8/2019 Integrated Pollution Prevention and Control European Environment Comission
http://slidepdf.com/reader/full/integrated-pollution-prevention-and-control-european-environment-comission 60/178
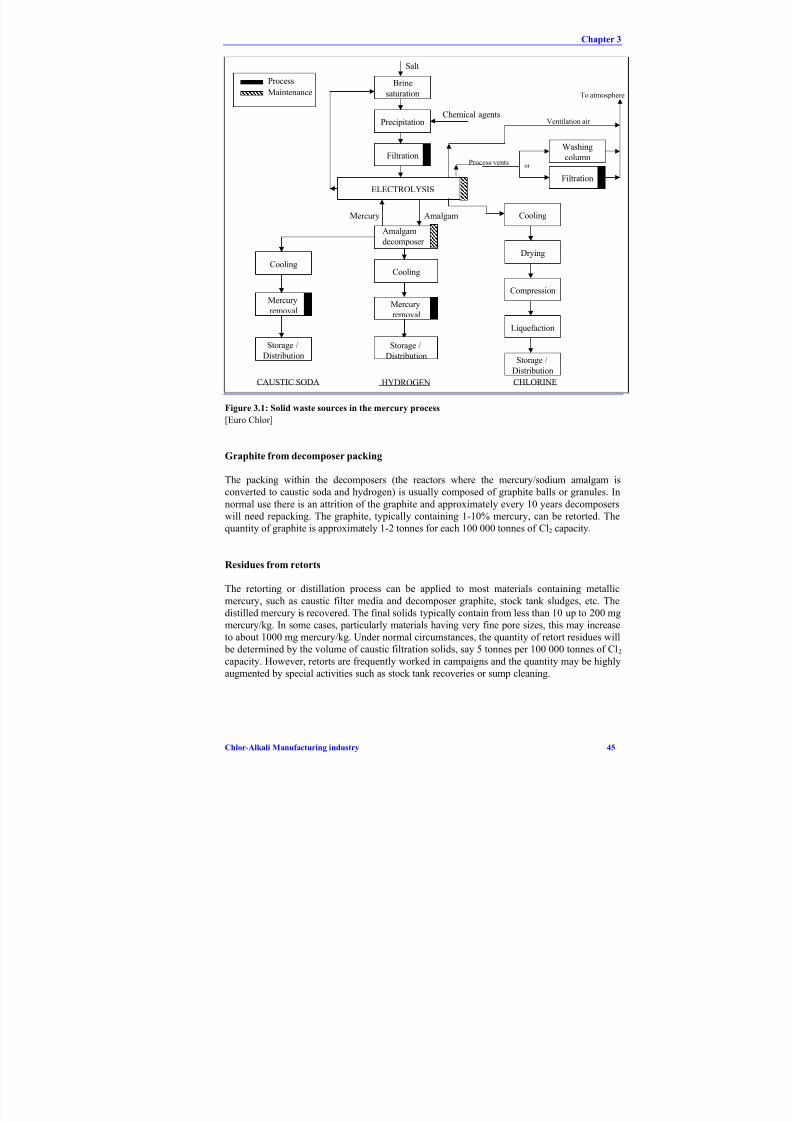
8/8/2019 Integrated Pollution Prevention and Control European Environment Comission
http://slidepdf.com/reader/full/integrated-pollution-prevention-and-control-european-environment-comission 61/178
Chapter 3
Chlor-Alkali Manufacturing industry 45
Brine
saturation
Precipitation
Filtration
ELECTROLYSIS
Cooling
Mercury
removal
Cooling
Mercury
removal
Storage /
Distribution
Cooling
Drying
Compression
Liquefaction
Storage /
Distribution
Chemical agents
Salt
Mercury Amalgam
Amalgam
decomposer
Cusomers
CAUSTIC SODA HYDROGEN CHLORINE
Washing
column
To atmosphereMaintenance
Process
Filtration
or Process vents
Ventilation air
Storage /
Distribution
Figure 3.1: Solid waste sources in the mercury process
[Euro Chlor]
Graphite from decomposer packing
The packing within the decomposers (the reactors where the mercury/sodium amalgam isconverted to caustic soda and hydrogen) is usually composed of graphite balls or granules. In
normal use there is an attrition of the graphite and approximately every 10 years decomposerswill need repacking. The graphite, typically containing 1-10% mercury, can be retorted. Thequantity of graphite is approximately 1-2 tonnes for each 100 000 tonnes of Cl2 capacity.
Residues from retorts
The retorting or distillation process can be applied to most materials containing metallic
mercury, such as caustic filter media and decomposer graphite, stock tank sludges, etc. Thedistilled mercury is recovered. The final solids typically contain from less than 10 up to 200 mgmercury/kg. In some cases, particularly materials having very fine pore sizes, this may increaseto about 1000 mg mercury/kg. Under normal circumstances, the quantity of retort residues will be determined by the volume of caustic filtration solids, say 5 tonnes per 100 000 tonnes of Cl2
capacity. However, retorts are frequently worked in campaigns and the quantity may be highlyaugmented by special activities such as stock tank recoveries or sump cleaning.
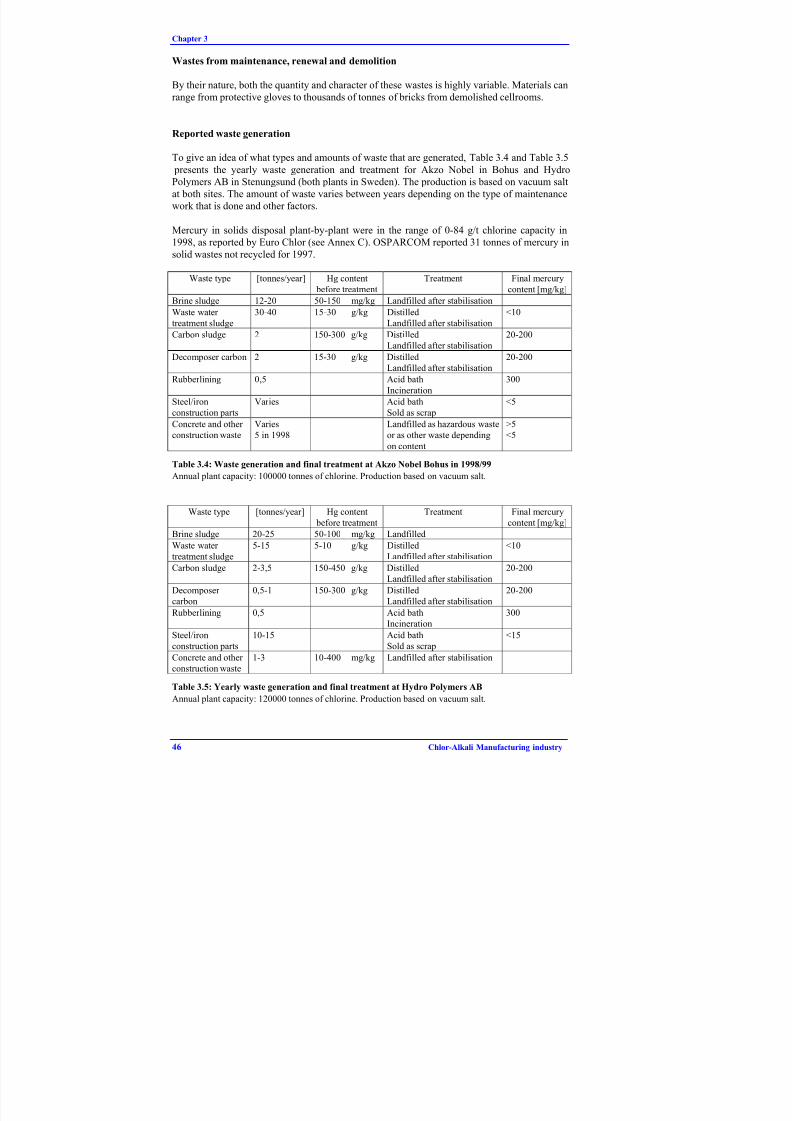
8/8/2019 Integrated Pollution Prevention and Control European Environment Comission
http://slidepdf.com/reader/full/integrated-pollution-prevention-and-control-european-environment-comission 62/178

8/8/2019 Integrated Pollution Prevention and Control European Environment Comission
http://slidepdf.com/reader/full/integrated-pollution-prevention-and-control-european-environment-comission 63/178
Chapter 3
Chlor-Alkali Manufacturing industry 47
3.1.2.1.4 Mercury contained in products
Hydrogen and caustic soda from amalgam chlor-alkali plants contain a certain amount of mercury. The mercury level in chlorine is negligible, i.e. less than 0.001 g/tonne. No mercury
removal processes are used for this product. Traces of mercury in chlorine may be due to the presence of mercury in the sulphuric acid used to dry chlorine. As regards sodium and
potassium hydroxides and hydrogen, purification techniques are needed before the products aresold. Mercury content in sodium and potassium hydroxides remains the most important
compared to other products.
Mercury losses to products in 1996, as reported by OSPARCOM, varied from 0.01 to 0.93 g per tonne chlorine capacity, corresponding to 612 kg emitted. These figures correspond to the sum
of mercury in chlorine gas, in alkalis and in hydrogen which is sold for further processing or use, but which is not sold as a fuel.
3.1.2.1.5 Mass balance calculation
Reported figures
As regards mercury outputs, figures are expressed and reported by the industry in terms of chlorine capacity rather than real production. This is quite specific to the mercury chlor-alkali
sector. Because of the electrolytic process in itself, emissions are not linked to production in alinear way. The majority of the emissions are from the cell room where the absolute amount isfar more related to the equipment, plant design, maintenance requirements, pressure andtemperature of cell and denuder. However, it could be assumed that if half of the cells are
switched off this reasoning may be wrong. The industry gives two main reasons for reportingmercury emissions in terms of chlorine capacity. The first one is economic and the secondtechnical. For economic reasons, a plant will always prefer to run all its cells because it is the
cheapest way of operating and minimising costs. This is particularly true in countries like Spainor the United Kingdom where electricity tariffs can vary a lot during the year or even the day.Running at lower current densities is cheaper than switching off the cells. The second reasongiven is the design of the electric circuit. The rectifier is specified for a certain voltage and theelectrical equipment may not support a voltage drop, especially for processes using a
combination of diaphragm and amalgam technologies or amalgam and membrane. In Europe,however, the figures reported refer to 90% running capacity.
The industry also reports that production figures on a plant by plant basis are confidential datafor “competitive reasons”.
Mass balance calculation
When making a balance between mercury inputs and outputs, the balance is frequently positiveor, from time to time, negative. In 1998, the mercury difference to balance were, plant by plant,in the range of -35 - +36 g Hg/tonne chlorine capacity (see Annex C). Mercury is recycledwithin the process to a large extent but some of the mercury is accumulated in equipment and
some is lost to air, water, wastes and products. A methodology for making a mercury balance ina chlor-alkali plant is laid out in [Euro Chlor Env. Prot. 12, 1998]. These guidelines are adopted by OSPARCOM for the annual reporting of mercury losses, and companies have to state wherethey have departed from them.
An accurate balance depends on the ability to measure the mercury inventory in the cells. Themercury cell inventory can be measured to 0.5% accuracy when using a radioactive tracer. With

8/8/2019 Integrated Pollution Prevention and Control European Environment Comission
http://slidepdf.com/reader/full/integrated-pollution-prevention-and-control-european-environment-comission 64/178
Chapter 3
48 Chlor-Alkali Manufacturing industry
an average cell inventory of 1.8 kg Hg/tonne chlorine capacity, this correspond to 9 g Hg/tonnechlorine capacity.
The mercury difference to balance is also due to the fact that mercury accumulates inside pipes,tanks, traps, sewers and in sludges, until some form of equilibrium is reached. Euro Chlor
recommends purging this type of equipment, where possible, just prior to making the balance.
Some 10 tonnes of mercury was said to be found by a company in a cooling water tower usedfor hydrogen (diameter 3.6 m). Mercury is often recovered when mercury cell rooms aredecommissioned.
Because of the difficulty in recording an accurate follow-up of the mercury outputs, some proposals, in order to avoid discussion as to the credibility of the balance, could be to:- operate rigorous and precise control of emissions, periodically, by third parties,
- optimise the recycling of mercury at each step of the process; in particular, extensiverecycling of mercury in solid wastes should be possible,
- adoption of a recognised standard methodology to do the mercury balance.
3.1.2.2 Emissions from the diaphragm cell process
Over the past twenty years all diaphragm cell facilities in western European countries haveswitched from the use of lead and graphite anodes with asbestos diaphragms to metal anodesand treated diaphragms, which resist corrosion and degradation. The diaphragms used to
become clogged with graphite particles and had to be renewed after a few weeks. The use of lead and graphite anodes and asbestos diaphragms generated lead, asbestos, and chlorinatedhydrocarbons in the caustic soda and chlorine processing waste. Lead salts and chlorinatedhydrocarbons were generated from corrosion of the anodes and asbestos particles formed by thedegradation of the diaphragm with use [USEPA, 1995]. Nowadays, Modified Diaphragms are
made of a mixture of chrysotile asbestos and PTFE fibres. They are fabricated at an averagerate of approximately 150 g asbestos per tonne of chlorine capacity.
EC Directive 87/217 concerning the prevention and reduction of pollution of the environment
by asbestos has the aim of defining steps and complementing measures already in existence toreduce and prevent pollution by asbestos, and to protect human health and the environment.The Directive applies to discharges from all plants where more than 100 kg a year of rawasbestos is used, which is the case in chlor-alkali plants using diaphragm technology. The
provisions came into effect on 31 December 1988 for all new plants and from 30 June 1991 for existing plants. Limits have been set to ensure that the concentration of asbestos dischargedinto the air does not exceed the limit of 0.1 mg/m3 of released air. As far as the aquaticenvironment is concerned, there is a general requirement to ensure that discharges of asbestos
are, as far as reasonably practicable, reduced at source and prevented. No specific provisions
linked to the chlor-alkali sector are given.
3.1.2.2.1 Air emissions
Air emissions consist of asbestos and fugitive emissions of chlorine from the cells and in the process tail gases. Other emissions coming from auxiliaries are described in the relevant paragraphs.
Asbestos
Air emissions can appear during production of the diaphragms and, excluding potentialaccidental releases during transportation, unloading and storage, the major potential sources of
air emission are during bag handling and opening and the disposal of spent asbestos.
8/8/2019 Integrated Pollution Prevention and Control European Environment Comission
http://slidepdf.com/reader/full/integrated-pollution-prevention-and-control-european-environment-comission 65/178
Chapter 3
Chlor-Alkali Manufacturing industry 49
Three sources of asbestos emission can be identified in the cell room maintenance area:- from the off-gas compressor,- from the off-gas drying oven,
- from the off-gas asbestos weighing room.
The fibre concentration in the cell room maintenance area is estimated by the industry to be less
than 100000 fibres/m3
.
Asbestos emissions from the baking furnace were calculated as being about 5 g per year,corresponding to an emission of 0.036 mg of asbestos per tonne of chlorine capacity in a plantof 140000 tonnes annual chlorine capacity [Dutch report, 1998].
Dry asbestos fibres can cause serious health problems if not properly used and handled in thediaphragm process. Asbestos fibres are thin and sharp crystals, which can be split into eventhinner crystals. Due to its physical properties, asbestos is considered to be carcinogenic. Thefibres are insoluble in body fluids and easily penetrate cell membranes. They can enter the
human body by either inhalation or ingestion.
3.1.2.2.2 Water emissions
Waste water streams from the diaphragm cell process mainly originate from the condenser during caustic soda evaporation, chlorine drying, and brine purification of salt recovered fromthe evaporators. These waste water streams are described in the relevant paragraphs aboutauxiliary processes.
At the end of the lifetime of an asbestos diaphragm, the asbestos is removed from the cathodecan by means of high pressure water-jet cleaning. Asbestos is collected with the rinsing water and can be discharged. A filter press can be installed to remove asbestos from the rinsing water.
Reported emissions give values of under or equal to 30 mg/l.
3.1.2.2.3 Generation of wastes
Solid wastes in the diaphragm process consist of wastes generated during brine purification andscrapped cell parts, including cell covers, piping and used diaphragms.
Bagged asbestos from scrap diaphragms
The asbestos diaphragms in modern diaphragm chlor-alkali plants have a lifetime of
approximately one year. After this year the cell is taken out of operation and the old asbestos isremoved from the cathode can. Reported figures are in the range of 0.09 kg solid residues per
tonne of chlorine capacity (~13.5 tonnes of asbestos per year, with a chlorine capacity of 150000 tonnes) to 0.2 kg per tonne of chlorine capacity (~30 tonnes of asbestos per year,considering a chlorine capacity of 150000 tonnes). 0.1 kg per tonne chlorine capacity is themedium average reported by the industry.
Discarded cell parts are either landfilled on-site or sent off-site for disposal, depending on thelegislation of the country.

8/8/2019 Integrated Pollution Prevention and Control European Environment Comission
http://slidepdf.com/reader/full/integrated-pollution-prevention-and-control-european-environment-comission 66/178
Chapter 3
50 Chlor-Alkali Manufacturing industry
3.1.2.3 Emissions from the membrane cell process
Emissions from chlor-alkali plants using the membrane technology are, apart from chlorine,linked to the brine purification needed to avoid undesirable impurities in the membrane cell andsolid wastes generated by the used membranes. Emissions coming from auxiliaries are
described in the relevant paragraphs.
3.1.2.3.1 Water emissions
Waste water from the membrane cell process originates from caustic evaporation, chlorinedrying and wash water from the ion exchange resin used to purify the brine. Membrane plantsusually use a bleed from the brine circuit in order to prevent accumulation of contaminants. Allthese emissions are described in the Section about auxiliary processes.
3.1.2.3.2 Generation of wastes
Wastes are generated during the secondary brine purification and consist of used materials suchas precoat and body feed material made of cellulose. The precoat filter sludge from the brine
softener consists mainly of alpha-cellulose, contaminated with iron hydroxide and silica.Membrane plants report a figure of 600 g/t for sludges from brine softening. Ion exchangeresins for secondary brine purification are very rarely changed. Resins are regenerated about 30times per year.
Spent membranes and gaskets from membrane cells become waste after their service life. Themembranes have a lifetime of between 2 and 4 years. The waste from cell gaskets andmembranes has been estimated at about 60 g per tonne of chlorine produced (data from one
membrane plant). In [Dutch report, 1998] other values are given: 3.3 g/t for gaskets and spentmembranes respectively.
3.1.2.4 Emissions from auxiliary processes
3.1.2.4.1 Emissions from salt unloading and storage
The salt is normally stored in sealed areas, sometimes equipped with a roof, to prevent it from blowing off site. Protective systems are installed to prevent contamination of the brine, in
particular in case of rain or if the storage is located near to surface waters or ground waters.
3.1.2.4.2 Emissions from the brine circuit
Table 3.3, page 38, shows the different chemical agents which are employed to purify the brine before electrolysis. The consumption of chemicals varies from plant to plant depending on theimpurities of the brine and the type and sensitivity of the local environment into which the purge is discharged.
As explained in Chapter 2, brine purification by pH adjustment, precipitation, flocculation andfiltration is required, on a full flow or sidestream basis, to keep impurities at acceptable levels.Membrane and mercury cells may use recycled brine requiring dechlorination. Specifically for membrane technology, brine purification is of critical importance to long membrane life and
high efficiency. Thus, impurities need to be removed by ion exchange resin units which thenrequire regeneration with caustic soda and acid washing. Some plants use vacuum crystallisedsalt, which is the most pure salt form (but also the most expensive) and for this reason have asimplified brine purification step.

8/8/2019 Integrated Pollution Prevention and Control European Environment Comission
http://slidepdf.com/reader/full/integrated-pollution-prevention-and-control-european-environment-comission 67/178
Chapter 3
Chlor-Alkali Manufacturing industry 51
Releases depend on the purity of the incoming salt used, the technology used (amalgam,diaphragm or membrane), the purification trade-off (use of chemical agents or direct purge inthe media) and whether the brine is recirculated or wasted. Brine sludges are one of the largest
waste streams of the chlor-alkali industry.
3.1.2.4.2.1 Air emissions
The fugitive emission of carbon dioxide is possible from all three chlor-alkali technologies.Carbon dioxide is emitted from the brine acidification tanks due to the decomposition of carbonate and bicarbonate ions into water and carbon dioxide. The carbonate and bicarbonateions are from the auxiliary chemicals used in the purification step. The carbon dioxide either
escapes from the brine and is emitted to the atmosphere or is led to the chlorine destructionunit, depending on the presence of chlorine in the brine. The concentration of (bi)carbonate isexpected to be lower when the depleted brine is recirculated and resaturated with solid salts(membrane and mercury cells). CO2 emission due to brine acidification is about 1.2 kg per
tonne of chlorine produced.
When the amalgam technology is used, mercury emissions may occur from brine resaturatorsand salt dissolvers, if there is no oxidising species.
3.1.2.4.2.2 Water emissions
Table 3.6 summarises the main releases from the brine circuit using a recirculation process(except mercury which is described in Section 3.1.2.1.2, water emissions from the mercury cell process). Each release is described in more detail below.
Substance Emission in kg/tonne chlorine capacity
Sulphate 0.3-0.7 (Vacuum salt) Strictly depends on the purity of 15 (rock salt) the incoming salt
Chloride 4–25
Free oxidants 0.001–1.5 (1) Generally treated before discharging
Chlorate 0.14-4 (2)
Metals Depends on the purity of the incoming salt
Chlorinated hydrocarbons(measured as EOX)
0.03-1.16 (3) g/tonne Cl2 capacity
1) Higher figure from a plant that destroy the produced bleach in a chlorine destruction unit and
releases the remaining liquid. In this case, a value of 1.5 kg/tonne chlorine capacity is reported.
2) Values will depend on the presence or not of a chlorate decomposer.
3) Higher figure from a plant that destroy the produced bleach in a chlorine destruction unit and
releases the remaining liquid. In this case, a value of 1.16 g/tonne chlorine capacity is reported.
Table 3.6: Releases into water from the brine circuit using a recirculation process
Sulphate
Brine is generally purged from cells to reduce the levels of sodium sulphate and/or sodiumchlorate in the cells. The source of sulphate in brine is the salt used. Sulphate has a negativeeffect on the electrolysis process (damages the anode coating) and its level is carefully
controlled. This is normally done by a bleed from the brine treatment system for amalgam and
membrane processes and by purge in the caustic evaporator from diaphragm cell chlor-alkali plants. The figures reported show that independently of the capacity of the plant, releases of sulphate are in the range of 0.3-0.7 kg per tonne chlorine produced if vacuum salt is used
8/8/2019 Integrated Pollution Prevention and Control European Environment Comission
http://slidepdf.com/reader/full/integrated-pollution-prevention-and-control-european-environment-comission 68/178
Chapter 3
52 Chlor-Alkali Manufacturing industry
(corresponding to about 34 tonnes a year for production of 100 kt) and around 15 kg per tonnechlorine produced if rock salt is used. This discharge may be considered problematic dependingon where the releases occur.
Chloride
During purification of the brine about 3-4% is purged to avoid build-up of undesiredcomponents. This purge can have a high concentration of chloride. Generally, after treatment to
remove free oxidants, the purge is discharged into the ambient water. Emissions reported are inthe range of 4-20 kg/tonne chlorine produced. This variation can be explained by the trade-off used for the purification to remove chloride and salt quality. This discharge may have someimpact in the recipient where it is released.
In the case of the process using waste brine, 50-70 % of the brine is purged and releases arearound 2000 kg/tonne chlorine produced.
Free oxidants
Free oxidants include halogenated components with a high reactivity: Cl2, Br 2, OCl-, OBr -and NHxBr y. Free oxidants are toxic to aquatic biota and are found in water streams which have
been in direct contact with chlorine and bromine. The purge from the brine purification isnormally treated before discharging into the environment. A concentration of 10 mg/l isgenerally observed. The release of free oxidants is higher for plants that destroy the produced bleach in the chlorine destruction unit and discharge the remaining liquid, which may contain
significant amounts of free oxidants [Dutch report, 1998].
Chlorate and bromate
The main sources of chlorate and bromate are the purge from brine purification and sometimesalso water streams that have been treated to decompose free oxidants into the less reactivechlorate and bromate. Chlorate (ClO3) and (to a much lesser extent) bromate (BrO3) are formed
as by-products during electrolysis. Chlorine may react with hydroxyl anions (OH-) to producechlorate while bromine may react with hydroxyl anions (OH -) to produce bromate. Due to therecycling of the brine, these components build up. Chlorate and bromate are unwantedcompounds in the process as their presence will reduce the solubility of incoming salt.Measures are usually taken to keep the level of chlorate low (usually below 10 g/l in the feed
brine). To maintain this level, there is a need to operate under acid conditions (approx. pH 2) inthe anolyte. If this is not the option chosen for the process (higher pH), a chlorate decomposer
may be necessary to remove chlorate before purging. The reported concentration is between 5to 10 g/l if no chlorate decomposer is installed and around 1 to 2 g/l after decomposition [Bayer
Uerdingen, 1998]. Specific emissions are between 0.14 and 1 kg per tonne of chlorine produced. Chlorate is less reactive than chlorine and has a lower toxicity for aquatic biota.Bromate, on the contrary, is a reactive compound. Nevertheless, it is present in small quantities,as bromine is only present as a contaminant of the salt. Bromate releases are typically 10-100
times lower than the chlorate figures.
Especially relevant with regard to chlorate and bromate are plants that do not use the bleach produced from the chlorine containing waste gases and destroy the bleach by means of heatingto 70 ºC and acidifying to pH 6 or 7. In this case the free oxidants are decomposed into the less
reactive chlorate. A value of 4 kg chlorate per tonne of chlorine produced is reported for a plantapplying thermal bleach destruction, while bromate was in the range of 0.22-550 g per tonne of chlorine produced [Dutch report, 1998].

8/8/2019 Integrated Pollution Prevention and Control European Environment Comission
http://slidepdf.com/reader/full/integrated-pollution-prevention-and-control-european-environment-comission 69/178
8/8/2019 Integrated Pollution Prevention and Control European Environment Comission
http://slidepdf.com/reader/full/integrated-pollution-prevention-and-control-european-environment-comission 70/178
Chapter 3
54 Chlor-Alkali Manufacturing industry
For plants using vacuum salt, reported figures for brine purification sludges are in the range of 120-775 g per tonne of chlorine produced (i.e. 12-77 tonnes of sludges per year for an annualchlorine production of 100000 tonnes).
For plants using rock salt, about 30 kg, on average, of brine sludges are generated for every
tonne of chlorine produced (i.e. 3000 tonnes of sludges per year for an annual chlorine
production of 100000 tonnes).
In the mercury process, brine filtration sludges contain mercury (see Sections 3.1.2.1.3 and
4.2.1.4). As regards the membrane process, the technology requires more rigorous purificationof the brine, and sludge disposal from the filters is thus more significant.
3.1.2.4.3 Emissions from chlorine gas production, cooling, drying, liquefaction and
storage
Air emissions consist of fugitive emissions of carbon dioxide and chlorine from the process, thechlorine destruction unit and the handling/storage of chlorine. The process of purifying and
liquefying impure chlorine gas involve carbon tetrachloride at a few installations in Europe,which is recovered to a large extent or incinerated.
The condensed water formed after cooling is usually recycled as brine make-up although somefacilities combine this waste stream with other waste water streams prior to treatment. The
remaining water vapour is removed by scrubbing the chlorine gas with concentrated sulphuricacid. The spent sulphuric acid waste is either sent back to the vendor, recycled or released.
3.1.2.4.3.1 Air emissions
Carbon dioxide
Small amounts of carbon dioxide are released from the anode compartment and are collected
and treated together with the chlorine. During chlorine liquefaction, carbon dioxide (and N2, O2,H2) remain in the gas phase and are finally purged from the system, together with a smallamount of chlorine. This waste stream is usually processed in the chlorine destruction unit. The part of the carbon dioxide that is not absorbed by the chlorine destruction unit is emitted into
the atmosphere.
Chlorine
Because chlorine is a hazardous gas, extreme precaution is taken to avoid emissions of chlorinefrom the process and from handling and storage. Therefore, emissions of chlorine gas into theatmosphere are generally low and the sources of significant potential emission are normallyconnected with the chlorine destruction unit.
Emissions from non-condensable gases remaining from liquefaction
Chlorine is liquefied in several steps of cooling and compressing. Gases (H2, O2, N2 CO2) in the process stream tend to concentrate in the gas phase. Therefore, chlorine gas liquefaction has anoutlet for non-condensable gases. The chlorine content of these non-condensable gases rangesfrom 1-8% of the raw chlorine gas produced. The non-condensable gases are directed to a
system which is able to handle chlorine such as a chlorine absorption/destruction unit or themanufacture of HCl, FeCl3 or ethylene dichloride, thus avoiding emissions into the atmosphere.
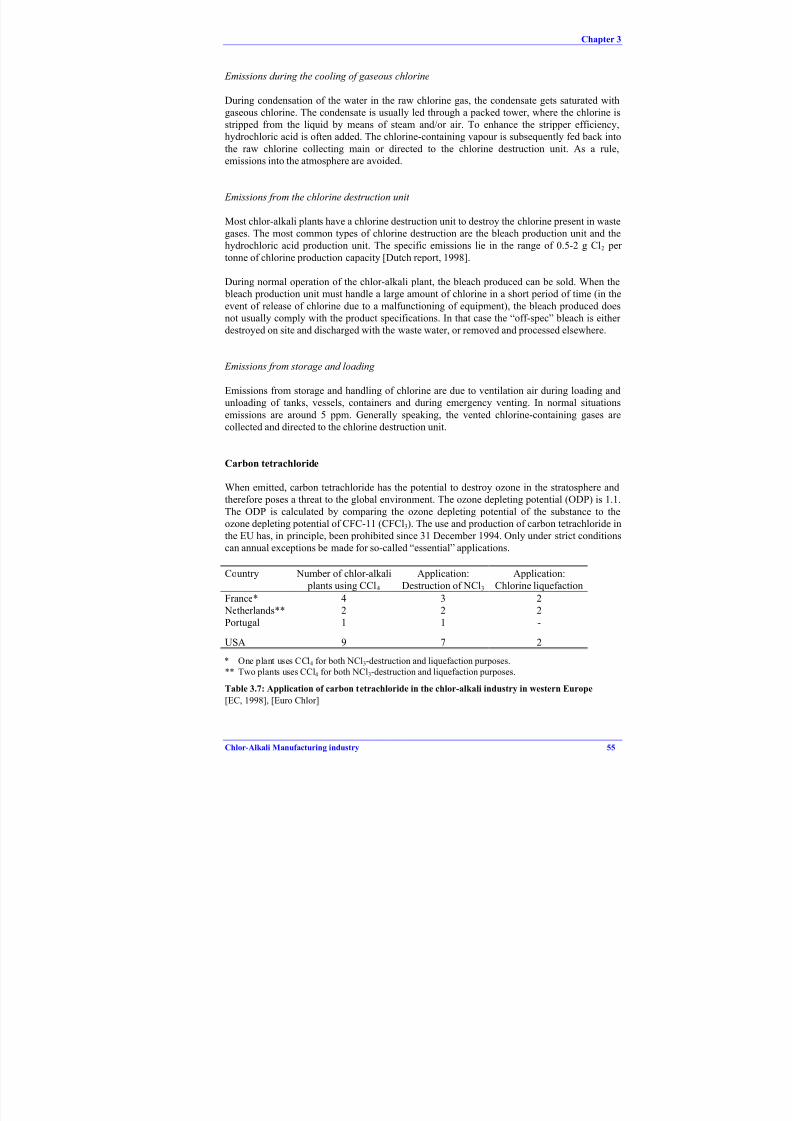
8/8/2019 Integrated Pollution Prevention and Control European Environment Comission
http://slidepdf.com/reader/full/integrated-pollution-prevention-and-control-european-environment-comission 71/178
Chapter 3
Chlor-Alkali Manufacturing industry 55
Emissions during the cooling of gaseous chlorine
During condensation of the water in the raw chlorine gas, the condensate gets saturated withgaseous chlorine. The condensate is usually led through a packed tower, where the chlorine isstripped from the liquid by means of steam and/or air. To enhance the stripper efficiency,
hydrochloric acid is often added. The chlorine-containing vapour is subsequently fed back intothe raw chlorine collecting main or directed to the chlorine destruction unit. As a rule,emissions into the atmosphere are avoided.
Emissions from the chlorine destruction unit
Most chlor-alkali plants have a chlorine destruction unit to destroy the chlorine present in wastegases. The most common types of chlorine destruction are the bleach production unit and thehydrochloric acid production unit. The specific emissions lie in the range of 0.5-2 g Cl2 per
tonne of chlorine production capacity [Dutch report, 1998].
During normal operation of the chlor-alkali plant, the bleach produced can be sold. When the bleach production unit must handle a large amount of chlorine in a short period of time (in the
event of release of chlorine due to a malfunctioning of equipment), the bleach produced doesnot usually comply with the product specifications. In that case the “off-spec” bleach is either destroyed on site and discharged with the waste water, or removed and processed elsewhere.
Emissions from storage and loading
Emissions from storage and handling of chlorine are due to ventilation air during loading andunloading of tanks, vessels, containers and during emergency venting. In normal situations
emissions are around 5 ppm. Generally speaking, the vented chlorine-containing gases arecollected and directed to the chlorine destruction unit.
Carbon tetrachloride
When emitted, carbon tetrachloride has the potential to destroy ozone in the stratosphere andtherefore poses a threat to the global environment. The ozone depleting potential (ODP) is 1.1.
The ODP is calculated by comparing the ozone depleting potential of the substance to theozone depleting potential of CFC-11 (CFCl3). The use and production of carbon tetrachloride inthe EU has, in principle, been prohibited since 31 December 1994. Only under strict conditionscan annual exceptions be made for so-called “essential” applications.
Country Number of chlor-alkali plants using CCl4
Application:Destruction of NCl3
Application:Chlorine liquefaction
France* 4 3 2 Netherlands** 2 2 2Portugal 1 1 -
USA 9 7 2
* One plant uses CCl4 for both NCl3-destruction and liquefaction purposes.
** Two plants uses CCl4 for both NCl3-destruction and liquefaction purposes.
Table 3.7: Application of carbon tetrachloride in the chlor-alkali industry in western Europe[EC, 1998], [Euro Chlor]

8/8/2019 Integrated Pollution Prevention and Control European Environment Comission
http://slidepdf.com/reader/full/integrated-pollution-prevention-and-control-european-environment-comission 72/178
Chapter 3
56 Chlor-Alkali Manufacturing industry
The Montreal Protocol allows the use of carbon tetrachloride as a process agent for liquefactionand purification of chlorine gas. CCl4 is only allowed in new installations if it is “essential”.Otherwise its use is forbidden. For existing plants, limit values will be set for process agents.
It should be noted that only 7 chlor-alkali plants in the EU use carbon tetrachloride for
liquefaction and purification of chlorine gas (see Table 3.7). The other 86 European chlor-alkali
plants have a different lay-out for chlorine liquefaction and purification, which allowsoperation without carbon tetrachloride (see Section 4.1.6).
The carbon tetrachloride for purification (absorption of tail gas, in particular to absorb NCl 3)and/or liquefaction of chlorine is circulated in a closed loop. Thus, in principle no processemissions of CCl4 occur. However, small amounts are emitted by leakage. The gas tightness of the system is of paramount importance to achieve low emission values from the system. [Dutch
report, 1998] Reported emissions from some companies are from less than 0.5 g CCl4/tonne Cl2
capacity to up to 4 g per tonne. Some plants in Europe report emissions of about 6 tonnes ayear.
3.1.2.4.3.2 Water emissions
Sulphates
Sulphuric acid mists coming from the drying towers are captured on candle filters and may bereleased as sulphates when the filters are washed for maintenance.
3.1.2.4.3.3 Generation of wastes
Spent sulphuric acid from chlorine drying
Highly concentrated sulphuric acid (92-98%) is used to dry chlorine. Up to 20 kg of sulphuricacid is consumed per tonne of chlorine produced. The spent acid usually becomes a waste product or one that requires reprocessing. Often the spent sulphuric acid is returned to thesupplier for refortification. The spent acid can also be used to control pH in process and wastewater streams or to destroy surplus hypochlorite, or it can be sold to an user who can accept this
quality of acid.
Where it is possible to reconcentrate it in a closed loop, consumption is very low, close to 0.1kg sulphuric acid per tonne of chlorine produced. Acid consumption can also be reduced by
optimising the time contact between chlorine and acid, keeping the fresh acid concentration ashigh and the spent acid concentration as low as possible.
Carbon tetrachloride
When carbon tetrachloride is used to absorb NCl3 from the liquid chlorine, the carbontetrachloride needs to be replaced periodically because of the build-up of pollutants (bromine,
FeCl3, chlorinated hydrocarbons, for example). The removed carbon tetrachloride is either incinerated or sent as hazardous waste. It must, however, be destroyed according to approveddestruction processes, as mentioned in Annex VI of the report of the fourth meeting of the parties to the Montreal Protocol. A plant with a capacity of 300000 tonnes chlorine per year uses carbon tetrachloride for NCl3 destruction and consumes approximately 12 tonnes of CCl4
per year, corresponding to 40 g CCl4/tonne of chlorine capacity (this figure includes fugitive
emissions from the CCl4 system of 0-4 g CCl4/tonne of chlorine capacity) [Dutch report, 1998].
8/8/2019 Integrated Pollution Prevention and Control European Environment Comission
http://slidepdf.com/reader/full/integrated-pollution-prevention-and-control-european-environment-comission 73/178
Chapter 3
Chlor-Alkali Manufacturing industry 57
3.1.2.4.4 Emissions from sodium and potassium hydroxide processing
Caustic soda solution from the diaphragm process have a concentration of 10-12% NaOH with15-17% NaCl when leaving the electrolytic cell and the caustic concentration from membrane
cells is 30-33% NaOH with little NaCl. Generally speaking, the caustic needs to beconcentrated to at least 50% and impurities need to be removed.
In the diaphragm process, about 5 tonnes of water must be evaporated per tonne of 50 percentcaustic soda solution produced [USEPA, 1995]. If sodium sulphate is not removed during the
brine purification process, salt recovered from the evaporators is often recrystallized to avoidsulphate build-up in the brine. If the salt is recrystallized, the waste water will also containsodium sulphates. Significant levels of copper may also be present in the waste water due tocorrosion of pipes and other equipment, along with iron and nickel which can dissolve to a
certain extent from the stainless steel equipment. In addition, the presence of nickel may berelated to the use of activated cathodes in the electrolytic cells. These metals are removed fromthe caustic by means of filtration and/or electrochemical reduction. The regeneration of thefilters or the reduction cathodes generates an acid waste water flow which may contain iron andnickel at levels which ought to be taken care of.
Waste water from the caustic evaporators in the membrane process contains caustic sodasolution and virtually no salt or sodium sulphates. It is usually recycled.
In the mercury process, caustic soda leaving the decomposer is directly concentrated to 50%. Itcontains practically no salt impurities, but it does contain mercury. The mercury (ranging from2.5 to 25 mg/l) can be released from the pumping tank vents or from the vents from causticfilters, depending on the type of denuder and temperature. Normally, the caustic soda is filtered
with activated carbon to remove mercury before handling. Charcoal from the filtration containsaround 150-500 g of mercury/kg carbon.
In mercury cell chlor-alkali plants, the filter sludge is dewatered and in some cases led to a
mercury recovery retort and subsequently disposed of. In cases where no mercury retort is present, the sludge has to be disposed of without mercury recovery. In membrane anddiaphragm cell plants, the filters can be flushed with a weak acid solution, causing the ironhydroxide and metals to dissolve. The effluent is usually discharged, as most chlor-alkali plantshave a physical-chemical waste water treatment unit which partially removes suspended solids
and free oxidants. 3 tonnes of sludge from caustic filtration out of a total of 38 tonnes of sludges (the other sources being the brine treatment sludge and the waste water treatmentsludges) produced per year has been reported for one amalgam chlor-alkali plant (chlorine production capacity of 115000 tonnes).
3.1.2.4.5 Hydrogen processing
The hydrogen produced in all of the electrolytic processes contains small amounts of water
vapour, sodium hydroxide and salt, which is removed through cooling and recycled or treatedwith other waste water streams. However, in the amalgam cells the hydrogen leaving thedecomposer is nearly saturated with mercury, which must be recovered prior to compression.Some facilities further purify the hydrogen of mercury using sulphurised carbon which may be
treated to recover mercury or disposed of in an approved landfill.
3.2 Historical contamination of chlor-alkali plant sites
Many old chlor-alkali plant sites are contaminated with PCDD/PCDF compounds (mercury anddiaphragm cell plants) and mercury (mercury cell plants). The soil contamination is due to

8/8/2019 Integrated Pollution Prevention and Control European Environment Comission
http://slidepdf.com/reader/full/integrated-pollution-prevention-and-control-european-environment-comission 74/178

8/8/2019 Integrated Pollution Prevention and Control European Environment Comission
http://slidepdf.com/reader/full/integrated-pollution-prevention-and-control-european-environment-comission 75/178
Chapter 3
Chlor-Alkali Manufacturing industry 59
Since then, advancing knowledge and experience have provided new insights. The “SEVESOII” Directive (96/82/EC) represents a fundamental revision of the Directive. By 1999, Member States must implement the Directive through their laws, regulations and administrative
practices. Storage and processes using chlorine are part of the scope of the Directive startingfrom 10 tonnes, along with hydrogen starting from 5 tonnes, while the alkali solutions are notcovered.
Among the new provisions is one which requires operators of certain establishments holdingsubstantial quantities of hazardous substances to produce a safety report which is accessible tothe public and contains the information listed in Annex II of the Directive. The safety reportappears to be one of the most important tools used to improve safety. It must provide a detaileddescription of the installation, presenting the main activities and products of the parts of the
establishment which are important from the safety point of view (not only chlorine, but also, for example, flammable liquid or ammonia, if present), sources of major-accident risks andconditions under which such a major accident could happen, together with a description of proposed preventive measures. A lot of methodologies, such as HAZOP (Hazard and
Operability Study), HAZAN (Hazard analysis numerical methods), QRA (Quantified Risk Assessment), generic fault trees, etc., are used for that purpose. The safety report should alsodescribe the measures to be taken, if a major accident occurs, to: issue an alert; protect the people affected and intervene to limit the consequences. Its requirement are specified in the
Directive for upper quantities: 25 tonnes for chlorine, 50 tonnes for hydrogen.
Based on lessons learnt from accidents, namely, that the contribution to risk from peoplefailures is of equal importance, whether they be simple human errors or more complex
procedural or organisational dysfunction, the Directive also asks operators to satisfy basic principles for management systems. The major-accident prevention policy includes:
− the training needs of personnel and the provision of the training so identified,
− management procedures for critical situations such as start-ups and shut-downs,disturbances or emergencies,
− an assessment of the effectiveness and suitability of the safety management system throughan internal audit and review.
Besides the implementation of safety measures by the operators, the Directive includes provisions concerning controls on land use planning when new installations are authorised andwhen urban development takes place around existing installations. A lot of initiatives alreadyexist in the Member States. In some countries, land use planning is based on a case-by-case
study, taking into account the scenarios of possible major accidents as described in the safetyreport when deciding whether or not to allow new constructions around a hazardous plant. Inother countries, land use planning is based on fixed external safety criteria which in somecountries, like the Netherlands, require the agreement of Parliament. Safety zones are
determined to permit different types of construction, depending on population density, to keep asuitable distance between such areas and hazardous establishments.
Another safety measure consists of establishing external and internal emergency plans and
creating systems to ensure those plans are tested and revised. Data and information to beincluded in the emergency plans are specified in Article 11 of the “ SEVESO II” Directive. Themain objective is to contain and control incidents so as to minimise the effects and to limitdamage to man, the environment and property.
The application of safety measures is part of best available techniques for chlor-alkali plants.Examples of preventive and corrective safety measures are given, in Chapter 4 of the document,on plant operation, storage and loading of products. Transport of chlorine, which also requires
certain precautions, is not covered.
8/8/2019 Integrated Pollution Prevention and Control European Environment Comission
http://slidepdf.com/reader/full/integrated-pollution-prevention-and-control-european-environment-comission 76/178
Chapter 4
60 Chlor-Alkali Manufacturing industry
4 TECHNIQUES TO CONSIDER IN THE DETERMINATION OF
BEST AVAILABLE TECHNIQUES
In this chapter, relevant techniques available for prevention and/or reduction of emissions,wastes and energy use are given both for new and existing plants. This list of techniques, basedon the information supplied by the members of the technical working group, should not be
considered as exhaustive; it may be added to when this document is reviewed. Process-integrated techniques, end-of-pipe techniques and changes of production process are presentedas techniques to consider to achieve integrated pollution prevention and control.
Safety measures are described, as safety is an issue of top priority for chlor-alkali plants due to
the potentially serious hazards that are connected with the synthesis, storage and use of chlorine, sodium/potassium hydroxide and hydrogen.
The structure is the same for all presentations of suggested techniques to consider in the
determination of BAT; a description of the applied technique including information onoperation and applicability to new and existing plants, the achieved emission levels/main
achievements, cross-media effects, reference plants, costs of application and references. When possible, the driving force for the implementation of the technique (environmental regulation,
economics, subsidies) has been mentioned.
Some techniques listed are applicable to all three cell technologies. Others are specific to a particular technology.
4.1 All cell plants
4.1.1 Safety measures
Description
In hazard and risk assessment studies, the design of chlor-alkali installations and equipment andthe operating and maintenance routines are examined in detail to reduce the risks for people andthe environment at source as much as possible. The most important substance to consider ischlorine. Preventative measures are the most important, although corrective and emergency
measures are also of importance. The design principles of the plant, scheduled maintenance andinspection, procedures and instrumentation (control systems) for operating the unit are covered,as well as hardware. An overview is given, below, of measures that can be applied to reduce therisks in operating a chlor-alkali plant, including storage and loading of products. The measures presented are an indication of possible measures that can be taken. The local situation will
determine the final package of measures that is required.
General measures
General measures related to safety are mainly linked to reliable and efficient safetymanagement systems based on:
Training of personnel including:
- basic knowledge of chlorine properties- correct operating practice- emergency procedures
- frequent refresher training- making sure that contractors’ personnel on the site are familiar with the safety regulations
and procedures for the site
8/8/2019 Integrated Pollution Prevention and Control European Environment Comission
http://slidepdf.com/reader/full/integrated-pollution-prevention-and-control-european-environment-comission 77/178
Chapter 4
Chlor-Alkali Manufacturing industry 61
Identification and evaluation of major hazards- written information for personnel about safety measures in normal and abnormal conditions
Instructions for safe operation including:- permanent monitoring of the installations under the responsibility of a designated person
specially trained for chlorine hazards
- good compliance with safety parameters defined in the safety report, including periodicinspection and control of materials specified according to safety hazards- maintenance programmes for the installations: for example, storage, maintenance of
pipework, pumps, compressors, monitoring of moisture concentrations, impurities in liquidchlorine
Planning for emergencies and recording of accidents and near-misses
- preparation, test and review of emergency plans
The safety management systems should be completed with appropriate technical measures, suchas:
- high quality preventive and protective systems, in particular in the loading area
- enhanced leak detection and leak isolation- good protection of employees and temporary workers on the site with appropriate and well
maintained equipment
In the chlor-alkali plant
In the chlor-alkali plant, safety measures refer in particular to the prevention of liquid chlorinespillage, using means such as:
- overfilling protection systems- correct choice of construction material and regular inspection of vessels- bunding for vessels containing hazardous material
and also:- Preventing impurities to avoid any explosive mixture. Measuring and control of hydrogen
concentration in the chlorine gas from the cell room and after each liquefaction step, andmeasuring and prevention of possible NCl3 accumulation.
- Prevention of failure of the electrical supply. Emergency generators for supply of power tovital equipment when/if grid power fails and also the prevention of failure of the instrumentair supply.
- Prevention of chlorine releases by a collection of chlorine releases during maintenanceoperation to the absorption unit, a correct warning for process deviations and irregularities.
In a more general way, a good layout of the installation and provision for instant shut-down of some compartments help to prevent domino-effects. Manual emergency push buttons which can be used by any of the site personnel on discovery of a chlorine leak should be present around
the plant.
In the loading area
In any liquid chlorine loading (or unloading) system, the weakest link is the connection betweenthe static plant and the mobile tank. The use of pneumatic valves with automatic shut down incase of failure of the link, at both ends of the link, is essential to limit the leak.
Only a risk assessment study, proper to each installation, can give the most likely modes of failure during loading and the associated safety measures to avoid them. Examples of somestandard measures are:

8/8/2019 Integrated Pollution Prevention and Control European Environment Comission
http://slidepdf.com/reader/full/integrated-pollution-prevention-and-control-european-environment-comission 78/178
Chapter 4
62 Chlor-Alkali Manufacturing industry
- Improved chlorine detection and location and rapid isolation of sources feeding a leak - Connection of loading area to a chlorine absorption system- PTFE hoses should not be used (based on information reported to accident databases)- Articulated arms or correctly specified flexible hoses and coils for chlorine transfers
Loading area hazards Examples of preventative measuresExamples of corrective or
emergency measures
- Tank overfill - Overfilling protection of the transportvehicle: a double weighing installation
(two weighbridges operated by two
different workers) should be installed
- Warning for loading deviations andirregularities
- Automatic pump shutdown
- Chlorine detectors connected to
alarms in the control room
- Remotely controlled shutdown
valves
- Emergency procedures
- Tank over-pressurisation during
filling
- Venting procedure to remove inert gases - Supply pump can be tripped
manually or from control room
- Corrosion due to chlorine/water
reaction
- Check tare weight of tank
- Moisture control system and avoidance
of possible back-flow
- Moisture analysis in chlorine gas
and padding gas, with alarm
- Response by process operators to
evidence of ferric chloride in
valves- Suction failure alarm in vent gas
scrubbing system
- Fire due to chlorine/iron reaction - Use of appropriate materials
- Avoidance of “hot work” areas
- No flammable liquids or materials in the
surroundings of loading areas
- Fire due to contaminants (oil,
organics)
- Prohibition of use of hydrocarbon oils,
greases and solvents
- Use of oil-free compressors in padding
gas systems
- Internal corrosion - Moisture control system in chlorine and
avoidance of possible back-flow
- Monitoring procedures for wet ferric
chloride in valves
- Collision with other rail/road tanks - Braking the transport vehicle and
blocking the road or railway track
during loading
- Prevention of runaway rail wagons or
tankers getting into filling area
- Alarms linked to rail retarders
- Emergency shut off valves on tank
and supply initiated by push
buttons
- Rupture of the filling pipe - Containment of the loading installation
- Use of articulated arms or correctly
specified flexible hoses and coils for
chlorine transfer
- Maintenance and inspection procedures
- Emergency shut-off valves
- Connection of dissipated chlorine
gas from the transport vehicle to
the chlorine destruction unit
Other causes:
- Liquid chlorine in vent
- Back-flow of chlorine into padding
gas system
- Valve leaks
- Control procedures on gas supplies
system to avoid over-pressurisation due
to warming
- Avoidance of possibility of inversion on
the connection between liquid and
gaseous phases
- Liquid chlorine in vent detector
(alarm/trip) to alert operator
- Increasing venting rate and
draining liquid to vented tanks
- High and low pressure alarms on
padding gas system
- Padding gas chlorine detector and
differential pressure control
Table 4.1: List of some preventative and corrective or emergency measures to avoid accidents at
loading areas of a chlor-alkali plant
In the storage area
Some standard safety measures to achieve optimum risk reduction in the storage area are:- Chlorine detection and location and rapid isolation of sources feeding a leak - Availability of at least one empty tank of sufficient capacity as an emergency spare

8/8/2019 Integrated Pollution Prevention and Control European Environment Comission
http://slidepdf.com/reader/full/integrated-pollution-prevention-and-control-european-environment-comission 79/178
Chapter 4
Chlor-Alkali Manufacturing industry 63
- Good pipework design to minimise the length of pipeline containing liquid chlorine- Limitation of the overall liquid chlorine inventory to what is really needed. A simplified
layout and a reduction in the number of valves, pipes and connections reduce the risk of leakage
- For large storage capacities, low-temperature storage at -34 °C is recommended
Storage tank hazards Examples of preventative measuresExamples of corrective or emergency
measures
- Vessel failure due to over
pressurisation (vapour padding/
inert, liquid overfill)
- Physical tank protection against over-
pressurisation or hydraulic overfill
- Maintain stock tank pressure below the
maximum allowable pressure
- Pump maximum discharge pressure less
than maximum allowable system
pressure
- Design standards of pump, pipework
and vessels
- High-pressure alarms on stock tanks
- Two independent level/weight alarms
on receiving tank
- Relief valves at appropriate settings
and capacities. It includes, in series:
a bursting disk protecting the valve
from corrosion; a detection device
giving an alarm in case of failure of
the disk; a protection against
corrosion due to back-flow of
moisture from the absorption unit. A
protective membrane may be used, or
a continuous flow of inert dry gas
may be added after the valve.
- Pump trips at high level and/or
pressure
- Pump can be tripped remotely
- Internal explosion due to build up
of NCl3
- Never allow liquid chlorine to
evaporate completely to dryness; no
branches or wells at bottom of small
tanks; brine quality control
- Internal explosion due to hydrogen - No direct connection between a
chlorine storage tank and a chlorine gas
stream containing hydrogen
- Contamination with organics - Prohibition of use of solvents or
organic drying agents
- Contamination with oil - Prohibition of use of oil or hydrocarbon
greases, use of oil-free compressors in
padding gas system
- Fire due to chlorine/iron reaction - Use of appropriate materials
- Avoidance of “hot work” areas
- No flammable liquids or materials in
the surroundings of loading areas
- Corrosion due to chlorine/water
reaction; internal corrosion
- Check tare weight of tank
- Moisture control system and avoidance
of possible back-flow
- Alarm on padding gas moisture
indicator
- Response by process operators to
evidence of ferric chloride
- Chlorine monitors on cooling
waterside of heat exchangers
- External corrosion - All stock tanks operated at temperatures
below zero insulated; fully watertightlagging where freeze/thaw conditions
exist
- Pressure vessel inspections include
selective removal of insulation to permit inspection of external surfaces
- Low temperature thermal stress - Tanks have to be stress-relieved to
prevent failure from high induced stress
- Prohibit excessive physical force on
valves
- Use of steel resilient at low temperature
(-40 °C)
- Pump failure - The pump shall be equipped with high
temperature alarm
- Pump should be bunded
- Pump design specifications respected
- Chlorine detectors close to the pump
Table 4.2: List of some preventative and corrective or emergency measures to avoid accidents
associated with storage of liquid chlorine

8/8/2019 Integrated Pollution Prevention and Control European Environment Comission
http://slidepdf.com/reader/full/integrated-pollution-prevention-and-control-european-environment-comission 80/178
Chapter 4
64 Chlor-Alkali Manufacturing industry
Main achieved risk levels
This level should tend to zero. Methodologies such as HAZOP (Hazard and Operability Study),HAZAN and QRA are designed to ensure that the operation of a chlorine installation poses anegligible risk to employees, the neighbouring public and the natural environment. The use of
checklists is also a useful methodology to reduce the risk; an example is [Gest 92/175, 1993].
Cross-media effects
Note that storage at low temperature requires deep cooling with CO2, HCFCs/HFCs or ammonia. Thus, fugitive emissions of the employed cooling agent may occur. Furthermore,low-temperature storage requires more energy than ambient storage.
Reference plants
Safety measures are well implemented in all chlorine producing plants in Europe. The options
chosen by the operator will differ, depending on the plant location (proximity of residentialareas for example), stored quantities on site and/or chlorine directly consumed in situ.
Economics
Examples are given for some applied safety measures. The choices made are of coursedependent on the specific activity:
1. General Electric Plastics in Bergen op Zoom (Netherlands) where chlorine is used for thesynthesis of phosgene. Cryogenic storage of chlorine includes:
1 tank of 58 tonnes currently in use, 1 full tank of 58 tonnes and 1 emergency tank. All tanksare kept at -34 °C and atmospheric pressure. The whole storage is contained inside a building of 8000 m3. The chlorine absorption unit is 11 m high and 1.8 m in diameter. A fan allows acontinuous venting of 5000 m3/h. The cost of the storage built in Bergen op Zoom in 1988 isestimated at about 4.3 million euros (10 million NLG, exchange rate 1998) and the maintenance
cost at about 2% of the building cost.
2. ICI in Wilhelmshaven (Germany), a large quantity chlorine storage:2 tanks of 1600 tonnes each and 1 emergency tank. Chlorine is stored in steel tanks enclosedwithin a shell constructed of a steel/polyurethane/aluminium sandwich material. This storage
was built in the 1970s and cost about 7.7 million euros (about 15 million DEM). This storagewas the solution at that time to a specific situation; today it might not have been built for such
large quantities.
3. ATOCHEM in Jarrie (Isère, France), loading area:Containment of a separated loading area (2 x 58 tonnes railway tanks), chlorine destruction unitand water spray equipment. The cost was approximately 1.5 million euros (September 1998).The cost can vary, depending on adaptations needed to existing installations.
References
[Gest 87/130, 1996], [Gest 92/175, 1993], [J. Loss Prev. Proc. Ind., March/94], [Mason, 1995]
8/8/2019 Integrated Pollution Prevention and Control European Environment Comission
http://slidepdf.com/reader/full/integrated-pollution-prevention-and-control-european-environment-comission 81/178
Chapter 4
Chlor-Alkali Manufacturing industry 65
4.1.2 The chlorine absorption unit
Description
The purpose of the chlorine destruction unit is to avoid large emissions of chlorine gas to theenvironment during irregular plant operation and/or emergencies, and to take care of all
chlorine-containing waste gases during normal operation. The most common way to destroy thechlorine is to absorb it in weak caustic soda to produce sodium hypochlorite. The absorption
system can make use of packed towers or venturi ejectors. However, packed columns, eventhough more complex, are better in case of emergency if electricity supply fails. They cancontinue to absorb chlorine from a pressure relief system using caustic soda stored in a gravity-fed head tank. The concentration of caustic soda should not exceed 22% NaOH because of therisk of salt deposition, causing blockages in the absorption plant, and freezing.
The design of an absorption system requires clear specifications of:- the maximum quantity of chlorine- the composition of the gas stream
- the maximum instantaneous flow
It is very important to ensure that in case of a major accident, a massive release of chlorinecould be absorbed. The size of the unit is of great importance and should be calculated to cope
with emergency conditions. Caustic soda supply and the storage capacity for caustic soda andhypochlorite solution should be correctly sized as well. It is essential that faults are detectedquickly and adequate instrumentation with alarms should be applied at the vent absorption plantto ensure that warning is given if equipment fails. In particular, temperature control of theabsorption solution is essential, as is measurement to prevent over-chlorination. The emergency
power supply should be tested periodically.
If the sodium hypochlorite cannot be sold, it has to be treated before it is discharged. Several
technologies are available to destroy sodium hypochlorite without generating significant cross-media effects, in particular catalytic processes.
Main achieved emission levels
Absorption units are generally designed to limit the chlorine content to below 5-10 mg/m3 inthe emitted gas in the worst case scenario. Under normal operation the concentration of chlorine is less than 1-3 mg/m3 in the case of partial liquefaction and less than 3-6 mg/m3 in the
case of total liquefaction.
Cross-media effects
When the sodium hypochlorite (bleach) produced can be sold, no cross-media effects occur,although it should be noted that the consumer might discharge free oxidants from the bleach.When there is no demand for bleach, the bleach has to be destroyed before it can be discharged.The effluent from the bleach destruction may have an adverse effect on the recipient water,
depending on the technology used (see Section 4.1.5).
Reference plants: All existing plants are equipped with emergency absorption systems.

8/8/2019 Integrated Pollution Prevention and Control European Environment Comission
http://slidepdf.com/reader/full/integrated-pollution-prevention-and-control-european-environment-comission 82/178
Chapter 4
66 Chlor-Alkali Manufacturing industry
References
[Dutch report, 1998], [Gest 76/52, 1986], [Gest 87/130, 1996], [Gest 92/169, 1994], [Le Chlore,1996], [Schubert], [Wunderlich]
4.1.3 Metal anodes
Description
In 1965, H. B. Beer presented a metal oxide coated titanium electrode which was a bigimprovement over earlier graphite anodes. The coated titanium anodes allow high currentdensity at a low voltage, are dimensionally stable and have long life. All coatings that are used
on an industrial scale are composed of an oxide of a platinum group metal (usually ruthenium)and an oxide of a nonplatinum metal group (usually titanium, tin or zirconium). Coating failuremay occur, depending on the type of cell in which the anode is operated. Lifetime of metalanodes in diaphragm cells is more than 12 years and in membrane and mercury cells 4-8 years.
In the amalgam process the unavoidable occurrence of minor short circuits, through contact
with the mercury cathode, causes gradual physical wear of the anode coating. Impurity levels in brine have to be controlled; compounds that negatively affect the metal anodes are for exampleorganic acids, fluoride and manganese. Operation in strongly alkaline brine (pH >11) may
rapidly destroy the coating, and operation with NaCl concentration so low that oxygen isevolved with the chlorine must also be avoided.
Metal anodes are used by all chlor-alkali plants in Western Europe.
Main performance characteristics
- Long lifetime- Low operating voltage- High energy efficiency- Improved process control- Reduced need for maintenance and inspection
- Reduced amounts of waste and pollution
References: [Dutch report, 1998], [Kirk-Othmer, 1991], [Ullmann’s, 1996]
4.1.4 On-site reconcentration of spent sulphuric acid
Description
Concentrated sulphuric acid (92-98%) is used to dry chlorine. Up to 20 kg of acid is consumed per tonne chlorine produced. The spent acid usually becomes a waste product or one thatrequires reprocessing. The spent acid can be used to control pH in process and waste water
streams or to destroy surplus hypochlorite. It can be returned to an acid producer for reconcentration or sold to any user who can accept this quality of acid.
Sulphuric acid can also be reconcentrated on-site in closed loop evaporators which reduces the
consumption to 0.1 kg of acid per tonne of chlorine produced. The spent sulphuric acid is
concentrated to 92-98% by indirect heating with steam. Materials used must be highlycorrosion-resistant to avoid corrosion problems, in particular if the feed acid is polluted.
8/8/2019 Integrated Pollution Prevention and Control European Environment Comission
http://slidepdf.com/reader/full/integrated-pollution-prevention-and-control-european-environment-comission 83/178
Chapter 4
Chlor-Alkali Manufacturing industry 67
On-site reconcentration in closed loop evaporators can be applied at new and existing plants.The required installation area depends on the capacity of the plant. If the acid is concentratedonly to 92%, investment cost as well as utility consumption may be reduced, as it may be possible to concentrate in a single stage.
Main achievements: Significant reduction in sulphuric acid consumption.
Cross-media effects
The concentration of sulphuric acid requires energy. Depending on the energy source used,several types of air emission may be generated (CO2 and NOx among others). Water isevaporated during the concentration. A small bleed of the acid will probably be necessary toavoid build-up of contaminants in the concentrated acid.
Reference plants
More than 50 plants worldwide have been supplied with recycling units for spent sulphuric acid by one supplier.
Economics
One supplier gives a price of around 360000 euros (700000 DEM, January 1999) for a newinstallation designed for 1000 kg/h sulphuric acid. The price depends on the customer’srequirements. The operating costs mainly depend on the energy costs.
References: Information mainly communicated by QVF Engineering GmbH.
4.1.5 Treatment of waste water containing free oxidants, including bleachdestruction
Description
The chlor-alkali industry potentially discharges waste water containing free oxidants. Freeoxidants are defined according to water analysis methods as the sum of the following
compounds: Cl2, Br 2, OCl-, OBr - and NHxBr y. This does not necessarily imply that all of thementioned compounds are actually present in waste water from chlor-alkali plants.
All water streams that have been in contact with chlorine and or bromine may contain freeoxidants. In the chlor-alkali plants these streams are:
• the bleed from the brine circuit
• the condensate from the chlorine gas cooling
• the bleach (sodium hypochlorite) produced by the chlorine absorption unit
The free oxidants can be destroyed by chemical reduction, by catalytic reduction or by thermaldecomposition. All these methods can be applied at existing and new chlor-alkali plants.
The formation of chlorates by destruction of bleach depends on the methodology used. It is also
possible to recover the chlorine by acidification of the waste hypochlorite stream. This wouldseem especially attractive to large chlorine plants when considerable amounts of spent acid areavailable (spent sulphuric acid from chlorine drying).
8/8/2019 Integrated Pollution Prevention and Control European Environment Comission
http://slidepdf.com/reader/full/integrated-pollution-prevention-and-control-european-environment-comission 84/178
Chapter 4
68 Chlor-Alkali Manufacturing industry
Chemical reduction
Chemical reduction agents such as sulphur dioxide (SO2), sodium sulphide (Na2S), sodiumsulphite (Na2SO3) or sodium thiosulphate (Na2S2O3) are used to destroy the free oxidants. Thechlorine or hypochlorite is reduced to chloride (Cl-). The choice of the chemical reducing agent
is influenced by cost, availability and ease of handling. The added chemicals in turn form a
range of sulphur oxy anions, predominantly sulphates (SO4
2-
). In some cases, hydrogen peroxide (H2O2) is used to destroy the free oxidants if chlorine concentrations are very low. Afinal treatment with H2O2 can reduce the free chlorine concentration from 300 ppm to 1 ppm of
free chlorine [Le Chlore, 1996].
The reaction with H2O2 (hydrogen peroxide) is the following: NaOCl + H2O2 → NaCl + H2O + O2
The reaction with Na2S2O3 (sodium thiosulphate) is the following:2 Na2S2O3+ NaOCl + x H2O → Na2S4O6 + NaCl + 2 NaOH + (x-1) H2O
Since the chemicals are added on a stoichiometric basis, the chemical costs can be considerable
when decomposing concentrated solutions of hypochlorite. In addition, to facilitate the reaction,sufficient residence time is required and excess chemical is used to ensure full reaction.Disposal of waste water streams with excess reducing agent can be a problem because of thehigh load of COD (chemical oxygen demand) [Kelly, 1998].
In order to control the heat of the exothermic reaction, highly diluted solutions are used to limitthe temperature to about 50 °C. For 1 kg of chlorine absorbed, 4.45 kg of reactive agent Na2S2O3 or 89 kg of diluted 5% solution is required [Le Chlore, 1996].
Catalytic reduction
The decomposition of free oxidants to chloride and oxygen can be catalysed by a nickel, iron or cobalt based catalyst, according to the following overall reaction: [M]n+
2 NaOCl → 2 NaCl + O2↑
Some systems operate with a catalyst slurry, which is blended with the waste water stream to promote the reaction, in a batch process. To avoid emissions of metals, the catalyst must beallowed to settle before the supernatant water can be discharged. The catalyst activity decreasesfrom batch to batch, although it is unclear whether this is due to deactivation of the catalyst or
loss of metal.
Other systems operate with the catalyst on a fixed bed reactor, see Figure 4.1, reducing the lossof metals and increasing the capacity (no settling required) compared to slurry type catalytic
systems. Also, the necessary concentration of catalyst is low (20 ppm), [Le Chlore, 1996].
In some cases, it is possible to recycle the effluent from the reactor back to the electrochemicalcell. It is then necessary to control the concentration of chlorate and other impurities, in
particular for membrane processes. Chlorate ion formation depends on the hypochlorite ionconcentration in the caustic scrubber recirculation liquor and the temperature in the scrubber itself.
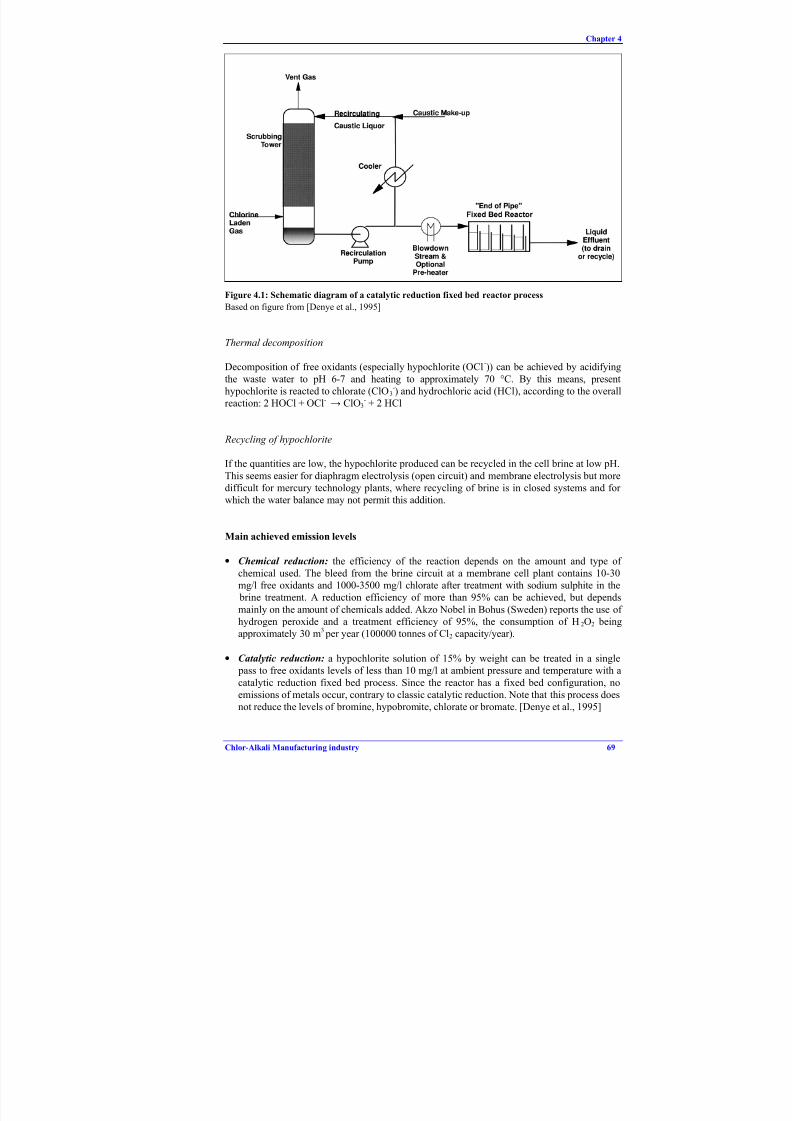
8/8/2019 Integrated Pollution Prevention and Control European Environment Comission
http://slidepdf.com/reader/full/integrated-pollution-prevention-and-control-european-environment-comission 85/178
Chapter 4
Chlor-Alkali Manufacturing industry 69
Figure 4.1: Schematic diagram of a catalytic reduction fixed bed reactor process
Based on figure from [Denye et al., 1995]
Thermal decomposition
Decomposition of free oxidants (especially hypochlorite (OCl-)) can be achieved by acidifying
the waste water to pH 6-7 and heating to approximately 70 °C. By this means, presenthypochlorite is reacted to chlorate (ClO3
-) and hydrochloric acid (HCl), according to the overallreaction: 2 HOCl + OCl-
→ ClO3- + 2 HCl
Recycling of hypochlorite
If the quantities are low, the hypochlorite produced can be recycled in the cell brine at low pH.
This seems easier for diaphragm electrolysis (open circuit) and membrane electrolysis but moredifficult for mercury technology plants, where recycling of brine is in closed systems and for which the water balance may not permit this addition.
Main achieved emission levels
• Chemical reduction: the efficiency of the reaction depends on the amount and type of chemical used. The bleed from the brine circuit at a membrane cell plant contains 10-30mg/l free oxidants and 1000-3500 mg/l chlorate after treatment with sodium sulphite in the brine treatment. A reduction efficiency of more than 95% can be achieved, but depends
mainly on the amount of chemicals added. Akzo Nobel in Bohus (Sweden) reports the use of hydrogen peroxide and a treatment efficiency of 95%, the consumption of H 2O2 beingapproximately 30 m3 per year (100000 tonnes of Cl2 capacity/year).
• Catalytic reduction: a hypochlorite solution of 15% by weight can be treated in a single pass to free oxidants levels of less than 10 mg/l at ambient pressure and temperature with a
catalytic reduction fixed bed process. Since the reactor has a fixed bed configuration, no
emissions of metals occur, contrary to classic catalytic reduction. Note that this process doesnot reduce the levels of bromine, hypobromite, chlorate or bromate. [Denye et al., 1995]

8/8/2019 Integrated Pollution Prevention and Control European Environment Comission
http://slidepdf.com/reader/full/integrated-pollution-prevention-and-control-european-environment-comission 86/178
Chapter 4
70 Chlor-Alkali Manufacturing industry
• Thermal decomposition: the destruction efficiency of hypochlorite in a Dutch chlor-alkali plant is 95%. Residual concentration in the effluent is nevertheless high and most samplesare in the range 500-2000 mg/l free oxidants [Dutch report, 1998].
Cross-media effects
• Chemical reduction leads to the formation of chloride and oxy sulphur compounds (for example SO4
2-). The amount formed depends on the amount of free oxidants to be reduced.
Because of the large number of chemical agents that may be used, this technique mayincrease the COD of the waste water.
• A potential emission of metals occurs in systems using a catalyst slurry. In systems with afixed bed configuration, no emissions of metals occur, as the catalyst is fixed in the bed. Nevertheless, the used catalyst cannot be regenerated and needs to be handled as hazardouswaste. Research is being carried out in this field.
• Thermal decomposition produces chlorate and hydrochloric acid. Depending on the amount
of bromine compounds in the treated water, bromate may also be formed.
Reference plants
• Chemical reduction:
Many plants use classic chemical reduction to remove free oxidants from the waste water streams. However, chemical costs and the production of oxy sulphur compounds may become a problem, especially in cases where large amounts of off-spec hypochlorite(bleach) have to be destroyed.
• Catalytic fixed bed reduction:Shin Etsu Chemicals, Japan, November 1993 Polifin, South Africa, June 1994 Mitsui Toatsu Company, Japan, December 1996 Solvay in Jemeppe, Belgium, June 1997
Besides the above-mentioned chlor-alkali plants, the catalytic fixed bed reduction process isused at more than 10 other industrial sites where there is a need for bleach destruction.
• Thermal decomposition:
Thermal destruction of hypochlorite is applied at Akzo Nobel Chemicals Delfzijl plant.
Economics
The cost of traditional chemical destruction of free oxidants is mainly the cost of chemicals.When the amount of free oxidants to be destroyed is low, chemical destruction might be thecheapest option.
Whenever large amounts of free oxidants have to be destroyed (for example, in bleachdestruction), catalytic or thermal destruction may be more economical.
The costs of a catalytic reduction fixed bed system will mainly depend on the quantity of
product to be treated. Operating costs include electricity for pumps and steam for heating theeffluent to 30-38 °C. One company reports a total investment of 250000 euros in 1997
8/8/2019 Integrated Pollution Prevention and Control European Environment Comission
http://slidepdf.com/reader/full/integrated-pollution-prevention-and-control-european-environment-comission 87/178
8/8/2019 Integrated Pollution Prevention and Control European Environment Comission
http://slidepdf.com/reader/full/integrated-pollution-prevention-and-control-european-environment-comission 88/178
Chapter 4
72 Chlor-Alkali Manufacturing industry
Techniques not using carbon tetrachloride can be applied to new and existing plants. HydroPolymers in Stenungsund (Sweden) stopped using CCl4 for purification purposes some yearsago. They now use a static mixer to cool the gaseous chlorine as much as possible withoutgetting any liquefaction, and then send the gaseous chlorine to the VCM-plant where NCl 3 isdecomposed at an elevated temperature. This method is a standard technique for plants with
integrated VCM production.
Main achievements
Avoid the use of carbon tetrachloride which is considered as harmful under the provisions of the Montreal Protocol.
Reference plants
Carbon tetrachloride-free chlorine liquefaction and purification processes are applied in nearly
all chlor-alkali plants in Europe.
Driving force
Emissions from leakage of CCl4 are avoided. Carbon tetrachloride-free chlorine liquefactionand purification processes do not generate discarded carbon tetrachloride which has to bedestroyed according to approved destruction processes.
Economics
To stop using CCl4 may involve a change of compressor type, depending on the chlorinetemperature.
References: [Debelle], [Gest 76/55, 1990], [Jorlöv]
4.2 Mercury cell plants
4.2.1 Overview of mercury emission abatement
This Section presents an overview of abatement of mercury emissions. Sections 4.2.1.1, 4.2.1.2,4.2.1.3 and 4.2.1.4 address in more detail the reduction of mercury emissions to air and water,
the removal of mercury from products and the treatment of mercury-containing wastesrespectively.
Description
There are currently approximately 12000 tonnes of mercury contained in mercury cells used for chlorine production in the EU. This is based on an average of 1.8 kg of mercury per tonneannual chlorine capacity and an EU mercury cell chlorine capacity of 6.7 million tonnes
chlorine per year. During the operation of mercury cells, mercury losses occur to air, water,
products and wastes. Although emissions have been greatly reduced, it is understood fromcomparing performances of applied abatement techniques that improvements are still possible.
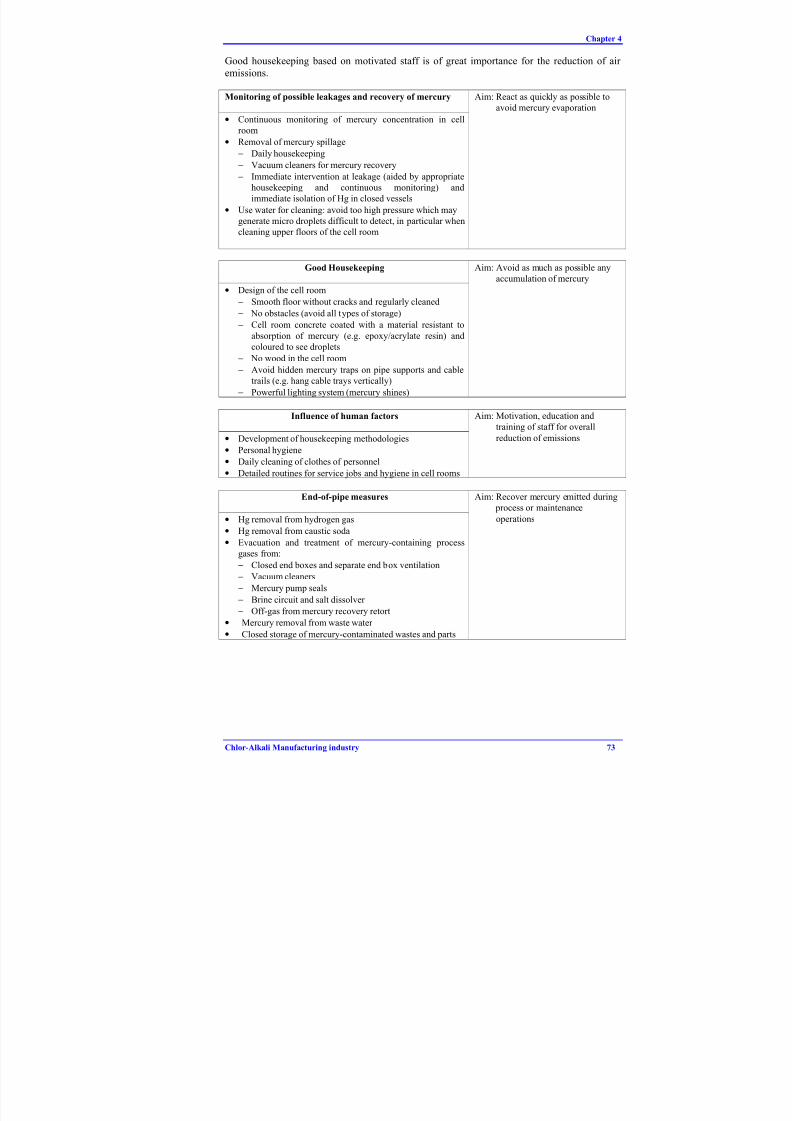
8/8/2019 Integrated Pollution Prevention and Control European Environment Comission
http://slidepdf.com/reader/full/integrated-pollution-prevention-and-control-european-environment-comission 89/178
Chapter 4
Chlor-Alkali Manufacturing industry 73
Good housekeeping based on motivated staff is of great importance for the reduction of air emissions.
Monitoring of possible leakages and recovery of mercury Aim: React as quickly as possible to
avoid mercury evaporation
• Continuous monitoring of mercury concentration in cell
room
• Removal of mercury spillage
− Daily housekeeping
− Vacuum cleaners for mercury recovery
− Immediate intervention at leakage (aided by appropriate
housekeeping and continuous monitoring) and
immediate isolation of Hg in closed vessels
• Use water for cleaning: avoid too high pressure which may
generate micro droplets difficult to detect, in particular when
cleaning upper floors of the cell room
Good Housekeeping
• Design of the cell room
− Smooth floor without cracks and regularly cleaned
− No obstacles (avoid all types of storage)
− Cell room concrete coated with a material resistant to
absorption of mercury (e.g. epoxy/acrylate resin) and
coloured to see droplets
− No wood in the cell room
− Avoid hidden mercury traps on pipe supports and cable
trails (e.g. hang cable trays vertically)
− Powerful lighting system (mercury shines)
Aim: Avoid as much as possible any
accumulation of mercury
Influence of human factors Aim: Motivation, education andtraining of staff for overall
• Development of housekeeping methodologies
• Personal hygiene
• Daily cleaning of clothes of personnel
• Detailed routines for service jobs and hygiene in cell rooms
reduction of emissions
End-of-pipe measures Aim: Recover mercury emitted during
process or maintenance
• Hg removal from hydrogen gas
• Hg removal from caustic soda
• Evacuation and treatment of mercury-containing process
gases from:− Closed end boxes and separate end box ventilation
− Vacuum cleaners
− Mercury pump seals
− Brine circuit and salt dissolver
− Off-gas from mercury recovery retort
• Mercury removal from waste water
• Closed storage of mercury-contaminated wastes and parts
operations

8/8/2019 Integrated Pollution Prevention and Control European Environment Comission
http://slidepdf.com/reader/full/integrated-pollution-prevention-and-control-european-environment-comission 90/178
Chapter 4
74 Chlor-Alkali Manufacturing industry
Process-integrated measures
• During normal operation Aim: Avoid opening of cells
− Use of salt with low impurity content
− Verify and clean the inter-cell buss for good current
distribution
− Monitoring of mercury pressure More constant operation of cells and
less waste produced− Mercury flow meter More constant operation of cells and
less waste produced
− Optimum quantity of mercury in cells
− Adjustable anodes over different segments of the cell
Lower frequency of opening of cells
for removal of Hg butter
− Computerised control of electrode gap, current and
voltage
Less heat development, lower Hg
emissions
− Consider graphite reactivation without opening
decomposer (for example: sodium molybdate treatment,
ferric sulphate treatment, cobalt treatment)
Increase carbon life in the decomposer
− Computer data base system for tracking life of cell
components
Coordinate changes and repair with
the opening of the cell
• During operations that require opening of the cells Aim:Reduce Hg evaporation and get
better control of Hg emitted
− Detailed routines and planning for dismantling of cells
− Cells cooled prior to and during opening
− Reduce duration of cell opening:
∗ Replacement parts available
∗ Manpower available
∗ If practical, spare decomposer completely assembled
with carbon
− Cell bottom cleaned and covered during repair
− Dedicated areas for maintenance and repair or mobile
screening with suction ducts led to Hg removal
− Avoid the use of rubber hoses to transfer mercury
because of difficulty of decontamination
− Stepping into the cell bottom should be minimised since
decontamination of boots is difficult
− In case of interruption of operation, all parts that might
evaporate mercury should be covered
The overall loss of mercury from a plant depends on the combined effectiveness of all themeasures taken. Apart from the above-mentioned measures, other parameters also influencemercury losses:
− number and size of cells− design of cells
− lay out of cell room (number of floors for example)
− current density and distribution
− electricity prices and associated (daily) modifications in production rate
− brine quality
− anode lifetime.
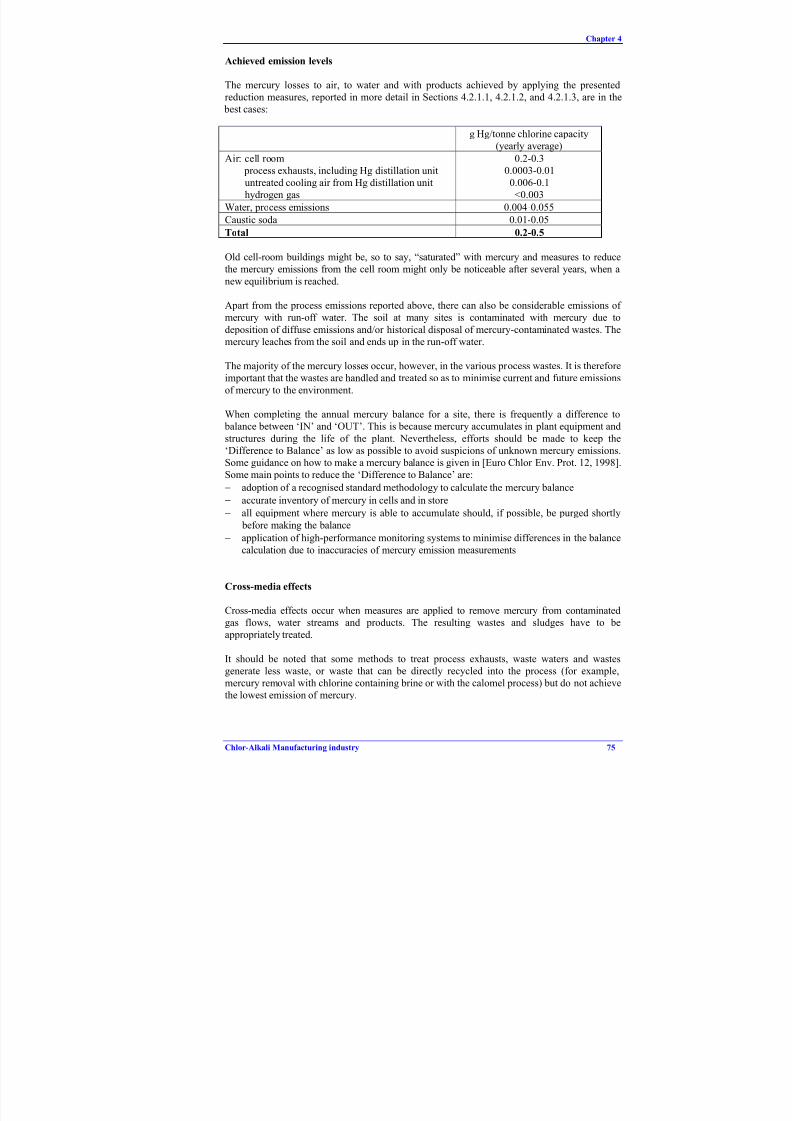
8/8/2019 Integrated Pollution Prevention and Control European Environment Comission
http://slidepdf.com/reader/full/integrated-pollution-prevention-and-control-european-environment-comission 91/178
Chapter 4
Chlor-Alkali Manufacturing industry 75
Achieved emission levels
The mercury losses to air, to water and with products achieved by applying the presentedreduction measures, reported in more detail in Sections 4.2.1.1, 4.2.1.2, and 4.2.1.3, are in the best cases:
g Hg/tonne chlorine capacity(yearly average)
Air: cell room process exhausts, including Hg distillation unituntreated cooling air from Hg distillation unithydrogen gas
0.2-0.30.0003-0.010.006-0.1<0.003
Water, process emissions 0.004-0.055
Caustic soda 0.01-0.05
Total 0.2-0.5
Old cell-room buildings might be, so to say, “saturated” with mercury and measures to reducethe mercury emissions from the cell room might only be noticeable after several years, when a
new equilibrium is reached.
Apart from the process emissions reported above, there can also be considerable emissions of mercury with run-off water. The soil at many sites is contaminated with mercury due to
deposition of diffuse emissions and/or historical disposal of mercury-contaminated wastes. Themercury leaches from the soil and ends up in the run-off water.
The majority of the mercury losses occur, however, in the various process wastes. It is thereforeimportant that the wastes are handled and treated so as to minimise current and future emissions
of mercury to the environment.
When completing the annual mercury balance for a site, there is frequently a difference to balance between ‘IN’ and ‘OUT’. This is because mercury accumulates in plant equipment and
structures during the life of the plant. Nevertheless, efforts should be made to keep the‘Difference to Balance’ as low as possible to avoid suspicions of unknown mercury emissions.Some guidance on how to make a mercury balance is given in [Euro Chlor Env. Prot. 12, 1998].Some main points to reduce the ‘Difference to Balance’ are:
− adoption of a recognised standard methodology to calculate the mercury balance
− accurate inventory of mercury in cells and in store
− all equipment where mercury is able to accumulate should, if possible, be purged shortly
before making the balance
− application of high-performance monitoring systems to minimise differences in the balance
calculation due to inaccuracies of mercury emission measurements
Cross-media effects
Cross-media effects occur when measures are applied to remove mercury from contaminatedgas flows, water streams and products. The resulting wastes and sludges have to beappropriately treated.
It should be noted that some methods to treat process exhausts, waste waters and wastesgenerate less waste, or waste that can be directly recycled into the process (for example,mercury removal with chlorine containing brine or with the calomel process) but do not achieve
the lowest emission of mercury.

8/8/2019 Integrated Pollution Prevention and Control European Environment Comission
http://slidepdf.com/reader/full/integrated-pollution-prevention-and-control-european-environment-comission 92/178
Chapter 4
76 Chlor-Alkali Manufacturing industry
Reference plants
The success of the measures depends on a number of factors, which are described above. Itappears that plants built in the 1970s took the abatement of mercury emissions intoconsideration from the beginning. Two plants that reported very low emissions of mercury in
1997 are (See Table 4.3 and Table 4.4):
• Akzo Nobel in Bohus (Sweden), two cell rooms commissioned in 1960 and 1969• Hydro Polymers in Stenungsund (Sweden), commissioned in 1969
These low emissions are achieved by implementing a large number of measures and by havingworked continuously to lower the emissions during the last 20 years.
Driving force
The driving force can be either a requirement by the authorities to reduce mercury emissions or the operator´s own initiative.
Economics
It is very difficult to make an assessment of the costs associated with minimising mercury
losses. However, it appears that companies still seem to prefer investing in measures to reducemercury emissions to changing to mercury-free technology. Efforts are today concentrated onreducing emissions to air.
References
[Akzo Nobel, 1998], [Blomgren], [Debelle], [Dutch report, 1998], [Euro Chlor Env. Prot. 11,1998], [Euro Chlor Env. Prot. 12, 1998], [Euro Chlor report, 1997], [Gest 93/187, 1993],
[Grunden], [Hydro Polymers, 1998], [UBA (D), 1997], [USEPA, 1998]

8/8/2019 Integrated Pollution Prevention and Control European Environment Comission
http://slidepdf.com/reader/full/integrated-pollution-prevention-and-control-european-environment-comission 93/178
Chlor-Alkali Manufacturing industry
Mercury source Measures Hg-level after
measures
Flow
General Education and training
Mercury monitoring (continuous)
Detailed routines for service
-
Process optimisation Dimensionally Stable Anodes
Computerised control of current and voltageMercury flow meter
Use of vacuum crystallised salt
-
Cell room Improved sealing of equipment
Closing and suction of end boxes
Acrylate resin floor
Immediate removal of spillage
Cell cooling during maintenance
2-8 µg/m3
in cell room 300000 - 600000 Nm3/h
22500 - 45000 Nm3/t Cl
NaOH-treatment Filtration with activated carbon 5-10 µg/l 50% NaOH 1.128 tonne 100% NaOH
H2-treatment Activated carbon filtration < 0.01 mg/Nm3 H2 311 Nm3 H2/t Cl2
Process gas treatment, including:
• Vacuum cleaner
• Depleted precoat drying
Activated carbon filtration. Note that end
boxes are connected to chlorine and hydrogen
treatment.
< 1 µg/Nm3 air 20 Nm3/minute when us
vacuum cleaner.
Waste water treatment Treatment with hydrazine followed by
sedimentation, sand filtration and activated
carbon filtration
< 20 µg/l water
0.5 kg Hg per year
<30000 m3/year
Waste treatment (regular) No treatment on site. The caustic filter residue
and the waste water sludge are stored for
treatment in a distillation unit off site. The
amount of recovered Hg is unknown. Brine
filtration sludge is landfilled.
Brine filtration sludge:
21.3 tonnes, with 1.8 kg
Caustic filter residue:
3 tonnes with appr. 800
Waste water sludge:
4 tonnes with appr. 200
Off-gas from mercury waste storage Untreated n/a n/a
Irregular waste Untreated n/a n/a
Total emissions
Hydro Polymers, Stenungsund, Sweden: Capacity 114000 tonne Cl2 per year; 64 electrolysers of Uhde design (15 m2); commissioned 1
second floor. The first floor is coated with an acrylate resin.
Table 4.3: Overview of measures, corresponding mercury levels and emissions from the Hydro Polymers (Stenungsund, Sweden
Table based on table 29 in [Dutch report, 1998] and information from: [Hydro Polymers, 1998], [Stenhammar]

8/8/2019 Integrated Pollution Prevention and Control European Environment Comission
http://slidepdf.com/reader/full/integrated-pollution-prevention-and-control-european-environment-comission 94/178
Chapter 4
78
Mercury source Measures Hg-level after measures Flow
General Education and training
Mercury monitoring (continuous)
Detailed routines for service
-
Process optimisation Dimensionally Stable Anodes
Computerised control of current and voltageMercury flow meter
Use of vacuum crystallised salt
-
Cell room Improved sealing of equipment
Closing and suction of end boxes
Cells are connected to vacuum system
Acrylate and epoxy resin floor
Immediate removal of spillage
Cell cooling during maintenance
5-10 µg/m3
in cell room 400000 – 600000 Nm
35000 - 50000 Nm3/
NaOH-treatment Filtration with activated carbon 5-10 µg/l 50% NaOH 1.128 tonne 100% Na
H2-treatment Scrubbing with chlorinated brine
Filtration with activated carbon
0.01 mg/Nm3 H2 311 Nm3 H2/t Cl2
Process gas treatment, including:• End box ventilation
• Vacuum cleaner
• Mercury pump seals and
• Storage of untreated waste
Filtration with activated carbon, in threedifferent systems. The mercury pumps have
been replaced by mechanical sealed pumps,
which allows the use of the carbon filter for
common purposes.
µg/Nm3 air 4
1
0.5 (pump seals and
storage)
Nm3/hr 2500
500
950 (pump seals and
storage)
Waste water treatment Treatment with hydrazine, sedimentation,
sand filtration, carbon filter and ion exchange
Run-off water not treated
5-8 µg/l water 7 m3/hr
Waste treatment (regular) Stored in drums and removed << 500 mg/kg waste Brine sludge: 1600 k
Caustic sludge: 200 k
WWT sludge: 1500
Irregular waste n/a n/a n/a
Total emissions
Akzo Nobel, Bohus, Sweden: Capacity 100000 tonne Cl2 per year; 54+12 electrolysers of Uhde in EKA design; commissioned 1960 an
cell rooms (only one cell room since 27 August 1999).
* 30 kg Hg according to periodical measurements (4 samplings per year). 40 kg Hg according to the continuous monitoring programm
Table 4.4: Overview of measures, corresponding mercury levels and emissions from the Akzo Nobel (Bohus, Sweden) mercury
Table based on table 30 in [Dutch report, 1998] and information from: [Akzo Nobel, 1998], [Stenhammar]

8/8/2019 Integrated Pollution Prevention and Control European Environment Comission
http://slidepdf.com/reader/full/integrated-pollution-prevention-and-control-european-environment-comission 95/178
8/8/2019 Integrated Pollution Prevention and Control European Environment Comission
http://slidepdf.com/reader/full/integrated-pollution-prevention-and-control-european-environment-comission 96/178
Chapter 4
80 Chlor-Alkali Manufacturing industry
Influence of season and climate on cell room emissions
This is a much discussed topic. From discussions during a visit to plants in Sweden, thefollowing picture was given and is also supported in [Dutch report, 1998]:
• The emissions from the cell room are mainly caused directly and indirectly by leakage fromthe equipment.
• Spilled mercury may be deposited in the building (in concrete, steel, wood etc.) and mayevaporate a long time after the actual spilling has taken place (“mercury memory”).
• There are no reasons to assume that leakage from the equipment is dependent on the ambienttemperature. The operational temperature of the equipment itself and the state of the art of the equipment are much more important in this respect.
• When the ambient temperature is high (mainly in summer), the ventilation flow is higher in
order to maintain an acceptable temperature in the cell room (max. 40 °C). At highventilation flow rates, the evaporation of spilled mercury is more rapid and thus there is lesstime to remove spillage.
Thus, it can be concluded that a seasonal and climatic effect does exist, but applies only tomercury that is released into the cell room, either directly by spillage or indirectly from the“mercury memory” of the cell room. This means that the seasonal and climatic effect becomesless important when the amount of leakage is reduced and when the historical mercury level inthe building is low.
Removal of mercury from the process exhausts
Process exhausts refer to all gaseous streams by which mercury can be emitted to theatmosphere apart from the cell room ventilation air and the hydrogen gas. The waste gases can be collected and treated together. The main sources are end boxes and mercury pump sealvents. Vacuum cleaners are usually connected to a separate ventilation system.
Adsorption on impregnated activated carbon
Description: Mercury contained in the waste gas is removed by adsorption on activated carbonimpregnated with sulphur or iodine.
Achieved levels: A lot of examples are available and indicate a specific emission of mercuryclose to zero. Solvay in Roermond (Netherlands) was achieving a concentration level of less
than 0.003 mg Hg/m3 air, corresponding to less than 0.001g Hg/tonne chlorine capacity (the plant was shut down in the end of 1999). Akzo Nobel in Bohus (Sweden) reported an emissionof 0.03 kg Hg with process exhausts for 1997, corresponding to 0.0003 g Hg/tonne chlorinecapacity (no mercury recovery retort). Solvay in Martorell (Spain) reports an emission level of
0,01 g Hg/tonne chlorine capacity. Note that a contaminated waste is generated.
Calomel reaction
Description: Mercury contained in the waste gas is converted to Hg2Cl2 (calomel) by addingchlorine. Hg2Cl2 is then absorbed in a packed column. The tower packing can be regeneratedusing chlorine-containing brine, which is recycled to the mercury cell brine cycle.
Achieved level: The residual mercury concentration is reported to be 0.05-0.1 mg/m 3, which
corresponds to an emission of 0.006-0.01 g Hg/tonne chlorine capacity [UBA (D), 1997].However, it has been reported by ICI that the removal of the calomel from the exhaust gas

8/8/2019 Integrated Pollution Prevention and Control European Environment Comission
http://slidepdf.com/reader/full/integrated-pollution-prevention-and-control-european-environment-comission 97/178
Chapter 4
Chlor-Alkali Manufacturing industry 81
stream is not always satisfactory when using a simple fluidised scrubber system and could leadto harmful emissions of mercury to air.
Cost: The cost has been estimated to 1.3 euros (2.58 DEM) per tonne chlorine capacity for a
plant with a capacity of 100000 tonnes chlorine per year and a waste gas volume of 2000 m 3/h[UBA (D), 1997].
Scrubbing with chlorinated brine or hypochlorite
Description: Generally, such processes involve packed columns with a countercurrent flow of hypochlorite or chlorinated brine. By scrubbing with chlorine-containing brine HgCl2 is
produced forming a mercury-chlorine complex in the brine. The chlorine has to be removed andthe brine can be recirculated. By scrubbing with alkaline hypochlorite solution, the mercurycontained in the process exhausts is oxidised as well but no subsequent chlorine removal isnecessary. The cleaned gas needs to pass through a separator to remove entrained liquiddroplets. The mercury is recirculated via the brine.
Achieved level by BASF in Antwerp (Belgium): mercury concentration in the process gas was50 ppb in 1997 (top of the absorption tower) corresponding to an emission of 0.023 g Hg per tonne chlorine capacity, and 20 ppb in 1998 (monthly averages). All gases are treated in an
absorption tower. The first Section is used to neutralise the chlorine in the gas by transformingit into hypochlorite. The mercury in the waste gas is partly absorbed by the hypochlorite in thefirst Section of the tower; no absorption takes place in the upper Section of the tower because itdoes not contain hypochlorite. The technique consists of adding hypochlorite to NaOH in the
upper Section. The higher efficiency of the absorption in 1998 was due to an increase of hypochlorite in the tower.
Cost: The cost has been estimated at approximately 0.9 euros (1.74-1.77 DEM) per tonne
chlorine capacity for a plant with a capacity of 100000 tonnes chlorine per year and a waste gasvolume of 2000 m3/h, using a scrubbing process with chlorine-containing brine or alkalinehypochlorite solution to achieve a residual mercury concentration of 0.05-0.1 mg/m3, whichcorresponds to an emission of 0.006-0.01 g Hg/tonne chlorine capacity [UBA (D), 1997].
Removal of mercury from the hydrogen gas
The equilibrium mercury concentration in hydrogen gas is a function of temperature and
pressure. The hydrogen gas stream leaving the denuder is at a temperature of 90-130 °C andnearly saturated with mercury vapour (up to 400 mg/m3). Most of the mercury is condensed outand collected by cooling the gas stream down in one or more stages. The cooling step isnormally followed by adsorption on activated carbon impregnated with sulphur or iodine, but
other techniques are also reported.
Scrubbing with chlorinated brine or hypochlorite
Description: As above in the section about removal of mercury from the process exhausts. AtAkzo Nobel in Bohus (Sweden) the hydrogen gas is scrubbed with chlorinated brine before theadsorption on activated carbon.
Achievable level: No information.
Cost: No information.

8/8/2019 Integrated Pollution Prevention and Control European Environment Comission
http://slidepdf.com/reader/full/integrated-pollution-prevention-and-control-european-environment-comission 98/178
Chapter 4
82 Chlor-Alkali Manufacturing industry
Adsorption on impregnated active carbon
Description: Mercury contained in hydrogen is removed by adsorption on activated carbonimpregnated with sulphur or iodine, leaving a mercury concentration in hydrogen gas of 0.002-0.015 mg/m3 [Ullmann’s, 1996]. Note that a contaminated waste is generated.
Achievable level: A lot of examples are available in Europe and this technique is increasinglyapplied because mercury from hydrogen is an important source of emission. Solvay in Antwerp(Belgium) reports a concentration of around 0.01 mg Hg/m3 hydrogen gas for a maximum flow
of 8000 m3/h, corresponding to a maximum residual emission of 0.003 g Hg/tonne Chlorinecapacity. Suppliers guarantee a concentration of 0.005 mg Hg/m3.
Cost: Atochem in Lavera (France) installed a sulphurised active carbon system in 1997 to
remove mercury from hydrogen gas. The plant has a mercury process chlorine capacity of 166000 tonnes. The total cost reported is in the range of 0.45-0.5 million euros, including theheat exchanger necessary to increase the temperature after the cooling step to 20-25 °C, theequipped tower and the necessary filters. The sulphurised active carbon needs to be changed
every 2-3 years. Its lifetime can be longer, depending on the efficiency of the cooling step,
which influences the mercury concentration in the hydrogen gas.
Chemical reaction with cupric oxide
BASF in Antwerp (Belgium) reports the use of a chemical reaction with CuO after the coolingstep in order to absorb mercury. The average concentration achieved with the technique is 10 ppb after treatment, corresponding to an emission level of 0.003 g Hg/tonne chlorine capacity.
Adsorption on copper/aluminium or silver/zinc oxides
By adsorption on copper/aluminium oxide or silver/zinc oxide a mercury concentration of lessthan 0.001 mg Hg/m3 hydrogen gas could be achieved [Ullmann’s, 1996].
4.2.1.2 Reduction of mercury emissions to water
Mercury-containing waste water streams in the chlorine plant mainly arise from:
Process: bleed from brine purification; condensate and wash liquor from treatment of chlorine;hydrogen drying; filtered caustic liquor; brine leakages and ion-exchange eluate from processwater treatment
Wash water from cell cleaning operations: inlet and outlet boxes
Rinsing water from the cell room: cleaning of the floors, tanks, pipes and dismantled apparatus
Most of these streams can be recycled into the process, but the bleed from brine purificationand the rinsing water do generally need to be treated and discharged. The waste water contains
metallic mercury and mercury compounds such as mercury chloride as well as magnesiumhydroxide, ferric hydroxide and calcium carbonate.
There can also be considerable emissions of mercury with run-off water. The soil at many sites
is contaminated with mercury due to deposition of diffuse emissions and/or historical disposalof mercury contaminated wastes. The mercury leaches from the soil and ends up in the run-off water.

8/8/2019 Integrated Pollution Prevention and Control European Environment Comission
http://slidepdf.com/reader/full/integrated-pollution-prevention-and-control-european-environment-comission 99/178
Chapter 4
Chlor-Alkali Manufacturing industry 83
At an integrated site, different values can be reported from the chlorine plant unit and from thecentral waste water treatment plant. It is recommended that the mercury level in the waste water be continuously monitored.
Description
The first step to reduce the mercury emissions to water is to reduce the amount of waste water
to be treated. A waste water rate of 0.3-1.0 m3/tonne of chlorine is reported to be achievable in[Ullmann’s, 1996]. The discharge of process water at Solvay in Roermond (Netherlands) was0.18 m3/tonne chlorine capacity in 1996, a specific volume reduction of more than 90%compared to the 1970s [Dutch report, 1998].
The mercury level in waste water is usually reduced in several steps by a combination of techniques. Several examples of waste water treatments are given in the achievable levelsection below.
Achievable level
At Hydro Polymers in Stenungsund (Sweden) the waste water mercury removal system consists
of treatment with hydrazine, sedimentation, sand filters and activated carbon filters. Theresultant mercury concentration in the waste water was less than 20 µg/l in 1997, correspondingto an emission of 0.004 g Hg/tonne chlorine capacity.
At Akzo Nobel in Bohus (Sweden) the waste water mercury removal system consists of amixing unit where hydrazine is added to the waste water, two sedimentation tanks, sand filters,activated carbon filters and ion exchange filters. The treated waste water flow was 7 m3/h witha mercury content of 3000-5000 µg/l in 1997 and the resultant mercury concentration in the
waste water was 5-8 µg/l, corresponding to an emission of 0.005 g Hg/tonne chlorine capacity.The total mercury emission to water from the site is approximately 0.045 g Hg/tonne chlorinecapacity, which means that about 10% of the mercury emissions are process emissions and theother 90% are emissions from deposited/disposed mercury ending up in the run-off water.
At Solvay in Roermond (Netherlands) the waste water mercury removal system consisted of sedimentation of solid mercury and chemical precipitation with sulphide (NaHS). The treatedwaste water flow was around 3 m3/h and the resultant mercury concentration in the waste water was about 30 µg/l, corresponding to an emission of 0.005 g Hg/tonne chlorine capacity. The
total mercury emission to water from the site was approximately 0.1 g Hg/tonne chlorinecapacity, which means that about 5% of the mercury emissions were process emissions and theother 95% were emissions from deposited/disposed mercury ending up in the run-off water.(The plant was shut down in the end of 1999)
At ICI in Wilhelmshaven (Germany) the waste water mercury removal system consists of chemical precipitation of mercuric sulphide followed by filtration. The treated waste water flowis around 15 m3/h (reported levels of AOX: 0.5-3 mg/l and COD: 50 mg/l), and the resultant
mercury concentration in the waste water is about 4 µg/l, corresponding to an emission of 0.006-0.008 g Hg/tonne chlorine capacity.
At Tessenderlo Chemie in Tessenderlo (Belgium) the waste water mercury removal systemconsists of chemical precipitation with sulphide (NaHS) followed by filtration with a precoated
filter. The resultant mercury (HgS) concentration in the waste water is 10-15 ppb and the total
emission to water from the site is 0.01-0.02 g Hg/tonne chlorine capacity.
8/8/2019 Integrated Pollution Prevention and Control European Environment Comission
http://slidepdf.com/reader/full/integrated-pollution-prevention-and-control-european-environment-comission 100/178
Chapter 4
84 Chlor-Alkali Manufacturing industry
At Akzo in Hengelo (Netherlands) the waste water mercury removal system consists of sedimentation of solid mercury and ion exchange filters. The treated waste water flow wasaround 8 m3/h in 1997 and the resultant mercury concentration in the waste water was about 50µg/l, corresponding to an emission of 0.05 g Hg/tonne chlorine capacity. The total mercuryemission to water from the site was 0.11 g Hg/tonne chlorine capacity, which means that about
50% of the mercury emissions are process emissions and the other 50% are emissions from
deposited/disposed mercury ending up in the run-off water.
At BASF in Antwerp (Belgium) the waste water mercury removal system consists of a reducing
step with hydroxylamine, followed by filtration and activated carbon filters. The mercuryemission from waste water is 0.055 g Hg/tonne chlorine capacity.
A mercury removal system proposed by suppliers, De Nora for example, consists of oxidation
with chlorine to mercurous chloride (Hg2Cl2), followed by adsorption on an ion exchangemedium. Elutriation is done with hydrochloric acid (HCl), which is then used to acidify the brine. All waste water is collected and treated with hypochlorite solution (OCl ) to oxidise themetallic mercury. The pH value is adjusted with HCl and the waste water is treated with a small
excess of sodium sulphite, in order to eliminate the chlorine introduced. Activated carbon is
necessary inside the dechlorination tower to eliminate the remaining traces of chlorine, whichare harmful to the mercury adsorbing resin. The acidic chlorine-free waste water enters the ionexchangers placed in series, filled with thyolic resin, reducing the mercury content of the water to below 5 µg Hg/l. The resin must be regenerated every now and then with concentrated HCl
acid. The mercury-containing eluate is recovered in the brine system and used in thedechlorination/acidification of the circulating brine.
4.2.1.3 Removal of mercury from caustic soda
The (approximately 50%) caustic soda leaving the mercury cells usually contains metallic
mercury in the range of 2.5 to 25 mg/l, depending on the type of denuders and temperature. For some applications very pure sodium and potassium hydroxide are needed.
Description: The predominant technique to reduce mercury levels in caustic soda is byactivated carbon filtration in precoated candle or plate filters. On a special carbon precoat, themercury is absorbed and is discharged from the filter as a dry cake. This technique guarantees a
maximum of mercury content in 50% caustic of 0.05 ppm if the content before filtration is inthe range of 5-20 ppm of mercury. It has been installed in many chlor-alkali plants. It isreported in [Dutch report, 1998] that the caustic filtration unit is sensitive to flow rate changesand that low mercury levels are only achieved during undisturbed operational conditions. Notethat the activated carbon filtration generates mercury-contaminated waste. The discharged filter
cakes can be subjected to distillation to recover the mercury.
Achievable level: Hydro Polymers in Stenungsund and Akzo Nobel in Bohus (Sweden) bothreport for 1997 a residual mercury concentration in caustic of 5-10 µg/l 50% NaOH,
corresponding to a mercury loss of 0.01-0.02 g Hg/tonne chlorine capacity. Akzo in Hengelo(Netherlands) reports for 1997 a residual mercury concentration in caustic of 40-60 µg/kg 100% NaOH, corresponding to a mercury loss of 0.03-0.05 g Hg/tonne chlorine capacity.
Cost: The price of one 15 m2 filter is about 0.125 million euros and its installation, including alloperating instruments is around 0.25 million euros (source: FUNDAR filter). It should be notedthat the reported mercury concentrations in caustic above at Hydro Polymers in Stenungsundand Akzo Nobel in Bohus (Sweden) are achieved with filter areas of 100-150 m 2 (100000-
120000 tonnes of chlorine/year).

8/8/2019 Integrated Pollution Prevention and Control European Environment Comission
http://slidepdf.com/reader/full/integrated-pollution-prevention-and-control-european-environment-comission 101/178
Chapter 4
Chlor-Alkali Manufacturing industry 85
4.2.1.4 Treatment of mercury-containing wastes, including recovery of mercury
The various processes already described for the treatment of mercury-contaminated gaseous,liquid and product streams give rise to mercury-contaminated solid wastes. Additionally, thereare maintenance, construction and demolition solid wastes which also may contain mercury.
Prior to treatment of the wastes, it is essential to characterise each waste by type, chemical stateand mercury concentration. Preferably, the characterisation should be done by assay; however, by their nature, solid wastes are non-homogeneous, making sampling difficult. This may result
in estimates having to be made. The materials range from semi-solid sludges from water, brineand caustic treatment, graphite and active carbon from gas treatment, residues from retortingand mercury in tanks/sumps to miscellaneous contaminated metallic equipment, sometimeslined with organic materials such as rubber. The mercury may be present both as metallic
mercury and as inorganic compounds. Table 4.5 shows available treatment possibilities for mercury-containing wastes.
Recycle or recovery techniques Disposal
techniques
Physical/mechanical
treatment *
WashingChemicaltreatment
DistillationLandfill or
underground
storage
Maintenancematerials
Solids from water & brine treatment
Solids from caustictreatment
Solids from gas
treatment; graphitefrom decomposers
Solids from retorts
NotesMetallic mercury
recovered directly from
treatment
For distillationresidues, see
“Solids fromretorts”
* includes cryogenic and thermal options
Table 4.5: Treatment possibilities for mercury-containing wastes
[Euro Chlor]
A waste management plan should be drawn up at each plant after consultation with the
appropriate authorities. It should include:
− the routines and records necessary to follow the recommended procedures
− a description of the different types of wastes that are generated and ways to minimise wastegeneration
− methods for quantification of the types of waste
− storage procedures for different types of waste
− treatment procedures including stabilisation and final destination of wastes. Any waste
treatment and disposal off-site should be described
− methods and frequencies for sampling and analysis before and after waste treatment.

8/8/2019 Integrated Pollution Prevention and Control European Environment Comission
http://slidepdf.com/reader/full/integrated-pollution-prevention-and-control-european-environment-comission 102/178
Chapter 4
86 Chlor-Alkali Manufacturing industry
The choice of equipment, materials and processes and methods of operation should aim atwaste reduction and mercury should be recycled wherever possible within the process.
Table 4.6 shows some available techniques for treatment of mercury-containing wastes,described in more detail below, with typical performances and with references given to other
sections of this document where waste generation and treatments are described.
Waste type
(References)
Characteristics/
Typical Amounts
Hg content before
treatment
Treatment Final mercury
content (mg/kg)
Brine sludge
(3.1.2.2.2,
3.1.2.5.2.3)
Inorganic waste
Up to 20 000 g/t
Cl2 depending on
salt quality
<150 mg/kg Landfilled after
stabilisation
Waste water
treatment sludge
(3.1.2.2.2, 4.2.1.2)
Activated carbon
50-400 g/t Cl2
10-50 g/kg Distillation
Landfilled after
stabilisation
Hg recovered
<10 in residue
Carbon sludge from
caustic filtration
(3.1.2.5.4, 4.2.1.3)
Activated carbon
20-50 g/t Cl2
150-500 g/kg Distillation
Landfilled after
stabilisation
Hg recovered
20-200 in residue
Decomposer carbon Activated carbon
10-20 g/t Cl2
10-100 g/kg Distillation
Landfilled after
stabilisation
Hg recovered
20-200 in residue
Filters from gaseous
exhausts
(3.1.2.5.5, 4.2.1.1)
Activated carbon
10-20 g/t Cl2
100-200 g/kg Chemical treatment
Landfilled after
stabilisation
Hg recovered
20-200 in residue
Sludges from storagetanks, sumps etc
Can containconsiderable
amounts
Often high mercurycontent
Distillation Hg recovered
Rubberlining Variable Variable Acid bath, cryogenic
and/or washing
Incineration
300
Coated metallic
materials
Contamination of
surface
Usually <0.1% Thermal, cut and
washed, or cryogenic
Steel/iron
construction parts
Amounts vary Non-homogeneous
Usually <1%
Acid bath
Sold as scrap
<5-10
Concrete and other
construction waste
Amounts vary Non-homogeneous
Usually <0.1%
Landfilled as
hazardous waste or
as other waste
depending on
content
>10
< 10
Table 4.6: Some available techniques with typical performances for treatment of mercury
containing wastes
[Euro Chlor], [Stenhammar]
The legislation with regard to mercury-containing waste differs from country to country. Some
countries do not have mercury recovering retorts and store all the waste either in undergrounddeposits such as mines or in secure landfills. This also influences the way the mercury-containing waste is treated, handled, counted and reported.
8/8/2019 Integrated Pollution Prevention and Control European Environment Comission
http://slidepdf.com/reader/full/integrated-pollution-prevention-and-control-european-environment-comission 103/178
Chapter 4
Chlor-Alkali Manufacturing industry 87
Brine sludge
If a residual quantity of chlorine is left in the brine when it leaves the cell, the mercury willremain in a soluble ionic form. Thus, when the brine is filtered to remove the precipitated
impurities, the only mercury contamination is from the soluble mercury in the mother liquor trapped within the filter cake. This can be removed by washing the cake prior to discharge.
There would therefore be very little mercury in the final solids which can be disposed of tonormal landfill. In certain cases, because of the materials the plant is made of, it is not possible
to maintain a chlorine excess in the brine circuit. In such circumstances it may be possible towash the filter cake with hypochlorite, thus resolubilising the mercury, which may be recoveredto the brine system. This may however cause problems with the water balance. The alternativeis retorting or landfilling the filter cake, depending on the mercury content. The use of vacuum
salt in such circumstances would minimise the quantities to be retorted or landfilled.
Sludges can be distilled in a recovery retort or be stored on site, generally after treatment withsodium sulphide to convert the mercury into an insoluble sulphide. Sludges are also stored inold salt mines that are no longer in use, in safe barrels (as is the case in some plants in
Germany) without being pretreated.
Solid wastes
Mechanical/physical treatment (including cryogenic and thermal treatment)
Mechanical treatment can be used if significant quantities of metallic mercury are present.
Techniques include brushing, ultrasonic vibration, vacuum cleaning and/or nitrogen freezing(for rubber coated steel). Thermal treatment, for instance warm sandblasting in a fluidised bedor pyrolysis in a furnace, is an alternative for coated metallic materials. As for every type of treatment, special attention should be given to minimising mercury emissions to air and to
avoiding cross-media effects. [Euro Chlor report, 1997], [Euro Chlor Env. Prot.3, 1999]
Water treatment
Water treatment in closed washing machines with high pressure jets can remove attachedmercury. [Euro Chlor report, 1997]
Chemical treatment
Chemical treatment can be made with hypochlorite, chlorinated brine, hydrochloric acid or solutions of hydrogen peroxide. Dissolved mercury can be recirculated in the brine stream or
recovered in the water treatment system. [Euro Chlor report, 1997]
Distillation
Distillation of mercury from solid waste can be carried out in special distillation units. To bedistilled, mercury has to be in elemental form. This means that some solid waste (for example,when the mercury is present as a salt) cannot be distilled. Special attention should be given totreatment of the exhaust gases from these installations. Filtration with activated carbon may
provide a good solution (see section about removal of mercury from the process exhausts in
4.2.1.1). [Euro Chlor report, 1997]

8/8/2019 Integrated Pollution Prevention and Control European Environment Comission
http://slidepdf.com/reader/full/integrated-pollution-prevention-and-control-european-environment-comission 104/178
Chapter 4
88 Chlor-Alkali Manufacturing industry
The retorting process (distillation) removes mercury to a large extent. The residual mercurycontent is reported to be less than 50 mg/kg waste [Dutch report, 1998], possibly after repeatedtreatments. The mercury is recovered as metallic mercury and can be stored for future make-upto the cells.
After treatment, the waste may be cooled by ventilation air. This ventilation air contains a small
amount of mercury. Akzo in Hengelo (Netherlands) reported a mercury emission of 0.006 gHg/tonne chlorine capacity with the cooling air from the mercury recovery unit in 1997. Solvayin Roermond (Netherlands) reported a mercury emission of 0.1 g Hg/tonne chlorine capacity
with the cooling air from the mercury recovery unit in 1996. [Dutch report, 1998].
The solid residue is landfilled or stored underground.
Recuperation of mercury
After treatment, mercury can be recovered and reused. Recuperation of mercury is possible
from:
- caustic treatment sludges- hydrogen and waste gas treatment when using chemical processes- water treatment sludges- the mercury distillation unit
- area for handling mercury-contaminated parts (for example, when changing the decomposer graphite).
Final disposal
In most cases, the mercury-containing solid residues that result from treatment need
stabilisation before being disposed of. Stabilisation serves to transform metallic mercury to aless soluble, more stable chemical state in order to reduce the risk of leaching from the finaldisposal site in the short and long term. In many cases, mercury is treated with sulphur or sulphur compounds to transform it to mercury sulphide or with selenium to mercury selenide.This can also be combined with physical stabilisation, for example in cement-based materials.
For final disposal, the residues can be sent to a waste landfill (hazardous or non-hazardous,depending on mercury content), to deep rock storage (now in the planning stage in Sweden) or to salt mines.
4.2.2 Conversion of mercury cell plants to membrane technology
Description
The conversion of mercury cell plants to membrane technology has the advantage of avoidingany future losses of mercury to the environment and reduces the energy consumption. To realisethe conversion, technical changes are required, depending on the existing situation. Most
membrane cell operators have either built a new “green field’’ plant or expanded productioncapacity with a new plant alongside their mercury facilities. Some have completely convertedtheir existing plant, but there are also examples of partial conversion. Figure 4.2 below showsthe main changes that need to be carried out to an existing plant when converting from mercury
cell to membrane technology.
Conversion is technically applicable at all existing mercury cell chlor-alkali plants . Economicfeasibility may vary from site to site (see Table 4.8, page 94).
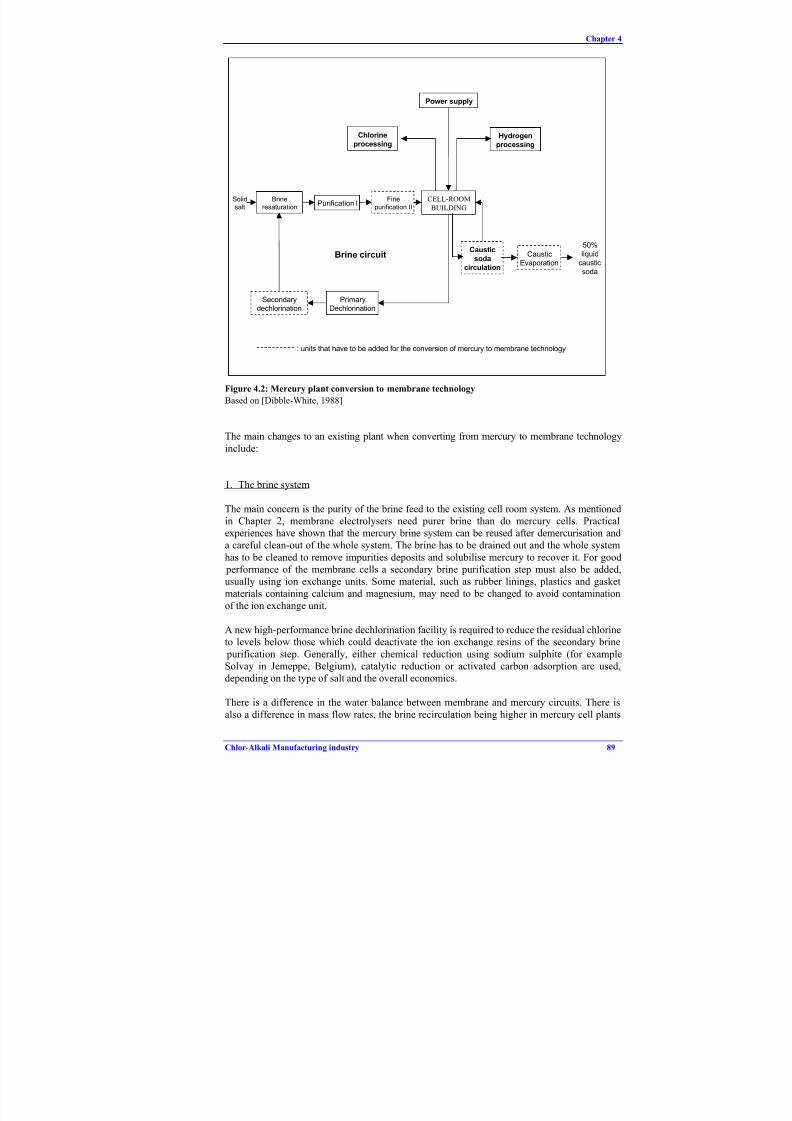
8/8/2019 Integrated Pollution Prevention and Control European Environment Comission
http://slidepdf.com/reader/full/integrated-pollution-prevention-and-control-european-environment-comission 105/178
Chapter 4
Chlor-Alkali Manufacturing industry 89
Solid
salt
CELL-ROOM
BUILDING
Caustic
soda
circulation
CausticEvaporation
Hydrogenprocessing
Power supply
50%
liquid
caustic
soda
Fine
purification IIPurification I
Brine
resaturation
PrimaryDechlorination
Secondarydechlorination
Chlorineprocessing
Brine circuit
: units that have to be added for the conversion of mercury to membrane technology
Figure 4.2: Mercury plant conversion to membrane technology
Based on [Dibble-White, 1988]
The main changes to an existing plant when converting from mercury to membrane technology
include:
1. The brine system
The main concern is the purity of the brine feed to the existing cell room system. As mentionedin Chapter 2, membrane electrolysers need purer brine than do mercury cells. Practicalexperiences have shown that the mercury brine system can be reused after demercurisation anda careful clean-out of the whole system. The brine has to be drained out and the whole system
has to be cleaned to remove impurities deposits and solubilise mercury to recover it. For good performance of the membrane cells a secondary brine purification step must also be added,usually using ion exchange units. Some material, such as rubber linings, plastics and gasketmaterials containing calcium and magnesium, may need to be changed to avoid contamination
of the ion exchange unit.
A new high-performance brine dechlorination facility is required to reduce the residual chlorineto levels below those which could deactivate the ion exchange resins of the secondary brine
purification step. Generally, either chemical reduction using sodium sulphite (for exampleSolvay in Jemeppe, Belgium), catalytic reduction or activated carbon adsorption are used,depending on the type of salt and the overall economics.
There is a difference in the water balance between membrane and mercury circuits. There is
also a difference in mass flow rates, the brine recirculation being higher in mercury cell plants
8/8/2019 Integrated Pollution Prevention and Control European Environment Comission
http://slidepdf.com/reader/full/integrated-pollution-prevention-and-control-european-environment-comission 106/178
Chapter 4
90 Chlor-Alkali Manufacturing industry
than in membrane cell plants at comparable capacities. Both the water balance and the massflow rates need to be taken into account in any conversion.
Very pure hydrochloric acid (HCl) is needed for brine acidification and a HCl burner mightneed to be installed.
2. The cell-room building
It is reported that existing cell room buildings can be reused to accommodate membraneelectrolysers. The saving of space makes it theoretically possible to install up to 400% morecapacity with membrane technology in an existing building. However, a clean space is neededfor the membrane cells. The decision to reuse an existing building will depend on:
- the condition of the existing building- whether space for a new cell room is available- extent of savings from reduced loss of production
Some old cell room buildings may be in a poor condition and thus may justify total
replacement. Environmental concerns may also lead to consideration of building replacement.This particularly applies to mercury contamination of existing concrete structures, where someemission will continue even after replacement of the mercury cells. In the conversion of themercury cell plant of Associated Octel in Ellesmere Port (UK), the existing cell room has been
kept, but mercury decontamination of the site and hygiene for the workforce were reported to be of paramount importance [Lott, 1995].
Some chlor-alkali plants have space available close to existing cell rooms. This allows the
erection of a new cell room building whilst reusing other plant systems in situ. Somecompanies, because they have plenty of space, succeed in having the two technologies in thesame cell-room, mercury and membrane, without any problem of contamination of membranes
or products [Bayer Uerdingen, 1998]. The construction of the building should also be able tosupport the normally higher weight density of membrane electrolysers.
The major advantage of a new building is the ability to minimise production losses duringconversion, since it can be erected and the electrolyser system installed while productioncontinues in the old building. In 1997, Borregaard in Norway converted its Sarpsborg mercury
cell chlor-alkali plant to a membrane cell plant, building a completely new cell room. The total production stoppage reported was 7 weeks. [Dibble-White, 1988] reports a case where the building was reused and production could be maintained during the conversion by operation of other cell rooms elsewhere on the site. The penalty of production loss in this case was not
significant, which is not the case if there is only a single cell room.
3. The electrolysers
The design and operation of the electrolysers are essentially different and no old parts can bereused.
4. The power supply
Reuse of the rectifiers depends on the type of membrane cell configuration and power requirements. The decision to renew the power supply or not will depend, among other things,
on the balance between investment and operating costs. A monopolar conversion should be possible using existing rectifiers and transformers, as, with few exceptions, existing plants aremonopolar. Bipolar conversions can also be carried out keeping the existing power supply, one
8/8/2019 Integrated Pollution Prevention and Control European Environment Comission
http://slidepdf.com/reader/full/integrated-pollution-prevention-and-control-european-environment-comission 107/178
Chapter 4
Chlor-Alkali Manufacturing industry 91
example being the conversion of Donau Chemie in Brückl, Austria, in 1999 [Schindler]. Acareful review of voltage is required to ensure that adequate control is achievable for themembrane system.
5. Gas treatment facilities
Chlorine and hydrogen collection and treatment are not essentially different in membrane cell
plants compared to the mercury process. Process steps to remove mercury are no longer needed.The main concern for the new cell room is the method of pressure control of the gases.Membrane technology requires a steady differential pressure of hydrogen over chlorine. Thismeans that a differential pressure controller must be added to the existing control system.
The chlorine and hydrogen gases leave the cell at higher temperatures than with mercurytechnology. The gases will be saturated with water vapour and so the loading on gas coolerswill be higher, as will the volume of resulting condensate. New cooling equipment may beneeded.
Chlorine from membrane cells contains more oxygen, which for some applications needs to beremoved prior to downstream use of the chlorine. For this purpose, total liquefaction followed by subsequent evaporation of liquid chlorine is necessary. Larger liquefaction units than those
normally in operation are required.
6. Caustic treatment
Mercury cell technology produces 50% caustic soda. Membrane cells require a recirculatingsystem with associated heat exchange and dilution and produce 33% caustic soda. If moreconcentrated caustic soda is needed, an evaporator system is also necessary.
7. Process piping
The reuse of existing process piping is not appropriate when converting to a membrane process,
as the physical location is often very different from that required by membrane electrolysers.The existing piping may also be made of material unsuitable for use with membraneelectrolysers.
Main achievements
Conversion to membrane technology avoids future emissions of mercury to the environment
and reduces the energy use. How big the reduction of total energy use will be depends on theoperating characteristics before and after the conversion. At the Borregaard plant in Sarpsborg(Norway) recently installed membrane cells have resulted in electrical energy savings of 30% per tonne of 100% NaOH compared to the mercury process which was used before (See Table
4.7). According to Euro Chlor an estimated typical electrical energy saving after conversion is15% and the total energy saving about 10%.
Cross-media effects
No direct cross-media effects occur. Future mercury emissions are avoided and lower energyuse is achieved. During conversion a temporary increase in losses of mercury to the

8/8/2019 Integrated Pollution Prevention and Control European Environment Comission
http://slidepdf.com/reader/full/integrated-pollution-prevention-and-control-european-environment-comission 108/178
Chapter 4
92 Chlor-Alkali Manufacturing industry
environment can be expected, due to the demolition of the old cells. Also, substantial amountsof mercury-contaminated waste are generated in the decommissioning process.
Note that, as a result of conversion, a large amount of mercury becomes available (on average1.8 kg/tonne annual Cl2 capacity). This mercury has the potential to be released into the global
environment. Currently, no legislation exists which regulates the handling of this mercury from
chlor-alkali plants, with the exception of Sweden, which has banned exports of mercury.
Driving force
The driving force for a conversion can be either an authority´s requirement for mercury-free production or an operator initiative for site-specific economic reasons such as an increase in
caustic, hydrochloric acid or chlorine demand and/or because significant changes are needed because of obsolete equipment.
Reference plants
Many plants around the world have been converted from mercury cell technology to membranecell technology. The increases in capacity that took place in Europe at the end of the 1980s and beginning of the 1990s all involved the installation of membrane technology. A well
documented conversion is the chlor-alkali plant of Associated Octel in Ellesmere Port (UK)which took place in 1992 [Lott, 1995].
Table 4.7 below presents data from the conversion of the Borregaard chlor-alkali plant in
Sarpsborg (Norway) to membrane technology in 1997.
Economics – capital costs of conversion
There have been numerous estimates of the capital cost of cellroom conversion and inevitablythese vary from plant to plant, even on a capacity-normalised basis. Even bigger variations in published estimates arise from the classic ‘boundary problem’ – what is included and what is
not. The capital cost of conversion for a typical mercury cellroom should include not only thecost of the electrolysers but also, as a minimum base case, the inextricably linked capital costsassociated with caustic recycle, caustic evaporation and brine secondary purification anddechlorination. In many cases additional capital will be required for additional gas cooling, newrectiformers (and possibly new electrical supply and switchgear), changes to the supply of
utilities and gaseous HCl, new building structures, decommissioning and site remediation.Reported capital costs range from 194 up to 700 euros per tonne of chlorine capacity.
The calculation is further complicated since trade-offs exist between capital and operating
costs. Designing for high current density operation can decrease the initial capital cost but thisincreases operating costs and energy consumption. The development of lower voltagemembranes is tending to shift the balance somewhat towards higher current densities – butregulatory pressure on energy consumption may reverse this trend and increase capital costs.
A conversion from mercury cells to membrane technology is presented in Table 4.7 and acomparison of reported conversion costs is presented in Table 4.8.

8/8/2019 Integrated Pollution Prevention and Control European Environment Comission
http://slidepdf.com/reader/full/integrated-pollution-prevention-and-control-european-environment-comission 109/178
Chapter 4
Chlor-Alkali Manufacturing industry 93
Context of the old production units
• Cell room built in 1949: 3 floors, 122 cells
• mercury air emissions: 1.4 g/tonne chlorine capacity
• mercury water emissions (water ion exchange process): 0.25 g/tonne chlorine capacity
Driving force for conversion
• Demand from the Norwegian authorities to switch to a mercury-free process
• Demand for higher production of sodium hydroxide and wish to lower operating costs.
The conversion
• Decision made to convert: autumn 1995
• Conversion carried out: autumn 1997
• Shutdown time: 7 weeks
Characteristics of new plant
• 40000 tonnes Cl2 capacity/year at 4.35 kA/m2
• Supplier: Asahi Glass Co. Ltd. Japan
• Engineering: Krebs-Swiss
• Electrolyser: AZEC-B1 bipolar, 4 electrolysers, each 75 cells.
• Membrane area: 2.88 m
2
per cell• Membrane: Flemion 893
Reused equipment:
• Rectifiers
• Hydrogen treatment and HCl production units
• Chlorine liquefaction section and compression
New equipment
• Cell room for electrolysers: The existing building was considered old and mercury-contaminated
• Electrolysis section
• Brine circuit: brine filtration unit, ion exchange unit, brine dechlorination unit
• Sodium hydroxide concentration unit and evaporation system
• Chlorine gas drying unit and chlorine gas absorption unit• Power supply and wiring (excluding rectifiers)
• Pumps, instruments and piping
Cost of conversion
• Total cost of conversion was about 210 million NOK (26.6 million euros October 1997)
corresponding to about 665 euros/tonne chlorine capacity. This figure includes 2.4 million euros for
the clean-up of the old plant and the storage of mercury-contaminated waste but excludes the clean-
up of soil pollution.
Economic benefits
• Electricity: 30% reduced per tonne 100% NaOH
• Personnel: 25% reduced
• Some mercury sold for batteries, instruments and to mercury chlor-alkali plants• Return on investment: 5 years (depending on the caustic market)
Decommissioning
• No cleaning-up of mercury-contaminated soil
• Monitoring of mercury emission to air from old cell room
• Construction of a sealed disposal facility for mercury-contaminated wastes: 1800m3, 3 special
membranes with sand filter seals between. The bunker is ventilated and the vented air led through a
carbon filter. The majority of the wastes (about 55%) was mercury contaminated process equipment
(steel and rubberlined steel).
• 95 tonnes of mercury drained from the cells
Table 4.7: Data from the conversion of the Borregaard chlor-alkali plant to membrane technology
[de Flon, 1998]

8/8/2019 Integrated Pollution Prevention and Control European Environment Comission
http://slidepdf.com/reader/full/integrated-pollution-prevention-and-control-european-environment-comission 110/178
Chapter 4
94 Chlor-Alkali Manufacturing industry
Source
Plant/base (year of
conversion)
Annual
plant
capacity
[tonne Cl2]
Investment in
original
currency
Investment in
euros
(currency date)
euros/tonne Cl2 Comments
[Lindley, 1997]
European union,
OSPARCOM impact
Calculationfor 1 tonne
of Chlorine
EURO 560–610 560–610 560-610 worst case assumptions; non-conversion costs included
[Lindley, 1997]
European union,
OSPARCOM impact
Calculationfor 1 tonne
of Chlorine
EURO 360 360 360 “ideal case”: no changes in power supply and buildings
[SRI Consulting, 1997]
average Western European
chlorine plant
157000 USD 111 M 92.5 M
(April 1997)
590 worst case assumptions; non-
conversion costs (chlorine drying,
liquefaction, bleach unit etc.) and
disposal costs included
ATS 200 M 14.5 M
(fixed EMU
conversion rate)
242 power supply and cell-room
building reused; non-conversion
costs included such as down-
stream modifications and
increased capacity of HCl and
bleach; site clean-up not included
[Schindler],
[UBA (A), 1998]
Donau Chemie, Brückl,
Austria (1999)
60000
ATS 160 M 11.6 M
(fixed EMUconversion rate)
194 pure conversion cost; estimated
waste disposal costs included
[Schubert],
[Chemie Prod., Mai 2000]
Bayer, Dormagen, Germany
(1999)
300000 DEM 240 M 122.7 M
(fixed EMU
conversion rate)
409 total cost including engineering
and construction (new equipment:DEM 170 M); cell-room building,
brine filtration, H2 and Cl2 gas
treatment facilities and
compressors reused; dismantling
of most Hg-cells not included;
[de Flon, 1998]
Borregaard, Sarpsborg,
Norway (1997)
40000 NOK 210 M 26.6 M
(October 1997)
665 rectifiers reused; new cell room;
new brine circuit; construction
and building of a landfill; non-
conversion costs included
[Lott, 1995]
Associated Octel, Ellesmere
Port, UK (1992)
40000 GBP 11.6 M 14.5 M
(January 1995)
362.5 "old" costs (no previous practical
experience); includes the clean-up
and disposal of the contaminated
parts of the plant (excluding soil)
[García Ara]
Aragonesas, Vilaseca,
Spain, (new capacitytogether with a mercury
plant 1992/1998)
40000 ESP 4660 M 28 M
(fixed EMU
conversion rate)
700 cell equipment (approx. 150-170
euros/ t Cl2), brine supply (rock
salt), rectifiers, new building,
training and start-up included; notincluded are caustic soda conc.,
liquefaction and evaporation unit
for oxygen elimination
Akzo Nobel, Skoghall,
Sweden, 2000
Akzo Nobel, Skoghall,
Sweden (conversion of one
membrane cell design to
another 1999)
75000 SEK 250 M 29 M
(December 1999)
387 new cell room, rectifiers, cells and
caustic evaporation included
OxyTech Systems, Inc.1998
adapted calculation of an
actual conversion project
122500 USD 56.2 M 51 M
(April 1998)
416 net cost: no changes in power supply and no reconstruction,
some overhauling of existingequipment included
[SEPA, 1997]
Akzo Nobel, Bohus,
Sweden (estimated 1997)
100000 SEK 250 M 29 M
(October 1997)
290 rectifiers, site clean-up and waste
disposal costs not included
UHDE Gmbh, 1998
average conversion costs
Calculationfor 1 tonne
of Chlorine
DEM 500 255
(December 1998)
255 average conversion costsexcluding disposal
Asahi glass Co., 1998
average conversion costs
166000 JPY 5000 M 35.4 M
(December 1998)
213 average conversion: includingrectifiers, excluding disposal
Table 4.8: Comparison of reported conversion costs
Based on [UBA (A), 1998] and personal communication with plants and suppliers
8/8/2019 Integrated Pollution Prevention and Control European Environment Comission
http://slidepdf.com/reader/full/integrated-pollution-prevention-and-control-european-environment-comission 111/178
Chapter 4
Chlor-Alkali Manufacturing industry 95
Generally, conversion costs of more than 600 euros/tonne Cl2 include costs not directly relatedto the conversion such as landfill construction, site clean-up, training of personnel, capacityincrease, start-up, etc. Costs between 400-600 euros generally include new cell room, power supply, waste disposal, down stream modifications, etc. Reported minimum conversion costs
range from below 200 to 400 euros per tonne of chlorine capacity and generally include somecosts for waste disposal and/or clean-up of contaminated parts.
A typical conversion cost according to Euro Chlor is around 530 euros per tonne chlorine
capacity. This cost would include engineering, equipment and construction as well asdismantling and cleaning of the old mercury cells and piping. It would not include new buildings, additional services or site remediation.
The cost of loss of production may play a significant part in conversion economics. There aretechniques, such as prefabrication, to minimise shutdown time. The Brückl plant (Austria)converted in summer 1999 and the mercury cells were running at 80% production rate while themembrane cells were installed. During the change of cells and system components the plantwas shutdown from Monday night to Friday (4 days). In the future, we can assume that plant
shutdowns could be minimised so that costs will be reduced compared to early conversions.
[Schindler], [UBA (A), 1998]
A gradual conversion has been carried out at the Bayer site in Uerdingen taking advantage of an
increased demand for chlorine. The same building could be used and no concentration plant or gas treatment facilities were needed. Membrane production has been increased progressively,switching off mercury cells and balancing the demand between the two technologies when itwas possible. However, industry reports that generally a step by step conversion is not
economically attractive compared to a complete conversion, mainly because of cross-contamination of mercury into new equipment and of the possible need for adaptations to the power supply.
There are also economic benefits resulting from the conversion of mercury cells to membranecells. Some economic benefits are [de Flon, 1998], [Lott, 1995]:- reduced energy use- reduced need for maintenance, reduced workforce- sale of mercury
- cost savings from mercury emission abatement and mercury medicals for the workforce.
According to Euro Chlor, conversions are only sufficiently profitable in special circumstancessuch as the need for increased capacity, high energy costs or high maintenance costs when the
plant is reaching the end of its natural life.
Operating and maintenance conditions can influence the lifetime of equipment andenvironmental performance and so make the operator decide to convert to membrane
technology. Most of the mercury cells in the EU were installed up to the mid-1970s andeconomic plant lifetimes can be in the range of 40-60 years [Lindley, 1997].
Effects on competitiveness
SRI Consulting, who made a study of the competitiveness of the western European chlor-alkaliindustry, reports that production costs for chlorine production by mercury technology aremainly linked to fixed costs in which plant size plays an important role. Most mercury
technology plants in western Europe have capacities between 50 and 200 kt/y with an average
of about 157 kt/y of chlorine capacity. The situation is quite different in the U.S. Gulf wherethe average plant size is significantly larger, with an average of 678 kt/y and structuraleconomic advantages linked to lower costs for main raw materials: salt and electricity higher in

8/8/2019 Integrated Pollution Prevention and Control European Environment Comission
http://slidepdf.com/reader/full/integrated-pollution-prevention-and-control-european-environment-comission 112/178
Chapter 4
96 Chlor-Alkali Manufacturing industry
western Europe (2.0 US cents/kg versus 3.6 in western Europe for salt and 2.8 US cents/kWhversus 4.3 for electricity). The SRI study concludes that the industry´s view of a forced phase-out of mercury technology by 2010 is that conversion would be uneconomic for about 33% (2.2million tonnes) of present mercury cell capacity, and that these plants would be closed. [SRIConsulting, 1997]
In western Europe, the cost of electrical energy is very dependent on the basic source of energyand the type of contracts negotiated with suppliers, but the relative differences betweencountries and regions remain. The special circumstances making a mercury plant economic can
change if the price of electrical energy increase sharply; in that case a conversion to membranetechnology can become more attractive economically.
Effect on downstream production
According to a chlorine flow study undertaken by Euro Chlor, sales of virgin chlorine accountfor only a few percent of the trade balance. That means that most of the chlorine produced is
used as a chemical intermediate either internally or by other companies. A key consideration,
therefore, is the down-time associated with the conversion and the impact on the production of downstream products such as PVC. Caustic users will also be affected by restrictions in chlor-alkali production.
References
[de Flon, 1998], [Dibble-White, 1988], [Euro Chlor paper, 1998], [Lindley, 1997], [Lott, 1995],
[SRI Consulting, 1997], [UBA (A), 1998]
4.2.3 Decommissioning
Description
The decommissioning of a mercury technology chlor-alkali plant should include all provisions
and measures which have to be taken into account to prevent environmental impact during andafter the shut-down process as well as safeguarding of human health. The operation shouldinclude plant shutdown, dismantling/demolition of equipment and circuits, handling of dismantled materials and the restoration and clean-up of the site so that the land can be reused
(depending on the local authorities’ decision on land use planning).
In many cases the clean-up of the site has to be done in a step by step procedure. At the
beginning it is not known how contaminated the site is or what types of contaminants are present. If graphite anodes have been used the site can be contaminated with PCDD/PCDF
compounds as well as mercury. Experience has shown that there is no direct correlation between PCDD/PCDF and mercury levels on old chlor-alkali sites. One study that covers alarge area might have to be followed by more detailed studies on particular areas wherecontamination is found. Sometimes this means that the project quite a long time.
When cell rooms are closed and decommissioned, there will be some loss of mercury to theenvironment, and this has to be considered when planning the operation. Loss of mercury to theatmosphere during decommissioning and demolition may be difficult to avoid completely and
could to some extent be influenced by cell room design and geographic location. However,
once the cells are shut down, the cell room temperature will decrease, and the evaporation rateof any exposed mercury is reduced [Lindley, 1997].

8/8/2019 Integrated Pollution Prevention and Control European Environment Comission
http://slidepdf.com/reader/full/integrated-pollution-prevention-and-control-european-environment-comission 113/178
Chapter 4
Chlor-Alkali Manufacturing industry 97
The closure of a cell room does not remove the operation from regulation. Much of thelegislation applicable to operational plants also applies whilst dismantling a mercury cell room,for example:- Protection of the health and safety of workers
- Protection of the environment (air and water emissions, soil contamination)- Handling, transport, treatment and disposal of wastes
Before proceeding with closure it is strongly recommended that a small task force be set up to
prepare the overall planning of the project. The role of the team is to prepare a welldocumented plan of action for discussion with the appropriate authorities before obtainingformal approval for it. It is vital that this team contains personnel from the chlor-alkalimanagement of the site. Contractors, if used, should be involved in this procedure as soon as
appointed. [Euro Chlor Env. Prot.3, 1999]
The organisation of project groups is also recommended, each responsible for a special issueduring the decommission operation. Examples of project group issues are:- Clean-up and demolition of buildings
- Recovery of mercury; treatment and disposal of material derived from general clean-up;
plant demolition; demolition of buildings, pipes, etc- Planning for transport and demolition activities- Health and safety monitoring: monitoring of mercury emissions to air and water and also
health checks for personnel involved- Follow-up after plant is stopped: survey on possible contamination of the whole site and
surroundings, including soil, old waste dumps and sediments in nearby waterways. Inaddition to mercury the soil/sediment samples should be analysed for PCDD/Fs if graphite
anodes have been used on the site.
Guidelines for the shut-down and decommissioning of mercury cell plants are presented in[Euro Chlor Env. Prot.3, 1999] and [Italian report, 1997].
Cross-media effects
A large amount of mercury will become available (1.8 kg/tonne Cl2 capacity per year). This
mercury has the potential to be released into the global environment. Currently, no legislationexists which regulates the fate of mercury from chlor-alkali plants, with the exception of Sweden which has banned exports of mercury. According to [SRI Consulting, 1997], thedecommissioning of all mercury cells in the EU may lead to over 12000 tonnes of available
mercury.
Reference plants
Example of decommissioning carried out at the Borregaard plant (Norway)
Project groups were organised for the different operations involved in the conversion and
decommissioning. The task of the demolition group was to work out methods, procedures, budget and schedule for demolition and handling of mercury-contaminated waste. The groupwas made up of representatives from local production and maintenance staff, localsafety/health/environment people and representatives from the Health Department.
A large number of samples was taken to determine the quantity of wastes. The total quantity of
contaminated waste material was estimated at 1750 m3
, of which 50% was contaminated process equipment such as steel and rubberlined steel. Before the plant was stopped, all

8/8/2019 Integrated Pollution Prevention and Control European Environment Comission
http://slidepdf.com/reader/full/integrated-pollution-prevention-and-control-european-environment-comission 114/178
Chapter 4
98 Chlor-Alkali Manufacturing industry
equipment which was going to be dismantled was marked with different colours, indicating thedestination of the wastes and method of treatment.
The authorities asked for special precautions concerning the landfill deposit:- No emission to water, air or ground from the deposit
- Possibility to open the landfill and take out the contaminated waste for other treatment if
new technologies should be available in the future to completely detoxify the residues- Deposit to be built for long-term deposition as long as geological conditions are unchanged- Transportation to the landfill with minimised risk of mercury loss
- Measures to monitor possible leaks- Marked with appropriate signs describing the content- Designed to blend into its surroundings- Secure against trespassers
- Programme of monitoring and maintenance routines
Costs for cleaning the old plant and depositing of contaminated waste:
million NOK 1997 million euros*
Cell room (removing and bottling of mercury, dismantlingequipment, sand washing of walls, floor, ceiling)
3.6 0.5
Dismantling of pipelines and other equipment in cell room 1.9 0.2
Treatment of mercury-contaminated waste (washing,
solidification, etc)
1.5 0.2
Construction and building of landfill 9.0 1.1
Transport and filling into landfill 2.1 0.3
Extra analyses, measurements and safety equipment 0.5 0.06
Total 18.6 2.36
* exchange rate of October 1997
References
[de Flon, 1998], [Euro Chlor Env. Prot.3, 1999], [Italian report, 1997], [Lindley, 1997]
4.3 Diaphragm cell plants
4.3.1 Abatement of asbestos emissions and discharges
Description
In its various formulations, the polymer modified asbestos (PMA) diaphragm is the mostcommon diaphragm in use today. The modified diaphragm still contains a minimum of 75% of chrysotile asbestos mixed with PTFE fibres. The major potential sources of air emissions areduring diaphragm deposition, treatment of operating cells with asbestos slurry and the disposalof spent asbestos. Contaminated water also needs to be collected and recycled as far as
possible.
It is recommended that personnel exposed to asbestos be provided with individual protectiveequipment and a personal health check programme.
8/8/2019 Integrated Pollution Prevention and Control European Environment Comission
http://slidepdf.com/reader/full/integrated-pollution-prevention-and-control-european-environment-comission 115/178
Chapter 4
Chlor-Alkali Manufacturing industry 99
1. To avoid as much as possible the deterioration of the diaphragms
Since diaphragm deposition and disposal of spent asbestos are sources of asbestos emissions,deterioration of diaphragms should be avoided as much as possible to reduce the need for
replacement, by:
• avoiding high concentrations of brine impurities: high brine impurities cause plugging of the
diaphragm with insoluble hydroxides, which reduce the diaphragm’s separation ability• avoiding irregular operation, such as electrical load changes, cell liquor strength changes,
changes in brine concentration or pH, gas-pressure fluctuations, shutdowns, changes in pHof the various regions of the diaphragm, thus accelerating chemical attack on the asbestos.
2. To avoid air emissions
Emissions of dry asbestos can be restricted by several actions:
• Avoid air emissions during delivery, unloading and handling of dry asbestos. Asbestos isusually delivered to the chlor-alkali producer dry and packed in bags. The bags are best palletised and covered with shrink-wrapped, sheet-wrapped or other non-porous material tominimise the likelihood of torn bags or loose material. Asbestos should be stored and
handled in an isolated and enclosed area (for example a dedicated storage room) withrestricted access and marked with specified warning signs. Wooden pallets should not beallowed to accumulate in the storage area. Automated systems as well as systems usingrobots for the handling of dry asbestos are used by some companies. With such technology,totally encapsulated rooms for unloading, bag-opening and preparation of asbestos slurry
prevents asbestos emissions. The rooms contain lock chamber systems under reduced pressure. No personnel have to enter the rooms for normal operation because no handling of dry asbestos by personnel is necessary.
• Avoid air emissions during the diaphragm preparation and deposition. Asbestos bag cuttingand emptying is best performed within an enclosed system. The bags should be fully cut and
carefully emptied with minimal disturbance of the contents. Bags should never be shaken.Empty bags should be folded over the cut and deposited in a closed labelled container withinthe enclosed area. Workers involved in the physical handling of asbestos bag transfer andslitting, sorting, weighing and slurry preparation should wear approved respirators and protective clothing if the tasks are not carried out inside sealed glove boxes. There should be
no visible asbestos on floor and equipment. Neither compressed air blowing, nor dry broomsweeping should be used to clean up loose asbestos. Fugitive asbestos fibres should beremoved with a HEPA filter-equipped vacuum cleaner or by wet cleaning. Prior toinstallation in a cell, completed diaphragms should be managed in a manner to preventasbestos from entering the atmosphere. Covering of stored diaphragms may be appropriate.
• Avoid air emissions from spent asbestos. After a certain operating time, asbestos
diaphragms are replaced. The spent asbestos is removed from the cathode body byhydroblasting. The area for hydroblasting should be enclosed, for example a separate roomor an enclosure with shielding and with smooth surfaces, to prevent asbestos from adheringand drying.
• Avoid air emissions from the cathode baking furnace. Emissions of asbestos occur from thefurnace where the green diaphragm cathodes are baked. A filter may be necessary to reduceemissions from this furnace.
3. To avoid wet asbestos drying out and becoming airborne
In the handling room, asbestos is handled under wet conditions. Asbestos that is suspended in
water will not directly have the potential to be emitted to the atmosphere. However, whenspillage or changes of the level of the suspension occur, the asbestos may dry out and becomeairborne. This also applies to depleted asbestos material which is hydroblasted from the cathode

8/8/2019 Integrated Pollution Prevention and Control European Environment Comission
http://slidepdf.com/reader/full/integrated-pollution-prevention-and-control-european-environment-comission 116/178
Chapter 4
100 Chlor-Alkali Manufacturing industry
can. When the asbestos-containing water is discharged, the asbestos has the potential to becomeairborne if it is transported to areas where it may dry out. Therefore, within the plant, allspillage should be removed immediately and all places where asbestos may have the potentialto dry out should be flushed regularly.
4. Contaminated water
Contaminated water has to be collected in an appropriate building. A filter press permits the
removal of asbestos from the waste water. Separation of spent asbestos from the hydroblastingwater wash is typically accomplished by pond settling, separation tanks or filtering, for example plate and/or frame filters. Residual levels of 0.1 g/tonne annual chlorine capacity are possible.
5. Waste Treatments
Thermal or chemical treatments can be applied to denature asbestos inside wastes. The
vitrification process is one of them. During this process the dangerous fibre structure is
destroyed and converted to ‘sand type’ silicate structures through thermal treatment. In order toachieve this, all spent asbestos is dewatered in a centrifuge and chemicals are added to generatea mixture with a significantly reduced melting point. This mixture is then pelletised and the pellets are fed to a rotary kiln for the vitrification process. The resulting slag no longer contains
asbestos fibres. Note that energy is used in the vitrification process.
Asbestos-containing wastes may be landfilled, providing it is done in a way which is consistentwith national asbestos regulation.
Monitoring
Asbestos fibres in suspension in air can be collected on a filter using a sampling system with asmall portable pump. Fibres are generally counted using an electron microscope. Fibre in thiscontext is defined as an object of length greater than 5µm, breadth less than 3 µm and having alength/breadth ratio greater than 3. Results are expressed in number of fibres/m 3 of air. Only
competent and trained people are able to do such measurements.
Directive 87/217/EEC contains an annex which provides a methodology for analysis andsampling of asbestos in aqueous effluents and air (gravimetric methodology or counting fibres).
Instructions on reporting and monitoring as well as records and notifications relating toincidents should be specified by the operator. Practically, all release points associated with
asbestos should be fitted with continuous particulate monitors which can be alarmed to detectabnormal emissions.
Main achieved emission levels
Automated systems, asbestos fixed and enclosed in cell body, modern monitoring and controlsystems, high industrial hygiene standards and high operating discipline achieve a fibreconcentration in the workplace and in the outlet to atmosphere of less than 1000 fibres/m3. Thisemission level is achieved by Dow in Stade (Germany).
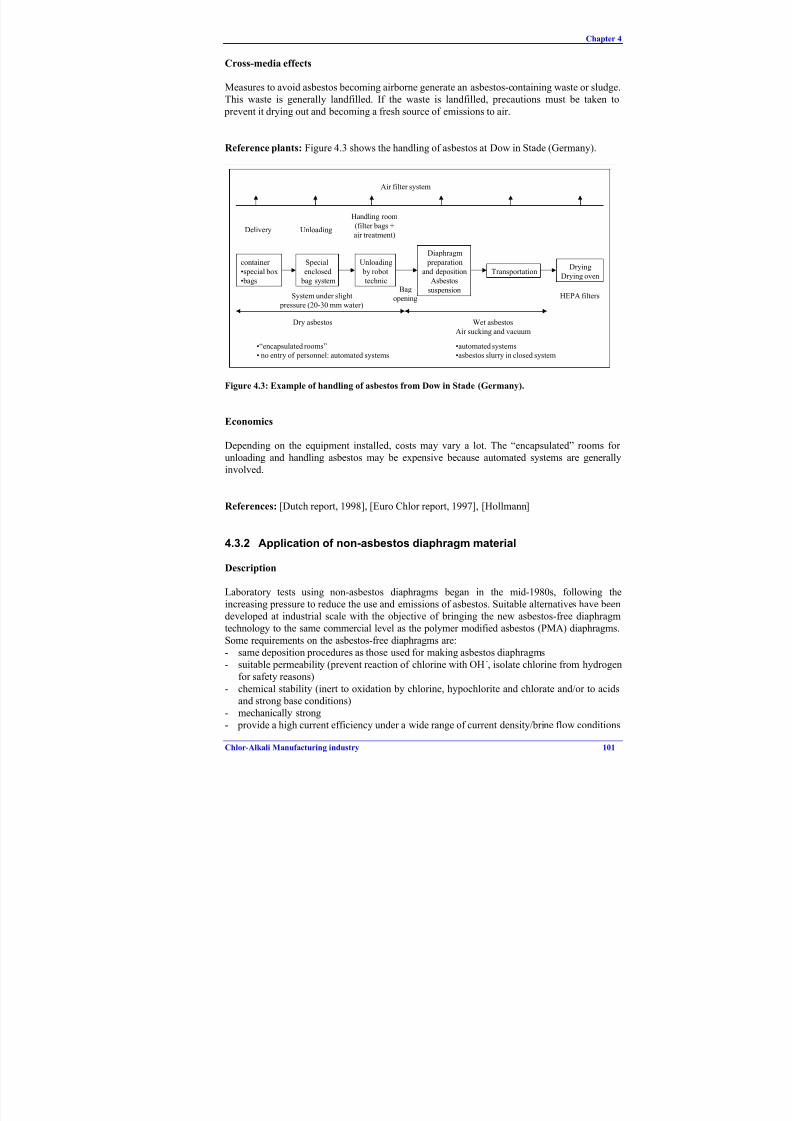
8/8/2019 Integrated Pollution Prevention and Control European Environment Comission
http://slidepdf.com/reader/full/integrated-pollution-prevention-and-control-european-environment-comission 117/178

8/8/2019 Integrated Pollution Prevention and Control European Environment Comission
http://slidepdf.com/reader/full/integrated-pollution-prevention-and-control-european-environment-comission 118/178
Chapter 4
102 Chlor-Alkali Manufacturing industry
Research on asbestos-free diaphragms is also carried out with the objectives of:- achieving an extended service life- obtaining a power consumption advantage- meeting safety and environmental needs
There are today two patents that are applied on a commercial scale: OxyTech’s Polyramix
(PMX) diaphragm and PPG’s Tephram diaphragm.
In addition, ChlorAlp’s patented microporous Asbestos Free Diaphragm is being installed in the
company’s industrial cell room at Pont de Claix, France. The plant will be fully converted by2001.
Composition of non-asbestos diaphragms
OxyTech’s PMX diaphragms are composed of (1) fibres with a PTFE polymer backbone withzirconia (ZrO2) particles embedded in and on the PTFE and (2) free zirconia particles. This
mixture is deposited from a slurry bath and then fused in an oven. Together with the
replacement of the existing diaphragm cell cathodes (at a minimum, the inner assembly portionof the cathode), the PMX diaphragms can directly replace other diaphragms in Hooker or Diamond type cells. [Florkiewicz, 1997], [Florkiewicz-Curlin, 1991]
The PPG’s Tephram diaphragms are composed of a base diaphragm and a topcoat. The basediaphragm is made of PTFE fluoropolymer, PTFE microfibrils and a perfluorinated ionexchange resin. The topcoat, composed of inorganic particulate materials (metal oxides such aszirconium oxide or titanium dioxide) is incorporated into, and becomes an integral part of, the
base diaphragm. The purpose of the topcoat is to adjust permeability and uniformity. TheTephram diaphragms can in some cases directly replace other diaphragms in chlor-alkali cells.[Dilmore-DuBois, 1995]
The differences between the patents lie in the way the hydrophobe PTFE fibres are treated anddeposited in order to form a permeable and hydrophilic diaphragm and in the mineral fillersused.
Operation and applicability of non-asbestos diaphragms
Non-asbestos diaphragms can be applied at new and existing diaphragm chlor-alkali plants.However, some operators still have doubts concerning the economics and safety of the
asbestos-free diaphragms.
The Dow diaphragm cell is optimised for low current density (~0.5 kA/m2) and requires a largeactive area (~100 m2 for one single bipolar element) [Kirk-Othmer, 1991]. The flow rate is
lower compared to other industrial cells and the company reports that there is a danger of chlorine and hydrogen getting mixed, because of the specificity of their cells, which could leadto an explosion.
On the other hand, for non-asbestos diaphragms the separator is no longer the most short-livedcomponent of the diaphragm cell. As the non-asbestos diaphragm is expected to last severalyears, the highest cause of failure of the diaphragm cell is the gaskets (base covers and perimeter gaskets). It is these gaskets which now pose the biggest challenge to overcome if a 3-5 year cell life is to be achieved.
Long life for PMX diaphragms has been commercially demonstrated. The Vulcan-Geismar plant in Louisiana (USA), fully converted since 1993, is achieving average diaphragm lives of

8/8/2019 Integrated Pollution Prevention and Control European Environment Comission
http://slidepdf.com/reader/full/integrated-pollution-prevention-and-control-european-environment-comission 119/178
Chapter 4
Chlor-Alkali Manufacturing industry 103
greater than 1000 days, while operating at an average current density of 2.55-2.65 kA/m 2.Demonstration blocks of 10 to 20 PMX diaphragm cells in Europe have lasted over 5 years andthe oldest PMX diaphragm cell at the Occidental Chemical Deer Park plant in Texas (USA) has been operating for over 8 years. [Florkiewicz, 1997]
Particular attention must be paid to the brine system, since poor brine will cause a fibre
diaphragm to plug at least as quickly as an asbestos diaphragm. The cathode must be protectedfrom corrosion during shutdowns, since an accumulation of corrosion products over several
years may result in high levels of hydrogen in chlorine before the end of the useful diaphragmlife. Patented procedures to overcome the plugging of a diaphragm with brine impurities areavailable (for example from OxyTech). A plugged diaphragm is frequently the cause of low cellefficiency. Removing iron from the diaphragm is also important, as iron also can be a source of
elevated hydrogen levels in chlorine. However, the preferred method of operation is to avoidthese problems by using pure brine. General Electric in Mount Vernon (USA), was fullyconverted to PMX diaphragms at one time but problems with iron in the brine forced GE toswitch back to PMA diaphragms.
Main achievements
Avoids consumption and emission of asbestos. Reduced energy use is also reported, depending
on operating conditions.
Non-asbestos diaphragms have demonstrated a number of advantages over asbestos diaphragmsin chlor-alkali cell operation:
- long lifetimes; at least 3 years can be considered as an average for an industrial cell room- extreme stability concerning load variations and outages
PMX diaphragm cells with three years on line show no increase in energy use, even after
repeated shutdowns at 95o
C. The operation of non-asbestos diaphragms may actually result innet energy savings. Additional savings in material handling and waste disposal might berealised, compared to asbestos diaphragms.
Cross-media effects
Polyramix diaphragms require the use of biocides in the suspension to avoid fermentation of the biogum used to suspend the dense fibres in the depositing slurry bath. The waste water is fairly
alkaline and contains organics from the suspension thickener. The effluent system thereforeneeds to be able to handle a COD load.
The Tephram diaphragms require “doping” during operation to maintain the required
wettability and permeability.
Reference plants
OxyTech’s Polyramix (PMX) Diaphragm
Vulcan Chemicals, Geismar, Louisiana, USA, has been fully converted to PMX diaphragmssince 1993. This plant uses OxyTech MDC-55 cells at 150 kA. All of the 152 cells are
equipped with PMX diaphragms. The Vulcan Chemicals plant personnel conducted a “make
good” analysis after the complete conversion of their plant. They achieved the power costsavings as expected in their appropriation and reduced the chlorate content of their caustic product and the hydrogen content in the chlorine gas. Today Vulcan Chemicals maintains

8/8/2019 Integrated Pollution Prevention and Control European Environment Comission
http://slidepdf.com/reader/full/integrated-pollution-prevention-and-control-european-environment-comission 120/178
8/8/2019 Integrated Pollution Prevention and Control European Environment Comission
http://slidepdf.com/reader/full/integrated-pollution-prevention-and-control-european-environment-comission 121/178
Chapter 4
Chlor-Alkali Manufacturing industry 105
monitoring. According to [Florkiewicz, 1997] a 3 year life of the PMX diaphragm is theminimum required to achieve breakeven.
On-site capital requirements for a conversion remain highly site-specific and the configuration
of the cells (cells with large active area, linked to the chlorine production per m2 of diaphragm)may greatly influence the cost of a conversion.
The total cost (everything included) for converting a diaphragm plant with an annual capacity
of 160 kt Cl2 to PMX diaphragms is reported to be 1.4-2 million euros. A new diaphragm preparation plant will be built to supply two sites with PMX diaphragms in France.
ChlorAlp in Pont de Claix (France) has estimated the costs for the modification of existing
equipment at 0.4-0.8 million euros (costs of raw materials not included).
References: [Curlin], [Dilmore-DuBois, 1995], [Dutch report, 1998], [Florkiewicz, 1997],[Florkiewicz-Curlin, 1991], [Foller et al, 1997], [Kuntzburger et al, 1995], [Perineau]
4.3.3 Conversion of asbestos diaphragm cell plants to membranetechnology or to asbestos-free diaphragms
Description
Converting to membranes
The important changes to an existing plant when converting from diaphragm cells to membranetechnology are:- Additional brine purification, including hardness removal ion exchange techniques.
Modifications to brine treatment to control other impurities, such as sulphate, may also berequired.
- Additional brine dechlorination to protect the ion exchange resin. It is necessary to completethe brine recirculation loop by adding primary and secondary dechlorination and possiblyresaturation.
- Inclusion of a cell room caustic soda recirculation system. If 50% product is required, theexisting diaphragm cell caustic soda evaporator must be modified and simplified to accepthigh-strength, salt-free caustic soda.
- Change of electrolysers and details of the cell room system.
Converting to asbestos-free diaphragms
In some cases the Tephram diaphragms can directly replace the old diaphragms and thePolyramix diaphragms can replace the old diaphragms if the cathodes are also replaced. Howmuch change other designs of asbestos-free diaphragms require is not known to the author atthe time of writing.
Comparison between converting to membranes or to asbestos-free diaphragms
Conversion of a diaphragm plant to membrane technology can be an attractive choice because
of the high energy efficiency and the pure 33% caustic produced directly from the cells. This is
especially the case when there is a need for high purity 50% caustic, due to the reduced costs of evaporation and the higher caustic quality of the membrane technology.

8/8/2019 Integrated Pollution Prevention and Control European Environment Comission
http://slidepdf.com/reader/full/integrated-pollution-prevention-and-control-european-environment-comission 122/178
Chapter 4
106 Chlor-Alkali Manufacturing industry
A conversion to asbestos-free diaphragms requires substantially less change in the existing cellroom than a conversion to membranes, and thus a lower capital investment. A comparison of the manufacturing costs is dependent on steam costs and the required caustic quality.
The final decision of the diaphragm cell producer between membranes and asbestos-free
diaphragms will depend on the situation at the individual site.
Main achievements
Avoids emission of asbestos and, in the case of membranes, significantly reduces the energyuse. Another advantage with membranes is the increased tolerance of power fluctuations, whichis especially attractive in regions with fluctuating energy prices.
Reference plants and economics
Any specific examples of conversions of diaphragm plants to membranes are not known to the
author at the time of writing. However, [Dibble-White, 1988] reports involvements in thedesign and implementation of conversion of diaphragm cell plants to membrane technology.
Examples of conversions of diaphragm plants to asbestos-free diaphragms, including some
economic data, are presented in the previous section, 4.3.2 Application of non-asbestosdiaphragm material.
Driving force
For membranes and asbestos-free diaphragms
Environmental regulation: no emissions of asbestos
For membranesEnd-use market : need for high purity caustic without saltEconomic: high energy efficiency and less need for caustic evaporation
For asbestos-free diaphragms, “the long-life diaphragm cell”Economic: reduced operating cost and reduced amounts of solid wastes
References
[Dibble-White, 1988], [Dutch report, 1998], [Florkiewicz, 1997], [Florkiewicz-Curlin, 1991]
4.4 Membrane cell plants
4.4.1 High performance membranes
Description
The membrane is the most critical component of this cell technology. Current density and cellvoltage, and hence energy use, are greatly dependent on its quality. New high-performance
membranes are now commercially available to equip electrolysers. There are high-performancemembranes for use in narrow and zero gap electrolysers (low cell voltage, reduced energy use)
for the production of chlorine and 30-35% caustic soda. They are all reinforced composite

8/8/2019 Integrated Pollution Prevention and Control European Environment Comission
http://slidepdf.com/reader/full/integrated-pollution-prevention-and-control-european-environment-comission 123/178
Chapter 4
Chlor-Alkali Manufacturing industry 107
membranes, having sulphonate and carboxylate polymer layers. They are specifically designedfor optimum gas/liquid circulation between the anode and the membrane’s anode surface. Theyare reinforced for safe operation and modified on both the anode and cathode surface toenhance gas release. [DuPont]
In the design of a membrane electrolyser using standard membranes, minimising the voltage
drop through the electrolyte gap is accomplished by reducing the gap. When the gap is verysmall, however, an increase in voltage may result from the entrapment of hydrogen gas bubbles
between the cathode and the hydrophobic membrane. In developed membranes the bubbleeffect problem has been solved by coating the cathodic surface with a thin layer of a porousinorganic material to improve the membrane’s hydrophilicity. These surface-modifiedmembranes have allowed the development of modern electrolysers with very small (narrow) or
no (zero) gap between the electrodes.
Achievements
Cell voltage is reported for new perfluorinated Nafion® membranes to be 2.88 V at a current
efficiency of >95% (conditions: 0 mm gap, DSA anode, activated cathode, 32% NaOH, 200 g/lanolyte, 90 oC, 3.0 kA/m2). The lifetime of the membranes ranges between 3 and 5 years.[DuPont]
Energy saving by developing a membrane having low ohmic drop has also been realised withFlemion membranes. They show a small increase in cell voltage while current density isreported up to 6 kA/m2. [Asahi Glass]
Driving force: Cost reduction by reducing energy use.
Economics
No specific economic information for the high-performance type membranes is known to theauthor at the time of writing.
References: [Asahi Glass], [DuPont]
8/8/2019 Integrated Pollution Prevention and Control European Environment Comission
http://slidepdf.com/reader/full/integrated-pollution-prevention-and-control-european-environment-comission 124/178
Chapter 5
108 Chlor-Alkali Manufacturing industry
5 BEST AVAILABLE TECHNIQUES
In understanding this chapter and its contents, the attention of the reader is drawn back to the
preface to this document and in particular the fifth section of the preface: “How to understandand use this document”. The techniques and associated emission and/or consumption levels, or ranges of levels, presented in this chapter have been assessed through an iterative process
involving the following steps:
• identification of the key environmental issues for the sector; for the manufacture of chlor-
alkali these are potential hazards concerning chlorine, hydrogen gas and alkalis, energy use,mercury releases from mercury cell plants and asbestos releases from asbestos diaphragmcell plants;
• examination of the techniques most relevant to address those key issues;
• identification of the best environmental performance levels, on the basis of the available
data in the European Union and world-wide;
• examination of the conditions under which these performance levels were achieved; such as
costs, cross-media effects, main driving forces involved in implementation of this
techniques;• selection of the best available techniques (BAT) and the associated emission and/or
consumption levels for this sector in a general sense all according to Article 2(11) andAnnex IV of the Directive.
Expert judgement by the European IPPC Bureau and the relevant Technical Working Group
(TWG) has played a key role in each of these steps and in the way in which the information is presented here.
On the basis of this assessment, techniques, and as far as possible emission and consumption
levels associated with the use of BAT, are presented in this chapter that are considered to beappropriate to the sector as a whole and in many cases reflect current performance of someinstallations within the sector. Where emission or consumption levels “associated with bestavailable techniques” are presented, this is to be understood as meaning that those levels
represent the environmental performance that could be anticipated as a result of the application,in this sector, of the techniques described, bearing in mind the balance of costs and advantagesinherent within the definition of BAT. However, they are neither emission nor consumptionlimit values and should not be understood as such. In some cases it may be technically possibleto achieve better emission or consumption levels but due to the costs involved or cross-media
considerations, they are not considered to be appropriate as BAT for the sector as a whole.However, such levels may be considered to be justified in more specific cases where there arespecial driving forces.
The emission and consumption levels associated with the use of BAT have to be seen together with any specified reference conditions (e.g. averaging periods).
The concept of “levels associated with BAT” described above is to be distinguished from the
term “achievable level” used elsewhere in this document. Where a level is described as“achievable” using a particular technique or combination of techniques, this should beunderstood to mean that the level may be expected to be achieved over a substantial period of time in a well maintained and operated installation or process using those techniques.
Where available, data concerning costs have been given together with the description of thetechniques presented in the previous chapter. These give a rough indication of the magnitude of costs involved. However, the actual cost of applying a technique will depend strongly on thespecific situation regarding, for example, taxes, fees, and the technical characteristics of the
installation concerned. It is not possible to evaluate such site-specific factors fully in this

8/8/2019 Integrated Pollution Prevention and Control European Environment Comission
http://slidepdf.com/reader/full/integrated-pollution-prevention-and-control-european-environment-comission 125/178
Chapter 5
Chlor-Alkali Manufacturing industry 109
document. In the absence of data concerning costs, conclusions on economic viability of techniques are drawn from observations on existing installations.
It is intended that the general BAT in this chapter are a reference point against which to judgethe current performance of an existing installation or to judge a proposal for a new installation.
In this way they will assist in the determination of appropriate "BAT-based" conditions for the
installation or in the establishment of general binding rules under Article 9(8). It is foreseenthat new installations can be designed to perform at or even better than the general BAT levels presented here. It is also considered that existing installations could move towards the general
BAT levels or do better, subject to the technical and economic applicability of the techniques ineach case.
While the BREFs do not set legally binding standards, they are meant to give information for
the guidance of industry, Member States and the public on achievable emission andconsumption levels when using specified techniques. The appropriate limit values for anyspecific case will need to be determined taking into account the objectives of the IPPCDirective and the local considerations.
Process technology selection
The selected process technology has a major impact on the energy use and emissions from the
manufacture of chlor-alkali.
• Best available techniques for the production of chlor-alkali is considered to be membranetechnology. Non-asbestos diaphragm technology can also be considered as BAT.
The total energy use associated with BAT for producing chlorine gas and 50% caustic soda
is less than 3000 kWh (AC) per tonne of chlorine when chlorine liquefaction is excluded
and less than 3200 kWh (AC) per tonne of chlorine when chlorine liquefaction andevaporation are included.
All cell plants
Best available techniques for the manufacture of chlor-alkali include the following measures:
• Use of management systems to reduce the environmental, health and safety risks of operating a chlor-alkali plant. The risk level should tend to zero. The management systems
will include (see Section 4.1.1 for more details):
− training of personnel
− identification and evaluation of major hazards
− instructions for safe operation
− planning for emergencies and recording of accidents and near-misses
− continuous improvement including feedback and learning from experience.
• A chlorine destruction unit designed to be able to absorb the full cell-room production in theevent of a process upset until the plant can be shut down. The chlorine absorption unit prevents emissions of chlorine gas in the event of emergencies and/or irregular plant
operation (see Section 4.1.2 for more details).
The absorption unit should be designed to lower the chlorine content in the emitted gas to
less than 5 mg/m3 in the worst case scenario.
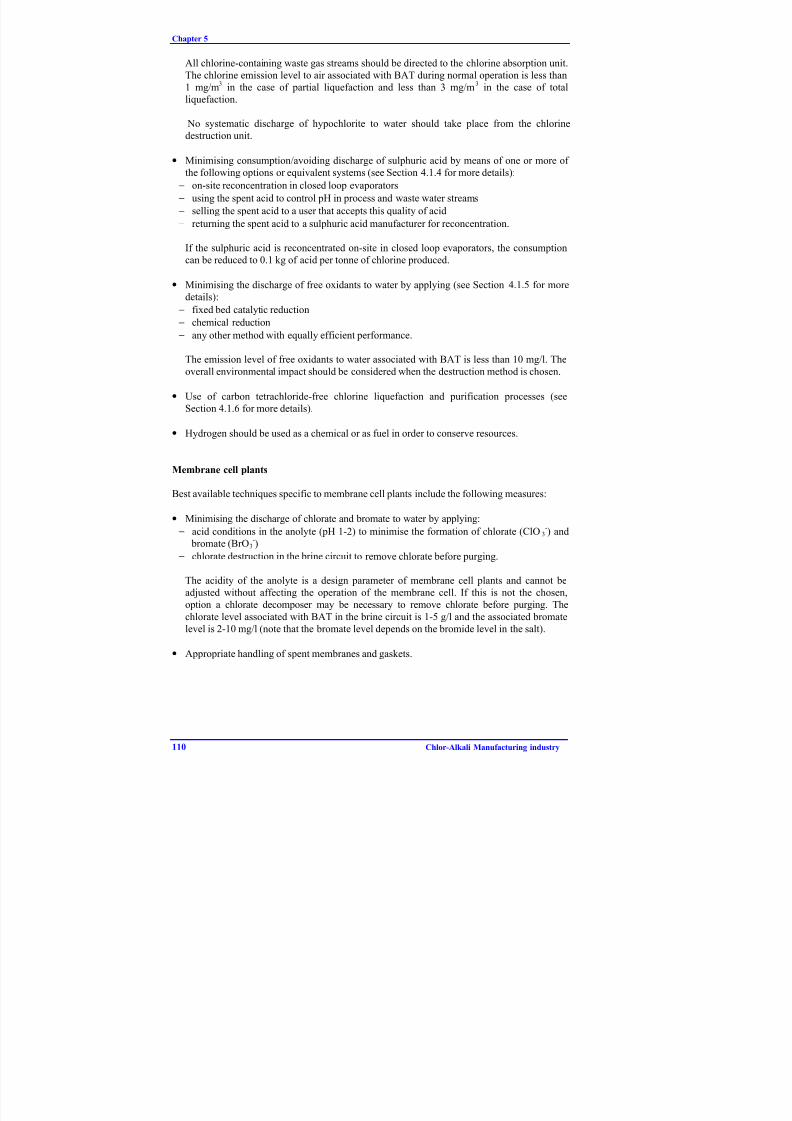
8/8/2019 Integrated Pollution Prevention and Control European Environment Comission
http://slidepdf.com/reader/full/integrated-pollution-prevention-and-control-european-environment-comission 126/178
Chapter 5
110 Chlor-Alkali Manufacturing industry
All chlorine-containing waste gas streams should be directed to the chlorine absorption unit.The chlorine emission level to air associated with BAT during normal operation is less than1 mg/m3 in the case of partial liquefaction and less than 3 mg/m3 in the case of totalliquefaction.
No systematic discharge of hypochlorite to water should take place from the chlorine
destruction unit.
• Minimising consumption/avoiding discharge of sulphuric acid by means of one or more of the following options or equivalent systems (see Section 4.1.4 for more details):
− on-site reconcentration in closed loop evaporators
− using the spent acid to control pH in process and waste water streams
− selling the spent acid to a user that accepts this quality of acid
− returning the spent acid to a sulphuric acid manufacturer for reconcentration.
If the sulphuric acid is reconcentrated on-site in closed loop evaporators, the consumptioncan be reduced to 0.1 kg of acid per tonne of chlorine produced.
• Minimising the discharge of free oxidants to water by applying (see Section 4.1.5 for moredetails):
− fixed bed catalytic reduction
− chemical reduction
− any other method with equally efficient performance.
The emission level of free oxidants to water associated with BAT is less than 10 mg/l. The
overall environmental impact should be considered when the destruction method is chosen.
• Use of carbon tetrachloride-free chlorine liquefaction and purification processes (seeSection 4.1.6 for more details).
• Hydrogen should be used as a chemical or as fuel in order to conserve resources.
Membrane cell plants
Best available techniques specific to membrane cell plants include the following measures:
• Minimising the discharge of chlorate and bromate to water by applying:
− acid conditions in the anolyte (pH 1-2) to minimise the formation of chlorate (ClO3-) and
bromate (BrO3-)
− chlorate destruction in the brine circuit to remove chlorate before purging.
The acidity of the anolyte is a design parameter of membrane cell plants and cannot beadjusted without affecting the operation of the membrane cell. If this is not the chosen,option a chlorate decomposer may be necessary to remove chlorate before purging. The
chlorate level associated with BAT in the brine circuit is 1-5 g/l and the associated bromatelevel is 2-10 mg/l (note that the bromate level depends on the bromide level in the salt).
• Appropriate handling of spent membranes and gaskets.

8/8/2019 Integrated Pollution Prevention and Control European Environment Comission
http://slidepdf.com/reader/full/integrated-pollution-prevention-and-control-european-environment-comission 127/178
Chapter 5
Chlor-Alkali Manufacturing industry 111
Mercury cell plants
Best available techniques specific to mercury cell plants include the following measures (seeSection 4.2.2 for more details):
• Conversion to membrane cell technology.
During the remaining life of mercury cell plants, all possible measures should be taken to protect the environment as a whole including:
• Minimising mercury losses to air, water and with products by:
− use of equipment and materials and, when possible, a lay-out of the plant (for example,dedicated areas for certain activities) that minimise losses of mercury due to evaporationand/or spillage (see Sections 4.2.1 and 4.2.1.1 for more details)
− good housekeeping practices and motivation of personnel to work in such a way (seeSections 4.2.1 and 4.2.1.1 for more details)
− good maintenance routines including planning of periodical maintenance and repair works(see Sections 4.2.1 and 4.2.1.1 for more details)
− collection and treatment of mercury-containing gas streams from all possible sources,including hydrogen gas (see Sections 4.2.1 and 4.2.1.1 for more details)
− minimising the amount of waste water and treatment of all mercury-containing waste water streams (see Sections 4.2.1 and 4.2.1.2 for more details)
− reduction of mercury levels in caustic soda (see Sections 4.2.1 and 4.2.1.3 for moredetails).
The best performing mercury cell plants are achieving total mercury losses to air, water andwith products in the range of 0.2-0.5 g Hg per tonne of chlorine capacity as a yearly average,
as shown in the table below:
g Hg/tonne chlorine capacity
Air: cell room process exhausts, including Hg distillation unituntreated cooling air from Hg distillation unithydrogen gas
0.2-0.30.0003-0.010.006-0.1<0.003
Water, process emissions 0.004-0.055
Caustic soda 0.01-0.05
Total 0.2-0.5
Apart from the process emissions reported above, there can also be considerable emissions
of mercury with run-off water. The soil at many sites is contaminated with mercury due todeposition of diffuse emissions and/or historical disposal of mercury-contaminated wastes.The mercury leaches from the soil and ends up in the run-off water.
The majority of mercury losses are in the various wastes from the process.
• Minimising current and future mercury emissions from handling, storage, treatment anddisposal of mercury-contaminated wastes by (see Section 4.2.1.4 for more details):
− implementation of a waste management plan drawn up after consultation with theappropriate authorities
− minimising the amount of mercury-containing wastes
− recycling the mercury contained in wastes when possible− treatment of mercury-contaminated wastes to reduce the mercury content in the wastes
− stabilisation of residual mercury-contaminated wastes before final disposal.
8/8/2019 Integrated Pollution Prevention and Control European Environment Comission
http://slidepdf.com/reader/full/integrated-pollution-prevention-and-control-european-environment-comission 128/178
Chapter 5
112 Chlor-Alkali Manufacturing industry
• Decommissioning carried out in a way that prevents environmental impact during and after the shutdown process as well as safeguarding human health (see Section 4.2.3 for more
details).
Before proceeding with closure it is strongly recommended that a small task force be set upto prepare the overall planning of the project. The role of the team is to prepare a well
documented plan of action for discussion with the appropriate authorities before obtainingformal approval for it.
The organisation of project groups is also recommended, each responsible for a special issue
during the decommission operation. Examples of project group issues are:- clean-up and demolition of buildings- recovery of mercury; treatment and disposal of material derived from general clean-up;
plant demolitions; demolition of buildings, pipes, etc- planning for transport and demolition activities
- health and safety monitoring: monitoring of mercury emissions to air and water and alsohealth checks for personnel involved
- follow-up after plant is stopped: survey on possible contamination of the whole site andsurroundings, including soil, old waste dumps and sediments in nearby waterways; in
addition to mercury, the soil/sediment samples should be analysed for PCDD/Fs if graphiteanodes have been used on the site.
Diaphragm cell plants
Best available techniques specific to diaphragm cell plants include the following measures (seeSections 4.3.3 and 4.3.2 for more details):
• Conversion to membrane cell technology
• Use of non-asbestos diaphragms.
During the remaining life of asbestos diaphragm cell plants, all possible measures should betaken to protect the environment as a whole including (see Section 4.3.1 for more details):
• Extending the diaphragm lifetime by using improved diaphragms and pure brine and byoperating in a way that does not accelerate the chemical attack on the asbestos. Diaphragmlifetime of 1 year (5 years being achieved by one company) has been achieved. Asbestosconsumption (and waste generation) can be reduced to around 0.1 kg per tonne of chlorine
capacity as a yearly average.
• Minimising asbestos emissions to air by applying: automated systems; asbestos fixed andenclosed in cell body; modern monitoring and control system to react in case of incidents;efficient air filter system; high industrial hygiene standards and high operating discipline.One plant is reported to achieve a fibre concentration in the workplace and in the outlet to
atmosphere of less than 1000 fibres/m3.
• Minimising asbestos emissions to water by applying a filter press to remove asbestos from
the waste water. A residual level of 0.1 g asbestos per tonne of chlorine capacity, as a yearlyaverage, has been achieved.
• Treatment of asbestos-contaminated wastes by thermal or chemical methods to denature
asbestos inside wastes. Normally, the resulting slag no longer contain asbestos fibres.
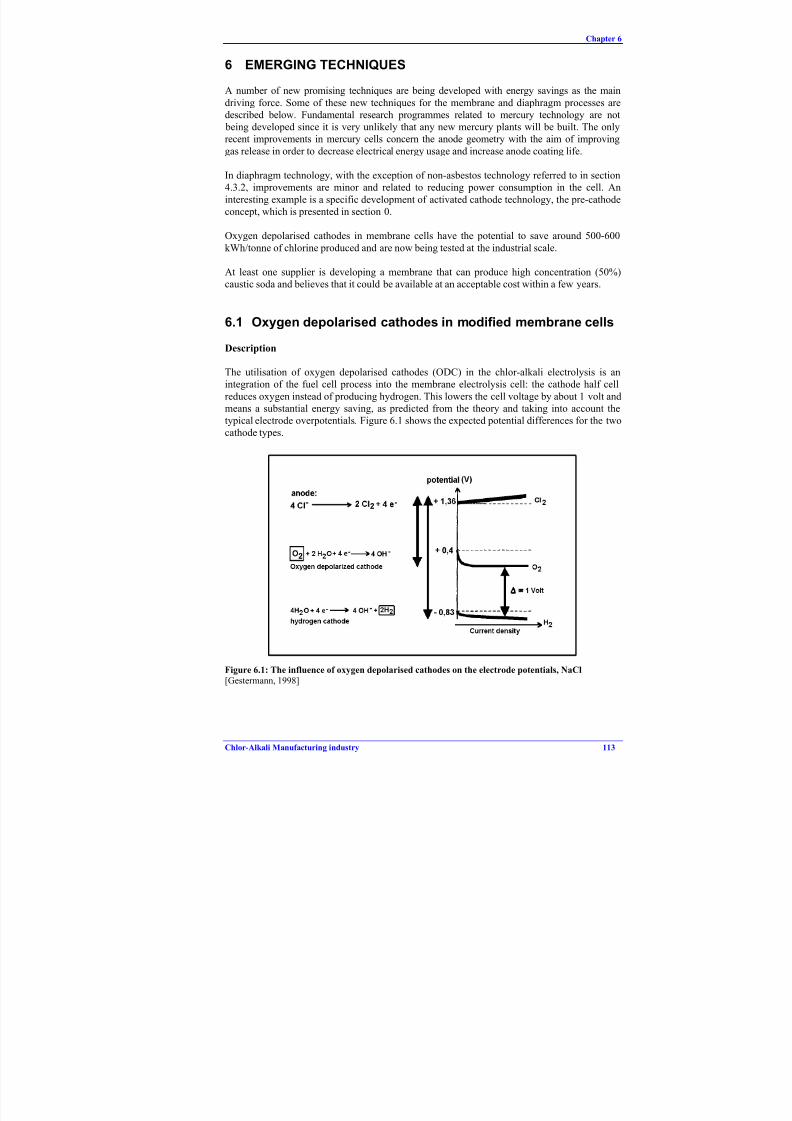
8/8/2019 Integrated Pollution Prevention and Control European Environment Comission
http://slidepdf.com/reader/full/integrated-pollution-prevention-and-control-european-environment-comission 129/178
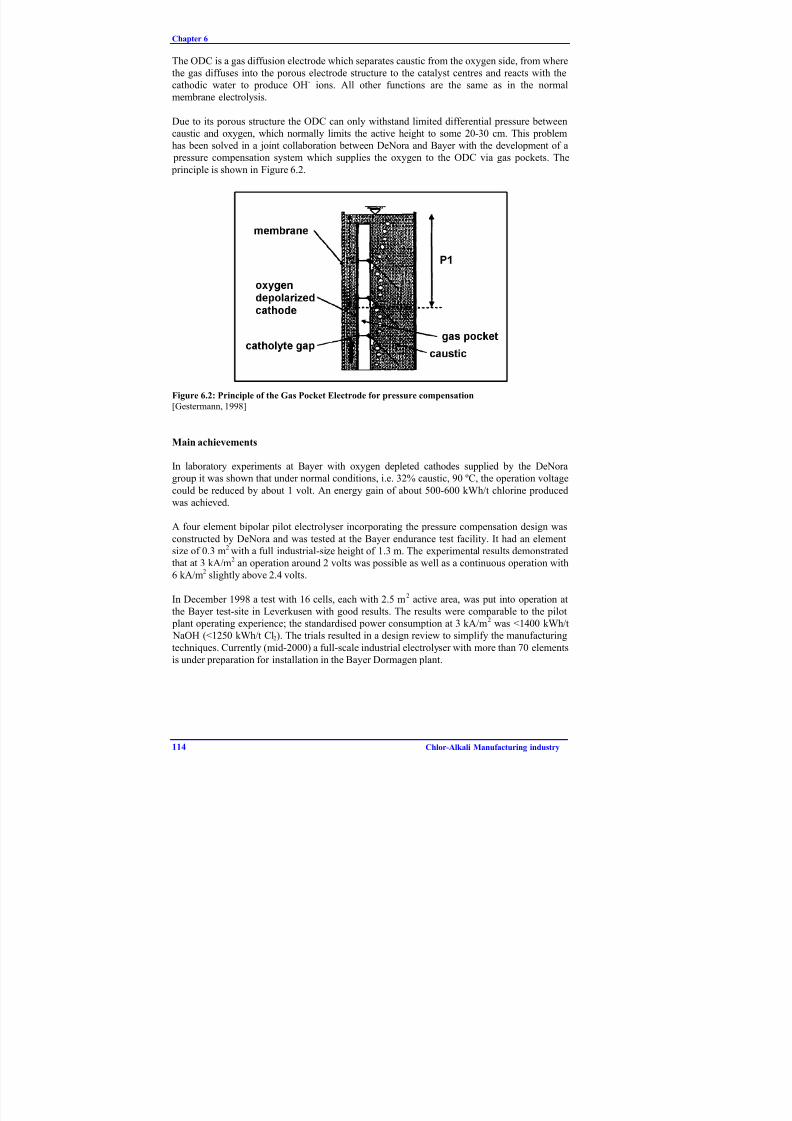
8/8/2019 Integrated Pollution Prevention and Control European Environment Comission
http://slidepdf.com/reader/full/integrated-pollution-prevention-and-control-european-environment-comission 130/178
Chapter 6
114 Chlor-Alkali Manufacturing industry
The ODC is a gas diffusion electrode which separates caustic from the oxygen side, from wherethe gas diffuses into the porous electrode structure to the catalyst centres and reacts with thecathodic water to produce OH- ions. All other functions are the same as in the normalmembrane electrolysis.
Due to its porous structure the ODC can only withstand limited differential pressure between
caustic and oxygen, which normally limits the active height to some 20-30 cm. This problemhas been solved in a joint collaboration between DeNora and Bayer with the development of a pressure compensation system which supplies the oxygen to the ODC via gas pockets. The
principle is shown in Figure 6.2.
Figure 6.2: Principle of the Gas Pocket Electrode for pressure compensation
[Gestermann, 1998]
Main achievements
In laboratory experiments at Bayer with oxygen depleted cathodes supplied by the DeNoragroup it was shown that under normal conditions, i.e. 32% caustic, 90 ºC, the operation voltage
could be reduced by about 1 volt. An energy gain of about 500-600 kWh/t chlorine producedwas achieved.
A four element bipolar pilot electrolyser incorporating the pressure compensation design was
constructed by DeNora and was tested at the Bayer endurance test facility. It had an element
size of 0.3 m
2
with a full industrial-size height of 1.3 m. The experimental results demonstratedthat at 3 kA/m2 an operation around 2 volts was possible as well as a continuous operation with6 kA/m2 slightly above 2.4 volts.
In December 1998 a test with 16 cells, each with 2.5 m2 active area, was put into operation atthe Bayer test-site in Leverkusen with good results. The results were comparable to the pilot plant operating experience; the standardised power consumption at 3 kA/m2 was <1400 kWh/t NaOH (<1250 kWh/t Cl2). The trials resulted in a design review to simplify the manufacturing
techniques. Currently (mid-2000) a full-scale industrial electrolyser with more than 70 elementsis under preparation for installation in the Bayer Dormagen plant.

8/8/2019 Integrated Pollution Prevention and Control European Environment Comission
http://slidepdf.com/reader/full/integrated-pollution-prevention-and-control-european-environment-comission 131/178
Chapter 6
Chlor-Alkali Manufacturing industry 115
Availability and applicability
The oxygen depolarised cathode technology is reported by Bayer to be expected to be availablefor licensing for industrial application by 2002 [Wienkenhöver, 2000].
The technique described is for an oxygen depolarised cathode which implies a source of pure
oxygen. Other technology suppliers have experimented with air cathodes which do not requirean air separation unit. According to [Kirk-Othmer, 1991] the essential features of an air cathode
cell are identical to those of the oxygen cathode cell. The first is the inclusion of an air chamber behind the electrode to provide oxygen for the cathodic reaction. Second, because no hydrogenis produced, there is no need for hydrogen collection equipment. Third, and most important, isthat the air cathode cell operates at approximately 1 V lower than a conventional hydrogen
evolving chlorine cell.
The air cathode technology has been demonstrated in commercial sized equipment atOccidental Chemical’s Muscle Shoals, Alabama plant but is not presently being practised because of being too expensive to commercialise at the currently low (US) power costs [Kirk-
Othmer, 1991].
The plant incorporating the air cathode electrolyser must include a high performance air scrubbing system to eliminate carbon dioxide from the air. Also, if there are downstream
chemical uses for the hydrogen, or if the hydrogen gas is used for energy production, it mightoff-set the energy reduction gained by introducing air or oxygen depolarised cathodes.
It is not possible to retrofit air and oxygen depolarised cathodes into existing membrane cells.
References: [Gestermann-Ottaviani, 2000], [Wienkenhöver, 2000], [Gestermann, 1998],[Kirk-Othmer, 1991]

8/8/2019 Integrated Pollution Prevention and Control European Environment Comission
http://slidepdf.com/reader/full/integrated-pollution-prevention-and-control-european-environment-comission 132/178
Chapter 6
116 Chlor-Alkali Manufacturing industry
6.2 Membrane for direct production of 50% caustic soda
Description
Standard chlor-alkali membranes produce caustic soda with a concentration of approximately30-35% which then might have to be evaporated to the normal 50% strength. Both sulphonic
and carboxylic membranes show a reduction in current efficiency and destabilisation of themembrane when caustic strength is increased to more than 35%. One company is developing anew membrane for direct production of 50% caustic soda which has an additional protectivelayer on the cathode side of the traditional bi-functional membrane forming an intermediate
‘room’ between the carboxylic and the protective layers (See Figure 6.3). Owing to thedifference of transport number between the two layers, the caustic concentration of theintermediate ‘room’ can be maintained in the range of 32-35% while the external catholyteconcentration is raised to 50%.
Figure 6.3: Structure of Fx-50 membrane producing 50% caustic soda
[Asahi Glass]
Main achievements
A prototype membrane, Fx-50B, has been evaluated in an Asahi Glass AZEC F-2 electrolyser.
The membrane showed stable performance (200 kA, 3 kA/m2, 80-85 oC) with a power
consumption of less than 2400 DC kWh/tonne caustic (<2850 AC kWh/tonne Cl 2). After about3 years on line the membrane was dismantled and checked. No unusual damage or impurityaccumulation was found.
Economics and availability
There is an increased voltage penalty due to both the lower conductivity of the 50% caustic and
the resistance of the protective layer. This may be off-set by a reduced or zero steam demandfor evaporation. According to the manufacture, the Fx-50 membrane for direct production of 50% caustic soda is deemed to be economically feasible if the steam cost is, comparatively,high and the electricity cost is, comparatively, low. These are conditions that currently do not
exist in the main markets and thus the new membrane has not yet been commercialised.

8/8/2019 Integrated Pollution Prevention and Control European Environment Comission
http://slidepdf.com/reader/full/integrated-pollution-prevention-and-control-european-environment-comission 133/178
Chapter 6
Chlor-Alkali Manufacturing industry 117
Reference: [Asahi Glass]
6.3 Built-in precathode diaphragm
Description
The term “built-in precathode diaphragm” is used to describe a composite assembly comprising
- the standard mild steel cathode screen- the precathode itself - the microporous asbestos or asbestos-free diaphragm.The latter two are consecutively vacuum deposited onto the normal diaphragm cell cathode box
in the same manner and with the same equipment as asbestos diaphragms.
The precathode technology is based on the incorporation of a volumetric cathode area in thefirst section of the diaphragm itself: it includes conducting fibres, electrocatalytic material, pore
forming agents and a fluoro-containing polymer binder.
The role of the pore-forming agent is to regulate the porosity of the separator which influencesthe flow of liquid and the discharge of the gases. It is a solid inorganic compound (type of
silica) which is subsequently removed by leaching or thermal or chemical decomposition.
The electrocatalytic agent is incorporated into the precathode in the form of a powder andchosen from among the metals of the platinum group such as Raney alloys, Raney metals andespecially Raney Nickel.
Figure 6.4 shows the built-in precathode diaphragm operating principle. The steel screenstructure of the cathode box acts as a support and ensures distribution of the current to theconductive fibres. These in turn conduct the current to the electrocatalytic particles
homogeneously dispersed in the volumetric electrode. The electrochemical reduction of water takes place directly on the large active surface area of the electrocatalyst which has a lower overpotential than the standard cathode thus reducing the cell voltage.
Figure 6.4: The built in precathode diaphragm operating principle
[Kuntzburger et al, 1997]

8/8/2019 Integrated Pollution Prevention and Control European Environment Comission
http://slidepdf.com/reader/full/integrated-pollution-prevention-and-control-european-environment-comission 134/178
Chapter 6
118 Chlor-Alkali Manufacturing industry
It is claimed that the built-in precathode can be applied at all existing and new plants usingdiaphragm technology (asbestos or non-asbestos). The manufacture of the built-in precathodediaphragm requires no equipment changes as it is vacuum-deposited on the cathode from awater-based slurry in the same manner as modified diaphragms and heated in the same oven.
Main achievements
According to the industrial experience in CHLORALP and test results in Heraeus
Elektrochemie the advantages of the precathode have been found to be:
− reduction of cell voltage by 100-150 mV, with respect to current density from 1.7-2.6
kA/m2, and thereby energy savings
− reduction of oxygen content in chlorine and increase of current efficiency by 0.7-3.0% dueto the improvement of the diaphragm homogeneity and additional resistance by the
precathode layer to back-migration of hydroxyl ions from catholyte to anolyte
− improvements of the cell performance in the field of:
• safe operation: safety is improved particularly during start up and shut down and thehydrogen content in chlorine is lowered below 0.1% during standard operation
• electrocatalytic reduction of chlorate: chlorate content is reduced by 30-50% in causticsoda due to strong (chemical) reduction of ClO3
- on the precathode
− extended diaphragm life (lifetime between 2 and 3 years instead of one year). This can beexplained by the improved chemical stability of the materials and the substantially smaller swelling of the diaphragm during use
− permeability of the diaphragm is improved, making high current density under constantanolyte level possible.
Cross media effects
After being used, the precathode and the diaphragm are eliminated by hydroblasting. Sludges(mix of asbestos fibres, PTFE, carbon, nickel particles) are considered as hazardous waste.
Reference plants
Heraeus Elektrochemie (now DeNora): has installed the precathode technology within its owntest facilities in MDC-55 cells (current density 2.64 kA/m2) and has found a test average energysaving of 200 kWh per tonne of chlorine produced. The cell voltage was found to be reduced by
140 mV (from 3.73 V to 3.59 V) and current efficiency increased by 3% (from 95% to 98%).Chlorate decreased from 0.25 g/l to <0.01 g/l in 130 g/l caustic soda The oxygen in chlorine
decreased from 1.8% to 0.95% and hydrogen in chlorine decreased from 0.2% to <0.1%.
CHLORALP, Le Pont de Claix, Isère (France): Built-in precathode diaphragm was firstinstalled at the Le Pont de Claix plant in 1986. The plant was fully converted in 1987. The plantcapacity is 240 ktonne of chlorine per year using only diaphragm cells (Hooker-S3B andHooker-H4). Cells are equipped with modified diaphragms and metal anodes. The brine supply
is alkaline and not saturated. Table 6.1 presents average performance data before and after theconversion to precathode technology. The average energy saving is estimated to be 175 kWh per tonne of chlorine (about 5% of total energy consumption).
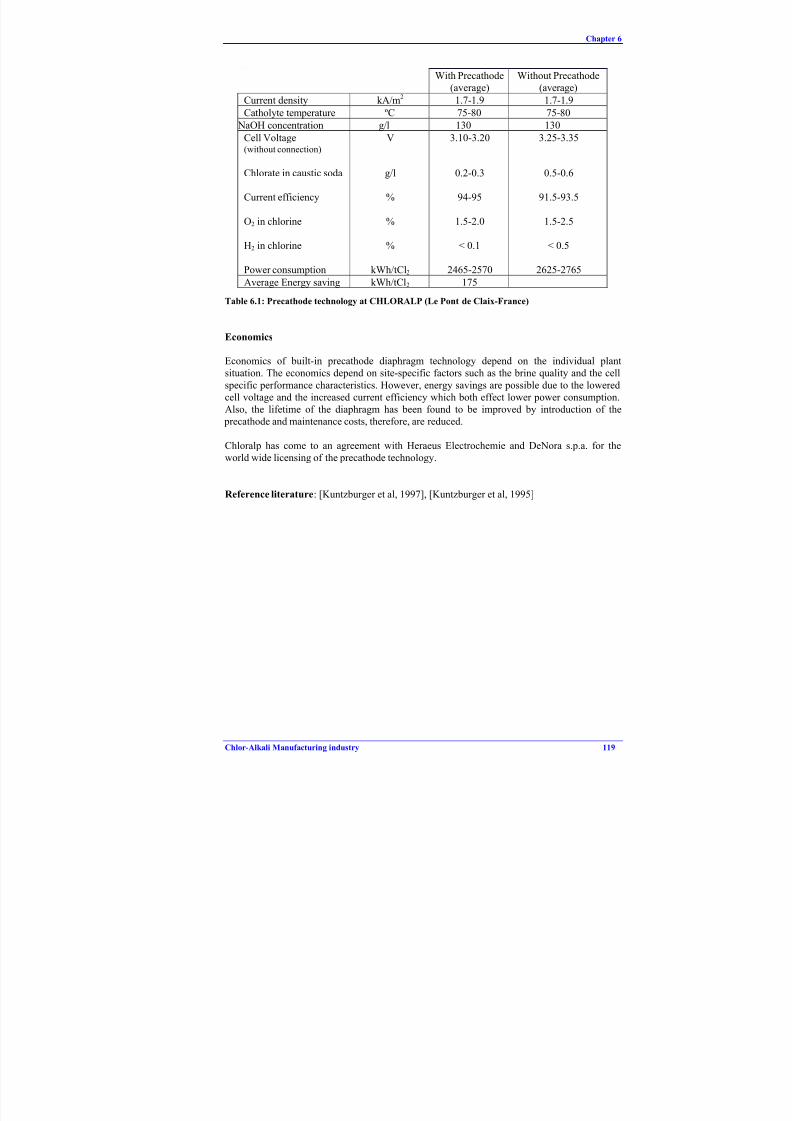
8/8/2019 Integrated Pollution Prevention and Control European Environment Comission
http://slidepdf.com/reader/full/integrated-pollution-prevention-and-control-european-environment-comission 135/178
Chapter 6
Chlor-Alkali Manufacturing industry 119
With Precathode(average)
Without Precathode(average)
Current density kA/m2 1.7-1.9 1.7-1.9
Catholyte temperature ºC 75-80 75-80
NaOH concentration g/l 130 130
Cell Voltage(without connection)
Chlorate in caustic soda
Current efficiency
O2 in chlorine
H2 in chlorine
Power consumption
V
g/l
%
%
%
kWh/tCl2
3.10-3.20
0.2-0.3
94-95
1.5-2.0
< 0.1
2465-2570
3.25-3.35
0.5-0.6
91.5-93.5
1.5-2.5
< 0.5
2625-2765
Average Energy saving kWh/tCl2 175
Table 6.1: Precathode technology at CHLORALP (Le Pont de Claix-France)
Economics
Economics of built-in precathode diaphragm technology depend on the individual plantsituation. The economics depend on site-specific factors such as the brine quality and the cell
specific performance characteristics. However, energy savings are possible due to the loweredcell voltage and the increased current efficiency which both effect lower power consumption.Also, the lifetime of the diaphragm has been found to be improved by introduction of the precathode and maintenance costs, therefore, are reduced.
Chloralp has come to an agreement with Heraeus Electrochemie and DeNora s.p.a. for theworld wide licensing of the precathode technology.
Reference literature: [Kuntzburger et al, 1997], [Kuntzburger et al, 1995]
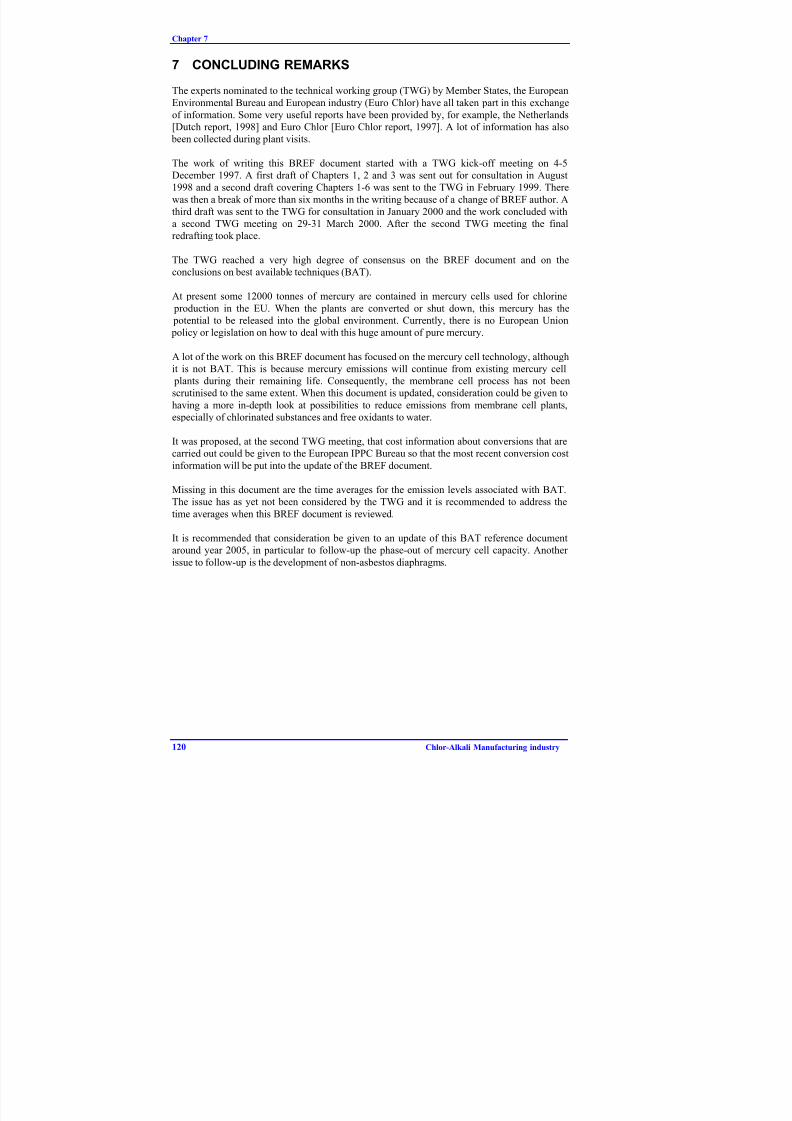
8/8/2019 Integrated Pollution Prevention and Control European Environment Comission
http://slidepdf.com/reader/full/integrated-pollution-prevention-and-control-european-environment-comission 136/178
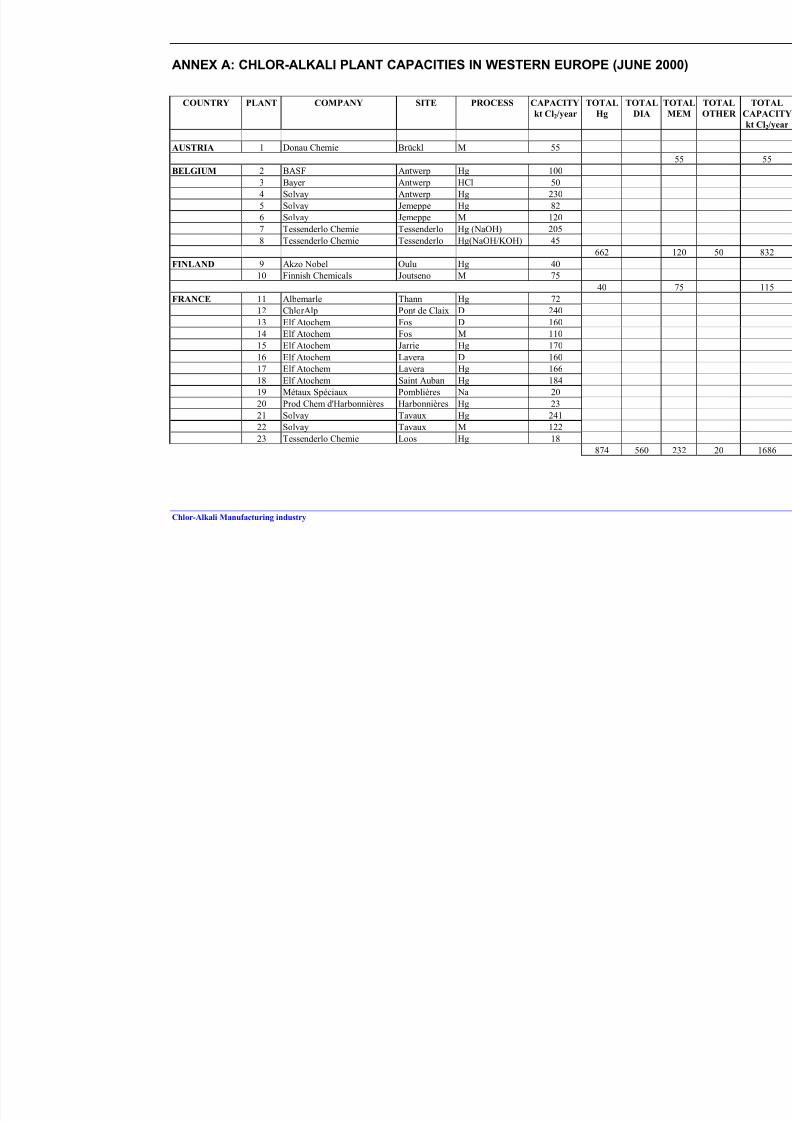
8/8/2019 Integrated Pollution Prevention and Control European Environment Comission
http://slidepdf.com/reader/full/integrated-pollution-prevention-and-control-european-environment-comission 137/178
Chlor-Alkali Manufacturing industry
ANNEX A: CHLOR-ALKALI PLANT CAPACITIES IN WESTERN EUROPE (JUNE 200
COUNTRY PLANT COMPANY SITE PROCESS CAPACITY
kt Cl2/year
TOTAL
Hg
TOTAL
DIA
TO
M
AUSTRIA 1 Donau Chemie Brückl M 55
BELGIUM 2 BASF Antwerp Hg 100
3 Bayer Antwerp HCl 50
4 Solvay Antwerp Hg 230
5 Solvay Jemeppe Hg 82
6 Solvay Jemeppe M 120
7 Tessenderlo Chemie Tessenderlo Hg (NaOH) 205
8 Tessenderlo Chemie Tessenderlo Hg(NaOH/KOH) 45
662 1
FINLAND 9 Akzo Nobel Oulu Hg 40
10 Finnish Chemicals Joutseno M 7540
FRANCE 11 Albemarle Thann Hg 72
12 ChlorAlp Pont de Claix D 240
13 Elf Atochem Fos D 160
14 Elf Atochem Fos M 110
15 Elf Atochem Jarrie Hg 170
16 Elf Atochem Lavera D 160
17 Elf Atochem Lavera Hg 166
18 Elf Atochem Saint Auban Hg 184
19 Métaux Spéciaux Pomblières Na 20
20 Prod Chem d'Harbonnières Harbonnières Hg 23
21 Solvay Tavaux Hg 24122 Solvay Tavaux M 122
23 Tessenderlo Chemie Loos Hg 18
874 560 2

8/8/2019 Integrated Pollution Prevention and Control European Environment Comission
http://slidepdf.com/reader/full/integrated-pollution-prevention-and-control-european-environment-comission 138/178
Annex
122
COUNTRY COMPANY SITE PROCESS CAPACITY
kt Cl2/year
TOTAL
Hg
TOTAL
DIA
TOT
ME
GERMANY 24 BASF Ludwigshafen D 210
25 BASF Ludwigshafen Hg 150
26 Bayer Brunsbuttel HCl 12027 Bayer Dormagen HCl 80
28 Bayer Dormagen M 300
29 Bayer Leverkusen HCl 30
30 Bayer Leverkusen Hg 300
31 Bayer Uerdingen Hg 130
32 Bayer Uerdingen M 90
33 Dow Schkopau M 220
34 Celanese Knapsack Hg 150
35 Clariant Gersthofen Hg 60
36 Dow Stade D 1036
37 Dow Stade M 234
38 Chlor IV Elektrolyse Bitterfeld Hg 6539 ECI Ibbenbüren Hg 120
41 Hüls Lülsdorf Hg 98
42 ICI Wilhemshafen Hg 130
43 LII Hoechst-Frankfurt Hg 150
44 Solvay Rheinberg D 200
45 Vestolit Marl Hg 180
46 Vinnolit Gendorf Hg 72
47 Wacker Burghausen Hg 157
1762 1446 844
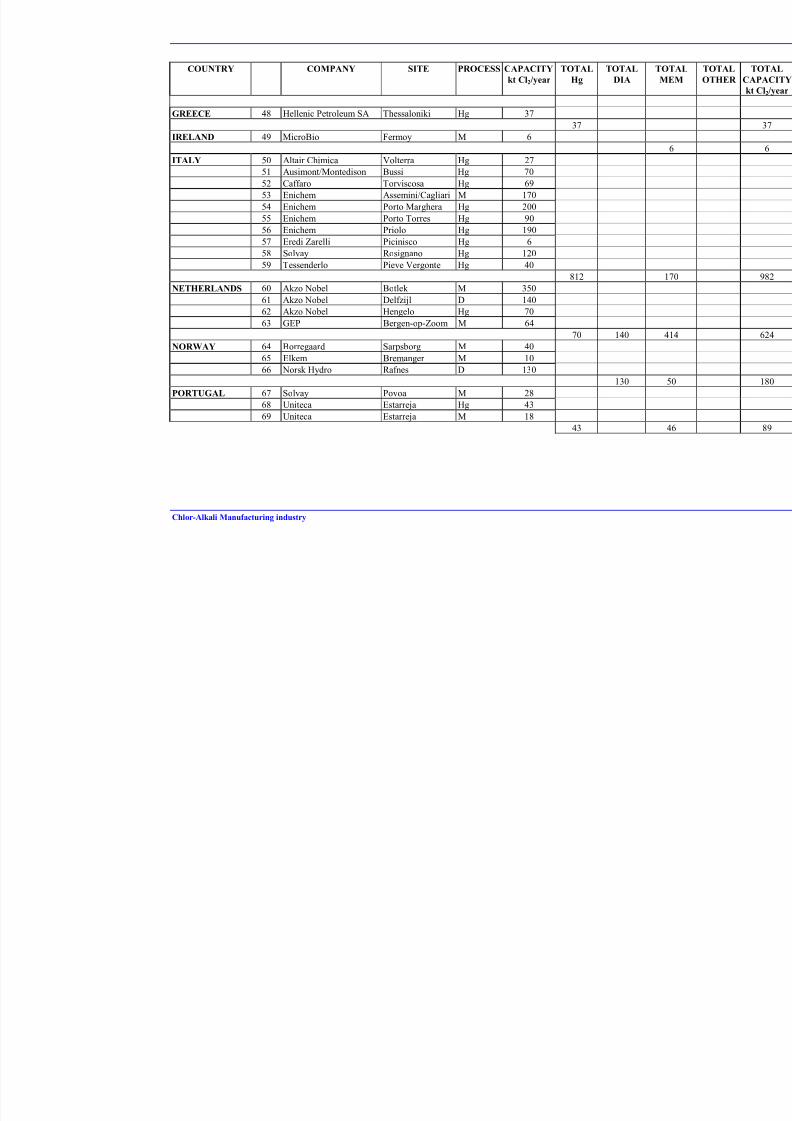
8/8/2019 Integrated Pollution Prevention and Control European Environment Comission
http://slidepdf.com/reader/full/integrated-pollution-prevention-and-control-european-environment-comission 139/178
Chlor-Alkali Manufacturing industry
COUNTRY COMPANY SITE PROCESS CAPACITY
kt Cl2/year
TOTAL
Hg
TOTAL
DIA
TOT
ME
GREECE 48 Hellenic Petroleum SA Thessaloniki Hg 37
37
IRELAND 49 MicroBio Fermoy M 66
ITALY 50 Altair Chimica Volterra Hg 27
51 Ausimont/Montedison Bussi Hg 70
52 Caffaro Torviscosa Hg 69
53 Enichem Assemini/Cagliari M 170
54 Enichem Porto Marghera Hg 200
55 Enichem Porto Torres Hg 90
56 Enichem Priolo Hg 190
57 Eredi Zarelli Picinisco Hg 6
58 Solvay Rosignano Hg 120
59 Tessenderlo Pieve Vergonte Hg 40
812 17NETHERLANDS 60 Akzo Nobel Botlek M 350
61 Akzo Nobel Delfzijl D 140
62 Akzo Nobel Hengelo Hg 70
63 GEP Bergen-op-Zoom M 64
70 140 414
NORWAY 64 Borregaard Sarpsborg M 40
65 Elkem Bremanger M 10
66 Norsk Hydro Rafnes D 130
130 50
PORTUGAL 67 Solvay Povoa M 28
68 Uniteca Estarreja Hg 43
69 Uniteca Estarreja M 1843 46

8/8/2019 Integrated Pollution Prevention and Control European Environment Comission
http://slidepdf.com/reader/full/integrated-pollution-prevention-and-control-european-environment-comission 140/178
Annex
124
COUNTRY COMPANY SITE PROCESS CAPACITY
kt Cl2/year
TOTAL
Hg
TOTAL
DIA
TOT
ME
SPAIN 70 EIASA (Aragonesas) Huelva Hg 101
71 EIASA (Aragonesas) Sabinanigo Hg 25
72 EIASA (Aragonesas) Villaseca Hg 13573 EIASA (Aragonesas) Villaseca M 40
74 Electroq. de Hernani Hernani Hg 15
75 Elnosa Lourizan Hg 33.5
76 Erkimia Flix Hg 150
77 Quimica del Cinca Monzon Hg 30
78 Solvay Martorell Hg 209
79 Solvay Torrelavega Hg 63
761.5 40
SWEDEN 80 Akzo Nobel Bohus Hg 100
81 Akzo Nobel Skoghall M 90
82 Hydro Polymers Stenungsund Hg 120
220 90SWITZERLAND 83 Novartis Monthey Hg 22
84 Säurefabrik
Schweizerhall
Pratteln Hg 26.5
85 Solvay Zurzach Hg 55
103.5
UK 86 Associated Octel Ellesmere Port M 40
87 Hays Sandbach Hg 89
88 ICI Lostock D 50
89 ICI Lostock M 20
90 ICI Runcorn Hg 738
91 ICI Runcorn M (KOH) 25
92 ICI Wilton D 17093 Rhodia Staveley Hg 29
94 Roche Dalry M 20
856 220 10
TOTAL 6241 2496 224
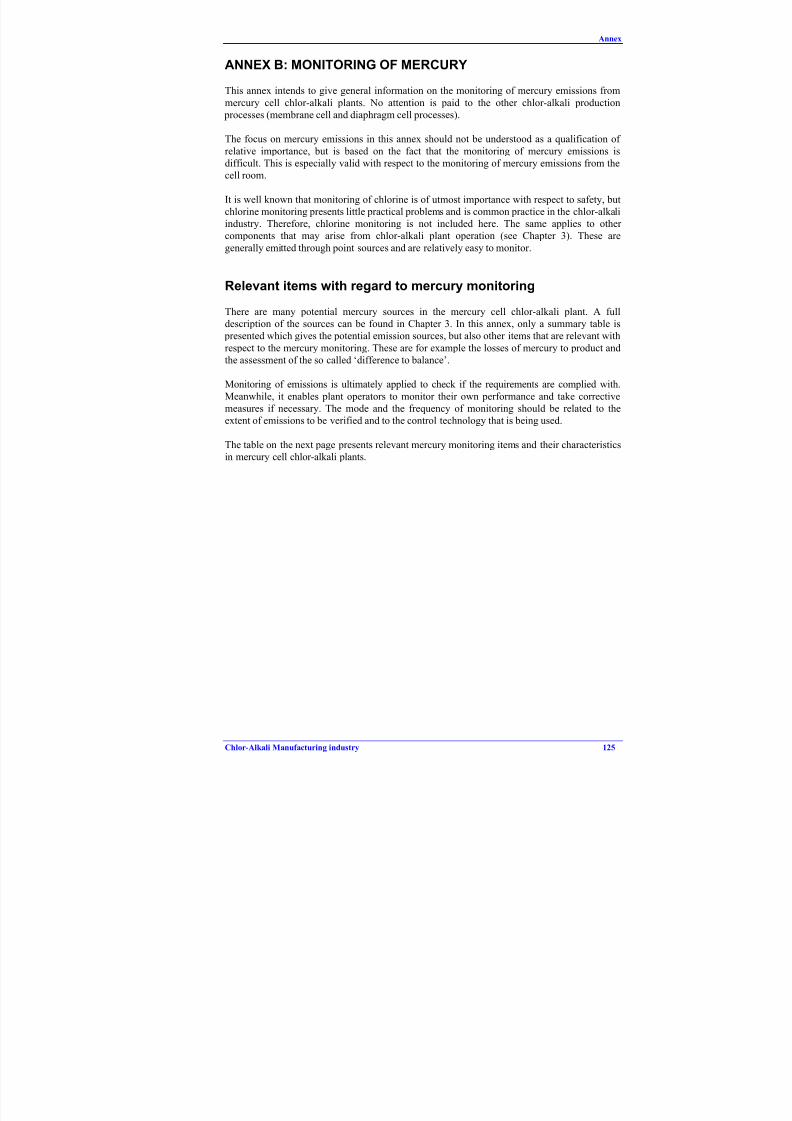
8/8/2019 Integrated Pollution Prevention and Control European Environment Comission
http://slidepdf.com/reader/full/integrated-pollution-prevention-and-control-european-environment-comission 141/178
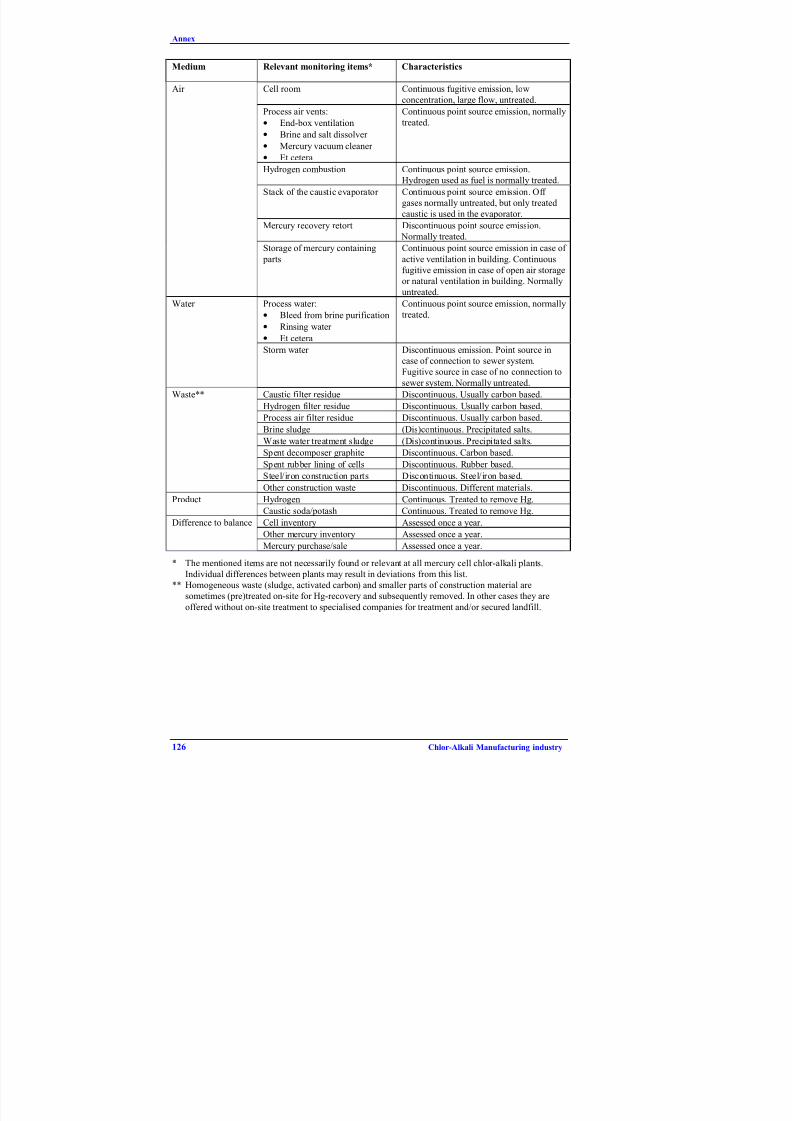
8/8/2019 Integrated Pollution Prevention and Control European Environment Comission
http://slidepdf.com/reader/full/integrated-pollution-prevention-and-control-european-environment-comission 142/178
Annex
126 Chlor-Alkali Manufacturing industry
Medium Relevant monitoring items* Characteristics
Air Cell room Continuous fugitive emission, low
concentration, large flow, untreated.
Process air vents:
• End-box ventilation
• Brine and salt dissolver • Mercury vacuum cleaner
• Et cetera
Continuous point source emission, normally
treated.
Hydrogen combustion Continuous point source emission.
Hydrogen used as fuel is normally treated.
Stack of the caustic evaporator Continuous point source emission. Off
gases normally untreated, but only treated
caustic is used in the evaporator.
Mercury recovery retort Discontinuous point source emission.
Normally treated.
Storage of mercury containing
parts
Continuous point source emission in case of
active ventilation in building. Continuous
fugitive emission in case of open air storage
or natural ventilation in building. Normally
untreated.
Water Process water:
• Bleed from brine purification
• Rinsing water
• Et cetera
Continuous point source emission, normally
treated.
Storm water Discontinuous emission. Point source in
case of connection to sewer system.
Fugitive source in case of no connection to
sewer system. Normally untreated.
Waste** Caustic filter residue Discontinuous. Usually carbon based.
Hydrogen filter residue Discontinuous. Usually carbon based.
Process air filter residue Discontinuous. Usually carbon based.Brine sludge (Dis)continuous. Precipitated salts.
Waste water treatment sludge (Dis)continuous. Precipitated salts.
Spent decomposer graphite Discontinuous. Carbon based.
Spent rubber lining of cells Discontinuous. Rubber based.
Steel/iron construction parts Discontinuous. Steel/iron based.
Other construction waste Discontinuous. Different materials.
Product Hydrogen Continuous. Treated to remove Hg.
Caustic soda/potash Continuous. Treated to remove Hg.
Difference to balance Cell inventory Assessed once a year.
Other mercury inventory Assessed once a year.
Mercury purchase/sale Assessed once a year.
* The mentioned items are not necessarily found or relevant at all mercury cell chlor-alkali plants.
Individual differences between plants may result in deviations from this list.
** Homogeneous waste (sludge, activated carbon) and smaller parts of construction material are
sometimes (pre)treated on-site for Hg-recovery and subsequently removed. In other cases they are
offered without on-site treatment to specialised companies for treatment and/or secured landfill.
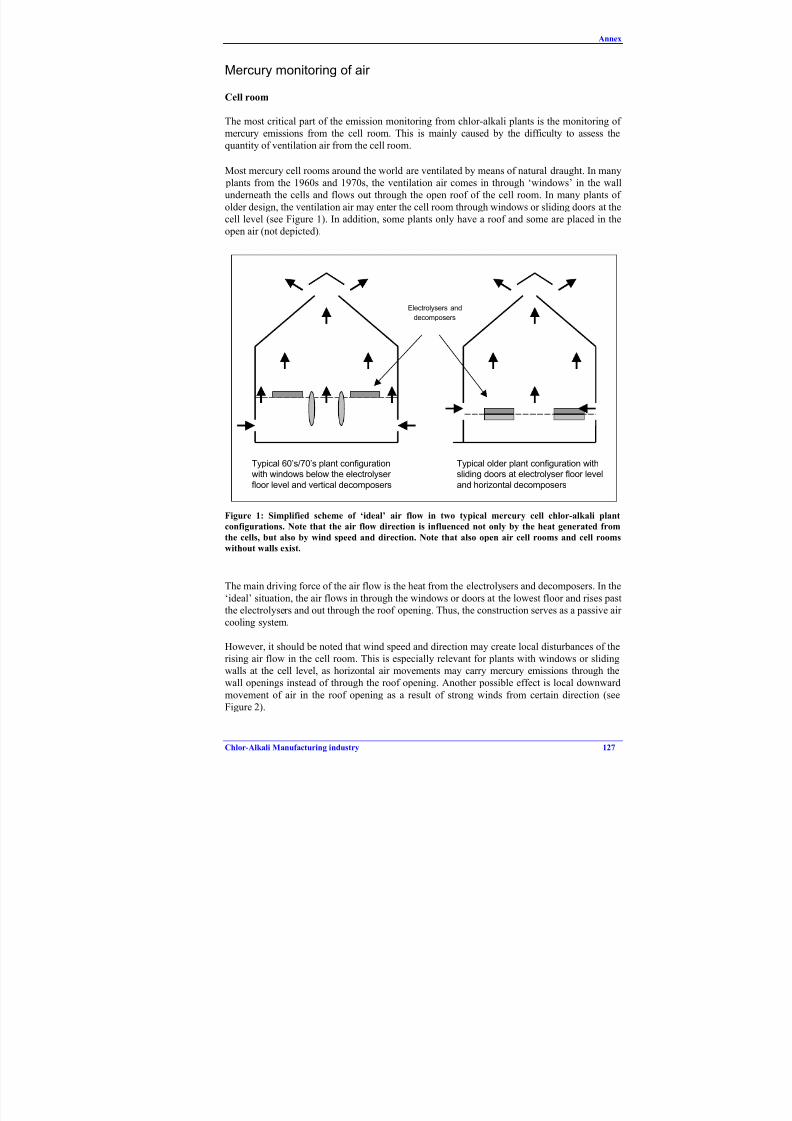
8/8/2019 Integrated Pollution Prevention and Control European Environment Comission
http://slidepdf.com/reader/full/integrated-pollution-prevention-and-control-european-environment-comission 143/178
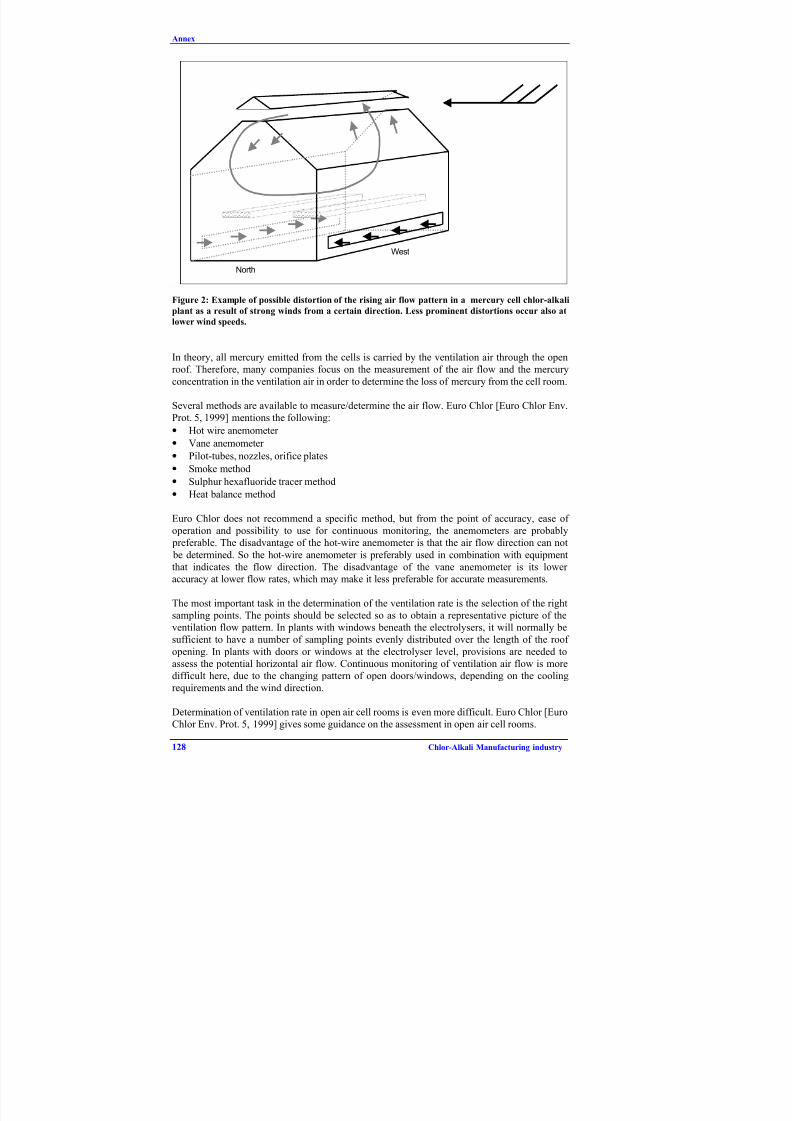
8/8/2019 Integrated Pollution Prevention and Control European Environment Comission
http://slidepdf.com/reader/full/integrated-pollution-prevention-and-control-european-environment-comission 144/178
Annex
128 Chlor-Alkali Manufacturing industry
North
West
Figure 2: Example of possible distortion of the rising air flow pattern in a mercury cell chlor-alkali
plant as a result of strong winds from a certain direction. Less prominent distortions occur also at
lower wind speeds.
In theory, all mercury emitted from the cells is carried by the ventilation air through the openroof. Therefore, many companies focus on the measurement of the air flow and the mercury
concentration in the ventilation air in order to determine the loss of mercury from the cell room.
Several methods are available to measure/determine the air flow. Euro Chlor [Euro Chlor Env.
Prot. 5, 1999] mentions the following:• Hot wire anemometer
• Vane anemometer
• Pilot-tubes, nozzles, orifice plates
• Smoke method
• Sulphur hexafluoride tracer method
• Heat balance method
Euro Chlor does not recommend a specific method, but from the point of accuracy, ease of operation and possibility to use for continuous monitoring, the anemometers are probably preferable. The disadvantage of the hot-wire anemometer is that the air flow direction can not
be determined. So the hot-wire anemometer is preferably used in combination with equipmentthat indicates the flow direction. The disadvantage of the vane anemometer is its lower accuracy at lower flow rates, which may make it less preferable for accurate measurements.
The most important task in the determination of the ventilation rate is the selection of the rightsampling points. The points should be selected so as to obtain a representative picture of theventilation flow pattern. In plants with windows beneath the electrolysers, it will normally besufficient to have a number of sampling points evenly distributed over the length of the roof
opening. In plants with doors or windows at the electrolyser level, provisions are needed toassess the potential horizontal air flow. Continuous monitoring of ventilation air flow is moredifficult here, due to the changing pattern of open doors/windows, depending on the cooling
requirements and the wind direction.
Determination of ventilation rate in open air cell rooms is even more difficult. Euro Chlor [EuroChlor Env. Prot. 5, 1999] gives some guidance on the assessment in open air cell rooms.
8/8/2019 Integrated Pollution Prevention and Control European Environment Comission
http://slidepdf.com/reader/full/integrated-pollution-prevention-and-control-european-environment-comission 145/178
Annex
Chlor-Alkali Manufacturing industry 129
The mercury concentration in the ventilation air can be determined by several methods. EuroChlor [Euro Chlor Env. Prot. 5, 1999] mentions four analytical methods and two physicaldetection methods.
Analytical:1. Absorption in acidified potassium permanganate (KMnO4).
2. Adsorption on cellulose powder and activated carbon, subsequent burning in an oxy-hydrogen flame followed by flameless atomic absorption spectrophotometry (AAS).
3. Adsorption of Hg on manganese dioxide (MnO2) and dissolution of the sample in aqua regia(HCl/HNO3).
4. Adsorption of mercury on gold wool.
Euro Chlor [Euro Chlor Anal.3-7, 1998 and Env. Prot. 5, 1999] does not recommend anyspecific method, but methods 2 and 3 are well validated and in addition to mercury vapour alsoallow determination of mercury aerosols. Analytical methods can be used for compliancemeasurements and for monitoring purposes.
Physical:
1. Portable UV mercury analyser 2. Portable Gold-film mercury analyser
The portable analysers can be used for quick indicative measurements. Especially tracing of mercury leaks and control of tightness of equipment can be very effectively done with portableanalysers. Due to the lower accuracy and reproducibility, they are less fit for compliancemeasurements.
Mercury monitoring of water
Monitoring will be made easier if all liquid effluent streams containing mercury are combinedin such a way that, after mercury removal, a single sampling point can be used to analyse theentire output from the mercury treatment plant.
Automatic flow proportional sampling together with flow recording is preferred. Automaticsampling and analysing equipment must be frequently checked by approved laboratorymethods. Analytical techniques have been developed by Euro Chlor [Euro Chlor Anal 3-7,1998].
If sludge (for example, brine purification sludge) is contained in the liquid effluent, specialsampling techniques must be applied since automatic analysers may not work properly.
Mercury monitoring of products
Chlorine
Chlorine, which has been cooled, dried and filtered, contains very little mercury (approximately1 mg/tonne Cl2). It is sufficient to check a few samples per year.
Most of the mercury entrained by the chlorine from the cells is trapped in the condensates fromcooling and in the sulphuric acid from the drying towers. If these liquids are not discharged intothe plant effluent system, a sampling and analysis scheme is required.
Moist chlorine (cell gas and waste gases not sent to a drying unit) contains mercury and willcontaminate the liquor of caustic absorption towers and/or other products manufactured. In this

8/8/2019 Integrated Pollution Prevention and Control European Environment Comission
http://slidepdf.com/reader/full/integrated-pollution-prevention-and-control-european-environment-comission 146/178
Annex
130 Chlor-Alkali Manufacturing industry
case, sampling and analysing of the moist chlorine or the reaction products at reasonableintervals may be necessary. However, since flow metering of moist chlorine is not easy,analyses and measurements of the reaction products are often more accurate.
Sodium and potassium hydroxide
Caustic and potassium hydroxide solutions leaving the cells are saturated with mercury. Theyhave to be filtered and cooled. After filtration, the liquors contain only small amounts of
mercury (10-100 mg/tonne caustic). Sampling and analysis are not a particular problem andsampling and analysis frequencies are generally high in order to meet customers specifications.
Hydrogen
Hydrogen sampling after a mercury removal unit poses few problems; if there are aerosols froma washing step, isokinetic sampling is recommended.
Since the concentration of mercury after removal unit is very low, the analysis frequency isnormally not relevant to measuring emissions but is necessary for control of the removal process performance.
However, the mercury concentration in pre-treatment hydrogen streams can be high. Anyemergency venting of cell hydrogen or by-passing of the treatment plant for, say, maintenance purposes should be recorded as even a few hours operation without treatment may result inemissions equal to several weeks normal operation.
Mercury accumulation in equipment and wastes
Although it would appear to be simple to balance mercury purchases against mercuryemissions, in practice this is almost impossible since accumulation of mercury in processequipment, in residues awaiting treatment and in non-recovered deposited solid wastes are
significantly larger than the emissions themselves.
These accumulations provide a large proportion of what is known as Difference to Balance(DB). [Euro Chlor Env. Prot. 12, 1998] describes the components of DB in detail.
Regular monitoring and analysis of the accumulations and wastes are nearly impossible.Techniques which may assist include drainage and cleaning prior to any balance, sampling anddevelopment of ‘standard’ concentrations combined with weighings.
The analytical techniques developed by Euro Chlor [Euro Chlor Anal 3-7, 1998] can be usedfor all waste streams.
Mercury in equipment other than cells
Some equipment can be drained periodically (e.g. tanks, catch-pots, traps). Equipment of thistype should be purged just prior to making the balance and the recovered mercury weighed and
returned to stock.
Sewers, traps and mercury sumps should be cleaned and the mercury recovered shortly beforemaking any balance.

8/8/2019 Integrated Pollution Prevention and Control European Environment Comission
http://slidepdf.com/reader/full/integrated-pollution-prevention-and-control-european-environment-comission 147/178
Annex
Chlor-Alkali Manufacturing industry 131
There are other pieces of equipment (headers, - mainly wash water, hydrogen, brine, caustic -,stock tanks, etc.) which can only be drained during plant stoppages. For this type of equipment,experiments have shown that very significant quantities of mercury can accumulate. Theequilibrium level of mercury in a header is sometimes reached only after several years of
operation.
Mercury in sludges and wastes temporarily stored on site
Dispersed mercury in sludges tends to agglomerate and settle. It is therefore very difficult toobtain representative samples from sludges such as caustic filtration filtercake, thick mercuryand cell room dirt.
The best solution to this problem is to treat, as far as possible, all sludges for mercury recovery before making the balance.
For those sludges for which recovery is not possible and for which a full analysis of the
mercury content is not practical, it is suggested that detailed analyses are done on samples of
each type of waste to establish a plant standard and that these are then used in combination withweighing of each quantity stored to obtain the mercury content.
Mercury-containing wastes removed to safe authorised disposal sites
Sampling of the mercury content of some of these components may be difficult. Guidance can
be found in Euro Chlor documents [Euro Chlor Env. Prot. 3, 1999]. It is suggested that adetailed analysis is done on a sample of each type of waste to establish a plant standard and thatthis is then used in combination with weighing of each load leaving the site to obtain themercury content.
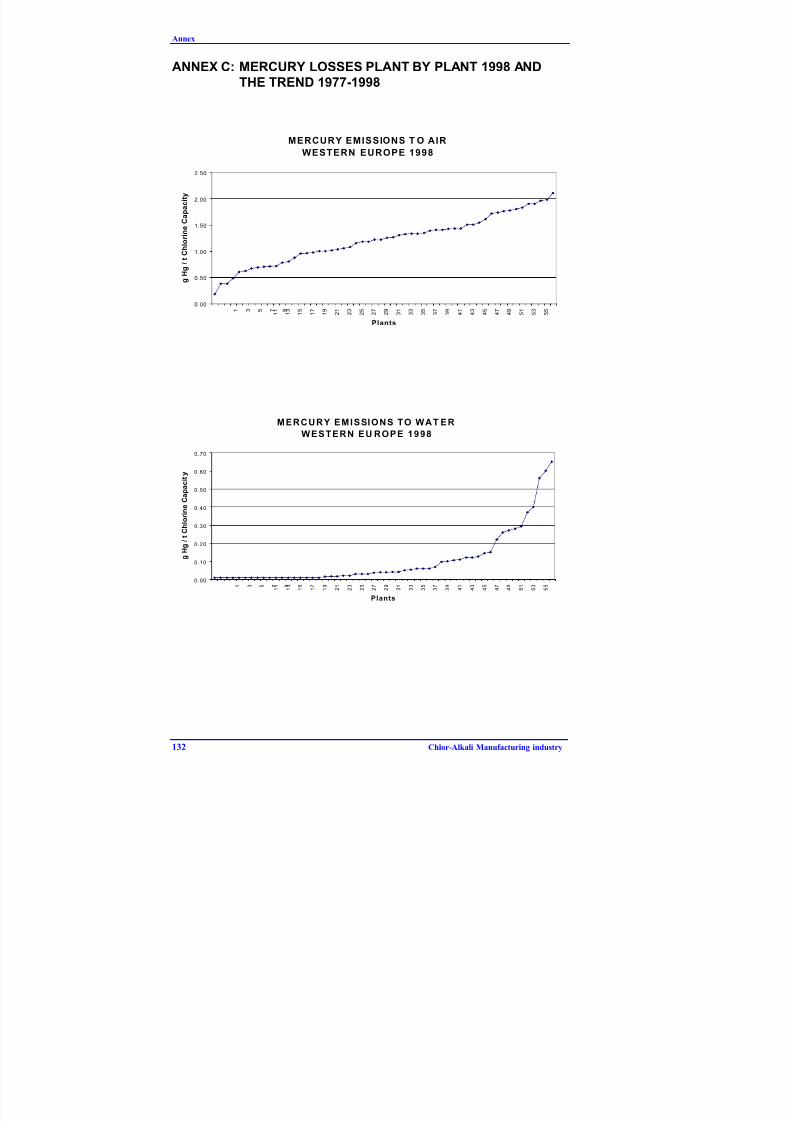
8/8/2019 Integrated Pollution Prevention and Control European Environment Comission
http://slidepdf.com/reader/full/integrated-pollution-prevention-and-control-european-environment-comission 148/178
Annex
132 Chlor-Alkali Manufacturing industry
ANNEX C: MERCURY LOSSES PLANT BY PLANT 1998 AND
THE TREND 1977-1998
MERCURY EMISSIONS T O AIRWESTERN EUROPE 1998
0.00
0.50
1.00
1.50
2.00
2.50
1 3 5 7 9 1 1
1 3
1 5
1 7
1 9
2 1
2 3
2 5
2 7
2 9
3 1
3 3
3 5
3 7
3 9
4 1
4 3
4 5
4 7
4 9
5 1
5 3
5 5
Plants
g
H g
/ t C h l o r i n e
C a p a c i t y
MERCURY EMISSIONS TO WAT ER
WESTERN EU ROPE 1998
0.00
0.10
0.20
0.30
0.40
0.50
0.60
0.70
1 3 5 7 9 1 1
1 3
1 5
1 7
1 9
2 1
2 3
2 5
2 7
2 9
3 1
3 3
3 5
3 7
3 9
4 1
4 3
4 5
4 7
4 9
5 1
5 3
5 5
Plants
g
H g
/ t C h l o r i n e
C a p a c i t
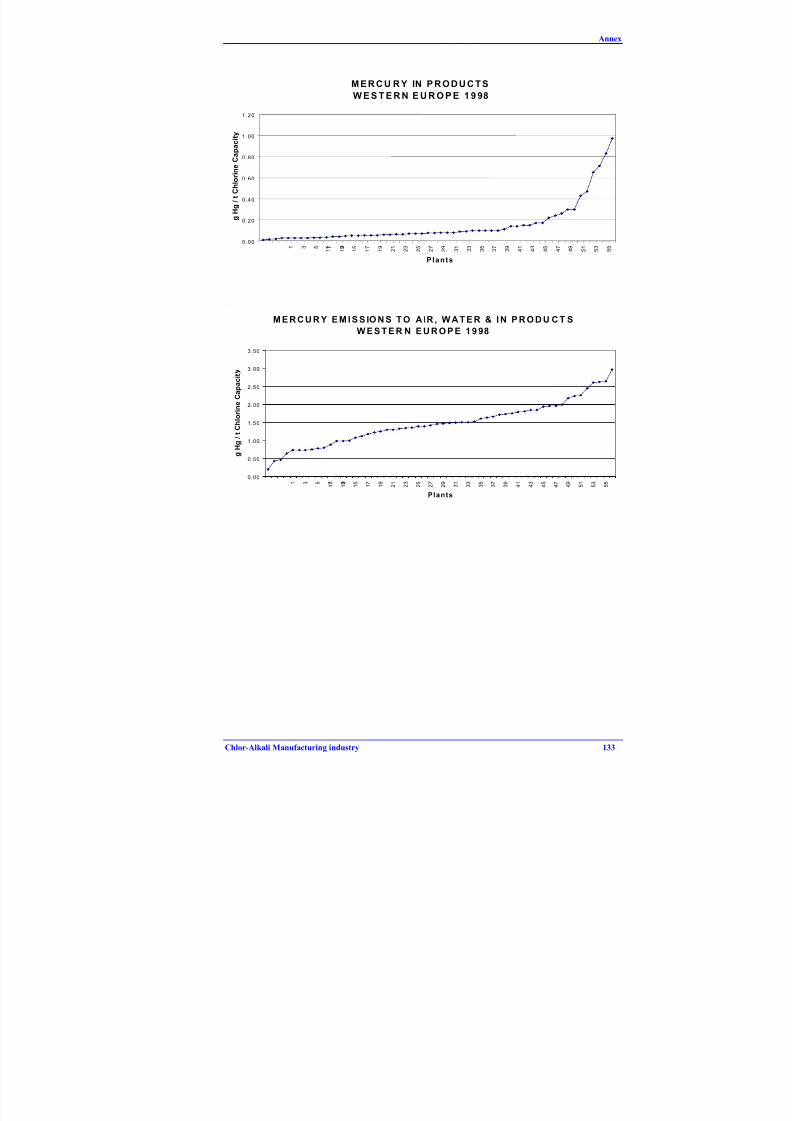
8/8/2019 Integrated Pollution Prevention and Control European Environment Comission
http://slidepdf.com/reader/full/integrated-pollution-prevention-and-control-european-environment-comission 149/178
Annex
Chlor-Alkali Manufacturing industry 133
M E R C U R Y IN P R O D U C T S
W E S T E R N E U R O P E 1 9 98
0.00
0.20
0.40
0.60
0.80
1.00
1.20
1 3 5 7 9 1 1
1 3
1 5
1 7
1 9
2 1
2 3
2 5
2 7
2 9
3 1
3 3
3 5
3 7
3 9
4 1
4 3
4 5
4 7
4 9
5 1
5 3
5 5
Plants
g
H g
/ t C h l o r i n e
C a p a c i t y
M E R C U R Y E M I S S IO N S T O A IR , W A T E R & I N P R O D U C T S
W E S T E R N E U R O P E 1 9 98
0.00
0.50
1.00
1.50
2.00
2.50
3.00
3.50
1 3 5 7 9 1 1
1 3
1 5
1 7
1 9
2 1
2 3
2 5
2 7
2 9
3 1
3 3
3 5
3 7
3 9
4 1
4 3
4 5
4 7
4 9
5 1
5 3
5 5
Plants
g
H g
/ t C h l o r i n e
C a p a c i t

8/8/2019 Integrated Pollution Prevention and Control European Environment Comission
http://slidepdf.com/reader/full/integrated-pollution-prevention-and-control-european-environment-comission 150/178
Annex
134 Chlor-Alkali Manufacturing industry
MERCURY IN SOLIDS DISPOSAL
WESTERN EUROPE 1998
0.00
10.00
20.00
30.00
40.00
50.00
60.00
70.00
80.00
90.00
1 3 5 7 9 1 1
1 3
1 5
1 7
1 9
2 1
2 3
2 5
2 7
2 9
3 1
3 3
3 5
3 7
3 9
4 1
4 3
4 5
4 7
4 9
5 1
5 3
5 5
Plants
g
H g
/ t C h l o r i n e C a p a c
i t y
MERCURY D IFFERENCE TO BALANCE
WESTERN EUROPE 1998
-40.00
-30.00
-20.00
-10.00
0.00
10.00
20.00
30.00
40.00
1 3 5 7 9 1 1
1 3
1 5
1 7
1 9
2 1
2 3
2 5
2 7
2 9
3 1
3 3
3 5
3 7
3 9
4 1
4 3
4 5
4 7
4 9
5 1
5 3
5 5
Plants
g
H g
/ t C h l o r i n e C a p a c i t y

8/8/2019 Integrated Pollution Prevention and Control European Environment Comission
http://slidepdf.com/reader/full/integrated-pollution-prevention-and-control-european-environment-comission 151/178
Chlor-Alkali Manufacturing industry
Mercury Emissions 1977-1998
Euro Chlor: W. Europe
Total Emissions (g Hg/t chlorine capacity)26.6
16.1
14.7 14.2
11.810.8
10.09.1
8.1 8.07.4
5.95.1
4.1 4.33.6
2.8 2
0
5
10
15
20
25
30
1977 1978 1979 1980 1981 1982 1983 1984 1985 1986 1987 1988 1989 1990 1991 1992 1993 19
8/8/2019 Integrated Pollution Prevention and Control European Environment Comission
http://slidepdf.com/reader/full/integrated-pollution-prevention-and-control-european-environment-comission 152/178
Annex
136 Chlor-Alkali Manufacturing industry
ANNEX D: NATIONAL AND INTERNATIONAL LEGISLATION
Flemish legislation concerning the Chlor-alkali industry
The environmental permit of a company in Flanders is written in accordance with the Flemish
environmental legislation, called “Vlarem”. The Chlor-Alkali industry is part of the ChemicalIndustry and has to follow the same general legislation. Chapter 5.7 in part 5 of VLAREM 2states the specific sectoral environmental conditions for the Chlor-Alkali Industry.
Section 5.7.5. Production of chlorine
Art. 5.7.5.1.
§1.The regulations of this section are applicable to the businesses mentioned in subdivision 7.5of the list of classification (Vlarem 1).
§2.In contravention to and as a supplement to the regulations of section 4.4.3 the followingemission limit values apply for:
1. chlorine:a. installations for the production of chlorine with complete liquefaction: 6 mg/Nm3
b. in other cases: 1 mg/Nm3
2. mercury and its compounds:
a. at a mass flow of 1 g/u or more: 0.2 mg/Nm3
b. with chlor-alkali electrolysis according to the amalgam process the emissions of mercury in the exhaust air from the cell room may not exceed, a yearly average of:i. 1.5 g per tonne chlorine production, for new installations;ii. 2 g per tonne chlorine production, for existing installations;
iii. the mercury in the hydrogen emitted in the atmosphere or burned, is included
in this limit value.§3.The construction of new installations for the production of chlorine according to the
mercury process will not be permitted any more. The mercury process can not be used after
the year 2010.
Summary of current German legislation relevant for the sector
of Chlor - alkali industry
Introduction
Important regulations relevant for industrial installations in Germany are laid down in theFederal Immission Control Act [Bundesimmissionsschutzgesetz - BImSchG], the Federal Water Act [Wasserhaushaltsgesetz - WHG] and the Federal Recycling and Waste Management Act[Kreislaufwirtschafts- und Abfallgesetz - KrW-/AbfG]. Germany uses a segregated media permitting system for different environmental media, but the final decision on an application is
reached by the assessment of environmental impacts on all media by the local authorities. Alsonoise requirements are considered in the licensing procedure, whereby Germany aims atfavouring pollution prevention. The “precautionary principle” has a legal status which permitsthe settings of standards. Legal standards are not subject to any negotiation in the licensing
process in Germany.
In compliance with the federal structure of Germany, the implementation of environmental lawsand decrees is under the responsibility of the federal states (Bundesländer), which may
implement the administrative procedure differently. For new plants, that are regarded as
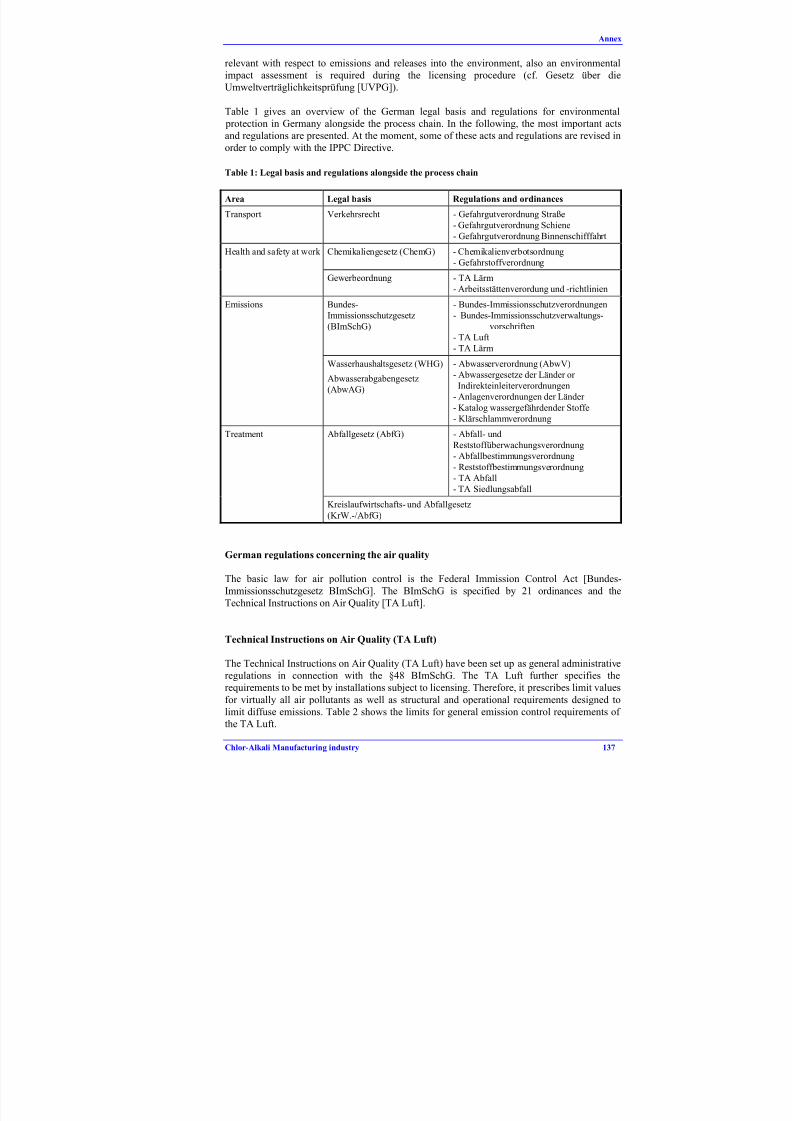
8/8/2019 Integrated Pollution Prevention and Control European Environment Comission
http://slidepdf.com/reader/full/integrated-pollution-prevention-and-control-european-environment-comission 153/178
Annex
Chlor-Alkali Manufacturing industry 137
relevant with respect to emissions and releases into the environment, also an environmentalimpact assessment is required during the licensing procedure (cf. Gesetz über dieUmweltverträglichkeitsprüfung [UVPG]).
Table 1 gives an overview of the German legal basis and regulations for environmental protection in Germany alongside the process chain. In the following, the most important acts
and regulations are presented. At the moment, some of these acts and regulations are revised inorder to comply with the IPPC Directive.
Table 1: Legal basis and regulations alongside the process chain
Area Legal basis Regulations and ordinances
Transport Verkehrsrecht - Gefahrgutverordnung Straße
- Gefahrgutverordnung Schiene
- Gefahrgutverordnung Binnenschifffahrt
Health and safety at work Chemikaliengesetz (ChemG) - Chemikalienverbotsordnung
- Gefahrstoffverordnung
Gewerbeordnung - TA Lärm- Arbeitsstättenverordung und -richtlinien
Emissions Bundes-
Immissionsschutzgesetz
(BImSchG)
- Bundes-Immissionsschutzverordnungen
- Bundes-Immissionsschutzverwaltungs-
vorschriften
- TA Luft
- TA Lärm
Wasserhaushaltsgesetz (WHG)
Abwasserabgabengesetz
(AbwAG)
- Abwasserverordnung (AbwV)
- Abwassergesetze der Länder or
Indirekteinleiterverordnungen
- Anlagenverordnungen der Länder
- Katalog wassergefährdender Stoffe
- Klärschlammverordnung
Treatment Abfallgesetz (AbfG) - Abfall- und
Reststoffüberwachungsverordnung
- Abfallbestimmungsverordnung
- Reststoffbestimmungsverordnung
- TA Abfall
- TA Siedlungsabfall
Kreislaufwirtschafts- und Abfallgesetz
(KrW.-/AbfG)
German regulations concerning the air quality
The basic law for air pollution control is the Federal Immission Control Act [Bundes-
Immissionsschutzgesetz BImSchG]. The BImSchG is specified by 21 ordinances and theTechnical Instructions on Air Quality [TA Luft].
Technical Instructions on Air Quality (TA Luft)
The Technical Instructions on Air Quality (TA Luft) have been set up as general administrativeregulations in connection with the §48 BImSchG. The TA Luft further specifies the
requirements to be met by installations subject to licensing. Therefore, it prescribes limit valuesfor virtually all air pollutants as well as structural and operational requirements designed tolimit diffuse emissions. Table 2 shows the limits for general emission control requirements of the TA Luft.
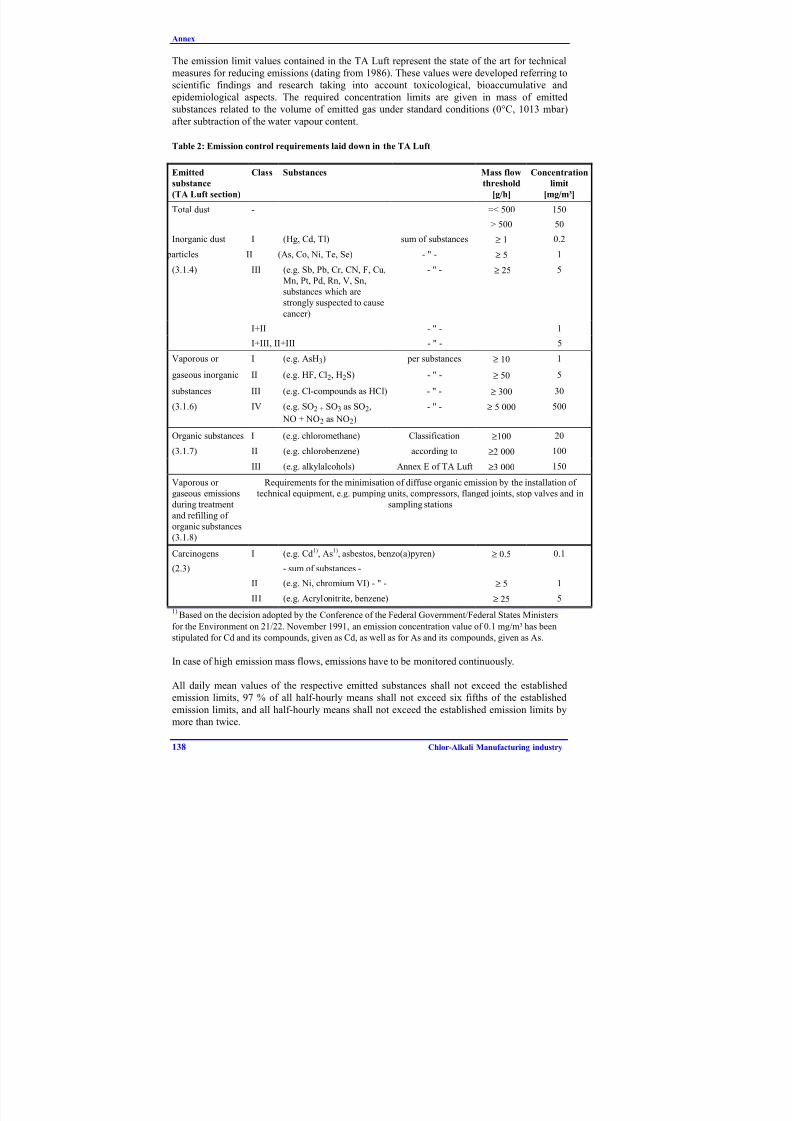
8/8/2019 Integrated Pollution Prevention and Control European Environment Comission
http://slidepdf.com/reader/full/integrated-pollution-prevention-and-control-european-environment-comission 154/178
Annex
138 Chlor-Alkali Manufacturing industry
The emission limit values contained in the TA Luft represent the state of the art for technicalmeasures for reducing emissions (dating from 1986). These values were developed referring toscientific findings and research taking into account toxicological, bioaccumulative andepidemiological aspects. The required concentration limits are given in mass of emittedsubstances related to the volume of emitted gas under standard conditions (0°C, 1013 mbar)
after subtraction of the water vapour content.
Table 2: Emission control requirements laid down in the TA Luft
Emitted
substance
(TA Luft section)
Class Substances Mass flow
threshold
[g/h]
Concentration
limit
[mg/m³]
Total dust - =< 500
> 500
150
50
Inorganic dust I (Hg, Cd, Tl) sum of substances ≥ 1 0.2
particles II (As, Co, Ni, Te, Se) - " - ≥ 5 1
(3.1.4) III (e.g. Sb, Pb, Cr, CN, F, Cu,
Mn, Pt, Pd, Rn, V, Sn,substances which are
strongly suspected to cause
cancer)
- " - ≥ 25 5
I+II - " - 1
I+III, II+III - " - 5
Vaporous or I (e.g. AsH3) per substances ≥ 10 1
gaseous inorganic II (e.g. HF, Cl2, H2S) - " - ≥ 50 5
substances III (e.g. Cl-compounds as HCl) - " - ≥ 300 30
(3.1.6) IV (e.g. SO2 + SO3 as SO2,
NO + NO2 as NO2)
- " - ≥ 5 000 500
Organic substances I (e.g. chloromethane) Classification ≥100 20
(3.1.7) II (e.g. chlorobenzene) according to ≥2 000 100
III (e.g. alkylalcohols) Annex E of TA Luft ≥3 000 150
Vaporous or
gaseous emissions
during treatment
and refilling of
organic substances
(3.1.8)
Requirements for the minimisation of diffuse organic emission by the installation of
technical equipment, e.g. pumping units, compressors, flanged joints, stop valves and in
sampling stations
Carcinogens(2.3)
I (e.g. Cd1)
, As1)
, asbestos, benzo(a)pyren)- sum of substances -
≥ 0.5 0.1
II (e.g. Ni, chromium VI) - " - ≥ 5 1
III (e.g. Acrylonitrite, benzene) ≥ 25 5
1)Based on the decision adopted by the Conference of the Federal Government/Federal States Ministers
for the Environment on 21/22. November 1991, an emission concentration value of 0.1 mg/m³ has been
stipulated for Cd and its compounds, given as Cd, as well as for As and its compounds, given as As.
In case of high emission mass flows, emissions have to be monitored continuously.
All daily mean values of the respective emitted substances shall not exceed the establishedemission limits, 97 % of all half-hourly means shall not exceed six fifths of the established
emission limits, and all half-hourly means shall not exceed the established emission limits bymore than twice.
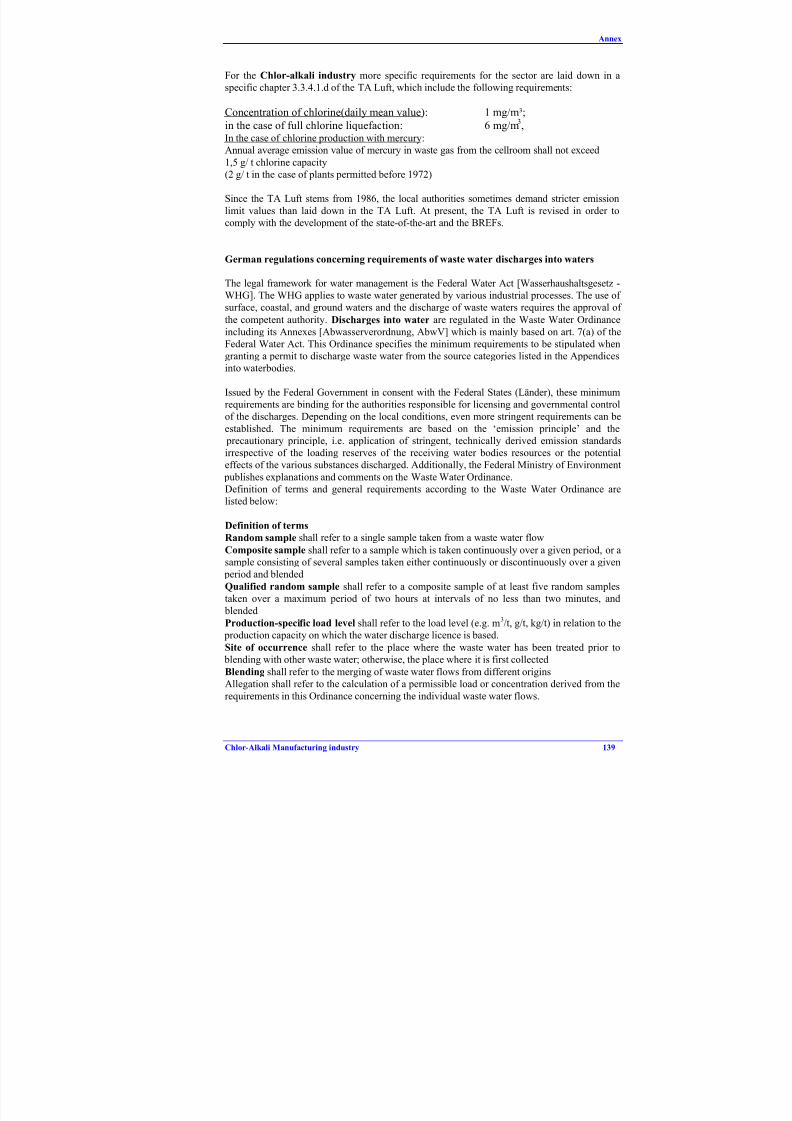
8/8/2019 Integrated Pollution Prevention and Control European Environment Comission
http://slidepdf.com/reader/full/integrated-pollution-prevention-and-control-european-environment-comission 155/178
Annex
Chlor-Alkali Manufacturing industry 139
For the Chlor-alkali industry more specific requirements for the sector are laid down in aspecific chapter 3.3.4.1.d of the TA Luft, which include the following requirements:
Concentration of chlorine(daily mean value): 1 mg/m³;
in the case of full chlorine liquefaction: 6 mg/m3,
In the case of chlorine production with mercury:Annual average emission value of mercury in waste gas from the cellroom shall not exceed
1,5 g/ t chlorine capacity(2 g/ t in the case of plants permitted before 1972)
Since the TA Luft stems from 1986, the local authorities sometimes demand stricter emission
limit values than laid down in the TA Luft. At present, the TA Luft is revised in order tocomply with the development of the state-of-the-art and the BREFs.
German regulations concerning requirements of waste water discharges into waters
The legal framework for water management is the Federal Water Act [Wasserhaushaltsgesetz -WHG]. The WHG applies to waste water generated by various industrial processes. The use of surface, coastal, and ground waters and the discharge of waste waters requires the approval of
the competent authority. Discharges into water are regulated in the Waste Water Ordinance
including its Annexes [Abwasserverordnung, AbwV] which is mainly based on art. 7(a) of theFederal Water Act. This Ordinance specifies the minimum requirements to be stipulated whengranting a permit to discharge waste water from the source categories listed in the Appendicesinto waterbodies.
Issued by the Federal Government in consent with the Federal States (Länder), these minimumrequirements are binding for the authorities responsible for licensing and governmental control
of the discharges. Depending on the local conditions, even more stringent requirements can beestablished. The minimum requirements are based on the ‘emission principle’ and the precautionary principle, i.e. application of stringent, technically derived emission standardsirrespective of the loading reserves of the receiving water bodies resources or the potentialeffects of the various substances discharged. Additionally, the Federal Ministry of Environment
publishes explanations and comments on the Waste Water Ordinance.Definition of terms and general requirements according to the Waste Water Ordinance arelisted below:
Definition of terms
Random sample shall refer to a single sample taken from a waste water flow
Composite sample shall refer to a sample which is taken continuously over a given period, or asample consisting of several samples taken either continuously or discontinuously over a given period and blended
Qualified random sample shall refer to a composite sample of at least five random samplestaken over a maximum period of two hours at intervals of no less than two minutes, and
blended
Production-specific load level shall refer to the load level (e.g. m3/t, g/t, kg/t) in relation to the production capacity on which the water discharge licence is based.
Site of occurrence shall refer to the place where the waste water has been treated prior to blending with other waste water; otherwise, the place where it is first collected
Blending shall refer to the merging of waste water flows from different originsAllegation shall refer to the calculation of a permissible load or concentration derived from the
requirements in this Ordinance concerning the individual waste water flows.
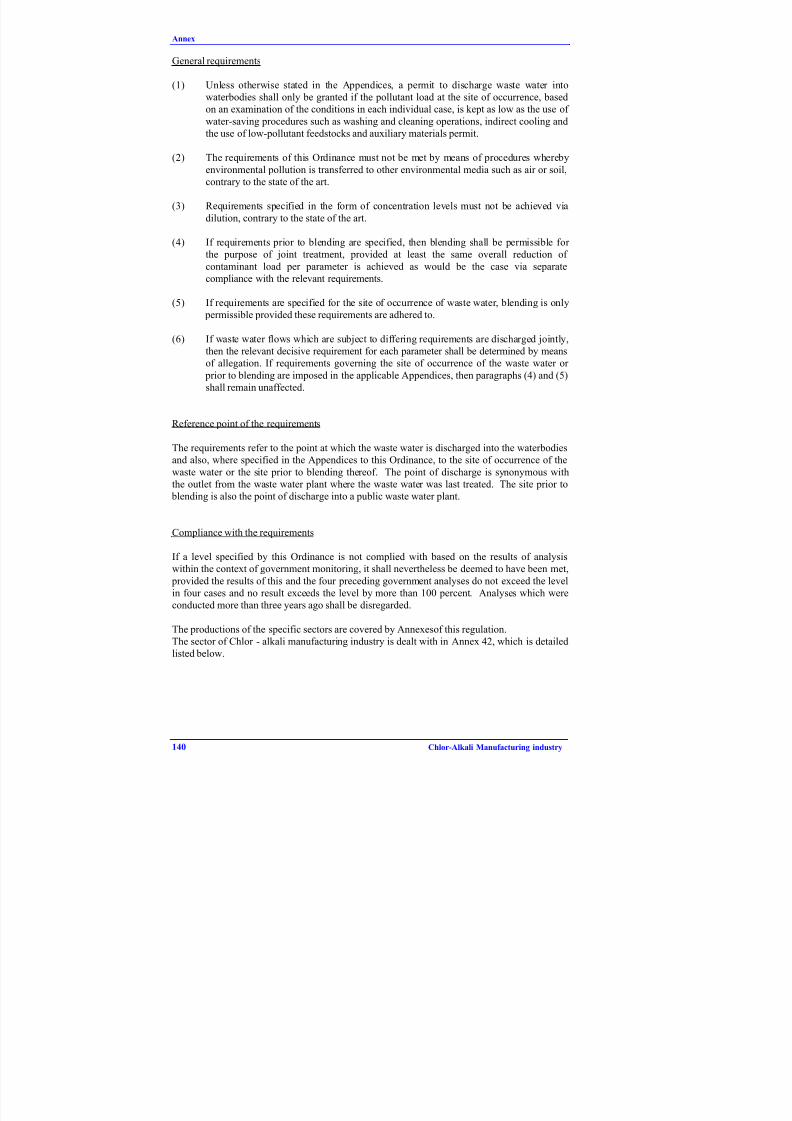
8/8/2019 Integrated Pollution Prevention and Control European Environment Comission
http://slidepdf.com/reader/full/integrated-pollution-prevention-and-control-european-environment-comission 156/178
Annex
140 Chlor-Alkali Manufacturing industry
General requirements
(1) Unless otherwise stated in the Appendices, a permit to discharge waste water intowaterbodies shall only be granted if the pollutant load at the site of occurrence, basedon an examination of the conditions in each individual case, is kept as low as the use of
water-saving procedures such as washing and cleaning operations, indirect cooling and
the use of low-pollutant feedstocks and auxiliary materials permit.
(2) The requirements of this Ordinance must not be met by means of procedures whereby
environmental pollution is transferred to other environmental media such as air or soil,contrary to the state of the art.
(3) Requirements specified in the form of concentration levels must not be achieved via
dilution, contrary to the state of the art.
(4) If requirements prior to blending are specified, then blending shall be permissible for the purpose of joint treatment, provided at least the same overall reduction of
contaminant load per parameter is achieved as would be the case via separate
compliance with the relevant requirements.
(5) If requirements are specified for the site of occurrence of waste water, blending is only permissible provided these requirements are adhered to.
(6) If waste water flows which are subject to differing requirements are discharged jointly,then the relevant decisive requirement for each parameter shall be determined by meansof allegation. If requirements governing the site of occurrence of the waste water or
prior to blending are imposed in the applicable Appendices, then paragraphs (4) and (5)shall remain unaffected.
Reference point of the requirements
The requirements refer to the point at which the waste water is discharged into the waterbodiesand also, where specified in the Appendices to this Ordinance, to the site of occurrence of the
waste water or the site prior to blending thereof. The point of discharge is synonymous withthe outlet from the waste water plant where the waste water was last treated. The site prior to blending is also the point of discharge into a public waste water plant.
Compliance with the requirements
If a level specified by this Ordinance is not complied with based on the results of analysiswithin the context of government monitoring, it shall nevertheless be deemed to have been met,
provided the results of this and the four preceding government analyses do not exceed the levelin four cases and no result exceeds the level by more than 100 percent. Analyses which wereconducted more than three years ago shall be disregarded.
The productions of the specific sectors are covered by Annexesof this regulation.The sector of Chlor - alkali manufacturing industry is dealt with in Annex 42, which is detailedlisted below.
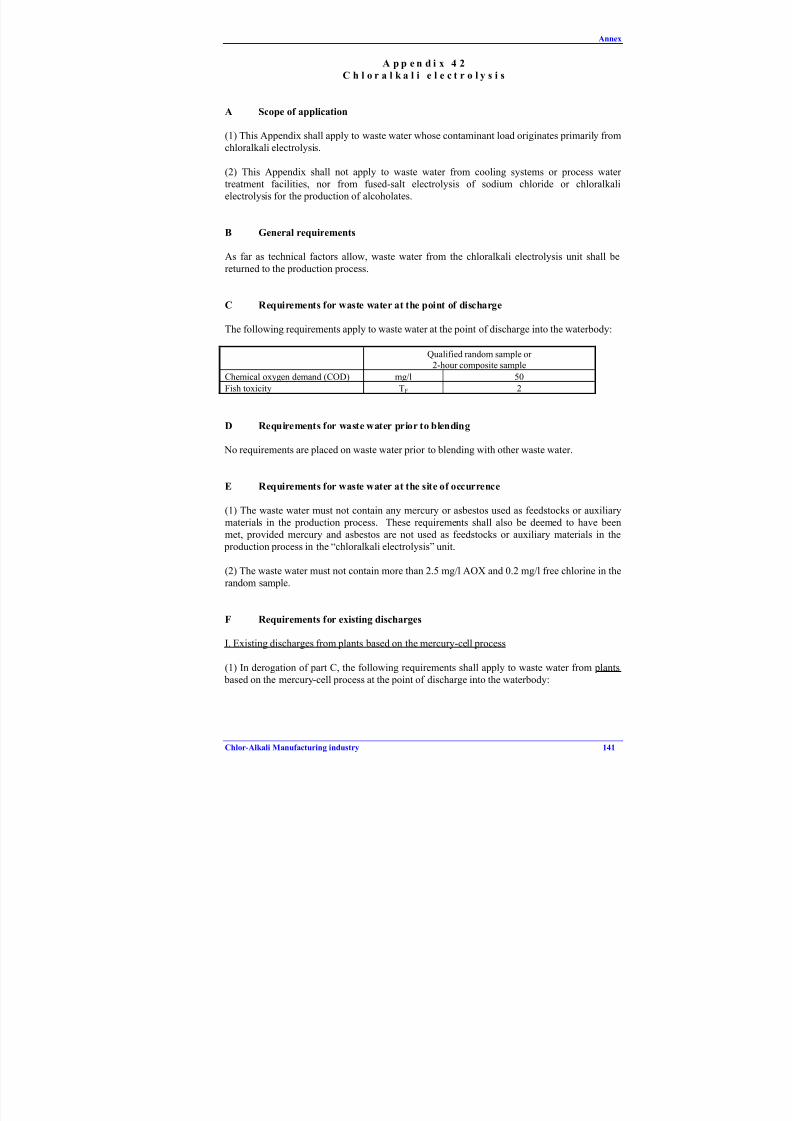
8/8/2019 Integrated Pollution Prevention and Control European Environment Comission
http://slidepdf.com/reader/full/integrated-pollution-prevention-and-control-european-environment-comission 157/178
Annex
Chlor-Alkali Manufacturing industry 141
A p p e n d i x 4 2
C h l o r a l k a l i e l e c t r o l y s i s
A Scope of application
(1) This Appendix shall apply to waste water whose contaminant load originates primarily fromchloralkali electrolysis.
(2) This Appendix shall not apply to waste water from cooling systems or process water treatment facilities, nor from fused-salt electrolysis of sodium chloride or chloralkalielectrolysis for the production of alcoholates.
B General requirements
As far as technical factors allow, waste water from the chloralkali electrolysis unit shall be
returned to the production process.
C Requirements for waste water at the point of discharge
The following requirements apply to waste water at the point of discharge into the waterbody:
Qualified random sample or
2-hour composite sample
Chemical oxygen demand (COD) mg/l 50
Fish toxicity TF 2
D Requirements for waste water prior to blending
No requirements are placed on waste water prior to blending with other waste water.
E Requirements for waste water at the site of occurrence
(1) The waste water must not contain any mercury or asbestos used as feedstocks or auxiliarymaterials in the production process. These requirements shall also be deemed to have beenmet, provided mercury and asbestos are not used as feedstocks or auxiliary materials in the production process in the “chloralkali electrolysis” unit.
(2) The waste water must not contain more than 2.5 mg/l AOX and 0.2 mg/l free chlorine in therandom sample.
F Requirements for existing discharges
I. Existing discharges from plants based on the mercury-cell process
(1) In derogation of part C, the following requirements shall apply to waste water from plants based on the mercury-cell process at the point of discharge into the waterbody:

8/8/2019 Integrated Pollution Prevention and Control European Environment Comission
http://slidepdf.com/reader/full/integrated-pollution-prevention-and-control-european-environment-comission 158/178
Annex
142 Chlor-Alkali Manufacturing industry
Qualified random sample or
2-hour composite sample
Chemical oxygen demand mg/l 50
Total mercury mg/l
g/t
0.05
0.3
Sulphide mg/l 1
Fish toxicity TF 2
(2) In derogation of part D, the following requirements shall apply to waste water from the
chloralkali electrolysis unit based on the mercury-cell process prior to blending with other waste water:
Total mercury 0.04 g/t Qualified random sample or 2-hour composite sample
AOX 3.5 mg/l Random sample
(3) The requirements for mercury given as production-specific load levels refer to the chlorine
production capacity in 24 hours.
(4) Part E shall not apply.
II. Existing discharges from plants based on the diaphragm cell process
(1) In derogation of part C, the following requirements shall apply to waste water from plants based on the diaphragm cell process at the point of discharge into the waterbody:
Qualified random sample or
2-hour composite sample
Chemical oxygen demand (COD) mg/l 130
Fish toxicity TF 2
(2) In derogation of part D, the following requirements shall apply to waste water from thechloralkali electrolysis unit based on the diaphragm cell process prior to blending with other
waste water:
AOX 3 mg/l (Random sample).
(3) Part E shall not apply.
The WHG is complemented by the discharge levy act [Abwasserabgabengesetz - AbwAG]. Thetariffs are related to the mass and possible hazard of the discharged waste water.
German regulations concerning the waste management and disposal of hazardous
materials
Regulations concerning the waste management and disposal of hazardous materials are laid
down in the Federal Recycling and Waste Management Act [Kreislaufwirtschafts- undAbfallgesetz - KrW-/AbfG] and the Federal Immission Control Act [BImSchG]. According to
the BImSchG, an operator of a waste generating installation which is subject to licensing, isobliged to avoid waste production or to make sure that the waste is environmentally soundly
recovered. If that is technically or economically not reasonable, the waste has to be disposed of

8/8/2019 Integrated Pollution Prevention and Control European Environment Comission
http://slidepdf.com/reader/full/integrated-pollution-prevention-and-control-european-environment-comission 159/178
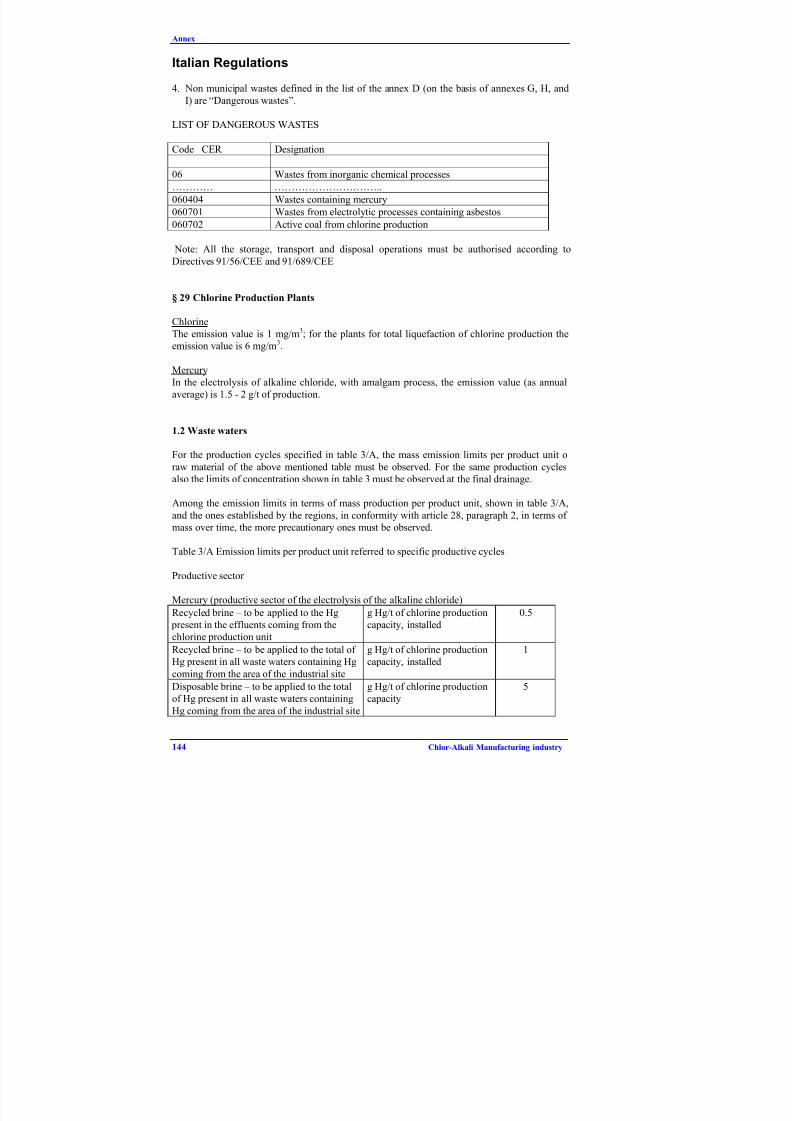
8/8/2019 Integrated Pollution Prevention and Control European Environment Comission
http://slidepdf.com/reader/full/integrated-pollution-prevention-and-control-european-environment-comission 160/178
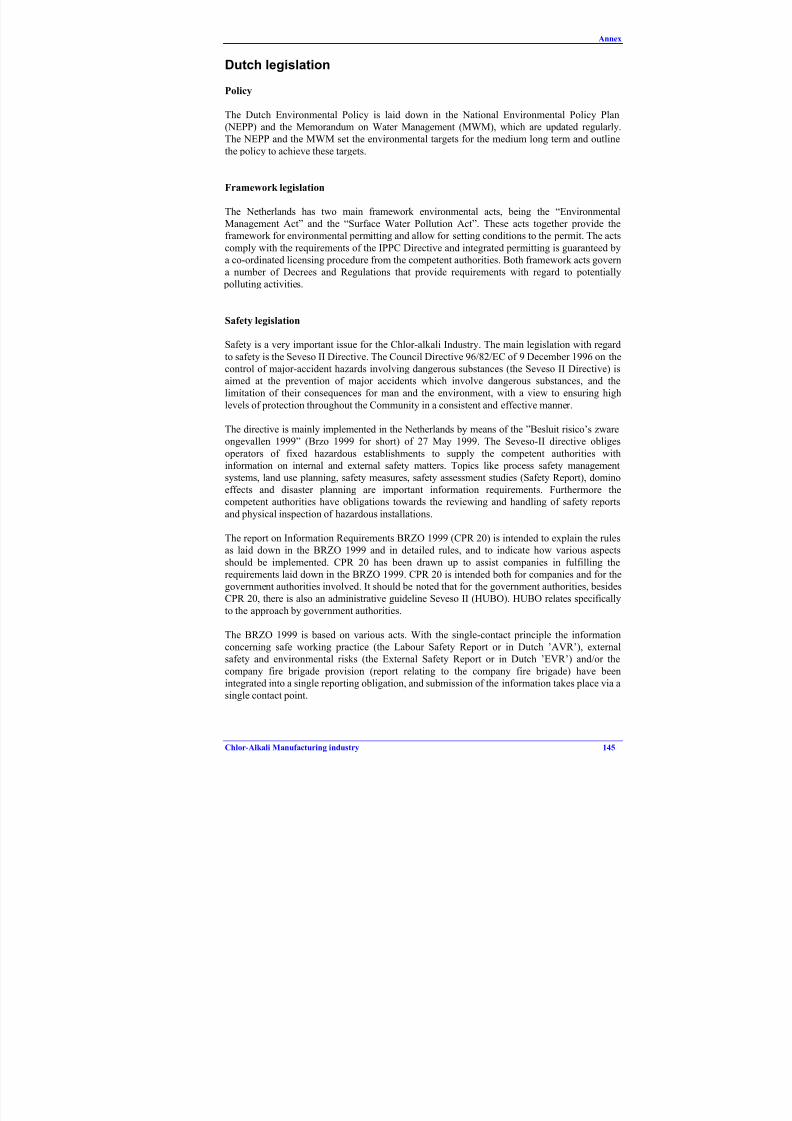
8/8/2019 Integrated Pollution Prevention and Control European Environment Comission
http://slidepdf.com/reader/full/integrated-pollution-prevention-and-control-european-environment-comission 161/178
Annex
Chlor-Alkali Manufacturing industry 145
Dutch legislation
Policy
The Dutch Environmental Policy is laid down in the National Environmental Policy Plan(NEPP) and the Memorandum on Water Management (MWM), which are updated regularly.
The NEPP and the MWM set the environmental targets for the medium long term and outlinethe policy to achieve these targets.
Framework legislation
The Netherlands has two main framework environmental acts, being the “EnvironmentalManagement Act” and the “Surface Water Pollution Act”. These acts together provide theframework for environmental permitting and allow for setting conditions to the permit. The acts
comply with the requirements of the IPPC Directive and integrated permitting is guaranteed bya co-ordinated licensing procedure from the competent authorities. Both framework acts govern
a number of Decrees and Regulations that provide requirements with regard to potentially polluting activities.
Safety legislation
Safety is a very important issue for the Chlor-alkali Industry. The main legislation with regard
to safety is the Seveso II Directive. The Council Directive 96/82/EC of 9 December 1996 on thecontrol of major-accident hazards involving dangerous substances (the Seveso II Directive) isaimed at the prevention of major accidents which involve dangerous substances, and thelimitation of their consequences for man and the environment, with a view to ensuring high
levels of protection throughout the Community in a consistent and effective manner.
The directive is mainly implemented in the Netherlands by means of the ”Besluit risico’s zwareongevallen 1999” (Brzo 1999 for short) of 27 May 1999. The Seveso-II directive obliges
operators of fixed hazardous establishments to supply the competent authorities withinformation on internal and external safety matters. Topics like process safety managementsystems, land use planning, safety measures, safety assessment studies (Safety Report), dominoeffects and disaster planning are important information requirements. Furthermore thecompetent authorities have obligations towards the reviewing and handling of safety reports
and physical inspection of hazardous installations.
The report on Information Requirements BRZO 1999 (CPR 20) is intended to explain the rules
as laid down in the BRZO 1999 and in detailed rules, and to indicate how various aspectsshould be implemented. CPR 20 has been drawn up to assist companies in fulfilling therequirements laid down in the BRZO 1999. CPR 20 is intended both for companies and for thegovernment authorities involved. It should be noted that for the government authorities, besidesCPR 20, there is also an administrative guideline Seveso II (HUBO). HUBO relates specifically
to the approach by government authorities.
The BRZO 1999 is based on various acts. With the single-contact principle the informationconcerning safe working practice (the Labour Safety Report or in Dutch ’AVR’), externalsafety and environmental risks (the External Safety Report or in Dutch ’EVR’) and/or the
company fire brigade provision (report relating to the company fire brigade) have beenintegrated into a single reporting obligation, and submission of the information takes place via a
single contact point.
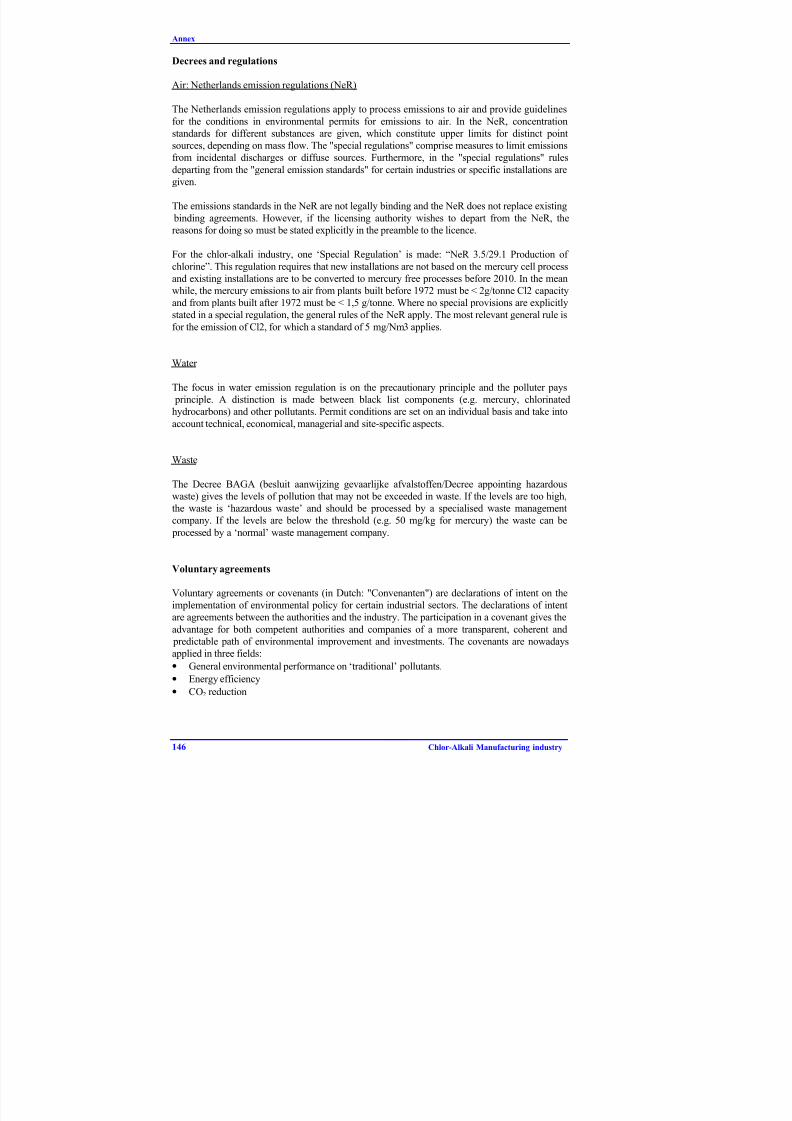
8/8/2019 Integrated Pollution Prevention and Control European Environment Comission
http://slidepdf.com/reader/full/integrated-pollution-prevention-and-control-european-environment-comission 162/178
Annex
146 Chlor-Alkali Manufacturing industry
Decrees and regulations
Air: Netherlands emission regulations (NeR)
The Netherlands emission regulations apply to process emissions to air and provide guidelines
for the conditions in environmental permits for emissions to air. In the NeR, concentration
standards for different substances are given, which constitute upper limits for distinct pointsources, depending on mass flow. The "special regulations" comprise measures to limit emissionsfrom incidental discharges or diffuse sources. Furthermore, in the "special regulations" rules
departing from the "general emission standards" for certain industries or specific installations aregiven.
The emissions standards in the NeR are not legally binding and the NeR does not replace existing
binding agreements. However, if the licensing authority wishes to depart from the NeR, thereasons for doing so must be stated explicitly in the preamble to the licence.
For the chlor-alkali industry, one ‘Special Regulation’ is made: “NeR 3.5/29.1 Production of
chlorine”. This regulation requires that new installations are not based on the mercury cell process
and existing installations are to be converted to mercury free processes before 2010. In the meanwhile, the mercury emissions to air from plants built before 1972 must be < 2g/tonne Cl2 capacityand from plants built after 1972 must be < 1,5 g/tonne. Where no special provisions are explicitlystated in a special regulation, the general rules of the NeR apply. The most relevant general rule is
for the emission of Cl2, for which a standard of 5 mg/Nm3 applies.
Water
The focus in water emission regulation is on the precautionary principle and the polluter pays principle. A distinction is made between black list components (e.g. mercury, chlorinated
hydrocarbons) and other pollutants. Permit conditions are set on an individual basis and take intoaccount technical, economical, managerial and site-specific aspects.
Waste
The Decree BAGA (besluit aanwijzing gevaarlijke afvalstoffen/Decree appointing hazardouswaste) gives the levels of pollution that may not be exceeded in waste. If the levels are too high,the waste is ‘hazardous waste’ and should be processed by a specialised waste managementcompany. If the levels are below the threshold (e.g. 50 mg/kg for mercury) the waste can be
processed by a ‘normal’ waste management company.
Voluntary agreements
Voluntary agreements or covenants (in Dutch: "Convenanten") are declarations of intent on theimplementation of environmental policy for certain industrial sectors. The declarations of intentare agreements between the authorities and the industry. The participation in a covenant gives the
advantage for both competent authorities and companies of a more transparent, coherent and predictable path of environmental improvement and investments. The covenants are nowadaysapplied in three fields:
• General environmental performance on ‘traditional’ pollutants.
• Energy efficiency
• CO2 reduction
8/8/2019 Integrated Pollution Prevention and Control European Environment Comission
http://slidepdf.com/reader/full/integrated-pollution-prevention-and-control-european-environment-comission 163/178
Annex
Chlor-Alkali Manufacturing industry 147
General environmental performance on ‘traditional’ pollutants
In the declaration of intent of this voluntary agreement, the authorities have drawn up an IntegralEnvironmental Target Plan (IETP), based on the National Environmental Policy Plan (NEPP), the
Memorandum on Water Management, the North Sea Action Plan, The Rhine Action Programme,the Memorandum on Energy Conservation and other official plans at the time of signature.
The Integral Environmental Target Plan is concerned with environmental pollution of the
‘traditional’ pollutants (SOx, NOx, VOC, heavy metals, PAH, et cetera) caused by the relevantindustrial sector. The IETP has been drawn up for the years 1994/1995, 2000 and 2010.
Apart from the reduction in emissions into the air, water and soil, the IETP also incorporates
policy with regard to energy conservation, water conservation, soil clean up, hazard risk, odour nuisance, noise and internal management systems. However, especially for energy conservationand CO2 reduction, two other covenants have been agreed upon.
For the "chemical industry" of which the chlor-alkali industry is a part, a declaration of intent was
signed on 2nd April 1993. A significant factor is the understanding that in view of the wide range
of disparate companies in the chemical industry, the contribution of each individual company tothe implementation of the IETP in the industry may vary. The responsibility of individualcompanies to contribute to the implementation of the IETP in the industry requires that these
companies take an active stance. The contribution of a company will be defined in CompanyEnvironmental Plans ("BMP's"), which are drawn up by each company. These BMP’s arerenewed every four years and must be agreed upon by the licensing authority.
Energy efficiency: Long-Term Agreements on Energy Efficiency
In the Netherlands, "Long-Term Agreements on Energy Efficiency (MJA's)" have been made
between the Ministry of Economic Affairs and representative organisations of many industrialsectors. The most important aspect of the MJA's is the target value for improvement of energyefficiency in the relevant industrial sector within a certain time frame. For the elaboration of theMJA's, bilateral agreements are made between the individual companies and the facilitatingagency, which is NOVEM. For the chemical industry, of which the chlor-alkali industry is a part,
an MJA was signed on 24 November 1993 and the agreed improvement of energy efficiency was20% over the period 1989-2000. The target has been achieved by the sector and a second round of MJA’s is now in preparation, although most of the LVOC companies will probably join the‘Benchmarking” covenant (see next item).
CO2 reduction: Benchmarking covenant
In the light of the Kyoto agreements, the Netherlands has to reduce the emission of CO 2.Improvement of the energy efficiency is one of the most important measures to reduce the CO2
emissions. The Benchmarking covenant is an agreement between the Dutch authorities and theDutch energy intensive industry. The industry agrees to belong to the world top in energy
efficiency and the authorities will then refrain from impairing additional CO2 reduction measures.The agreement is open to all companies with an energy use of 0,5 PJ per year or more.
The principle agreement was signed on 6 July 1999 between the industrial organisations and theauthorities. Now that the principle agreement has been signed, the agreement is open to individual
companies to sign in on the covenant.
For those companies that do not want to join or that have an energy use of less than 0,5 PJ per year, the ‘traditional’ MJA route (see above) will be followed [43,44].
8/8/2019 Integrated Pollution Prevention and Control European Environment Comission
http://slidepdf.com/reader/full/integrated-pollution-prevention-and-control-european-environment-comission 164/178
Annex
148 Chlor-Alkali Manufacturing industry
Austrian wastewater legislation
AEV Chlor-Alkali-Elektrolyse says in paragraph 1 that ‘Wastewater from any activity specified
in section 2 is not allowed to contain mercury or asbestos. This provision is met, if mercury andasbestos are not used as an auxiliary material in any activity listed in section 2.’ (Chlor-alkali islisted in section 2)
Regulations concerning the chlor-alkali industry in Finland
In Finland we don`t have any special regulations concerning the chlor-alkali industry. The
authorities set their requirements to the industry in the permits. The procedure is regulated inthe Environmental Protection Act. This act implements those requirements in the IPPCdirective including the BAT.
British Legislation Concerning the Chlor-Alkali Industry
Integrated Pollution Control
Proposals for an integrated approach to pollution control in the U.K were first recommended inthe Fifth Report of the Royal Commission on Environmental Pollution presented to the U.K
government in 1976. It recommended that a new unified inspectorate should be set up to ensurean integrated approach to difficult industrial pollution problems at source whether these affectair, water or land. The inspectorate would expand the concept of “best practicable means” toensure the adoption of the “best practicable environmental option.” This recommendation wasincluded as Integrated Pollution Control (IPC) in the Environmental Protection Act (1990).
Regulations stemming from this act are The Environmental Protection (Prescribed Processesand Substances) regulations 1991. These include the chlor-alkali industry as an IPC prescribed process coming under the definition “Any process for the manufacture of fluorine, chlorine, bromine or iodine etc”. These regulations require that the prescribed process must be operated
with the objective, of ensuring that, in carrying on the process, the best available technique notentailing excessive cost (BATNEEC) will be used:
a.) for preventing the release of substances prescribed for any environmental medium into
that medium or, where that is not practicable by such means, for reducing the release of such substances to a minimum and for rendering harmless any such substances which areso released;
b.) for rendering harmless any other substances which might cause harm if released into any
environmental medium; and
c.) For minimising the pollution which may be caused to the environment taken as a whole by the releases having regard to the best practicable environmental option (BPEO)available as respects the substances which may be released.
Guidance for inspectors in assessing an application for an IPC authorisation is contained in aseries of Process Guidance Notes. These give guidance on what constitutes BAT for each process and also include “achievable release levels” for new plants using best availabletechniques. The chlor-alkali industry is described in S2 4.03, Inorganic Acids and Halogens,
(ISBN 0-11-310141-4).
There have been many pieces of amending legislation since the Environment Protection Act
(1990). The main amendment has been the Environment Act (1995) which allowed for theestablishment of the Environment Agency (for England and Wales) and the ScottishEnvironment Protection Agency. These are the authorities, which regulate the major industrial processes including the chlor-alkali industry. More recently the Pollution Prevention and
8/8/2019 Integrated Pollution Prevention and Control European Environment Comission
http://slidepdf.com/reader/full/integrated-pollution-prevention-and-control-european-environment-comission 165/178
Annex
Chlor-Alkali Manufacturing industry 149
Control Act (1999) has transposed the provisions of E.C Directive 96/61/EC into the U.K.legislation. Under the provision of the U.K Act implementation of the requirements in Englandand Wales will be by The Pollution Prevention and Control (England and Wales) Regulations(2000) (SI1973). These regulations describe activities, which require a permit from the
appropriate authority. In the case of the chlor-alkali industry, this falls into the activitydescription in Schedule1, Section 4.2; Inorganic Chemicals, Part A (1)(a) Producing inorganic
chemicals such as:- (vi) halogens, or interhalogen compounds etc. The regulatory authority for the four installations in England is the Environment Agency.
Health and Safety
The requirements of the Seveso II Directive (96/82/EC) have been implemented by the Controlof Major Accident and Hazards Regulations 1999 (COMAH Regulations) (SI743).
They apply in England, Scotland and Wales, to establishments which keep (or transport) listeddangerous substances about certain thresholds. In the case of chlorine, the threshold is 10
tonnes, which brings in the chlor-alkali processes. The general duty is that every operator shall
take all measures necessary to prevent major accidents and limit their consequences to personsand the environment. The Regulations applying at the four chlor-alkali installations in Englandare enforced jointly by the Environment Agency and the Health and Safety Executive.
Surface and Groundwater
Mercury and its compounds are identified under the List I of families and groups of substancesin the EC Council Directive “on pollution caused by certain dangerous substances dischargedinto the aquatic environment of the Community” (76/464/EEC) – the Dangerous SubstancesDirective. Substances are included on List I on the basis of their toxicity, persistence and
bioaccumulation. The Directive requires that Member States take steps to eliminate pollution by List I substances. However substances do not come under List I methods of control until adaughter Directive, setting emission standards and environmental quality standards, is adopted.In the case of mercury and its compounds two daughter directives have been issued – 82/176/EEC (Mercury from the chlor-alkali electrolysis industry) and 84/156/EEC (Mercury –
other sectors). The Dangerous Substances Directive (76/464/EEC) states that limit values shallapply except where a Member State can prove that quality objectives are being met andmaintained. The UK Government has adopted the quality objective approach and establishedthese in UK legislation for List I substances under 2 statutory instruments. The Surface Waters
(Dangerous Substances) (Classification) Regulations 1989 (SI 2286) includes EQSs for mercury of 1 microgram per litre for inland waters and 0.3 micrograms per litre for coastalwaters. Both apply as annual means. The coastal EQS relates to dissolved concentrationswhereas the inland EQS relates to total.
The provisions of Directive 76/464/EEC relating to groundwater were superseded by the provisions of the Directive “on the protection of groundwater against pollution caused bycertain dangerous substances” (80/68/EEC). Both require that Member states shall prevent theintroduction of List I substances to groundwater. The requirements of 80/68/EEC are
established in UK legislation through the Groundwater Regulations 1998 (SI 2746).

8/8/2019 Integrated Pollution Prevention and Control European Environment Comission
http://slidepdf.com/reader/full/integrated-pollution-prevention-and-control-european-environment-comission 166/178
Annex
150 Chlor-Alkali Manufacturing industry
Contaminated Land
Regulatory controls on industrially contaminated land follow one of two routes.
Where any land is proposed to be redeveloped, then the control is through the Local Authority
planning development control process under the Town and Country Planning Act 1990. The
prerequisite for development of land is a planning permission with conditions to seek appropriate site investigation for contamination, risk assessment and remediation to a standardto protect both the development and the environment. The Environment Agency is a non-
statutory consultee on planning applications involving contaminated land. The EnvironmentAgency advises on the pollution impact to controlled waters (groundwater and surface water)and the related remediation of the contamination.
The Contaminated Land (England) Regulations 2000 (Pt 2A) were commenced on 1 April 2000and seek to control contaminated land which is not dealt with through other legislation. Thestatutory definition of contaminated land relates to actual harm to a wide range of receptors or pollution of controlled waters, with pollutant linkages (Source - Pathway - Receptor) needing to
be established and risk assessed. The prime regulator for the majority of Pt 2A sites would be
the Local Authority whom also has the responsibility to produce a Strategy document by July2001. The Environment Agency would regulate those sites designated as Special Sites, whichinclude certain land, use types and three specific categories of pollution to controlled waters.The chlor-alkali use of land as an IPC process, is a designated land use to form a Special Site.
Also specifically in relation to mercury, land would be a Special Site if it was causing drinkingwater to be treated before consumption; or if it was entering certain groundwater geologies; or was causing the failure of an EQS in a watercourse.
Reference
The National Society for Clean Air and Environment Protection produce an up to date usefulguide to U.K and European pollution control legislation and related issues, its most recent publication; “Pollution Handbook 2000” (ISBN 0 903474 48 4) contains chapters on Air,Water, Waste and Noise Pollution.
European Legislation regarding Mercury containing Wastes
1. CLASSIFICATION AS HAZARDOUS WASTE
General Directive 91/689/EEC on hazardous wastes sets out criteria for wastes which should beclassified as hazardous. In Annex II, wastes containing mercury and mercury compounds arelisted provided they have one or more of the properties described in Annex III. The Annex III
properties relevant to mercury are H6 (toxic or very toxic) and H14 (ecotoxic). These propertiesare defined in Directive 67/548/EEC and its subsequent adaptations which categorise mercuryas toxic and ecotoxic.
Decision 94/904/EEC adopted under Article 1(4) of Directive 91/689/EEC provides for a list of hazardous wastes. These wastes are considered to display one or more of the properties of Annex III of Directive 91/689/EEC and as regards toxicity are considered to contain one or more of the substances classified as toxic at a total concentration of 3% or more. Therefore, as
currently defined under EU-legislation, wastes containing mercury (code 060404 of thehazardous waste list) are classified as hazardous unless it is proven that the concentration of
mercury in these wastes is less than 3% or that they do not contain one of the properties of Annex III.
8/8/2019 Integrated Pollution Prevention and Control European Environment Comission
http://slidepdf.com/reader/full/integrated-pollution-prevention-and-control-european-environment-comission 167/178
Annex
Chlor-Alkali Manufacturing industry 151
Apart from the general requirement on all waste disposal to record and maintain records of production, transportation and disposal, classification as hazardous waste imposes severalobligations or restrictions:- waste must be properly packaged and labelled during collection, transportation and
temporary storage- mixing with non-hazardous wastes or other categories of hazardous wastes is prohibited
except under derogations which may be granted in specific cases- whenever hazardous wastes are mixed with non-hazardous wastes, separation must be
effected wherever it is technically and economically feasible- disposal must be implemented in an installation dedicated to hazardous wastes
2. TRANSFRONTIER MOVEMENT OF WASTES
(COUNCIL REGULATION (EEC) 259/93)
The European regulation on transfrontier movement of wastes divides wastes into threecategorised lists: the green list, the amber list and the red list.
Wastes and residues containing mercury appear on the amber list.
The consequence of this classification is that for transfer of mercury and/or mercury-containing
wastes between E.U. countries the following procedure must be followed, either for recovery(e.g. distillation) or disposal:- a contract for disposal or recovery must be established with the consignee. This contract
must be supplied to the Competent Authority on request.
- mandatory notification by consignment note of the transfer prior to execution must be passed to the relevant authorities of the countries of origin, transit and final destination;
- conditions may be imposed by the countries of origin or transit;- the country of destination can object to the transfer for specified reasons;
- export can be prohibited by the country of production in order to encourage local solutions(self sufficiency principle) in case of disposal only.
- disposal/recovery operations must be recorded (follow-up document).- a certificate of final disposal or recovery, as appropriate, must be supplied to all the
Competent Authorities concerned as well as the originator.
Exports from the EU area to other OECD countries, for disposal or recovery, are possible provided that adequate procedures are followed.
Exports to countries outside the OECD area are prohibited under the Basel Convention and byCouncil Decision of 20/01/97.
8/8/2019 Integrated Pollution Prevention and Control European Environment Comission
http://slidepdf.com/reader/full/integrated-pollution-prevention-and-control-european-environment-comission 168/178
Annex
152 Chlor-Alkali Manufacturing industry
ANNEX E: RELEVANT ADDRESSES
Industrial organisations:
The Chlorine Institute, Inc. Euro Chlor
2001 L Street, NW, Suite 506 Av. E. Van Nieuwenhuyse 4, box 2Washington D.C. 20036 B-1160 BrusselsUnited States of America BelgiumTel: +1 202 775 27 90 Tel: +32 2 676 72 11
Fax: +1 202 223 7225 Fax: +32 2 676 72 41Internet: http://www.cl2.com Internet: http://www.cefic.be
Technology Suppliers for electrolysis chlorine/caustic:
Electrolysers
Asahi Chemical Industry Co., Ltd. De Nora S.p.A
IEM Sales & Technical Dept., Via Bistolfi 35Ion Exchange membranes Div. 20134 Milan3-2 Yako 1-chome, ItalyKawasaki-ku, Kawasaki Tel. +39 02 21 291
Japan e-mail: [email protected]: http://www.asahi-kasei.co.jp Internet: http://www.denora.com
Asahi Glass Co. Ltd. ICI Chemicals and Polymers Ltd.
1-2, Marunouchi, 2-chome PO Box 14Chiyoda-ku, Tokyo 100 The Heath RuncornJapan Cheshire WA7 4Q8Internet: http://www.agc.co.jp United Kingdom
Internet: http://www.ici.com
OxyTech Systems, Inc. UHDE GmbH
100 7th Avenue Electrolysen
Chardon, OH 44024-1000 Friedrich-Uhde-Straße 15USA D-44141 DortmundTel: +1 440 285 00 00 GermanyFax: +1 440 285 00 70 Tel. +49 231 547 24 38
http://www.Krupp.com/kud/company/Intern
Metallic Anodes
Degussa AG Heraeus W.C. GmbH
Weißfrauenstraße 9 Postfach 1553D-60311 Frankfurt am Main D-63405 HanauGermany Germany
Tel. +49 69 218 01 Tel: +49 (6181) 35-1Fax. +49 69 218 32 18 Fax: +49 (6181) 35-658Internet: http://www.degussa.de Internet: http://www.heraeus.de
8/8/2019 Integrated Pollution Prevention and Control European Environment Comission
http://slidepdf.com/reader/full/integrated-pollution-prevention-and-control-european-environment-comission 169/178
Annex
Chlor-Alkali Manufacturing industry 153
ICI Chemicals and Polymers Ltd. De Nora S.p.A
PO Box 14 Via Bistolfi 35The Heath Runcorn I-20134 Milan
UK-Cheshire WA7 4Q8 ItalyUnited Kingdom Tel. +39 02 21 291
Internet: http://www.ici.com e-mail: [email protected]: http://www.denora.com
OxyTech Systems, Inc. Permascand AB
100 7th Avenue Box 42Chardon, OH 44024-1000 S-840 10 Ljungaverk
USA SwedenTel: +1 440 285 00 00 Tel: +46 691 355 00Fax: +1 440 285 00 70 Fax: +46 691 330 40
Membranes
Asahi Chemical Industry Co., Ltd. Du Pont
IEM Sales & Technical Dept., Nafion Global
Ion Exchange membranes Div. Customer Services3-2 Yako 1-chome, P O Drawer Z.Kawasaki-ku, Kawasaki FayettevilleJapan USA - NC 23302
Internet: http://www.asahi-kasei.co.jp Tel: +1 910 678 13 80
Asahi Glass Co. Ltd. Chlorine Engineers Corp., Ltd.
1-2, Marunouchi, 2-chome First Sales Dept.
Chiyoda-ku, Tokyo 100 Tomlokabashi Bldg.Japan 6-11, Fukagawa 2-chome,Internet: http://www.agc.co.jp Koto-ku Tokyo 135
Japan

8/8/2019 Integrated Pollution Prevention and Control European Environment Comission
http://slidepdf.com/reader/full/integrated-pollution-prevention-and-control-european-environment-comission 170/178
References
154 Chlor-Alkali Manufacturing industry
REFERENCES
[Akzo Nobel, 1998]
Akzo Nobel AB, S-445 80 Bohus, SwedenMiljörapport 1998 (Annual Environmental Report 1998)
[Asahi Glass]Asahi Glass Co. Ltd., Tokyo, JapanPersonal communication, Recent Progress of Flemion Membrane, 1998 and 1999
[Bayer Uerdingen, 1998]
Bayer, Uerdingen, GermanyPersonal communication, plant visit 1998
[Beal, 1995]
M. G. Beal, Harriman Chemsult Ltd, London, UK Chlor-alkali: the impact of Economic and Environmental Pressures on the Industry
Modern Chlor-alkali Technology vol. 6 -SCI, p. 1-12 (1995)
[Blomgren]
J. Blomgren, Akzo Nobel, S-445 80 Bohus, SwedenPersonal communication, plant visit 1998
[Brien-White, 1995]
F. O. Brien, I. F. White, Raytheon Engineers and Constructors, USA and UK Process Engineering Aspects of Chlorine Cooling and DryingModern Chlor-Alkali Technology, Vol. 6-SCI, p. 70-81 (1995)
[Chemie Prod., May 2000]
Reportage: Eingriff am offenen herzen (Open hart surgery)Chemie Produktion, p. 120-121 (May 2000)
[Curlin]
C. Curlin, OxyTech Systems Inc., USAPersonal communication 1998
[Debelle]
J-P Debelle, Solvay SA, rue de Ransbeek 310, B-1120 Brussels, belgiumMember of the Technical Working group
[de Flon, 1998]R. de Flon, Borregaard Industries Ltd, P.O. Box 162, N-1701 Sarpsborg, NorwayPersonal communication, plant visit 1998
[Denye et al., 1995]
M. Denye, F. E. Hancock, M. E. Fakley - ICI Katalco, UK The Hydecat Process-Fit and Forget Technology for Hypochlorite DestructionModern Chlor-Alkali Technology, Vol. 6-SCI, p. 251-257 (1995)
[Dibble-White, 1988]
G. J. Dibble, I. F. White – Badger Catalytic Ltd, UK Practical Experience in Mercury and Diaphragm Cell Conversions to Membrane Technology
Paper presented at the 1988 London International Chlorine SymposiumModern Chlor-Alkali Technology, Vol. 4, p. 291-305

8/8/2019 Integrated Pollution Prevention and Control European Environment Comission
http://slidepdf.com/reader/full/integrated-pollution-prevention-and-control-european-environment-comission 171/178
References
Chlor-Alkali Manufacturing industry 155
[Dilmore-DuBois, 1995]C. Dilmore, D. DuBois – PPG Industries, USAPPG’s TephramTM Synthetic Diaphragm Circuit ConversionModern Chlor-Alkali Technology, Vol. 6-SCI, p. 133-139 (1995)
[Dutch report, 1998]
Ministry of Housing, Spatial Planning and the Environment, The NetherlandsDutch Notes on BAT for the Chlor-alkali Industry, (Infomil, 1998)
[DuPont, 1998]DuPont Nafion®, Global customer service, Fayetteville, USAFact sheets and personal communication, 1998
[EC, 1998]EC, DG XI-D4Process Agents – list updated 8 June 1998
[Euro Chlor]
Euro Chlor – The European Chlor-Alkali Industry AssociationAvenue E. Van Nieuwenhuyse 4 Box 2, B-1160 Brussels, BelgiumTel: +32 2 676 7265, Fax: +32 2 676 7241, E-mail: [email protected]
[Euro Chlor Anal 3-7, 1998]Euro Chlor, Avenue E. Van Nieuwenhuyse 4 Box 2, B-1160 Brussels, BelgiumPrécis of the Standardization of Methods for the Determination of Traces of MercuryAnal 3-7, 2nd edition (1998)
[Euro Chlor Env. Prot. 3, 1999]Euro Chlor, Avenue E. Van Nieuwenhuyse 4 Box 2, B-1160 Brussels, Belgium
Decommissioning of Mercury Chlor-Alkali PlantsEnv. Prot. 3, 2nd edition (February 1999)
[Euro Chlor Env. Prot. 5, 1999]Euro Chlor, Avenue E. Van Nieuwenhuyse 4 Box 2, B-1160 Brussels, Belgium
Measurement of Air Flow and Mercury in Cellroom VentilationEnv. Prot. 5, 2nd edition (February 1999)
[Euro Chlor Env. Prot. 11, 1998]Euro Chlor, Avenue E. Van Nieuwenhuyse 4 Box 2, B-1160 Brussels, Belgium
Code of Practice - Mercury HousekeepingEnv. Prot. 11, 4th edition (September 1998)
[Euro Chlor Env. Prot. 12, 1998]
Euro Chlor, Avenue E. Van Nieuwenhuyse 4 Box 2, B-1160 Brussels, BelgiumGuidelines for Making a Mercury Balance in a Chlorine PlantEnv. Prot. 12, 2nd edition (July 1998)
[Euro Chlor paper, 1998]Euro Chlor, Avenue E. Van Nieuwenhuyse 4 Box 2, B-1160 Brussels, BelgiumConversion of Amalgam-Plants to Membrane Technology - Considerations for possible use of existing equipmentPaper written by Euro Chlor (February 1998)
8/8/2019 Integrated Pollution Prevention and Control European Environment Comission
http://slidepdf.com/reader/full/integrated-pollution-prevention-and-control-european-environment-comission 172/178
References
156 Chlor-Alkali Manufacturing industry
[Euro Chlor report, 1997]Euro Chlor, Avenue E. Van Nieuwenhuyse 4 Box 2, B-1160 Brussels, BelgiumRecommendations for a Best Available Techniques Reference Support Document. Chlorine
Production by the Electrolysis of Brine (November 1997)A contribution from the European Chlorine Industry to assist the IPPC Process
[Florkiewicz, 1997]
T. F. Florkiewicz, OxyTech Systems, USALong Life Diaphragm Cell
[Florkiewicz-Curlin, 1991]
T. F. Florkiewicz, L. C. Curlin - OxyTech Systems, USAPolyramix TM Diaphragm – A Commercial RealityPaper presented at London Symposium (June 1991)
[Foller et al, 1997]
P.C. Foller, D. W. Dubois, J. Hutchins – PPG Industries Inc., USA
PPG’s Tephram® Diaphragm: The Adaptable Non-Asbestos DiaphragmPaper presented at the SCI 1997 London International Chlorine Symposium (June 1997)
[García Ara]L. García Ara, ANE, Paseo de Recoleto 27, E-28004 Madrid, SpainMember of the Technical Working group
[Gest 76/52, 1986]Euro Chlor, Avenue E. Van Nieuwenhuyse 4 Box 2, B-1160 Brussels, BelgiumEquipment for the Treatment of Gaseous Effluents Containing ChlorineGest 76/52, 9th edition (October 1986)
[Gest 76/55, 1990]Euro Chlor, Avenue E. Van Nieuwenhuyse 4 Box 2, B-1160 Brussels, BelgiumMaximum Levels of Nitrogen Trichloride in Liquid ChlorineGest 76/55, 9th edition (September 1990)
[Gest 87/130, 1996]Euro Chlor, Avenue E. Van Nieuwenhuyse 4 Box 2, B-1160 Brussels, BelgiumHazard Analysis for Chlorine Plants
Gest 87/130, 7th edition (April 1996)
[Gest 92/169, 1994]Euro Chlor, Avenue E. Van Nieuwenhuyse 4 Box 2, B-1160 Brussels, Belgium
Guidelines for the Safe Handling and Use of ChlorineGest 92/169, 1st edition (October 1994)
[Gest 92/175, 1993]
Euro Chlor, Avenue E. Van Nieuwenhuyse 4 Box 2, B-1160 Brussels, BelgiumA Scheme for Safety Visits to Chlorine Customers' PlantsGest 92/175, 1st edition (May 1993)
[Gest 93/186, 1993]
W. D. Müller, Bayer AG, Germany
Chlorine, its Fabrication and Handling - General Technology OverviewGest 93/186, Third Euro Chlor Technical Seminar (December 1993)
8/8/2019 Integrated Pollution Prevention and Control European Environment Comission
http://slidepdf.com/reader/full/integrated-pollution-prevention-and-control-european-environment-comission 173/178
References
Chlor-Alkali Manufacturing industry 157
[Gest 93/187, 1993]S. Grunden, Euro Chlor Environmental Protection GroupGood Mercury HousekeepingGest 93/187, Third Euro Chlor Technical Seminar (December 1993)
[Gestermann, 1998]
F. Gestermann, Bayer AG, GermanyDepolarized Cathodes in the Chlor-Alkali ElectrolysisPaper presented at the DeNora Symposium held in Venice, Italy, May 1998
[Gestermann-Ottaviani, 2000]F. Gestermann, Bayer AG, Germany – A. Ottaviani, DeNora s.p.a. ItalyChlorine Production with Oxygen Depolarized Cathodes in Industrial scale
Paper presented at the London International Chlorine Symposium in June 2000
[Grunden]S. Grunden, Hydro Polymers AB, S-444 83 Stenungsund, Sweden
Personal communication, plant visit 1998
[Hollmann]G. Hollmann, Dow Deutschland Inc., Stade (Germany)Personal communication, fax dated 22 October 1998
[Hydro Polymers, 1998]Hydro Polymers AB, S-444 83 Stenungsund, SwedenMiljörapport 1998 (Annual Environmental Report 1998)
[Italian report, 1997]Italian Notes on the BREF for the Chlor-Alkali I ndustry
Italian BAT reference document (February 1997)
[J. Loss Prev. Proc. Ind., March/94]G. Purdy, M. Wasilewski – DNV Technica, UK Risk Management Strategies for Chlorine InstallationsJournal of Loss Prevention in the Process Industries, Vol. 7, No. 2, p. 147-156 (March 1994)
Special Issue: Problem Clouds II
[J. Ind. Ecology, 1997]R. Ayres, INSEAD, Fontainbleu, France
The Life-Cycle of Chlorine, Part I - Chlorine Production and the Chlorine-Mercury ConnectionJournal of Industrial Ecology, Vol. I, No. 1, p. 81-94 (1997)
Massachusetts Institute of Technology Press
[Jorlöv]B-O Jorlöv, Hydro Polymers AB, S-444 83 Stenungsund, SwedenPersonal communication, 1998
[Kelly, 1998]K. Kelly, ICI Katalco, UK Personal communication, 1998
[Kirk-Othmer, 1991]
John Wiley & Sons, Inc.Alkali and chlorine products, Chlorine and sodium hydroxideKirk-Othmer - Encyclopedia of Chemical Technology, 4th edition, Vol. 1, 938-1025 (1991)

8/8/2019 Integrated Pollution Prevention and Control European Environment Comission
http://slidepdf.com/reader/full/integrated-pollution-prevention-and-control-european-environment-comission 174/178
References
158 Chlor-Alkali Manufacturing industry
[Kuntzburger et al, 1995]F. Kuntzburger, D. Horbez, J. Bachot – Rhone Poluenc Recherches, Aubervilliers, France andJ. M. Perineau - Rhone Poluenc Chimie, Le Pont de Claix, France
New Developments in Microporous Diaphragm Built-in Precathode and Asbestos-FreeDiaphragm
Modern Chlor-Alkali Technology, Vol.6-SCI, p. 140-148 (1995)
[Kuntzburger et al, 1997]F. Kuntzburger, D. Horbez, J. G. Le Helloco – Rhone Poluenc Recherches, Aubervilliers,France and J. M. Perineau - Rhone Poluenc Chimie, Le Pont de Claix, France New developments in built-in precathode diaphragm technology
Paper presented at the London International Chlorine Symposium in June 1997
[Le Chlore, 1996]Syndicat des Halogènes et Dérivés, 14 rue de la République, F-92909 Paris, FranceLe Chlore, 4th edition (October 1996)
[Lindley, 1997]A. A. Lindley, ICI Chemicals & Polymers, UK An Economic and Environmental Analysis of the Chlor-Alkali Production Process
Report prepared for the European Commission during a secondment to DG III C-4 (1997)
[Lott, 1995]B. Lott, The Associated Octel company Ltd, UK
Practical Experiences on the Conversion of Mercury Cells to membrane TechnologyModern Chlor-Alkali Technology, Vol.6-SCI, p. 243-250 (1995)
[Mason, 1995]
J.W. Mason, Hays Chemical Distribution Ltd, UK Design aspects of loading and unloading systems which can mitigate or eliminate accidentalchlorine releaseModern Chlor-Alkali Technology, Vol. 6-SCI, p. 48-61 (1995)
[Müllmagazin, 1991]G. Lutz, W. Otto, H. Schönberger Chlorproduktion in neuem Licht; AltlastenerfassungMüllmagazin, 4. Jhg, No. 3/1991, p. 55-60 (1991)
[OxyChem, 1992]Occidental Chemical Corporation, USACaustic Soda Handbook (1992)
[Perineau]J. M. Perineau, Rhone Poluenc Chimie, FrancePersonal communication, 1998
[Schindler]I. Schindler, Umweltbundesamt, Federal Environment Agency (UBA), AustriaMember of the Technical Working group
[Schubert]
H. Schubert, Bayer AG, GermanyMember of the Technical Working group

8/8/2019 Integrated Pollution Prevention and Control European Environment Comission
http://slidepdf.com/reader/full/integrated-pollution-prevention-and-control-european-environment-comission 175/178
References
Chlor-Alkali Manufacturing industry 159
[SEPA, 1997]O. Alterå – Naturvårdsverket, Swedish Environmental Protection AgencyEkonomisk konsekvensbeskrivning för övergång till kvicksilverfri klor-alkaliproduktion vidEka Chemicals i Bohus. (Economic assessment of conversion to mercury free production of
chlor-alkali at Eka Chemicals (today Akzo Nobel) in Bohus.)
Presented at the meeting of the National Licensing Board for Environment Protection (October 1997)
[SRI Consulting, 1997]SRI ConsultingCompetitive Situation of the Western European Chlor-Alkali Industry in a Global ContextAn independent assessment prepared for Euro Chlor (April 1997)
[Stenhammar]S. Stenhammar, Naturvårdsverket, Swedish Environmental Protection AgencyMember of the Technical Working group
[UBA (A), 1998]Umweltbundesamt, Federal Environment Agency (UBA), AustriaBAT Reference Document Chlor-Alkali: Austrian Statement (December 1998)
[UBA (D), 1997]D. Wunderlich, S. Richter – Umweltbundesamt, Federal Environment Agency (UBA) GermanyChlorine production by chlor-alkali processesBAT Background document (November 1997)
[UBA (D)-TNO report, 1997]TNO Institute of Environmental Sciences, Energy Research and Process Innovation
The European Emission Inventory of Heavy Metals and Persistent Organic Pollutants for 1990Sponsored by UBA (D) and TNO, UBA-FB UFOPLAN-Ref.No. 104.02 672/03 (1997)
[UK Guidance note, 1993]HMIP, UK Processes for the Manufacture of, or Which Use or Release Halogens, Mixed Halogen
Compounds or OxohalocompoundsChief Inspector's Guidance to Inspectors, Process Guidance Note IPR 4/13 (1993)
[Ullmann’s, 1996]
VCH Verlagsgesellschaft mbH, D-6940 WeinheimChlorine
Ullmann's Encyclopedia of Industrial Chemistry, Vol. A 6, 399-481 (1996)
[UN/ECE 1985]United Nations Economic Commission for Europe, Task ForceGuidelines for the control of emissions from the inorganic chemical industry (1985)
[USEPA, 1995]United States Environmental Protection AgencyProfile of the Inorganic Chemical IndustryEPA 310-R-95-004 (September 1995)
[USEPA, 1998]United States Environmental Protection AgencyMercury Cell Emission Control Practices and Techniques Guidelines (May 1998)

8/8/2019 Integrated Pollution Prevention and Control European Environment Comission
http://slidepdf.com/reader/full/integrated-pollution-prevention-and-control-european-environment-comission 176/178
References
160 Chlor-Alkali Manufacturing industry
[Wienkenhöver, 2000]Dr. M. Wienkenhöver, Bayer AG, Germany
A letter written to the members of the Euro Chlor Management Committee regarding an updateon the development of the oxygen depolarised cathode (16 June 2000)
[Wunderlich]
D. Wunderlich, Umweltbundesamt, Federal Environment Agency (UBA) GermanyMember of the Technical Working group

8/8/2019 Integrated Pollution Prevention and Control European Environment Comission
http://slidepdf.com/reader/full/integrated-pollution-prevention-and-control-european-environment-comission 177/178
Chlor-Alkali Manufacturing industry 161
GLOSSARY OF TERMS AND ABBREVIATIONS
Abbreviations and units
AC alternating current
ACkWh kWh (alternating current) bar bar (1 bar = 100 kPa,
1.013 bar = 1 atm) barg bar gauge (bar + 1 atm) billion thousand million (109)
BOD biochemical oxygendemand
°C degree CelsiusCFC chlorofluorocarbon
CHP co-generation of heat and power
COD chemical oxygen demandDC direct current“dioxins” PCDD/PCDF compounds
DSA dimensionally stableanodes
EDC ethylene dichlorideEOCl extractable chloroorganics
EOP end-of-pipeEOX extractable organic
halogensg gram
HCFC hydrochlorofluorocarbon
h hour I-TEQ dioxin/furan toxicity
equivalentJ Joule
K degree Kelvin(0 oC = 273.15 K)
k Α kilo Ampèrekg kilogramkPa kilo PascalkWh kilowatt-hour
(1 kWh = 3.6 MJ)
l litrem metremg milligram
m2 square metrem3 cubic metremV millivolts Nm3 Normalised m3 (gas,
273 K, 101.3 kPa)
ODP ozone depletion potential pa per annum (per year)PCDDs polychlorinated
dibenzodioxins
PCDFs polychlorinateddibenzofurans
PI process integrated
ppb parts per billion
ppm parts per million ppmv parts per million by
volumePTFE polytetrafluorethylenePVC polyvinyl chloride
Raney Nickel surface activated form of nickel (alloys, metals) usedas hydrogen donor
rectiformer rectifier/transformer
s secondt tonne (106 gram)
V VoltVCM vinyl chloride monomer vol% Percentage by volume
W Watt (1 W = 1 J/s)
Ω Ohm
Substances
Ba BariumBr - BromideBr 2 Bromine
BrO3- BromateC CarbonCa CalciumCCl4 Carbon tetrachlorideC2Cl4 TetrachloroethyleneCd Cadmium
CH3Cl Monochloromethane(Methyl chloride)
CH2Cl2 Dichloromethane(Methylene chloride)
CHCl3 Trichloromethane
(Chloroform)CxHyXz Halogenated hydrocarbonsCl- Chloride
Cl2 ChlorineClO3
- ChlorateCO2 Carbon dioxideCO3
2- CarbonateCr Chromium
Cu Copper F FluorineFe IronFeCl3 Ferric chloride
H2 HydrogenHCO3
- BicarbonateHCl Hydrochloric acid
8/8/2019 Integrated Pollution Prevention and Control European Environment Comission
http://slidepdf.com/reader/full/integrated-pollution-prevention-and-control-european-environment-comission 178/178
Substances, continued
Hg MercuryHg2Cl2 Mercuric chloride (Calomel)
H2O Water H2O2 Hydrogen peroxide
HS-
BisulphideH2SO4 Sulphuric acid
K PotassiumMg Magnesium N2 Nitrogen Na Sodium
NCl3 Nitrogen trichloride N2H2 Hydrazine NH3 Ammonia NH4
+ Ammonium NHxBr y Brominated amines
Ni Nickel
O2 OxygenOBr - HypobromiteOCl- Hypochlorite
Pb LeadS2
- SulphideSiO2 Silicon dioxideS O 2- Thiosulphate