Embed Size (px)
Citation preview

fVcWSCANADA
ONTARIONorthern OntarioDevelopment Agreement
Entente de de\cloppenient(In norcl de I'Ontario
Forestry • Foresterie
FILE REPORT 58
Integrated Modelling of Moose Habitatand Population:
Preliminary Investigations Using an Ontario Boreal Forest
P. Duinker, C. Daniel, R. Morash, W. Stafford, R. Plinte and C. Wedeles
1*1 Natural Resources Ressources naturellesCanada Canada
Canadian ForestService
Service canadiendes forets Ontario
Ministry of Ministere desNatural Richesses
Resources naturelles

This file report is an unedited, unpublished report submitted as partialfulfilment of NODA/NFP Project #4045, "Integrated modelling of moosehabitat and population".
The views, conclusions, and recommendations contained herein are those of
the authors and should be construed neither as policy nor endorsement byNatural Resources Canada or the Ontario Ministry of Natural Resources.

This file report is an unedited, unpublished report submitted as partialfulfilment of NODA/NFP Project #4045, igategratod modelling uf muu&u •
"trabttai and pupulationrPreliminarylnvestigations using afTDnnrrro borear—_foxestiIr^'
The views, conclusions, and recommendations contained herein are those of
the authors and should be construed neither as policy nor endorsement byNatural Resources Canada or the Ontario Ministry of Natural Resources.

INTEGRATED MODELLING OF MOOSE HABITAT AND POPULATION:
PRELIMINARY INVESTIGATIONS USING AN ONTARIO BOREAL FOREST
Peter Duinker1, Colin Daniel2, Richard Morash3, Will Stafford3, Ron Plinte3, andChris Wedeles2
INTRODUCTION
Moose (Alces alces) is a wildlife species of major ecological andsocial importance in Ontario's boreal forest.
Habitat management for moose is done by attempting to accommodate habitat needs during forest
management operations. To this end, provincial guidelines exist for moose (Ontario Ministry of Natural
Resources 1988) to provide forest managers with information on key habitat characteristics and features.
The intent of the guidelines is not just to protect and develop good habitat, but to foster moose populations.
A logical link exists, therefore, between objectives for habitat quality and those for moose populations.
However, to the authors' knowledge, nowhere are the processes of timber management and moose
population managementexplicitly linked by considering relationships between habitat characteristics and
populationdynamics. The integration of habitatandpopulationmanagement is incomplete, therefore,because
no objective meansexists to translate the effects of forestryoperations into measures for moose populations.
1Chair in Forest Management and Policy,Facultyof Forestry, Lakehead University,Thunder Bay, Ontario P7B 5E1
2ESSA Technologies Ltd, 308-9555 Yonge St., Richmond Hill, Ontario L4C 9M5
3Faculty of Forestry, Lakehead University, Thunder Bay, Ontario P7B 5E1

Most habitat models predict either ahabitat suitability index that is translated ina very simple way into either
apopulation index or ameasure ofhabitat carrying capacity.4 Through this project, a set ofsimulation tools
was developed that specifically address the missing links between theeffects offorest management operations
and population numbers of an important vertebrate species. The integrated models will be suitable for use
inapplied research orina preliminary exploration ofthe effects of long-range forest management plans. The
approach has been todevelop theintegrated models with aneye towards normal operational use in the near
future. The present version has been oriented toward applied research.
Moose was chosen in this study because: (1) The authors have experience in building a habitat simulator for
moose (Duinker et al. 1991, 1993, Higgelke et al. 1992, Higgelke 19945), (2)Moose is a featured species
in the boreal forest of Ontario, and high in social and economic value, so the research could have significant
financial implications for the economy of the north, and (3) the costs of planning timber harvests according
to moose habitat guidelines can be substantial. Justification for such habitat protection costs needs to be
stronger, and can be provided by predicting moose population responses to habitat changes caused by
forestry operations.
OBJECTIVES
4Greig, L.A.; Duinker, P.N.; Wedeles, C.H.R.; Higgelke, P.E. 1991. Habitat supplyanalysis and modelling: State of the art and feasibility of implementation in Ontario. Ont. Min.Nat. Resour., Wildlife Br., Toronto, ON. Unpub. rep.
5 Higgelke, P.E. 1994. Simulation analysis of components of Ontario's moose habitatguidelines. Unpublished M.Sc.F. thesis, School of Forestry, Lakehead University, Thunder Bay,ON. 157 p.

Themain objective was todevelop and testanintegrated setof simulation models that canpredict theeffects
of combining forest management and moose harvest management on a moose population.
Ancillary objectives for moosemanagement in theLakeAbitibi ModelForest (LAMF) wereto (1)begin the
process of developing computerized tools suitable foruse byforest and wildlife managers in an operational
context. These will assist in developing and implementing integrated (i.e., habitat and population)
management strategies, (2)develop toolsto assistin identifying keyhabitatandpopulation information needs
for moose management, and (3) develop tools to assist with the evaluation and testing of hypotheses that
relate to moose habitat and population management.
THE CASE STUDY FOREST
The Lake Abitibi Model Forest, some 1.1 million hectares in total area, is situated in northeastern Ontario,
east of Cochrane (Fig. 1). The forest is dominated by lowland black spruce (Picea mariana [Mill.] B.S.P.)
stands on surface organic soils and clay subsoils, and is part of the northeastern Ontario claybelt.
METHODS
GIS-based simulation modelling underlies the research framework. A GIS (geographic information system)
is needed to account for proximities of food and cover habitat, and for variations of moose habitat quality
across the landscape. Simulation is needed to track habitat and population responses through time. Models

are linked and used in a modular fashion. Each major set of required calculations are made by a discrete
model.
The modelling framework involvesthree models or sets of models:
• a forest inventory projection tool called HSG (Moore andLockwood 1990). It requires data on thecurrent
forest inventory, management strategies, andsuccessional pathways, and produces simulated future forest
inventories.
• a suite of GIS programs thatrequire forest inventories as inputdata, andinterpret those inventories in terms
of moose food and cover.
• a moose population model (Fig. 2), which requires data on moose food and cover and on forest ageclass
structure, and calculates cohort-specific moose population data (e.g., number and weight of animals) in
response to the habitat data.
Forest Management Strategies
Four forest management strategies were created covering a 100-year period:
• "No Harvest"—No timber management activities take place (i.e., no harvesting or regeneration activities).
• "Basic"—In general terms, all the major assumptions included in the managementplan of the IroquoisFalls
forest management unit (that comprises most of the model forest territory). This meant acceptance of an
annual harvest (clear-cut) of 380 725 m3 of spruce and incidental volumes of associated species, and
silvicultural ground rules for use throughout the 100-year simulation.
• "Lower"— Annual timber harvests were assumed to amount to 75 percent of those of the Basic strategy
(285 544 m3 ofspruce and incidental volumes ofassociated species). Silvicultural ground rules remained the
same, although annual areas treated would be lower, depending on forest types harvested inany time period.
The Lower strategy was formulated to explore the general premise that relaxation oftimber harvest pressures
might benefit some species of forest-dwelling wildlife.
• "Spatial"—Using the harvest volumes and silvicultural ground rules of the Basic strategy, the eligibility of
harvestable stands was constrained according to their general location.
This is based onthe assumption that by2054 thewhole forest will have a well developed road network. The
Spatial strategy was formulated toexplore the notion, inherent in the design ofthe moose habitat guidelines
(Ontario Ministry of Natural Resources 1988), that smaller and well-distributed clear-cuts are better for
moose habitat than are larger cuts.
The following specifications were common to all the scenarios in which timber harvesting took place:
• all timber harvests were regulated based on the annual yields of spruce;
• a set of forest-specific yield curves were used that show wood volume trends over stand age for all
combinations of stand type, stocking, and site class;
• timber harvest priority rule: minimize primary species volume losses;
• minimum operable volume: 40 m3/ha;
• prohibition of timber harvesting on site class 4; and
• silviculture programs unrestricted in areal extent, butset inpriority according to a treatment priority table.
Forest Inventory Projection

A 10-year time step was used over a 100-year horizon. The simulation outputs from HSG in our study
include tenstructurally identical future forest inventories foreachof the fourstrategies, onefor each 10-year
timestep. Theforest inventory inputdata for each HSG run was the same 1994 dataset, thus anchoring all
simulations to the same present forest.
Moose Habitat Interpretations of Projected Inventories
The main function of the moosehabitatmodels is to interpretfutureforest inventories in terms of moosefood
and cover values. Several steps are required to accomplish this in our modelling framework, including:
• reclassification of the forest;
• developmentof forest type-specific, stocking-dependent, and age-dependentcurves for browse availability
and cover values;
• calculation of food and cover values for each stand (or part of stand) in the forest;
• calculation of average food and cover values for habitat assessment units.
Reclassification of the Forest
Ontario Forest Resource Inventory working groups are too coarse for calculation of moose food and cover
values, and stand composition data are too detailed. The forest was therefore reclassified for the specific
purposes of this study, using a procedure similar to that of Higgelke (1994).
Food and Cover Values

Following the protocol of Higgelke (1994), relationships were established depicting stocking-dependent,
forest type-dependent food and cover values over stand age.
Food: Food supply curves were generated with consideration of the following keypoints:
• Forage production peaks 5-20 years after timber harvesting (Crete 1977). After this period browse
production begins to diminish (Joyal 1987).
• Foodsupply curves wereset at 450 kg/ha. For early winter, the maximum was set at 167 kg/ha.
Cover: The study deals with early winter cover only. The Higgelke (1994) approach was modified to
generate an earlywinter cover index for each stand for subsequent use in calculating cover-adjusted food
values for early winter.
Food and Cover
A 200 m by 200 m point grid was laid over the stand map of the study forest for the purposes of calculating
food and cover supplies. The grid was used in calculations of food supplies for all three
seasons—spring/summer (S/S), autumn, and early winter—but it was actually only necessaryfor the special
calculations of cover-adjusted food in early winter.
Food and Cover Calculations for Habitat Assessment Units (HAU)
It was decided to capture spatial variation in moose carrying capacity across the whole study forest landscape
using overlapping HAUs. With stands on the order of tens of hectares, moose home ranges on the order of

hundreds of hectares and of unknown location, and a forest of a million hectares, some method must be found
toquantify local moose population responses tolocal habitat change. Given our approach ofmodelling moose
population response tohabitat change, and adensity ofmoose known tobe roughly 0.1 moose/km2, ahabitat
assessment unitof hundreds of square kilometres wasneededbefore a minimally acceptable size of moose
population would beamenable tosimulation. Asquare (for simplicity) HAU ofapproximately 50000 hawas
used.
It is necessary to reduce the raw food data by some appropriate factor that we shall call the cropping rate
(actually, a proportion used to reduce the raw food data to available food data). A cropping rate of 0.2 for
S/S and 0.6 for autumn and early winter was applied.
Data Transfer to the Population Model
The population model requires the following data from the habitat models:
• season-specific, HAU-specific food supplies for each future snapshot of the forest inventory (in this case,
once every 10 years for 100 years); and
• areas of forest in age classes 0-10, 11-20, 21-30, and 31—40.
Moose Population Modelling
Three elements of moose population dynamics represented in the model are mortality, reproduction, and
weight change. Feeding occurs in spring/summer, fall, and early winter with changes in weight being a
8

function of thefood supply (aspredicted bythe habitat model). Mortality includes hunting mortality in the
fall andothermortality (e.g. predation) in allseasons. Mortality dueto starvation canalsooccurin any season
if significant weight loss occurs due toan insufficient food supply. Reproduction is characterized by births
that occur in the spring/summer season.
Population Structure
For modelling purposes, the moose population in each HAU is tracked independently over time. The
populationis dividedinto cohorts based upon sex and age (11 classes, representing ages 0-10+). For each
of these cohorts, the model tracks two state variables over time: the number of animals in the cohort, and the
cohort's average weight per animal. The model divides the year into four seasons: spring/summer, fall, early
winter, and late winter. It produces "census" data for each between-season enumeration by calculating the
change in the number of animals and average weight per animal for each cohort.
Starvation mortality: Mortality due to starvation is calculated by the model in all four seasons. For each
cohort, the average weight of the cohort is compared to a threshold weight below which individuals are
assumed to die as a result of starvation.
Other mortality: Mortality due to factors other than starvation and hunting is calculated by the model in all
four seasons. For each cohort (and season), the proportion of animals that die due to other factors each
season is specified as an input to the model.

Hunting mortality: Hunting mortality is calculated in the autumn each year. In calculating the hunting
mortality for each of the individual habitat windows, the model first determines a level of harvest for the
entire forest. This harvest calculation follows the tag allocation process currently used in Ontario for
establishing harvest levels each year (Heyden et al. 1992).
Births: The number of births for the population is calculated by the model each year in the spring season.
The number of calves born from each female cohort is calculated as a product of the number of females in
the cohort (in spring/summer) and the cohort's average birth rate.
Input Parameters
The moose population model requires the user to specify a number of input parameters for each model run.
The following section provides some background on the values assigned to each of these parameters for the
model forest model runs.
Initial moose density: The initial density of moose was set to match the estimated 1995 density for the
LAMF area. The initial density estimates were:
Calves: 0.039 moose per km2
Adult females: 0.074 moose per km2
Adult males: 0.027 moose per km2
Total density: 0.14 moose per km2
10

Ideal weights: The "ideal" weights of each cohort (i.e., weight when food is not limiting) were estimated
from information provided by the OMNR:
Calves (5 months): 160-180 kg
Mature bulls: 400-542 kg (average of 483 kg)
Mature cows: 376-533 kg (average of 445 kg)
As the habitat in the LAMF is less productive than in AlgonquinPark, these weightestimates were assumed
to represent approximate ideal weights for theLAMF. The ideal weights (kg) for eachcohort in the model
were set as follows:
Calf Yearling Adult1 Adult2
Male 170 300 450 485
Female 160 250 400 445
1Young (2-5 years).2 Mature (6 years+).
Initial weights: To initialize the model, weights for all cohorts were set at their ideal levels, as outlined
above.
Weight at death: This variable represents the weight, for each cohort, below which an individual animal will
die from starvation. The weight below which an individual will die was set at 66 percent of the ideal weight
for each cohort.
Distribution of weights: The typical distributionof weights is represented in the model through a standard
11

deviation about themean weight ofeach cohort, where thestandard deviation foreach cohort is expressed
as a proportion of the cohort's mean weight.
Weightat birth: The average weight ofcalves atbirth was reported as 12-17 kgforOntario; thevalue used
in the model was set as 15 kg.
Sex ratio at birth: The sex ratio at birth was set to 0.5 for the model.
Energy per unit forage: Theenergy per unitof forage for the model wasestimated as 3 100kcal per kg (4
200 x 0.74).
Maintenance energy requirement: A value of 170kcal per kg per day was used for the maintenanceenergy
requirement for all cohorts in the model.
Energy requirement for weight gain: Assuming a 70 percent efficiency for tissue production, an average
of 9 800 kcal is required to produce one kilogram of fat and protein. This value was used for all cohorts in
the model to represent the energy required for weight gain.
Energy requirement for weight loss: A value of 8 100 kcal per kg of weight loss was used for all cohorts
in the model to represent the energy required for weight loss to occur.
Fecundity: For the purposes of these model runs, fecundity was not made to vary as a function of cow
12
weight.
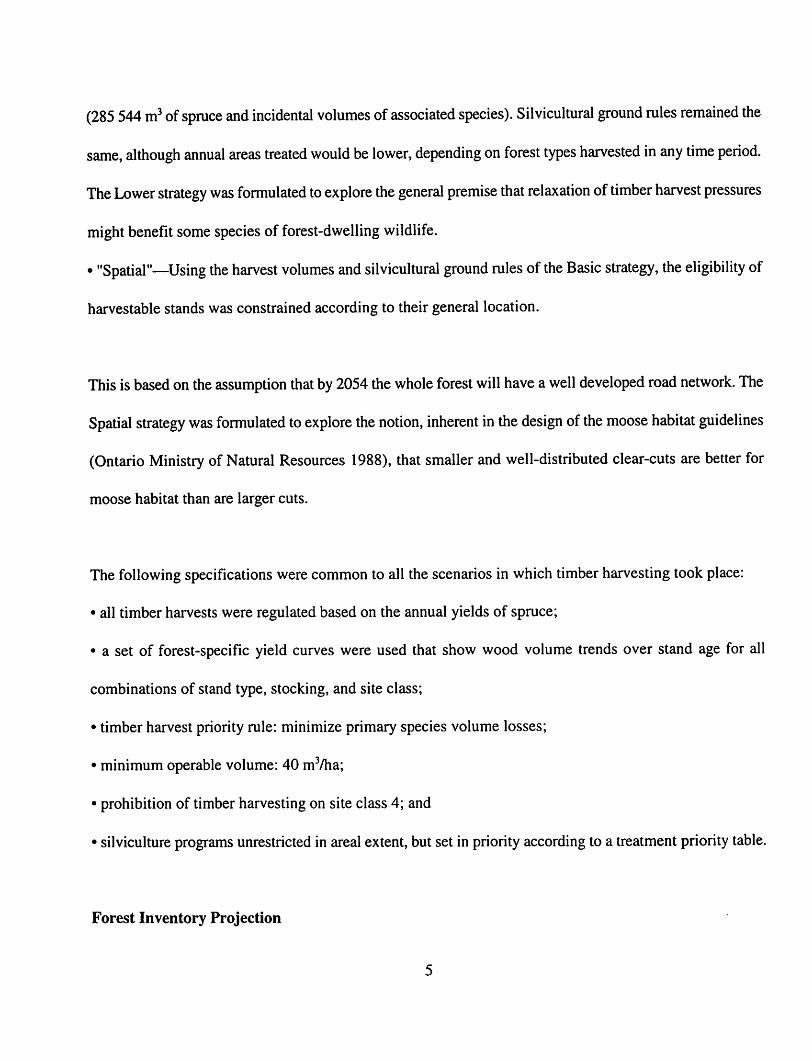
Target density for harvest: Because the LAMF includes areas from three different WMUs, the target
density for theLAMF was calculated using anarea-weighted average of the 1995 provincial targets forthese
WMUs; the resulting target density was calculated as 0.27 moose per km2.
Cow harvest rate: The relationship between the cow harvest rate and the density of moose each year was
defined in the model by the following points:
Actual density / Target density Cow harvest rate
0 0
0.25 0.02
0.5 0.04
0.75 0.06
>1.0 0.085
Bull-to-cow harvest ratio: A value of 3.5 was used for all the model runs.
Calf-to-cow harvest ratio: A value of 1.67 was used for all the model runs.
Relative hunting pressure and access: For the model to distribute the moose harvest spatially, the
relationship between the amount of forested area and the relative hunting pressure must be specified. In
quantifying this relationship, it was assumed that the younger a particular hectare of forest is, the more road
13
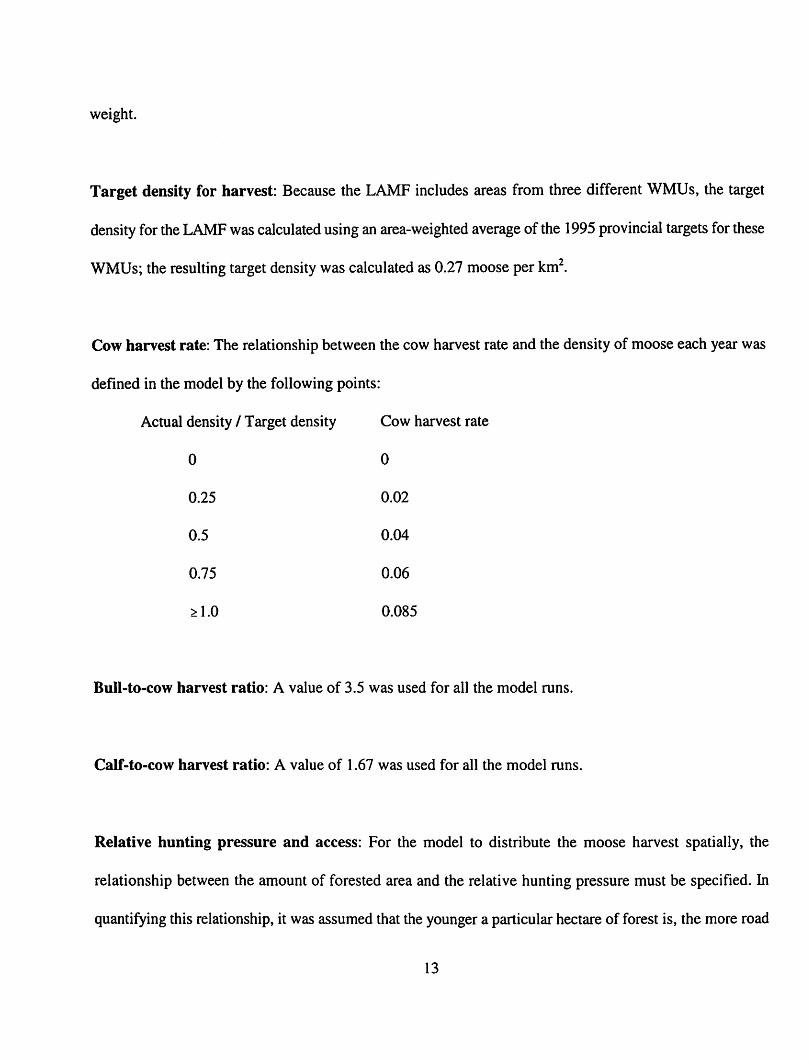
access there will be (because of recent timber harvesting) and the greater the relative hunting pressure. The
relative contribution of each age class of forest in determining the total proportion of each HAU that was
accessed was assumed to decrease exponentially as a function of the timesince the lastharvest, with access
being negligible 40 years afterharvesting. This was represented as follows in the model:
Forest age class Relative contribution to access
0-10 1
11-20 0.5
21-30 0.25
31-40 0.125
Finally, in translating the effect of access into relative hunting pressure in the model, a 1:1 relationship was
assumed between the relative hunting pressure and the proportion of access in each habitat window.
RESULTS AND DISCUSSION
Forest Inventory Projection and Wood Supply
Except for one time step in one of the simulations (2004-2014), all timber harvest targets could be met, and
therefore can be judged to be sustainable over the 100 year simulation period.
14
Age Class Structure
Age class structure isimportant indetermining moose food supplies according toourmodels, because young
stands (and, to some degree, very oldstands) provide the highest per-unit-area food supplies. Like theother
strategies, theNo Harvest strategy has substantial area in young ageclasses in 1994, but as time progresses
thestrategy has little or no area in these ageclasses. This will, predictably, have the effect of lowering the
moose food supplies of the No Harvest strategy as time passes.
Stocking Levels
In 1994, the average stockingper hectare across theforestwas74.5%.By the end of the 100-year simulation,
the average stocking under each strategy increased (a) under the No Harvest strategy, to 86.6%; (b) under
the Basic strategy, to 87.9%; (c) under the Lower strategy, to 85.4%; and (d) under the Spatial strategy, to
88.2%.
The shift from variable to moderate stocking will have two main effects upon moose habitat characteristics.
On one hand, since the relationships to calculate food supplies are most generous in poorly stocked stands
(food is inversely proportional to stocking), the average food supplies will shift downward over time as the
average stocking shifts upward. On the other hand, early winter cover is favoured by mid-range stocking, and
its value too goes down as stocking moves from mid-range to high range. Thus, moose habitat receives a
double downward pressure as the forest stocking increases over time.
15

Moose Habitat Forecasts
Becauseof the mannerof calculation, spring/summer and autumnfood supplies respond in exactly the same
mannerto changes in forest structure, so the following discussions will focus on spring/summer andearly
winter food responses. The spring/summer food response in any particular HAU is solely a function of the
sum of raw location-specific food supplies,but the earlywinterfood response is conditioned by the proximity
of food supplies to good seasonal cover.
Spring/Summer Food Responses
In 1994, the average spring/summer food value for the whole model forest was roughly 24 kg/ha dry weight
of browse. This value makes intuitive sense, given that the model forest is not considered prime moose
habitat.
Overall, the habitat models as constructed and parameterized in this study are unable to distinguish, for the
model forest as a whole, significant differences among the four strategies in terms of the predicted variable
of spring/summer food supply response.
Early Winter Food Responses
Earlywinter food supplies, as an averageacross the whole model forest, decline steadily in all scenarios, from
a 1994 high of almost 3 kg/ha, to a 2094 range of about 1 to 1.5 kg/ha. Again, this is a low value, consistent
16

with the general assumption that the model forest is poor quality moose habitat.
It was concluded that the habitat models as constructed and parameterized are able to distinguish, for the
model forest as a whole, significant differences among the four strategies in terms of the predicted variable
of early winter food supply response.
Moose Population Forecasts
Five sets of simulations with the moose population model were implemented using the four sets of outputs
from the habitat models:
(a) No Harvest strategy with no moose hunting;
(b) Basic strategy with no moose hunting;
(c) Basic strategy with moose hunting;
(d) Lower strategy with moose hunting; and
(e) Spatial strategy with moose hunting.
A run using the No Harvest strategy with hunting was not made because it was expected that roads would
become impassible to hunters over time, and that hunting opportunities in new and recent clearcuts would
diminish rapidly.Thus, under a No Harvest strategy, the moose hunting opportunities would rapidly erode.
Results of the five runs are shown below in tabular form, with moose populations as forecasted in 100 years:
17

Strategy Moose population (number per km2)
No Harvest, no hunting 0.2
Basic, no hunting 0.1
Basic, hunting 0.05
Lower, hunting 0.06
Spatial, hunting 0.05
Two Strategies Without Hunting
The current (1994) approximate moose population density inthe model forest is0.14 moose/km2. The moose
populations are responding to both their habitat and their predators, which include nonhuman vertebrates
such as wolves and bears, as well as humans. When the populations are allowed to come to equilibrium with
the simulated habitat alone, without hunting, the model shows that the density of moose as determined by
habitat would bejustunder 0.4 moose/km2 in 1994. Thismay indicate thathunting is responsible forholding
the current population several times lower than it would be if the population were constrained by habitat
CONCLUSIONS
Hunting seems to play an important role in keeping moose population densities at their current levels in the
model forest. If hunting were to cease entirely, the habitat could probably carry significantly higher moose
densities.
18

Forest simulations driven by assumptions that are oriented toward timber production (e.g., successful
plantation silviculture) are likely to lead to lower moose population densities. In particular, timber-oriented
forest management will result in a more dense forest structure, whereas nature is likely to produce more
lower-stocked and older stands in the landscape. Simulation analysts in forest management planning must
prepare realistic forest inventory projections for use in interpreting wildlife habitat and other biodiversity-
oriented values.
If current hunting pressures on moose in the model forest continue, then the kind of forest management
strategy implemented (i.e., how timber is harvested) may have a relatively minor impact on moose densities.
The No Harvest strategy failed to incorporate natural disturbances such as fire and insect infestations, and
the timber harvest strategies were too similar.
At least three obstacles must be overcome if simulation analysts are to develop and test a useful array of
forest management strategies for moose: (a) the uncertainties over what kinds of strategies would elicit
sufficiently different responses in habitat and populations; (b) the burden of data and model manipulation to
implement the alternative strategies; and (c) the potential for other people to dismiss specific strategies as
foolish or unimplementable.
Model Development, Testing, and Research Needs
The need to understand the implications of alternative approaches to forest management on populations of
important wildlife speciesis growing rapidly, as is apparent in many contemporary forest management and
19

policy initiatives. Examples of such initiatives include the criteria and indicators of the Canadian Council of
Forest Ministers (1995), the principles and criteria of the Forest Stewardship Council (1995), and the
indicators of forest sustainability in the Ontario forest management planning manual (Ontario Ministry of
Natural Resources 1995).
• development of a wider range of forest management strategies;
• development of mechanisms to incorporate natural disturbances into forest projections;
• implementation of a full sensitivity analysis of the models, particularly our population model;
• development of relationships for food and cover in late winter, a critical time of year for moose;
• development of methods to account for potential immigration and emigration of animals among habitat
assessment units, and between the study area and neighbouring forests;
• development of relationships between cow weight and birth rate (i.e., habitat and fecundity);
• collection of field data for moose food and cover relationships, as well as demographic data on moose
populations.
ACKNOWLEDGEMENTS
Funding for this study came from the Northern Ontario Development Agreement/Northern Forestry Program.
Thanks areextended to Abitibi-Price Inc. for help in securing forest data and creating the forest management
strategies. Thanks also to G.W. Crook, Canadian Forest Service-Great Lakes Forestry Centre, for preparing
this technical note from the final report.
20

LITERATURE CITED
Canadian Council of Forest Ministers. 1995. Defining sustainable forest management: A Canadian approach
to criteria and indicators. Nat. Resour. Can., Canadian Forest Service, Ottawa, ON. 22 p.
Crete, M. 1977. Importance de la coupe forestiere sur l'habitat hivernal de l'orignal dans le sud-ouest du
Quebec. Canadian Journal of Forest Research.
Duinker, P.N.; Higgelke, P.; Koppikar, S. 1991. GIS-based habitat supply modelling in northwestern Ontario:
Moose and marten, p. 271-275 in Proceedings, GIS '91: Applications in a Changing World, Forestry Canada,
Pacific Forestry Centre, Victoria, BC.
Duinker, P.N.; Higgelke, P.; Bookey, N. 1993. Future habitat for moose on the Aulneau Penninsula,
northwestern Ontario, p. 551-556 in Proceedings, Eyes on the Future: 7th Annual Symposium on
Geographic Information Systems in Forestry, Environment and Natural Resources Management. Supply and
Services Canada, Ottawa.
Forest Stewardship Council. 1995. Principles and criteria for natural forest management. Forest Stewardship
Council, Oaxaca, Mexico.
21

Heydon, C; Euler, D.;Smith, H.; Bisset, A. 1992. Modelling the selective moose harvest program in Ontario.
Alces 28:111-121.
Higgelke, P.E.; Duinker, P.N.; Koppikar, S. 1992. Moose carrying capacities on the Aulneau Penninsula:
Preliminary analysis. Report prepared for Kenora District, Ont. Min. Nat. Resour., Lakehead University,
School of Forestry, Thunder Bay, ON. 23 p + Append.
Joyal, R. 1987. Moose habitat investigations in Quebec and management implications. Swedish Wildlife
Research Supplement 1:139-153.
Moore, T.G.E.; Lockwood, C.G. 1990. The HSG wood supply model: Description and user's manual.
Information Report PI-X-98, Forestry Canada, Petawawa National Forestry Institute, Chalk River, ON. 31
P-
Ontario Ministry of Natural Resources. 1988. Timber management guidelines for the provision of moose
habitat. Ontario Ministry of Natural Resources, Wildlife Branch, Toronto, ON. 33 p.
Ontario Ministry of Natural Resources. 1995. Forest management planning manual for Ontario's crown
forests. Ontario Ministry of Natural Resources, Toronto, ON. 388 p.
22

Figure 1. Location ofthe Lake Abitibi Model Forest.
Figure 2. Calculation sequence in the moose population model.
23