Embed Size (px)
Citation preview
iLEAPS Newsletter Issue No. 10 ◆ November 2010 1
NewsletterIntegrated Land Ecosystem – Atmosphere Processes Study
www.ileaps.org
Issue No. 10 – November 2010
Terrestrial feedbacksand Earth system models
iLEAPS Newsletter Issue No. 10 ◆ November 20102
iLEAPS welcomes collaboration and interac-tion between the International Project Office(IPO) and the many researchers from a mul-titude of disciplines involved in iLEAPS activi-ties. We welcome guests from professors andsenior researchers to postdocs and PhDstudents.
A guest scientist can host a workshop,edit a book or journal special issue related toiLEAPS activities, guest–edit the iLEAPS
Newsletter, develop new initiatives, plan andenhance national iLEAPS activities, constructa website, for example.
This is an opportunity for close collabora-tion with an international research programwith a view of the activities all over theworld, also an opportunity to develop newinteractions and lines of research, obtainnew contacts, and spend a shorter or longertime period in new surroundings.
Although budget constraints usuallylimit our ability to fund visitors, we providefor the office and computational needs ofvisitors who come with independent salarysupport.
If you are interested in spending a sab-batical, a shorter of longer period at iLEAPSIPO, please contact: [email protected]
iLEAPS IPO GUEST SCIENTISTS
iLEAPS Science Plan andImplementation Strategy isavailable in English and inChinese.
The iLEAPS Newsletter informs on iLEAPS-related scientific activities. The theme ofcontributions should be relevant to iLEAPSand integrated land-atmosphere research.The Newsletter is published twice a year andit is released both in printed and on-lineversions. For the paper version the specifiedword length according to these instructionsis enforced. The author may provide addi-tional material to be used on the iLEAPSweb site.
INSTRUCTIONS TO CONTRIBUTORS
Photographs should be in TIF format,minimum 300 dpi. When you take photos,save them using the best possible resolutionand quality available in your camera settings,with as little compression as possible.Generally digital cameras (and photoscanners) save photos in RGB format. Sendthe photos in the format saved by thecamera, do not make any transformations. Ifyou use Photoshop or some other programto edit the photo, then save the file in EPSformat with resolution 300 dpi, no compres-sion. If the program forces you to compressthe file, select the best possible quality. Even.tif and very little compressed JPEG formatsare applicable. In addition to EPS format, agood format for sending all kinds of photosis PDF, with resolution at minimum 300 dpi(in the size it will be printed in) and as littlecompression as possible.
The contributors are kindly requested tohandle potential copyright issues of thematerial.
EDITORIAL
Editorials are around 500 words with orwithout one accompanying figure. Editorialsare by invitation and feature a personalinterpretation and evaluation on the themeof the issue.
NEWS
Other than strictly scientific contents will bemax 200 words and can be for
● PEOPLE presentation
● ACTIVITIES report and commentaries
● ANNOUNCEMENTS of coming events orother short news.
Text and graphs should be provided inseparate files. Please do not send graphs,figures, logos, photos or other graphicalmaterial inserted into Word documents.
Text should be in Word doc or plain text.
Graphs and figures should be in its originalformat or else as high resolution .eps vectorimages. If you do not have the possibility tosave the graph as an EPS file, save it as a verylarge pixel graph, minimum 300 dpi (TIF, TIFFor JPEG).
SCIENTIFIC ARTICLES
Articles are 700–1000 words and cover 1–2pages with accompanying 2–3 pictures orfigures. Articles can contain the following:
● RESULTS of scientific research
● SUMMARIES presenting synthesisof recent scientific development inland-atmosphere research
● POSITION PAPERS stating viewsand directions in scientific research
● REPORTS presenting key scientificoutcomes of programmes, workshops,or meetings.
Get your paper copy bycontacting [email protected] download the .pdf filesfrom the iLEAPS web siteat: www.ileaps.org
iLEAPS IPO ISSPONSORED BY:
● University of Helsinki
● Finnish Meteorological Institute
● Ministry of Education, Finland
Contributions should be e–mailed to theExecutive Editor at the iLEAPS IPO.
iLEAPS Newsletter Issue No. 10 ◆ November 2010 3
iLEAPS Newsletter
ISSN Printed version 1796–0363ISSN On–line version 1796–0401For submissions and subscriptionsplease contact [email protected]
PublisheriLEAPSInternational Project OfficeErik Palmenin aukio 1PO Box 48FI-00014 University of HelsinkiTel: +358 (0)9 191 50571Fax: +358 (0)9 191 [email protected]
Editorial PaneliLEAPS Executive Committee
Editor–in–ChiefAnni Reissell
Executive EditorTanja Suni
Circulation3000
Printed by J–Paino Oy, FinlandLayout by Ilpo Koskinen, Kimarko, Finland
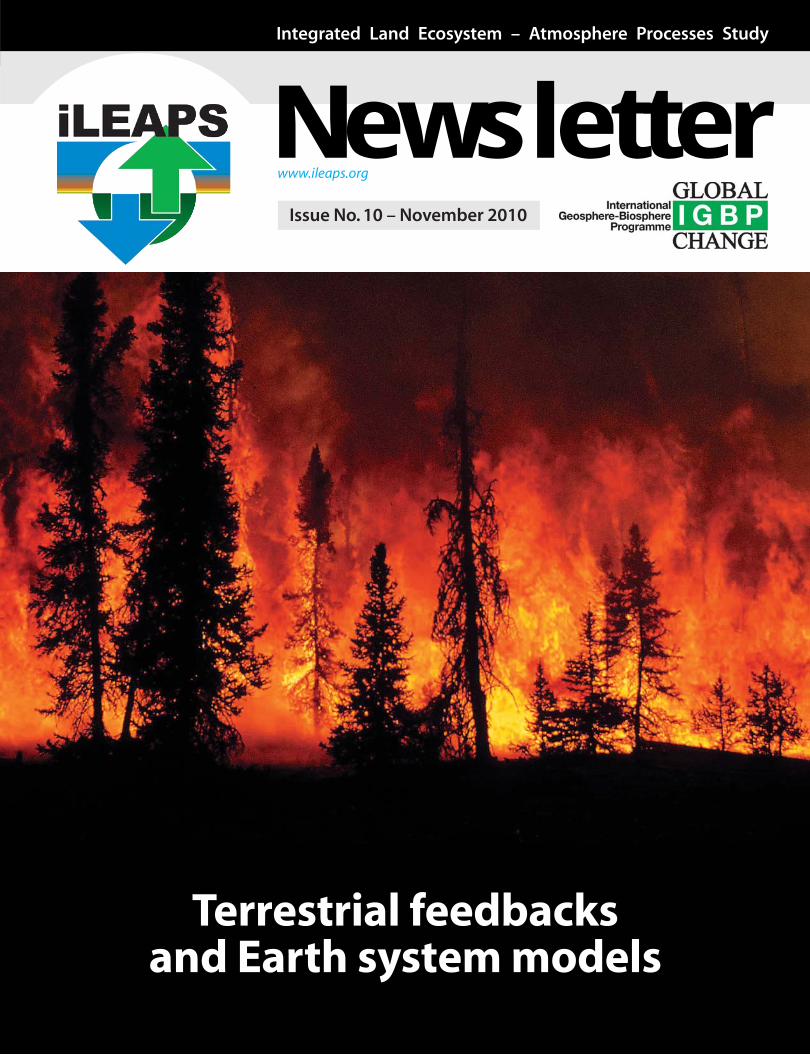
Cover photo:
Fire in the boreal forest of Canada© Brian J. Stocks, Canadian ForestService
The boreal forests are located northwardof 50 north latitude and are found mostlyin Canada, Alaska, Siberia, and China.The boreal forests represent about 29% ofthe world's total forest area and about37% of the total land global carbon.
CONTENTS
EDITORIAL
Terrestrial feedbacks and Earth system models 4
SCIENCE
Biogeophysical processes behind the climatic influence of deforestation 6
Global warming or cooling from historical land–cover change? 10
Recent and future advances in Dynamic Vegetation Modelling 14
Global process–based fire modelling 18
Elevated tropical nitrogen deposition: soil–atmosphere interaction 22
A network of measuring stations to monitor climate change 26
ACTIVITIES
ALANIS: a joint ESA-iLEAPS study over boreal Eurasia 28
IGBP second synthesis 34
Land–use–induced land–cover changes and the Earth System 36
EARLY–CAREER SCIENTIST PAGE
Early–career scientist interview 40
MEETINGS AND EVENTS
Recent meetings 42
Upcoming events
❏ 3rd iLEAPS international science conference 2011 9
❏ 3rd iLEAPS international science conference 2011 workshops 13
❏ International science conference 2012: Planet under pressure 43
iLEAPS Newsletter Issue No. 10 ◆ November 2010 1
NewsletterIntegrated Land Ecosystem – Atmosphere Processes Study
www.ileaps.org
Terrestrial feedbacksand Earth system models
Issue No. 10 – November 2010
iLEAPS Newsletter Issue No. 10 ◆ November 20104
Terrestrial feedbacks andEarth system models
Guest Editor Gordon B. Bonan
E d i t o r i a lE d i t o r i a l
The first models of the Earth’s atmospherefocused on its physics and dynamics andwere appropriately termed atmosphericgeneral circulation models. Earth’s surface –its oceans, sea ice, and land – was treatedthrough specified boundary conditions. Sub-sequent development of ocean, sea ice, andland component models provided geophysi-cal interactions within the climate systemand allowed simulation of Earth’s climate.
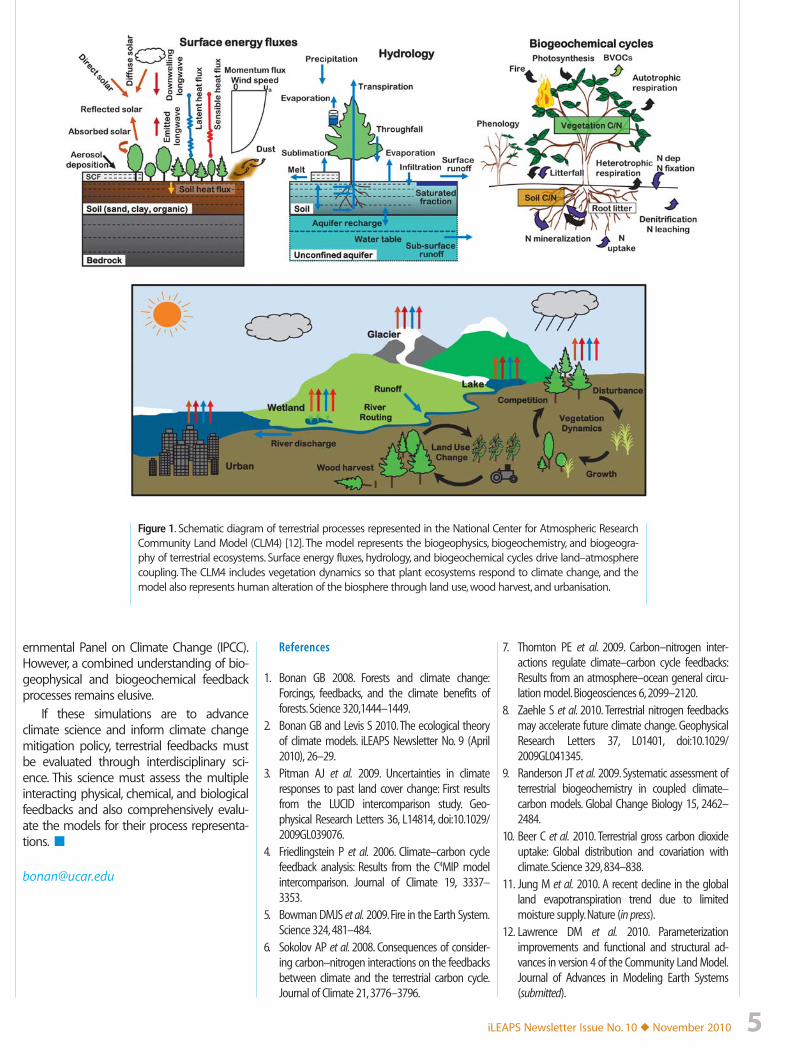
The initial land models represented sur-face hydrometeorology, excluding vegeta-tion. With the advancement of soil–vegeta-tion–atmosphere transfer schemes to repre-sent land–atmosphere interactions, climatemodels added a biogeophysical framework.Further developments in biogeochemistryand biogeography facilitated the advance-ment from models of the land surface tomodels of the terrestrial biosphere [1, 2]. Fig.1 shows a schematic diagram of these proc-esses in the National Center for AtmosphericResearch Community Land Model (CLMversion 4).
The breadth with which models nowrepresent the physics, chemistry, and biologyof terrestrial ecosystems (both managed andunmanaged), the responsiveness of eco-systems to and their influence on atmos-pheric processes, and the pervasive influenceof human activity on the biosphere (includ-ing also urbanisation) has contributed to theevolution of climate models to models ofthe Earth system. In this issue of the iLEAPSNewsletter, we cover a range of topicsrelevant for terrestrial feedbacks and Earthsystem models. Prominent themes arebiogeochemical cycles, human–inducedland–cover change, and their influence onclimate change.
Human–induced land–cover changealters climate through changes in surfacealbedo (reflectiveness), surface roughness,and evapotranspiration (evaporation fromsurfaces and transpiration from plants) [3].Davin and de Noblet–Ducoudré examinethese biogeophysical processes. They findthat global forest removal increases surfacealbedo (producing large global cooling), butdecreases evapotranspiration and surfaceroughness (each yielding small globalwarming).
Land–cover change also altersbiogeochemical cycles, and a more inte-grated understanding of ecosystem–atmos-phere coupling contrasts biogeophysicaland biogeochemical processes [1]. Pongratzfinds that the global temperature responseto historical land–cover change over the 20th
century has been a warming driven by car-bon emissions, diminished to a small extentby biogeophysical cooling from increasedsurface albedo. However, biogeophysicalcooling strongly offsets biogeochemicalwarming in some regions.
Our current understanding of carboncycle feedback in the Earth system is thatplants respond to increasing atmosphericcarbon dioxide (CO
2) concentration through
greater photosynthetic uptake, diminishedby increased carbon loss through respirationand plant dieback with climate warming [4].Fisher explains that this modelling paradigmexcludes key concepts of plant ecology thatdetermine the long–term dynamics ofcommunity composition and ecosystemfunctions in relation to land use and climatechange. These principles require a newgeneration of global vegetation dynamicsmodels.
Fire from lightning and human ignitionis another key terrestrial feedback in theEarth system [5]. Kloster describes the repre-sentation of fire in a terrestrial biospheremodel that accounts for natural wildfiresfrom lightning, accidental human–ignitedfires, and land–use change. Land–use activi-ties in the form of deforestation fires are acritical feature of the simulated fire cycle.
Coupled carbon–nitrogen biogeochem-istry is being included in terrestrial biospheremodels, though the influence of nitrogen oncarbon cycle–climate feedback is uncertain[6, 7, 8]. One key driver of carbon–nitrogendynamics is nitrogen deposition from hu-man activities. Koehler et al. reveal the com-plexities of nitrogen deposition as it affectsthe carbon balance and trace gas emissionsin tropical forests.
An integrated validation of terrestrialbiosphere models remains an importantchallenge, especially with respect to surfacefluxes and the carbon cycle [9]. Comprehen-sive datasets of ecosystem–atmosphereinteractions are needed to guide model de-velopment and to critically evaluate modelsimulations. Flux tower networks such asFLUXNET allow monitoring of the globalbiosphere [10, 11], but Hari et al. advocate fora still more comprehensive monitoring sys-tem with a hierarchy of measuring stations.
As climate models evolve into Earthsystem models, they can inform ecosystemmanagement practices such as reforestation,afforestation, and avoided deforestation tomitigate climate change. For example,anthropogenic land–cover change and thecarbon cycle are included in climatesimulations of the 20th and 21st centuries forthe Fifth Assessment Report of the Intergov-
iLEAPS Newsletter Issue No. 10 ◆ November 2010 5
7. Thornton PE et al. 2009. Carbon–nitrogen inter-actions regulate climate–carbon cycle feedbacks:Results from an atmosphere–ocean general circu-lation model. Biogeosciences 6, 2099–2120.
8. Zaehle S et al. 2010. Terrestrial nitrogen feedbacksmay accelerate future climate change. GeophysicalResearch Letters 37, L01401, doi:10.1029/2009GL041345.
9. Randerson JT et al. 2009. Systematic assessment ofterrestrial biogeochemistry in coupled climate–carbon models. Global Change Biology 15, 2462–2484.
10. Beer C et al. 2010. Terrestrial gross carbon dioxideuptake: Global distribution and covariation withclimate. Science 329, 834–838.
11. Jung M et al. 2010. A recent decline in the globalland evapotranspiration trend due to limitedmoisture supply. Nature (in press).
12. Lawrence DM et al. 2010. Parameterizationimprovements and functional and structural ad-vances in version 4 of the Community Land Model.Journal of Advances in Modeling Earth Systems(submitted).
References
1. Bonan GB 2008. Forests and climate change:Forcings, feedbacks, and the climate benefits offorests. Science 320,1444–1449.
2. Bonan GB and Levis S 2010. The ecological theoryof climate models. iLEAPS Newsletter No. 9 (April2010), 26–29.
3. Pitman AJ et al. 2009. Uncertainties in climateresponses to past land cover change: First resultsfrom the LUCID intercomparison study. Geo-physical Research Letters 36, L14814, doi:10.1029/2009GL039076.
4. Friedlingstein P et al. 2006. Climate–carbon cyclefeedback analysis: Results from the C4MIP modelintercomparison. Journal of Climate 19, 3337–3353.
5. Bowman DMJS et al. 2009. Fire in the Earth System.Science 324, 481–484.
6. Sokolov AP et al. 2008. Consequences of consider-ing carbon–nitrogen interactions on the feedbacksbetween climate and the terrestrial carbon cycle.Journal of Climate 21, 3776–3796.
ernmental Panel on Climate Change (IPCC).However, a combined understanding of bio-geophysical and biogeochemical feedbackprocesses remains elusive.
If these simulations are to advanceclimate science and inform climate changemitigation policy, terrestrial feedbacks mustbe evaluated through interdisciplinary sci-ence. This science must assess the multipleinteracting physical, chemical, and biologicalfeedbacks and also comprehensively evalu-ate the models for their process representa-tions. ■
Figure 1. Schematic diagram of terrestrial processes represented in the National Center for Atmospheric ResearchCommunity Land Model (CLM4) [12]. The model represents the biogeophysics, biogeochemistry, and biogeogra-phy of terrestrial ecosystems. Surface energy fluxes, hydrology, and biogeochemical cycles drive land–atmospherecoupling. The CLM4 includes vegetation dynamics so that plant ecosystems respond to climate change, and themodel also represents human alteration of the biosphere through land use, wood harvest, and urbanisation.
iLEAPS Newsletter Issue No. 10 ◆ November 20106
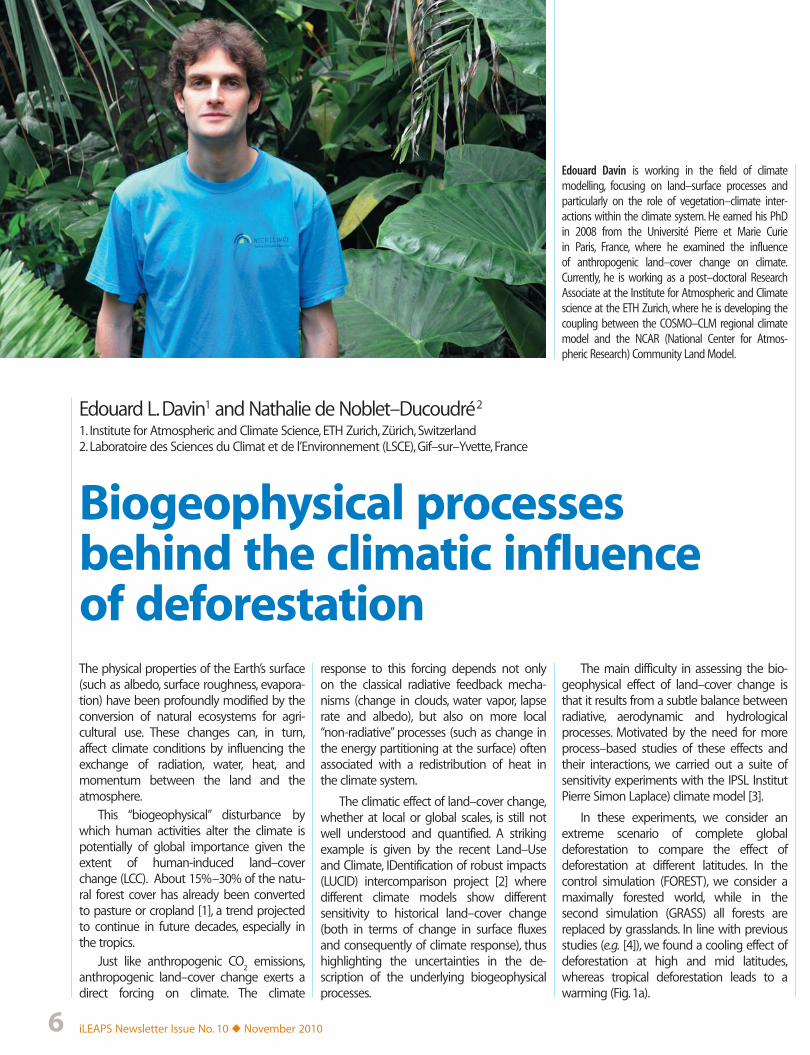
Edouard L. Davin1 and Nathalie de Noblet–Ducoudré2
1. Institute for Atmospheric and Climate Science, ETH Zurich, Zürich, Switzerland2. Laboratoire des Sciences du Climat et de l’Environnement (LSCE), Gif–sur–Yvette, France
Biogeophysical processesbehind the climatic influenceof deforestation
Edouard Davin is working in the field of climatemodelling, focusing on land–surface processes andparticularly on the role of vegetation–climate inter-actions within the climate system. He earned his PhDin 2008 from the Université Pierre et Marie Curiein Paris, France, where he examined the influenceof anthropogenic land–cover change on climate.Currently, he is working as a post–doctoral ResearchAssociate at the Institute for Atmospheric and Climatescience at the ETH Zurich, where he is developing thecoupling between the COSMO–CLM regional climatemodel and the NCAR (National Center for Atmos-pheric Research) Community Land Model.
The physical properties of the Earth’s surface(such as albedo, surface roughness, evapora-tion) have been profoundly modified by theconversion of natural ecosystems for agri-cultural use. These changes can, in turn,affect climate conditions by influencing theexchange of radiation, water, heat, andmomentum between the land and theatmosphere.
This “biogeophysical” disturbance bywhich human activities alter the climate ispotentially of global importance given theextent of human-induced land–coverchange (LCC). About 15%–30% of the natu-ral forest cover has already been convertedto pasture or cropland [1], a trend projectedto continue in future decades, especially inthe tropics.
Just like anthropogenic CO2 emissions,
anthropogenic land–cover change exerts adirect forcing on climate. The climate
response to this forcing depends not onlyon the classical radiative feedback mecha-nisms (change in clouds, water vapor, lapserate and albedo), but also on more local“non-radiative” processes (such as change inthe energy partitioning at the surface) oftenassociated with a redistribution of heat inthe climate system.
The climatic effect of land–cover change,whether at local or global scales, is still notwell understood and quantified. A strikingexample is given by the recent Land–Useand Climate, IDentification of robust impacts(LUCID) intercomparison project [2] wheredifferent climate models show differentsensitivity to historical land–cover change(both in terms of change in surface fluxesand consequently of climate response), thushighlighting the uncertainties in the de-scription of the underlying biogeophysicalprocesses.
The main difficulty in assessing the bio-geophysical effect of land–cover change isthat it results from a subtle balance betweenradiative, aerodynamic and hydrologicalprocesses. Motivated by the need for moreprocess–based studies of these effects andtheir interactions, we carried out a suite ofsensitivity experiments with the IPSL InstitutPierre Simon Laplace) climate model [3].
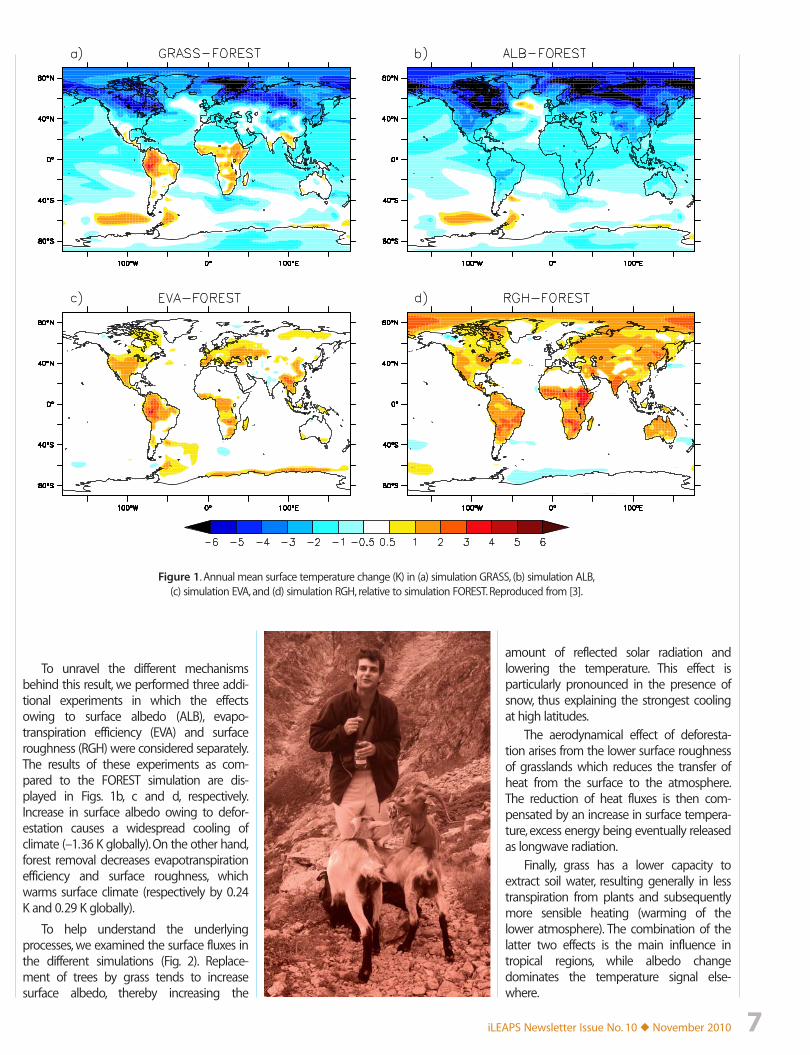
In these experiments, we consider anextreme scenario of complete globaldeforestation to compare the effect ofdeforestation at different latitudes. In thecontrol simulation (FOREST), we consider amaximally forested world, while in thesecond simulation (GRASS) all forests arereplaced by grasslands. In line with previousstudies (e.g. [4]), we found a cooling effect ofdeforestation at high and mid latitudes,whereas tropical deforestation leads to awarming (Fig. 1a).
iLEAPS Newsletter Issue No. 10 ◆ November 2010 7
Figure 1. Annual mean surface temperature change (K) in (a) simulation GRASS, (b) simulation ALB,(c) simulation EVA, and (d) simulation RGH, relative to simulation FOREST. Reproduced from [3].
To unravel the different mechanismsbehind this result, we performed three addi-tional experiments in which the effectsowing to surface albedo (ALB), evapo-transpiration efficiency (EVA) and surfaceroughness (RGH) were considered separately.The results of these experiments as com-pared to the FOREST simulation are dis-played in Figs. 1b, c and d, respectively.Increase in surface albedo owing to defor-estation causes a widespread cooling ofclimate (–1.36 K globally). On the other hand,forest removal decreases evapotranspirationefficiency and surface roughness, whichwarms surface climate (respectively by 0.24K and 0.29 K globally).
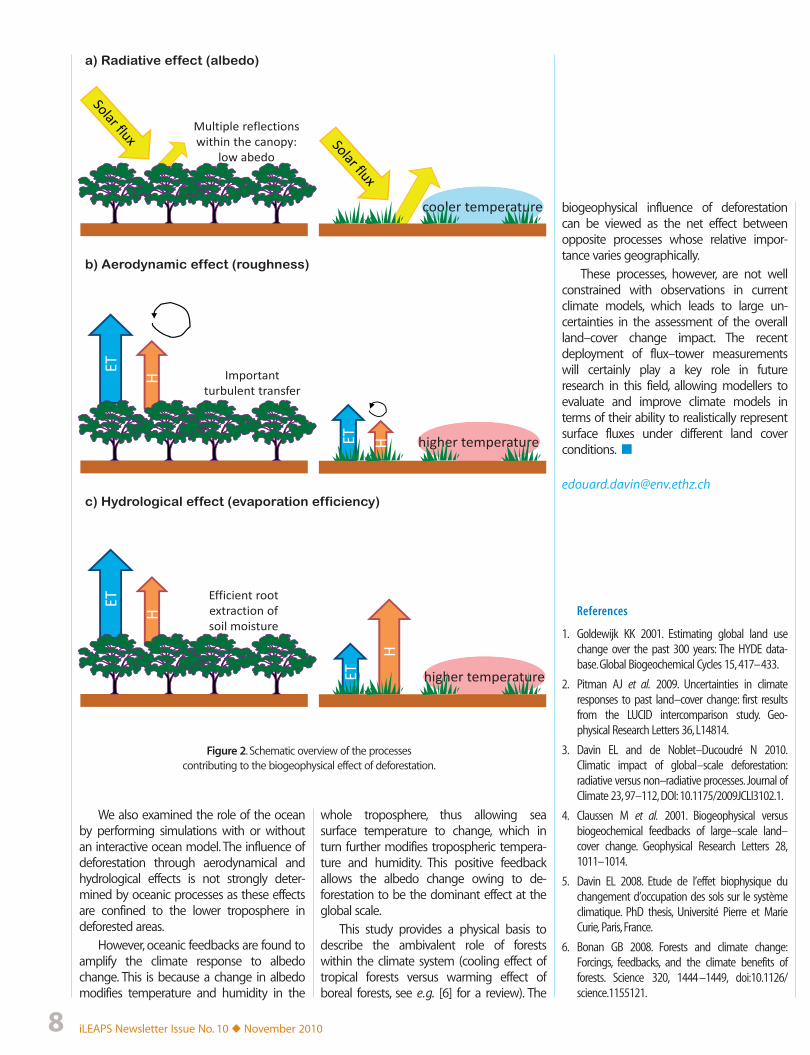
To help understand the underlyingprocesses, we examined the surface fluxes inthe different simulations (Fig. 2). Replace-ment of trees by grass tends to increasesurface albedo, thereby increasing the
amount of reflected solar radiation andlowering the temperature. This effect isparticularly pronounced in the presence ofsnow, thus explaining the strongest coolingat high latitudes.
The aerodynamical effect of deforesta-tion arises from the lower surface roughnessof grasslands which reduces the transfer ofheat from the surface to the atmosphere.The reduction of heat fluxes is then com-pensated by an increase in surface tempera-ture, excess energy being eventually releasedas longwave radiation.
Finally, grass has a lower capacity toextract soil water, resulting generally in lesstranspiration from plants and subsequentlymore sensible heating (warming of thelower atmosphere). The combination of thelatter two effects is the main influence intropical regions, while albedo changedominates the temperature signal else-where.
iLEAPS Newsletter Issue No. 10 ◆ November 20108
H
ET
H
HET
H
ETET
cooler temperature
higher temperature
higher temperature
a) Radiative effect (albedo)
b) Aerodynamic effect (roughness)
c) Hydrological effect (evaporation efficiency)
Multiple reflectionswithin the canopy:
low abedo
Importantturbulent transfer
Efficient rootextraction ofsoil moisture
References
1. Goldewijk KK 2001. Estimating global land usechange over the past 300 years: The HYDE data-base. Global Biogeochemical Cycles 15, 417–433.
2. Pitman AJ et al. 2009. Uncertainties in climateresponses to past land–cover change: first resultsfrom the LUCID intercomparison study. Geo-physical Research Letters 36, L14814.
3. Davin EL and de Noblet–Ducoudré N 2010.Climatic impact of global–scale deforestation:radiative versus non–radiative processes. Journal ofClimate 23, 97–112, DOI: 10.1175/2009JCLI3102.1.
4. Claussen M et al. 2001. Biogeophysical versusbiogeochemical feedbacks of large–scale land–cover change. Geophysical Research Letters 28,1011–1014.
5. Davin EL 2008. Etude de l’effet biophysique duchangement d’occupation des sols sur le systèmeclimatique. PhD thesis, Université Pierre et MarieCurie, Paris, France.
6. Bonan GB 2008. Forests and climate change:Forcings, feedbacks, and the climate benefits offorests. Science 320, 1444–1449, doi:10.1126/science.1155121.
Figure 2. Schematic overview of the processescontributing to the biogeophysical effect of deforestation.
We also examined the role of the oceanby performing simulations with or withoutan interactive ocean model. The influence ofdeforestation through aerodynamical andhydrological effects is not strongly deter-mined by oceanic processes as these effectsare confined to the lower troposphere indeforested areas.
However, oceanic feedbacks are found toamplify the climate response to albedochange. This is because a change in albedomodifies temperature and humidity in the
whole troposphere, thus allowing seasurface temperature to change, which inturn further modifies tropospheric tempera-ture and humidity. This positive feedbackallows the albedo change owing to de-forestation to be the dominant effect at theglobal scale.
This study provides a physical basis todescribe the ambivalent role of forestswithin the climate system (cooling effect oftropical forests versus warming effect ofboreal forests, see e.g. [6] for a review). The
biogeophysical influence of deforestationcan be viewed as the net effect betweenopposite processes whose relative impor-tance varies geographically.
These processes, however, are not wellconstrained with observations in currentclimate models, which leads to large un-certainties in the assessment of the overallland–cover change impact. The recentdeployment of flux–tower measurementswill certainly play a key role in futureresearch in this field, allowing modellers toevaluate and improve climate models interms of their ability to realistically representsurface fluxes under different land coverconditions. ■
iLEAPS Newsletter Issue No. 10 ◆ November 2010 9
Important dates15 Mar 2011 Deadline for abstract submission15 May 2011 Confirmation of abstracts30 Jun 2011 Deadline for early–bird registration
Conference structureThe conference will consist of plenary lectures and invitedspeeches given by prominent scientists in LEAP (LandEcosystem — Atmosphere Processes) research, poster sessions,and an Early–Career Scientist programme.
Conference themes1. Land ecosystem–atmosphere observation2. Land ecosystem–atmosphere modelling3. Innovative methods, ideas and challenges in ecosystem–atmosphere interactions4. Human drivers and impacts of ecosystem–atmosphere interactions
Local organising committeeHans Peter SchmidAlexander KnohlMeinrat O. AndreaeIngrid Kögel–KnabnerElija BleherMonika LieblMartin ClaussenWolfram MauserThomas FokenHarry VereeckenMartin Heimann
3rd iLEAPS InternationalScience Conference
18–23 September 2011Garmisch–Partenkirchen,Germany
ContactHans Peter [email protected] Institute of Technology (KIT)Institute of Meteorology and ClimateResearch (IMK–IFU)Garmisch–Partenkirchen, Germany
Anni [email protected] International Project [email protected]
The iLEAPS Scientific Steering Committeeand the Karlsruhe Institute of Technologywarmly welcome you to participate iniLEAPS SC2011.Conference website:www.ileaps.org/science_conf_2011
iLEAPS, Integrated Land Ecosystem – Atmosphere Processes Study,is an international interdisciplinary research program aimed atimproved understanding of processes, linkages and feedbacksin the land–atmosphere interface affecting the Earth System.iLEAPS is the land–atmosphere core project of IGBP,International Geosphere — Biosphere Programme.
All themes involve both modellers andobservational researchers working atmultiple spatial and temporal scales, withmultiple observations, integration ofobservations into model developmentand evaluation.
Scientific committeeMarkku Kulmala, co–chair, FinlandAlex Guenther, co–chair, USAAlmut Arneth, SwedenPaulo Artaxo, BrazilEleanor Blyth, UKGordon Bonan, USAAijun Ding, ChinaLaurens Ganzeveld, NetherlandsHans–Christen Hansson, SwedenOluwagbemiga (Gbenga) O. Jegede,NigeriaNathalie de Noblet–Ducoudré, FrancePaul Palmer, UKMarkus Reichstein, GermanyAnni Reissell, FinlandHans Peter Schmid, GermanyMaria Assunção da Silva Dias, BrazilHanwant B. Singh, USADan Yakir, Israel
Call for papersiLEAPS welcomes scientists from allaround the world to submit an abstractrelated to one of the conference themes.
iLEAPS Newsletter Issue No. 10 ◆ November 201010
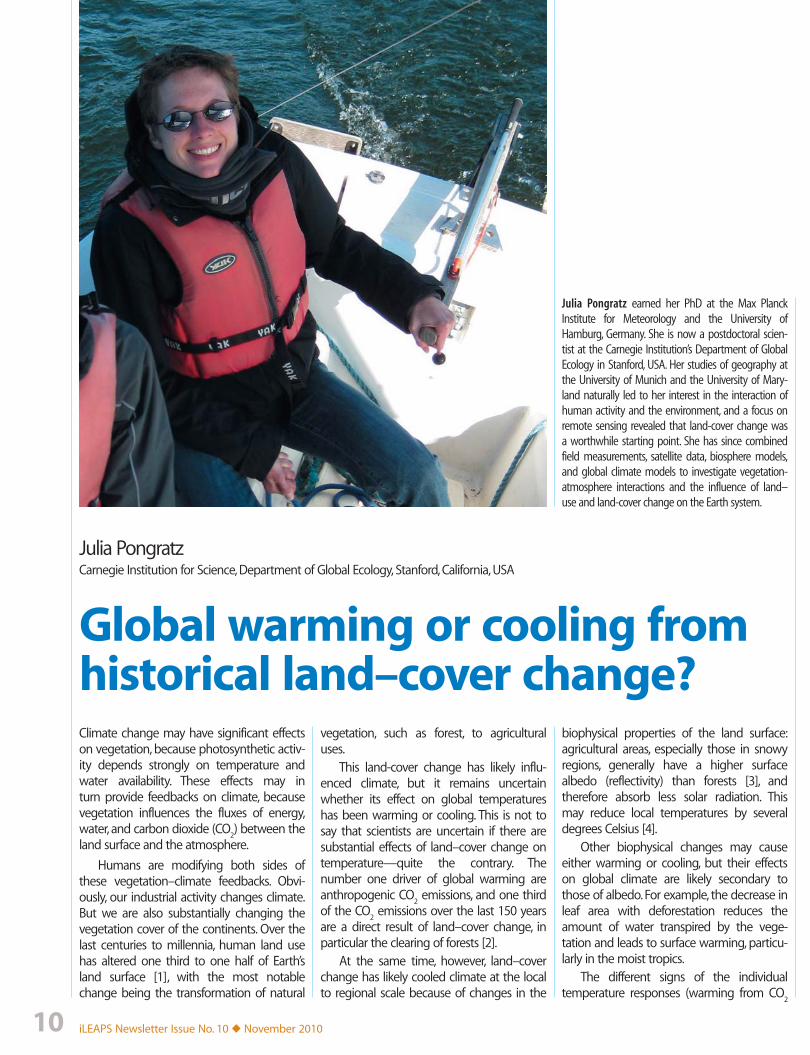
Julia PongratzCarnegie Institution for Science, Department of Global Ecology, Stanford, California, USA
Julia Pongratz earned her PhD at the Max PlanckInstitute for Meteorology and the University ofHamburg, Germany. She is now a postdoctoral scien-tist at the Carnegie Institution’s Department of GlobalEcology in Stanford, USA. Her studies of geography atthe University of Munich and the University of Mary-land naturally led to her interest in the interaction ofhuman activity and the environment, and a focus onremote sensing revealed that land-cover change wasa worthwhile starting point. She has since combinedfield measurements, satellite data, biosphere models,and global climate models to investigate vegetation-atmosphere interactions and the influence of land–use and land-cover change on the Earth system.
Global warming or cooling fromhistorical land–cover change?Climate change may have significant effectson vegetation, because photosynthetic activ-ity depends strongly on temperature andwater availability. These effects may inturn provide feedbacks on climate, becausevegetation influences the fluxes of energy,water, and carbon dioxide (CO
2) between the
land surface and the atmosphere.
Humans are modifying both sides ofthese vegetation–climate feedbacks. Obvi-ously, our industrial activity changes climate.But we are also substantially changing thevegetation cover of the continents. Over thelast centuries to millennia, human land usehas altered one third to one half of Earth’sland surface [1], with the most notablechange being the transformation of natural
vegetation, such as forest, to agriculturaluses.
This land-cover change has likely influ-enced climate, but it remains uncertainwhether its effect on global temperatureshas been warming or cooling. This is not tosay that scientists are uncertain if there aresubstantial effects of land–cover change ontemperature—quite the contrary. Thenumber one driver of global warming areanthropogenic CO
2 emissions, and one third
of the CO2 emissions over the last 150 years
are a direct result of land–cover change, inparticular the clearing of forests [2].
At the same time, however, land–coverchange has likely cooled climate at the localto regional scale because of changes in the
biophysical properties of the land surface:agricultural areas, especially those in snowyregions, generally have a higher surfacealbedo (reflectivity) than forests [3], andtherefore absorb less solar radiation. Thismay reduce local temperatures by severaldegrees Celsius [4].
Other biophysical changes may causeeither warming or cooling, but their effectson global climate are likely secondary tothose of albedo. For example, the decrease inleaf area with deforestation reduces theamount of water transpired by the vege-tation and leads to surface warming, particu-larly in the moist tropics.
The different signs of the individualtemperature responses (warming from CO
2
iLEAPS Newsletter Issue No. 10 ◆ November 2010 11
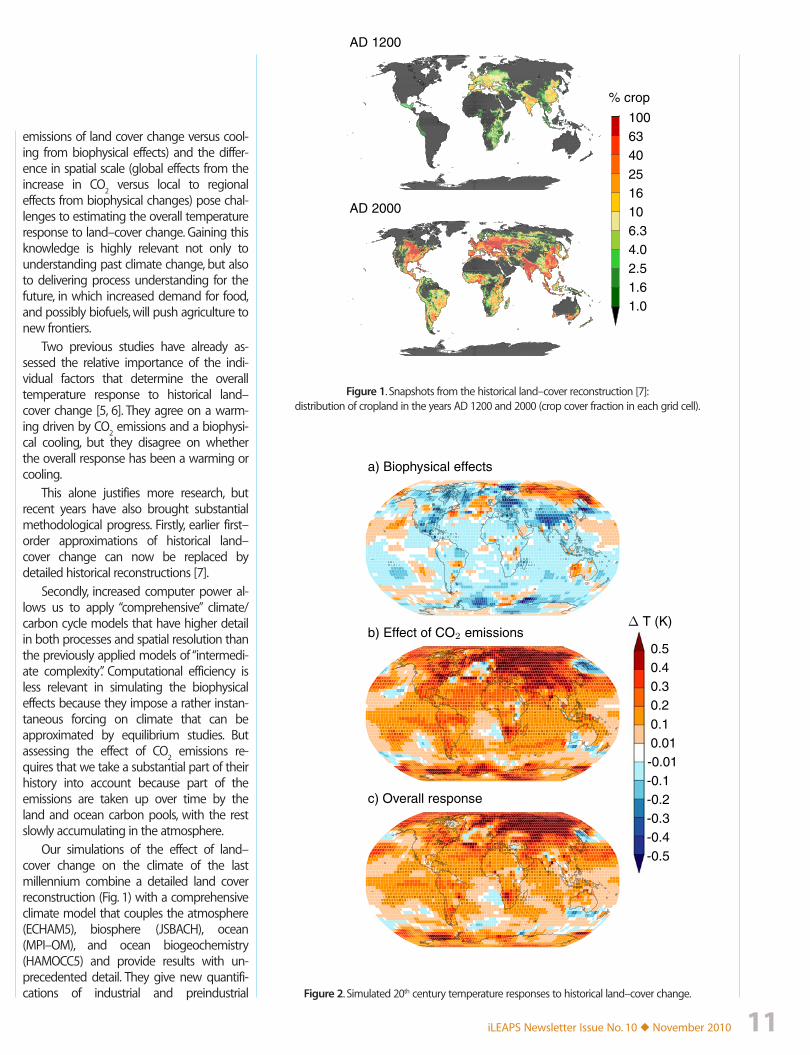
1.01.62.54.06.31016254063100
% crop
AD 1200
AD 2000
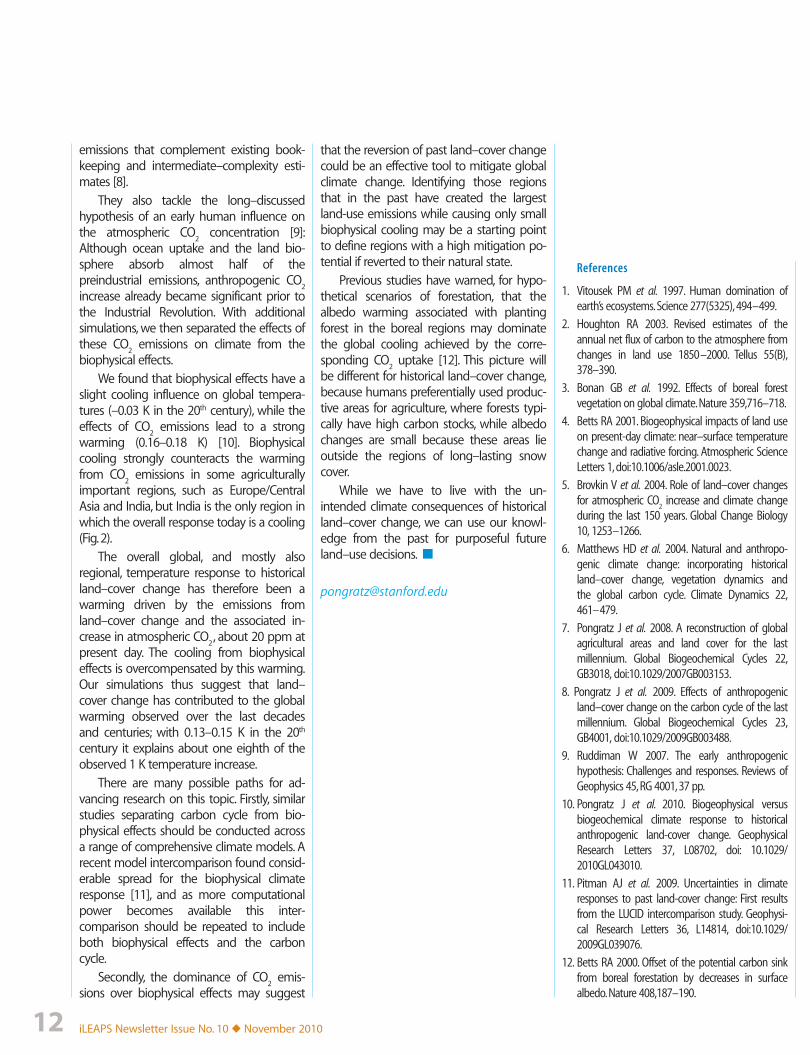
-0.5-0.4-0.3-0.2-0.1-0.010.010.10.20.30.40.5
Δ T (K)
a) Biophysical effects
b) Effect of CO2 emissions
c) Overall response
Figure 2. Simulated 20th century temperature responses to historical land–cover change.
Figure 1. Snapshots from the historical land–cover reconstruction [7]:distribution of cropland in the years AD 1200 and 2000 (crop cover fraction in each grid cell).
emissions of land cover change versus cool-ing from biophysical effects) and the differ-ence in spatial scale (global effects from theincrease in CO
2 versus local to regional
effects from biophysical changes) pose chal-lenges to estimating the overall temperatureresponse to land–cover change. Gaining thisknowledge is highly relevant not only tounderstanding past climate change, but alsoto delivering process understanding for thefuture, in which increased demand for food,and possibly biofuels, will push agriculture tonew frontiers.
Two previous studies have already as-sessed the relative importance of the indi-vidual factors that determine the overalltemperature response to historical land–cover change [5, 6]. They agree on a warm-ing driven by CO
2 emissions and a biophysi-
cal cooling, but they disagree on whetherthe overall response has been a warming orcooling.
This alone justifies more research, butrecent years have also brought substantialmethodological progress. Firstly, earlier first–order approximations of historical land–cover change can now be replaced bydetailed historical reconstructions [7].
Secondly, increased computer power al-lows us to apply “comprehensive” climate/carbon cycle models that have higher detailin both processes and spatial resolution thanthe previously applied models of “intermedi-ate complexity”. Computational efficiency isless relevant in simulating the biophysicaleffects because they impose a rather instan-taneous forcing on climate that can beapproximated by equilibrium studies. Butassessing the effect of CO
2 emissions re-
quires that we take a substantial part of theirhistory into account because part of theemissions are taken up over time by theland and ocean carbon pools, with the restslowly accumulating in the atmosphere.
Our simulations of the effect of land–cover change on the climate of the lastmillennium combine a detailed land coverreconstruction (Fig. 1) with a comprehensiveclimate model that couples the atmosphere(ECHAM5), biosphere (JSBACH), ocean(MPI–OM), and ocean biogeochemistry(HAMOCC5) and provide results with un-precedented detail. They give new quantifi-cations of industrial and preindustrial
iLEAPS Newsletter Issue No. 10 ◆ November 201012
References
1. Vitousek PM et al. 1997. Human domination ofearth’s ecosystems. Science 277(5325), 494–499.
2. Houghton RA 2003. Revised estimates of theannual net flux of carbon to the atmosphere fromchanges in land use 1850–2000. Tellus 55(B),378–390.
3. Bonan GB et al. 1992. Effects of boreal forestvegetation on global climate. Nature 359,716–718.
4. Betts RA 2001. Biogeophysical impacts of land useon present-day climate: near–surface temperaturechange and radiative forcing. Atmospheric ScienceLetters 1, doi:10.1006/asle.2001.0023.
5. Brovkin V et al. 2004. Role of land–cover changesfor atmospheric CO
2 increase and climate change
during the last 150 years. Global Change Biology10, 1253–1266.
6. Matthews HD et al. 2004. Natural and anthropo-genic climate change: incorporating historicalland–cover change, vegetation dynamics andthe global carbon cycle. Climate Dynamics 22,461–479.
7. Pongratz J et al. 2008. A reconstruction of globalagricultural areas and land cover for the lastmillennium. Global Biogeochemical Cycles 22,GB3018, doi:10.1029/2007GB003153.
8. Pongratz J et al. 2009. Effects of anthropogenicland–cover change on the carbon cycle of the lastmillennium. Global Biogeochemical Cycles 23,GB4001, doi:10.1029/2009GB003488.
9. Ruddiman W 2007. The early anthropogenichypothesis: Challenges and responses. Reviews ofGeophysics 45, RG 4001, 37 pp.
10. Pongratz J et al. 2010. Biogeophysical versusbiogeochemical climate response to historicalanthropogenic land-cover change. GeophysicalResearch Letters 37, L08702, doi: 10.1029/2010GL043010.
11. Pitman AJ et al. 2009. Uncertainties in climateresponses to past land-cover change: First resultsfrom the LUCID intercomparison study. Geophysi-cal Research Letters 36, L14814, doi:10.1029/2009GL039076.
12. Betts RA 2000. Offset of the potential carbon sinkfrom boreal forestation by decreases in surfacealbedo. Nature 408,187–190.
emissions that complement existing book-keeping and intermediate–complexity esti-mates [8].
They also tackle the long–discussedhypothesis of an early human influence onthe atmospheric CO
2 concentration [9]:
Although ocean uptake and the land bio-sphere absorb almost half of thepreindustrial emissions, anthropogenic CO
2
increase already became significant prior tothe Industrial Revolution. With additionalsimulations, we then separated the effects ofthese CO
2 emissions on climate from the
biophysical effects.We found that biophysical effects have a
slight cooling influence on global tempera-tures (–0.03 K in the 20th century), while theeffects of CO
2 emissions lead to a strong
warming (0.16–0.18 K) [10]. Biophysicalcooling strongly counteracts the warmingfrom CO
2 emissions in some agriculturally
important regions, such as Europe/CentralAsia and India, but India is the only region inwhich the overall response today is a cooling(Fig. 2).
The overall global, and mostly alsoregional, temperature response to historicalland–cover change has therefore been awarming driven by the emissions fromland–cover change and the associated in-crease in atmospheric CO
2, about 20 ppm at
present day. The cooling from biophysicaleffects is overcompensated by this warming.Our simulations thus suggest that land–cover change has contributed to the globalwarming observed over the last decadesand centuries; with 0.13–0.15 K in the 20th
century it explains about one eighth of theobserved 1 K temperature increase.
There are many possible paths for ad-vancing research on this topic. Firstly, similarstudies separating carbon cycle from bio-physical effects should be conducted acrossa range of comprehensive climate models. Arecent model intercomparison found consid-erable spread for the biophysical climateresponse [11], and as more computationalpower becomes available this inter-comparison should be repeated to includeboth biophysical effects and the carboncycle.
Secondly, the dominance of CO2 emis-
sions over biophysical effects may suggest
that the reversion of past land–cover changecould be an effective tool to mitigate globalclimate change. Identifying those regionsthat in the past have created the largestland-use emissions while causing only smallbiophysical cooling may be a starting pointto define regions with a high mitigation po-tential if reverted to their natural state.
Previous studies have warned, for hypo-thetical scenarios of forestation, that thealbedo warming associated with plantingforest in the boreal regions may dominatethe global cooling achieved by the corre-sponding CO
2 uptake [12]. This picture will
be different for historical land–cover change,because humans preferentially used produc-tive areas for agriculture, where forests typi-cally have high carbon stocks, while albedochanges are small because these areas lieoutside the regions of long–lasting snowcover.
While we have to live with the un-intended climate consequences of historicalland–cover change, we can use our knowl-edge from the past for purposeful futureland–use decisions. ■
iLEAPS Newsletter Issue No. 10 ◆ November 2010 13
Important dates
30 Jun 2011 Deadline for ECSW registration30 Jun 2011 Deadline for PCW registration
Post–Conference Workshop
(PCW)
Challenges and chances of integratedlong–term LEAP observatories25–26 September 2011IMK–IFU, KIT,Garmisch–Partenkirchen,GermanyThis event is by invitation only.For more information, please contact:[email protected]
Early–Career Scientist Workshop
(ECSW)
Challenges and chances ofinterdisciplinary collaboration inLand Ecosystem–Atmosphere Processes(LEAP) science16–17 September 2011Mercure Hotel,Garmisch–Partenkirchen,Germany
The iLEAPS Scientific Steering Committeeand the Karlsruhe Institute of Technologywarmly welcome you to participate inthe several events in Garmisch–Partenkirchen.
18–23 September 2011
3rd iLEAPS InternationalScience Conference
16–17 and 25–26 September 2011Garmisch–Partenkirchen,Germany
Contact
Hans Peter [email protected] Institute of Technology (KIT),Institute of Meteorology and ClimateResearch (IMK–IFU),Garmisch–Partenkirchen,Germanywww.imk-ifu.kit.edu
Anni [email protected] International Project Office (IPO),University of Helsinki,[email protected]
More information of iLEAPS SC2011 on
conference website:www.ileaps.org/science_conf_2011
iLEAPS, Integrated Land Ecosystem – Atmosphere Processes Study,is an international interdisciplinary research program aimed atimproved understanding of processes, linkages and feedbacksin the land–atmosphere interface affecting the Earth System.iLEAPS is the land–atmosphere core project of IGBP,International Geosphere — Biosphere Programme.
ECSW organising committee
Joshua Fisher, USAAndrea Ghirardo, GermanyIlona Riipinen, FinlandTaina Ruuskanen, FinlandNobuko Saigusa, JapanBenjamin Wolf, GermanyErika Zardin, Australia
Workshops
iLEAPS Newsletter Issue No. 10 ◆ November 201014
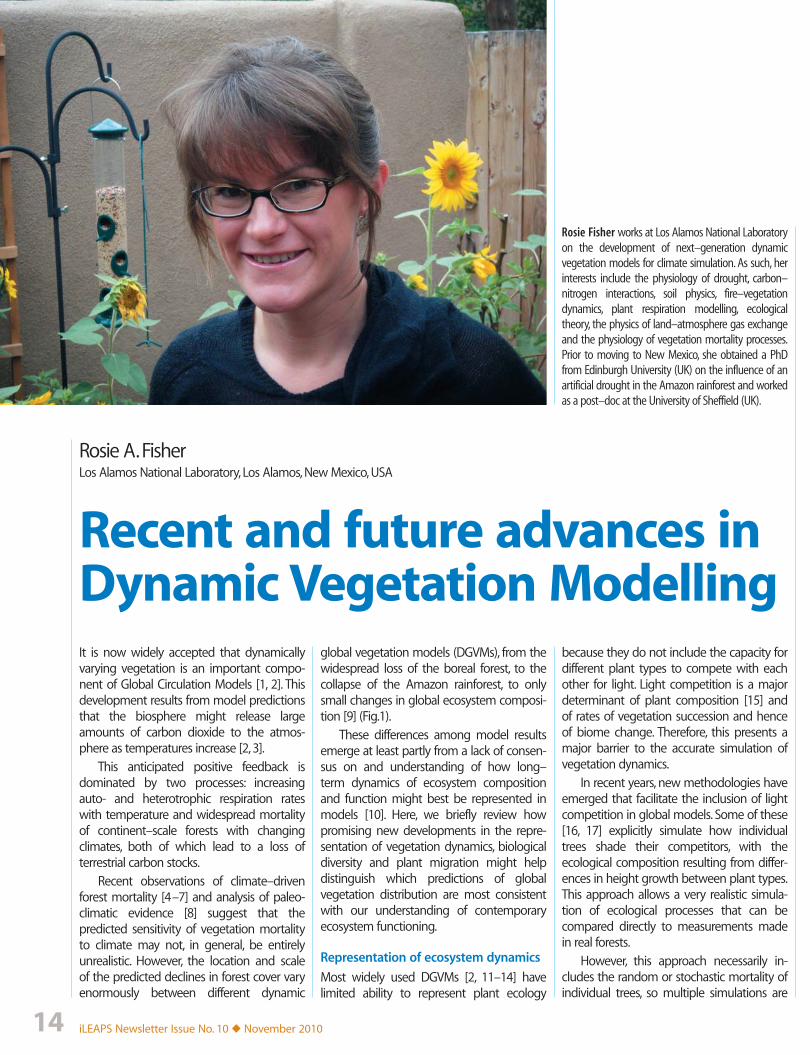
Rosie A. FisherLos Alamos National Laboratory, Los Alamos, New Mexico, USA
Rosie Fisher works at Los Alamos National Laboratoryon the development of next–generation dynamicvegetation models for climate simulation. As such, herinterests include the physiology of drought, carbon–nitrogen interactions, soil physics, fire–vegetationdynamics, plant respiration modelling, ecologicaltheory, the physics of land–atmosphere gas exchangeand the physiology of vegetation mortality processes.Prior to moving to New Mexico, she obtained a PhDfrom Edinburgh University (UK) on the influence of anartificial drought in the Amazon rainforest and workedas a post–doc at the University of Sheffield (UK).
Recent and future advances inDynamic Vegetation ModellingIt is now widely accepted that dynamicallyvarying vegetation is an important compo-nent of Global Circulation Models [1, 2]. Thisdevelopment results from model predictionsthat the biosphere might release largeamounts of carbon dioxide to the atmos-phere as temperatures increase [2, 3].
This anticipated positive feedback isdominated by two processes: increasingauto- and heterotrophic respiration rateswith temperature and widespread mortalityof continent–scale forests with changingclimates, both of which lead to a loss ofterrestrial carbon stocks.
Recent observations of climate–drivenforest mortality [4–7] and analysis of paleo-climatic evidence [8] suggest that thepredicted sensitivity of vegetation mortalityto climate may not, in general, be entirelyunrealistic. However, the location and scaleof the predicted declines in forest cover varyenormously between different dynamic
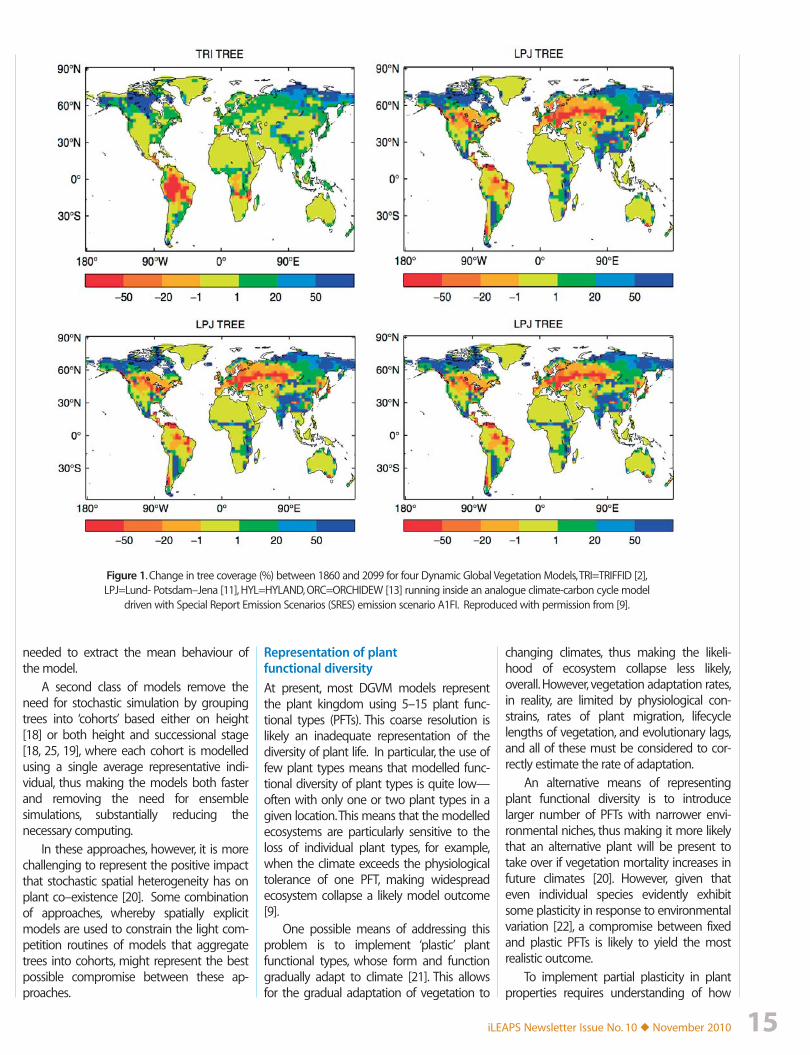
global vegetation models (DGVMs), from thewidespread loss of the boreal forest, to thecollapse of the Amazon rainforest, to onlysmall changes in global ecosystem composi-tion [9] (Fig.1).
These differences among model resultsemerge at least partly from a lack of consen-sus on and understanding of how long–term dynamics of ecosystem compositionand function might best be represented inmodels [10]. Here, we briefly review howpromising new developments in the repre-sentation of vegetation dynamics, biologicaldiversity and plant migration might helpdistinguish which predictions of globalvegetation distribution are most consistentwith our understanding of contemporaryecosystem functioning.
Representation of ecosystem dynamics
Most widely used DGVMs [2, 11–14] havelimited ability to represent plant ecology
because they do not include the capacity fordifferent plant types to compete with eachother for light. Light competition is a majordeterminant of plant composition [15] andof rates of vegetation succession and henceof biome change. Therefore, this presents amajor barrier to the accurate simulation ofvegetation dynamics.
In recent years, new methodologies haveemerged that facilitate the inclusion of lightcompetition in global models. Some of these[16, 17] explicitly simulate how individualtrees shade their competitors, with theecological composition resulting from differ-ences in height growth between plant types.This approach allows a very realistic simula-tion of ecological processes that can becompared directly to measurements madein real forests.
However, this approach necessarily in-cludes the random or stochastic mortality ofindividual trees, so multiple simulations are
iLEAPS Newsletter Issue No. 10 ◆ November 2010 15
needed to extract the mean behaviour ofthe model.
A second class of models remove theneed for stochastic simulation by groupingtrees into ‘cohorts’ based either on height[18] or both height and successional stage[18, 25, 19], where each cohort is modelledusing a single average representative indi-vidual, thus making the models both fasterand removing the need for ensemblesimulations, substantially reducing thenecessary computing.
In these approaches, however, it is morechallenging to represent the positive impactthat stochastic spatial heterogeneity has onplant co–existence [20]. Some combinationof approaches, whereby spatially explicitmodels are used to constrain the light com-petition routines of models that aggregatetrees into cohorts, might represent the bestpossible compromise between these ap-proaches.
Representation of plantfunctional diversity
At present, most DGVM models representthe plant kingdom using 5–15 plant func-tional types (PFTs). This coarse resolution islikely an inadequate representation of thediversity of plant life. In particular, the use offew plant types means that modelled func-tional diversity of plant types is quite low—often with only one or two plant types in agiven location. This means that the modelledecosystems are particularly sensitive to theloss of individual plant types, for example,when the climate exceeds the physiologicaltolerance of one PFT, making widespreadecosystem collapse a likely model outcome[9].
One possible means of addressing thisproblem is to implement ‘plastic’ plantfunctional types, whose form and functiongradually adapt to climate [21]. This allowsfor the gradual adaptation of vegetation to
changing climates, thus making the likeli-hood of ecosystem collapse less likely,overall. However, vegetation adaptation rates,in reality, are limited by physiological con-strains, rates of plant migration, lifecyclelengths of vegetation, and evolutionary lags,and all of these must be considered to cor-rectly estimate the rate of adaptation.
An alternative means of representingplant functional diversity is to introducelarger number of PFTs with narrower envi-ronmental niches, thus making it more likelythat an alternative plant will be present totake over if vegetation mortality increases infuture climates [20]. However, given thateven individual species evidently exhibitsome plasticity in response to environmentalvariation [22], a compromise between fixedand plastic PFTs is likely to yield the mostrealistic outcome.
To implement partial plasticity in plantproperties requires understanding of how
Figure 1. Change in tree coverage (%) between 1860 and 2099 for four Dynamic Global Vegetation Models, TRI=TRIFFID [2],LPJ=Lund- Potsdam–Jena [11], HYL=HYLAND, ORC=ORCHIDEW [13] running inside an analogue climate-carbon cycle model
driven with Special Report Emission Scenarios (SRES) emission scenario A1FI. Reproduced with permission from [9].
iLEAPS Newsletter Issue No. 10 ◆ November 201016
much adaptation in-situ vegetation is capa-ble of. This might derive from top–down evi-dence from manipulation experiments [23]or from an improved mechanistic under-standing of plant structure and function. Inparticular, to include the costs and benefitsof plant allocation and life-history strategiesis necessary: for example, how much does itcost to build xylem that transports watertwice as fast? What gain in leaf lifespan canwe expect from a doubling of leaf thickness?How much quicker do roots decay whentheir diameter is halved?
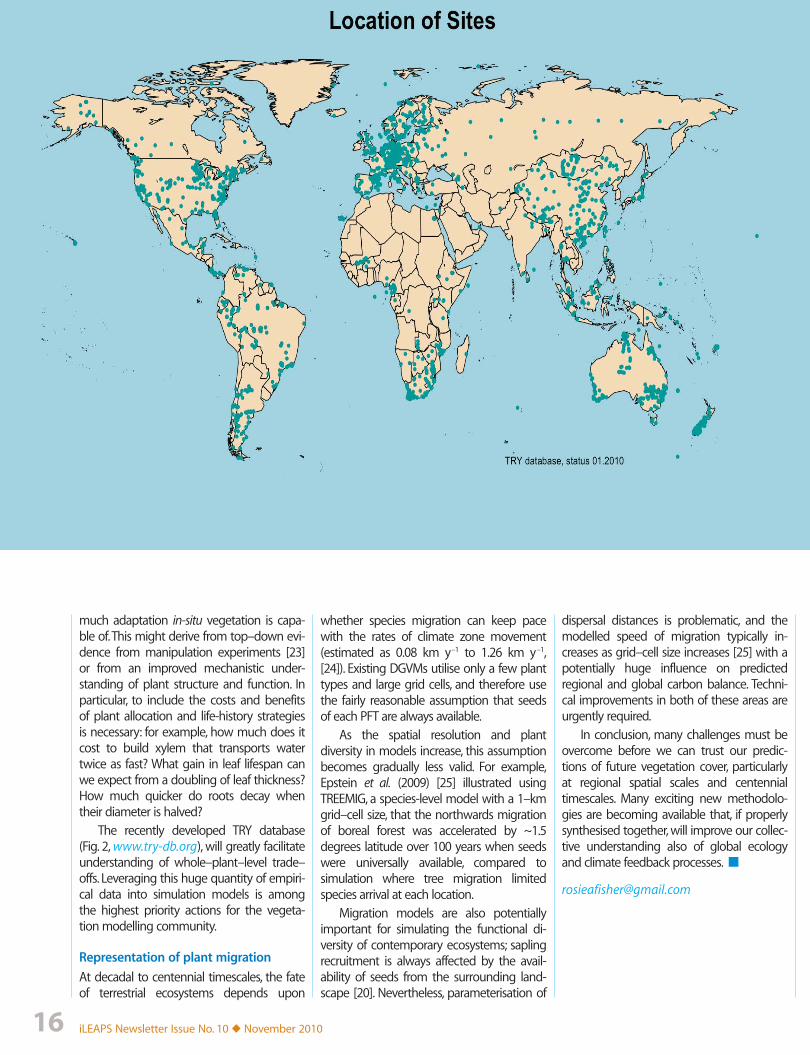
The recently developed TRY database(Fig. 2, www.try-db.org), will greatly facilitateunderstanding of whole–plant–level trade–offs. Leveraging this huge quantity of empiri-cal data into simulation models is amongthe highest priority actions for the vegeta-tion modelling community.
Representation of plant migration
At decadal to centennial timescales, the fateof terrestrial ecosystems depends upon
whether species migration can keep pacewith the rates of climate zone movement(estimated as 0.08 km y–1 to 1.26 km y–1,[24]). Existing DGVMs utilise only a few planttypes and large grid cells, and therefore usethe fairly reasonable assumption that seedsof each PFT are always available.
As the spatial resolution and plantdiversity in models increase, this assumptionbecomes gradually less valid. For example,Epstein et al. (2009) [25] illustrated usingTREEMIG, a species-level model with a 1–kmgrid–cell size, that the northwards migrationof boreal forest was accelerated by ~1.5degrees latitude over 100 years when seedswere universally available, compared tosimulation where tree migration limitedspecies arrival at each location.
Migration models are also potentiallyimportant for simulating the functional di-versity of contemporary ecosystems; saplingrecruitment is always affected by the avail-ability of seeds from the surrounding land-scape [20]. Nevertheless, parameterisation of
dispersal distances is problematic, and themodelled speed of migration typically in-creases as grid–cell size increases [25] with apotentially huge influence on predictedregional and global carbon balance. Techni-cal improvements in both of these areas areurgently required.
In conclusion, many challenges must beovercome before we can trust our predic-tions of future vegetation cover, particularlyat regional spatial scales and centennialtimescales. Many exciting new methodolo-gies are becoming available that, if properlysynthesised together, will improve our collec-tive understanding also of global ecologyand climate feedback processes. ■

iLEAPS Newsletter Issue No. 10 ◆ November 2010 17
References
1. Bonan GB 2008. Forests and climate change:Forcings, Feedbacks, and the climate benefits offorests. Science 320 (5882), 1444–1449.
2. Friedlingstein P et al. 2006. Climate–carbon cyclefeedback analysis: results from the C4MIP modelintercomparison. Journal of Climate 19(14), 3337–3353.
3. Cox PM et al. 2000. Acceleration of global warmingdue to carbon–cycle feedbacks in a coupledclimate model. Nature 408, 184–187.
4. Phillips OL et al. 2009. Drought Sensitivity of theAmazon Rainforest. Science 323(5919), 134–1347.
5. Allen CD et al. 2010. Climate–induced forestmortality: a global overview of emerging risks.Forest Ecology and Management doi:10.1016/j.foreco.2009.09.001.
6. van Mantgem PJ et al. 2009. Widespread increaseof tree mortality rates in the western United States.Science 323(5913), 521–524. doi:10.1126/science.1165000.
7. McDowell NG et al. 2008. Mechanisms of plantsurvival and mortality during drought: why dosome plants survive while others succumb todrought? New Phytologist 178, 719–739.
8. Cox PM and Jones C 2008. Illuminating themodern dance of climate and CO
2. Nature 321,
1642–1644.
9. Sitch S et al. 2008. Evaluation of the terrestrialcarbon cycle, future plant geography and climate–carbon cycle feedbacks using five DynamicGlobal Vegetation Models (DGVMs). Global ChangeBiology 14, 1–25.
10. Arora VK and Boer GJ 2006. Simulating competi-tion and coexistence between plant functionaltypes in a dynamic vegetation model. Earth Inter-actions 10 (10), 1–30.
11. Sitch S et al. 2003. Evaluation of ecosystem dynam-ics, plant geography and terrestrial carbon cyclingin the LPJ dynamic vegetation model. GlobalChange Biology 9, 161–185.
12. Bonan G et al. 2003. A dynamic global vegetationmodel for use with climate models: concepts anddescription of simulated vegetation dynamics.Global Change Biology 9, 1543–1566.
13. Krinner G et al. 2005. A dynamic global vegetationmodel for studies of the coupled atmosphere–bio-sphere system. Global Biogeochemical Cycles 19,GB1015, doi: 10.1029/2003GB002199.
14. Woodward FI and Lomas MR 2004. Vegetation dy-namics—simulating responses to climatic change.Biological Reviews, 79(3), 643–670.
15. Shugart HH 1984. A theory of forest dynamics.Springer–Verlag, New York, New York, USA.
16. Hickler T et al. 2008. CO2 fertilization in temperate
forest FACE experiments not representative ofboreal and tropical forests. Global Change Biology14, 1–12.
17. Sato H et al. 2007. SEIB–DGVM: A new DynamicGlobal Vegetation Model using a spatially explicitindividual–based approach. Ecological Modeling200, 279–307.
18. Moorcroft PR et al. 2001. A method for scalingvegetation dynamics: the ecosystem demographymodel (ED). Ecological Monographs 71(4), 557–586.
19. Lischke H et al. 2006. TreeMig: A forest–landscapemodel for simulating spatio–temporal patternsfrom stand to landscape scale. Ecological Model-ling 199, 409–420.
20. Fisher R et al. 2010. Assessing uncertainties in asecond–generation dynamic vegetation modeldue to ecological scale limitations. New Phytologist(in press).
Figure 2. Locations of the >2.4M data pointsadded to the TRY database as of January 2010.Reproduced with permission from www.try-db.org.
21. Scheiter S and Higgins SI 2008. Impacts of climatechange on the vegetation of Africa: an adaptivedynamic vegetation modelling approach. GlobalChange Biology 15(9), 2224–2246.
22. Martínez–Vilalta J 2009. Hydraulic adjustment ofScots pine across Europe. New Phytologist 184(2),353–364.
23. Metcalfe DB et al. 2008. The effects of soil wateravailability on root growth and morphology in anAmazon rain forest. Plant & Soil 311, 189–199.
24. Loarie SR et al. 2009. The velocity of climatechange. Nature 462, 1052–1055.
25. Epstein HE et al. 2007. Simulating future changes inArctic and subarctic vegetation. Computing inScience & Engineering 9, 12–23.
iLEAPS Newsletter Issue No. 10 ◆ November 201018
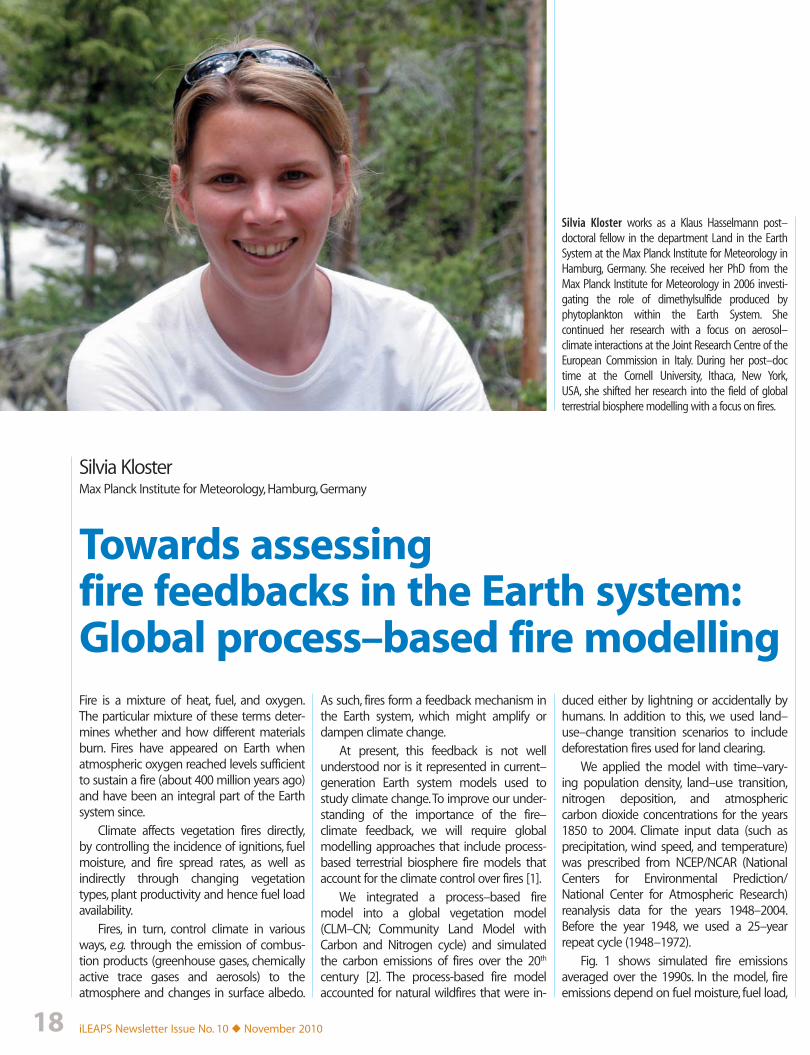
Silvia Kloster works as a Klaus Hasselmann post–doctoral fellow in the department Land in the EarthSystem at the Max Planck Institute for Meteorology inHamburg, Germany. She received her PhD from theMax Planck Institute for Meteorology in 2006 investi-gating the role of dimethylsulfide produced byphytoplankton within the Earth System. Shecontinued her research with a focus on aerosol–climate interactions at the Joint Research Centre of theEuropean Commission in Italy. During her post–doctime at the Cornell University, Ithaca, New York,USA, she shifted her research into the field of globalterrestrial biosphere modelling with a focus on fires.
Silvia KlosterMax Planck Institute for Meteorology, Hamburg, Germany
Fire is a mixture of heat, fuel, and oxygen.The particular mixture of these terms deter-mines whether and how different materialsburn. Fires have appeared on Earth whenatmospheric oxygen reached levels sufficientto sustain a fire (about 400 million years ago)and have been an integral part of the Earthsystem since.
Climate affects vegetation fires directly,by controlling the incidence of ignitions, fuelmoisture, and fire spread rates, as well asindirectly through changing vegetationtypes, plant productivity and hence fuel loadavailability.
Fires, in turn, control climate in variousways, e.g. through the emission of combus-tion products (greenhouse gases, chemicallyactive trace gases and aerosols) to theatmosphere and changes in surface albedo.
As such, fires form a feedback mechanism inthe Earth system, which might amplify ordampen climate change.
At present, this feedback is not wellunderstood nor is it represented in current–generation Earth system models used tostudy climate change. To improve our under-standing of the importance of the fire–climate feedback, we will require globalmodelling approaches that include process-based terrestrial biosphere fire models thataccount for the climate control over fires [1].
We integrated a process–based firemodel into a global vegetation model(CLM–CN; Community Land Model withCarbon and Nitrogen cycle) and simulatedthe carbon emissions of fires over the 20th
century [2]. The process-based fire modelaccounted for natural wildfires that were in-
duced either by lightning or accidentally byhumans. In addition to this, we used land–use–change transition scenarios to includedeforestation fires used for land clearing.
We applied the model with time–vary-ing population density, land–use transition,nitrogen deposition, and atmosphericcarbon dioxide concentrations for the years1850 to 2004. Climate input data (such asprecipitation, wind speed, and temperature)was prescribed from NCEP/NCAR (NationalCenters for Environmental Prediction/National Center for Atmospheric Research)reanalysis data for the years 1948–2004.Before the year 1948, we used a 25–yearrepeat cycle (1948–1972).
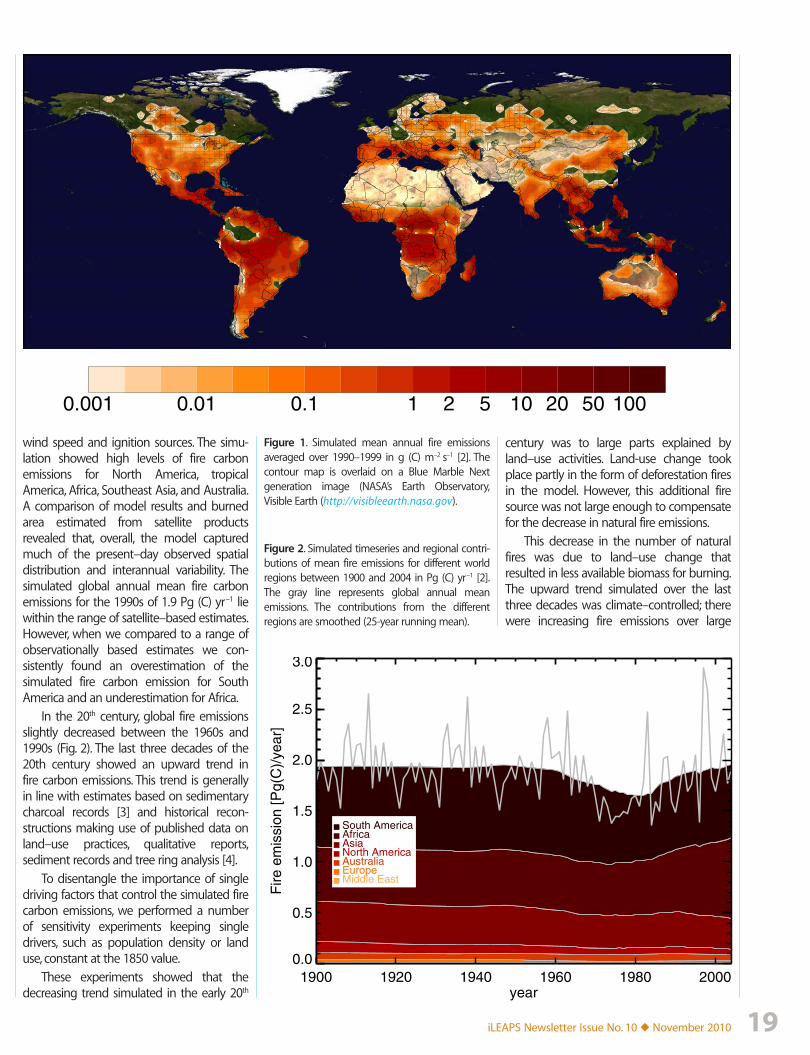
Fig. 1 shows simulated fire emissionsaveraged over the 1990s. In the model, fireemissions depend on fuel moisture, fuel load,
Towards assessingfire feedbacks in the Earth system:Global process–based fire modelling
iLEAPS Newsletter Issue No. 10 ◆ November 2010 19
0.001 0.01 0.1 1 2 5 10 20 50 100
year
0.0
0.5
1.0
1.5
2.0
2.5
3.0
Fire
em
issi
on [P
g(C
)/ye
ar]
1900 1920 1940 1960 1980 2000
South AmericaAfricaAsiaNorth AmericaAustraliaEuropeMiddle East
Figure 1. Simulated mean annual fire emissionsaveraged over 1990–1999 in g (C) m–2 s–1 [2]. Thecontour map is overlaid on a Blue Marble Nextgeneration image (NASA’s Earth Observatory,Visible Earth (http://visibleearth.nasa.gov).
Figure 2. Simulated timeseries and regional contri-butions of mean fire emissions for different worldregions between 1900 and 2004 in Pg (C) yr–1 [2].The gray line represents global annual meanemissions. The contributions from the differentregions are smoothed (25-year running mean).
wind speed and ignition sources. The simu-lation showed high levels of fire carbonemissions for North America, tropicalAmerica, Africa, Southeast Asia, and Australia.A comparison of model results and burnedarea estimated from satellite productsrevealed that, overall, the model capturedmuch of the present–day observed spatialdistribution and interannual variability. Thesimulated global annual mean fire carbonemissions for the 1990s of 1.9 Pg (C) yr–1 liewithin the range of satellite–based estimates.However, when we compared to a range ofobservationally based estimates we con-sistently found an overestimation of thesimulated fire carbon emission for SouthAmerica and an underestimation for Africa.
In the 20th century, global fire emissionsslightly decreased between the 1960s and1990s (Fig. 2). The last three decades of the20th century showed an upward trend infire carbon emissions. This trend is generallyin line with estimates based on sedimentarycharcoal records [3] and historical recon-structions making use of published data onland–use practices, qualitative reports,sediment records and tree ring analysis [4].
To disentangle the importance of singledriving factors that control the simulated firecarbon emissions, we performed a numberof sensitivity experiments keeping singledrivers, such as population density or landuse, constant at the 1850 value.
These experiments showed that thedecreasing trend simulated in the early 20th
century was to large parts explained byland–use activities. Land-use change tookplace partly in the form of deforestation firesin the model. However, this additional firesource was not large enough to compensatefor the decrease in natural fire emissions.
This decrease in the number of naturalfires was due to land–use change thatresulted in less available biomass for burning.The upward trend simulated over the lastthree decades was climate–controlled; therewere increasing fire emissions over large
iLEAPS Newsletter Issue No. 10 ◆ November 201020
1900s 1930s 1950s 1970s 1990s
Species
CO2 6089 6480 6290 4873 6262CO 343 367 351 269 352H2 10.0 11.0 10.3 7.8 10.6NOx 8.2 8.6 8.4 6.5 8.3BC 2.2 2.3 2.2 1.7 2.2OC 19.3 20.3 19.6 15.0 19.4SO2 2.54 2.67 2.62 2.0 2.6
References
1. Bowman DMJS et al. 2009. Fire in the Earth System.Science 324 (481), doi: 10.1126/science.1163886.
2. Kloster S et al. 2010. Fire dynamics during the 20th
century simulated by the Community Land Model.Biogeosciences Discussions 7, 565–630.
3. Marlon JR et al. 2008. Climate and human influ-ence on global biomass burning over the past twomillennia. Nature Geoscience 1, doi:10.1038/ngeo313.
4. Mieville A et al. 2010. Emissions of gases andparticles from biomass burning using satellite dataand an historical reconstruction. AtmosphericEnvironment 44, 1469–1477, doi:10.1016/j.atmosenv.2010.01.011.
5. Andreae MO and Merlet P 2001. Emission of tracegases and aerosols from biomass burning. GlobalBiogeochemical Cycles 15(4), 955–966.
6. Ito A and Penner JE 2005. Historical emissions ofcarbonaceous aerosols from biomass and fossilfuel burning for the period 1870–2000. GlobalBiogeochemical Cycles 19, GB(2028), doi:1029/2004GB002374.
7. Van Aardenne JA et al. 2001. A High resolutiondataset of historical anthropogenic trace gas emis-sions for the period 1890–1990. Global Biogeo-chemical Cycles 15(4), 909–928.
8. Dentener F et al. 2006. Emissions of primaryaerosol and precursor gases in the years 2000 and1750 prescribed data–sets for AeroCom. Atmos-pheric Chemistry and Physics 6, 4321–4344.
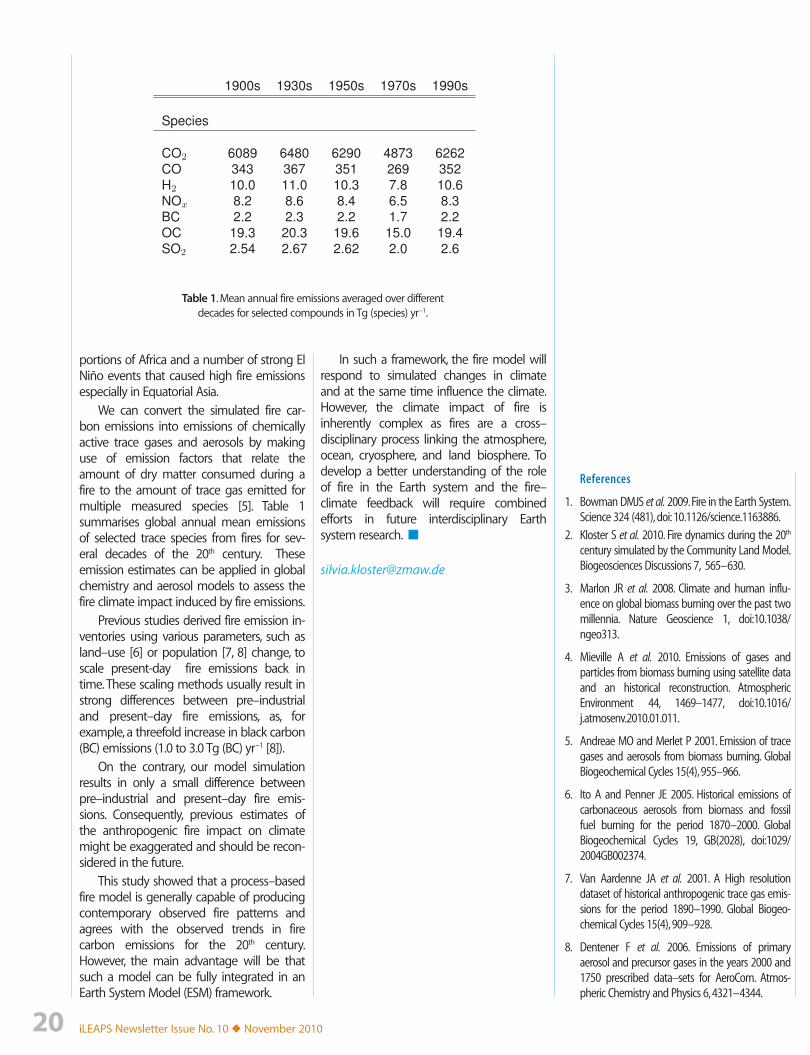
Table 1. Mean annual fire emissions averaged over differentdecades for selected compounds in Tg (species) yr–1.
portions of Africa and a number of strong ElNiño events that caused high fire emissionsespecially in Equatorial Asia.
We can convert the simulated fire car-bon emissions into emissions of chemicallyactive trace gases and aerosols by makinguse of emission factors that relate theamount of dry matter consumed during afire to the amount of trace gas emitted formultiple measured species [5]. Table 1summarises global annual mean emissionsof selected trace species from fires for sev-eral decades of the 20th century. Theseemission estimates can be applied in globalchemistry and aerosol models to assess thefire climate impact induced by fire emissions.
Previous studies derived fire emission in-ventories using various parameters, such asland–use [6] or population [7, 8] change, toscale present-day fire emissions back intime. These scaling methods usually result instrong differences between pre–industrialand present–day fire emissions, as, forexample, a threefold increase in black carbon(BC) emissions (1.0 to 3.0 Tg (BC) yr–1 [8]).
On the contrary, our model simulationresults in only a small difference betweenpre–industrial and present–day fire emis-sions. Consequently, previous estimates ofthe anthropogenic fire impact on climatemight be exaggerated and should be recon-sidered in the future.
This study showed that a process–basedfire model is generally capable of producingcontemporary observed fire patterns andagrees with the observed trends in firecarbon emissions for the 20th century.However, the main advantage will be thatsuch a model can be fully integrated in anEarth System Model (ESM) framework.
In such a framework, the fire model willrespond to simulated changes in climateand at the same time influence the climate.However, the climate impact of fire isinherently complex as fires are a cross–disciplinary process linking the atmosphere,ocean, cryosphere, and land biosphere. Todevelop a better understanding of the roleof fire in the Earth system and the fire–climate feedback will require combinedefforts in future interdisciplinary Earthsystem research. ■

iLEAPS Newsletter Issue No. 10 ◆ November 2010 21
iLEAPS is now onacebook!
Join our Facebook group to get updated information on
❏ iLEAPS news
❏ Meetings, workshops
❏ iLEAPS Science Conference 2011 (SC2011)
❏ Newsletter information
You can link directly our Newsletter, get resources, read ourlatest notes, and connect with other researchers and studentsworking in the iLEAPS field.
See also iLEAPS website www.ileaps.org
iLEAPS Newsletter Issue No. 10 ◆ November 201022
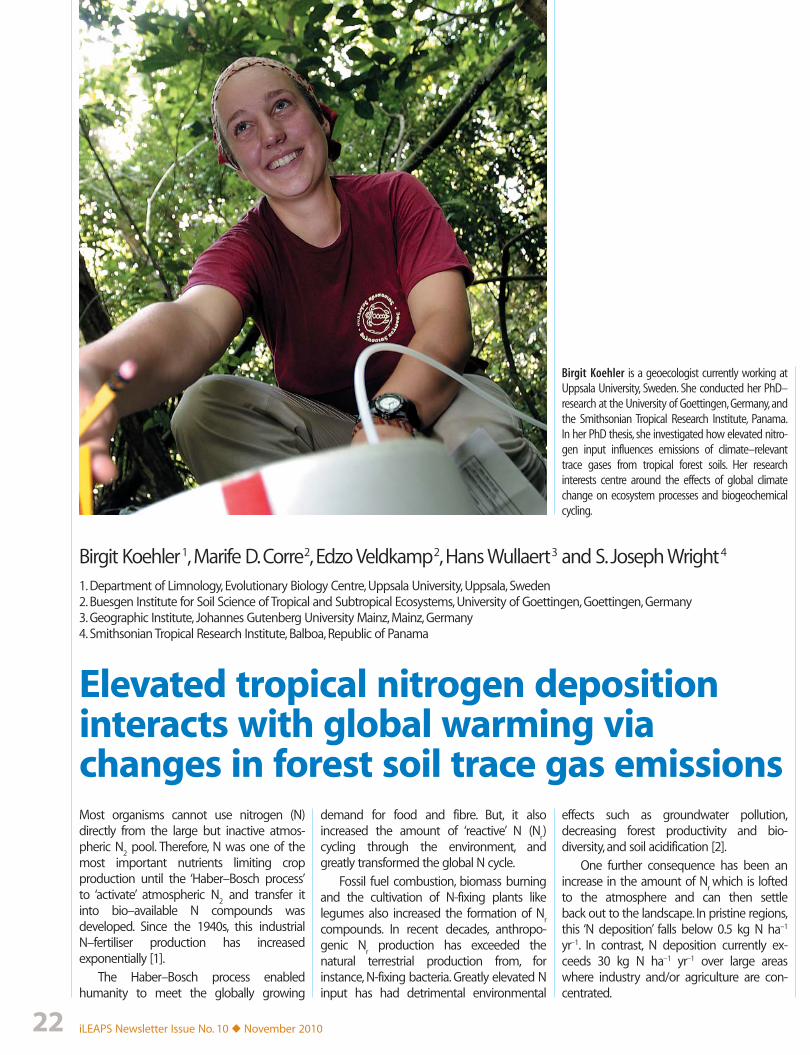
Birgit Koehler is a geoecologist currently working atUppsala University, Sweden. She conducted her PhD–research at the University of Goettingen, Germany, andthe Smithsonian Tropical Research Institute, Panama.In her PhD thesis, she investigated how elevated nitro-gen input influences emissions of climate–relevanttrace gases from tropical forest soils. Her researchinterests centre around the effects of global climatechange on ecosystem processes and biogeochemicalcycling.
Birgit Koehler1, Marife D. Corre2, Edzo Veldkamp2, Hans Wullaert3 and S. Joseph Wright4
1. Department of Limnology, Evolutionary Biology Centre, Uppsala University, Uppsala, Sweden2. Buesgen Institute for Soil Science of Tropical and Subtropical Ecosystems, University of Goettingen, Goettingen, Germany3. Geographic Institute, Johannes Gutenberg University Mainz, Mainz, Germany4. Smithsonian Tropical Research Institute, Balboa, Republic of Panama
Elevated tropical nitrogen depositioninteracts with global warming viachanges in forest soil trace gas emissionsMost organisms cannot use nitrogen (N)directly from the large but inactive atmos-pheric N
2 pool. Therefore, N was one of the
most important nutrients limiting cropproduction until the ‘Haber–Bosch process’to ‘activate’ atmospheric N
2 and transfer it
into bio–available N compounds wasdeveloped. Since the 1940s, this industrialN–fertiliser production has increasedexponentially [1].
The Haber–Bosch process enabledhumanity to meet the globally growing
demand for food and fibre. But, it alsoincreased the amount of ‘reactive’ N (N
r)
cycling through the environment, andgreatly transformed the global N cycle.
Fossil fuel combustion, biomass burningand the cultivation of N-fixing plants likelegumes also increased the formation of N
r
compounds. In recent decades, anthropo-genic N
r production has exceeded the
natural terrestrial production from, forinstance, N-fixing bacteria. Greatly elevated Ninput has had detrimental environmental
effects such as groundwater pollution,decreasing forest productivity and bio-diversity, and soil acidification [2].
One further consequence has been anincrease in the amount of N
r which is lofted
to the atmosphere and can then settleback out to the landscape. In pristine regions,this ‘N deposition’ falls below 0.5 kg N ha–1
yr–1. In contrast, N deposition currently ex-ceeds 30 kg N ha–1 yr–1 over large areaswhere industry and/or agriculture are con-centrated.
iLEAPS Newsletter Issue No. 10 ◆ November 2010 23
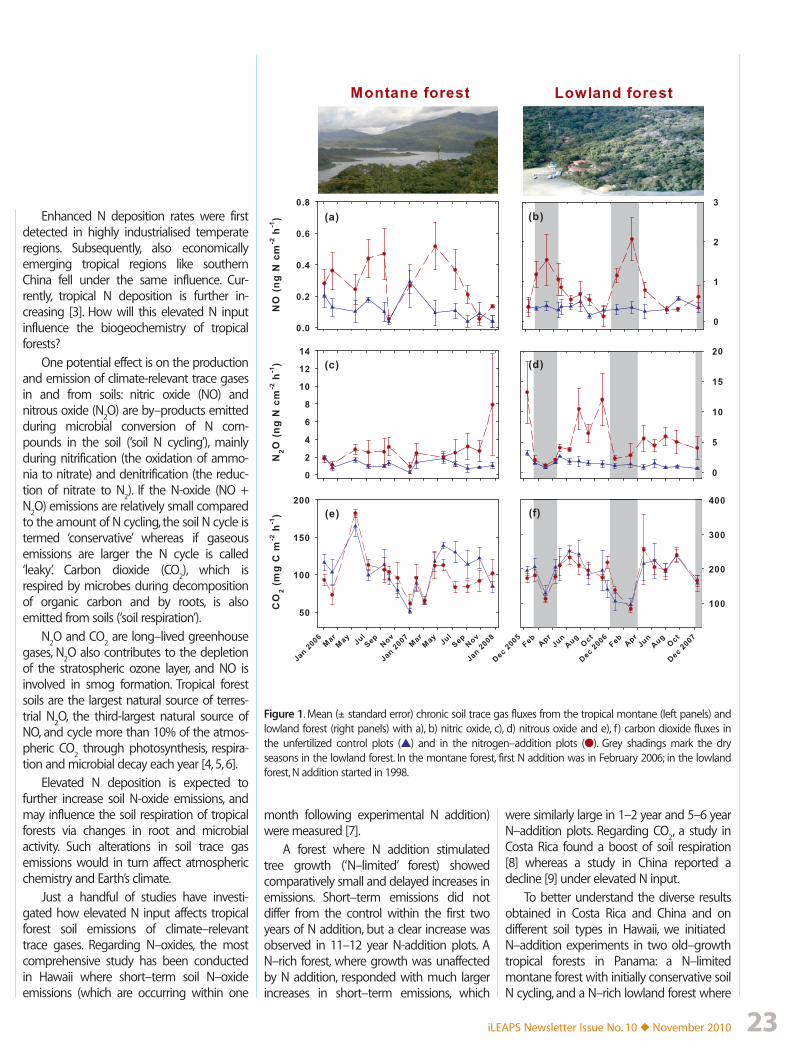
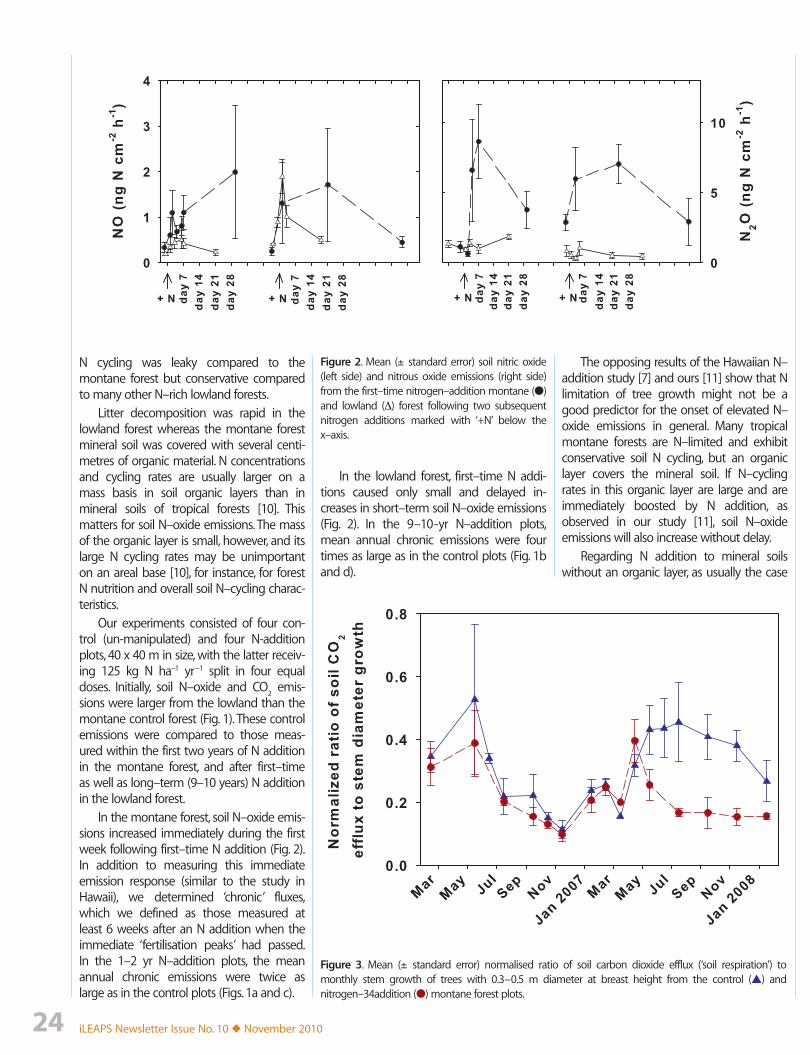
Figure 1. Mean (± standard error) chronic soil trace gas fluxes from the tropical montane (left panels) andlowland forest (right panels) with a), b) nitric oxide, c), d) nitrous oxide and e), f) carbon dioxide fluxes inthe unfertilized control plots (▲) and in the nitrogen–addition plots (●). Grey shadings mark the dryseasons in the lowland forest. In the montane forest, first N addition was in February 2006; in the lowlandforest, N addition started in 1998.
Enhanced N deposition rates were firstdetected in highly industrialised temperateregions. Subsequently, also economicallyemerging tropical regions like southernChina fell under the same influence. Cur-rently, tropical N deposition is further in-creasing [3]. How will this elevated N inputinfluence the biogeochemistry of tropicalforests?
One potential effect is on the productionand emission of climate-relevant trace gasesin and from soils: nitric oxide (NO) andnitrous oxide (N
2O) are by–products emitted
during microbial conversion of N com-pounds in the soil (‘soil N cycling’), mainlyduring nitrification (the oxidation of ammo-nia to nitrate) and denitrification (the reduc-tion of nitrate to N
2). If the N-oxide (NO +
N2O) emissions are relatively small compared
to the amount of N cycling, the soil N cycle istermed ‘conservative’ whereas if gaseousemissions are larger the N cycle is called‘leaky’. Carbon dioxide (CO
2), which is
respired by microbes during decompositionof organic carbon and by roots, is alsoemitted from soils (‘soil respiration’).
N2O and CO
2 are long–lived greenhouse
gases, N2O also contributes to the depletion
of the stratospheric ozone layer, and NO isinvolved in smog formation. Tropical forestsoils are the largest natural source of terres-trial N
2O, the third-largest natural source of
NO, and cycle more than 10% of the atmos-pheric CO
2 through photosynthesis, respira-
tion and microbial decay each year [4, 5, 6].Elevated N deposition is expected to
further increase soil N-oxide emissions, andmay influence the soil respiration of tropicalforests via changes in root and microbialactivity. Such alterations in soil trace gasemissions would in turn affect atmosphericchemistry and Earth’s climate.
Just a handful of studies have investi-gated how elevated N input affects tropicalforest soil emissions of climate–relevanttrace gases. Regarding N–oxides, the mostcomprehensive study has been conductedin Hawaii where short–term soil N–oxideemissions (which are occurring within one
month following experimental N addition)were measured [7].
A forest where N addition stimulatedtree growth (‘N–limited’ forest) showedcomparatively small and delayed increases inemissions. Short–term emissions did notdiffer from the control within the first twoyears of N addition, but a clear increase wasobserved in 11–12 year N-addition plots. AN–rich forest, where growth was unaffectedby N addition, responded with much largerincreases in short–term emissions, which
were similarly large in 1–2 year and 5–6 yearN–addition plots. Regarding CO
2, a study in
Costa Rica found a boost of soil respiration[8] whereas a study in China reported adecline [9] under elevated N input.
To better understand the diverse resultsobtained in Costa Rica and China and ondifferent soil types in Hawaii, we initiated N–addition experiments in two old–growthtropical forests in Panama: a N–limitedmontane forest with initially conservative soilN cycling, and a N–rich lowland forest where
iLEAPS Newsletter Issue No. 10 ◆ November 201024
Figure 2. Mean (± standard error) soil nitric oxide(left side) and nitrous oxide emissions (right side)from the first–time nitrogen–addition montane (●)and lowland (Δ) forest following two subsequentnitrogen additions marked with ‘+N’ below thex–axis.
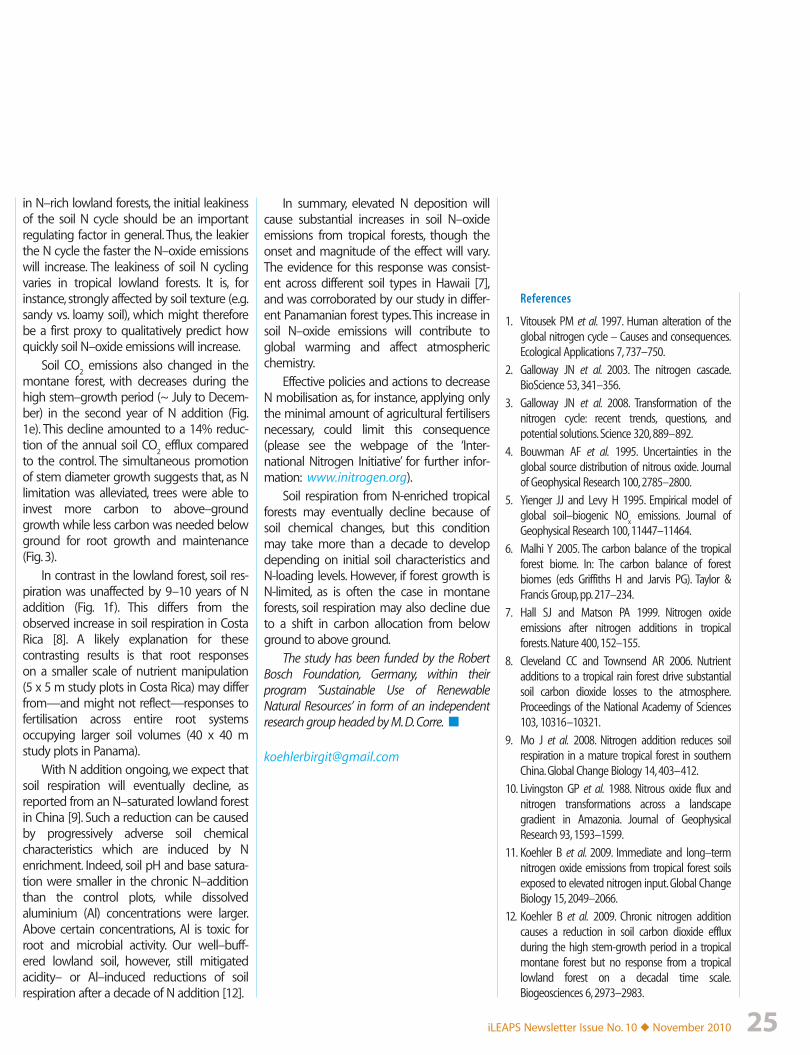
Figure 3. Mean (± standard error) normalised ratio of soil carbon dioxide efflux (‘soil respiration’) tomonthly stem growth of trees with 0.3–0.5 m diameter at breast height from the control (▲) andnitrogen–34addition (●) montane forest plots.
N cycling was leaky compared to themontane forest but conservative comparedto many other N–rich lowland forests.
Litter decomposition was rapid in thelowland forest whereas the montane forestmineral soil was covered with several centi-metres of organic material. N concentrationsand cycling rates are usually larger on amass basis in soil organic layers than inmineral soils of tropical forests [10]. Thismatters for soil N–oxide emissions. The massof the organic layer is small, however, and itslarge N cycling rates may be unimportanton an areal base [10], for instance, for forestN nutrition and overall soil N–cycling charac-teristics.
Our experiments consisted of four con-trol (un-manipulated) and four N-additionplots, 40 x 40 m in size, with the latter receiv-ing 125 kg N ha–1 yr–1 split in four equaldoses. Initially, soil N–oxide and CO
2 emis-
sions were larger from the lowland than themontane control forest (Fig. 1). These controlemissions were compared to those meas-ured within the first two years of N additionin the montane forest, and after first–timeas well as long–term (9–10 years) N additionin the lowland forest.
In the montane forest, soil N–oxide emis-sions increased immediately during the firstweek following first–time N addition (Fig. 2).In addition to measuring this immediateemission response (similar to the study inHawaii), we determined ‘chronic’ fluxes,which we defined as those measured atleast 6 weeks after an N addition when theimmediate ‘fertilisation peaks’ had passed.In the 1–2 yr N–addition plots, the meanannual chronic emissions were twice aslarge as in the control plots (Figs. 1a and c).
In the lowland forest, first–time N addi-tions caused only small and delayed in-creases in short–term soil N–oxide emissions(Fig. 2). In the 9–10–yr N–addition plots,mean annual chronic emissions were fourtimes as large as in the control plots (Fig. 1band d).
The opposing results of the Hawaiian N–addition study [7] and ours [11] show that Nlimitation of tree growth might not be agood predictor for the onset of elevated N–oxide emissions in general. Many tropicalmontane forests are N–limited and exhibitconservative soil N cycling, but an organiclayer covers the mineral soil. If N–cyclingrates in this organic layer are large and areimmediately boosted by N addition, asobserved in our study [11], soil N–oxideemissions will also increase without delay.
Regarding N addition to mineral soilswithout an organic layer, as usually the case
iLEAPS Newsletter Issue No. 10 ◆ November 2010 25
References
1. Vitousek PM et al. 1997. Human alteration of theglobal nitrogen cycle – Causes and consequences.Ecological Applications 7, 737–750.
2. Galloway JN et al. 2003. The nitrogen cascade.BioScience 53, 341–356.
3. Galloway JN et al. 2008. Transformation of thenitrogen cycle: recent trends, questions, andpotential solutions. Science 320, 889–892.
4. Bouwman AF et al. 1995. Uncertainties in theglobal source distribution of nitrous oxide. Journalof Geophysical Research 100, 2785–2800.
5. Yienger JJ and Levy H 1995. Empirical model ofglobal soil–biogenic NO
x emissions. Journal of
Geophysical Research 100, 11447–11464.
6. Malhi Y 2005. The carbon balance of the tropicalforest biome. In: The carbon balance of forestbiomes (eds Griffiths H and Jarvis PG). Taylor &Francis Group, pp. 217–234.
7. Hall SJ and Matson PA 1999. Nitrogen oxideemissions after nitrogen additions in tropicalforests. Nature 400, 152–155.
8. Cleveland CC and Townsend AR 2006. Nutrientadditions to a tropical rain forest drive substantialsoil carbon dioxide losses to the atmosphere.Proceedings of the National Academy of Sciences103, 10316–10321.
9. Mo J et al. 2008. Nitrogen addition reduces soilrespiration in a mature tropical forest in southernChina. Global Change Biology 14, 403–412.
10. Livingston GP et al. 1988. Nitrous oxide flux andnitrogen transformations across a landscapegradient in Amazonia. Journal of GeophysicalResearch 93, 1593–1599.
11. Koehler B et al. 2009. Immediate and long–termnitrogen oxide emissions from tropical forest soilsexposed to elevated nitrogen input. Global ChangeBiology 15, 2049–2066.
12. Koehler B et al. 2009. Chronic nitrogen additioncauses a reduction in soil carbon dioxide effluxduring the high stem-growth period in a tropicalmontane forest but no response from a tropicallowland forest on a decadal time scale.Biogeosciences 6, 2973–2983.
in N–rich lowland forests, the initial leakinessof the soil N cycle should be an importantregulating factor in general. Thus, the leakierthe N cycle the faster the N–oxide emissionswill increase. The leakiness of soil N cyclingvaries in tropical lowland forests. It is, forinstance, strongly affected by soil texture (e.g.sandy vs. loamy soil), which might thereforebe a first proxy to qualitatively predict howquickly soil N–oxide emissions will increase.
Soil CO2 emissions also changed in the
montane forest, with decreases during thehigh stem–growth period (~ July to Decem-ber) in the second year of N addition (Fig.1e). This decline amounted to a 14% reduc-tion of the annual soil CO
2 efflux compared
to the control. The simultaneous promotionof stem diameter growth suggests that, as Nlimitation was alleviated, trees were able toinvest more carbon to above–groundgrowth while less carbon was needed belowground for root growth and maintenance(Fig. 3).
In contrast in the lowland forest, soil res-piration was unaffected by 9–10 years of Naddition (Fig. 1f). This differs from theobserved increase in soil respiration in CostaRica [8]. A likely explanation for thesecontrasting results is that root responseson a smaller scale of nutrient manipulation(5 x 5 m study plots in Costa Rica) may differfrom—and might not reflect—responses tofertilisation across entire root systemsoccupying larger soil volumes (40 x 40 mstudy plots in Panama).
With N addition ongoing, we expect thatsoil respiration will eventually decline, asreported from an N–saturated lowland forestin China [9]. Such a reduction can be causedby progressively adverse soil chemicalcharacteristics which are induced by Nenrichment. Indeed, soil pH and base satura-tion were smaller in the chronic N–additionthan the control plots, while dissolvedaluminium (Al) concentrations were larger.Above certain concentrations, Al is toxic forroot and microbial activity. Our well–buff-ered lowland soil, however, still mitigatedacidity– or Al–induced reductions of soilrespiration after a decade of N addition [12].
In summary, elevated N deposition willcause substantial increases in soil N–oxideemissions from tropical forests, though theonset and magnitude of the effect will vary.The evidence for this response was consist-ent across different soil types in Hawaii [7],and was corroborated by our study in differ-ent Panamanian forest types. This increase insoil N–oxide emissions will contribute toglobal warming and affect atmosphericchemistry.
Effective policies and actions to decreaseN mobilisation as, for instance, applying onlythe minimal amount of agricultural fertilisersnecessary, could limit this consequence(please see the webpage of the ‘Inter-national Nitrogen Initiative’ for further infor-mation: www.initrogen.org).
Soil respiration from N-enriched tropicalforests may eventually decline because ofsoil chemical changes, but this conditionmay take more than a decade to developdepending on initial soil characteristics andN-loading levels. However, if forest growth isN-limited, as is often the case in montaneforests, soil respiration may also decline dueto a shift in carbon allocation from belowground to above ground.
The study has been funded by the RobertBosch Foundation, Germany, within theirprogram ‘Sustainable Use of RenewableNatural Resources’ in form of an independentresearch group headed by M. D. Corre. ■
iLEAPS Newsletter Issue No. 10 ◆ November 201026
Pertti Hari1, Meinrat O. Andreae2, Pavel Kabat3 and Markku Kulmala4
1. Department of Forest Ecology, University of Helsinki, Helsinki, Finland2. Biogeochemistry Department, Max Planck Institute for Chemistry, Mainz, Germany3. Wageningen University and Research Centre, Wageningen, the Netherlands4. Department of Physics, University of Helsinki, Helsinki, Finland
A comprehensive network of measuringstations to monitor climate change
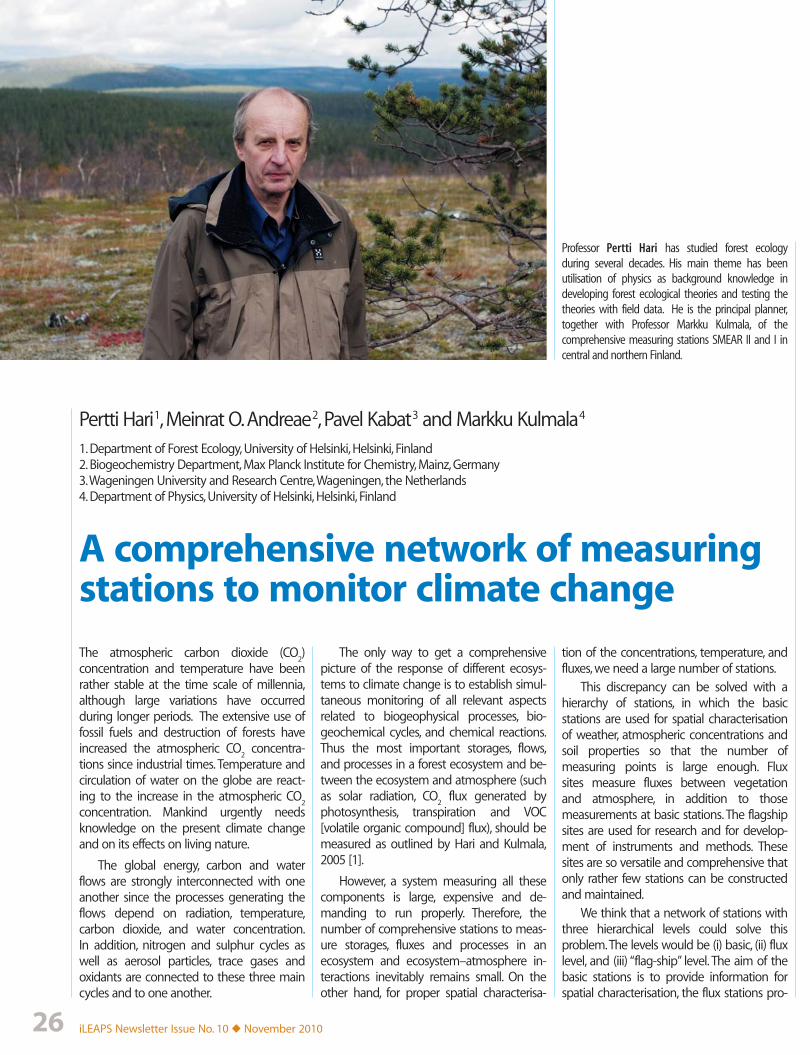
Professor Pertti Hari has studied forest ecologyduring several decades. His main theme has beenutilisation of physics as background knowledge indeveloping forest ecological theories and testing thetheories with field data. He is the principal planner,together with Professor Markku Kulmala, of thecomprehensive measuring stations SMEAR II and I incentral and northern Finland.
The atmospheric carbon dioxide (CO2)
concentration and temperature have beenrather stable at the time scale of millennia,although large variations have occurredduring longer periods. The extensive use offossil fuels and destruction of forests haveincreased the atmospheric CO
2 concentra-
tions since industrial times. Temperature andcirculation of water on the globe are react-ing to the increase in the atmospheric CO
2
concentration. Mankind urgently needsknowledge on the present climate changeand on its effects on living nature.
The global energy, carbon and waterflows are strongly interconnected with oneanother since the processes generating theflows depend on radiation, temperature,carbon dioxide, and water concentration.In addition, nitrogen and sulphur cycles aswell as aerosol particles, trace gases andoxidants are connected to these three maincycles and to one another.
The only way to get a comprehensivepicture of the response of different ecosys-tems to climate change is to establish simul-taneous monitoring of all relevant aspectsrelated to biogeophysical processes, bio-geochemical cycles, and chemical reactions.Thus the most important storages, flows,and processes in a forest ecosystem and be-tween the ecosystem and atmosphere (suchas solar radiation, CO
2 flux generated by
photosynthesis, transpiration and VOC[volatile organic compound] flux), should bemeasured as outlined by Hari and Kulmala,2005 [1].
However, a system measuring all thesecomponents is large, expensive and de-manding to run properly. Therefore, thenumber of comprehensive stations to meas-ure storages, fluxes and processes in anecosystem and ecosystem–atmosphere in-teractions inevitably remains small. On theother hand, for proper spatial characterisa-
tion of the concentrations, temperature, andfluxes, we need a large number of stations.
This discrepancy can be solved with ahierarchy of stations, in which the basicstations are used for spatial characterisationof weather, atmospheric concentrations andsoil properties so that the number ofmeasuring points is large enough. Fluxsites measure fluxes between vegetationand atmosphere, in addition to thosemeasurements at basic stations. The flagshipsites are used for research and for develop-ment of instruments and methods. Thesesites are so versatile and comprehensive thatonly rather few stations can be constructedand maintained.
We think that a network of stations withthree hierarchical levels could solve thisproblem. The levels would be (i) basic, (ii) fluxlevel, and (iii) “flag-ship” level. The aim of thebasic stations is to provide information forspatial characterisation, the flux stations pro-
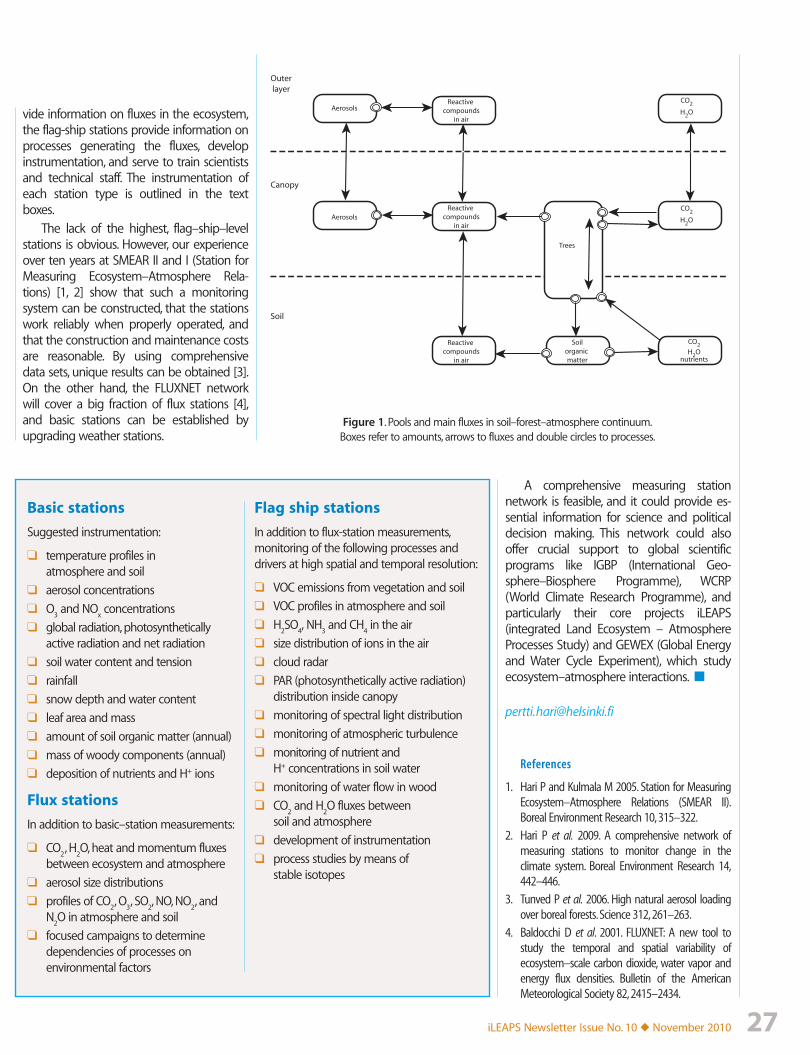
iLEAPS Newsletter Issue No. 10 ◆ November 2010 27
Reactive compounds
in air
Reactive compounds
in air
Reactive compounds
in air
Aerosols
Aerosols
Soilorganic matter
Trees
CO2H2O
nutrients
CO2
H2O
CO2
H2O
Outerlayer
Canopy
Soil
vide information on fluxes in the ecosystem,the flag-ship stations provide information onprocesses generating the fluxes, developinstrumentation, and serve to train scientistsand technical staff. The instrumentation ofeach station type is outlined in the textboxes.
The lack of the highest, flag–ship–levelstations is obvious. However, our experienceover ten years at SMEAR II and I (Station forMeasuring Ecosystem–Atmosphere Rela-tions) [1, 2] show that such a monitoringsystem can be constructed, that the stationswork reliably when properly operated, andthat the construction and maintenance costsare reasonable. By using comprehensivedata sets, unique results can be obtained [3].On the other hand, the FLUXNET networkwill cover a big fraction of flux stations [4],and basic stations can be established byupgrading weather stations.
Figure 1. Pools and main fluxes in soil–forest–atmosphere continuum.Boxes refer to amounts, arrows to fluxes and double circles to processes.
References
1. Hari P and Kulmala M 2005. Station for MeasuringEcosystem–Atmosphere Relations (SMEAR II).Boreal Environment Research 10, 315–322.
2. Hari P et al. 2009. A comprehensive network ofmeasuring stations to monitor change in theclimate system. Boreal Environment Research 14,442–446.
3. Tunved P et al. 2006. High natural aerosol loadingover boreal forests. Science 312, 261–263.
4. Baldocchi D et al. 2001. FLUXNET: A new tool tostudy the temporal and spatial variability ofecosystem–scale carbon dioxide, water vapor andenergy flux densities. Bulletin of the AmericanMeteorological Society 82, 2415–2434.
A comprehensive measuring stationnetwork is feasible, and it could provide es-sential information for science and politicaldecision making. This network could alsooffer crucial support to global scientificprograms like IGBP (International Geo-sphere–Biosphere Programme), WCRP(World Climate Research Programme), andparticularly their core projects iLEAPS(integrated Land Ecosystem – AtmosphereProcesses Study) and GEWEX (Global Energyand Water Cycle Experiment), which studyecosystem–atmosphere interactions. ■
Basic stations
Suggested instrumentation:
❑ temperature profiles inatmosphere and soil
❑ aerosol concentrations
❑ O3 and NO
x concentrations
❑ global radiation, photosynthetically active radiation and net radiation
❑ soil water content and tension
❑ rainfall
❑ snow depth and water content
❑ leaf area and mass
❑ amount of soil organic matter (annual)
❑ mass of woody components (annual)
❑ deposition of nutrients and H+ ions
Flux stations
In addition to basic–station measurements:
❑ CO2, H
2O, heat and momentum fluxes
between ecosystem and atmosphere
❑ aerosol size distributions
❑ profiles of CO2, O
3, SO
2, NO, NO
2, and
N2O in atmosphere and soil
❑ focused campaigns to determinedependencies of processes onenvironmental factors
Flag ship stations
In addition to flux-station measurements,monitoring of the following processes anddrivers at high spatial and temporal resolution:
❑ VOC emissions from vegetation and soil
❑ VOC profiles in atmosphere and soil
❑ H2SO
4, NH
3 and CH
4 in the air
❑ size distribution of ions in the air
❑ cloud radar
❑ PAR (photosynthetically active radiation)distribution inside canopy
❑ monitoring of spectral light distribution
❑ monitoring of atmospheric turbulence
❑ monitoring of nutrient and H+ concentrations in soil water
❑ monitoring of water flow in wood
❑ CO2 and H
2O fluxes between
soil and atmosphere
❑ development of instrumentation
❑ process studies by means ofstable isotopes
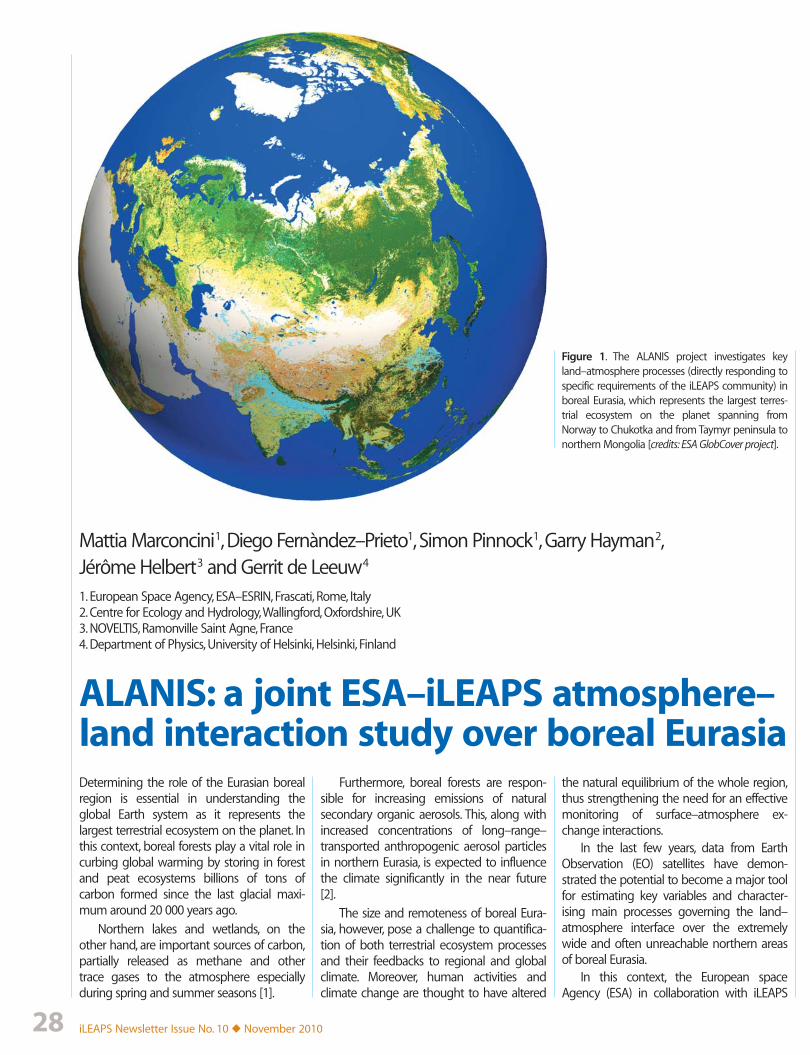
iLEAPS Newsletter Issue No. 10 ◆ November 201028
Mattia Marconcini1, Diego Fernàndez–Prieto1, Simon Pinnock1, Garry Hayman2,Jérôme Helbert3 and Gerrit de Leeuw4
1. European Space Agency, ESA–ESRIN, Frascati, Rome, Italy2. Centre for Ecology and Hydrology, Wallingford, Oxfordshire, UK3. NOVELTIS, Ramonville Saint Agne, France4. Department of Physics, University of Helsinki, Helsinki, Finland
ALANIS: a joint ESA–iLEAPS atmosphere–land interaction study over boreal EurasiaDetermining the role of the Eurasian borealregion is essential in understanding theglobal Earth system as it represents thelargest terrestrial ecosystem on the planet. Inthis context, boreal forests play a vital role incurbing global warming by storing in forestand peat ecosystems billions of tons ofcarbon formed since the last glacial maxi-mum around 20 000 years ago.
Northern lakes and wetlands, on theother hand, are important sources of carbon,partially released as methane and othertrace gases to the atmosphere especiallyduring spring and summer seasons [1].
Furthermore, boreal forests are respon-sible for increasing emissions of naturalsecondary organic aerosols. This, along withincreased concentrations of long–range–transported anthropogenic aerosol particlesin northern Eurasia, is expected to influencethe climate significantly in the near future[2].
The size and remoteness of boreal Eura-sia, however, pose a challenge to quantifica-tion of both terrestrial ecosystem processesand their feedbacks to regional and globalclimate. Moreover, human activities andclimate change are thought to have altered
the natural equilibrium of the whole region,thus strengthening the need for an effectivemonitoring of surface–atmosphere ex-change interactions.
In the last few years, data from EarthObservation (EO) satellites have demon-strated the potential to become a major toolfor estimating key variables and character-ising main processes governing the land–atmosphere interface over the extremelywide and often unreachable northern areasof boreal Eurasia.
In this context, the European spaceAgency (ESA) in collaboration with iLEAPS
Figure 1. The ALANIS project investigates keyland–atmosphere processes (directly responding tospecific requirements of the iLEAPS community) inboreal Eurasia, which represents the largest terres-trial ecosystem on the planet spanning fromNorway to Chukotka and from Taymyr peninsula tonorthern Mongolia [credits: ESA GlobCover project].
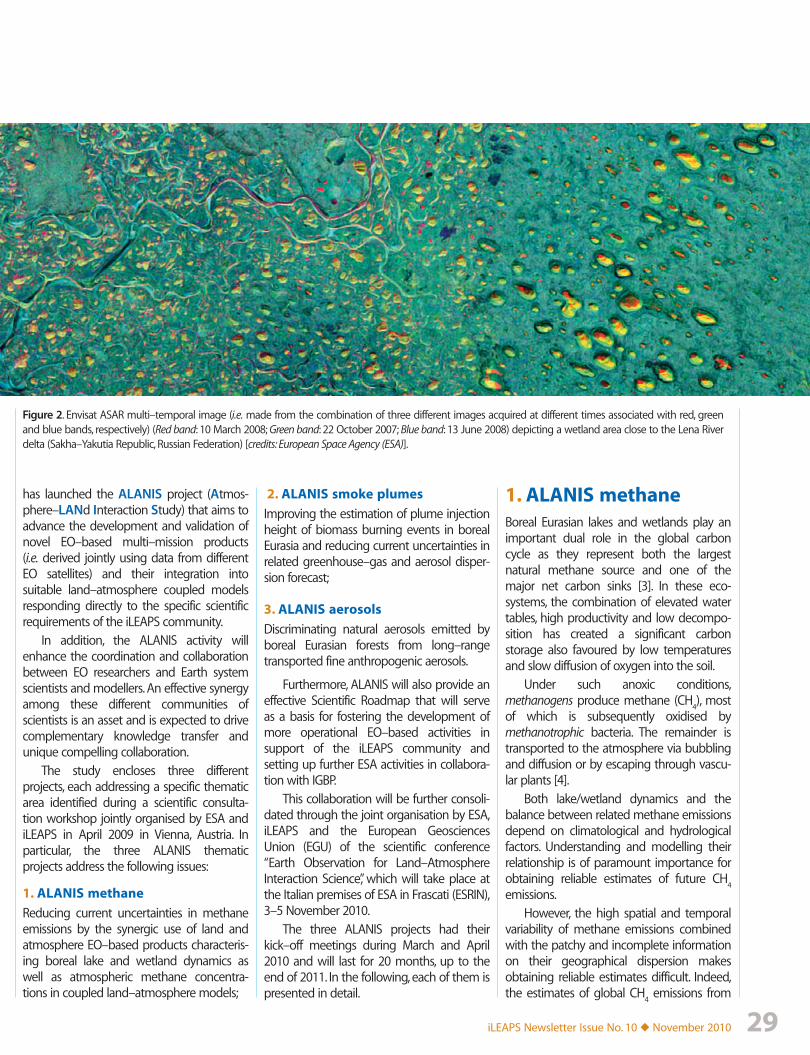
iLEAPS Newsletter Issue No. 10 ◆ November 2010 29
has launched the ALANIS project (Atmos-phere–LANd Interaction Study) that aims toadvance the development and validation ofnovel EO–based multi–mission products(i.e. derived jointly using data from differentEO satellites) and their integration intosuitable land–atmosphere coupled modelsresponding directly to the specific scientificrequirements of the iLEAPS community.
In addition, the ALANIS activity willenhance the coordination and collaborationbetween EO researchers and Earth systemscientists and modellers. An effective synergyamong these different communities ofscientists is an asset and is expected to drivecomplementary knowledge transfer andunique compelling collaboration.
The study encloses three differentprojects, each addressing a specific thematicarea identified during a scientific consulta-tion workshop jointly organised by ESA andiLEAPS in April 2009 in Vienna, Austria. Inparticular, the three ALANIS thematicprojects address the following issues:
1. ALANIS methane
Reducing current uncertainties in methaneemissions by the synergic use of land andatmosphere EO–based products characteris-ing boreal lake and wetland dynamics aswell as atmospheric methane concentra-tions in coupled land–atmosphere models;
2. ALANIS smoke plumes
Improving the estimation of plume injectionheight of biomass burning events in borealEurasia and reducing current uncertainties inrelated greenhouse–gas and aerosol disper-sion forecast;
3. ALANIS aerosols
Discriminating natural aerosols emitted byboreal Eurasian forests from long–rangetransported fine anthropogenic aerosols.
Furthermore, ALANIS will also provide aneffective Scientific Roadmap that will serveas a basis for fostering the development ofmore operational EO–based activities insupport of the iLEAPS community andsetting up further ESA activities in collabora-tion with IGBP.
This collaboration will be further consoli-dated through the joint organisation by ESA,iLEAPS and the European GeosciencesUnion (EGU) of the scientific conference“Earth Observation for Land–AtmosphereInteraction Science”, which will take place atthe Italian premises of ESA in Frascati (ESRIN),3–5 November 2010.
The three ALANIS projects had theirkick–off meetings during March and April2010 and will last for 20 months, up to theend of 2011. In the following, each of them ispresented in detail.
1. ALANIS methaneBoreal Eurasian lakes and wetlands play animportant dual role in the global carboncycle as they represent both the largestnatural methane source and one of themajor net carbon sinks [3]. In these eco-systems, the combination of elevated watertables, high productivity and low decompo-sition has created a significant carbonstorage also favoured by low temperaturesand slow diffusion of oxygen into the soil.
Under such anoxic conditions,methanogens produce methane (CH
4), most
of which is subsequently oxidised bymethanotrophic bacteria. The remainder istransported to the atmosphere via bubblingand diffusion or by escaping through vascu-lar plants [4].
Both lake/wetland dynamics and thebalance between related methane emissionsdepend on climatological and hydrologicalfactors. Understanding and modelling theirrelationship is of paramount importance forobtaining reliable estimates of future CH
4
emissions.However, the high spatial and temporal
variability of methane emissions combinedwith the patchy and incomplete informationon their geographical dispersion makesobtaining reliable estimates difficult. Indeed,the estimates of global CH
4 emissions from
Figure 2. Envisat ASAR multi–temporal image (i.e. made from the combination of three different images acquired at different times associated with red, greenand blue bands, respectively) (Red band: 10 March 2008; Green band: 22 October 2007; Blue band: 13 June 2008) depicting a wetland area close to the Lena Riverdelta (Sakha–Yakutia Republic, Russian Federation) [credits: European Space Agency (ESA)].
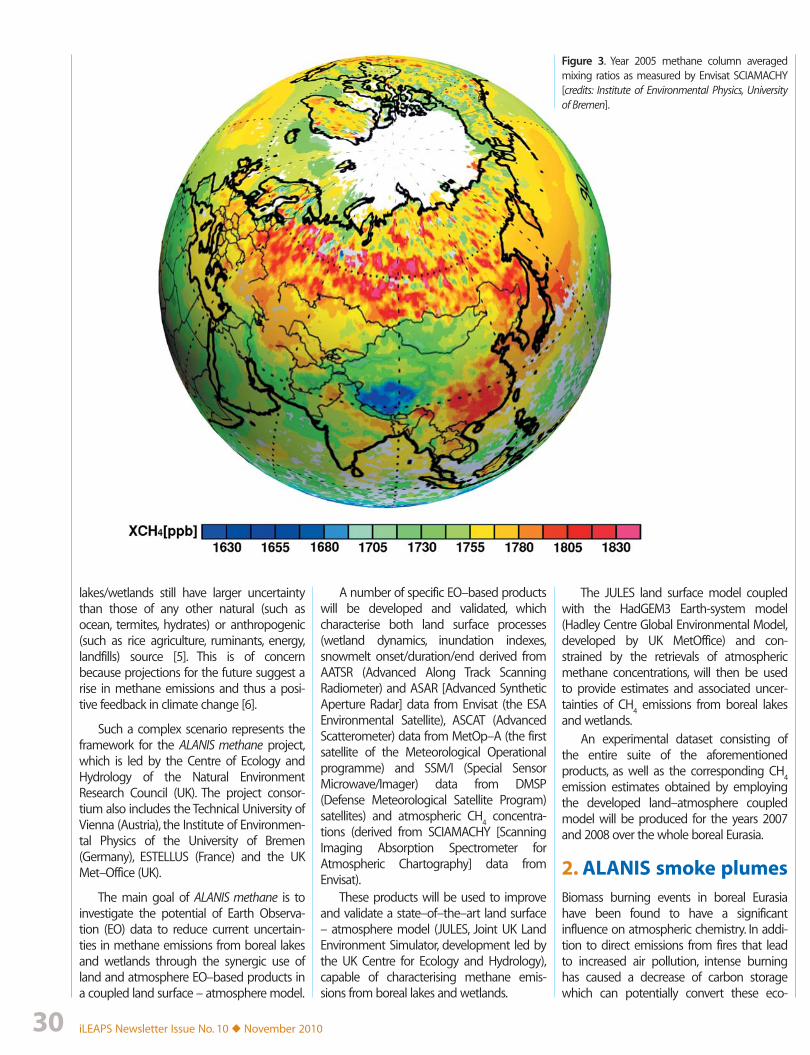
iLEAPS Newsletter Issue No. 10 ◆ November 201030
Figure 3. Year 2005 methane column averagedmixing ratios as measured by Envisat SCIAMACHY[credits: Institute of Environmental Physics, Universityof Bremen].
lakes/wetlands still have larger uncertaintythan those of any other natural (such asocean, termites, hydrates) or anthropogenic(such as rice agriculture, ruminants, energy,landfills) source [5]. This is of concernbecause projections for the future suggest arise in methane emissions and thus a posi-tive feedback in climate change [6].
Such a complex scenario represents theframework for the ALANIS methane project,which is led by the Centre of Ecology andHydrology of the Natural EnvironmentResearch Council (UK). The project consor-tium also includes the Technical University ofVienna (Austria), the Institute of Environmen-tal Physics of the University of Bremen(Germany), ESTELLUS (France) and the UKMet–Office (UK).
The main goal of ALANIS methane is toinvestigate the potential of Earth Observa-tion (EO) data to reduce current uncertain-ties in methane emissions from boreal lakesand wetlands through the synergic use ofland and atmosphere EO–based products ina coupled land surface – atmosphere model.
A number of specific EO–based productswill be developed and validated, whichcharacterise both land surface processes(wetland dynamics, inundation indexes,snowmelt onset/duration/end derived fromAATSR (Advanced Along Track ScanningRadiometer) and ASAR [Advanced SyntheticAperture Radar] data from Envisat (the ESAEnvironmental Satellite), ASCAT (AdvancedScatterometer) data from MetOp–A (the firstsatellite of the Meteorological Operationalprogramme) and SSM/I (Special SensorMicrowave/Imager) data from DMSP(Defense Meteorological Satellite Program)satellites) and atmospheric CH
4 concentra-
tions (derived from SCIAMACHY [ScanningImaging Absorption Spectrometer forAtmospheric Chartography] data fromEnvisat).
These products will be used to improveand validate a state–of–the–art land surface– atmosphere model (JULES, Joint UK LandEnvironment Simulator, development led bythe UK Centre for Ecology and Hydrology),capable of characterising methane emis-sions from boreal lakes and wetlands.
The JULES land surface model coupledwith the HadGEM3 Earth-system model(Hadley Centre Global Environmental Model,developed by UK MetOffice) and con-strained by the retrievals of atmosphericmethane concentrations, will then be usedto provide estimates and associated uncer-tainties of CH
4 emissions from boreal lakes
and wetlands.An experimental dataset consisting of
the entire suite of the aforementionedproducts, as well as the corresponding CH
4
emission estimates obtained by employingthe developed land–atmosphere coupledmodel will be produced for the years 2007and 2008 over the whole boreal Eurasia.
2. ALANIS smoke plumesBiomass burning events in boreal Eurasiahave been found to have a significantinfluence on atmospheric chemistry. In addi-tion to direct emissions from fires that leadto increased air pollution, intense burninghas caused a decrease of carbon storagewhich can potentially convert these eco-
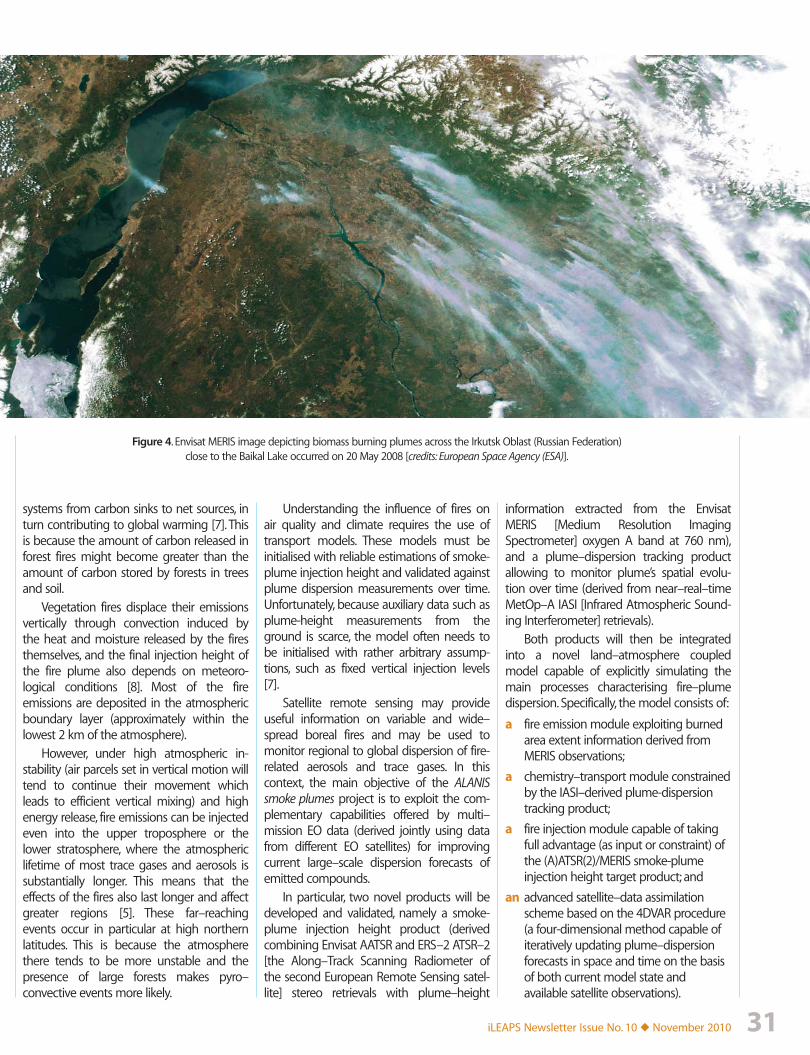
iLEAPS Newsletter Issue No. 10 ◆ November 2010 31
Figure 4. Envisat MERIS image depicting biomass burning plumes across the Irkutsk Oblast (Russian Federation)close to the Baikal Lake occurred on 20 May 2008 [credits: European Space Agency (ESA)].
systems from carbon sinks to net sources, inturn contributing to global warming [7]. Thisis because the amount of carbon released inforest fires might become greater than theamount of carbon stored by forests in treesand soil.
Vegetation fires displace their emissionsvertically through convection induced bythe heat and moisture released by the firesthemselves, and the final injection height ofthe fire plume also depends on meteoro-logical conditions [8]. Most of the fireemissions are deposited in the atmosphericboundary layer (approximately within thelowest 2 km of the atmosphere).
However, under high atmospheric in-stability (air parcels set in vertical motion willtend to continue their movement whichleads to efficient vertical mixing) and highenergy release, fire emissions can be injectedeven into the upper troposphere or thelower stratosphere, where the atmosphericlifetime of most trace gases and aerosols issubstantially longer. This means that theeffects of the fires also last longer and affectgreater regions [5]. These far–reachingevents occur in particular at high northernlatitudes. This is because the atmospherethere tends to be more unstable and thepresence of large forests makes pyro–convective events more likely.
Understanding the influence of fires onair quality and climate requires the use oftransport models. These models must beinitialised with reliable estimations of smoke-plume injection height and validated againstplume dispersion measurements over time.Unfortunately, because auxiliary data such asplume-height measurements from theground is scarce, the model often needs tobe initialised with rather arbitrary assump-tions, such as fixed vertical injection levels[7].
Satellite remote sensing may provideuseful information on variable and wide–spread boreal fires and may be used tomonitor regional to global dispersion of fire-related aerosols and trace gases. In thiscontext, the main objective of the ALANISsmoke plumes project is to exploit the com-plementary capabilities offered by multi–mission EO data (derived jointly using datafrom different EO satellites) for improvingcurrent large–scale dispersion forecasts ofemitted compounds.
In particular, two novel products will bedeveloped and validated, namely a smoke-plume injection height product (derivedcombining Envisat AATSR and ERS–2 ATSR–2[the Along–Track Scanning Radiometer ofthe second European Remote Sensing satel-lite] stereo retrievals with plume–height
information extracted from the EnvisatMERIS [Medium Resolution ImagingSpectrometer] oxygen A band at 760 nm),and a plume–dispersion tracking productallowing to monitor plume’s spatial evolu-tion over time (derived from near–real–timeMetOp–A IASI [Infrared Atmospheric Sound-ing Interferometer] retrievals).
Both products will then be integratedinto a novel land–atmosphere coupledmodel capable of explicitly simulating themain processes characterising fire–plumedispersion. Specifically, the model consists of:
a fire emission module exploiting burnedarea extent information derived fromMERIS observations;
a chemistry–transport module constrainedby the IASI–derived plume-dispersiontracking product;
a fire injection module capable of takingfull advantage (as input or constraint) ofthe (A)ATSR(2)/MERIS smoke-plumeinjection height target product; and
an advanced satellite–data assimilationscheme based on the 4DVAR procedure(a four-dimensional method capable ofiteratively updating plume–dispersionforecasts in space and time on the basisof both current model state andavailable satellite observations).
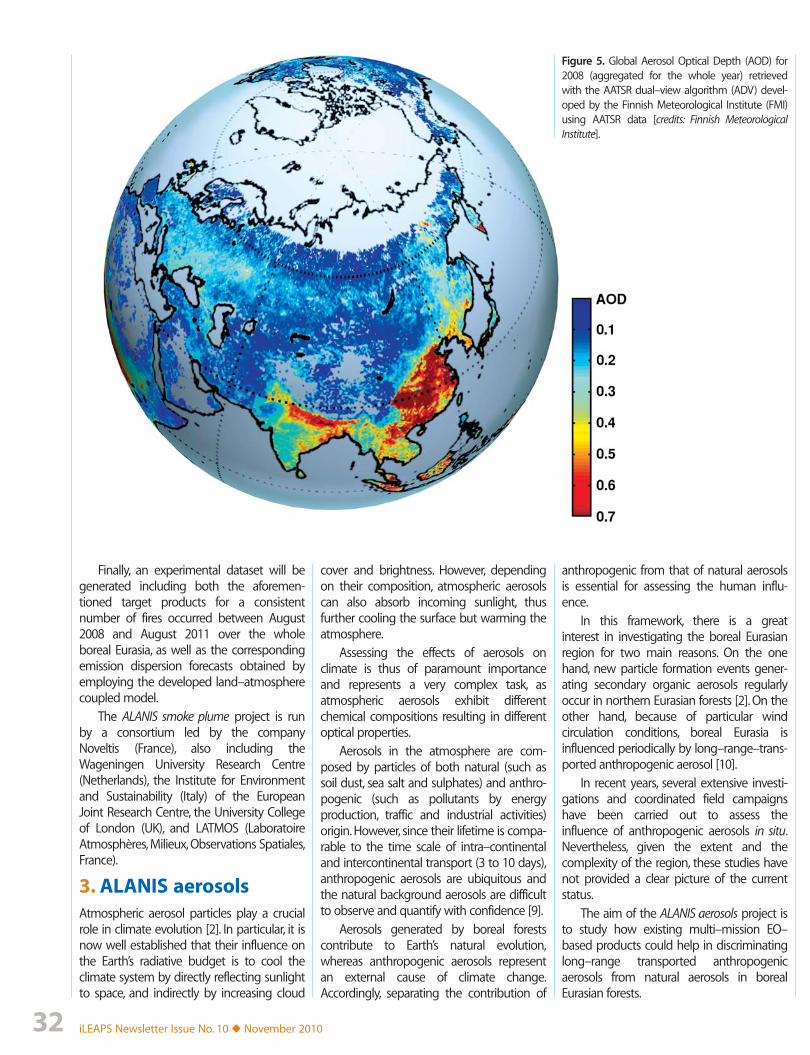
iLEAPS Newsletter Issue No. 10 ◆ November 201032
Figure 5. Global Aerosol Optical Depth (AOD) for2008 (aggregated for the whole year) retrievedwith the AATSR dual–view algorithm (ADV) devel-oped by the Finnish Meteorological Institute (FMI)using AATSR data [credits: Finnish MeteorologicalInstitute].
Finally, an experimental dataset will begenerated including both the aforemen-tioned target products for a consistentnumber of fires occurred between August2008 and August 2011 over the wholeboreal Eurasia, as well as the correspondingemission dispersion forecasts obtained byemploying the developed land–atmospherecoupled model.
The ALANIS smoke plume project is runby a consortium led by the companyNoveltis (France), also including theWageningen University Research Centre(Netherlands), the Institute for Environmentand Sustainability (Italy) of the EuropeanJoint Research Centre, the University Collegeof London (UK), and LATMOS (LaboratoireAtmosphères, Milieux, Observations Spatiales,France).
3. ALANIS aerosolsAtmospheric aerosol particles play a crucialrole in climate evolution [2]. In particular, it isnow well established that their influence onthe Earth’s radiative budget is to cool theclimate system by directly reflecting sunlightto space, and indirectly by increasing cloud
cover and brightness. However, dependingon their composition, atmospheric aerosolscan also absorb incoming sunlight, thusfurther cooling the surface but warming theatmosphere.
Assessing the effects of aerosols onclimate is thus of paramount importanceand represents a very complex task, asatmospheric aerosols exhibit differentchemical compositions resulting in differentoptical properties.
Aerosols in the atmosphere are com-posed by particles of both natural (such assoil dust, sea salt and sulphates) and anthro-pogenic (such as pollutants by energyproduction, traffic and industrial activities)origin. However, since their lifetime is compa-rable to the time scale of intra–continentaland intercontinental transport (3 to 10 days),anthropogenic aerosols are ubiquitous andthe natural background aerosols are difficultto observe and quantify with confidence [9].
Aerosols generated by boreal forestscontribute to Earth’s natural evolution,whereas anthropogenic aerosols representan external cause of climate change.Accordingly, separating the contribution of
anthropogenic from that of natural aerosolsis essential for assessing the human influ-ence.
In this framework, there is a greatinterest in investigating the boreal Eurasianregion for two main reasons. On the onehand, new particle formation events gener-ating secondary organic aerosols regularlyoccur in northern Eurasian forests [2]. On theother hand, because of particular windcirculation conditions, boreal Eurasia isinfluenced periodically by long–range–trans-ported anthropogenic aerosol [10].
In recent years, several extensive investi-gations and coordinated field campaignshave been carried out to assess theinfluence of anthropogenic aerosols in situ.Nevertheless, given the extent and thecomplexity of the region, these studies havenot provided a clear picture of the currentstatus.
The aim of the ALANIS aerosols project isto study how existing multi–mission EO–based products could help in discriminatinglong–range transported anthropogenicaerosols from natural aerosols in borealEurasian forests.
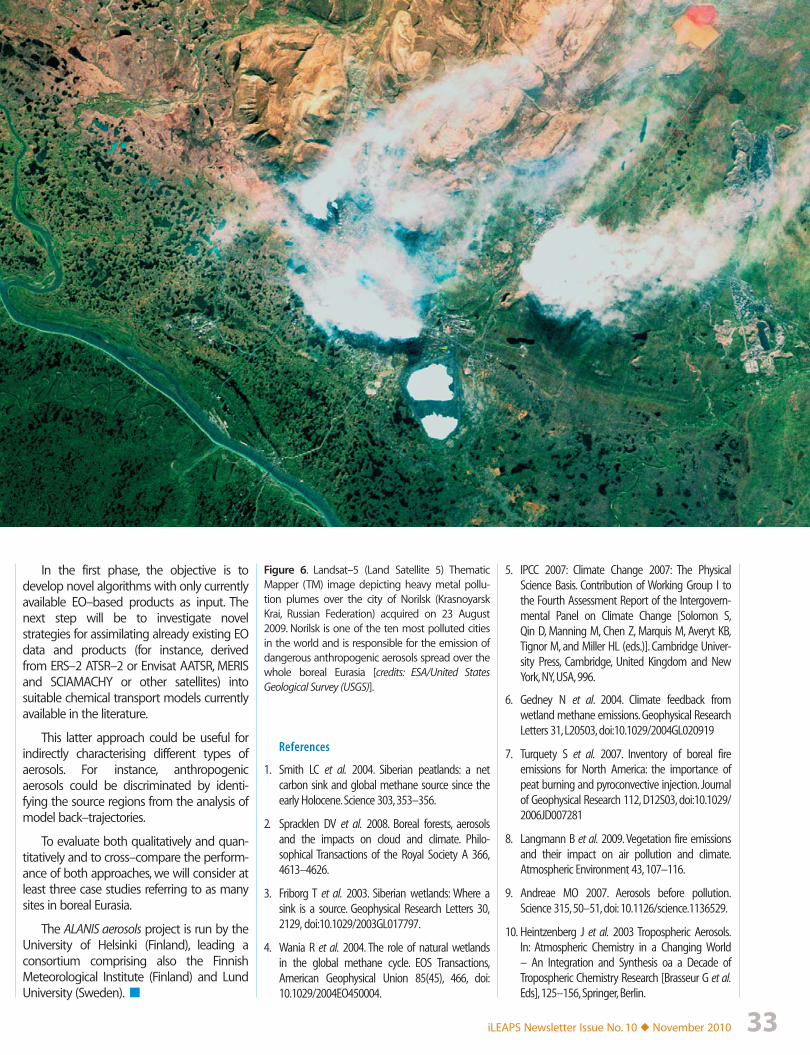
iLEAPS Newsletter Issue No. 10 ◆ November 2010 33
Figure 6. Landsat–5 (Land Satellite 5) ThematicMapper (TM) image depicting heavy metal pollu-tion plumes over the city of Norilsk (KrasnoyarskKrai, Russian Federation) acquired on 23 August2009. Norilsk is one of the ten most polluted citiesin the world and is responsible for the emission ofdangerous anthropogenic aerosols spread over thewhole boreal Eurasia [credits: ESA/United StatesGeological Survey (USGS)].
5. IPCC 2007: Climate Change 2007: The PhysicalScience Basis. Contribution of Working Group I tothe Fourth Assessment Report of the Intergovern-mental Panel on Climate Change [Solomon S,Qin D, Manning M, Chen Z, Marquis M, Averyt KB,Tignor M, and Miller HL (eds.)]. Cambridge Univer-sity Press, Cambridge, United Kingdom and NewYork, NY, USA, 996.
6. Gedney N et al. 2004. Climate feedback fromwetland methane emissions. Geophysical ResearchLetters 31, L20503, doi:10.1029/2004GL020919
7. Turquety S et al. 2007. Inventory of boreal fireemissions for North America: the importance ofpeat burning and pyroconvective injection. Journalof Geophysical Research 112, D12S03, doi:10.1029/2006JD007281
8. Langmann B et al. 2009. Vegetation fire emissionsand their impact on air pollution and climate.Atmospheric Environment 43, 107–116.
9. Andreae MO 2007. Aerosols before pollution.Science 315, 50–51, doi: 10.1126/science.1136529.
10. Heintzenberg J et al. 2003 Tropospheric Aerosols.In: Atmospheric Chemistry in a Changing World– An Integration and Synthesis oa a Decade ofTropospheric Chemistry Research [Brasseur G et al.Eds], 125–156, Springer, Berlin.
References
1. Smith LC et al. 2004. Siberian peatlands: a netcarbon sink and global methane source since theearly Holocene. Science 303, 353–356.
2. Spracklen DV et al. 2008. Boreal forests, aerosolsand the impacts on cloud and climate. Philo-sophical Transactions of the Royal Society A 366,4613–4626.
3. Friborg T et al. 2003. Siberian wetlands: Where asink is a source. Geophysical Research Letters 30,2129, doi:10.1029/2003GL017797.
4. Wania R et al. 2004. The role of natural wetlandsin the global methane cycle. EOS Transactions,American Geophysical Union 85(45), 466, doi:10.1029/2004EO450004.
In the first phase, the objective is todevelop novel algorithms with only currentlyavailable EO–based products as input. Thenext step will be to investigate novelstrategies for assimilating already existing EOdata and products (for instance, derivedfrom ERS–2 ATSR–2 or Envisat AATSR, MERISand SCIAMACHY or other satellites) intosuitable chemical transport models currentlyavailable in the literature.
This latter approach could be useful forindirectly characterising different types ofaerosols. For instance, anthropogenicaerosols could be discriminated by identi-fying the source regions from the analysis ofmodel back–trajectories.
To evaluate both qualitatively and quan-titatively and to cross–compare the perform-ance of both approaches, we will consider atleast three case studies referring to as manysites in boreal Eurasia.
The ALANIS aerosols project is run by theUniversity of Helsinki (Finland), leading aconsortium comprising also the FinnishMeteorological Institute (Finland) and LundUniversity (Sweden). ■
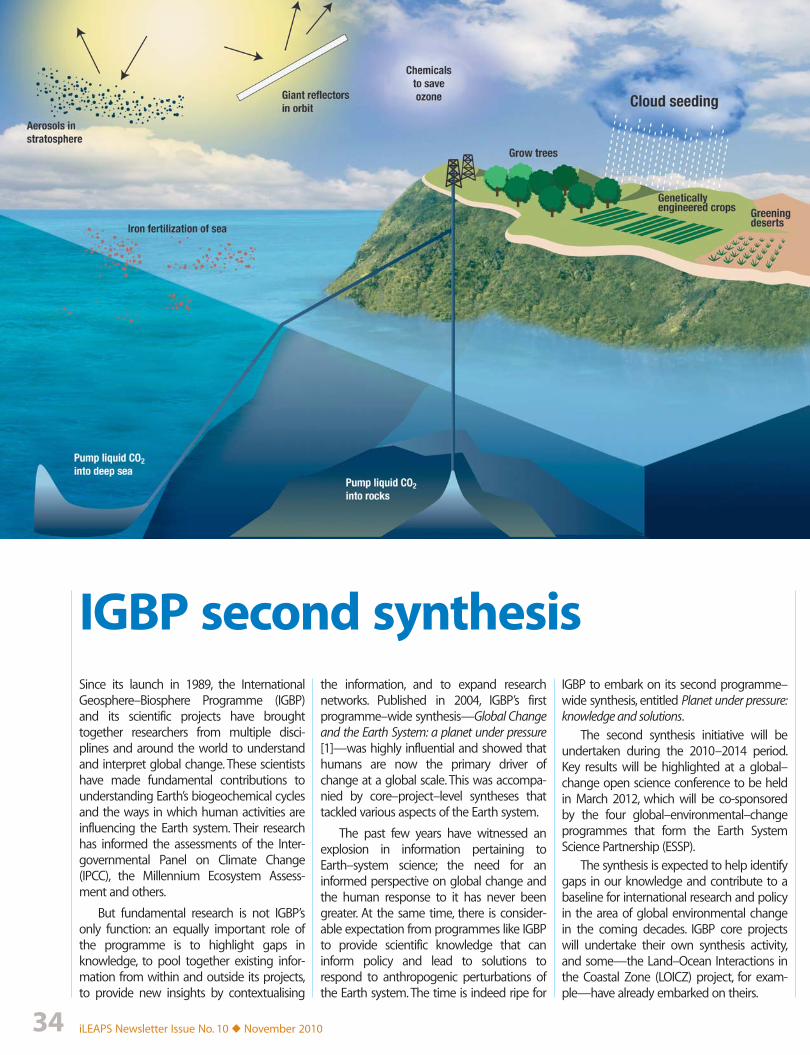
iLEAPS Newsletter Issue No. 10 ◆ November 201034
IGBP second synthesisSince its launch in 1989, the InternationalGeosphere–Biosphere Programme (IGBP)and its scientific projects have broughttogether researchers from multiple disci-plines and around the world to understandand interpret global change. These scientistshave made fundamental contributions tounderstanding Earth’s biogeochemical cyclesand the ways in which human activities areinfluencing the Earth system. Their researchhas informed the assessments of the Inter-governmental Panel on Climate Change(IPCC), the Millennium Ecosystem Assess-ment and others.
But fundamental research is not IGBP’sonly function: an equally important role ofthe programme is to highlight gaps inknowledge, to pool together existing infor-mation from within and outside its projects,to provide new insights by contextualising
the information, and to expand researchnetworks. Published in 2004, IGBP’s firstprogramme–wide synthesis—Global Changeand the Earth System: a planet under pressure[1]—was highly influential and showed thathumans are now the primary driver ofchange at a global scale. This was accompa-nied by core–project–level syntheses thattackled various aspects of the Earth system.
The past few years have witnessed anexplosion in information pertaining toEarth–system science; the need for aninformed perspective on global change andthe human response to it has never beengreater. At the same time, there is consider-able expectation from programmes like IGBPto provide scientific knowledge that caninform policy and lead to solutions torespond to anthropogenic perturbations ofthe Earth system. The time is indeed ripe for
IGBP to embark on its second programme–wide synthesis, entitled Planet under pressure:knowledge and solutions.
The second synthesis initiative will beundertaken during the 2010–2014 period.Key results will be highlighted at a global–change open science conference to be heldin March 2012, which will be co-sponsoredby the four global–environmental–changeprogrammes that form the Earth SystemScience Partnership (ESSP).
The synthesis is expected to help identifygaps in our knowledge and contribute to abaseline for international research and policyin the area of global environmental changein the coming decades. IGBP core projectswill undertake their own synthesis activity,and some—the Land–Ocean Interactions inthe Coastal Zone (LOICZ) project, for exam-ple—have already embarked on theirs.
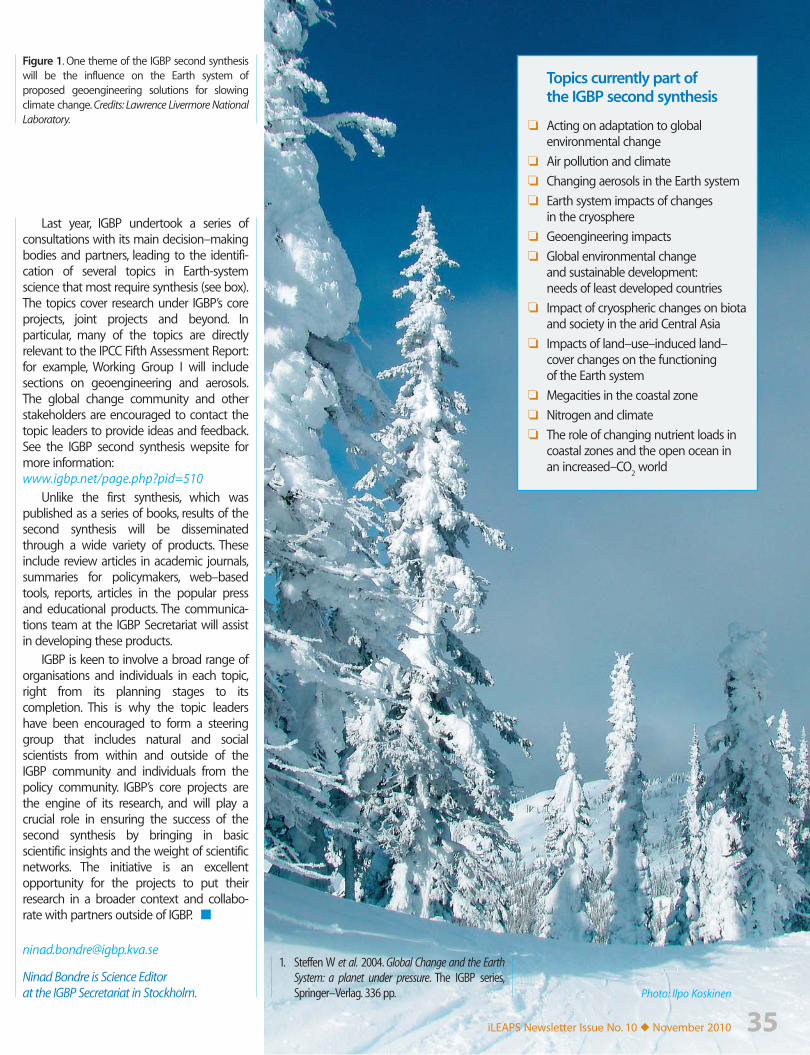
iLEAPS Newsletter Issue No. 10 ◆ November 2010 35
Last year, IGBP undertook a series ofconsultations with its main decision–makingbodies and partners, leading to the identifi-cation of several topics in Earth-systemscience that most require synthesis (see box).The topics cover research under IGBP’s coreprojects, joint projects and beyond. Inparticular, many of the topics are directlyrelevant to the IPCC Fifth Assessment Report:for example, Working Group I will includesections on geoengineering and aerosols.The global change community and otherstakeholders are encouraged to contact thetopic leaders to provide ideas and feedback.See the IGBP second synthesis wepsite formore information:www.igbp.net/page.php?pid=510
Unlike the first synthesis, which waspublished as a series of books, results of thesecond synthesis will be disseminatedthrough a wide variety of products. Theseinclude review articles in academic journals,summaries for policymakers, web–basedtools, reports, articles in the popular pressand educational products. The communica-tions team at the IGBP Secretariat will assistin developing these products.
IGBP is keen to involve a broad range oforganisations and individuals in each topic,right from its planning stages to itscompletion. This is why the topic leadershave been encouraged to form a steeringgroup that includes natural and socialscientists from within and outside of theIGBP community and individuals from thepolicy community. IGBP’s core projects arethe engine of its research, and will play acrucial role in ensuring the success of thesecond synthesis by bringing in basicscientific insights and the weight of scientificnetworks. The initiative is an excellentopportunity for the projects to put theirresearch in a broader context and collabo-rate with partners outside of IGBP. ■
Ninad Bondre is Science Editorat the IGBP Secretariat in Stockholm.
Figure 1. One theme of the IGBP second synthesiswill be the influence on the Earth system ofproposed geoengineering solutions for slowingclimate change. Credits: Lawrence Livermore NationalLaboratory.
1. Steffen W et al. 2004. Global Change and the EarthSystem: a planet under pressure. The IGBP series,Springer–Verlag. 336 pp.
Topics currently part ofthe IGBP second synthesis
❏ Acting on adaptation to globalenvironmental change
❏ Air pollution and climate
❏ Changing aerosols in the Earth system
❏ Earth system impacts of changesin the cryosphere
❏ Geoengineering impacts
❏ Global environmental changeand sustainable development:needs of least developed countries
❏ Impact of cryospheric changes on biotaand society in the arid Central Asia
❏ Impacts of land–use–induced land–cover changes on the functioningof the Earth system
❏ Megacities in the coastal zone
❏ Nitrogen and climate
❏ The role of changing nutrient loads incoastal zones and the open ocean inan increased–CO
2 world
iLEAPS Newsletter Issue No. 10 ◆ November 2010 35Photo: Ilpo Koskinen
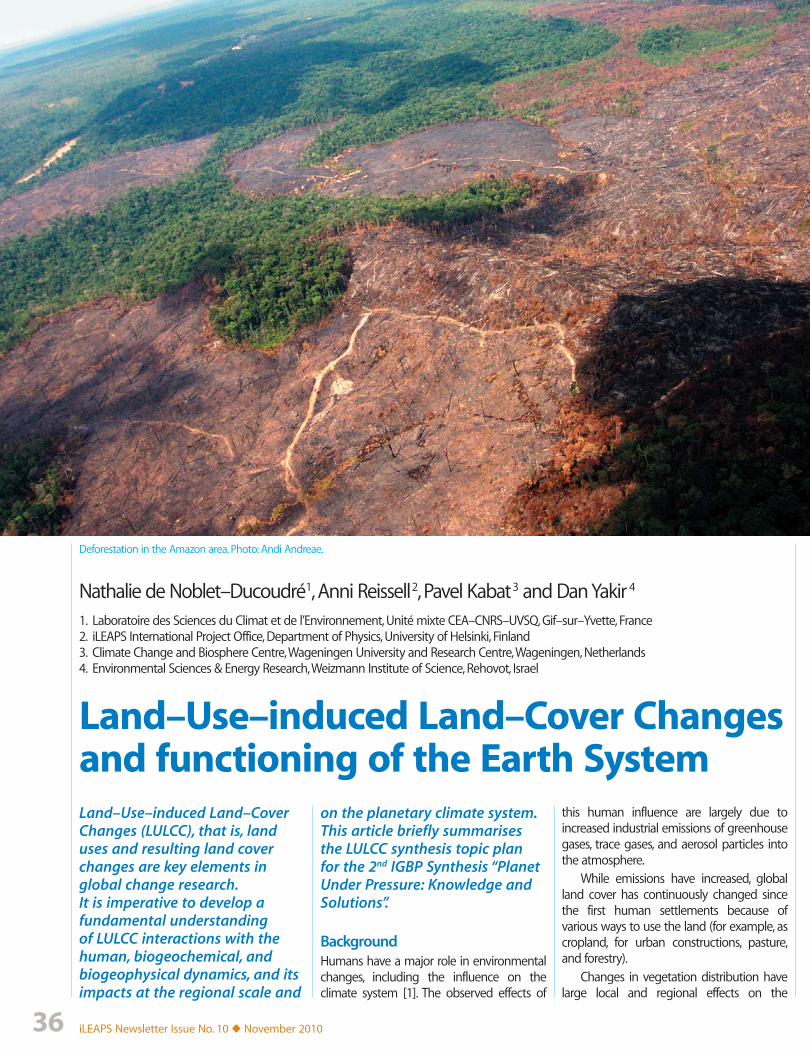
iLEAPS Newsletter Issue No. 10 ◆ November 201036
Nathalie de Noblet–Ducoudré1, Anni Reissell2, Pavel Kabat3 and Dan Yakir 4
1. Laboratoire des Sciences du Climat et de l’Environnement, Unité mixte CEA–CNRS–UVSQ, Gif–sur–Yvette, France2. iLEAPS International Project Office, Department of Physics, University of Helsinki, Finland3. Climate Change and Biosphere Centre, Wageningen University and Research Centre, Wageningen, Netherlands4. Environmental Sciences & Energy Research, Weizmann Institute of Science, Rehovot, Israel
Land–Use–induced Land–Cover Changesand functioning of the Earth SystemLand–Use–induced Land–CoverChanges (LULCC), that is, landuses and resulting land coverchanges are key elements inglobal change research.It is imperative to develop afundamental understandingof LULCC interactions with thehuman, biogeochemical, andbiogeophysical dynamics, and itsimpacts at the regional scale and
BackgroundHumans have a major role in environmentalchanges, including the influence on theclimate system [1]. The observed effects of
this human influence are largely due toincreased industrial emissions of greenhousegases, trace gases, and aerosol particles intothe atmosphere.
While emissions have increased, globalland cover has continuously changed sincethe first human settlements because ofvarious ways to use the land (for example, ascropland, for urban constructions, pasture,and forestry).
Changes in vegetation distribution havelarge local and regional effects on the
Deforestation in the Amazon area. Photo: Andi Andreae.
on the planetary climate system.This article briefly summarisesthe LULCC synthesis topic planfor the 2nd IGBP Synthesis “PlanetUnder Pressure: Knowledge andSolutions”.
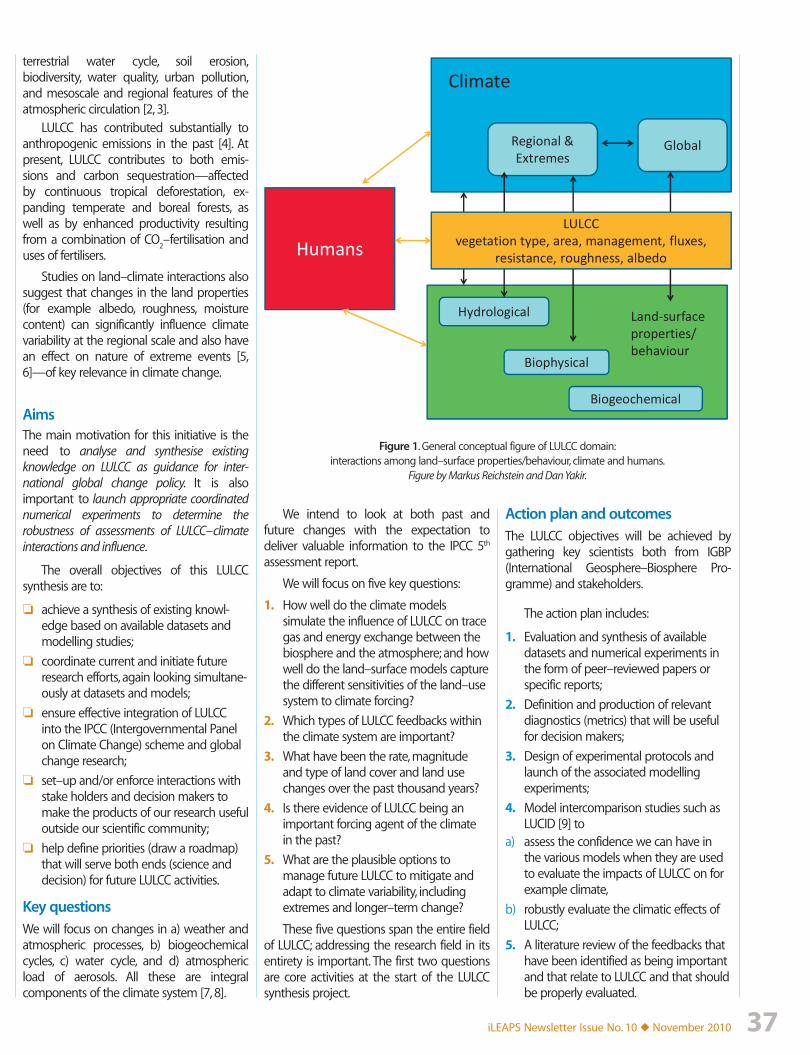
iLEAPS Newsletter Issue No. 10 ◆ November 2010 37
Regional &Extremes
Global
Humans
Biophysical
Hydrological
Biogeochemical
Land-surfaceproperties/behaviour
Climate
LULCC vegetation type, area, management, fluxes,
resistance, roughness, albedo
AimsThe main motivation for this initiative is theneed to analyse and synthesise existingknowledge on LULCC as guidance for inter-national global change policy. It is alsoimportant to launch appropriate coordinatednumerical experiments to determine therobustness of assessments of LULCC–climateinteractions and influence.
The overall objectives of this LULCCsynthesis are to:
❏ achieve a synthesis of existing knowl-edge based on available datasets andmodelling studies;
❏ coordinate current and initiate futureresearch efforts, again looking simultane-ously at datasets and models;
❏ ensure effective integration of LULCCinto the IPCC (Intergovernmental Panelon Climate Change) scheme and globalchange research;
❏ set–up and/or enforce interactions withstake holders and decision makers tomake the products of our research usefuloutside our scientific community;
❏ help define priorities (draw a roadmap)that will serve both ends (science anddecision) for future LULCC activities.
Key questionsWe will focus on changes in a) weather andatmospheric processes, b) biogeochemicalcycles, c) water cycle, and d) atmosphericload of aerosols. All these are integralcomponents of the climate system [7, 8].
We intend to look at both past andfuture changes with the expectation todeliver valuable information to the IPCC 5th
assessment report.
We will focus on five key questions:
1. How well do the climate modelssimulate the influence of LULCC on tracegas and energy exchange between thebiosphere and the atmosphere; and howwell do the land–surface models capturethe different sensitivities of the land–usesystem to climate forcing?
2. Which types of LULCC feedbacks withinthe climate system are important?
3. What have been the rate, magnitudeand type of land cover and land usechanges over the past thousand years?
4. Is there evidence of LULCC being animportant forcing agent of the climatein the past?
5. What are the plausible options tomanage future LULCC to mitigate andadapt to climate variability, includingextremes and longer–term change?
These five questions span the entire fieldof LULCC; addressing the research field in itsentirety is important. The first two questionsare core activities at the start of the LULCCsynthesis project.
Action plan and outcomesThe LULCC objectives will be achieved bygathering key scientists both from IGBP(International Geosphere–Biosphere Pro-gramme) and stakeholders.
The action plan includes:
1. Evaluation and synthesis of availabledatasets and numerical experiments inthe form of peer–reviewed papers orspecific reports;
2. Definition and production of relevantdiagnostics (metrics) that will be usefulfor decision makers;
3. Design of experimental protocols andlaunch of the associated modellingexperiments;
4. Model intercomparison studies such asLUCID [9] to
a) assess the confidence we can have inthe various models when they are usedto evaluate the impacts of LULCC on forexample climate,
b) robustly evaluate the climatic effects ofLULCC;
5. A literature review of the feedbacks thathave been identified as being importantand that relate to LULCC and that shouldbe properly evaluated.
Figure 1. General conceptual figure of LULCC domain:interactions among land–surface properties/behaviour, climate and humans.
Figure by Markus Reichstein and Dan Yakir.
terrestrial water cycle, soil erosion,biodiversity, water quality, urban pollution,and mesoscale and regional features of theatmospheric circulation [2, 3].
LULCC has contributed substantially toanthropogenic emissions in the past [4]. Atpresent, LULCC contributes to both emis-sions and carbon sequestration—affectedby continuous tropical deforestation, ex-panding temperate and boreal forests, aswell as by enhanced productivity resultingfrom a combination of CO
2–fertilisation and
uses of fertilisers.
Studies on land–climate interactions alsosuggest that changes in the land properties(for example albedo, roughness, moisturecontent) can significantly influence climatevariability at the regional scale and also havean effect on nature of extreme events [5,6]—of key relevance in climate change.
iLEAPS Newsletter Issue No. 10 ◆ November 201038
References
1. IPCC 2007. Climate Change 2007, The PhysicalScience Basis. Working Group 1 Contribution to theFourth Assessment Report of the Intergovern-mental Panel on Climate Change. CambridgeUniversity Press. Edited by S. Salomon et al.
2. Takata K et al. 2009. Changes in the Asianmonsoon climate during 1700–1850 inducedby preindustrial cultivation. Proceedings of theNational Academy of Sciences of the UnitedStates of America, PNAS 106(24), 9586–9589,doi:10.1073/pnas.0807346106.
3. Feddema et al. 2005. The importance ofland–cover change in simulating future climates.Science 310, 1674–1678.
4. Houghton RA 2003. Revised estimates of theannual net flux of carbon to the atmospherefrom changes in land use 1850–2000. Tellus55(B), 378–390.
5. Narisma GT and Pitman AJ 2003. The impactof 200 years of land–cover change on theAustralian near–surface climate. Journal of Hydro-meteorology 4, 424–436.
6. Seneviratne SI et al. 2006. Land–atmospherecoupling and climate change in Europe. Nature443, 205–209.
7. Radiative forcing of climate change: Expandingthe concept and addressing uncertainties.Committee on Radiative Forcing Effects onClimate Change, Climate Research Committee,Board on Atmospheric Sciences and Climate,Division on Earth and Life Studies, The NationalAcademies Press, Washington DC, 208 pp.
8. Kabat P et al. Eds 2004. Vegetation, water,humans and the climate: A new perspective on aninteractive system. Springer, Berlin, Global Change– The IGBP Series, 566 pp.
9. Pitman AJ et al. 2009. Uncertainties in climateresponses to past land cover change: First resultsfrom the LUCID intercomparison study. Geo-physical Research Letters 36, L14814, doi:10.1029/2009GL039076.
The implementation will include work–shops that bring together modellers andexperimentalists. The kick–off meeting willbe held in winter 2010/11, immediately fol-lowed by a workshop that will be orientedtowards decision–making. We are hoping toproduce a position paper in summer 2011that describes the best way to interact withdecision makers, together with one or moreproposals to funding agencies to seek somesupport to our activities.
The longer–term outcomes will includehigh–profile review articles, journal specialissues, summaries for policy makers, onlineresources, press releases, articles in popularpress aimed at the general public, inter-national and national policy briefings,educational products.
Several of the products will be publishedin time for the next IPCC Assessment Report(AR5) and the major international scienceconference in 2012 “Planet Under Pressure –new knowledge towards solutions”.
This synthesis project will be carried outin collaboration by Integrated Land Ecosys-tem–Atmosphere Processes Study (iLEAPS),Analysis, Integration and Modeling of theEarth System (AIMES,) Past Global Changes(PAGES), International Global AtmosphericChemistry (IGAC), Global Land Project (GLP),Global Land/Atmosphere System Study ofthe Global Energy and Water Cycle Experi-ment (GEWEX/GLASS), Land–Use andClimate, Identification of robust impacts(LUCID), Climate of the 20th Century (C20C),global network of micrometeorologicaltower sites FLUXNET, Evaluation andintercomparison of existing land evapo-transpiration products (LandFlux–EVAL),International Land Model Benchmarking(iLAMB) as well as with non–IGBP research-ers and organisations in this interdisciplinaryfield.
The project works also with Food andAgriculture Organization (FAO) of the UnitedNations, United Nations EnvironmentProgramme (UNEP), IntergovernmentalPanel on Climate Change (IPCC), US NationalAeronautics and Space Administration(NASA), European Space Agency (ESA), forexample.
The initial effort is coordinated by iLEAPS(Pavel Kabat, Nathalie de Noblet–Ducoudré,Dan Yakir, and Anni Reissell). The LULCCsynthesis project gathers the leadingscientists from around the world and will belead by an international Scientific Commit-tee.
For updated information about LULCCand the IGBP Synthesis, please see thewebsites: www.ileaps.org/multisites/lulcc/and www.igbp.net/page.php?pid=510. Formore information and if you are interestedin contributing to the project, pleasecontact Nathalie de Noblet–Ducoudré orAnni Reissell. ■
[email protected]@helsinki.fi
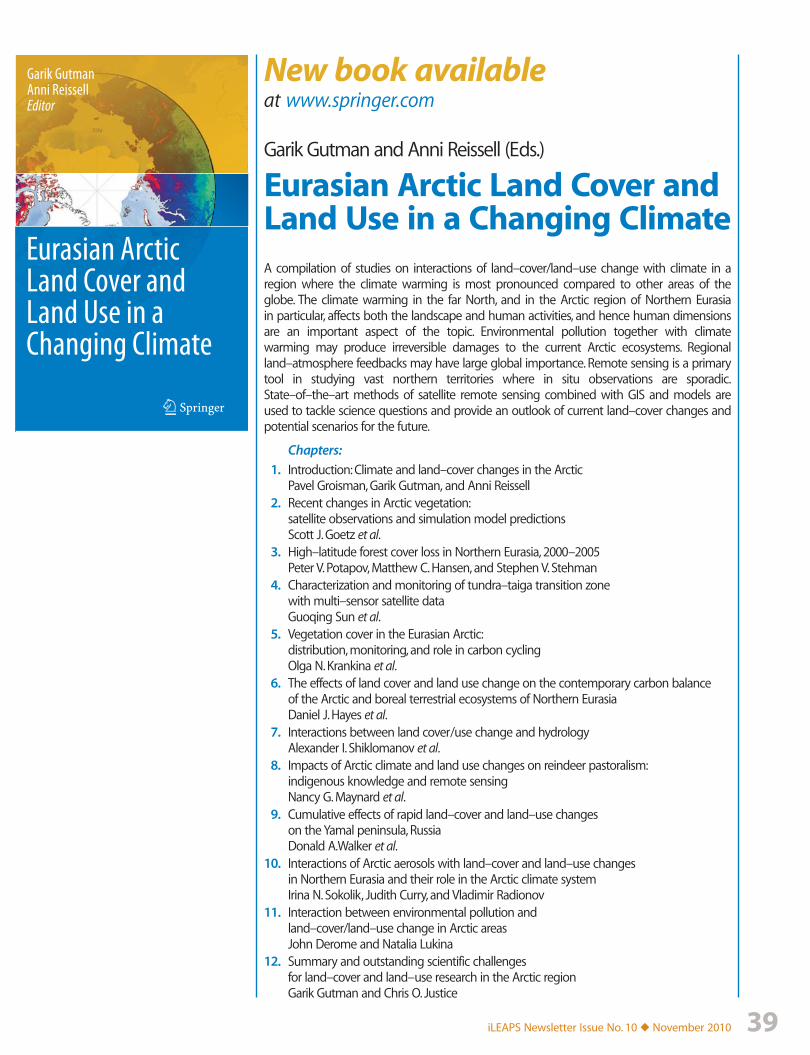
iLEAPS Newsletter Issue No. 10 ◆ November 2010 39
New book available
Garik Gutman and Anni Reissell (Eds.)
Eurasian Arctic Land Cover andLand Use in a Changing ClimateA compilation of studies on interactions of land–cover/land–use change with climate in aregion where the climate warming is most pronounced compared to other areas of theglobe. The climate warming in the far North, and in the Arctic region of Northern Eurasiain particular, affects both the landscape and human activities, and hence human dimensionsare an important aspect of the topic. Environmental pollution together with climatewarming may produce irreversible damages to the current Arctic ecosystems. Regionalland–atmosphere feedbacks may have large global importance. Remote sensing is a primarytool in studying vast northern territories where in situ observations are sporadic.State–of–the–art methods of satellite remote sensing combined with GIS and models areused to tackle science questions and provide an outlook of current land–cover changes andpotential scenarios for the future.
Chapters:
1. Introduction: Climate and land–cover changes in the ArcticPavel Groisman, Garik Gutman, and Anni Reissell
2. Recent changes in Arctic vegetation:satellite observations and simulation model predictionsScott J. Goetz et al.
3. High–latitude forest cover loss in Northern Eurasia, 2000–2005Peter V. Potapov, Matthew C. Hansen, and Stephen V. Stehman
4. Characterization and monitoring of tundra–taiga transition zonewith multi–sensor satellite dataGuoqing Sun et al.
5. Vegetation cover in the Eurasian Arctic:distribution, monitoring, and role in carbon cyclingOlga N. Krankina et al.
6. The effects of land cover and land use change on the contemporary carbon balanceof the Arctic and boreal terrestrial ecosystems of Northern EurasiaDaniel J. Hayes et al.
7. Interactions between land cover/use change and hydrologyAlexander I. Shiklomanov et al.
8. Impacts of Arctic climate and land use changes on reindeer pastoralism:indigenous knowledge and remote sensingNancy G. Maynard et al.
9. Cumulative effects of rapid land–cover and land–use changeson the Yamal peninsula, RussiaDonald A.Walker et al.
10. Interactions of Arctic aerosols with land–cover and land–use changesin Northern Eurasia and their role in the Arctic climate systemIrina N. Sokolik, Judith Curry, and Vladimir Radionov
11. Interaction between environmental pollution andland–cover/land–use change in Arctic areasJohn Derome and Natalia Lukina
12. Summary and outstanding scientific challengesfor land–cover and land–use research in the Arctic regionGarik Gutman and Chris O. Justice
at www.springer.com
Eurasian Arctic Land Cover and Land Use in a Changing Climate
Garik GutmanAnni Reissell Editor
iLEAPS Newsletter Issue No. 10 ◆ November 201040
Joshua Fisher is a Research Scientist at the JetPropulsion Laboratory of NASA (National Aeronauticsand Space Administration)/CalTech (California Uni-versity of Technology) in Los Angeles, California. Hestudied Environmental Sciences at the University ofCalifornia, Berkeley, USA, and received his PhD in 2006.
Erika Zardin is a PhD student at the University ofWestern Australia in Perth, Australia. Her field isanalytical atmospheric chemistry, and her currentresearch focuses on online measurements of volatileorganic compounds (VOC) in ambient air of WesternAustralia.
How do you feel about theopportunities currently outthere for ECSs?
Joshua: At the early–career stage thereare plenty of post–doc opportunities. I thinkright now there is more money comingfrom the top looking for capable ECSs thanthere is the workforce available to fill thesepositions. I guess it makes sense that it’sdifficult to synch the job opportunities andthe lag time in training perfectly.
Erika: I agree that the availability offellowships and small grants for ECSs inEarth System Science is greater than thenumber of viable candidates. On the otherhand, these short–term and high–through-put research opportunities require the ECSto work very hard and frequently relocateabroad. In my experience, this mobility andexclusive dedication to science places ademand on personal and familiar relation-ships.
Joshua: However, the permanent jobsituation is difficult because of the depressedglobal economy. Things are starting torebound, but for the most part hard moneypositions are still hard to come by.
Erika: Add to this the extreme competi-tion for acquiring and retaining an academicor research positions on the long–term, forwhich the continued scientific and financialsupport (and ultimately a tenure position)are not even guaranteed! I would like thecareer path of ECSs to become less depend-ent from chance or influenced by localinterests, whilst rewarding the actual re-search (and teaching talent) demonstratedby the young scientist/academic.
Any advice for PhD studentsand soon–to–become ECSs?
Erika: Reach out to network with peersand leading scientist in your area early inyour career. Seek exposure, objective criti-cism and feedback on your research fromother researchers, and even from the broadpublic. Avoid getting too embedded in yourresearch niche, by narrowly specialising inyour current research topic alone. True‘’multi- and interdisciplinarity“ is a mindset.
Joshua: Publish, publish, publish. Otherthan that, I went with a post–doc instead ofa permanent position straight out of gradschool because that was highly recom-mended by a lot of people I respect. Youlearn new skills, develop new networks, andbuild a core of research without necessarilygetting bogged down in teaching, meetings,and such.
Early–Career Scientist (ECS) Page
interview
iLEAPS Newsletter Issue No. 10 ◆ November 2010 41
You were actively involved iniLEAPS Early–Career ScientistWorkshop (ECSW) 2009 inMelbourne, and you are alsomembers of the organisingcommittee of ECSW2011 inGarmisch–Partenkirchen,Germany. How did you findECSW2009 and what are yourplans for ECSW2011?
Erika: I enjoyed the truly proactive in-volvement that we participants had in theworkshop’s activities, such as the Q&Asessions with the senior scientists and brain-storming ideas for a final report paper onECSW2009. At ECSW2011 in Germany, Iwould like to see the training on science/media and science/policy communicationre-introduced in a pan–European perspec-tive.
Joshua: I liked the engagement with thetop Australian senior scientists and linking
What do you thinkiLEAPS gives you ECSs?
Joshua: I enjoyed the conferences andthe Newsletter is well written and interest-ing. I think it’s doing a good job. I suppose itcould be even more focussed and driven interms of results and science development.
Erika: The many thematic workshopsand schools organised by iLEAPS offer awealth of opportunity to enhance one’sresearch experience and to learn thelanguage of other scientists. I also enjoy theiLEAPS Newsletter for its personal focus onthe people behind the research it features.
I think iLEAPS could work to address thecurrent demand for multi- and interdiscipli-nary preparation by expanding the trainingoffer in a systematic manner with, forinstance, an annual summer school forstudents and ECSs offering both basicdisciplinary lectures and thematic work-shops on Earth System science.
with other ECSs, which spilled over intothe iLEAPS/GEWEX conferences. In theupcoming ECSW in Garmisch–Partenkirchen,it would be nice to see if I could somehowlink my research with others to build some-thing even greater than the parts. ■
iLEAPS Newsletter Issue No. 10 ◆ November 201042
iLEAPS organised and co–sponsored 10sessions at EGU2010. Six belonged to a seriesof sessions called Biosphere–AtmosphereInteractions (BAI).
❏ BG2.9/AS4.20 BAI session: Carbon andwater cycles at multiple spatial andtemporal scales.Conveners: M. Reichstein,A. D. Richardson, C. Beer, D. Papale
❏ BG2.3/AS4.17 BAI session: Trends andtemporal variability in biogeochemicalsurface fluxes.Conveners: P. Stoy,S. Luyssaert, A. D. Richardson
❏ BG2.1 Biotic interactions andbiogeochemical processes.Conveners: M. Bahn,R. Bardgett, M. Reichstein
❏ BG2.2/AS4.16 BAI session: From biogenicprimary exchange to atmospheric fluxesof reactive trace gases.Conveners: J. Kesselmeier,J. Rinne, J. P. Schnitzler
❏ BG2.5/AS4.18 BAI session: Improvingmeasurements and models of soilrespiration and its components.Conveners: J. Subke,M. Khomik, M. Carbone, P. Stoy
❏ CL1.22 BAI session: Feedbacks in theglobal Earth system in the past, present,and future.Conveners: M. Claussen, V. Brovkin
❏ HS6.9 BAI session: Production, transport,and emission of trace gases from thevadose zone to the atmosphere.Conveners: L. Weihermueller, M. Lamers
❏ CL2.7/HS5.6 Land–climate interactionsfrom models and observations:Implications from past to future climate.Conveners: B. van den Hurk,S. Seneviratne, P. Ciais
❏ CL2.4 Shifting Seasons: Phenologicalevidence from observations, recon-structions, measurements and models(co–sponsored by PAGES & ILEAPS).Conveners: T. Rutishauser, A. Menzel,J. Weltzin
❏ AS2.1 Air–Land Interactions.Conveners: Ibrom, T. Foken
The aim of the 2nd Workshop of ABBA (COSTAction ES0804: Advancing the integratedmonitoring of trace gas exchange betweenbiosphere and atmosphere) was to deter-mine and assess deliverables and tasks foreach of the four working groups (WG1–4).23 Management Committee members werepresent along with two invited speakers,Prof. Kazimierz Rózanski from AGH (AkademiaGórniczo–Hutnicza) University of Science andTechnology, Krakow, Poland (“Greenhousegases in urban atmosphere of Krakow:Assessing local loads and fluxes of CO2 andCH4”) and Dr. Christian Bernhofer from theTechnical University of Dresden, Germany(“Long–term monitoring of water, carbonand N fluxes from different land–uses.The Tharandt cluster of sites.”).
Among the discussed deliverables andtasks were:
WG1 Analysis and synthesis of the currentstate of the flux monitoring sites, measure-ment techniques, data handling methodsand storage of data in Europe:
❏ Review of available flux datawith the aid of a questionnaire
❏ Added value of this datafor different user communities
❏ Guidelines for the measurements andalso to increase harmonisation amongsites.
WG2 Work towards comprehensive multi–species flux monitoring sites:
❏ Measurement wish lists for differentmodels
❏ Updated flux measurement methodologyreview paper
❏ Synthesis paper on multispecies sites toshow their added value.
WG3 Assessing regional representativenessof the flux sites in different ecosystems:
The conference covered all main fields ofaerosol science and technology. Recentachievements presented in the conferencecovered multiple scales and disciplines, forinstance, from nanomaterials to globalclimate. The plenary speakers were:
❏ Ingwald Obernberger: “Aerosols frombiomass combustion plants – formation,characterisation and emissions”
❏ Hanna Vehkamäki: “Molecular modellingof atmospheric clusters”
❏ Juan Fernández De La Mora: “ Charging,electrical classification and vapor conden-sation on sub–3–nm aerosols”
❏ Chandra Venkataraman: “Integrating anunderstanding of aerosol sourc–receptorrelationships and climate perturbation:from challenge to opportunity”
❏ Mansoo Choi: “Aerosol assembly ofnanoparticles and its applications”.
iLEAPS co–chair Professor MarkkuKulmala was awarded the Fuchs MemorialAward, recognising outstanding worldwidecontributions to the field of aerosol research.It is the premier international prize in aerosolscience, presented every four years at theInternational Aerosol Conference by theAmerican Association for Aerosol Research,Gesellschaft für Aerosolforschung, and theJapan Association of Aerosol Science andTechnology.www.atm.helsinki.fi/IAC2010
European Geosciences Union (EGU)General Assembly,Vienna, Austria,2–7 May 2010
ABBA 2nd Workshop,Krakow, Poland,21–23 June 2010
International Aerosol Conference(IAC2010),University of Helsinki,Helsinki, Finland,29 Aug – 3 Sep 2010
Meetings❏ AS3.14 From gas to particles, new
perspectives on organic compounds inthe atmosphere.Conveners: B. Noziere, M. Kulmala.
http://meetings.copernicus.org/egu2010www.egu.eu
❏ Assessment of representativity of existingsites for important European ecosystemsand hotspots of ES interactions
❏ Recommendations and key prioritiesfor optimisation of the network
❏ Guidelines on upscaling in spaceand time.
WG4 Training and capacity building:❏ ABBA training school on Flux measure-
ment techniques, sensors and databasesin Poland, 22 Aug – 4 September 2011 forapproximately 30 ABBA member countrystudents.
www.ileaps.org/multisites/cost0804

iLEAPS Newsletter Issue No. 10 ◆ November 2010 43
The International Council for Science’s global-change research programmes announce a
MAJOR INTERNATIONAL SCIENCE CONFERENCE
26-29 MarchLondon, UK
PLANET UNDER PRESSURE 2012New knowledge towards solutions
AND THEIR EARTH SYSTEM SCIENCE PARTNERSHIP
MOVING TOWARDS G L O B A L SUSTAINABILITY
The International Council for Science’s global-change research programmes sponsor a major international science conference in 2012 attracting 2500 of the world’s leading global-change researchers and policymakers.
The conference is a platform for scientists to discuss a comprehensive picture of the state of the planet, its past, and its future.
Millennium Development Goals, prediction, adaptation, vulnerability and sustainability at global and regional scales will be important themes.
The conference will be designed to feed in to the 2012 Earth Summit and will help mark a move to a new vision for global sustainability research.
www.planetunderpressure2012.net
iLEAPS Newsletter Issue No. 10 ◆ November 201044
iLEAPS–RECOGNISED PROJECTS
Pavel Kabat (Co–Chair), Earth System Science & Climate ChangeGroup, Climate Change and Biosphere Centre, WageningenUniversity and Research Centre, Wageningen, NetherlandsMarkku Kulmala (Co–Chair), Dept. Physics,University of Helsinki, Helsinki, FinlandMeinrat O. Andreae (Past Chair), Biogeochemistry Department,Max Planck Institute for Chemistry, Mainz, GermanyAlmut Arneth, Dept. Physical Geography andEcosystems Analysis, Lund University, Lund, SwedenPaulo Artaxo, Dept. Applied Physics, Institute of Physics,University of São Paulo, São Paulo, BrazilGordon Bonan, Climate and Global Dynamics Division, NationalCenter for Atmospheric Research (NCAR), Boulder, Colorado, USATorben R. Christensen, Dept. Physical Geography andEcosystems Analysis, Lund University, Lund, SwedenAijun Ding, Institute for Climate and Global Change Research(ICGCR), School of Atmospheric Sciences, Nanjing University, ChinaLaurens Ganzeveld, Dept. Environmental Sciences,Earth System Sciences Group, Wageningen Universityand Research Centre, Wageningen, Netherlands
Alex Guenther, Atmospheric Chemistry Division, NationalCenter for Atmospheric Research (NCAR), Boulder, Colorado, USA
Sandy Harrison, School of Geographical Sciences,University of Bristol, Bristol, UKFrancesco Loreto, National Research Council of Italy (CNR),Firenze, ItalyNathalie de Noblet–Ducoudré, Laboratoire des Sciencesdu Climat et de l’Environnement (LSCE),Gif–sur–Yvette cedex, FrancePaul I. Palmer, Quantitative Earth Observation, School ofGeoSciences, University of Edinburgh, Edinburgh, UKAndy Pitman, Climate Change Research Centre,The University of New South Wales, Sydney, AustraliaMarkus Reichstein, Biogeochemical Model–Data IntegrationGroup, Max Planck Institute for Biogeochemistry, Jena, GermanyNobuko Saigusa, Office for Terrestrial Monitoring, Centerfor Global Environmental Research, National Institute forEnvironmental Studies, Tsukuba, JapanSonia I. Seneviratne, Institute for Atmospheric andClimate Science, ETH Zurich, Switzerland
Maria Assunção Faus da Silva Dias, Dept. AtmosphericScience, Institute of Astronomy, Geophysics and AtmosphericScience, University of São Paulo, São Paulo, Brazil
iLEAPS SCIENTIFIC STEERING COMMITTEE 2010
iLEAPS-GEIA
ACPC
LUCID