Embed Size (px)
Citation preview

The Pacific Journal of Science and Technology –274– http://www.akamaiuniversity.us/PJST.htm Volume 16. Number 2. November 2015 (Fall)
Integrated Geophysical Survey for Post-Foundation Studies in a Typical Basement Complex of Southwestern Nigeria.
Omowumi Ademila, M.Sc.
Department of Earth Sciences, Adekunle Ajasin University, Akungba-Akoko, Nigeria.
E-mail: [email protected]
ABSTRACT An integrated geophysical survey was carried out around a story building in southwestern Nigeria, with a view to determining the reason(s) for the development of cracks on the walls of the building; increasing the safety factor, ensuring integrity of the building and assisting in the future planning for the construction of new buildings in the area. The geophysical methods used for the investigation were the Very Low Frequency Electromagnetic (VLF-EM) and Electrical Resistivity methods involving Schlumberger and 2-D dipole-dipole arrays. The VLF-EM measurements were taken at an interval of 5 m along eight traverses. Using the VLF-EM method was a guide, from which twenty VES stations were occupied from the results in the study area. The 2-D dipole-dipole array was employed for the subsurface imaging. The acquired data were processed and interpreted to show the shallow structural setting in the area. Integrated interpretation led to the delineation of vertical and sub-vertical linear features such as faults, fracture zones, depressions, and geologic contacts. The combined geophysical results revealed four distinct subsurface geo-electric layers which comprised of topsoil, weathered layer, fractured layer and fresh bedrock. The undulating nature of the bedrock topography was shown with depth to bedrock between 3.5 and 12.6 m. The weathered layer beneath the topsoil upon which the foundation was formed displayed relatively low resistivity ranging from 42–151 Ohm-m typical of incompetent clayey/silty formation. These features and the clayey formations must have been responsible for the rock instability with the attendant cracks observed on the building.
(Keywords: electromagnetic, electrical resistivity, depressions, rock instability, dipole-dipole array)
INTRODUCTION The very high rate of failures of engineering structures such as roads, buildings, dams, and bridges have been a major concern to the various tiers of government, engineering geologists, architects, researchers, and the communities at large in Nigerian society. It is no longer considered news as these occurrences happen almost every day throughout the nation. The availability of soil makes it an indispensable and important material for construction on which engineering structures are placed except when erected on rocks. A basic understanding of certain physical characteristics of soil will aid the engineering geologists in evaluating soils and their uses because a balanced interaction of the soil and structure must be ensured as this form the basis of a successful design of foundation. Poor soil stability has posed problems for nearby engineered works because of the sensitivity of some soils to moisture gain or loss. Clayey soils expand when saturated and shrink in volume when there is loss of water in them. As the soil goes through wet and dry periods, the soil expands and shrinks. Structures built on top of the clay soil rise and fall with the soil which result to “differential” foundation movement which leads to cracking and distress. Therefore, in-depth understanding of the behavior and characteristics of soils like swelling and shrinkage of soil is very vital in solving engineering problems associated with the construction of dams, highways, buildings and bridges. Foundation cracks on buildings occur as a result of differential movement on the building. The size, shape, pattern and location of foundation cracks on a building, when correlated with other site and construction conditions, help to distinguish among probable causes of foundation based failures (Tim, 2002). Settlement could be as a result of weakness of the soil beneath the

The Pacific Journal of Science and Technology –275– http://www.akamaiuniversity.us/PJST.htm Volume 16. Number 2. November 2015 (Fall)
foundation or beneath the building’s column supports, unstable soil, structures above concealed cavities or organic material, expansive soils, lifting by growth of ice, shock, vibration or regional subsidence, hydration of anhydrite in rocks on which they are founded, foundation located on landslides. The degree of damage caused by settlement is to some extent dependent on the sequence and time of construction operations (Tomlingson and Boorman, 1999; Sands, 2002). Recently, a valid alternative to direct investigation methods, in order to study the stability of galleries, foundation, etc., is the use of the geophysical surveys. Although in many cases in the assessment and monitoring phases, direct methods, such as drillings are used to establish the stability, yet such methods may damage the structure and may often be very costly and provide information that cannot always be extrapolated to large areas (Leucci and De Giorgi, 2005). Meanwhile, geophysical techniques are generally quick, inexpensive and generally non-destructive to provide information about the subsurface properties, depth to bedrock, location and distribution of conductive fluids, location and
orientation of fractures and faults with accuracy in the shallow subsurface (Reynolds, 1997). Environmental and engineering applications of surface geophysical techniques such as the Electrical Resistivity (ER), Seismic Refraction, Electromagnetic (EM), Magnetic and Ground Penetrating Radar are used singly or in combinations for engineering site investigation. The applications of such geophysical investigation were determination of depth to bedrock, structural mapping and evaluation of subsoil competence. Factors responsible for failures of engineering structures include poor construction materials, non-compliance to specifications, inadequate supervision and nature of the subsurface conditions of the ground on which the buildings is sited. This study assesses the use of geophysical methods for post-foundation studies at the Faculty of Education, Adekunle Ajasin University, Akungba Akoko. This is essential as a result of crack (gradual failure of the building) noticed from the first to the ground floor of the story building (Figure 1). This is to determine the reasons for the development of cracks on the walls of the building in order to increase the safety factor and ensure integrity of the building.
Figure 1: Crack from First to the Ground Floor of the Story Building.

The Pacific Journal of Science and Technology –276– http://www.akamaiuniversity.us/PJST.htm Volume 16. Number 2. November 2015 (Fall)
LOCATION AND GEOLOGY OF STUDY AREA The study area is the Faculty of Education building in Adekunle Ajasin University, Akungba-Akoko, Nigeria which consists of offices. It is a story building donated by Access Bank (formerly Intercontinental Bank). It lies between latitudes 7° 27' 21.6”N and 7° 29' 14.46”N and longitudes 5° 43' 33.84” and 5° 44' 53.34” East. The study area lies within the Precambrian Basement Complex rocks of southwestern Nigeria, underlain by migmatite- gneiss- quartzite complex with the granite gneiss and grey gneiss being the major units (Figure 2) while the minor units include mafic, granodiorite, pegmatite, garnet-sillimanite gneiss and quartzite (Rahaman, 1988). Based on field observations, the identified lithological units comprise of migmatite gneiss, charnokitic rocks and fine to medium grained biotite granite. Migmatite gneiss are dominant in the study area which are extensively weathered and fractured, with prominent direction of foliation lying between 176
0 and 184
0 with easterly dips of
440 and 76
0. They occur as ridges and hills which
contain quartz veins, dykes, quartzo-feldspathic intrusion and pegmatitic veins usually very extensive. The granite forms the basement lithology in some other parts of the study area. These rocks are generally trending in N-S direction typical of the basement complex rocks. Structural features such as faults, joints, xenoliths, folds, dykes etc. characterize the rocks. The older
granite of the study area is grey with a speckled appearance caused by the darker crystals. MATERIALS AND METHODS The geologic mapping of the area involves studying of rock outcrops and their distribution on the environment of the study area, road networks and major features so as to produce a sketch map of the study area. Eight geophysical traverses (p1-p8) were established in an approximately NW-SE direction within the survey area. The profiling technique was employed for the VLF-EM using a station separation of 5 m along the established traverses and perpendicular to the transmitter signal direction. The VLF-EM and the electrical resistivity geophysical methods were used in this survey. The electrical resistivity method utilized the Vertical Electrical Sounding (VES) and the dipole – dipole profiling techniques to image the subsurface. The EM measurement engaged the ABEM WADI equipment, which measures the in-phase (Real) and quadrature (Imaginary) components of the induced vertical magnetic field as a percentage of the horizontal primary field along the eight profiles. Measurements were taken at 5 m intervals along each of the profiles lines in the West-East direction. The VLF-EM data was interpreted and inverted into a 2-D section using the Karous-Hjelt and Fraser filtering (Pirttijarvi, 2004).
Figure 2: Geological Map of Akungba Akoko showing Study Area (from Geological Map of Ondo State).

The Pacific Journal of Science and Technology –277– http://www.akamaiuniversity.us/PJST.htm Volume 16. Number 2. November 2015 (Fall)
Figure 3: Geophysical Field Layout map of the Study Area. Twenty Schlumberger depth Soundings were conducted (Figure 3), at selected locations based on the results obtained from the VLF surveys along the traverses. The VES data interpretation involved the convectional preliminary partial curve matching (Patra and Nath, 1998) The model derived from the manual interpretation was iteratively adjusted, using Win RESIST version 1.0 (Vander Velper, 2004) software, to get a better fit in each case. The 2-D subsurface imaging was carried out with the dipole – dipole profiling. Measurements were made at electrode spacing of a = 5 m and expansion factor of n, varying from 1 – 5 depending on the length of each profile. A few electrodes were skipped during the data acquisition because of the presence of features like concrete slabs and road tars but it was ensured that the ground was having a firm contact with the electrodes insertion. The dipole – dipole data were inverted into 2-D resistivity structures, using the DIPRO for Windows (2000) software.
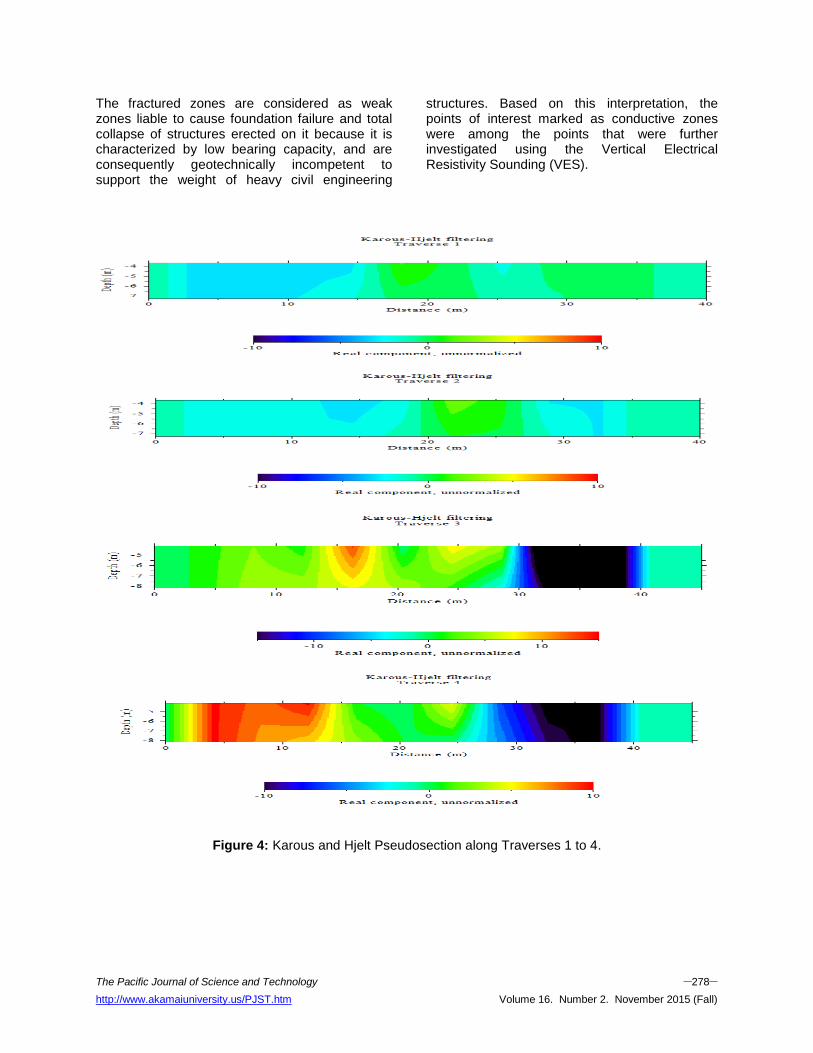
RESULTS AND DISCUSSION The K-H pseudo-section of the profile which is a measure of conductivity of the subsurface as a function of depth is shown in Figures 4 and 5. This conductivity is shown as color codes with response increasing from left to right (i.e. from negative to positive). The 2-D model section of the EM filtered real profiles reveal points showing conductive zones. Major conductive features of varying degree of conductivity trending in different directions were delineated on the sections, for instance, between distances 17 – 24 m and 29 – 37 m conductive features are shown along traverse 1. Similarly, between distances 19 – 27 m, 3 – 28 m and 2 – 25 m are other conductive bodies along traverses 2, 3, and 4, respectively all trending in the NW-SE directions. The same process of qualitative interpretation was adopted for the remaining pseudo-sections. The identified conductive zones (anomalies in yellow – reddish color bands) are suspected to be fault/fracture zones and sheared zones within the bedrock.
The Pacific Journal of Science and Technology –278– http://www.akamaiuniversity.us/PJST.htm Volume 16. Number 2. November 2015 (Fall)
The fractured zones are considered as weak zones liable to cause foundation failure and total collapse of structures erected on it because it is characterized by low bearing capacity, and are consequently geotechnically incompetent to support the weight of heavy civil engineering
structures. Based on this interpretation, the points of interest marked as conductive zones were among the points that were further investigated using the Vertical Electrical Resistivity Sounding (VES).
Figure 4: Karous and Hjelt Pseudosection along Traverses 1 to 4.

The Pacific Journal of Science and Technology –279– http://www.akamaiuniversity.us/PJST.htm Volume 16. Number 2. November 2015 (Fall)
Figure 5: Karous and Hjelt pseudosection along Traverses 5 to 8. Resistivity Sounding Curves and Geoelectric Sections The resistivity sounding curves identified in the study area are H and HA type which constitute 50% each. The geoelectric sections along the traverses (Figure 6) show maximum of four geologic subsurface layers comprising the top soil, weathered layer, fractured basement and fresh bedrock. The topsoil varies in composition from sandy clay to clayey sand with resistivity values ranging from 161 – 364 Ωm and the
thickness varies from 0.7 m – 3.7 m. The topsoils are generally thin with the predominant thickness generally less than 2 m except beneath VES stations 2, 3, 4, and 6. The resistivities of the weathered layer are generally less than 100 Ωm except beneath VES station7 with resistivity value of 151 Ωm which are typical of clayey materials. The thickness varies from 1.7 m to 9.5 m. Adequate measures should be taken since part of the study area is consisting of clay and clayey sands at shallow

The Pacific Journal of Science and Technology –280– http://www.akamaiuniversity.us/PJST.htm Volume 16. Number 2. November 2015 (Fall)
depths to avoid foundation failure or sudden collapse of engineering structures (Oluwafemi and Ogunribido, 2014). 50% of the VES curves indicate subsurface partly weathered/fractured basement classified as fractured unconfined (with HA type curve) basement column. The layer resistivity values vary from 574 – 894 Ωm while its thickness ranges from 6.1 – 12.0 m.
The basement resistivity values range from 1047 Ωm to infinity which is an evidence of fresh basement bedrock. The depth to the bedrock varies from 3.5 to 12.6 m. The structural failure related cracks on the building is also due to the presence of near surface bedrock depressions, occupied by low resistivity weathered materials typical of water-saturated clays which is unsuitable construction materials.
Figure 6: Geoelectric Sections across Study Area along NW-SE (a & c) and NE-SW (b & d) directions.
d
a
b
c

The Pacific Journal of Science and Technology –281– http://www.akamaiuniversity.us/PJST.htm Volume 16. Number 2. November 2015 (Fall)
Dipole-Dipole Pseudosections The 2-D pseudosection was produced from the dipole- dipole data taken along four traverses indicating the lateral variation of the subsurface lithology with depth (Figure 7 a, b, c & d). This gives similar information as the geoelectric sections. It delineated topsoil, weathered layer, fractured layer and the fresh bedrock. The highly resistive parts are seen at the lower part of the sections which is the fresh bedrock while the green and blue colored parts are the weathered/fractured part of the sections. Traverse 1 This profile (Figure 7) shows four distinct geologic layers. The first layer is a relatively resistive layer having resistivity values in the range of 102 – 498 Ohm-m which can be observed across the section at depths between 0 – 3 m. This area indicates the presence of clay/sandy clay/clayey sand. Beneath this layer is a very low resistivity layer of less than 100 Ohm-m as can be observed across the traverse at depths between 3 – 9 m. This layer indicates the presence of high water retaining material (clay) due to its very low resistivity value range. The third layer with resistivity values in the range of 150 – 500 Ohm-m, this layer indicates the presence of a weathered/fractured basement material at depths between 9 – 15m, stretches across the section. However, a medium of more resistive layer having resistivity values in the range of 532 – 3387 Ohm-m, indicating the presence of a fractured/fresh basement rock. Traverse 2 This traverse (Figure 8) shows relatively thick layer topsoil (about 5 m thick) with the resistivity ranging from 104 – 649 Ohm-m composed of clay/sandy clay/clayey sand/laterite. Below this unit is a conductive layer of about 5 m thick forming closures and have resistivity values less than 100 Ohm-m. Below this conductive layer is another layer of resistive material with resistivity in the range of 150 – 692 Ohm-m which indicates the presence of a weathered/fractured basement material at
depths between 10 – 16 m, stretches across the section. The fourth layer having resistivity values ranging from 731 – 3390 Ohm-m with depths in the range of 15 m to infinity. Traverse 3 This traverse (Figure 9) clearly shows that the topsoil is composed of clayey sand/laterite with resistivity values varying from 332 – 590 Ohm-m. The weathered layer ranges in composition from clay and sandy clay with resistivity values that vary between 20 and 217 Ohm-m and depth of between 2 – 10 m. The third layer with resistivity values in the range of 351 – 903 Ohm-m stretches across the section. It ranges in depth of between 10 – 17 m. This layer indicates the presence of a weathered/fractured basement material. However, a medium of very high resistivity values in the range of 903 – 1619 Ohm-m as can be observed at depths of 17 m to infinity indicating the presence of a fresh basement rock. Traverse 4 The resistivity section of traverse 4 (Figure 10) shows resistive topsoil which composed of clayey sand/laterite with resistivity values varying from 302 – 833 Ohm-m. Beneath this layer, is a pocket of conducting material forming a closure with resistivity values varying from 50 – 150 Ohm-m at depth between 5 m – 10 m. This layer indicates the presence of high water retaining material due to its very low resistivity value range. The third layer with resistivity values in the range of 274 – 500 Ohm-m at depth between 10 – 15 m which indicates the presence of a weathered/fractured basement material. The fourth layer is a resistive layer with resistivity values varying from 837 – 1510 Ohm-m indicating the presence of a fresh basement rock.

The Pacific Journal of Science and Technology –282– http://www.akamaiuniversity.us/PJST.htm Volume 16. Number 2. November 2015 (Fall)
Figure 7: 2-D Subsurface Resistivity Images along Traverse 1.
Figure 8: 2-D Subsurface Resistivity Images along Traverse 2.

The Pacific Journal of Science and Technology –283– http://www.akamaiuniversity.us/PJST.htm Volume 16. Number 2. November 2015 (Fall)
. Figure 9: 2-D Subsurface Resistivity Images along Traverse 3.
Figure 10: 2-D Subsurface Resistivity Images along Traverse 4.

The Pacific Journal of Science and Technology –284– http://www.akamaiuniversity.us/PJST.htm Volume 16. Number 2. November 2015 (Fall)
CONCLUSIONS The geophysical methods involving the Very Low Frequency Electromagnetic method, Vertical Electrical Sounding and 2-D electrical imaging have served as a useful tool for post foundation studies in order to show the inhomogeneous subsurface geologic setting underlying the building which has helped in the determination of the incompetent zones in the study area. The weathered layer beneath the topsoil upon which the foundation was formed displayed relatively low resistivity ranging from 42 – 151 Ohm-m typical of incompetent clayey formation with thickness which varies from 1.7 m to 9.5 m. Structural failure related cracks on the building is due to the presence of these underlying geological structures, active clay at shallow depths and the occurrence of near surface bedrock depressions, occupied by low resistivity weathered materials, typical of water-saturated clays which is unsuitable construction materials. Future planning for the construction of new buildings in the area should be erected on the fresh bedrock with pile foundation since the fresh bedrock lies beneath the fractured basement to ensure the integrity of buildings. This study has revealed that thorough and detailed geophysical/geotechnical investigation acts as a necessary task needed to be carried out before constructing any engineering structure as it guarantees post construction stability to avoid structural failure of foundation itself and undue loss of lives and properties. ACKNOWLEDGEMENTS I wish to acknowledge the Department of Earth Sciences, Adekunle Ajasin University, Akungba-Akoko for the provision of equipment and the effort of the technologist for his assistance during data acquisition. REFERENCES 1. DIPPRO for Windows 2000. DipproTM Version 4.0
Processing and Interpretation software for Dipole – Dipole electrical resistivity data. KIGAM, Daejon, South Korea.
2. Leucci, G. and L. De Girogi. 2005. “Integrated Geophysical Surveys to assess the Structural
Conditions of a Karstic Cave of Archaeological Importance”. Natural Hazards and Earth System Sciences. 5:17-22.
3. Oluwafemi, O. and T.H.H. Ogunribido. 2014.
“Integrated Geophysical and Geotechnical Assessment of the Permanent Site of Adekunle Ajasin University, Akungba Akoko, Southwestern Nigeria”. Advances in Applied Science Research. 5(2):199-209.
4. Patra, H.P. and S.K. Nath. 1998. “Schlumberger Geoelectric Sounding in Ground Water”. Principles, Interpretation and Application. A.A. Balkema Publishers: Boca Raton, FL. 153.
5. Pirttijarvi, M. 2004. KHFfilt Program, A Geophysical Software for Karous-Hjelt and Fraser Filtering on Geophysical VLF (Very-Low Frequency) Data, Geophysics Division Department of Geosciences, University of Oulu: Oulu, Finland.
6. Reynolds, J.M.1997. An introduction to Applied and Environmental Geophysics. John Wiley and Sons, Ltd.: West Sussex, England. 796.
7. Sands, T.B. 2002. “Buildings Stability and Tree Growth for in Swelling London Clay-Implications for Pile Foundation Design”. www.agu.org.
8. Tim, C. 2002. “House Foundation. Ask the
Builder”. Nationality Syndicated Newspaper Columnist. www.askthebuilder.com.
9. Tomlingson, M.J. and R. Boorman. 1999.
Foundation Design and Construction. Longman Scientific and Technical: Singapore. 1- 125.
10. Vander Velpen, B.P.A. 2004. Win RESIST Version 1.0 Resistivity Depth Sounding Interpretation Software. M.Sc. Research Project, ITC, Delft Netherland.
ABOUT THE AUTHOR Omowumi Ademila, is a member of the Department of Earth Sciences, Adekunle Ajasin University, P.M.B. 001, Akungba- AKoko, Ondo State, Nigeria with research interests in environmental and engineering geophysics.

The Pacific Journal of Science and Technology –285– http://www.akamaiuniversity.us/PJST.htm Volume 16. Number 2. November 2015 (Fall)
SUGGESTED CITATION Ademila, O. 2015. “Integrated Geophysical Survey for Post-Foundation Studies in a Typical Basement Complex of Southwestern Nigeria”. Pacific Journal of Science and Technology. 16(2):274-285.
Pacific Journal of Science and Technology