Embed Size (px)
Citation preview

Integrated Phase Classification 1 Pilot
Integrated Food Security And
Humanitarian Phase Classification
WFP
World Food Programme
Pilot in Tajikistan
April 2008

Integrated Phase Classification i Pilot
List of Abbreviations
AKRSP Agha Khan Rural Support Programme CFSAM Crop and Food Security Assessment Mission CMR Crude Mortality Rate DRD Direct Rule Districts IPC Integrated Food Security and Humanitarian Phase Classification EC European Commission FAO Food and Agriculture Organization FCF Food Coordination Forum FNPP FAO/Netherlands Partnership Programme FS Food Security FSMS Food Security Monitoring System FSWG Food Security Working Group GBAO Gorno Badakhshan Autonomous Oblast GoT Government of Tajikistan Ha Hectares HIV Human immunodeficiency virus HPG Humanitarian Policy Group IDS Institute of Development Studies IMR Infant Mortality Rate KT Kurgan-Tyube KY Kulyab MICS Multiple Indicator Cluster Survey MT Metric Tonnes MSDSP Mountain Societies Development Support Programme NGO Non Governmental Organization NNS National Nutrition Survey ODI Overseas Development Institute SENAC Strengthening Emergency Needs Assessment Capacity SC Steering Committee TWG Technical Working Group U5MR Under Five Mortality Rate UN United Nations UNICEF United Nations Children’s Fund UNCU United Nations Coordination Unit VAM Vulnerability Analysis and Mapping WFP World Food Programme

Integrated Phase Classification ii Pilot
Table of Contents 1.0 Executive Summary 1 2.0 Introduction 2 2.1 IPC Pilot 2 2.2 Background 3 2.3 Integrated FS and Humanitarian Phase Classification 4 3.0 Methodology 6
3.1 Awareness Workshop 6 3.2 Situation Analysis Workshop 6 3.3 Response Analysis Workshop 7 3.4 Response Options 8
3.5 Field Work 9 3.6 Constraints 9
4.0 Classification 11 4.1 Region 11 4.2 Ecological Zoning 11 4.3 Food Security Factors 11 4.4 Wheat Quality 13 4.5 Assessment 13 4.6 Representative Jamoats 14 5.0 Food Security Monitoring System 16 6.0 Conclusions, Recommendations and Lessons Learnt 19 6.1 Conclusions 19 6.2 Recommendations 20 6.3 Lessons Learnt 20 6.3.1 IPC as an Analysis Tool 20 6.3.2 IPC as a Targeting Tool 22 6.3.3 IPC as a Monitoring Tool 22
6.3.4 IPC Partners 23

Integrated Phase Classification iii Pilot
List of Maps and Tables Maps
Situation Analysis Food Insecurity Map 2005 Vulnerability Map 2003 Vulnerability Elevation Slope Ecological Zoning Livestock: Cows Livestock: Sheep and Goats Per Capita Wheat Production Area Under Cotton Crop Hazards Dominant Livelihoods Health Education Wheat Consumption Key Underlying Causes Response Trend Confidence Level Representative Jamoats
Tables Template 1: Analysis of Key Reference Outcomes and Evidence:
DRD, Sughd, GBAO, Khatlon Template 2: Analysis of Immediate Hazards, Effects on Livelihood Strategies
and Implications for Immediate Response Template 3: Analysis of Underlying Structures, Effects and Response Opportunities for Medium and Long Term Template 4: Phase 2 Sub-Classification Table 1: Food Security Factors
Table 2: Assessment Table 3: Representative Jamoats Table 4: FSMS Design Criteria Table 5: Outline for FSMS Webpage
Appendix Jamoat Classification Workshop Powerpoint Presentations Workshop Participants’ List References
Integrated Phase Classification 1 Pilot
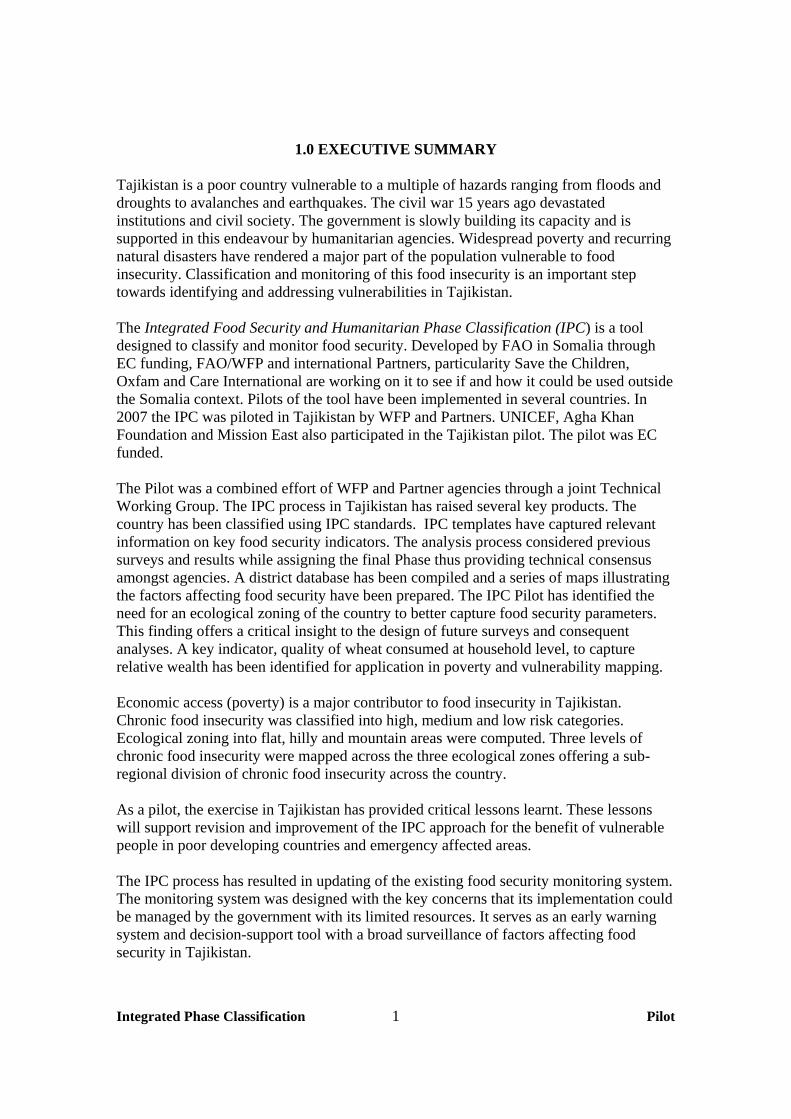
1.0 EXECUTIVE SUMMARY
Tajikistan is a poor country vulnerable to a multiple of hazards ranging from floods and droughts to avalanches and earthquakes. The civil war 15 years ago devastated institutions and civil society. The government is slowly building its capacity and is supported in this endeavour by humanitarian agencies. Widespread poverty and recurring natural disasters have rendered a major part of the population vulnerable to food insecurity. Classification and monitoring of this food insecurity is an important step towards identifying and addressing vulnerabilities in Tajikistan.
The Integrated Food Security and Humanitarian Phase Classification (IPC) is a tool designed to classify and monitor food security. Developed by FAO in Somalia through EC funding, FAO/WFP and international Partners, particularity Save the Children, Oxfam and Care International are working on it to see if and how it could be used outside the Somalia context. Pilots of the tool have been implemented in several countries. In 2007 the IPC was piloted in Tajikistan by WFP and Partners. UNICEF, Agha Khan Foundation and Mission East also participated in the Tajikistan pilot. The pilot was EC funded. The Pilot was a combined effort of WFP and Partner agencies through a joint Technical Working Group. The IPC process in Tajikistan has raised several key products. The country has been classified using IPC standards. IPC templates have captured relevant information on key food security indicators. The analysis process considered previous surveys and results while assigning the final Phase thus providing technical consensus amongst agencies. A district database has been compiled and a series of maps illustrating the factors affecting food security have been prepared. The IPC Pilot has identified the need for an ecological zoning of the country to better capture food security parameters. This finding offers a critical insight to the design of future surveys and consequent analyses. A key indicator, quality of wheat consumed at household level, to capture relative wealth has been identified for application in poverty and vulnerability mapping. Economic access (poverty) is a major contributor to food insecurity in Tajikistan. Chronic food insecurity was classified into high, medium and low risk categories. Ecological zoning into flat, hilly and mountain areas were computed. Three levels of chronic food insecurity were mapped across the three ecological zones offering a sub-regional division of chronic food insecurity across the country. As a pilot, the exercise in Tajikistan has provided critical lessons learnt. These lessons will support revision and improvement of the IPC approach for the benefit of vulnerable people in poor developing countries and emergency affected areas. The IPC process has resulted in updating of the existing food security monitoring system. The monitoring system was designed with the key concerns that its implementation could be managed by the government with its limited resources. It serves as an early warning system and decision-support tool with a broad surveillance of factors affecting food security in Tajikistan.
Integrated Phase Classification 2 Pilot
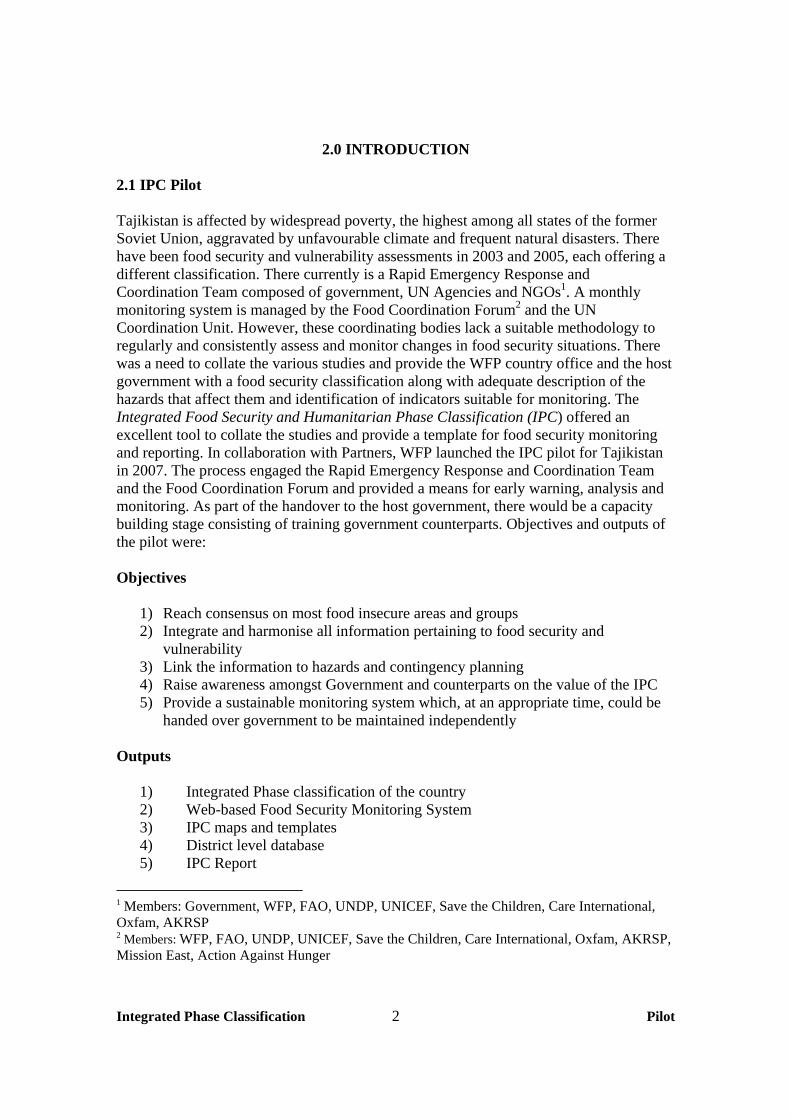
2.0 INTRODUCTION 2.1 IPC Pilot Tajikistan is affected by widespread poverty, the highest among all states of the former Soviet Union, aggravated by unfavourable climate and frequent natural disasters. There have been food security and vulnerability assessments in 2003 and 2005, each offering a different classification. There currently is a Rapid Emergency Response and Coordination Team composed of government, UN Agencies and NGOs1. A monthly monitoring system is managed by the Food Coordination Forum2 and the UN Coordination Unit. However, these coordinating bodies lack a suitable methodology to regularly and consistently assess and monitor changes in food security situations. There was a need to collate the various studies and provide the WFP country office and the host government with a food security classification along with adequate description of the hazards that affect them and identification of indicators suitable for monitoring. The Integrated Food Security and Humanitarian Phase Classification (IPC) offered an excellent tool to collate the studies and provide a template for food security monitoring and reporting. In collaboration with Partners, WFP launched the IPC pilot for Tajikistan in 2007. The process engaged the Rapid Emergency Response and Coordination Team and the Food Coordination Forum and provided a means for early warning, analysis and monitoring. As part of the handover to the host government, there would be a capacity building stage consisting of training government counterparts. Objectives and outputs of the pilot were: Objectives
1) Reach consensus on most food insecure areas and groups 2) Integrate and harmonise all information pertaining to food security and
vulnerability 3) Link the information to hazards and contingency planning 4) Raise awareness amongst Government and counterparts on the value of the IPC 5) Provide a sustainable monitoring system which, at an appropriate time, could be
handed over government to be maintained independently Outputs
1) Integrated Phase classification of the country 2) Web-based Food Security Monitoring System 3) IPC maps and templates 4) District level database 5) IPC Report
1 Members: Government, WFP, FAO, UNDP, UNICEF, Save the Children, Care International, Oxfam, AKRSP 2 Members: WFP, FAO, UNDP, UNICEF, Save the Children, Care International, Oxfam, AKRSP, Mission East, Action Against Hunger

Integrated Phase Classification 3 Pilot
6) CD containing report, data, maps and analysis 2.2 Background Tajikistan is a mountainous, landlocked low-income food-deficit country of some 6.7 million people3. Despite notable economic growth rates in recent years, sixteen years after independence and after a devastating civil war in the 1990s, it remains the poorest country in the Eastern Europe and Central Asia region, ranked 122nd out of 177 countries listed in the 2006 Human Development Index4, down from a ranking of 103 in 2001 and 112 in 2002.
Based on a poverty threshold of per capita earnings of US$2.15/day, the World Bank estimated that 64 percent of Tajik population were living below the poverty line in 2003 and some 18 percent fell in the extreme poor category, below $US 1.08/day. There is a wide income gap between rich and poor with the poor spending some 80 percent of their income on food. Some 76 percent of the country’s poor live in rural areas with the rural population representing three-fourths of total population.
Social indicators are significantly lower than pre-independence levels due to poverty and deterioration of basic health, education and social infrastructure and services. Health indicators are comparable to some of the world’s poorest countries, with the highest IMR in Central Asia (89/1000 live births), child mortality at 100/1000 and maternal mortality rate at 120/100,0005 and a high incidence of infectious diseases, diarrhoea, and malaria. Tuberculosis levels are high with prevalence 277 per 100,0006 as is the incidence of endemic goitre with 45-82 percent among children and 60 percent among women of reproductive age affected in different regions. HIV infection is rapidly spreading expected to rise from some 7,000 cases at the end of 2005 to over 10,000 cases by the end of 20067. To confront these challenges the government of Tajikistan is spending less than $US 1 per capita per year on health services.
Tajikistan is one of the few countries in the world where men and women aged between 20 and 30 have a much lower level of education, compared to the older generation of above 40 years old. The education system is characterized by falling attendance rates since 1990 when attendance was 90% whilst in 2000 this was 78%. Although Tajikistan is a food deficit country, its capacity to import food is sufficient due in a large part to revenues from aluminium and cotton production which has made possible wheat imports of up to 450 thousand MT annually in recent years. During the 2005/06 marketing year, domestic production of some 834 thousand MT of cereals compared with consumption requirements of over one million MT. Despite a positive
3 FAO, Ministry of Agriculture, WFP Country Cereals Production Assessment Special Report Oct. 2005 4 UNDP Human Development Report 2006 5 World Bank Health Sector Note 6 Multiple Indicator Cluster Survey (MICS) 2005 7 UN Joint Advocacy Project brief on HIV/AIDS 2006

Integrated Phase Classification 4 Pilot
food balance at national level however, food and nutrition security at household level remains problematic.
With only 10 percent of the land suitable for cultivation, agriculture contributes to 21.6 % of the country’s GDP and employs about 66% of the workforce with cotton contributing to about one fourth of agricultural output8. Scarcity and poor quality of agricultural inputs (fertilizer/seed) as well as pest damage results in low yields.
Although most rural households have access to land, with an average plot size of 0.13 ha per household, production provides a maximum of 50 percent of a family’s annual food needs. Food purchases made to supplement household production can consume up to 80 percent of cash income of poorest households at the expense of other essential needs such as health care and education.
A national nutrition survey undertaken by the Ministry of Health in 2006 found that the prevalence of global acute malnutrition and global chronic malnutrition are 7.6 and 20.7 percent respectively. Moderate and severe underweight prevalence amongst children in the 0-59 month age group is 17 percent, of which 4 percent are severely underweight. Nearly 27 percent are stunted, of which 9 percent severely stunted and 7 percent are classified as wasted9.
With its rugged terrain, Tajikistan regularly faces small scale natural disasters such as floods, avalanches, landslides and tremors. These disasters can directly effect food security of vulnerable households and necessitate frequent emergency response. Disaster prevention and mitigation are priority concerns of the Committee of Emergency Situations and Civil Defence established to address emergency humanitarian concerns.
2.3 Integrated Food Security and Humanitarian Phase Classification Based on a global review of needs assessment practice, the Overseas Development Institute (ODI) HPG Report ‘According to Need? - Needs assessment and decision-making in the humanitarian sector’ (Darcy and Hofmann, 2003), identifies a critical gap in food security and needs assessment practice. While there is a broadly accepted definition of food security10, there is a lack of clarity and common definitions for classifying various situations in terms of varying severity and implications for action. This lack of clarity is operationally problematic because the way in which a situation is classified determines not only the form of response, but the source of funding and scale, planning timeframe and the organizational roles of different stakeholders. There is an urgent practical and operational need for a broadly accepted food security and humanitarian classification system. This ‘gap’ and lack of clarity is well recognized and appreciated by analysts, donors, governments, implementing agencies, academics and the media. Projects such as, the EC/WFP Strengthening Emergency Needs Assessment Capacity (SENAC) project, the EC/FAO Project for Linking Information to Action, and the FAO/Netherlands Partnership Programme (FNPP) all are focused on improving food 8 FAO/Ministry of Agriculture/WFP Country Cereals Production Assessment Special report, Oct 2005 pg 5 9 Multiple Indicator Cluster Survey (MICS) 2005, Oct 2006 10 Food security exists when all people, at all times, have physical and economic access to sufficient, safe and nutritious food for a healthy and active life’, World Food Summit 1996.

Integrated Phase Classification 5 Pilot
security assessment practices in order to elicit more effective response. NGO’s also are investing in improvements in assessment practices, including Save the Children, Oxfam, CARE, World Vision, and others. Also guiding and contributing to this dialogue are academic institutions, such as Institute of Development Studies (IDS) in Sussex, Tufts University, Tulane University, and ODI. The Integrated Food Security and Humanitarian Phase Classification is an attempt to bridge this ‘gap’ and provide a common framework for assessment and response analysis. Developed in Somalia, it has evolved through a series of pilots implemented across Africa and Asia. The IPC uses a set of tools including: a Reference Table, Analysis Templates and a map11. The Reference Table guides analysis for both the Phase Classification and Early Warning Levels. Geographic areas and social groups are classified into one of five phases:
1) Generally Food Secure 2) Chronically Food Insecure 3) Acute Food and Livelihood Crisis 4) Humanitarian Emergency 5) Famine/Humanitarian Catastrophe
Early Warning is divided into three levels of Alert, Moderate Risk and High Risk. The Analysis Templates are tables populating information to guide Phase determination. In addition to the source of information, the reliability level is also recorded to ensure transparency. The IPC Map is an output illustrating the Phase classification and includes drop down boxes detailing food security characteristics of different zones on the map.
11 A detailed technical description of the IPC may be found in the online manual at http://www.fsausomali.org/uploads/Other/785.pdf

Integrated Phase Classification 6 Pilot
3.0 METHODOLOGY
The IPC Tajikistan Pilot was implemented in 2007 through a series of Workshops intermittent with data collection and field work. 3.1 Awareness Workshop An Awareness Workshop was conducted in June 2007. The IPC pilot plan was announced at the monthly Food Coordination Forum. Members included FAO, UNICEF, WFP, Oxfam, Save the Children, Care International, AKRSP, Mission East and Action Against Hunger. The announcement was followed by a brief on the objectives, scope, plan and expectations from Partners of the IPC pilot. The Global partners and progress to date were presented. It was agreed that the Forum members would constitute the IPC Steering Committee. Each member appointed a nominee (with technical i.e. food security knowledge) to the Technical Working Group (TWG). An Awareness Workshop was held where TWG members were provided a description of the IPC approach including details on IPC tools: Reference Table, Thresholds and Indicators, Templates, Maps and Lessons Learnt from previous pilots. Data sources were agreed upon for populating the Templates 1, 2 and 3. In July the templates were populated and circulated amongst TWG members. Realizing the lack of updated district level data, a consultancy was raised to create a district level database of key agriculture and livestock data. The database was compiled over July and August. Database includes 2006 district level data on population, area cultivation, cereal and leguminous crop yield, area under cotton, cotton yield/ha, irrigated land, arable land, area under wheat, wheat yield/ha, gross cereal harvest, gross wheat harvest, wheat as percentage of total cereal production, area under potato, potato yield/ha, number of: cattle, cows, sheep and goats, horses and poultry. The database also includes the food balance sheet for 2006. 3.2 Situation Analysis Workshop The Situation Analysis Workshop was conducted in August. Information in IPC templates 1, 2 and 3 were used to assign IPC Phases. The TWG classified Direct Rule Districts (DRD), Sughd and Gorno Badakhshan Autonomous Oblast (GBAO). It was recommended to separate Dushanbe city from the rest of DRD. For Khatlon, the region was to be divided into Kurgan-Tyube (KT) and Kulyab (KY). Although DRD and GBAO both classified as Phase 2, the vulnerability of GBAO was far more than that of DRD. Bifurcation of Phase 2 or use of Risk Level was recommended. Additional sources of information on GBAO, KT and Sughd were identified. MSDSP, Oxfam and Mission East agreed to compile these data into Template 1. Anaemia data was given a low reliability factor since the calibration of instruments was old Soviet style with a high error factor. Regarding government statistics, it was noted there is a systemic bias in data where the government data presents a better agriculture production and health situation. It was therefore agreed that malnutrition and stunting figures from National Nutrition Survey (NNS) would be considered as the lowest threshold i.e. the indicated rates are lower than actual. It was recommended to add year 2004 nutrition statistics for comparison and

Integrated Phase Classification 7 Pilot
document where results have changed dramatically (by 30%) whereas no factors on the ground could substantiate such improvements. It was agreed, remittances are a very important part of livelihoods and should be factored in while analyzing food security of Tajikistan12. The Unit of Analysis was discussed. Administrative boundaries, valleys, district, Jamoat (sub-district) and livelihoods were considered. The government uses regions and districts for planning and programming purposes, therefore programming would eventually have to conform to administrative boundaries. However, due to the topography of Tajikistan, it was agreed, an ecological zoning of flat lands, hilly areas and high mountains would provide a better analysis of food security in the country. This zoning broadly conforms to the livelihoods: cotton production through irrigated agriculture (flat); rainfed wheat and horticulture (hilly); and potato cultivation and livestock herding (mountain). Lack of data was considered. However, it was agreed, adoption of these units would be a major step forward in understanding, monitoring and responding to food security in Tajikistan. The lack of confidence in most existing studies lies in the fact that lumping diverse areas into single units of region, skews information from presenting the actual food security situation. It was agreed to compile the data from MSDSP, Oxfam and Mission East to complete the classification along Regional Lines. Maps based on satellite imagery and administrative boundaries (Jamoat) were prepared to further analyze a vertical classification. The revised templates, maps and district level statistics were considered in the next Workshop. It was agreed that core indicators and thresholds stipulated in the IPC reference Table need not be changed. However, division of phase 2 was required. 3.3 Response Analysis Workshop The final Workshop was held in December. A summary of IPC was presented followed by a summary of Workshop I and Workshop 2. Maps produced from the district level database were presented. IPC templates 1, 2 and 3 were considered. VAM studies of 2003 and 2005 were presented. The Workshop completed the Phase classification of KT and KY. Based on all available evidence, particularly Oxfam survey 2007, a Classification of Phase 2 was assigned to KT and KY. The TWG discussed bifurcation of Phase 2. The maps and data sheets showing slopes and elevation at Jamoat level were considered. Based on all available data, IPC templates, district database, VAM studies of 2003 and 2005, and maps, it was agreed that flat, hilly and mountain areas are valid distinct zones and should be included in the classification. It was agreed to complete the sub-classification of Phase 2 through a consultative process where partners conduct in-house workshops to populate the Sub-classification template. This sub-classification was used to populate a fourth template: Phase 2 Sub-classification. Considering the utility of the exercise, Partners agreed to engage all technical staff of 12 Findings of the Asian Development Bank study on remittances (November 2007) was incorporated in the third Workshop proceedings.

Integrated Phase Classification 8 Pilot
each partner agency to populate the Phase 2 Sub-classification (Template 4). AKRSP populated the template for GBAO region. WFP conducted an IPC Programme Targeting Workshop to populate the Template. Save the Children and Mission East populated the Template for Sughd, Khatlon and DRD regions. Slope and elevation information was available at Jamoat level. Agricultural produce and livestock data was available at district level. Malnutrition information was available at Regional level. The VAM study of 2003 utilized government data at district level. The VAM study of 2005 relied on a household survey which divided the country into 14 zones. Neither VAM study offered IPC indicators wasting and stunting information at Jamoat or district levels. Consequently, following IPC guidelines, the classes of high, medium and low risk were created after taking into account all available data and recording confidence level for each area. The TWG discussed the adoption of IPC as a FSMS for Tajikistan. The FAO design of 8 indicators, the Drought Monitoring System with commodity price data and household questionnaires and the government’s quarterly Food Security Bulletin were discussed. It was agreed the existing data collection should be processed into the IPC and presented on UN Coordination Unit website through a webpage. The webpage would have links to major food security assessments such as WFP VAM reports, the government food security bulletin, graphs in price fluctuation and a box highlighting recent disasters. Once the FAO design is implemented, its results should be phased into the website. TWG members considered the Jamoat slope classification extremely useful and requested slope and elevation data in hard and soft copies. It was agreed to compile these into a single CD with the IPC final report. 3.4 Response Options IPC methodology is more developed in its situation analysis and efforts are underway to improve its response analysis component. The Templates 2 and 3 have captured certain immediate, medium and long term response options. The main cause of food insecurity is poverty and long term responses designed to improve and sustain incomes are required. Several initiatives at the national level are underway. The government is currently revising its agriculture policy with technical support from FAO. The rural areas rely heavily on agriculture and both technical (agriculture extension, improved inputs) and non-technical (land reform, debt relief and credit schemes) are required. All weather road connections to remote regions and neighboring countries would improve trade and job opportunities. Livestock sector requires rangeland management and establishment of cold chains and abattoirs across hilly areas. Vocational trainings to support job opportunities abroad could improve remittance levels. Response options for WFP are more restricted and the Programming Workshop identified several interventions: school feeding, food for work, food for education and vulnerable group feeding. Food for Work may include: tree planting in hilly areas prone to landslides and repair of houses weakened by earthquakes in Rasht valley. Tree and shrub planting in flood prone areas DRD (flat, mountain), Sughd (hilly, mountain and Khatlon (flat, hilly). Landslide mitigation measures in DRD (hilly) and Sughd (hilly, mountain). Analysis of monitoring system results would improve tertiary level targeting.

Integrated Phase Classification 9 Pilot
3.5 Field Work In June, a rapid field assessment was conducted in Khatlon. Jamoat and village officials were interviewed. Government registers maintained at Jamoat level were studied. Utility of wheat quality13 as a proxy indicator of relative wealth was identified and discussed with government officials. In August, a Rapid field assessment was carried out in the earthquake affected Rasht valley in DRD. Areas prone to landslides, earthquakes and flooding were visited. Income generation schemes for vulnerable groups were considered. Housing structures, repair capacity and coping mechanisms were assessed. Hashar is a local word describing an important traditional coping mechanism where people from neighboring villages visit the disaster affected village and offer free labour in return for a mid-day meal. This tradition is very effective in small scale disasters (such as earthquakes) by offering immediate local response to the most vulnerable households. Planners in their response analyses should take into account this local coping strategy. 3.6 Constraints The National Nutrition Surveys and UNICEF’s MICS offered information at the Regional level. This allowed regional comparison. However, data were not available at district or Jamoat (sub-district) level. The 2003 VAM study relied on secondary data from government sources to generate a district level table of relevant information. Multiple sources were used and the actual data was collected between 1998 and 2003. WFP staff were asked to weigh the indicators so that a composite index could be generated. However, national surveys over the period 2002-2007 have established significant changes in poverty, malnutrition, health and education services. Land reforms have affected access to land indicator. Remittances from Russia have increased, causing change in debt and dependency ratio (ratio between working members of a household and non-working members) indicators. The remoteness/accessibility indicator for GBAO was still valid but changing constantly with progress on construction of the new road from China. Overall, the results of VAM 2003 were considered somewhat dated. The 2005 VAM study received severe criticism from the government and the WFP evaluation mission. Field staff in WFP who conducted the questionnaires were also surprised at the results since they did not conform to what was observed during field work. Use of night lights as an indicator to estimate populations was a poor choice since Tajikistan is often plagued with blackouts. Use of existing census data would have been better. The data and results from VAM 2005 were considered while assigning the IPC phase. However, due to across the board criticism of the study, use of its data and results were made with caution and reservation. A district level database of agriculture and livestock data was compiled using 2006 figures. This provided a good indication of crops, production and livestock levels. However, lack of nutrition data at district level precluded production of a composite index covering availability, access and utilization. Due to limited time during Workshops, background documents were prepared between Workshops and shared with participants. This allowed deliberation beyond the Workshop 13 Imported versus locally produced. The former being of better grain, more refined and more expensive.
Integrated Phase Classification 10 Pilot
time. Since the IPC approach to phase classification incorporates an element of subjectivity, it was important to ensure results were based on consensus. The report was compiled at WFP Regional Bureau in Cairo. Results were circulated among the TWG members for comments and their comments were incorporated.
Integrated Phase Classification 11 Pilot
4.0 CLASSIFICATION
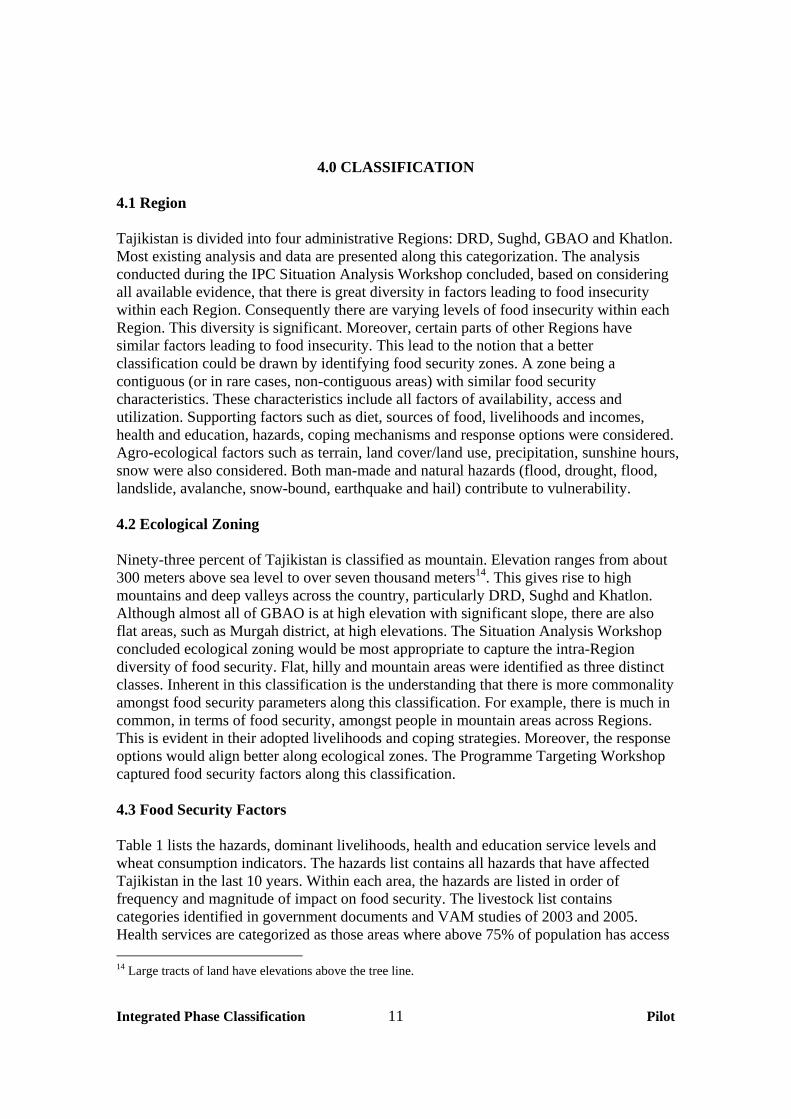
4.1 Region Tajikistan is divided into four administrative Regions: DRD, Sughd, GBAO and Khatlon. Most existing analysis and data are presented along this categorization. The analysis conducted during the IPC Situation Analysis Workshop concluded, based on considering all available evidence, that there is great diversity in factors leading to food insecurity within each Region. Consequently there are varying levels of food insecurity within each Region. This diversity is significant. Moreover, certain parts of other Regions have similar factors leading to food insecurity. This lead to the notion that a better classification could be drawn by identifying food security zones. A zone being a contiguous (or in rare cases, non-contiguous areas) with similar food security characteristics. These characteristics include all factors of availability, access and utilization. Supporting factors such as diet, sources of food, livelihoods and incomes, health and education, hazards, coping mechanisms and response options were considered. Agro-ecological factors such as terrain, land cover/land use, precipitation, sunshine hours, snow were also considered. Both man-made and natural hazards (flood, drought, flood, landslide, avalanche, snow-bound, earthquake and hail) contribute to vulnerability. 4.2 Ecological Zoning Ninety-three percent of Tajikistan is classified as mountain. Elevation ranges from about 300 meters above sea level to over seven thousand meters14. This gives rise to high mountains and deep valleys across the country, particularly DRD, Sughd and Khatlon. Although almost all of GBAO is at high elevation with significant slope, there are also flat areas, such as Murgah district, at high elevations. The Situation Analysis Workshop concluded ecological zoning would be most appropriate to capture the intra-Region diversity of food security. Flat, hilly and mountain areas were identified as three distinct classes. Inherent in this classification is the understanding that there is more commonality amongst food security parameters along this classification. For example, there is much in common, in terms of food security, amongst people in mountain areas across Regions. This is evident in their adopted livelihoods and coping strategies. Moreover, the response options would align better along ecological zones. The Programme Targeting Workshop captured food security factors along this classification. 4.3 Food Security Factors Table 1 lists the hazards, dominant livelihoods, health and education service levels and wheat consumption indicators. The hazards list contains all hazards that have affected Tajikistan in the last 10 years. Within each area, the hazards are listed in order of frequency and magnitude of impact on food security. The livestock list contains categories identified in government documents and VAM studies of 2003 and 2005. Health services are categorized as those areas where above 75% of population has access 14 Large tracts of land have elevations above the tree line.
Integrated Phase Classification 12 Pilot
to health clinics within walking distance. Moderate represents areas where between 50 and 75 percent of population has access. Poor represents areas where between 25 and 50% and Very Poor represents areas where less than 25% percent of population has access. Most of the population has access to primary schools. For education, the classification uses access to secondary schools. Good represents areas where above 75% of school age children have access to secondary schools. Moderate represents areas where 50-75, Poor represents areas where 25-50% and Very Poor for areas where less than 25% of population has access to secondary schools. Hilly and mountain areas show worst health and education status as compared to flat areas. Predominantly, cotton is grown in flat, wheat and horticulture in hilly, and potato cultivation along with livestock herding, in mountain areas. Table 1: Food Security Factors Region Food Security Factors Flat Hilly Mountain DRD 1,2,7,615 7,1,3,4,2,6 1,5,4,5,3,2,7Sughd 2,6,1,7 1,3,2,6,7 1,3,5,4,6 GBAO n/a 6,5,4,3,2 6,5,4,3 KT 1,2,6 1,2,3,6 n/a KY
Haz
ards
1. Flood; 2. Drought 3. Landslide; 4. Avalanche 5. Snow-bound; 6. Earthquake; 7. Hail
1,2,6 1,2,3,6 1,5,6 DRD Cotton
growers, 1,4,6,3,5,7
Potato cultivation 7,6,3,8,4,2
Potato cultivation 7,3,6,8,4,2
Sughd Cotton growers 1,4,2,6,5
Rainfed wheat agriculture 2,4,3,6,5
Potato cultivation 7,3,4,2,6
GBAO n/a Horticulture 6,7,3,4,2
Potato cultivation 7,6,3,4
KT Cotton growers 1,4,2,6,5
Remittances 4,3,2,6
n/a
KY
Dom
inan
t Liv
elih
ood
1. Cotton growers; 2. Rainfed wheat; 3. Livestock; 4. Remittances; 5. Industry; 6. Horticulture; 7. Potato cultivation; 8. Bee Keeping
Cotton growers 1,4,2
Horticulture 6,4,3,2
Livestock 3,4,6
DRD Moderate Moderate Poor Sughd Moderate Poor Very poor GBAO n/a Moderate Poor KT Poor Very poor n/a KY
Hea
lth
Serv
ices
1. Good (>75% population have access); 2. Moderate (50-75%); 3. Poor (25-50%); 4. Very Poor (<25%)
Poor Very poor Very poor DRD Good Moderate Poor Sughd Good Moderate Poor GBAO Ed
uca
tion
Access to secondary schools: 1. Good (>75% population has access); 2. Moderate (50- n/a Good Moderate
15 Listed by decreasing significance. For example, flat areas of DRD are affected by floods, drought, hail and earthquakes. Floods being the most significant and earthquakes having least impact.

Integrated Phase Classification 13 Pilot
KT Good Moderate n/a KY
75); 3. Poor (25-50); 4. Very poor (<25%) Good Moderate Poor
DRD 4 3 3 Sughd 4 3 3 GBAO n/a 1 3 KT 2 3 n/a KY
Whe
at
Con
sum
ptio
n Consumption of imported wheat
Population Months/year <=6 >6 <50% 1 2 >50% 3 4 2 3 3
4.4 Wheat Quality Wheat is the staple diet in Tajikistan. Two qualities of wheat are consumed: imported and local produce. Wheat imported from neighboring countries is of better quality and higher price. It is produced from superior quality grains and is milled in larger mills (Russian) resulting in more refined flour. The locally produced wheat flour is produced from lower quality grain, milled in lower quality mills (Chinese) and costs less. Since wheat is consumed by all strata of society in all geographic areas of the country and throughout the year, its use as a proxy indicator of relative wealth was considered. Interviews with key informants and government officials during the field work confirmed wheat quality (imported versus locally produced) as a broad proxy indicator for wealth. The indicator was confirmed by Jamoat authorities, NGOs and WFP field staff. There are some exceptions in remote areas of GBAO where local wheat is neither produced nor available on markets16. The classification was agreed upon by WFP field officers during the Programme Targeting Workshop. The classification divides wheat consumers into 3 categories. The first category is of areas where a minority (less than 50% population) consumes imported wheat for a short period (less than 6 months). People in these areas predominantly rely on less expensive local wheat, indicating low purchasing power. The last category is of areas where a majority consumes imported wheat most of the year. This would suggest higher purchasing power. The flat areas of DRD and Sughd fall in this category. The middle group is between the two, where over a year, both qualities are interchanged depending on availability and access. Admittedly, this categorization is broad and any refinement in such data would require a proper survey. The household questionnaire results could offer more details once the questionnaire is modified to include this indicator. In future, market surveys or periodic queries from Jamoat authorities may also be considered to strengthen the FSMS. The provision of a simple verifiable indicator applicable to all strata of society, all areas of the country and throughout the year would contribute towards the FSMS design criteria of a simple, manageable system. (This does not suggest it should be the sole indicator.) 4.5 Assessment The Progamme Targeting Workshop classified the flat, hilly and mountain areas of each Region by vulnerability, key causes of food insecurity and potential response options.
16 Murghab district in GBAO Region receives imported wheat from adjacent Kyrgystan at less cost. This is an exceptional case where imported wheat costs less than wheat transported from within the country.

Integrated Phase Classification 14 Pilot
Trends were identified to facilitate Early Warning. According to IPC methodology, confidence level was recorded. Key underlying causes were established using the three pillars of food security: availability, access and utilization. Considering the extent of remote areas in the country and the fact that chronic food insecurity was prevalent throughout the country, the access indicator was divided into physical and economic. Since participants of the Programme Targeting Workshop were WFP staff, responses were restricted to options available to WFP. (For a comprehensive spectrum of multi-sector Reponses see TWGs IPC Templates 2 and 3). School feeding emerged as a valid response option for all areas though the priority level shifted. For hilly areas, school feeding was the most preferred. Food for Work was recommended for most of Sughd and GBAO whereas Food for Health was recommended for Khatlon areas. Table 2: Assessment Region Assessment Flat Hilly Mountain DRD Low-
Medium Low Medium
Sughd Low Medium Medium GBAO n/a Medium High KT Medium Low n/a KY
Vul
nera
bilit
y Early Warning Level: 1. High 2. Medium(moderate)3. Low (Alert)
High Medium High DRD 2 2 2,3 Sughd 2,4 2,3,4 3,2,4 GBAO n/a 2 2,3,4 KT 2,4 2,4 n/a KY
Cau
ses
Key underlying causes: 1. Availability 2. Access –economic 3. Access – physical 4. Utilization 4,2 4,2,3,1 4,2,3,1
DRD FFW, Emerg SF,FFW SF,FFW Sughd SF, FFW SF,FFW Emerg,SF GBAO n/a SF,FFW Emerg,SF KT SF, FFH SF,FFH n/a KY R
espo
nse
Response (WFP specific) 1. Emergency 2. VGF 3. School Feeding 4. Food for Health 5. Food for Work
SF,FFH SF,FFH FFH,SF
DRD No change No change No change Sughd Worsening Worsening No change GBAO n/a No change No change KT Worsening No change n/a KY
Tren
d
1. Improving 2. No change 3. Worsening
Worsening No change No change DRD Medium Medium High Sughd Medium High High GBAO n/a Medium High KT High High n/a KY C
onfid
ence
Le
vel
1. High 2. Medium 3. Low
High High Medium 4.6 Representative Jamoats

Integrated Phase Classification 15 Pilot
Table 3 lists representative Jamoats for monitoring purposes. Household food security questionnaire is to be administered in these Jamoats, each representing the Jamoats in that particular area. For example, Galaobod and Firuza represent the flat areas of KT and Shidz and Vanqaal represent the mountain areas of GBAO. For a complete list of Jamoats and their classification along flat, hilly and mountain criteria see appendix. Table 3: Representative Jamoats
Region Flat Hilly Mountain DRD Buston
Boghiston Jafr Kuktosh – Almosi
Ziddi-Anzob Dombrachi – Sangvor
Sughd Lakkon Asht Ravshan Farmokurgon Ovchiqalacha Vangilkurgon Gazantarak Leninobod Sarazam
Punuk Yor, Rarz
Langar Vorukh Shing
GBAO n/a Zong Rangkul
Shidz Vanqala
KT Galaobod Firuza
Navzamin Iftikhor Oqgaza
n/a
KY Zaribdor Dehqonariq
Sarichashma Sarikhosor
Tojikiston Langardara

Integrated Phase Classification 16 Pilot
5. 0 FOOD SECURITY MONITORING SYSTEM
WFP plans to establish a food security monitoring system that could be handed over,
after an appropriate period, to the government to be maintained through government resources. This raises the importance of a viable early warning and monitoring system that could alert decision makers to potential disruptions in food security. Two critical design factors were that the system be a) realistic –could be implemented within limited government capacity and b) indicative - the monitoring system should alert to change in food security levels and identify when an assessment is required. The existing monitoring system was updated based on the criteria in Table 5. Table 5: FSMS Design Criteria
Criteria Details Indicators
Availability: monitor main food staple of poorest and vulnerable groups Access: market trends, purchasing power, relief aid Utilization: nutrition status, nutrition problems, mortality rate, dietary diversity Risks: natural, conflict, economic shocks Crisis indicators: triggers and thresholds
Selection
Relevant to local conditions Available at acceptable cost Allowing early warning Measurable in an objective way
Avoid large unmanageable system design
GoT should be able to implement the system
Emphasis on existing systems
Utilize existing data collection processes Avoid parallel systems
Two processes were underway at the time of this IPC pilot. The WFP and Partners lead Drought Monitoring System and the FAO lead Food Security Monitoring system. The former had a data collection regime in place. A household food security questionnaire was administered by WFP and Partners in selected areas on a monthly basis. For market analysis, price data on food, fuel and transport were collected by WFP. The data were compiled at the United Nations Coordination Unit and results were presented in tabular form to the Food Coordinating Forum. Price data was collected from main markets in each Region. The household questionnaire was administered in areas where WFP and Partners had field presence. Although this was not representative of the whole country, it did represent the most vulnerable areas of the country since vulnerability was a key criteria in the programme targeting of WFP and Partners. Although strict random sampling was not adopted, poor households were selected as survey respondents. Data collection was on voluntary basis and consistency could not be managed throughout the year. A serious drawback was the absence of any formal process of analyzing the data.

Integrated Phase Classification 17 Pilot
The UNCU was well equipped for data processing but did not have the analytical capacity required for food security analysis.
Through the IPC process, it was agreed to modify this monitoring system in the following areas:
1. Adopt the WFP Food Consumption Score (FCS) methodology. This required modification of the household questionnaire. The advantage would be a score that could be compared over time thus facilitating trend analysis. 2. Add a question to household questionnaire on quality of wheat consumed (proportion of imported vs local). 3. On a quarterly basis, the questionnaire results would be submitted to the IPC Steering Committee/Food Coordination Forum. In the light of new data, the Forum would identify changes required in the IPC map. Updating of the map would be done by UNCU with technical backstopping from the WFP Regional Bureau mapping unit. 4. A webpage on FSMS would be added to the UNTJ.org website (Table 6). The webpage would be updated on a quarterly basis with price data, household food security questionnaire results and the IPC map. The website will offer hyperlinks to government publication of food security bulletin, IPC report, VAM studies and other food security related documents. 5. The initial FAO report recommended a comprehensive list of 60 indicators. This was considered too ambitious and unmanageable for the Tajikistan government. The list has now been reduced to eight indicators. Once the FAO system is finalized, the data collection and webpage reporting would be updated to conform to the FAO system. 6. The monitoring system would be reviewed on an annual basis for possible improvements to ensure the information provided is supporting decision-making. The review should also consider periodicity of data collection. Currently a monthly regime is practiced. Whereas price data on a monthly basis allows trend analysis, the household food security and coping mechanisms data collection should be synchronized with the crop calendar. 7. Part of the FAO lead design would include capacity building (institutions and human resources) of government to gradually take over implementation of the system thus relieving need for external resources. 8. Possible links with nutrition surveillance may be explored through consultations with Ministry of Health, UNICEF and other agencies involved in nutrition surveillance. However, the purpose of an early warning system is to flash situations before malnutrition actually increases.
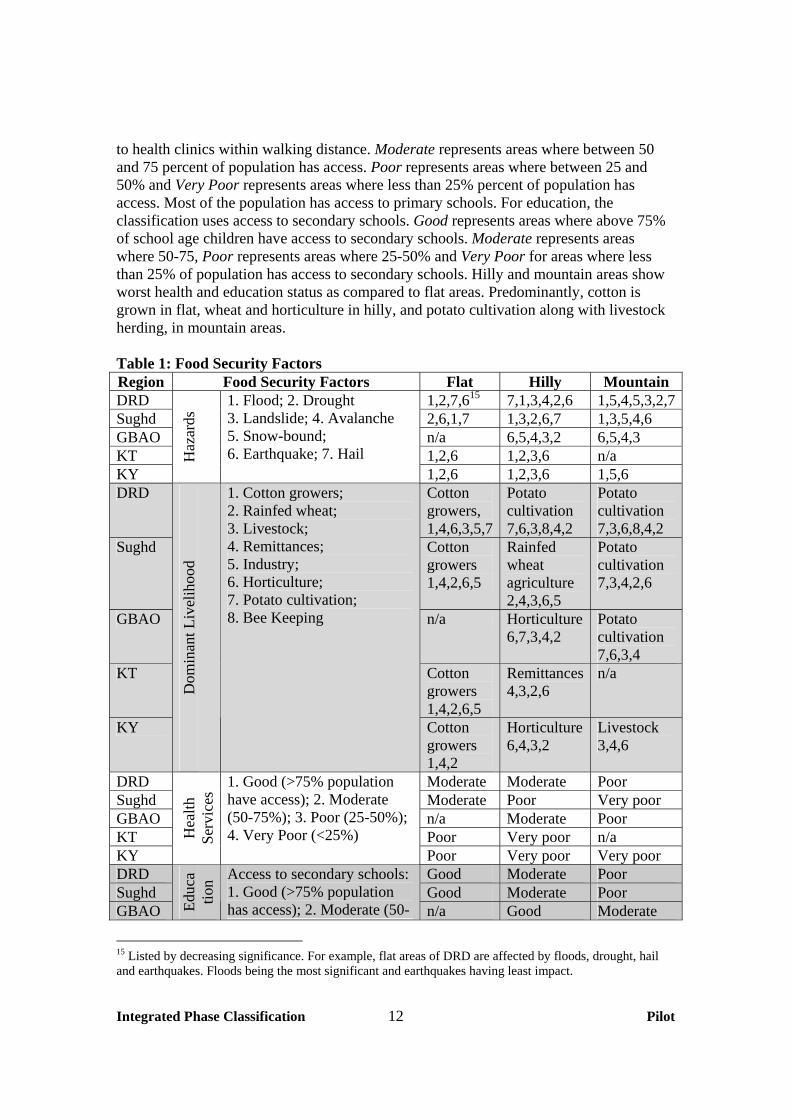
Table 6: Outline for FSMS Webpage
Icon Details Links to documents IPC Executive Brief
IPC Tajikistan Report Govt FS Bulletin CFSAM Report VAM Reports Minutes of Meetings FCF, FS Working Group
Integrated Phase Classification 18 Pilot
Graph Market price data indicating change Precipitation compared to normal
Table Results of household questionnaires (particularly Food Consumption Score and Dietary Diversity data indicating change)
Box Recent disaster with brief description taken from WFP rapid assessment.
Box Political: change in neighbouring country relations
Country Concern Russia affecting remittances Uzbekistan Kyrgyzstan
affecting trade and movement of food commodities
Afghanistan refugee influx Map IPC Map
Integrated Phase Classification 19 Pilot
6.0 CONCULSIONS, RECOMMENDATIONS AND LESSONS LEARNT 6.1 Conclusions Economic access (poverty) is a major contributor to food insecurity in Tajikistan. Predominant food insecurity is chronic. High rates of malnutrition are recorded in all Regions. Natural disasters such as drought, flood, earthquake, hail and landslides are frequent and exacerbate food insecurity, especially of the poor. Escalation in prices of commodities, transport and fuel affect food security and monitoring of these prices should be part of a food security monitoring system. There is high confidence in the zoning of flat, hilly and mountain areas. Accurate terrain data allows this division. Land cover, land use and livelihoods divide well over these classes. IPC reference table does not include poverty as an indicator. Since most of Tajikistan’s food insecurity is due to poverty, this indicator should be considered. The classification is essentially of rural areas. Mixed livelihoods and income brackets amongst urban populations require a detailed survey to capture their food security. VAM 2003 concludes highest food insecurity in mountain areas of GBAO. The VAM 2005 concludes this area as least food insecure. Assigning vulnerability levels of high, medium and low involved subjective judgment. Using existing data sets had limitations: NNS (geographic). VAM 2003 (dated) and VAM 2005 (credibility). Recent Oxfam study increased confidence of KT and KY classification. Recent ADB study on remittances offered useful information on a key indicator. Whereas primary and secondary targeting may be achieved through secondary data sets captured in the IPC templates, tertiary level targeting requires additional information. Jamoat is a small geographic unit usually of a pre-dominant terrain (flat, hilly or mountain). There are, of course, exceptions.

Integrated Phase Classification 20 Pilot
Within Regions, Jamoats of similar terrain have common food security factors of land use and livelihoods. Identification of representative Jamoats allow simplification of assessment, targeting and monitoring. Wheat quality is a useful proxy indicator of wealth in Tajikistan. No single indicator could capture food security. However, used in conjunction with other indicators, it would improve targeting and monitoring. Relations with neighbouring countries affect potential remittance levels which play a major role in household food security in certain areas. 6. 2 Recommendations Future surveys and studies of Tajikistan’s food security should consider the classification along flat, hilly and mountain areas. Food security monitoring should utilize the representative Jamoats. The application should consider limitations in over-simplification. Food security monitoring should include wheat quality as a proxy indicator of poverty (excluding exceptional areas). Food security monitoring should include monitoring of border relations that may affect remittances. Food security monitoring should include monitoring prices of food commodities, fuel and transport. A food security monitoring webpage should be designed and maintained at UNTJ website. Upon completion of FAO FSMS design, it should be adopted by modifying the surveys and webpage designs. The Food Coordination Forum should periodically update the IPC map in light of monitoring data. Programme targeting should consider monitoring results for updating target areas. 6.3 Lessons Learnt
6.3.1 IPC as an Analysis Tool 6.3.1.1 Chronically Food Insecure Population: A majority of Tajikistan population falls within one Phase – Chronically Food Insecure. The standard IPC reference table does not

Integrated Phase Classification 21 Pilot
offer a sub-classification of Phase 2. This is probably the most serious limitation IPC has for Tajikistan. The TWG offered sub-classification of Phase 2 to ensure utility of IPC to those working at national and sub-national levels. By magnitude, the problem lies in chronic food insecurity yet funding seems to prefer emergencies. Therefore, should IPC, by design, alert decision makers to where the bulk of the problem lies, or restrict itself to elaborate on areas donors are willing to fund? Lesson Learnt: Sub-classification of Phase 2 will allow classification of a large percentage of Tajikistan’s population, highlighting the different levels of food security. 6.3.1.2 Aggregation: Existing VAM studies of 2003 and 2005 offered more refined analysis of chronically food insecure than the IPC reference table, albeit with different sets of indicators. VAM 2003 offered the following classes: food insecurity/vulnerability into 5 categories: highest, high, middle, low and lowest. VAM 2005 classified 6 areas based on extent of food insecurity17. Instead of offering more insight, the IPC would aggregate to a higher level hiding more detailed divisions already established in earlier studies. This raised the challenge that unless Phase 2 were subdivided, the IPC exercise would dilute existing detailed VAM studies into broader more general classes. Data on IPC indicators of wasting and stunting are not available for district and Jamoat levels in the VAM studies. Malnutrition data is available only at Regional level. Only an indirect link could be established between VAM and IPC indicators. Lesson Learnt: To ensure value added, the Unit of Analysis for the IPC should not be larger than units of analyses of earlier studies. 6.3.1.3 Consensus Validation: By considering all prior assessments together and through consensus, the TWG identified a significant flaw inherent to all earlier assessments. There is more intra regional disparity than inter regional disparity. Lumping data at Regional (provincial) level skews significant differences in food security amongst areas within a Region, particularly the low flat lands and the high mountains. Actually the averages represent neither extremes. This flaw has been imbedded in all existing surveys including WFPs VAM studies of 2003 and 2005; UNICEF’s MICS, the government’s National Nutrition Survey and the government’s own quarterly food security bulletin. This identification will benefit all future assessments in Tajikistan. This is perhaps the most significant benefit from the IPC process in Tajikistan. The household survey planned for 2008 by the World Bank is considering this observation in its design. Lesson Learnt: The IPC process allowed identification and agreement on strengths and weaknesses of earlier reports and assessments. It provided a legitimate forum to document such observations for the benefit of future work. 6.3.1.4 Primary Data Generation: Field work allowed identification of wheat quality as a proxy indicator of relative wealth. By introducing the proxy indicator and the slope map, it was possible to make useful classifications. By adding field work and generating additional information (in this case, elevation and slope maps with corresponding statistics) the TWG improved their classification. Restricting the exercise to existing data
17Percentage of households with <8%, 8-16%, 17-20%, 21-30%, 31-40% and >40% chronically food insecure.

Integrated Phase Classification 22 Pilot
and reports would have been limiting. Lesson Learnt: Field Work enriched the analysis of secondary data and should be encouraged during an IPC update. 6.3.1.5 Data Bias: While studying Template 1 and comparing government data with international agencies’ data, it was observed that government statistics on nutrition show a healthier picture than reality. The TWG agreed to use government statistics on malnutrition as the lower limit of reality. This allowed utilization of data which was known to be biased. Lesson Learnt: IPC allowed utilization of weak data as long as its weakness was understood, considered and documented. 6.3.2 IPC as a Targeting Tool 6.3.2.1 Tertiary Level: Data for indicators stipulated in the Reference Table, for example, malnutrition and stunting, are not available at district and sub-district level. Yet area targeting at these levels is most critical to government and the international humanitarian agencies. Lesson Learnt: Programme targeting often requires a geographic unit of analysis smaller than that for which nutrition data is available. 6.3.3 IPC as a Monitoring Tool 6.3.3.1 Process Indicators: The output indicators of IPC do not serve well for monitoring where process indicators are more suited. For example, malnutrition is an IPC indicator. As an early warning and monitoring tool, it would be useful to identify areas where food consumption is compromised much earlier. Malnutrition will set in after some time, yet the monitoring system should alert decision-makers to the fact that food consumption has worsened much earlier than when malnutrition actually occurs. This can only be achieved if process indicators (such as food consumption scores in case of nutrition, and lack of rain in terms of agriculture) are monitored. WFP markets assessment recommended monitoring of wages and prices of food commodities, fuel and transport. The WFP Contingency Plan recommends monitoring of political factors that may affect trade, movement of food and labour opportunities with neighbouring countries. Lesson Learnt: Using IPC as a food security monitoring system in Tajikistan requires incorporation of a range of process indicators. 6.3.3.2 Representative Jamoats: Monitoring requires consistent periodic collection of data from the field. This is expensive and labour intensive. The criteria set out in the design of the FSMS was to have a system that could eventually be implemented by the government with its own resources. Therefore, a simple system was required. The Programme Targeting Workshop identified representative Jamoats for each sub-classification i.e. flat, hilly and mountain areas. The criteria for selection was to identify for each sub-classification of each Region a single Jamoat which represented adjacent Jamoats in terms of food security characteristics. The assumption being that flat areas of a Region will have the same food security issues, livelihoods and response options. Therefore, monitoring and early warning indicators applied to the representative Jamoat will allow extension of results to adjacent Jamoats in the same sub-classification of the same Region. The Workshop deliberations revealed that in practical terms this simplification overlooks

Integrated Phase Classification 23 Pilot
certain key differences. For example, the mountain area of Sughd has a further division between mountains with permanent snow and those with no snow. This factor affects the livelihoods, consequent food security of the populations and potential response options in these areas. The flat areas of Sughd are diverse and require several Jamoats to capture this diversity. In such instances, more than one Jamoat was selected. Lesson Learnt: By selecting representative Jamoats, the effort of monitoring could be reduced substantially thus offering a practical, implementable FSMS and a lean process of updating the IPC. 6.3.4 IPC Partners 6.3.4.1 Local Capacity: WFP CO does not have a dedicated VAM officer. This limited certain activities e.g. mapping of data, contact with essential data sources and maintaining a core set of data relevant to food security analysis. Lesson Learnt: Involvement of a dedicated food security analyst at local level could expedite and improve the IPC process. 6.3.4.2 Role of Government. Government absence was a major setback in terms of consensus building. The TWG did not include government officials though government is part of the Steering Committee. Lesson Learnt: Maximum effort should be made to include the government in the IPC process. 6.3.4.3 Long Term Commitment. Most NGOs and international agencies are phasing out of Tajikistan. Initiating a new classification at this stage raised questions of the exercise’s utility. Initially, this also lead to limited involvement from partner agencies. Only a few hours could be dedicated during the first two workshops. However, as the process continued and its significance established, partners offered additional time, especially in data collection and sub-classification of Phase 2. Lesson Learnt: A well run IPC process will generate interest and investment of time and effort amongst partners. 6.3.4.4 FAO Involvement. A WFP lead IPC initiative was perceived as an attempt to establish a parallel process. Discussions with FAO hovered around concepts of product (IPC templates, phase classification and maps) and process (turning IPC into a regular monitoring system through awareness raising, capacity building of government and regular data collection). The utility of IPC was accepted without debate. However, turning it into a regular monitoring system was challenged by FAO as parallel processing. In light of the Partners’ meeting in UK, it was agreed that WFP concentrate on the product and FAO concentrate on the process. By the third IPC workshop, it became clear that FAO lead process was still in design stage while the IPC product was near completion. Lesson Learnt: A better division of labour/commitment should be agreed upon between FAO and WFP at the outset.