Embed Size (px)
Citation preview
GCOE –HSE Program, Kyoto University
Integrated Disaster Risks Management for
Megacity Mumbai
Suhajyoti SamaddarDisaster Prevention Research Institute
Kyoto University
Kyoto, Japan
Roshni ChatterjeeGCOE-HSE Project, Mumbai Base
Kyoto University
Mumbai, India
Bijay Anand MisraGCOE-HSE Project, Mumbai Base
Kyoto University
Mumbai, India
Hirokazu TatanoDisaster Prevention Research Institute, Kyoto
University
Kyoto, Japan
10

Economic losses and insured losses with
trend
Source: Munich RE. 200511
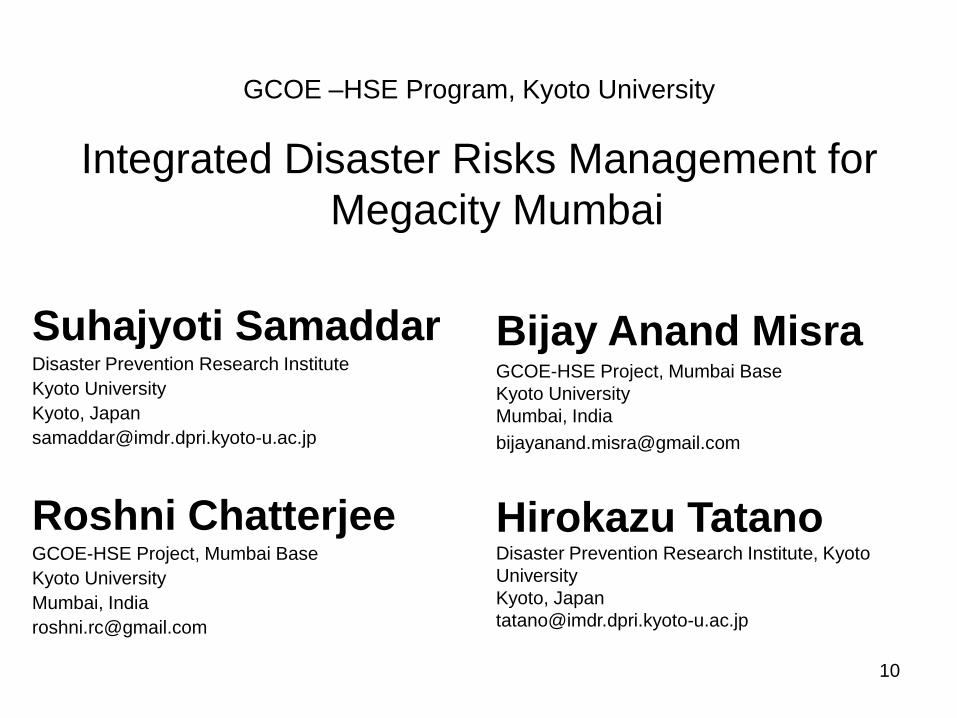
Disasters in Asia,2007
Source: Munich Re, 200812

Trend of Natural Disaster in the world
• Larger catastrophic disaster is more likely to
occur.
– Number of Disaster for which some international aid
is executed.
– 60s:90s=1:3
• Economic losses increased in high rate
– 60s:90s= 1:9
• Insured losses increased in higher rate
– Anti-catastrophe insurance available in high-income
countries
– 60s:90s =1:1613
What is happening?
• Increase in exposure :
Population and assets are
concentrating to hazardous area
• Vulnerability : Population and
assets have not enough
resistance against natural hazards
14
IDRiM- Building up its architecture
We are not DOING enough
And not at the most challenging scenarios – the HOT SPOTS
Hence,
Much of our knowledge remains isolated NOT integrated
Much of our technology remains inadequately tested OR untested.
Result,Over promise and under achieve
We do not win hearts and minds over disaster reduction deliveries. 15
IDRiM
Everybody’s concern- risks engulf us all and hazards
and disasters impact all
How do we move from CONCEPT TO REALITY
From lab to evidence based practice & to find useful
& transferable technologiesFrom ideas to implementation
Learning through doing & develop success models
16
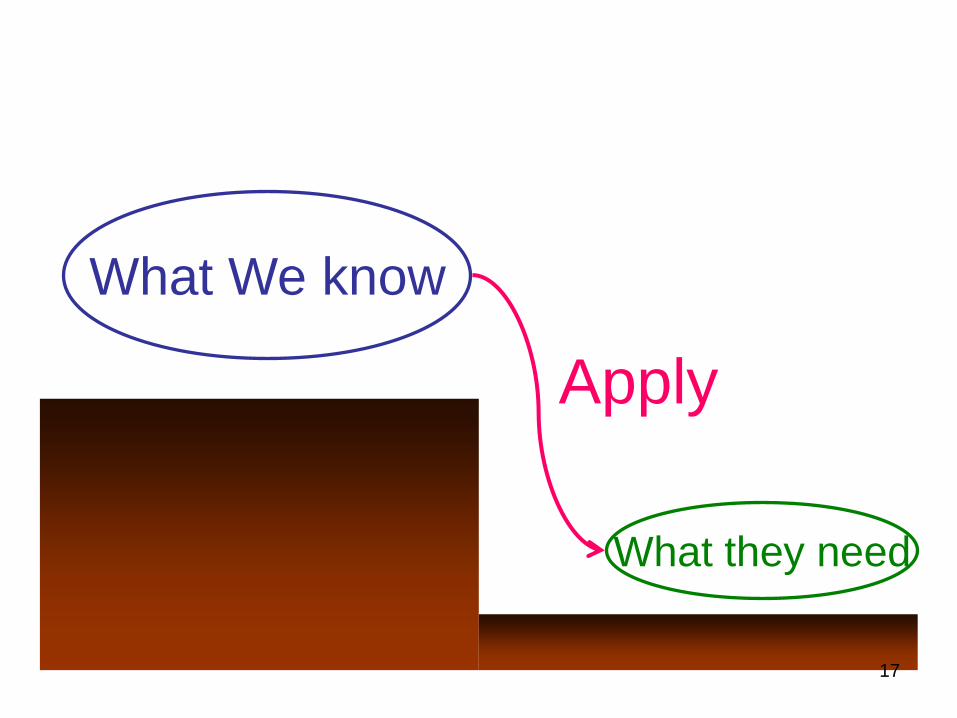
What they need
What We know
Apply
17

PURPOSE OF HOT SPOTS
IN
BUILDING IDRiM ARCHITECTURE
Hot Spots present most challenging scenarios but also opportunities to innovate and generate new ideas. From technology only solutions to Social solutions & better Management solutions.
Hot Spots urge us to be sensitive to human values and emphasize the human face of technology.
Hot Spots provide opportunities to work and learn together with the stakeholders and on-the –ground feed back.
Hot Spots help to observe disaster reduction structures as those emerge and function under stressful conditions. 18
The Process of
“Knowing the People”
19
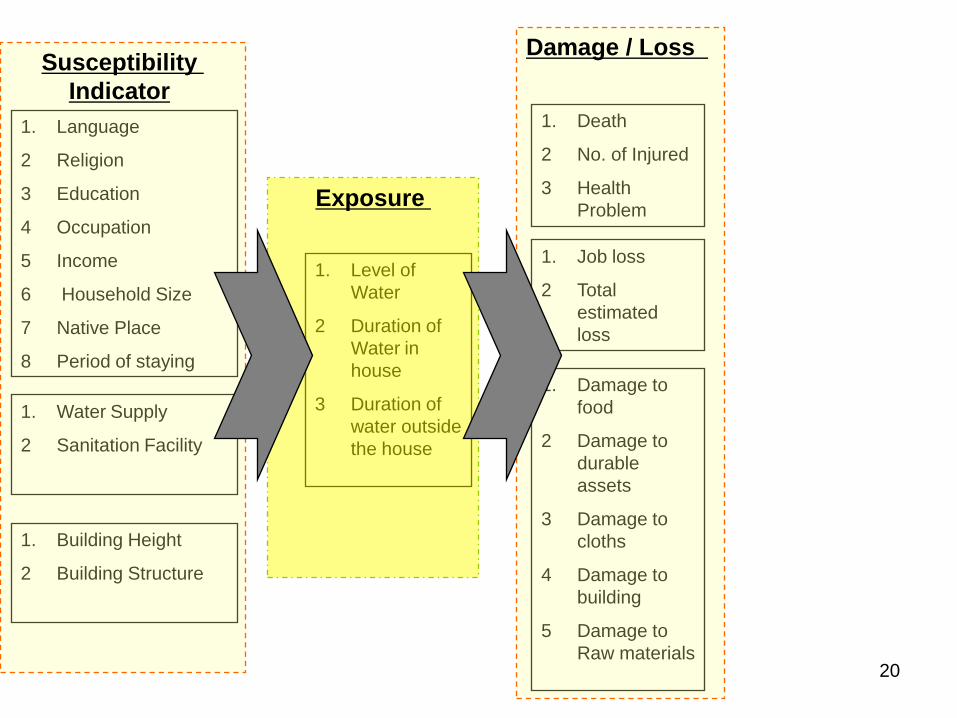
1. Language
2 Religion
3 Education
4 Occupation
5 Income
6 Household Size
7 Native Place
8 Period of staying
1. Water Supply
2 Sanitation Facility
1. Building Height
2 Building Structure
1. Level of
Water
2 Duration of
Water in
house
3 Duration of
water outside
the house
1. Death
2 No. of Injured
3 Health
Problem
1. Damage to
food
2 Damage to
durable
assets
3 Damage to
cloths
4 Damage to
building
5 Damage to
Raw materials
1. Job loss
2 Total
estimated
loss
Susceptibility
Indicator
Exposure
Damage / Loss
20
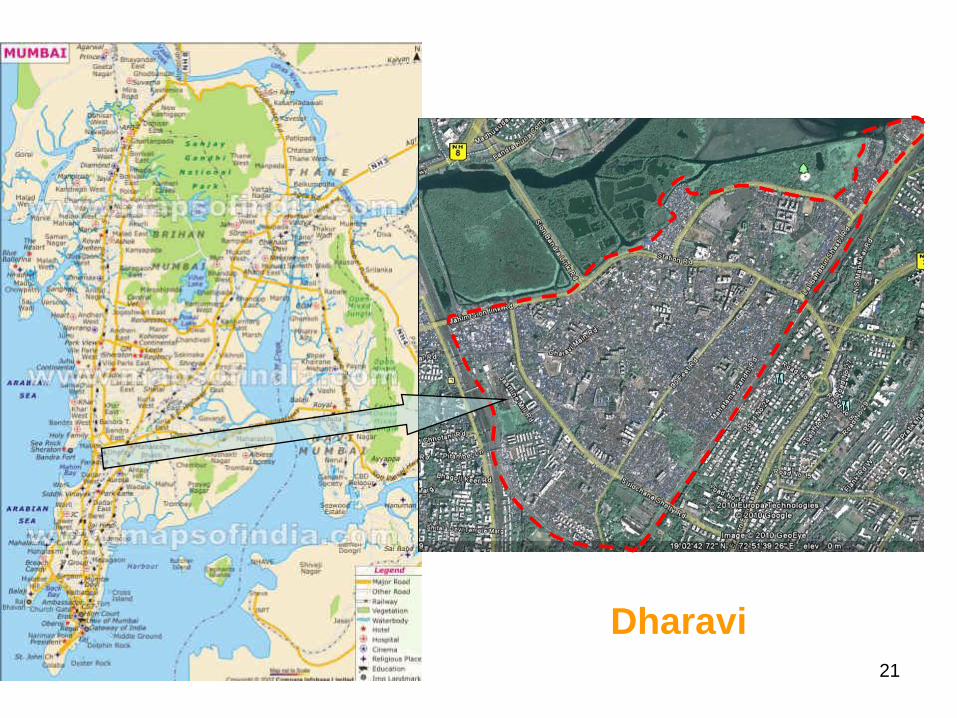
Dharavi 21

Selected Hotspots at Dharavi
Mithi River
Premnagar
Rajiv
Gandhi
Nagar
Parsi-Chawl
22
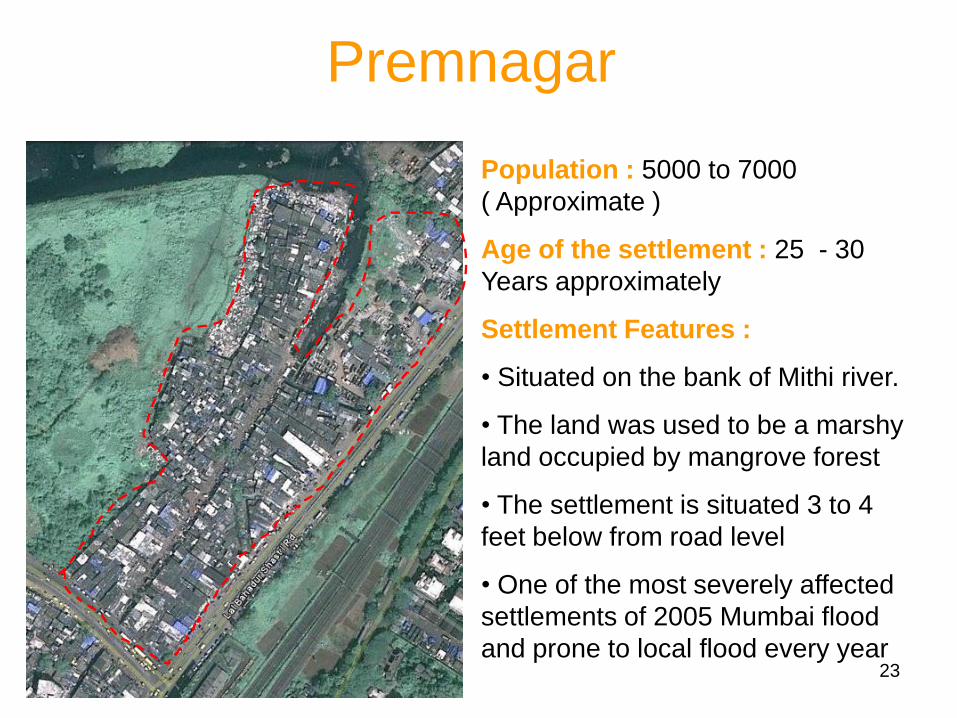
Population : 5000 to 7000
( Approximate )
Age of the settlement : 25 - 30
Years approximately
Settlement Features :
• Situated on the bank of Mithi river.
• The land was used to be a marshy
land occupied by mangrove forest
• The settlement is situated 3 to 4
feet below from road level
• One of the most severely affected
settlements of 2005 Mumbai flood
and prone to local flood every year
Premnagar
23

•Education: 23 % illiterates, 19 % can only write their names
•Income structure: Average income is Rs 4647 and 76 %
people earn less than Rs 5000 per month.
•Religion: 61 % people are Hindus and the rest 39 %
people are Muslims
•Mother Tongue: 94 % people are Hindi speaking
•Household size: Average household size is 6
•51 % of households have 1 working member
•Average period of stay: 23 years
•Migration Status: Majority of people are immigrants from
Uttar Pradesh; it is likely that the major reason for
immigration is better job opportunities.
Premnagar
24

Parshi-Chawl
Population : 1500 (300
households) approximately
Landuse : Mainly residential
Age of settlement : Around
50 years or more
Settlement Features :
• Situated 3 to 4 feet below
the road level
• Severe flood on 2005 and
presence of water logging or
local flood in every year
• Settlement is much clean
and environmentally much
better to stay 25
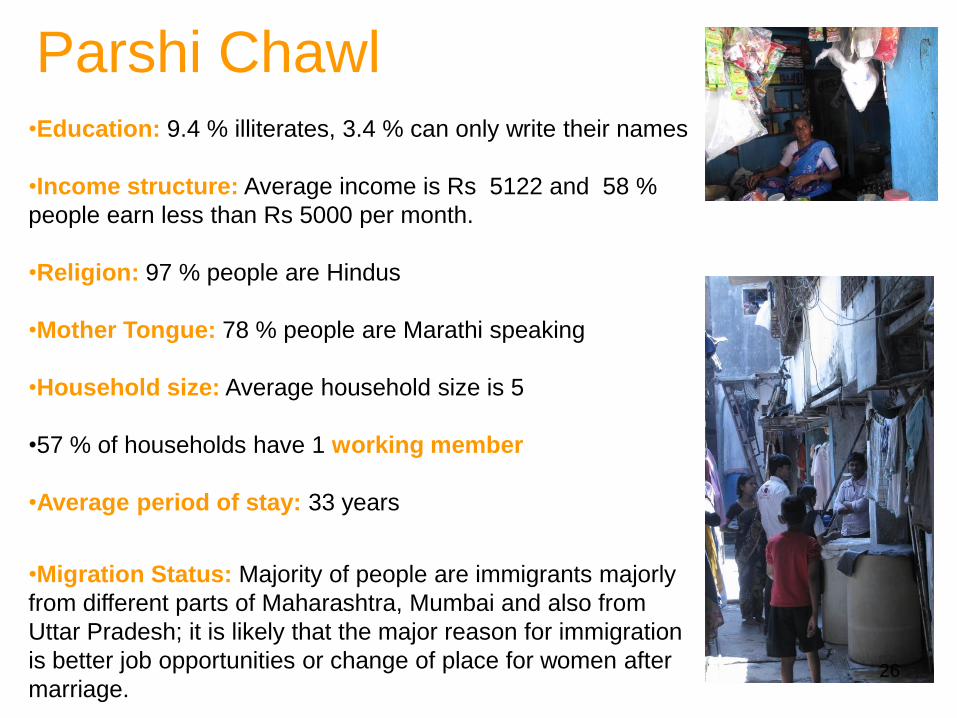
Parshi Chawl•Education: 9.4 % illiterates, 3.4 % can only write their names
•Income structure: Average income is Rs 5122 and 58 %
people earn less than Rs 5000 per month.
•Religion: 97 % people are Hindus
•Mother Tongue: 78 % people are Marathi speaking
•Household size: Average household size is 5
•57 % of households have 1 working member
•Average period of stay: 33 years
•Migration Status: Majority of people are immigrants majorly
from different parts of Maharashtra, Mumbai and also from
Uttar Pradesh; it is likely that the major reason for immigration
is better job opportunities or change of place for women after
marriage.26

Rajiv Gandhi Nagar
Population : 10000
Age of Settlement : 15 Years
Landuse : Mainly residential
Settlement Characteristics :
• Developed in the verge of Mithi
river bed which was previously a
marshy land bound by mangrove
forest
• Most recently developed in
Dharavi Slum area
• Prone to Flood ( water loggings
for few hours are also observed) 27

Rajiv Gandhi Nagar
Education: 38 % illiterates, 4.4 % can only write their names
•Income structure: Average income is Rs 4348 and 80 %
people earn less than Rs 5000 per month.
•Religion: 73 % people are Hindus and 17 % are Muslims
•Mother Tongue: Majorly Hindi and Kannad and also Marathi
•Household size: Average household size is 5
•80 % of households have 1 working member
•Average period of stay: 15 years
•Migration Status: Majority of people are immigrants majorly
from Karnataka and Uttar Pradesh; it is likely that the major
reason for immigration is better job opportunities.28

MAGNITUDE & IMPACT
OF FLOOD
29

Flood levels
30

Premnagar Parsi-Chawl Rajiv Gandhi Nagar
Duration of Flood inside the house ( in Hours )
Mean 31.27 35.99 42
Duration of flood water outside the house ( surrounding streets)
Mean 37.43 45.60 47.55
Maximum 96 96 120
Duration of Flood : 2005
31
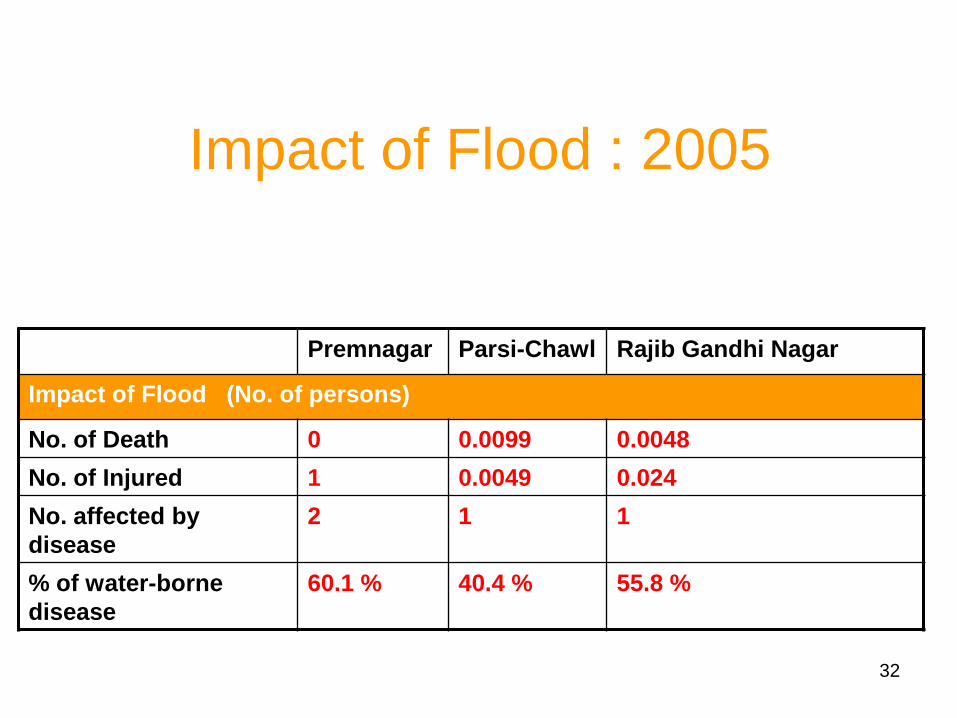
Premnagar Parsi-Chawl Rajib Gandhi Nagar
Impact of Flood (No. of persons)
No. of Death 0 0.0099 0.0048
No. of Injured 1 0.0049 0.024
No. affected by
disease
2 1 1
% of water-borne
disease
60.1 % 40.4 % 55.8 %
Impact of Flood : 2005
32
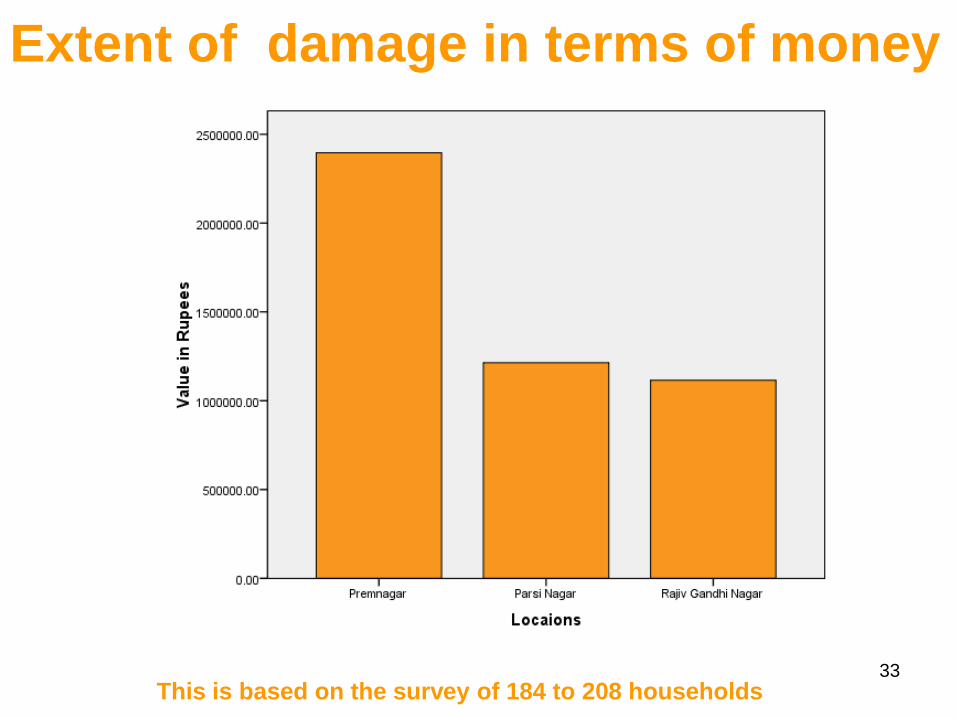
Extent of damage in terms of money
This is based on the survey of 184 to 208 households33

1. Language
2 Religion
3 Education
4 Occupation
5 Income
6 Household Size
7 Native Place
8 Period of staying
1. Water Supply
2 Sanitation Facility
1. Building Height
2 Building Structure
1. Level of
Water
2 Duration of
Water in
house
3 Duration of
water outside
the house
1. Death
2 No. of Injured
3 Health
Problem
1. Damage to
food
2 Damage to
durable
assets
3 Damage to
cloths
4 Damage to
building
5 Damage to
Raw materials
1. Job loss
2 Total
estimated
loss
Susceptibility
Indicator
Exposure
Damage / Loss
34
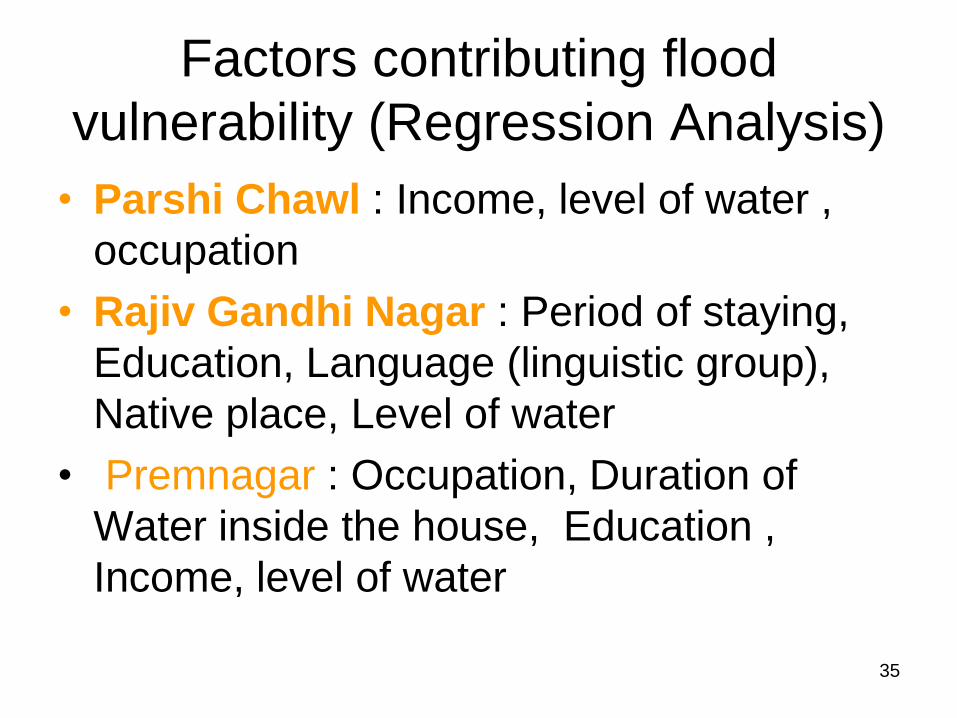
Factors contributing flood
vulnerability (Regression Analysis)
• Parshi Chawl : Income, level of water ,
occupation
• Rajiv Gandhi Nagar : Period of staying,
Education, Language (linguistic group),
Native place, Level of water
• Premnagar : Occupation, Duration of
Water inside the house, Education ,
Income, level of water
35
Will you leave to another place in
case of big flood
NO
36
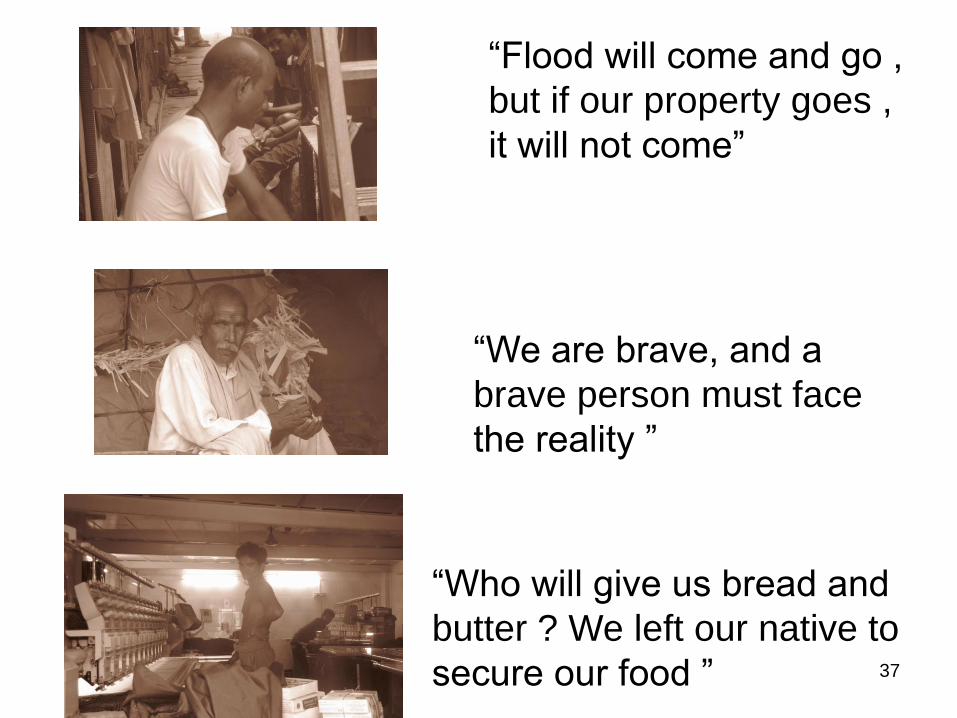
“Flood will come and go ,
but if our property goes ,
it will not come”
“Who will give us bread and
butter ? We left our native to
secure our food ”
“We are brave, and a
brave person must face
the reality ”
37
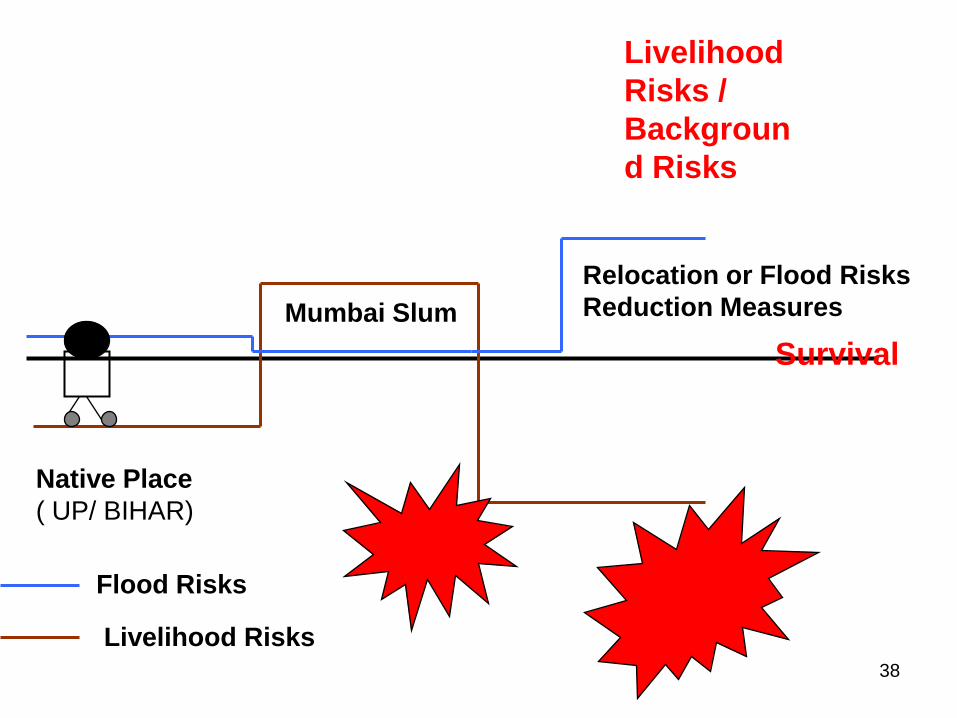
Native Place
( UP/ BIHAR)
Mumbai Slum
Relocation or Flood Risks
Reduction Measures
Livelihood
Risks /
Backgroun
d Risks
Flood Risks
Livelihood Risks
Survival
38

Physical Event
Social Vulnerabi
l-ity
Disaster
Requires largely technological solutions
•Manifested in quality ofinfrastructure, economy,environmental stability, whichare always determined byhuman interaction and behavior
•Non-structural solutions likeCapacity building, reduction ofsocial vulnerability in society
Vulnerability
39

Factors for Measuring
Vulnerability Pattern
Figure: Conceptual framework of household vulnerability elements
40

Indicators and variables of Household Profile
Indicator Variable
Socio-economic
Characteristics
Religion
Mother Tongue
Native Place
( The place from where the head of the household actually
migrated)
Period of Staying
Education
( Education level of the head of the household)
Income
(Income of the head of the household )
Housing
Characteristics
Housing Type
(Types of building materials )
Building height
Infrastructure
Source of water supply
Duration of receiving water
Sanitation Facility
41
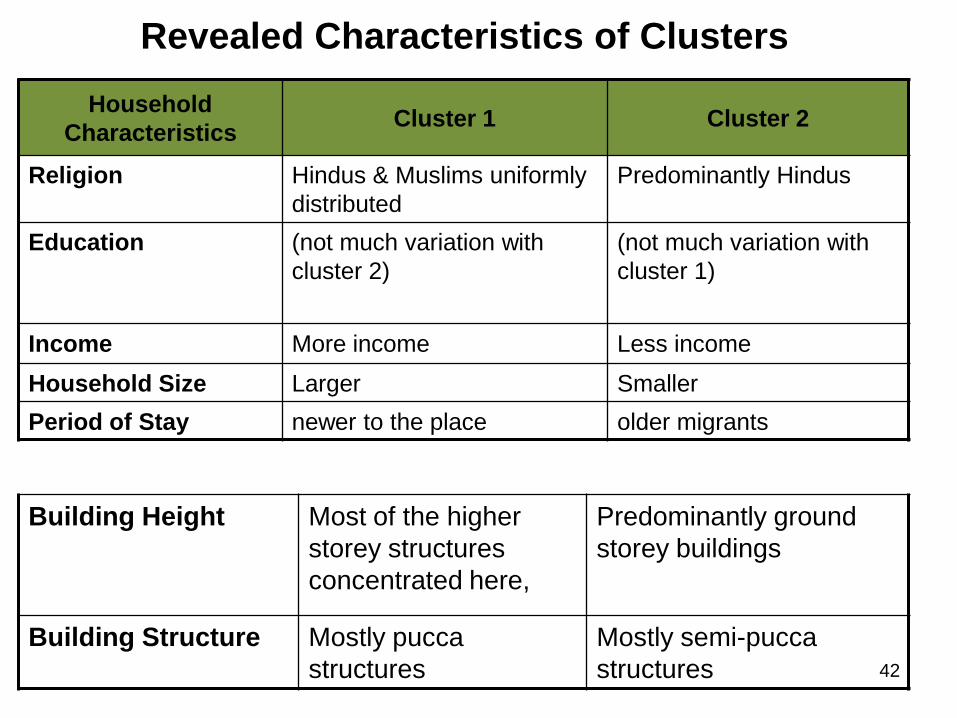
Revealed Characteristics of Clusters
Household
CharacteristicsCluster 1 Cluster 2
Religion Hindus & Muslims uniformly
distributed
Predominantly Hindus
Education (not much variation with
cluster 2)
(not much variation with
cluster 1)
Income More income Less income
Household Size Larger Smaller
Period of Stay newer to the place older migrants
Building Height Most of the higher
storey structures
concentrated here,
Predominantly ground
storey buildings
Building Structure Mostly pucca
structures
Mostly semi-pucca
structures 42
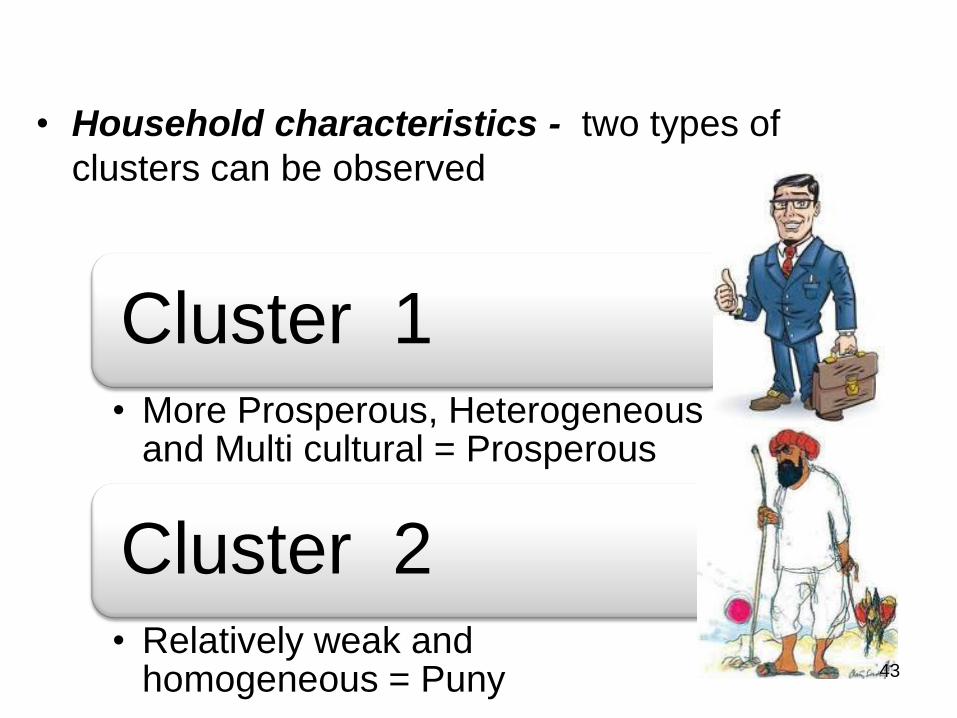
• Household characteristics - two types of
clusters can be observed
Cluster 1 • More Prosperous, Heterogeneous
and Multi cultural = Prosperous
Cluster 2 • Relatively weak and
homogeneous = Puny 43

Indicators and variables of
“Physical Condition of The Site And
House”
Indicator Variable
Extent and magnitude of
flood
Level of flood water inside the house
(in feet)
Duration of flood water inside the house
Duration of flood water outside the
housing or immediate surrounding
areas Note : All the variables of Physical Condition Of The Site And House are self reported.
44
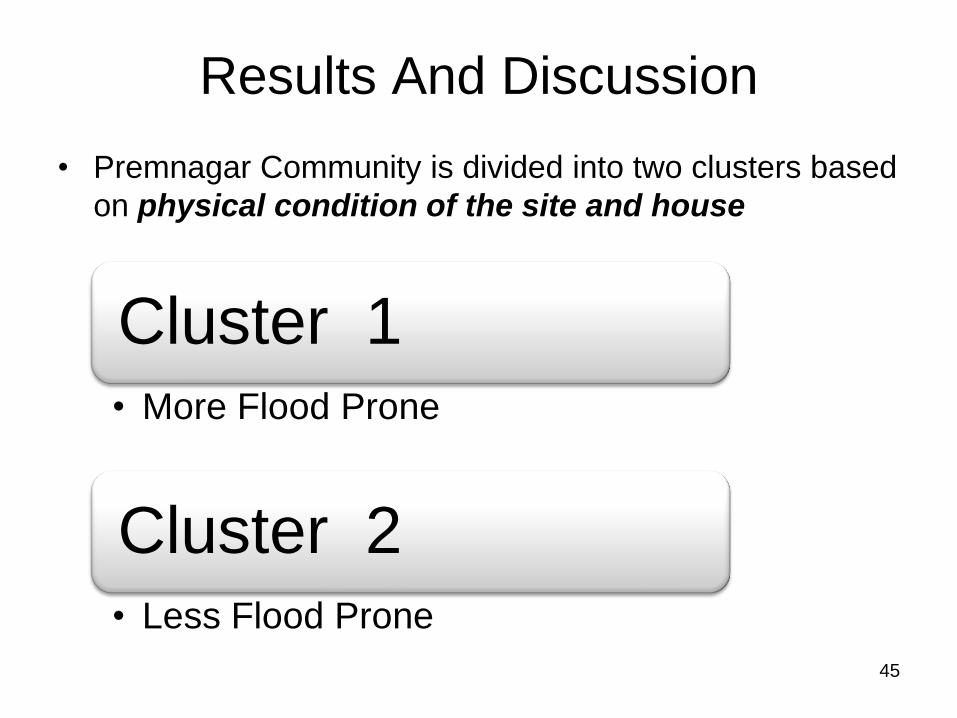
• Premnagar Community is divided into two clusters based
on physical condition of the site and house
Cluster 1 • More Flood Prone
Cluster 2 • Less Flood Prone
Results And Discussion
45
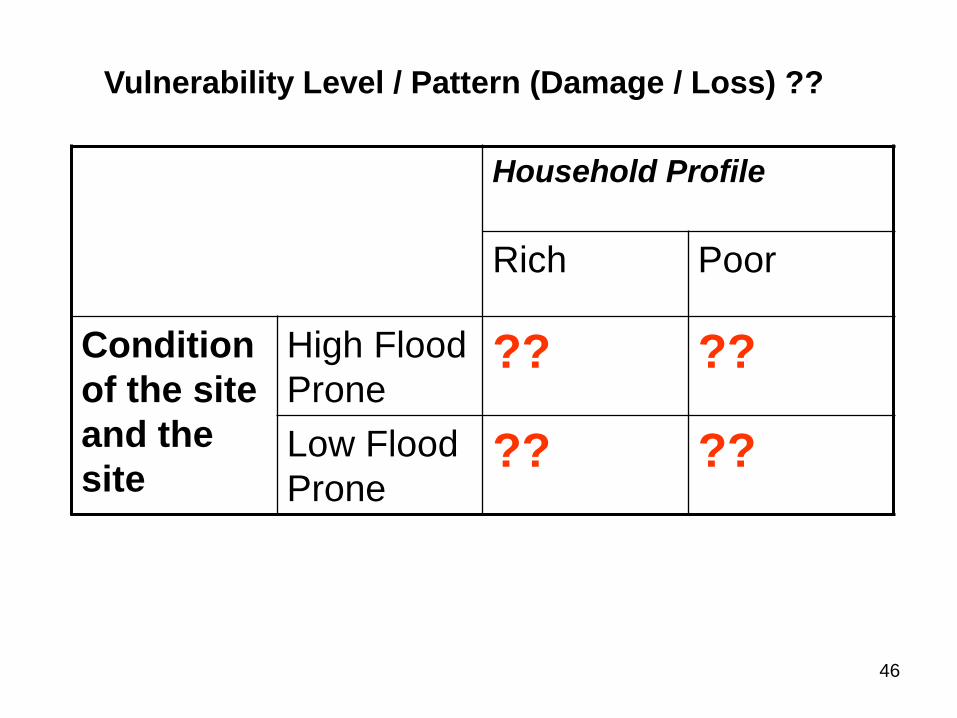
Household Profile
Rich Poor
Condition
of the site
and the
site
High Flood
Prone ?? ??
Low Flood
Prone ?? ??
Vulnerability Level / Pattern (Damage / Loss) ??
46

Vulnerability Level Damage / Loss
1) Total Monitory Loss
2) Damage to Cloths
3) Damage to Food
4) Damage to Household durable assets
5) Damage to building materials
47
Observed Vulnerability Pattern
• “Two way ANOVA” was performed to examine the
vulnerability pattern of Premnagar, considering two
factors:
Household Profile
Physical Condition Of The Site And House
48
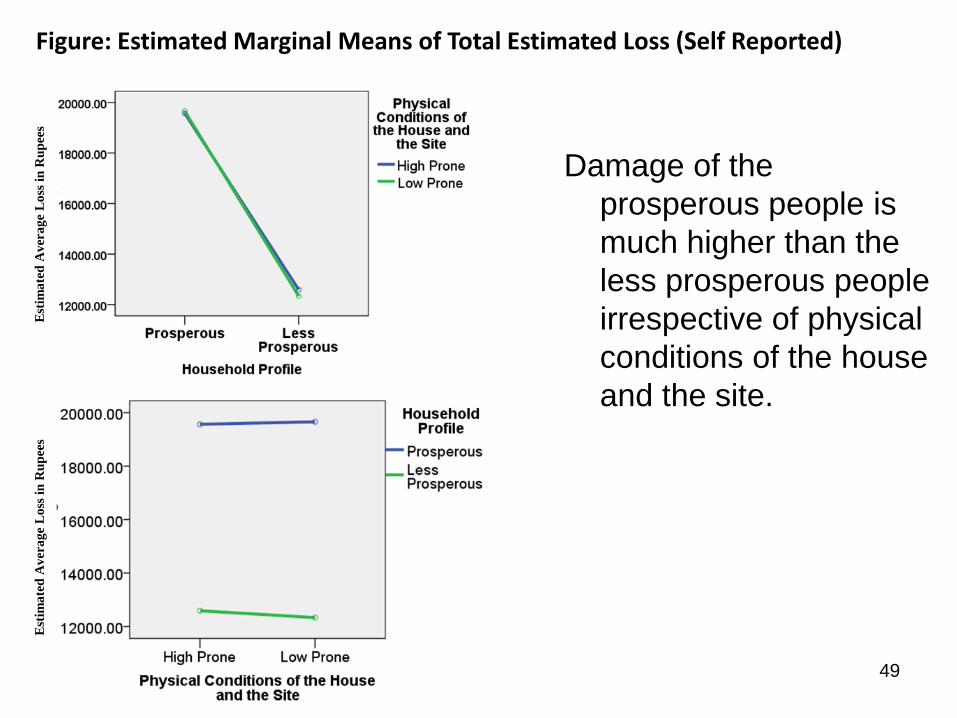
Figure: Estimated Marginal Means of Total Estimated Loss (Self Reported)E
stim
ate
d A
ver
ag
e L
oss
in
Ru
pee
sE
stim
ate
d A
ver
ag
e L
oss
in
Ru
pee
s
Damage of the
prosperous people is
much higher than the
less prosperous people
irrespective of physical
conditions of the house
and the site.
49

Damage to Food Damage to Cloths
less prosperous people/ poor
reported higher loss Households who are high prone
to flood is more vulnerable
irrespective of their household
profile background50
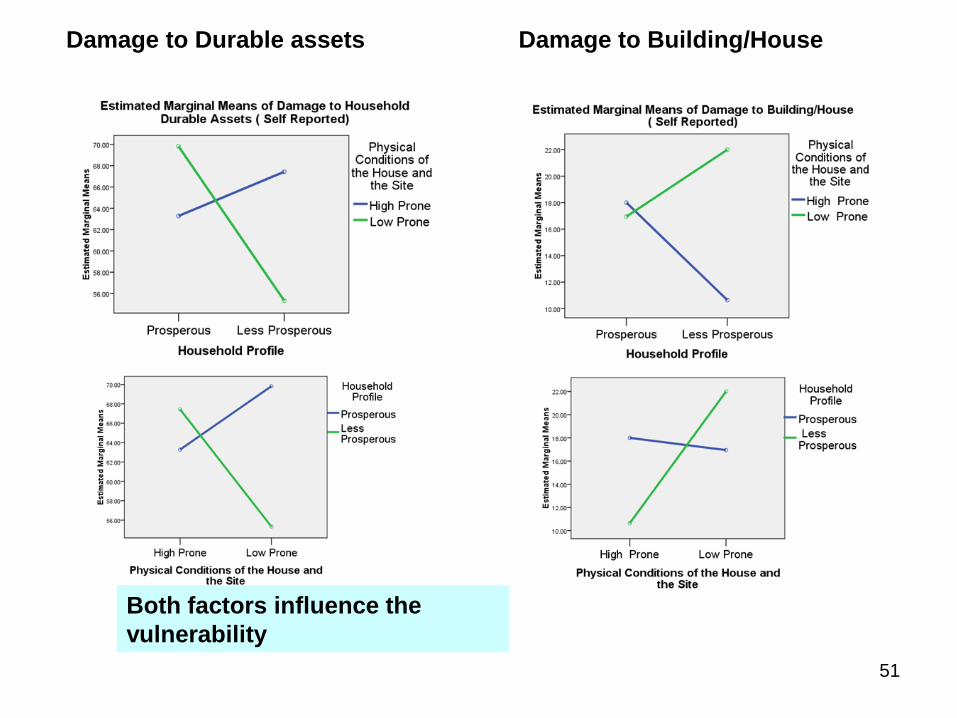
Damage to Durable assets Damage to Building/House
Both factors influence the
vulnerability
51
Conclusions
• Prosperous people have more money loss than poor
irrespective of the level/exposure of flood
• Poor People have more damage to food stored in house
than prosperous group irrespective of their level of hazard.
• Household of high flood prone category reported more
loss to clothes than low flood prone category
irrespective of their household profile.
52
Conclusions
• Combined impact of household profile and physical
condition of the house and the site is observed in all
kinds of damage, but no particular pattern of common
impact on vulnerability has emerged.
53
Working with the People
54

Communities are Primary Victims
Affected Communities First
To Respond To Emergencies
Direct / First Hand Experience Revealed
Local Perceptions & Priorities are
known
Easier To Know People’s Coping
Strategies, Adaptation
Easier To Assess Their Needs &
Analyze Problems
Use of Local / Indigenous Knowledge
Easier Acceptability of Projects &
working collectively
55
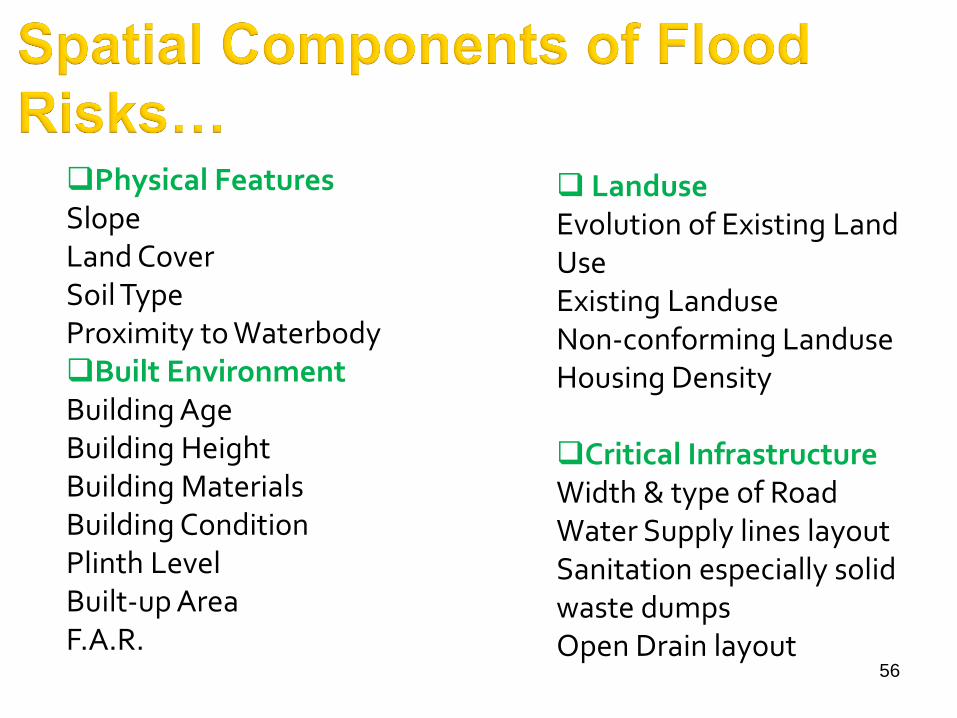
Physical Features SlopeLand CoverSoil TypeProximity to WaterbodyBuilt EnvironmentBuilding AgeBuilding HeightBuilding MaterialsBuilding ConditionPlinth LevelBuilt-up AreaF.A.R.
LanduseEvolution of Existing Land UseExisting LanduseNon-conforming LanduseHousing Density
Critical InfrastructureWidth & type of Road Water Supply lines layoutSanitation especially solid waste dumpsOpen Drain layout
56
• Flood Duration
• Water Level during Flood
• Velocity of water flow
• Frequency of Flood
• Flood water mix with debris, wastes and
chemicals.
57

Micro Hotspot @ Dharavi
Mithi River
Rajiv Gandhi Nagar
58
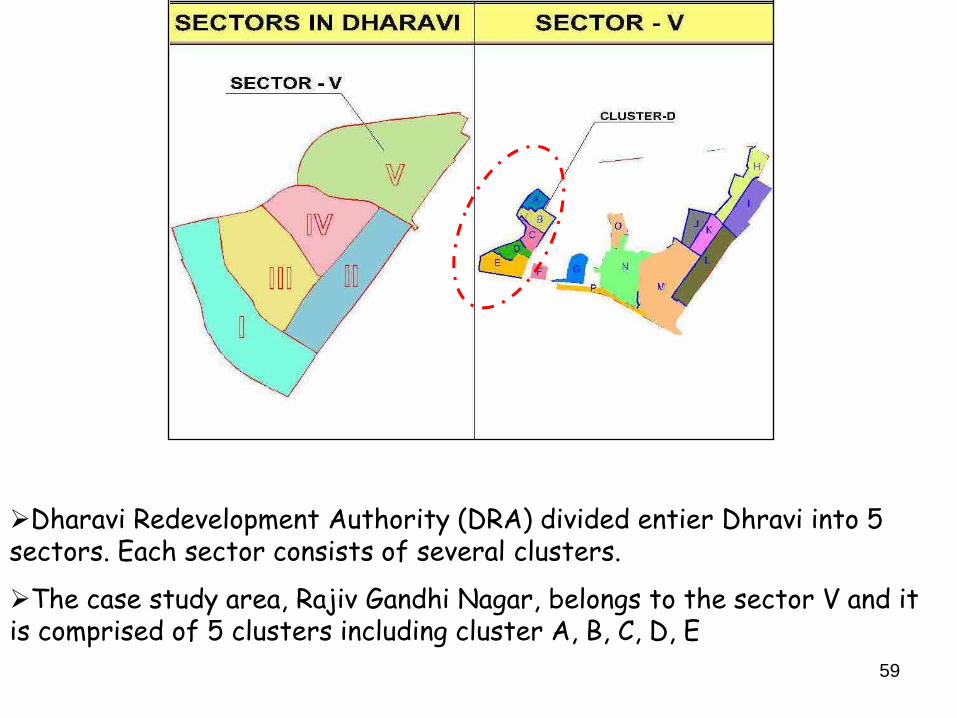
Dharavi Redevelopment Authority (DRA) divided entier Dhravi into 5 sectors. Each sector consists of several clusters.
The case study area, Rajiv Gandhi Nagar, belongs to the sector V and it is comprised of 5 clusters including cluster A, B, C, D, E
59

Rajiv Gandhi Nagar
60
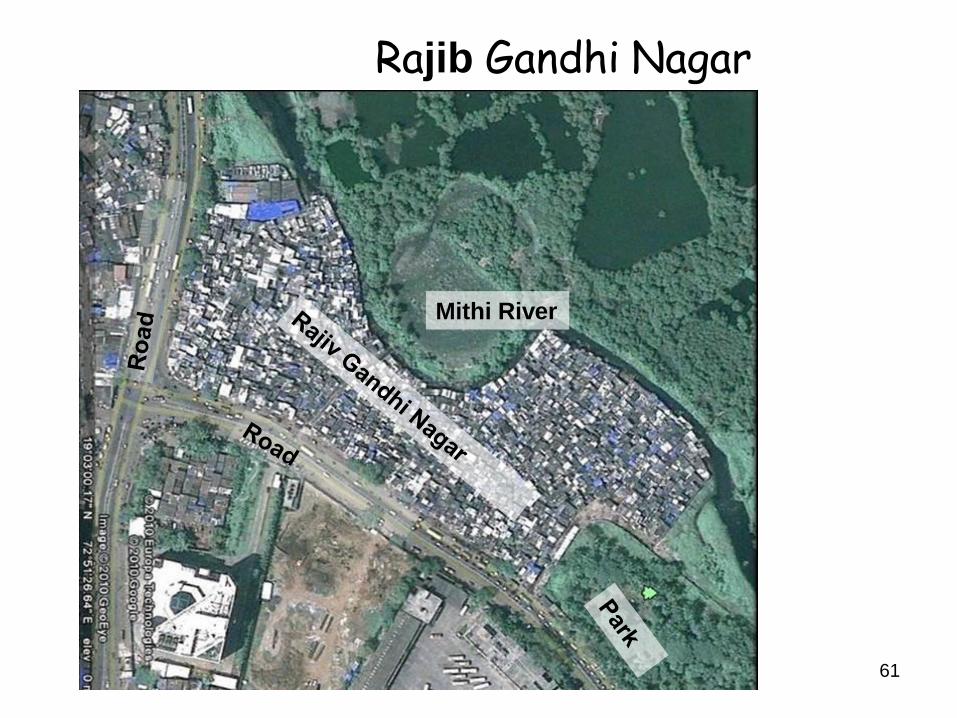
Mithi River
Rajib Gandhi Nagar
61

Population : 20,000 ( Approximate)
Area : 100 sq.m
Age of the Settlement : 25 – 30 Years
Landuse : Mainly residential
Settlement Characteristics :
• Located on a site which previously was a marshy land with mangrove forest in the flood plain of the Mithi River.
• Most recently developed portion of Dharavi Slum area
• The area was very severely affected by the 2005 flood disaster and because of the low lying terrain the area experiences water logging or local flood every year.
Rajiv Gandhi Nagar
62
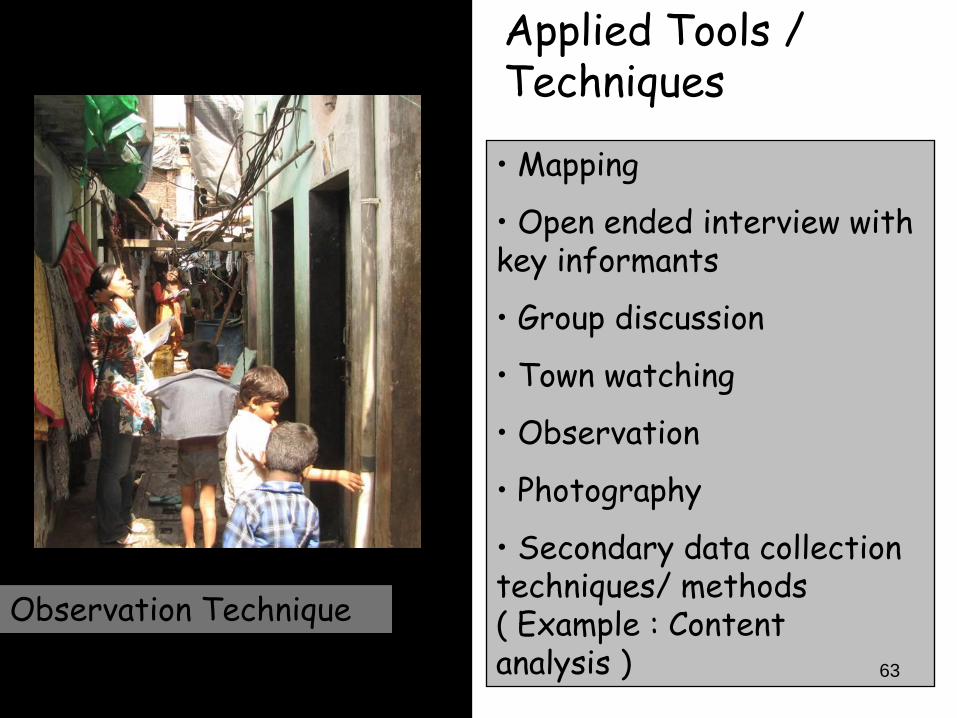
Applied Tools / Techniques
• Mapping
• Open ended interview with key informants
• Group discussion
• Town watching
• Observation
• Photography
• Secondary data collection techniques/ methods ( Example : Content analysis )
Observation Technique
63
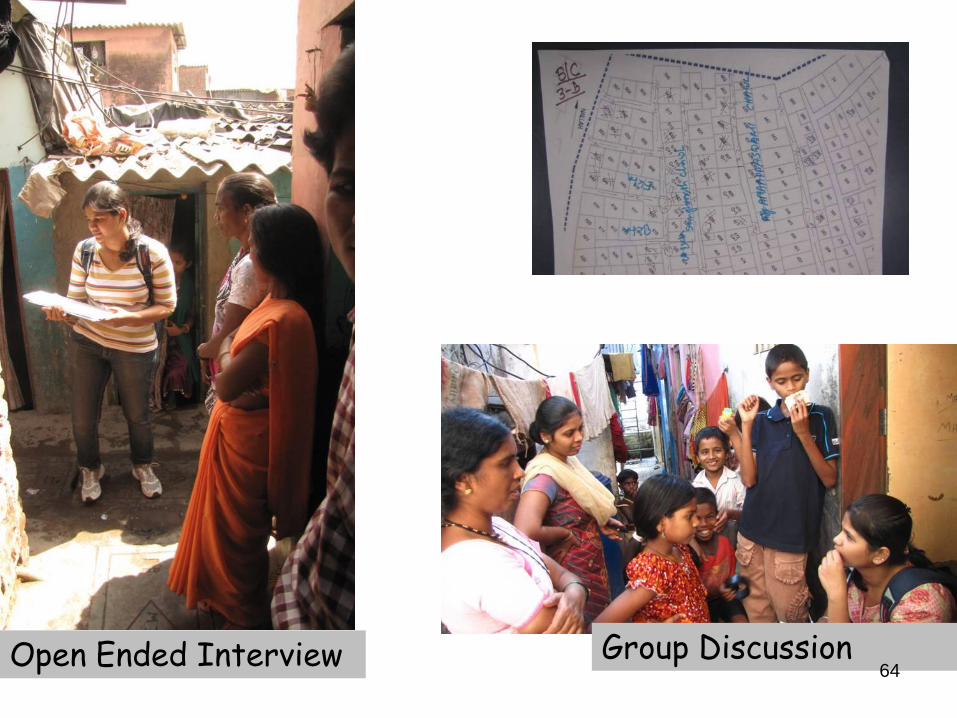
Open Ended Interview Group Discussion64
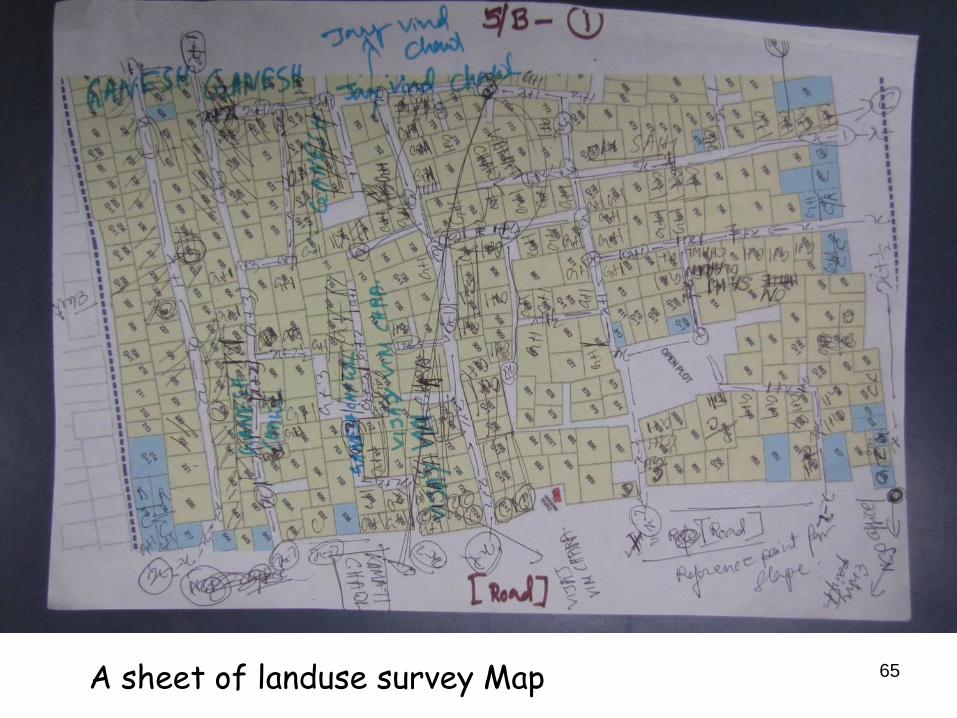
A sheet of landuse survey Map 65

Participating Stakeholders
Level of Participation
GCOE Research Team ( including surveyors)
Local Community Members
MCGM (Field Officers)
Political/ Religious Organization
Less Active
Highly Active
Participating Stakeholders/ Agency
66
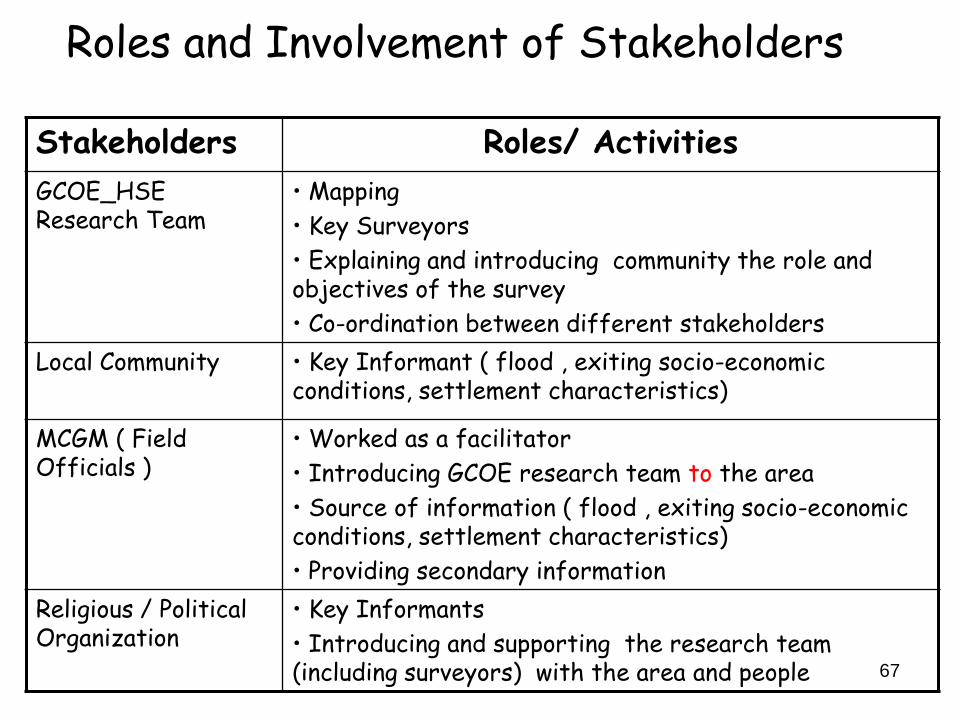
Stakeholders Roles/ Activities
GCOE_HSE Research Team
• Mapping
• Key Surveyors
• Explaining and introducing community the role and objectives of the survey
• Co-ordination between different stakeholders
Local Community • Key Informant ( flood , exiting socio-economic conditions, settlement characteristics)
MCGM ( Field Officials )
• Worked as a facilitator
• Introducing GCOE research team to the area
• Source of information ( flood , exiting socio-economic conditions, settlement characteristics)
• Providing secondary information
Religious / Political Organization
• Key Informants
• Introducing and supporting the research team (including surveyors) with the area and people
Roles and Involvement of Stakeholders
67
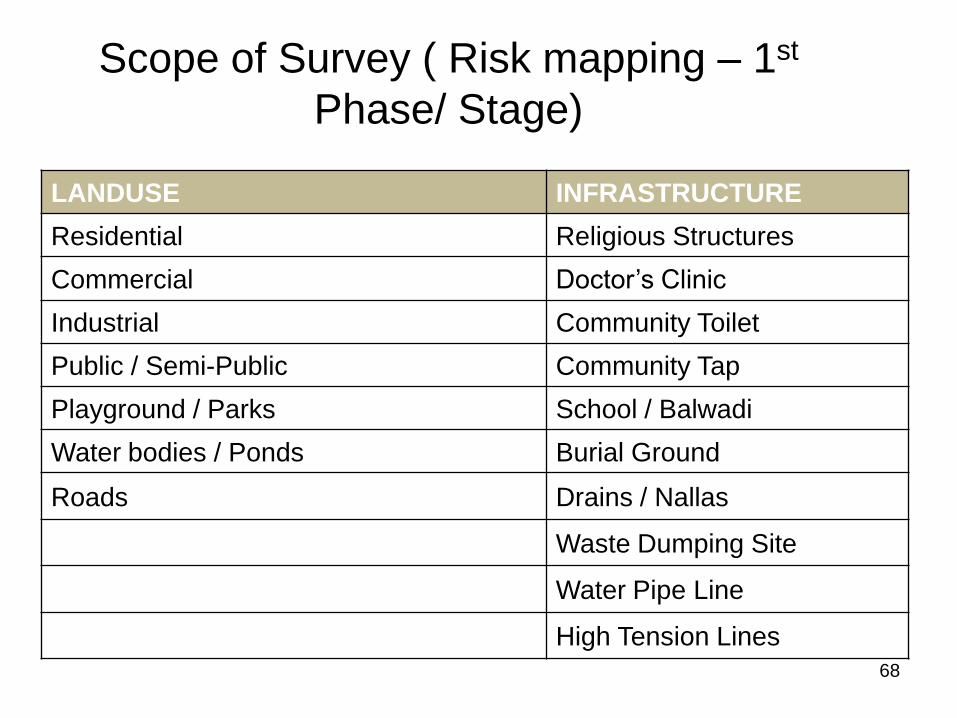
Scope of Survey ( Risk mapping – 1st
Phase/ Stage)
LANDUSE INFRASTRUCTURE
Residential Religious Structures
Commercial Doctor’s Clinic
Industrial Community Toilet
Public / Semi-Public Community Tap
Playground / Parks School / Balwadi
Water bodies / Ponds Burial Ground
Roads Drains / Nallas
Waste Dumping Site
Water Pipe Line
High Tension Lines
68
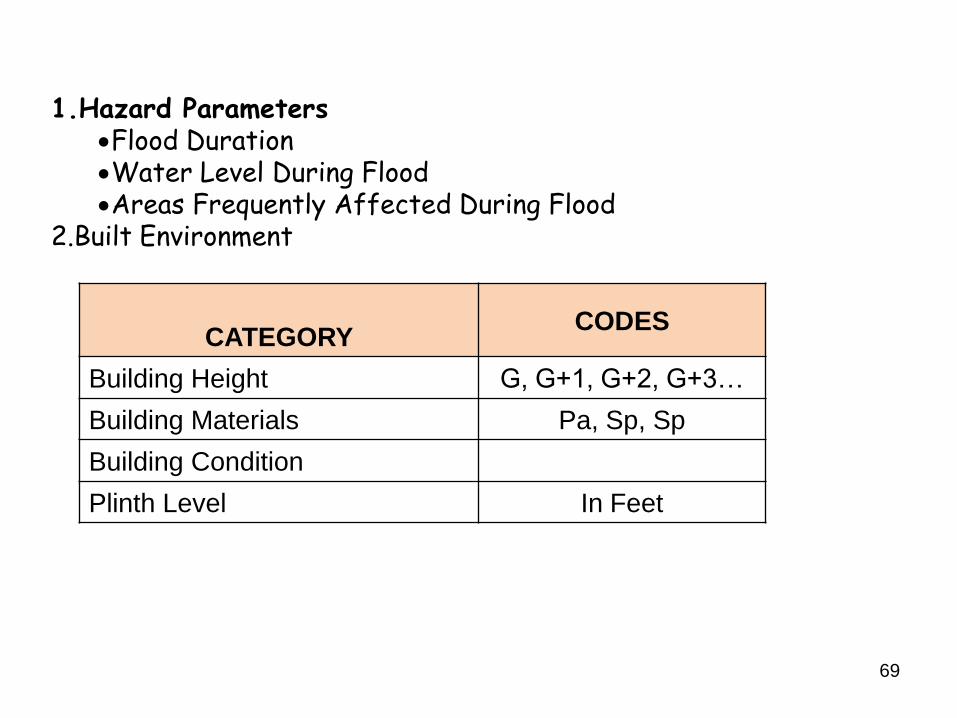
1.Hazard ParametersFlood Duration Water Level During FloodAreas Frequently Affected During Flood
2.Built Environment
CATEGORY CODES
Building Height G, G+1, G+2, G+3…
Building Materials Pa, Sp, Sp
Building Condition
Plinth Level In Feet
69
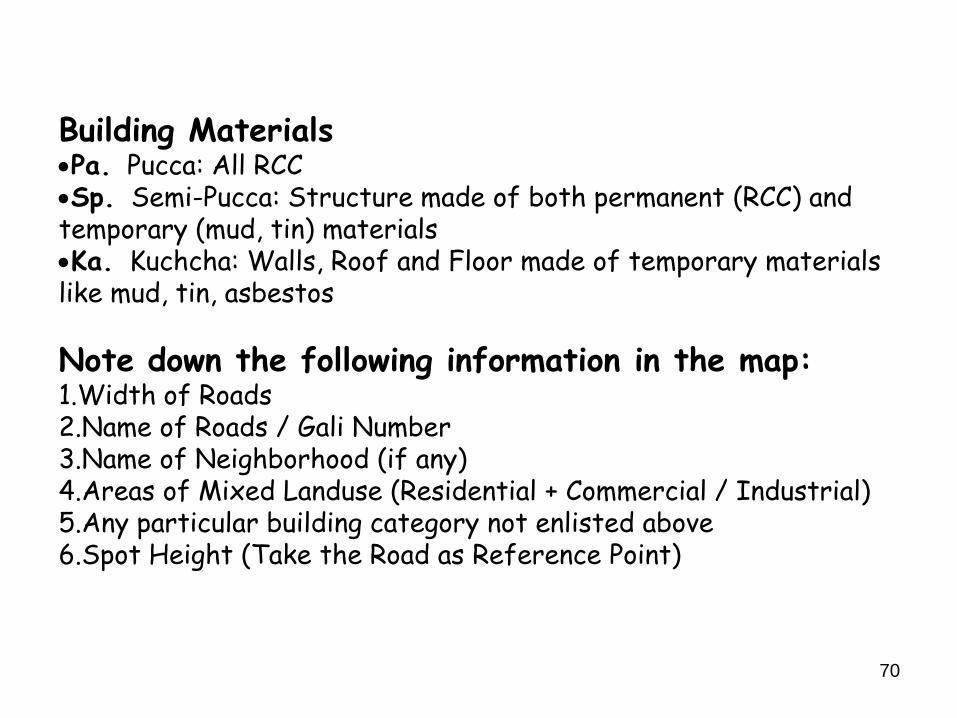
Building MaterialsPa. Pucca: All RCCSp. Semi-Pucca: Structure made of both permanent (RCC) and temporary (mud, tin) materialsKa. Kuchcha: Walls, Roof and Floor made of temporary materials like mud, tin, asbestos
Note down the following information in the map:1.Width of Roads2.Name of Roads / Gali Number3.Name of Neighborhood (if any)4.Areas of Mixed Landuse (Residential + Commercial / Industrial)5.Any particular building category not enlisted above6.Spot Height (Take the Road as Reference Point)
70
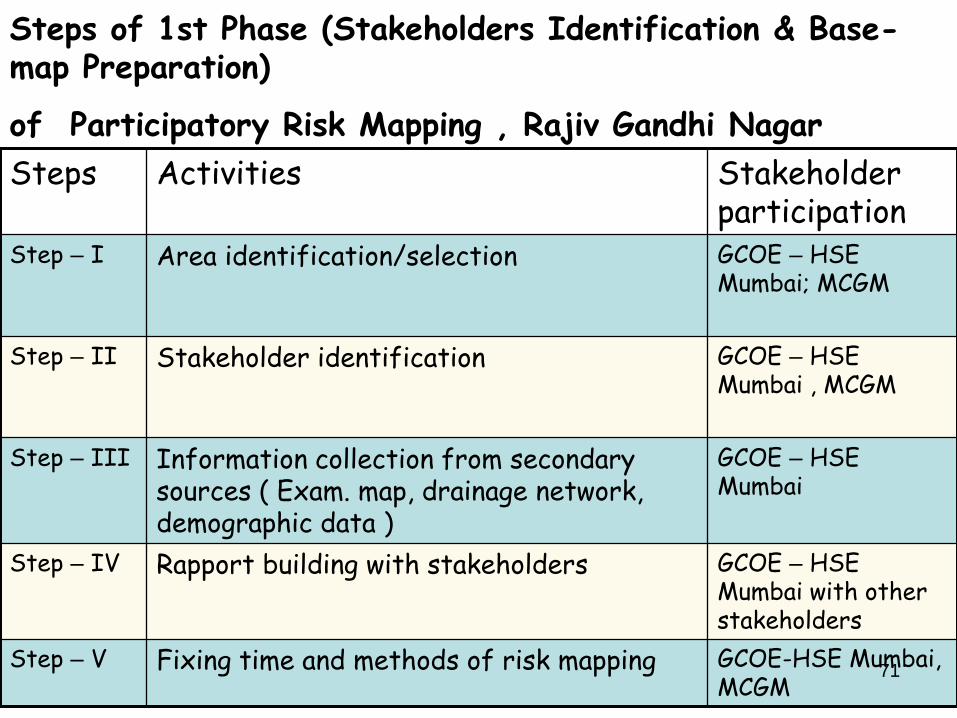
Steps Activities Stakeholder participation
Step – I Area identification/selection GCOE – HSE Mumbai; MCGM
Step – II Stakeholder identification GCOE – HSE Mumbai , MCGM
Step – III Information collection from secondary sources ( Exam. map, drainage network, demographic data )
GCOE – HSE Mumbai
Step – IV Rapport building with stakeholders GCOE – HSE Mumbai with other stakeholders
Step – V Fixing time and methods of risk mapping GCOE-HSE Mumbai, MCGM
Steps of 1st Phase (Stakeholders Identification & Base-map Preparation)
of Participatory Risk Mapping , Rajiv Gandhi Nagar
71
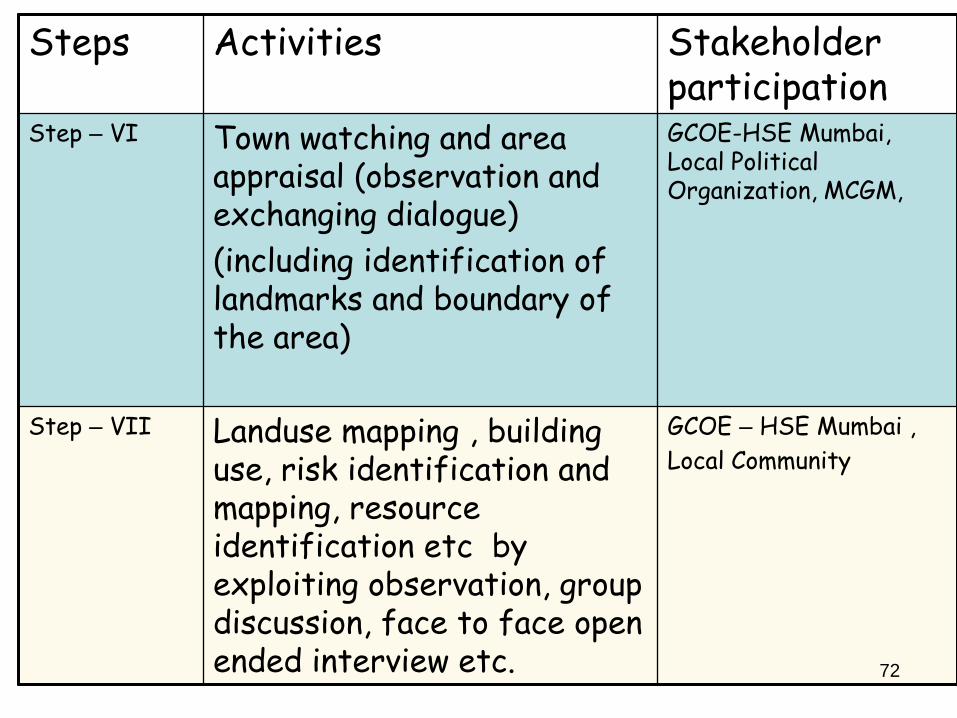
Steps Activities Stakeholder participation
Step – VI Town watching and area appraisal (observation and exchanging dialogue)
(including identification of landmarks and boundary of the area)
GCOE-HSE Mumbai, Local Political Organization, MCGM,
Step – VII Landuse mapping , building use, risk identification and mapping, resource identification etc by exploiting observation, group discussion, face to face open ended interview etc.
GCOE – HSE Mumbai ,
Local Community
72
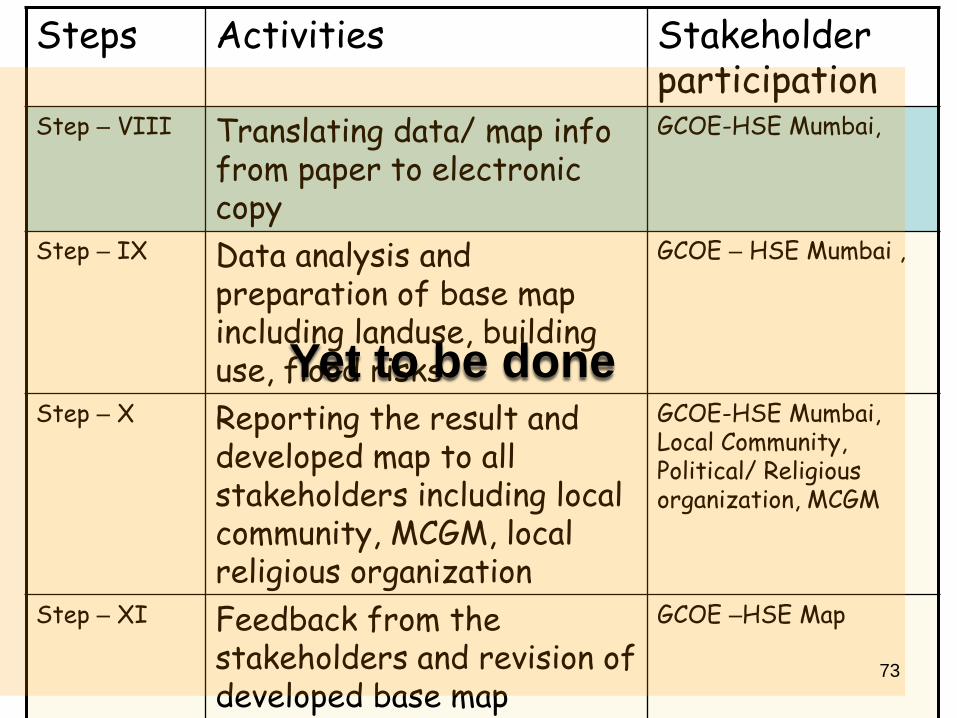
Steps Activities Stakeholder participation
Step – VIII Translating data/ map info from paper to electronic copy
GCOE-HSE Mumbai,
Step – IX Data analysis and preparation of base map including landuse, building use, flood risks
GCOE – HSE Mumbai ,
Step – X Reporting the result and developed map to all stakeholders including local community, MCGM, local religious organization
GCOE-HSE Mumbai, Local Community, Political/ Religious organization, MCGM
Step – XI Feedback from the stakeholders and revision of developed base map
GCOE –HSE Map
Yet to be done
73
Fact Findings
We have just finished the survey or more to say it is still
going on, so the digitization of map and transferring data
into electric file have not been completed yet. The findings
mentioned here are some general observation
74
Origin and Growth of the settlement
75
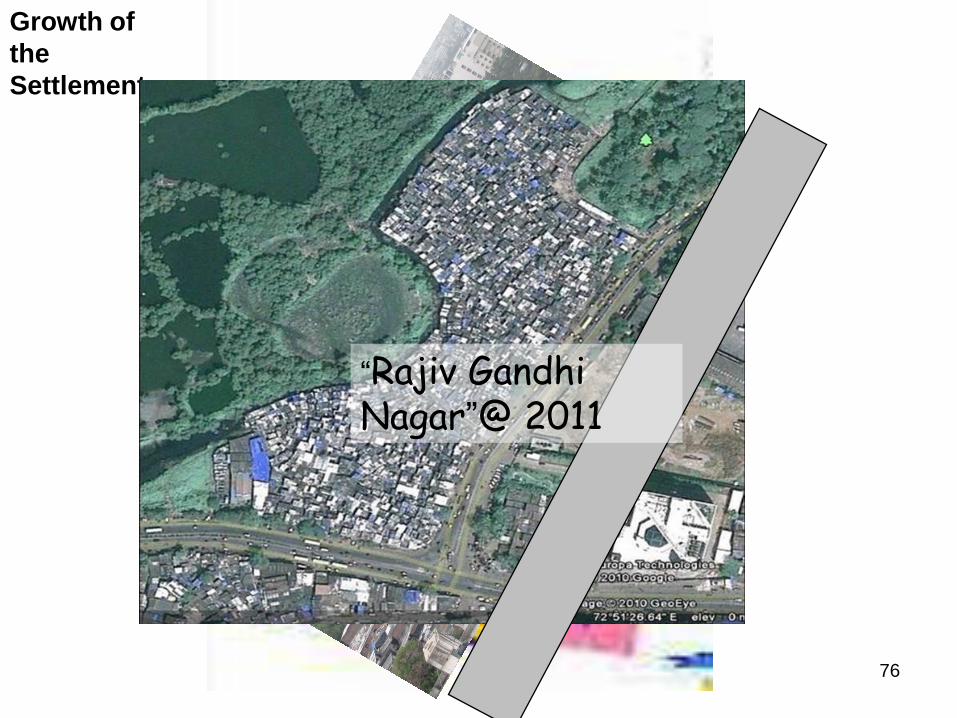
Growth of
the
Settlement
The entire area was
a marshy land
abounded by
mangrove forest on
the bank Mithi
River
198019851990
“Rajiv Gandhi Nagar”@ 2011
76
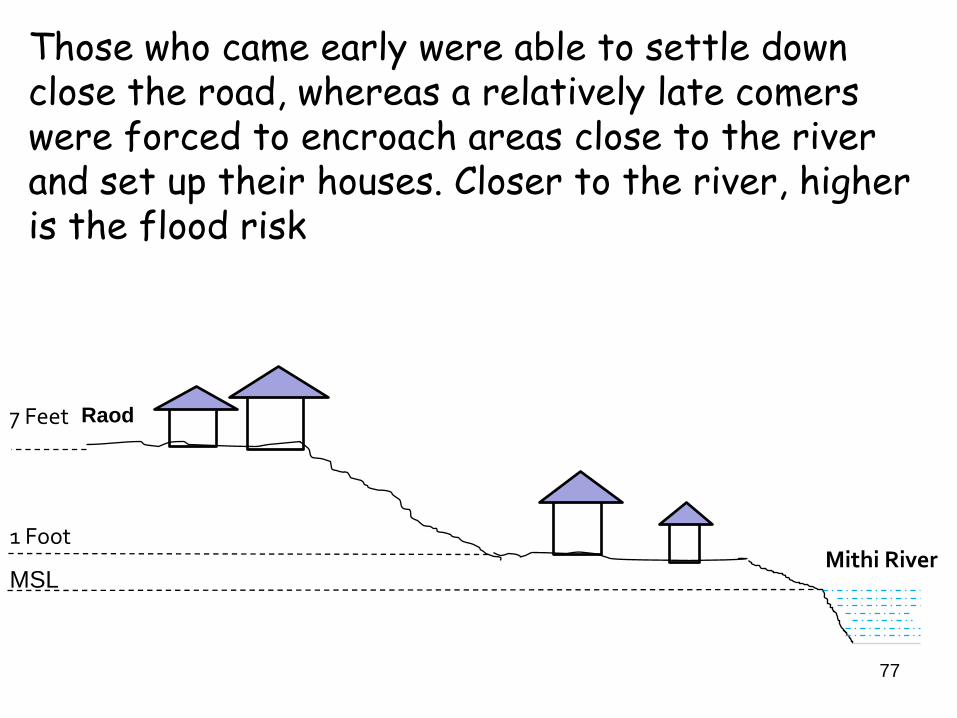
1 Foot
7 Feet
MSLMithi River
Raod
Those who came early were able to settle down close the road, whereas a relatively late comers were forced to encroach areas close to the river and set up their houses. Closer to the river, higher is the flood risk
77
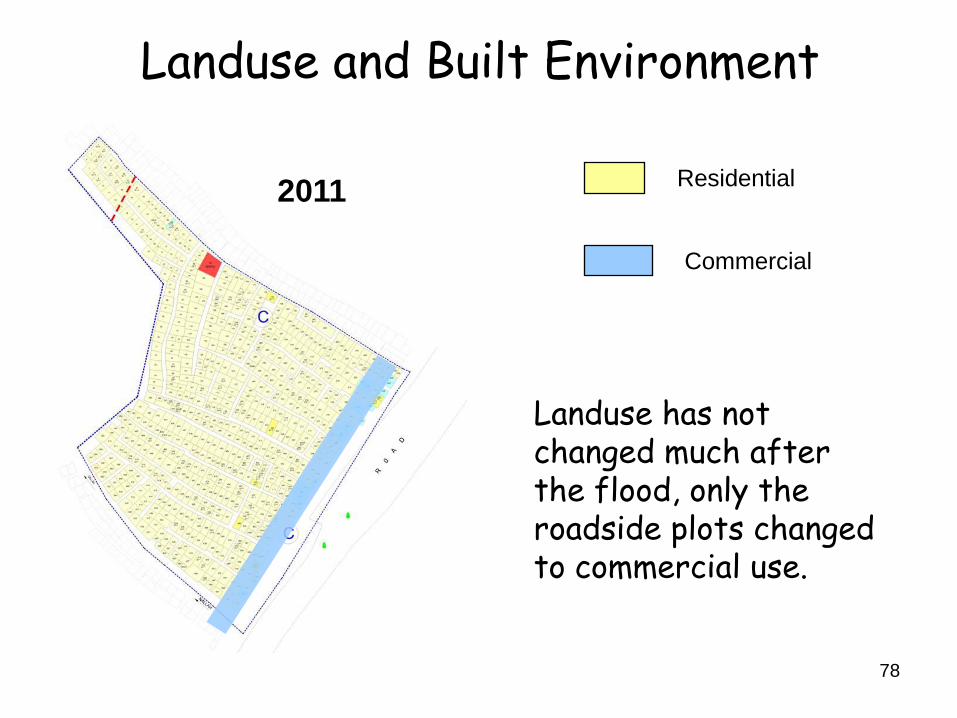
Residential
Commercial
2006
Landuse has not changed much after the flood, only the roadside plots changed to commercial use.
2011
Landuse and Built Environment
78

A significant number of residential structures turned into G+ 1 structure after the flood.
Semi – concrete structures turned into concrete structures
Community reported a bulk number of them built G+ 1 structure after the flood in order to avoid flood risks
G + 1 construction is illegal in Rajiv Gandhi Nagar
79
Infrastructure
80

Pipe water supply in form of free public taps and private supply with cost was introduced by BMC in 2009 to parts of the community.
In areas where people do not yet have pipe water supply people buy water from BMC water tanker ( INR 200/ month)
One public water-tap is shared by 4 to 5 households
Water supply is for 5 to 6 hours in the morning .
Those who could not pay or afford the water pipeline installation cost, normallyborrow water from those who have private water pipe line and in return pay 200/300 INR to the owner
Water Supply
81
82
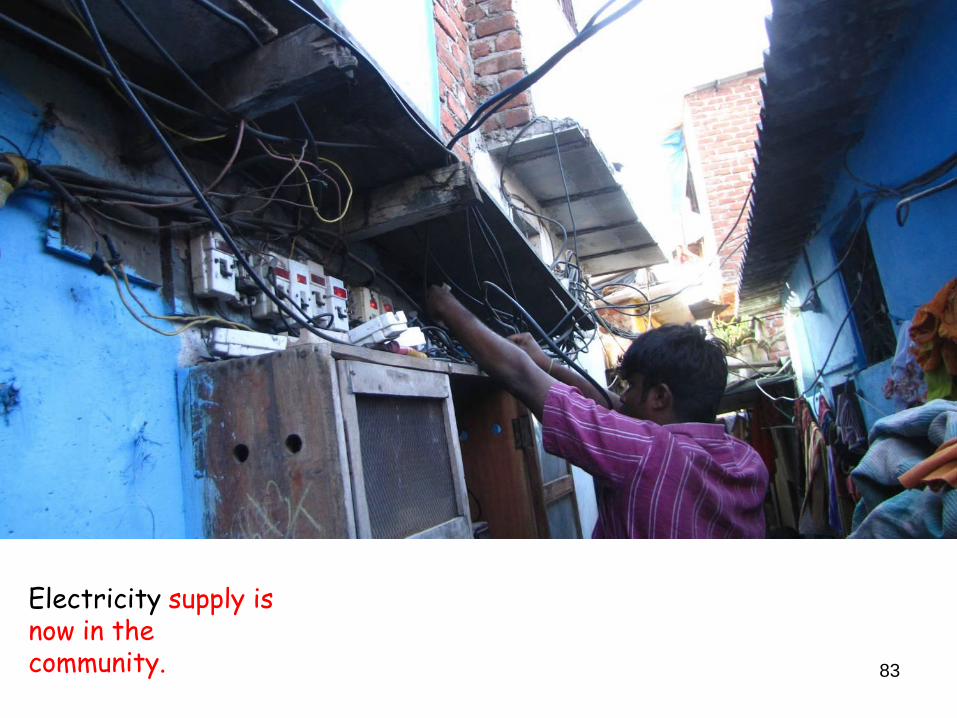
Electricity supply is now in the community. 83
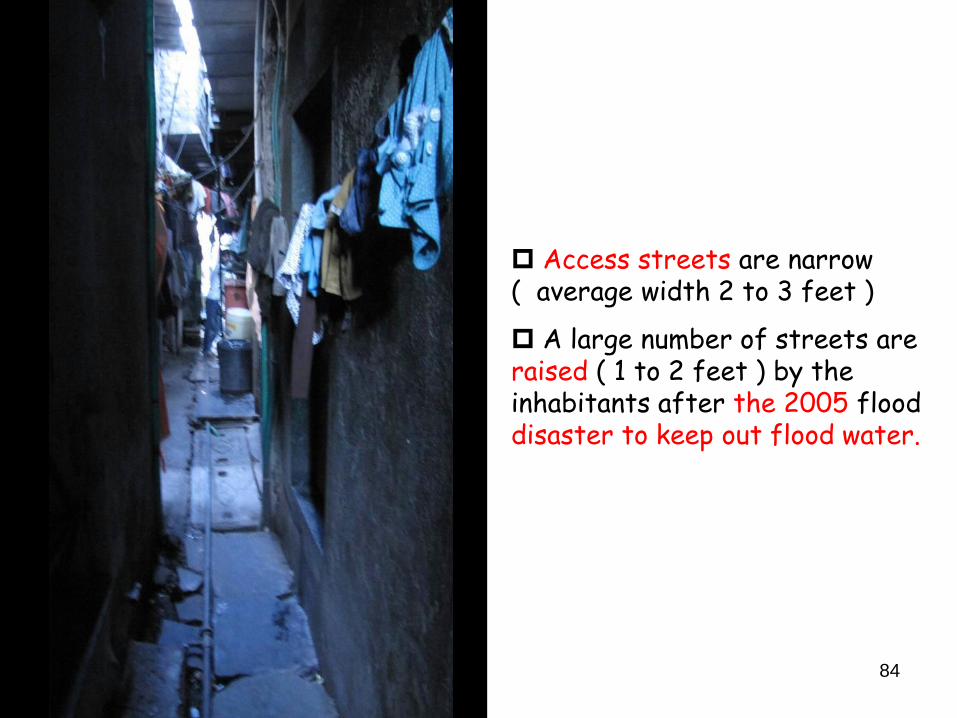
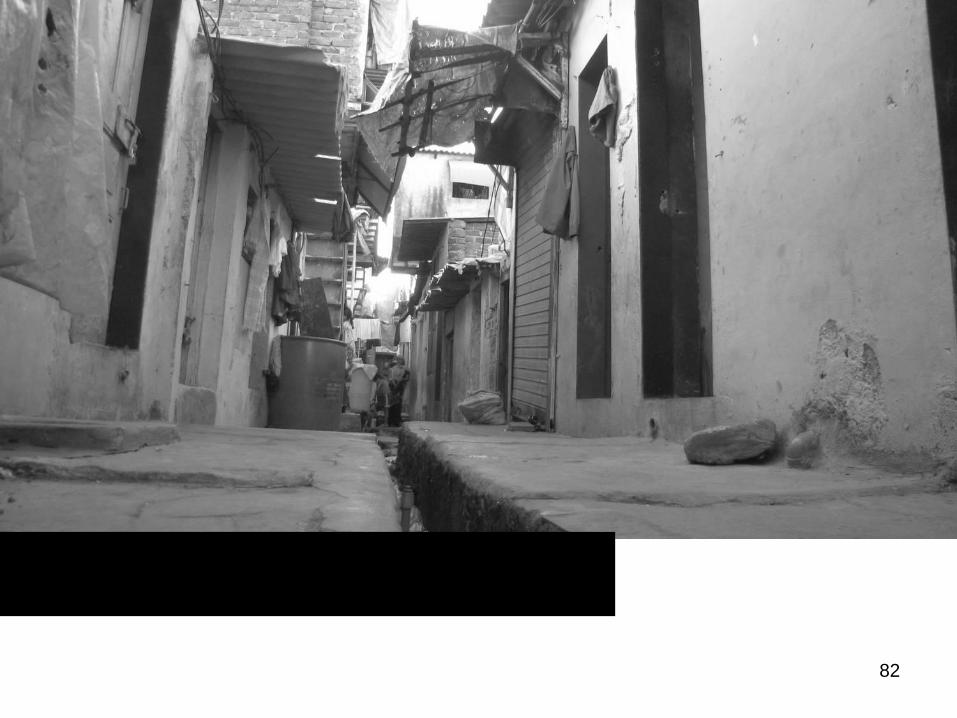
Access streets are narrow ( average width 2 to 3 feet )
A large number of streets are raised ( 1 to 2 feet ) by the inhabitants after the 2005 flood disaster to keep out flood water.
84

85
Flood @ 2005
86
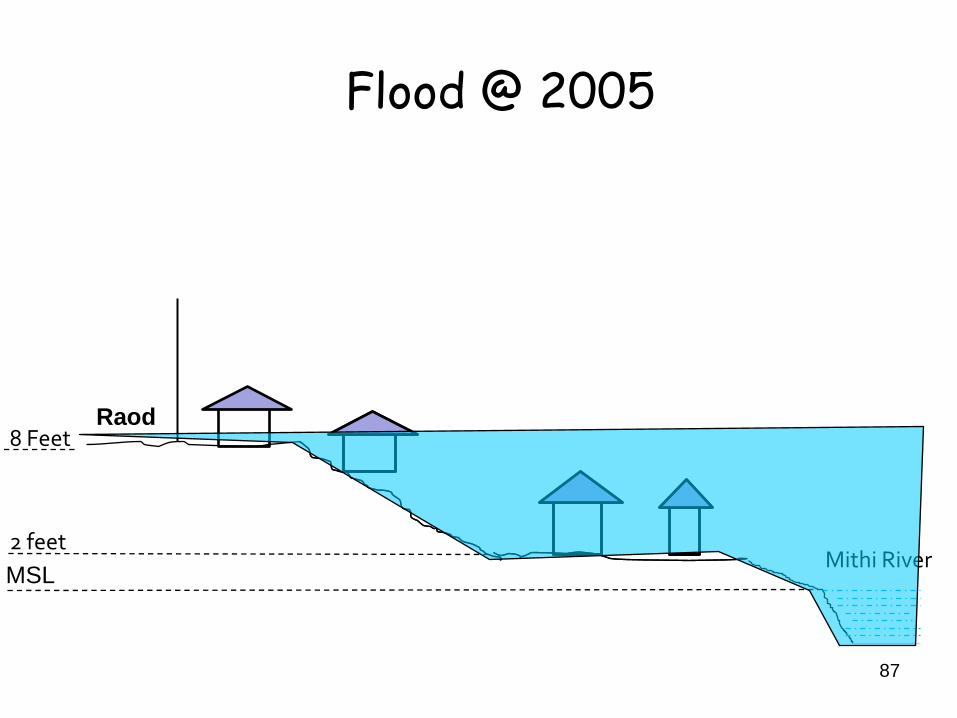
2 feet
8 Feet
MSLMithi River
Raod
Flood @ 2005
87
Common Reasons for Not Early
Evacuation during 2005 Flood
( Hierarchical order )
• Flood was unpredictable: Community thought flood water would flash back as the tide flow.
• No early warning by mass media / local Govt./ Non-Govt. organization and no planning for evacuation.
• The head of the household (male member) was outside the house and could not came back to house during flood as the roads were blocked. In the absence of male members, the family members could not decide whether they will evacuate or not.
• It was too late to evacuate when they decided to evacuate as the roads were already submerged and unusable.
• Fear of loosing property• No knowledge with the people where to evacuate to and of
course the least risky route of evacuation.• Within short time the entire area was submerged, shelter at
only roof tops or on to the road at higher level than flood.. 88
Nature of Evacuation
• Majority of them evacuated to the nearby roadside or railway station at the last moment when flood water already reached 3 feet height
• A few stayed on their own house (on the roof ) as because when they decided to evacuate it was impossible to evacuate as roads were already submerged.
• A very few went to their upper floor or neighbors’ house having upper floor (G+ 1 Structure) 89
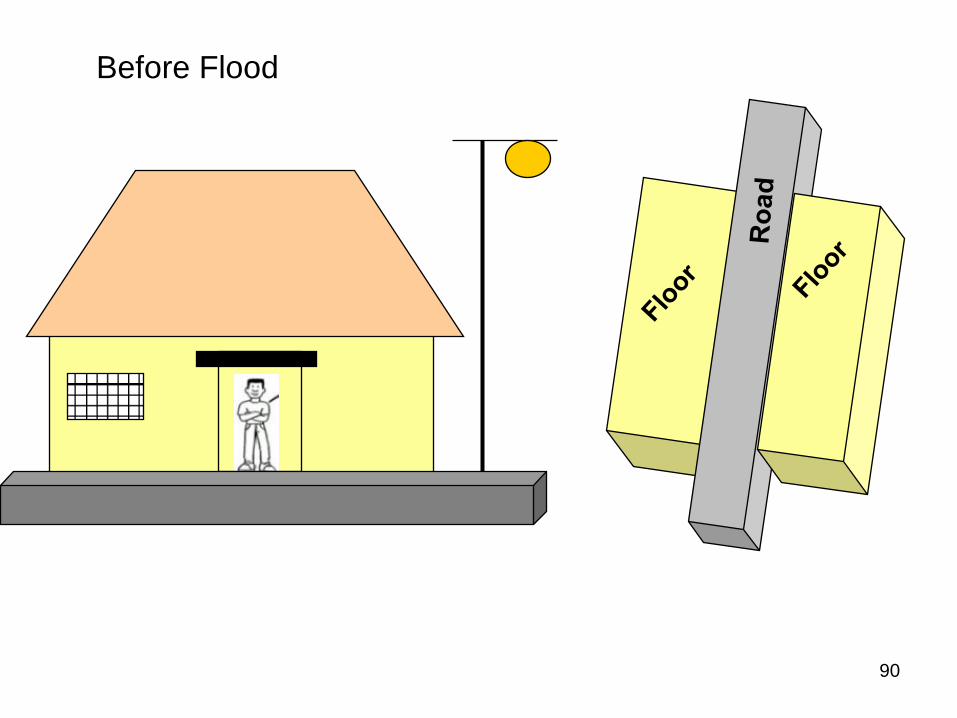
Before Flood
90
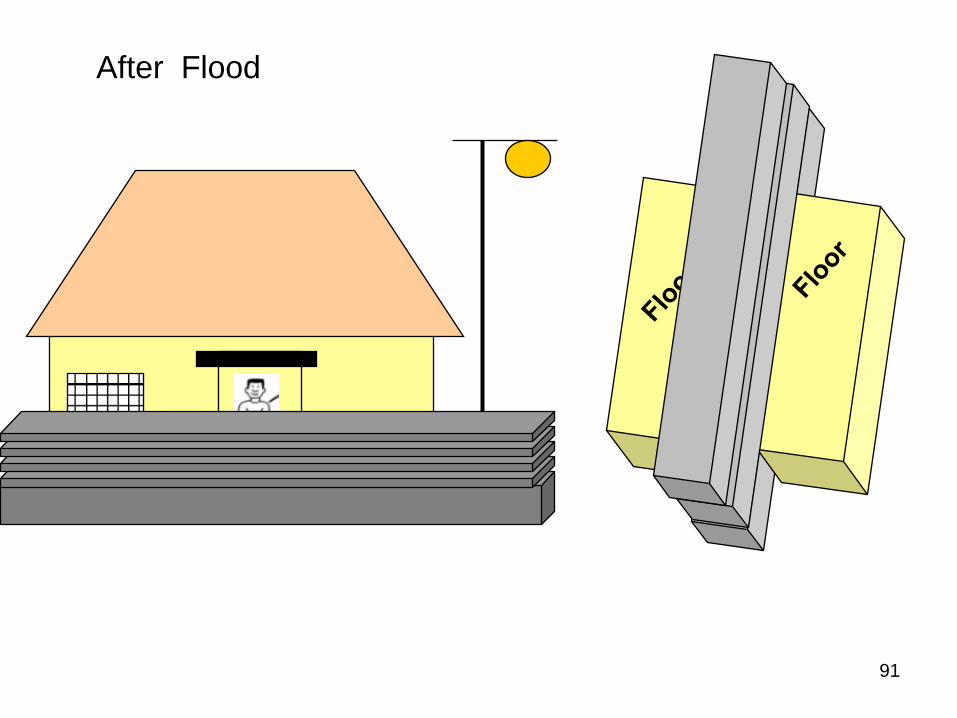
After Flood
91
92
93
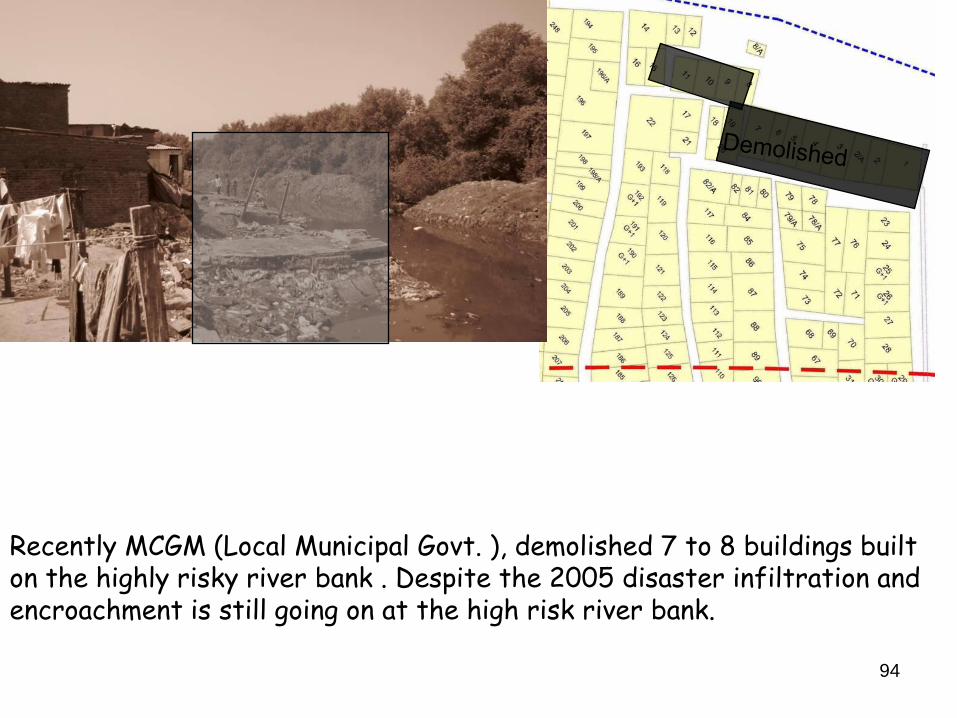
Recently MCGM (Local Municipal Govt. ), demolished 7 to 8 buildings built on the highly risky river bank . Despite the 2005 disaster infiltration and encroachment is still going on at the high risk river bank.
94

The Outcome of 1st Phase
Participatory Risk Mapping
• Developing base map & documenting base information (Objective Findings) – Knowing the process of developing and updating base information (spatial risk nature and characteristics) by involving various stakeholders, particularly the local participants
• Reducing data gap • Built up network and interaction between stakeholders • Creating and building platform for implementation of
Integrated Community Action Plan ( Example. Yomenkaigi System)
• Strengthening the process of stakeholder selection for practicing participatory risk mapping and action plan
95

Coping Capacity Process
( Mental Model)
Risk
Perception
Self Efficacy
Response Efficacy
Intention Preventive
behavior
Adoption
Model to explain behavioral intention and the role or influence of Self – Efficacy
96
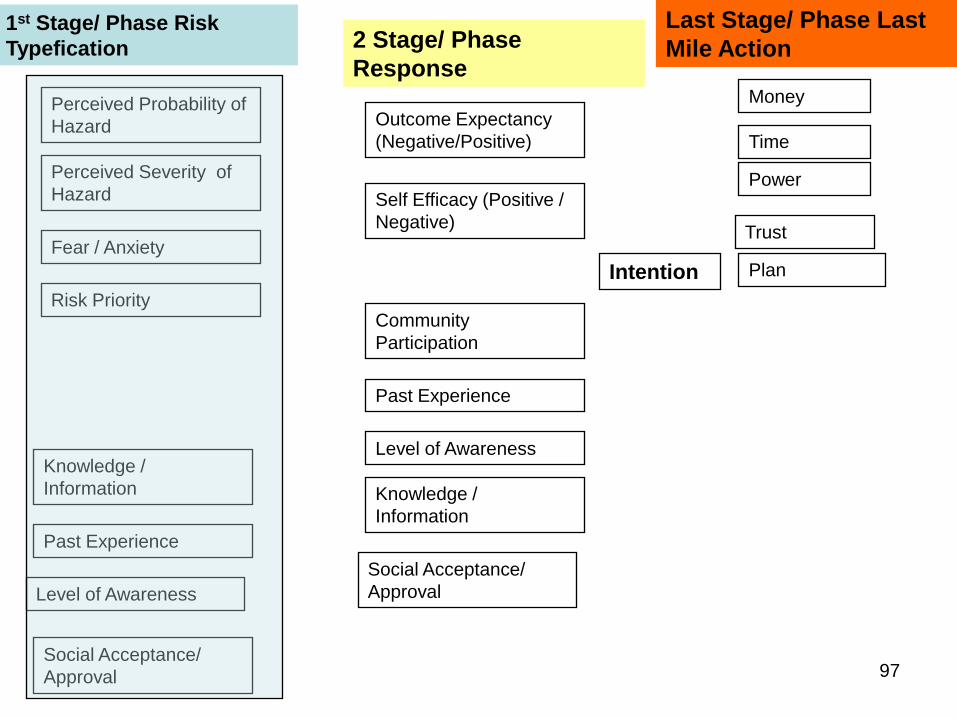
Perceived Probability of
Hazard
Perceived Severity of
Hazard
Fear / Anxiety
Knowledge /
Information
Past Experience
Level of Awareness
Social Acceptance/
Approval
1st Stage/ Phase Risk
Typefication 2 Stage/ Phase
Response
Outcome Expectancy
(Negative/Positive)
Self Efficacy (Positive /
Negative)
Community
Participation
Past Experience
Level of Awareness
Social Acceptance/
Approval
Risk Priority
Knowledge /
Information
Intention
Money
Time
Power
Plan
Trust
Last Stage/ Phase Last
Mile Action
97
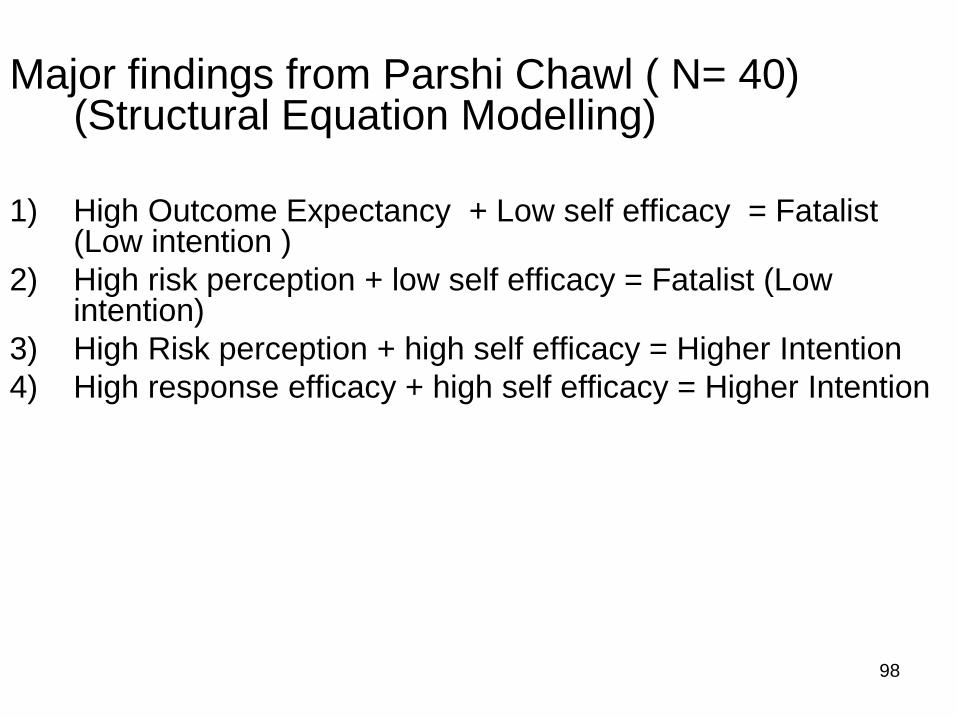
Major findings from Parshi Chawl ( N= 40) (Structural Equation Modelling)
1) High Outcome Expectancy + Low self efficacy = Fatalist (Low intention )
2) High risk perception + low self efficacy = Fatalist (Low intention)
3) High Risk perception + high self efficacy = Higher Intention
4) High response efficacy + high self efficacy = Higher Intention
98
THANK YOU
99