Embed Size (px)
Citation preview
Open Journal of Gastroenterology, 2016, 6, 249-264 http://www.scirp.org/journal/ojgas
ISSN Online: 2163-9469 ISSN Print: 2163-9450
DOI: 10.4236/ojgas.2016.610030 October 19, 2016
Insulin Resistance, Visceral Adiposity Index and TyG Index in Genotype-4 Chronic HCV Patients and Their Relation to Hepatic Histopathology
Eman A. Sabet1, Asmaa N. Mohammad2, Laila M. Yousef3, Ahmed R. H. Ahmed4, Abeer Sheneef5
1Department of Internal Medicine, Faculty of Medicine, Sohag University, Sohag, Egypt 2Department of Tropical Medicine and Gastroenterology, Faculty of Medicine, Sohag University, Sohag, Egypt 3Department of Clinical Pathology, Faculty of Medicine, Sohag University, Sohag, Egypt 4Department of Pathology, Faculty of Medicine, Sohag University, Sohag, Egypt 5Department of Medical Microbiology and Immunology, Faculty of Medicine, Sohag University, Sohag, Egypt
Abstract Introduction: Hepatitis C virus (HCV) genotype 4 is the most prevalent in Egypt. Visceral adiposity index (VAI) and (TyG) index are newly developed indices for as-sessment of metabolic syndrome (MS) and insulin resistance (IR). We aimed at comparing their levels in HCV-patients with healthy controls and validate their use for prediction of hepatic histopathological changes. Patient and Methods: 78 chronic HCV-infected patients proven by PCR, viral genotyping and hepatic histopathology, and 67 healthy controls were enrolled. Presence of MS, Homeostasis Model Assess- ment for IR estimation (HOMA-IR), TyG index, and VAI were assessed. Results: HOMA-IR, TyG and frequency of MS were significantly higher in patients’ group (p < 0.0001 for each) in comparison to controls. In HCV patients, increased fasting blood glucose (FBG) was the only strong predictor of severe hepatic necro-inflammation. High FBG, older age, female sex, high AST, TyG, VAI, serum lipids abnormalities and presence of MS were all associated with severe fibrosis on univariate regression analysis. Only high AST, TyG, VAI and LDL were independent predictors of severe fibrosis. A model using the 4 parameters showed a strong validity in predicting ad-vanced hepatic fibrosis (AUC 0.801; CI: 0.705 - 0.897, p < 0001). Female sex, high BMI, VAI, LDL and TG values are all significantly associated with moderate/severe steatosis on univariate analysis. Among them, high BMI and LDL are the strong pre-dictors (AUC 0.738; CI 0.625 - 0.851, p = 0.002). Conclusion: HCV genotype 4 is significantly associated with MS and increased values of HOMA IR and TyG index. TyG index and VAI are valuable simple indices that could predict the histopatholog-ical changes in Egyptian CHC patients.
How to cite this paper: Sabet, E.A., Mo-hammad, A.N., Yousef, L.M., Ahmed, A.R.H. and Sheneef, A. (2016) Insulin Resistance, Visceral Adiposity Index and TyG Index in Genotype-4 Chronic HCV Patients and Their Relation to Hepatic Histopathology. Open Journal of Gastroenterology, 6, 249-264. http://dx.doi.org/10.4236/ojgas.2016.610030 Received: August 26, 2016 Accepted: October 16, 2016 Published: October 19, 2016 Copyright © 2016 by authors and Scientific Research Publishing Inc. This work is licensed under the Creative Commons Attribution International License (CC BY 4.0). http://creativecommons.org/licenses/by/4.0/
Open Access
E. A. Sabet et al.
250
Keywords HCV, IR, TyG, VAI, Steatosis, Genotype 4
1. Introduction and Aim of the Work
Hepatitis C virus (HCV) is quiet prevalent globally. Genotype 1 was estimated to be the most prevalent worldwide (46.2% of all HCV cases), followed by genotype 3 (30.1%). Other genotypes comprise the remaining 36% of cases. Genotype 4 predominates in North Africa and Middle East countries including Egypt [1]. In fact, studies indicate that Egypt is enduring a large HCV disease burden, and is likely to be the most affected nation worldwide by this infection which makes HCV and its complications one of leading public health problems in Egypt [2].
Previous clinico-epidemiological studies postulated that metabolic syndrome, steato-sis and insulin resistance occurring more in patients with hepatitis C virus [3] [4]. HCV- induced glucose intolerance was a pathological feature of insulin resistance. IR may have many serious effects in HCV patients. It may be associated with fibrosis progres-sion of the liver tissue, failure to treatment response, and progression to hepatocellular carcinoma. Eradication of HCV by antiviral therapy has been shown to ameliorate IR, both in hepatic tissues and whole body. On the other hand, visceral obesity has been shown to enhance HCV-induced insulin resistance [4] [5] [6] [7].
Histologically, Hepatocyte steatosis is a feature associating many liver diseases in-cluding chronic HCV. Its prevalence among HCV patients ranges from 40% to 86% according to the genotype. Researchers have defined two main types of steatosis; one type is associated with metabolic syndrome (metabolic steatosis) and commonly found in patients infected by genotype 1. The other one was reported in patients with geno-type 3a in which fat accumulation correlates with HCV replication levels and disap-pears after successful antiviral therapy, without other known steatogenic cofactors sug-gesting a direct cytopathic effect of the virus (viral steatosis) [4] [8] [9].
Visceral adiposity is best evaluated by magnetic resonance imaging and was found to be correlated with liver fat accumulation in healthy subjects [10] and it was associated with severe inflammation and fibrosis in nonalcoholic steato-hepatitis. In other studies, waist circumference (WC) measurement was used as a surrogate marker of visceral adiposity and association was reported between it and hepatic steatosis in nonalcoholic fatty liver disease and in CHC patients [11] [12]. However, using WC alone to indicate visceral obesity is not entirely accurate as it does not help distinguishing subcutaneous and visceral fat mass; the latter being the most important factor in metabolic derange-ment [13] [14].
A mathematical model called “Visceral Adiposity Index (VAI)” was developed by Amato et al. [15] to overcome this problem. Both anthropometric measures (BMI and WC) and functional parameters (serum TG & HDL-cholesterol) are used to calculate it. They consider it a simple surrogate marker of VA disease, as it showed a strong associ-
E. A. Sabet et al.
251
ation with Euglycemic-hyperinsulinemic Clamp as a test of IR as well as with visceral adipose tissue (VAT) measured with MRI.
VAI has been studied in a specific cohort of patients with genotype 1 chronic hepati-tis C and proved to be independently associated with both steatosis and necro-inflam- matory activity and directly correlated with viral load [16].
Another group of investigators [17] proposed the product of plasma triglyceride and glucose concentrations as an index of IR (TyG index). The levels of both metabolites are strictly dependent on prevailing insulin concentrations, and the inclusion of a lipid parameter widens the concept of IR on different substrates. They concluded that the TyG index could be useful, low cost and easy-to-calculate surrogate for estimating insu-lin resistance in apparently healthy subjects. The index was validated in other studies [18] [19] [20] and was shown to be non-inferior to HOMA-IR, directly related to HCV viral load, and appears to have a similar performance to HOMA-IR, in predicting the severity of steatosis, but compares favorably in terms of cost and use in general clinical practice.
The present study is a case-control study aimed to compare the values of HOMA-IR, VAI and TyG indices in chronic HCV-infected Egyptian patients to those in healthy population and to determine the correlation of such indices to viral genotype and his-topathological changes in infected patients.
2. Patients and Methods
This study is a prospective case-control study. Seventy-eight patients with chronic he-patitis C (CHC) among those admitted to departments of Internal Medicine and Trop-ical Medicine and attending the out-patient clinic of Sohag University Hospital during the period from 6/2013 to 12/2014 were included in our study. Inclusion criteria were; chronic HCV Naïve-patients, who were proved by positive HCV-Abs by ELISA for more than 6 months, positive PCR and had a histopathological diagnosis by liver biop-sy.
Exclusion criteria were: patients with diabetes mellitus, Child-Pugh class B and C cirrhotic patients, patients with hepatocellular carcinoma, other causes of liver disease, anti-viral treatment experienced patients or immunosuppressive drug and/or regular use of steatosis-inducing drugs (corticosteroids, amiodarone, etc.).
In addition, 67 of age- and sex-matched healthy control individuals were included. The study was approved by the local Ethics Committee of Sohag Faculty of Medicine and it was performed in accordance with the principles of the Declaration of Helsinki. All participants assigned a written informed consent.
Personal data, full history and anthropometric measurements were obtained from all participants. Height, weight, and waist circumference were measured, and body mass index (BMI) was calculated for each included patient. Patients grouped in accordance with National Institutes of Health classification of obesity (1998); BMI (kg/m2): Normal range 18.5 - 24.9, Overweight 25.0 - 29.9, Obesity ≥30 [21]. WC was estimated mid-way between the lowest point of the thoracic cage and the iliac crest. High abnormal values
E. A. Sabet et al.
252
are ≥94 cm for men and ≥80 cm for women according to International Diabetes Fed-eration (IDF) criteria. Metabolic syndrome was diagnosed according to IDF criteria in 2006 [22]. Thorough clinical examination was performed for all patients as well as ab-dominal sonographic examination.
2.1. Laboratory Testing
The following tests were done for the participants: - Two ml. venous blood collected on EDTA tube for complete blood picture (CBC) by
CEII-DYN 3700 (Abbott Laboratories, USA). - Twelve hours overnight fasting venous blood samples (about 10 ml) were collected
in sterile tubes. Samples were immediately cooled to 4˚C and centrifuged at 3000 rpm for 10 minutes. Serum was divided into three aliquots:
The first aliquot used immediately for measuring of: fasting plasma glucose, lipid profile (triglycerides, total cholesterol, HDL-c and LDL), liver enzymes (Alanine Ami-notransferase (ALT), Aspartate Aminotransferase (AST), Alkaline phosphatase (ALP), Total bilirubin (TB) and serum Albumin by Cobas c311 Chemistry Analyzer System (Roche Diagnostics, Germany).
The second aliquot was used for detection of fasting insulin level (using Architect i2000, Abbott)
The third portion (only for patients) was collected in a sterile plain vacationer for HCV molecular testing;
RNA extraction HCV RNA was extracted from serum samples by the use of a fully automated QIA
cube instrument using QIA amp Viral RNA Mini (Qiagen, Germany) according to the manufacturer’s instructions. Extracted RNA was frozen at -20°C till the time of use.
Quantitative Real time PCR for the detection of HCV RNA and the viral load: Using AgPath-ID™ One-Step RT-PCR Reagents and 7500 Fast Real Time-PCR system (Ap-plied Biosystems, USA) according to the manufacturer's instructions.
HCV genotyping Using the VERSANT® HCV Amplification 2.0 Kit (LiPA) (Siemens Healthcare, USA);
designed for reverse transcription and amplification of the 5’ untranslated region (5’ UTR) and core region of HCV genome sequentially in a single tube. Genomic HCV RNA is reverse transcribed into cDNA using HCV-specific primers, next the mixture is heated to activate the DNA polymerase and inactivate the reverse transcriptase simul-taneously. Portions of the 5' UTR and core regions of the HCV genome are co-ampli- fied from the cDNA using two pairs of biotinylated primers to produce two distinct biotinylated DNA fragments of 240 and 270 base pairs. The VERSANT HCV Genotype 2.0 Assay (LiPA) strips have 3 control lines and 22 parallel DNA probe lines containing sequences specific for HCV genotypes 1 to 6. HCV genotypes are determined by align-ing the assay strips with the kit reading card and comparing the line patterns from the assay strips with the patterns shown on the kit Interpretation Chart.
E. A. Sabet et al.
253
2.2. Calculation of Indices
a) Homeostasis Model Assessment (HOMA) as estimates of Insulin resistance (IR): (HOMA-IR). It was calculated by using the following formula:
Fasting insulin (U/mL) X fasting glucose (mmol/L)/22.5. HOMA-IR values of >2.7 indicate IR [23] [24].
b) Visceral Adiposity Index (VAI) VAI score was calculated as described by Amato et al. [15] using the following for-
mulae and was differentiated according to sex:
Males: ( )
TG 1.3139.68 1.88 BMI 1.03 H
VAIDL
wc × × + ×
=
Females: ( )
TG 1.5239.58 1.89 BMI 0.81 H
VAIDL
wc × × + ×
=
WC: waist circumference, TG: serum Triglycerides, HDL: High-density lipoprotein- cholesterol, BMI: Body mass index. c) TyG index.
Was calculated using the following formula [19]:
( ) ( )Fasting triglycerides mg dl fasting glucose mg dl 2×
2.3. Histopathological Evaluation
Haematoxylin and eosin-stained and Masson’s trichrome-stained sections of liver core biopsies were evaluated by a single pathologist without knowledge of the patients’ clin-ical or blood samples data. The grade of necro-inflammation and stage of fibrosis were scored according to Scheuer’s scoring system [25] and the degree of steatosis was eva-luated according to the relative percentage of involved cells [4]. For Masson`s trich-rome staining (DDK Italia, Code 12-107); tissue sections were de-paraffinized, rehy-drated, rinsed in running water and re-fixed in Bouin’s solution for 1 hour at room temperature. After washing in tap water, the sections were stained by Weigert’s iron hematoxylin working solution for 10 minutes before incubation in Biebrich acid fuch-sin solution for 10 minutes followed by differentiation in phosphomolybdic-phospho- tungstic acid solution for 10 - 15 minutes. The sections were incubated in aniline blue solution for 10 minutes; rinsed briefly in distilled water and differentiated in 1% acetic acid solution for 5 minutes. Finally, the sections were dehydrated and mounted as usual.
2.4. Statistical Analysis
The results were analyzed by IBM-SPSS version 20.0 for Windows; IBM Inc. Mann- Whitney U test was used to compare continuous variables, and the correlations of con-tinuous variables were evaluated by Pearson’s correlation co-efficient test. Univariate and Multivariate Binary Logistic regression analyses were used to recognize the factors associated with hepatitis grading, staging and degree of steatosis. The validity of differ-
E. A. Sabet et al.
254
ent parameters in predicting histopathological changes was determined by Receiver operating characteristic (ROC) curve. Significant and highly significant relationships were considered when P-value was <0.05 or <0.001, respectively.
3. Results 3.1. Patient Demographic, Clinical and Laboratory Features
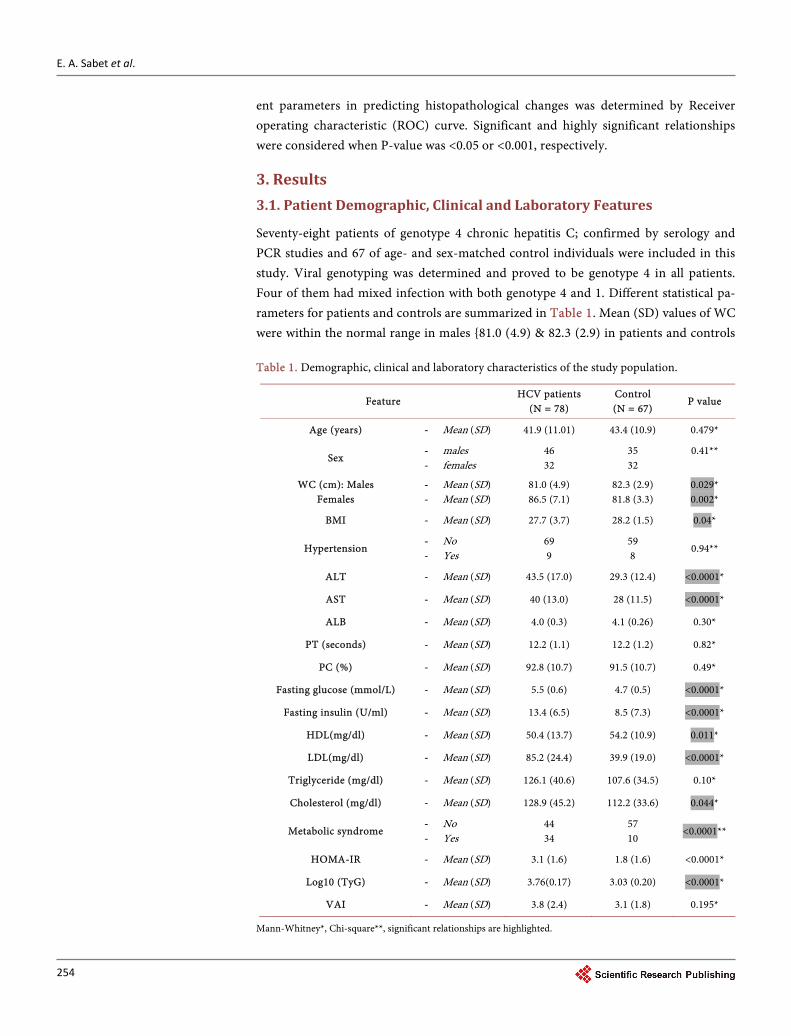
Seventy-eight patients of genotype 4 chronic hepatitis C; confirmed by serology and PCR studies and 67 of age- and sex-matched control individuals were included in this study. Viral genotyping was determined and proved to be genotype 4 in all patients. Four of them had mixed infection with both genotype 4 and 1. Different statistical pa-rameters for patients and controls are summarized in Table 1. Mean (SD) values of WC were within the normal range in males {81.0 (4.9) & 82.3 (2.9) in patients and controls Table 1. Demographic, clinical and laboratory characteristics of the study population.
Feature HCV patients
(N = 78) Control (N = 67)
P value
Age (years) - Mean (SD) 41.9 (11.01) 43.4 (10.9) 0.479*
Sex - males - females
46 32
35 32
0.41**
WC (cm): Males Females
- Mean (SD) - Mean (SD)
81.0 (4.9) 86.5 (7.1)
82.3 (2.9) 81.8 (3.3)
0.029* 0.002*
BMI - Mean (SD) 27.7 (3.7) 28.2 (1.5) 0.04*
Hypertension - No - Yes
69 9
59 8
0.94**
ALT - Mean (SD) 43.5 (17.0) 29.3 (12.4) <0.0001*
AST - Mean (SD) 40 (13.0) 28 (11.5) <0.0001*
ALB - Mean (SD) 4.0 (0.3) 4.1 (0.26) 0.30*
PT (seconds) - Mean (SD) 12.2 (1.1) 12.2 (1.2) 0.82*
PC (%) - Mean (SD) 92.8 (10.7) 91.5 (10.7) 0.49*
Fasting glucose (mmol/L) - Mean (SD) 5.5 (0.6) 4.7 (0.5) <0.0001*
Fasting insulin (U/ml) - Mean (SD) 13.4 (6.5) 8.5 (7.3) <0.0001*
HDL(mg/dl) - Mean (SD) 50.4 (13.7) 54.2 (10.9) 0.011*
LDL(mg/dl) - Mean (SD) 85.2 (24.4) 39.9 (19.0) <0.0001*
Triglyceride (mg/dl) - Mean (SD) 126.1 (40.6) 107.6 (34.5) 0.10*
Cholesterol (mg/dl) - Mean (SD) 128.9 (45.2) 112.2 (33.6) 0.044*
Metabolic syndrome - No - Yes
44 34
57 10
<0.0001**
HOMA-IR - Mean (SD) 3.1 (1.6) 1.8 (1.6) <0.0001*
Log10 (TyG) - Mean (SD) 3.76(0.17) 3.03 (0.20) <0.0001*
VAI - Mean (SD) 3.8 (2.4) 3.1 (1.8) 0.195*
Mann-Whitney*, Chi-square**, significant relationships are highlighted.
E. A. Sabet et al.
255
respectively} but it was significantly high in female patients in comparison to control groups {86.5 (7.1) & 81.8 (3.3) in patients and controls respectively, p < 0.002}. The majority of the patients (n = 48) were overweight and 16 patients were obese according to value of BMI. Nine of the investigated cases and eight of the control group were hypertensive. Regarding liver function tests, 67% (n = 52) and 59% (n = 46) of HCV- patients had raised serum levels of ALT and AST, respectively. The patients had signif-icantly higher serum ALT and AST levels compared to the control group (Mann- Whitney, p < 0.0001 for both analyses). The mean values for serum albumin, proth-rombin time (PT), prothrombin concentration (PC) and platelet count are within nor-mal. Metabolic syndrome was diagnosed in 43.6% of the cases and it was more incident among HCV patients compared to the control group (p < 0.0001). Insulin resistance as determined by HOMA-IR is significantly more frequent among HCV patients com-pared to control group (p < 0.0001). Similarly, TyG values were significantly higher than control group (p < 0.0001). Although the mean (SD) value of VAI was higher in patients than controls, the difference was not statistically significant.
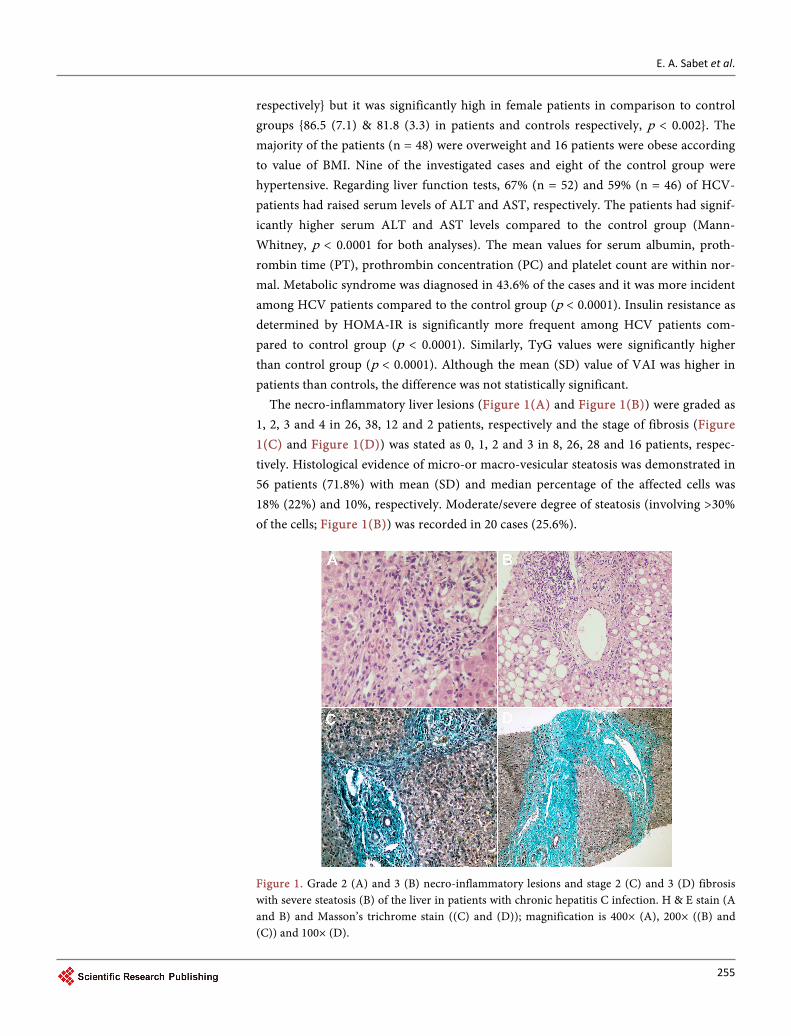
The necro-inflammatory liver lesions (Figure 1(A) and Figure 1(B)) were graded as 1, 2, 3 and 4 in 26, 38, 12 and 2 patients, respectively and the stage of fibrosis (Figure 1(C) and Figure 1(D)) was stated as 0, 1, 2 and 3 in 8, 26, 28 and 16 patients, respec-tively. Histological evidence of micro-or macro-vesicular steatosis was demonstrated in 56 patients (71.8%) with mean (SD) and median percentage of the affected cells was 18% (22%) and 10%, respectively. Moderate/severe degree of steatosis (involving >30% of the cells; Figure 1(B)) was recorded in 20 cases (25.6%).
Figure 1. Grade 2 (A) and 3 (B) necro-inflammatory lesions and stage 2 (C) and 3 (D) fibrosis with severe steatosis (B) of the liver in patients with chronic hepatitis C infection. H & E stain (A and B) and Masson’s trichrome stain ((C) and (D)); magnification is 400× (A), 200× ((B) and (C)) and 100× (D).
E. A. Sabet et al.
256
3.2. Factors Associated with HOMA IR, TyG and VAI
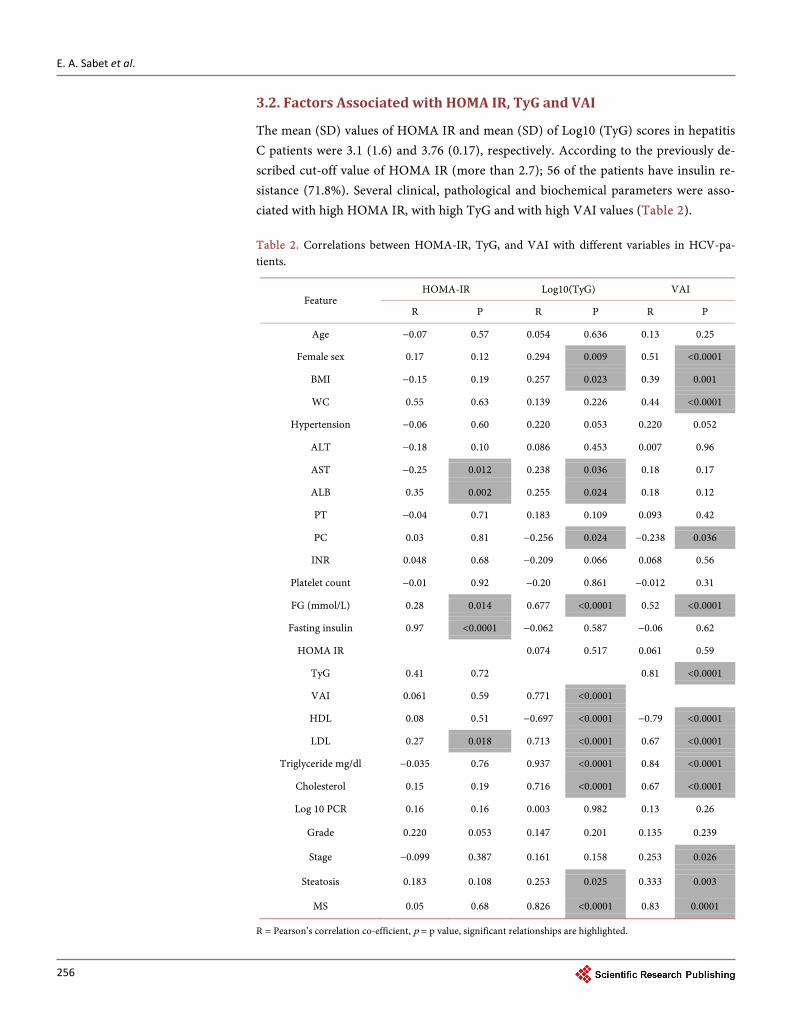
The mean (SD) values of HOMA IR and mean (SD) of Log10 (TyG) scores in hepatitis C patients were 3.1 (1.6) and 3.76 (0.17), respectively. According to the previously de-scribed cut-off value of HOMA IR (more than 2.7); 56 of the patients have insulin re-sistance (71.8%). Several clinical, pathological and biochemical parameters were asso-ciated with high HOMA IR, with high TyG and with high VAI values (Table 2). Table 2. Correlations between HOMA-IR, TyG, and VAI with different variables in HCV-pa- tients.
Feature HOMA-IR Log10(TyG) VAI
R P R P R P
Age −0.07 0.57 0.054 0.636 0.13 0.25
Female sex 0.17 0.12 0.294 0.009 0.51 <0.0001
BMI −0.15 0.19 0.257 0.023 0.39 0.001
WC 0.55 0.63 0.139 0.226 0.44 <0.0001
Hypertension −0.06 0.60 0.220 0.053 0.220 0.052
ALT −0.18 0.10 0.086 0.453 0.007 0.96
AST −0.25 0.012 0.238 0.036 0.18 0.17
ALB 0.35 0.002 0.255 0.024 0.18 0.12
PT −0.04 0.71 0.183 0.109 0.093 0.42
PC 0.03 0.81 −0.256 0.024 −0.238 0.036
INR 0.048 0.68 −0.209 0.066 0.068 0.56
Platelet count −0.01 0.92 −0.20 0.861 −0.012 0.31
FG (mmol/L) 0.28 0.014 0.677 <0.0001 0.52 <0.0001
Fasting insulin 0.97 <0.0001 −0.062 0.587 −0.06 0.62
HOMA IR 0.074 0.517 0.061 0.59
TyG 0.41 0.72 0.81 <0.0001
VAI 0.061 0.59 0.771 <0.0001
HDL 0.08 0.51 −0.697 <0.0001 −0.79 <0.0001
LDL 0.27 0.018 0.713 <0.0001 0.67 <0.0001
Triglyceride mg/dl −0.035 0.76 0.937 <0.0001 0.84 <0.0001
Cholesterol 0.15 0.19 0.716 <0.0001 0.67 <0.0001
Log 10 PCR 0.16 0.16 0.003 0.982 0.13 0.26
Grade 0.220 0.053 0.147 0.201 0.135 0.239
Stage −0.099 0.387 0.161 0.158 0.253 0.026
Steatosis 0.183 0.108 0.253 0.025 0.333 0.003
MS 0.05 0.68 0.826 <0.0001 0.83 0.0001
R = Pearson’s correlation co-efficient, p = p value, significant relationships are highlighted.
E. A. Sabet et al.
257
3.3. Factors Associated with Histopathological Findings
The association of different host and viral factors with liver histopathological changes of genotype 4 CHC patients namely grade and stage of the disease and severity of stea-tosis was evaluated. The grade of hepatitis was classified into two main categories; mild/moderate hepatitis (n = 64) including grade I and II necro-inflammatory lesions and severe hepatitis (n = 14) including grade III and IV necro-inflammatory lesions. Similarly the degree of fibrosis was classified into two categories; no/early fibrosis (n = 34) including stages 0 and I disease and more advanced fibrosis (n = 34) including stages II, III and IV. Steatosis was classified as absent-mild at <30% or moderate–se- vere at >30%
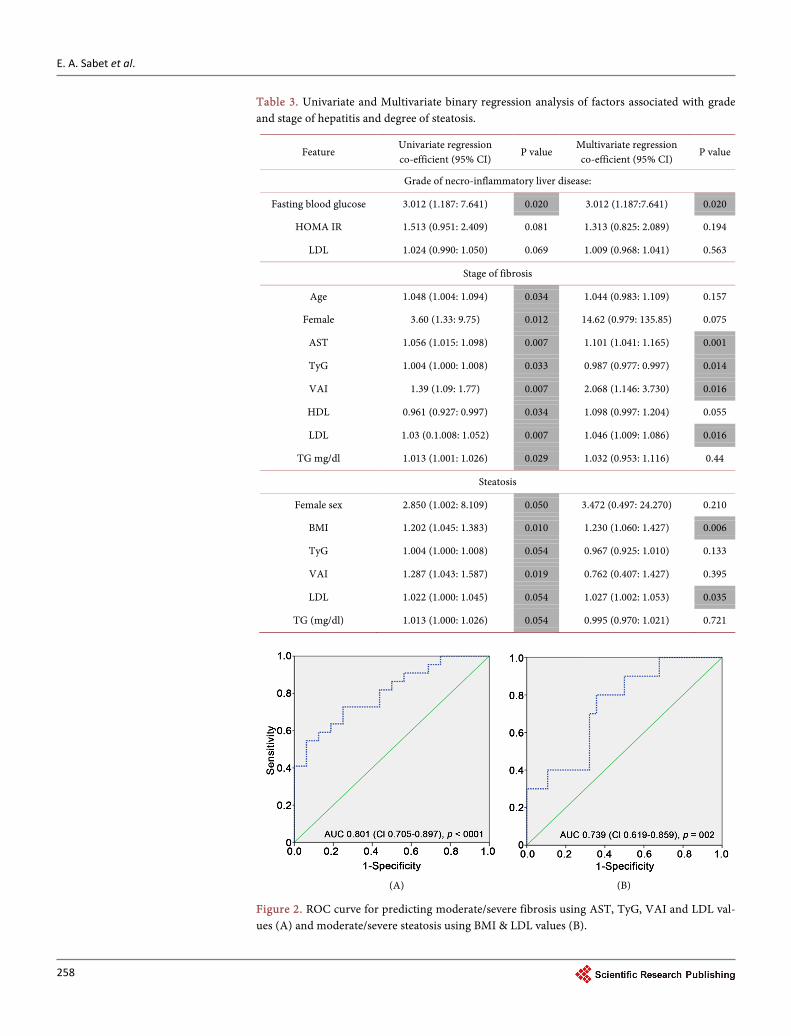
On univariate logistic regression analysis, increased fasting blood glucose, increased HOMA IR and high LDL were associated with severe necro-inflammatory lesions of the liver. On multivariate regression analysis, fasting blood glucose level can predict the severity of necro-inflammatory lesions (Table 3). Older age, female sex, high AST, high TyG score, high VAI index, low HDL, high LDL, high TG, high cholesterol level and presence of MS were all associated with severe fibrosis on univariate binary regression analysis (Table 3). Multivariate logistic regression analysis showed that the following parameters were independent predictors of severe fibrosis: high AST level, high TyG score, high VAI index and high LDL level (Table 3). Receiver operating characteristic (ROC) curve showed a strong validity of the model using these four parameters in pre-dicting advanced hepatic fibrosis (AUC 0.801; SE 0.049; CI0.705 - 0.897, p < 0001, Fig-ure 2(A)).
The univariate and multivariate comparisons of variables linked to moderate/severe steatosis (>30%) were reported in Table 3. Although female sex, high BMI,VAI, TyG, LDL and TG values were all significantly associated with moderate/severe steatosis (>30%) on univariate analysis, only high BMI and high LDL levels are the strong pre-dictors of moderate/severe steatosis on multivariate logistic regression analyses. ROC curve analyses showed a significant validity of the model using BMI and LDL to predict high degree of steatosis (AUC 0.738; SE 0.058; CI 0.625 - 0.851, p = 0.002, Figure 2(B)).
4. Discussion
Association between CHC and metabolic disorders manifested by metabolic syndrome, IR, Diabetes mellitus and hepatic steatosis was proven in several previous studies. The underlying mechanisms of metabolic derangements and degree of affection may vary in different population or in relation to viral genotype [4] [7] [8] [9]. New indices such as VAI and TyG, which were proposed to be surrogate indicators of the metabolic abnor-malities accompanying IR [15] [16] [17] [18], were found to valuable predictors to his-topathological changes occurring in HCV genotype 1 [10] [19]. To our knowledge, this is the first study to compare such indices in Egyptian genotype 4 HCV patients with healthy controls and validate its role in prediction of histopathological changes namely necro-inflammation, fibrosis, and/or steatosis.
Liver biopsy is the gold standard method for assessing hepatic fibrosis and steatosis.
E. A. Sabet et al.
258
Table 3. Univariate and Multivariate binary regression analysis of factors associated with grade and stage of hepatitis and degree of steatosis.
Feature Univariate regression co-efficient (95% CI)
P value Multivariate regression co-efficient (95% CI)
P value
Grade of necro-inflammatory liver disease:
Fasting blood glucose 3.012 (1.187: 7.641) 0.020 3.012 (1.187:7.641) 0.020
HOMA IR 1.513 (0.951: 2.409) 0.081 1.313 (0.825: 2.089) 0.194
LDL 1.024 (0.990: 1.050) 0.069 1.009 (0.968: 1.041) 0.563
Stage of fibrosis
Age 1.048 (1.004: 1.094) 0.034 1.044 (0.983: 1.109) 0.157
Female 3.60 (1.33: 9.75) 0.012 14.62 (0.979: 135.85) 0.075
AST 1.056 (1.015: 1.098) 0.007 1.101 (1.041: 1.165) 0.001
TyG 1.004 (1.000: 1.008) 0.033 0.987 (0.977: 0.997) 0.014
VAI 1.39 (1.09: 1.77) 0.007 2.068 (1.146: 3.730) 0.016
HDL 0.961 (0.927: 0.997) 0.034 1.098 (0.997: 1.204) 0.055
LDL 1.03 (0.1.008: 1.052) 0.007 1.046 (1.009: 1.086) 0.016
TG mg/dl 1.013 (1.001: 1.026) 0.029 1.032 (0.953: 1.116) 0.44
Steatosis
Female sex 2.850 (1.002: 8.109) 0.050 3.472 (0.497: 24.270) 0.210
BMI 1.202 (1.045: 1.383) 0.010 1.230 (1.060: 1.427) 0.006
TyG 1.004 (1.000: 1.008) 0.054 0.967 (0.925: 1.010) 0.133
VAI 1.287 (1.043: 1.587) 0.019 0.762 (0.407: 1.427) 0.395
LDL 1.022 (1.000: 1.045) 0.054 1.027 (1.002: 1.053) 0.035
TG (mg/dl) 1.013 (1.000: 1.026) 0.054 0.995 (0.970: 1.021) 0.721
(A) (B)
Figure 2. ROC curve for predicting moderate/severe fibrosis using AST, TyG, VAI and LDL val-ues (A) and moderate/severe steatosis using BMI & LDL values (B).
E. A. Sabet et al.
259
Previous guidelines recommended it as preliminary step to decide Interferon-based therapy [26]. All patients in this study had performed liver biopsy as a part of pre- treatment assessment before the beginning of anti-viral therapy for treatment of HCV in Egypt. As we mentioned, all samples were examined by a single pathologist to avoid inter-observer variability. With the development of anti-protease therapy for HCV, the need for liver biopsy is minimized and the presence of simple cheap non-invasive pre-dictors may be sufficient to evaluate histopathological changes [27].
By comparing the demographic, clinical and laboratory parameters in HCV patients and control groups, we found that metabolic syndrome was significantly prevalent among HCV group (p < 0.0001); our diagnosis was dependent on IDF criteria [22] which included WC, TG, HDL, hypertension and fasting serum glucose level. WC was significantly increased only in female patients, while it was within normal range in male patients, however, the abnormalities in other components; namely HDL, TG & fasting glucose seems to be the determinant factors for metabolic syndrome in this study. In fact, ethnic variations are well known in the determination of standards values for WC. In Egypt we use the European values but the development of our own standards will be valuable and highly recommended. We previously reported the association of CHC with metabolic syndrome in our locality [28] and it was also reported in many studies globally [29] [30] [31] [32]. A Brazilian study on genotype 1 HCV [33] had reported high prevalence of metabolic syndrome among HCV patients even in patients without type 2 diabetes or obesity. They found that metabolic syndrome was significantly asso-ciated with hypertension, insulin resistance and increased abdominal fat.
In this study, HOMA-IR and TyG values were significantly higher among patients as compared with control group (p < 0.0001 for both). The association of CHC with IR is well documented in several previous studies and with almost all genotypes including genotype 4 [4] [5] [6] [7]. The underlying mechanisms of HCV-induced IR have been previously studied. HCV induces IR with both hepatic and peripheral manner with some differences in different genotypes [34]. TyG index has been recently emerged as a simple surrogate index for IR and proved in several studies to be non-inferior to HOMA IR when compared to euglycemic-hyperinsulinemic clamp test [17] [18] [19]. A single study reported the significance of its measurement in CHC genotype 1 but it didn’t compare it to healthy controls [20].
VAI; a novel sex-specific index was suggested as a valuable indicator of “visceral adipose function” and insulin sensitivity [15] was calculated in this study for both pa-tients and controls. The values although higher in patients but the difference was not statistically significant. No reports are available till now comparing VAI values in HCV patients and controls. One study tested its correlation to viral load and histological findings in genotype 1-HCV patients [16].
IR in addition to its role in development of type 2 diabetes and increased cardiovas-cular risk [35], has emerged as an important prognostic factor for the clinical course of HCV infection. It has been linked to increased disease severity, extra hepatic manifesta-tions, and decreased response to antiviral therapy [6] [36], progression of hepatic fibro-
E. A. Sabet et al.
260
sis and development of hepatocellular carcinoma [37]. Moreover, HCV affects lipid metabolism and induces hepatic steatosis by genotype-specific mechanisms; HCV ge-notype 1 can cause metabolic hepatic steatosis through its interactions with factors re-lated to visceral adiposity while HCV genotype 3 causes mainly viral hepatic steatosis. Both insulin resistance and hepatic steatosis are related to hepatic inflammation and fi-brosis, and might enhance these conditions [3]. Genotype 4 is the least studied in pre-vious literatures.
In the present study we tested the correlations between HOMA IR, TyG and VAI and other clinical, laboratory and histopathogical variables in HCV patients. HOMA IR was significantly correlated only with AST, serum albumin & LDL levels. On the other hand; TyG had significant correlations with female sex, BMI, AST, serum albumin, prothrombin concentration, and all elements of serum lipids. It was correlated signifi-cantly also with hepatic steatosis, VAI and presence of metabolic syndrome. VAI showed similar significant correlations as TyG, in addition to a significant correlation with stage of hepatic fibrosis. None of the tested indices had a significant correlation with viral load in this study.
Petta et al. [20] found TyG was independently associated with WC, total cholesterol, presence of arterial hypertension, viral load and steatosis. HOMA was significantly as-sociated with WC and steatosis. No independent associations were found between both TyG and HOMA and fibrosis or SVR in their study. They reported similar performance of TyG and HOMA in ROC model in predicting moderate to severe steatosis in HCV patients. On the other hand, several researchers found that serum insulin concentra-tions and HOMA-IR index scores were positively correlated with the severity of hepatic fibrosis [5] [6] [38] [39], Yoneda et al. stated that in patients with HCV, insulin resis-tance is more strongly associated with viral load than visceral obesity [40].
In their study on genotype 1 HCV, Petta et al. [16] found VAI score was indepen-dently associated with higher HOMA score, viral load, necro-inflammatory activity and steatosis. The same researchers claimed that VAI score was linked to severe fibrosis in non-alcoholic fatty liver disease (NAFLD) [41], Whereas others [42] found VAI is nei-ther related to the severity of hepatic inflammation nor fibrosis in non-diabetic patients with NAFLD.
When univariate and multivariate binary regression analyses were performed to find variables which could predict histological finding in patients with HCV genotype 4. High fasting serum glucose, HOMA IR and LDL were all associated with severe ne-cro-inflammation but fasting glucose was the only predictor on multivariate analysis. Several factors were associated with severe fibrosis, but among them high AST, TyG, VAI & LDL were strong independent predictors; a strong validity of the model using these four parameters in predicting advanced hepatic fibrosis was shown. Moderate to severe steatosis could be predicted more in female patient, and in patients with high BMI, VAI, LDL and TG. The independent risk factors for severe steatosis were high BMI and High LDL, a significantly valid model using BMI and LDL could be used to predict high degree of steatosis.
E. A. Sabet et al.
261
5. Conclusion
In conclusion, the present study showed significant association of HCV genotype 4 with increased HOMA IR, TyG score and the presence of metabolic syndrome in com-parison to controls. TyG & VAI are simple indices that could be of value in prediction of histopathological changes however further studies are needed to evaluate their accu-racy.
Acknowledgements
The authors are grateful to all who participated in the study.
Funding
All needed investigations were held in Sohag university hospital, with no any external funding corporation.
Ethical Approval
The study protocol was approved by the local ethics committee of scientific research in Sohag University, Faculty of Medicine and all patients gave their consent prior to the study.
Disclosure Statement
All authors declare that there are no financial or other conflicts of interest.
References [1] Messina, J.P., Humphreys, I., Flaxman, A., Brown, A., Cooke, G.S., Pybus, O.G. and Barnes,
E. (2015) Global Distribution and Prevalence of Hepatitis C Virus Genotypes. Hepatology, 61, 77-87. http://dx.doi.org/10.1002/hep.27259
[2] Mohamoud, Y.A., Mumtaz, G.R., Riome, S., Miller, D. and Abu-Raddad, L.J. (2013) The Epidemiology of Hepatitis C Virus in Egypt: A Systematic Review and Data Synthesis. BMC Infectious Diseases, 13, 1. http://dx.doi.org/10.1186/1471-2334-13-288
[3] Kawaguchi, Y. and Mizuta, T. (2014) Interaction between Hepatitis C Virus and Metabolic Factors. World Journal of Gastroenterology: WJG, 20, 2888-2901. http://dx.doi.org/10.3748/wjg.v20.i11.2888
[4] Del Campo, J.A. and Romero-Gómez, M. (2009) Steatosis and Insulin Resistance in Hepati-tis C: A Way Out for the Virus. World Journal of Gastroenterology, 15, 5014-5019. http://dx.doi.org/10.3748/wjg.15.5014
[5] D’souza, R., Sabin, C. and Foster, G. (2005) Insulin Resistance Plays a Significant Role in Liver Fibrosis in Chronic Hepatitis C and in the Response to Antiviral Therapy. The Amer-ican Journal of Gastroenterology, 100, 1509-1515. http://dx.doi.org/10.1111/j.1572-0241.2005.41403.x
[6] Hui, J.M., Sud, A., Farrell, G.C., Bandara, P., Byth, K., Kench, J.G., McCaughan, G.W. and George, J. (2003) Insulin Resistance Is Associated with Chronic Hepatitis C and Virus In-fection Fibrosis Progression. Gastroenterology, 125, 1695-1704. http://dx.doi.org/10.1053/j.gastro.2003.08.032
[7] Moucari, R., Asselah, T., Cazals-Hatem, D., Voitot, H., Boyer, N., Ripault, M.P., Sobesky,
E. A. Sabet et al.
262
R., Martinot-Peignoux, M., Maylin, S. and Nicolas-Chanoine, M.H. (2008) Insulin Resis-tance in Chronic Hepatitis C: Association with Genotypes 1 and 4, Serum HCV RNA Level, and Liver Fibrosis. Gastroenterology, 134, 416-423. http://dx.doi.org/10.1053/j.gastro.2007.11.010
[8] Gordon, A., McLean, C.A., Pedersen, J.S., Bailey, M.J. and Roberts, S.K. (2005) Hepatic Steatosis in Chronic Hepatitis B and C: Predictors, Distribution and Effect on Fibrosis. Journal of Hepatology, 43, 38-44. http://dx.doi.org/10.1016/j.jhep.2005.01.031
[9] Lonardo, A., Adinolfi, L.E., Loria, P., Carulli, N., Ruggiero, G. and Day, C.P. (2004) Steato-sis and Hepatitis C Virus: Mechanisms and Significance for Hepatic and Extrahepatic Dis-ease. Gastroenterology, 126, 586-597. http://dx.doi.org/10.1053/j.gastro.2003.11.020
[10] Chan, D., Watts, G., Ng, T., Hua, J., Song, S. and Barrett, P. (2006) Measurement of Liver Fat by Magnetic Resonance Imaging: Relationships with Body Fat Distribution, Insulin Sensitivity and Plasma Lipids in Healthy Men. Diabetes, Obesity and Metabolism, 8, 698- 702. http://dx.doi.org/10.1111/j.1463-1326.2005.00543.x
[11] Van der Poorten, D., Milner, K.L., Hui, J., Hodge, A., Trenell, M.I., Kench, J.G., London, R., Peduto, T., Chisholm, D.J. and George, J. (2008) Visceral Fat: A Key Mediator of Steatohe-patitis in Metabolic Liver Disease. Hepatology, 48, 449-457. http://dx.doi.org/10.1002/hep.22350
[12] Marchesini, G., Brizi, M., Bianchi, G., Tomassetti, S., Bugianesi, E., Lenzi, M., McCullough, A.J., Natale, S., Forlani, G. and Melchionda, N. (2001) Nonalcoholic Fatty Liver Disease a Feature of the Metabolic Syndrome. Diabetes, 50, 1844-1850. http://dx.doi.org/10.2337/diabetes.50.8.1844
[13] Pouliot, M.-C., Després, J.-P., Lemieux, S., Moorjani, S., Bouchard, C., Tremblay, A., Na-deau, A. and Lupien, P.J. (1994) Waist Circumference and Abdominal Sagittal Diameter: Best Simple Anthropometric Indexes of Abdominal Visceral Adipose Tissue Accumulation and Related Cardiovascular Risk in Men and Women. The American Journal of Cardiology, 73, 460-468. http://dx.doi.org/10.1016/0002-9149(94)90676-9
[14] Dixon, J.B., Bhathal, P.S. and O’brien, P.E. (2001) Nonalcoholic Fatty Liver Disease: Pre-dictors of Nonalcoholic Steatohepatitis and Liver Fibrosis in the Severely Obese. Gastroen-terology, 121, 91-100. http://dx.doi.org/10.1053/gast.2001.25540
[15] Amato, M.C., Giordano, C., Galia, M., Criscimanna, A., Vitabile, S., Midiri, M. and Galluz-zo, A. (2010) Visceral Adiposity Index A Reliable Indicator of Visceral Fat Function Asso-ciated with Cardiometabolic Risk. Diabetes Care, 33, 920-922. http://dx.doi.org/10.2337/dc09-1825
[16] Petta, S., Amato, M., Cabibi, D., Camma, C., Di Marco, V., Giordano, C., Galluzzo, A. and Craxì, A. (2010) Visceral Adiposity Index Is Associated with Histological Findings and High Viral Load in Patients with Chronic Hepatitis C Due to Genotype 1. Hepatology, 52, 1543-1552. http://dx.doi.org/10.1002/hep.23859
[17] Simental-Mendía, L.E., Rodríguez-Morán, M. and Guerrero-Romero, F. (2008) The Prod-uct of Fasting Glucose and Triglycerides as Surrogate for Identifying Insulin Resistance in Apparently Healthy Subjects. Metabolic Syndrome and Related Disorders, 6, 299-304. http://dx.doi.org/10.1089/met.2008.0034
[18] Vasques, A.C.J., Novaes, F.S., de Oliveira, M., Souza, J.R.M., Yamanaka, A., Pareja, J.C., Tambascia, M.A., Saad, M.J.A. and Geloneze, B. (2011) TyG Index Performs Better than HOMA in a Brazilian Population: A Hyperglycemic Clamp Validated Study. Diabetes Re-search and Clinical Practice, 93, e98-e100. http://dx.doi.org/10.1016/j.diabres.2011.05.030
[19] Gastaldelli, A., Folli, F. and DeFronzo, R. (2010) The Product of Triglycerides and Glucose as Index of Insulin Resistance. Validation in the SAM Study. Journal of Clinical Endocri-
E. A. Sabet et al.
263
nology of Metabolism, EPUB.
[20] Petta, S., Di Marco, V., Di Stefano, R., Cabibi, D., Camma, C., Marchesini, G. and Craxì, A. (2011) TyG Index, HOMA Score and Viral Load in Patients with Chronic Hepatitis C Due to Genotype 1. Journal of Viral Hepatitis, 18, e372-e380. http://dx.doi.org/10.1111/j.1365-2893.2011.01439.x
[21] World Health Organization (2000) Obesity: Preventing and Managing the Global Epidemic. World Health Organization.
[22] Alberti, K.G.M.M., Zimmet, P. and Shaw, J. (2006) Metabolic Syndrome—A New World- Wide Definition. A Consensus Statement from the International Diabetes Federation. Di-abetic Medicine, 23, 469-480. http://dx.doi.org/10.1111/j.1464-5491.2006.01858.x
[23] McAuley, K.A., Williams, S.M., Mann, J.I., Walker, R.J., Lewis-Barned, N.J., Temple, L.A. and Duncan, A.W. (2001) Diagnosing Insulin Resistance in the General Population. Di-abetes Care, 24, 460-464. http://dx.doi.org/10.2337/diacare.24.3.460
[24] Matsuda, M. and DeFronzo, R.A. (1999) Insulin Sensitivity Indices Obtained from Oral Glucose Tolerance Testing: Comparison with the Euglycemic Insulin Clamp. Diabetes Care, 22, 1462-1470. http://dx.doi.org/10.2337/diacare.22.9.1462
[25] Scheuer, P.J. (1991) Classification of Chronic Viral Hepatitis: A Need for Reassessment. Journal of Hepatology, 13, 372-374. http://dx.doi.org/10.1016/0168-8278(91)90084-O
[26] Yee, H.S., Currie, S.L., Darling, J.M. and Wright, T.L. (2006) Management and Treatment of Hepatitis C Viral Infection: Recommendations from the Department of Veterans Affairs Hepatitis C Resource Center Program and the National Hepatitis C Program Office. The American Journal of Gastroenterology, 101, 2360-2378. http://dx.doi.org/10.1111/j.1572-0241.2006.00754.x
[27] Yee, H.S., Chang, M.F., Pocha, C., Lim, J., Ross, D., Morgan, T.R. and Monto, A. (2012) Update on the Management and Treatment of Hepatitis C Virus Infection: Recommenda-tions from the Department of Veterans Affairs Hepatitis C Resource Center Program and the National Hepatitis C Program Office. The American Journal of Gastroenterology, 107, 669-689. http://dx.doi.org/10.1038/ajg.2012.48
[28] Sabet, E. and El Aal, A. (2015) Hepatitis C Virus Infection and Metabolic Syndrome—A Community Based Study in Sohag University Hospital. Journal of Diabetes & Metabolism, S13, 011. http://dx.doi.org/10.4172/2155-6156.s13-011
[29] Huang, J.-F., Chuang, W.-L., Yu, M.-L., Yu, S.-H., Huang, C.-F., Huang, C.-I., Yeh, M.-L., Hsieh, M.-H., Yang, J.-F. and Lin, Z.-Y. (2009) Hepatitis C Virus Infection and Metabolic Syndrome—A Community-Based Study in an Endemic Area of Taiwan. The Kaohsiung Journal of Medical Sciences, 25, 299-305. http://dx.doi.org/10.1016/S1607-551X(09)70520-0
[30] Sheikh, M.Y., Choi, J., Qadri, I., Friedman, J.E. and Sanyal, A.J. (2008) Hepatitis C Virus Infection: Molecular Pathways to Metabolic Syndrome. Hepatology, 47, 2127-2133. http://dx.doi.org/10.1002/hep.22269
[31] Shaheen, M., Echeverry, D., Oblad, M.G., Montoya, M.I., Teklehaimanot, S. and Akhtar, A.J. (2007) Hepatitis C, Metabolic Syndrome, and Inflammatory Markers: Results from the Third National Health and Nutrition Examination Survey (NHANES III). Diabetes Re-search and Clinical Practice, 75, 320-326. http://dx.doi.org/10.1016/j.diabres.2006.07.008
[32] Younossi, Z.M. and McCullough, A.J. (2009) Metabolic Syndrome, Non-Alcoholic Fatty Liver Disease and Hepatitis C Virus: Impact on Disease Progression and Treatment Re-sponse. Liver International, 29, 3-12. http://dx.doi.org/10.1111/j.1478-3231.2008.01949.x
[33] Oliveira, L.P.M., Jesus, R., Boulhosa, R.S., Mendes, C.M.C., Lyra, A.C. and Lyra, L.G.C. (2012) Metabolic Syndrome in Patients with Chronic Hepatitis C Virus Genotype 1 Infec-
E. A. Sabet et al.
264
tion Who Do Not Have Obesity or Type 2 Diabetes. Clinics, 67, 219-223. http://dx.doi.org/10.6061/clinics/2012(03)03
[34] Mangia, A. and Ripoli, M. (2013) Insulin Resistance, Steatosis and Hepatitis C Virus. He-patology International, 7, 782-789. http://dx.doi.org/10.1007/s12072-013-9460-1
[35] Bianchi, G., Marchesini, G., Zoli, M., Bugianesi, E., Fabbri, A. and Pisi, E. (1994) Prognostic Significance of Diabetes in Patients with Cirrhosis. Hepatology, 20, 119-125.
[36] Alberti, A., Vario, A., Ferrari, A. and Pistis, R. (2005) Chronic Hepatitis C—Natural Histo-ry and Cofactors. Alimentary Pharmacology & Therapeutics, 22, 74-78. http://dx.doi.org/10.1111/j.1365-2036.2005.02602.x
[37] Machado, M.V. and Cortez-Pinto, H. (2009) Insulin Resistance and Steatosis in Chronic Hepatitis C. Annals of Hepatology, 8, S67-S75.
[38] Patel, K., Thompson, A.J., Chuang, W.L., Lee, C.M., Peng, C.Y., Shanmuganathan, G., Thongsawat, S., Tanwandee, T., Mahachai, V. and Pramoolsinsap, C. (2011) Insulin Resis-tance Is Independently Associated with Significant Hepatic Fibrosis in Asian Chronic He-patitis C Genotype 2 or 3 Patients. Journal of Gastroenterology and Hepatology, 26, 1182- 1188. http://dx.doi.org/10.1111/j.1440-1746.2011.06722.x
[39] Hsu, C.S., Liu, C.H., Liu, C.J., Hsu, S.J., Chen, C.L., Hwang, J.J., Lai, M.Y., Chen, P.J., Chen, D.S. and Kao, J.H. (2010) Association of Metabolic Profiles with Hepatic Fibrosis in Chronic Hepatitis C Patients with Genotype 1 or 2 Infection. Journal of Gastroenterology and Hepatology, 25, 970-977. http://dx.doi.org/10.1111/j.1440-1746.2009.06186.x
[40] Yoneda, M., Saito, S., Ikeda, T., Fujita, K., Mawatari, H., Kirikoshi, H., Inamori, M., Nozaki, Y., Akiyama, T. and Takahashi, H. (2007) Hepatitis C Virus Directly Associates with Insu-lin Resistance Independent of the Visceral Fat Area in Nonobese and Nondiabetic Patients. Journal of Viral Hepatitis, 14, 600-607. http://dx.doi.org/10.1111/j.1365-2893.2006.00836.x
[41] Petta, S., Amato, M., Di Marco, V., Cammà, C., Pizzolanti, G., Barcellona, M.R., Cabibi, D., Galluzzo, A., Sinagra, D. and Giordano, C. (2012) Visceral Adiposity Index Is Associated with Significant Fibrosis in Patients with Non-Alcoholic Fatty Liver Disease. Alimentary Pharmacology & Therapeutics, 35, 238-247. http://dx.doi.org/10.1111/j.1365-2036.2011.04929.x
[42] Ercin, C.N., Dogru, T., Genc, H., Celebi, G., Aslan, F., Gurel, H., Kara, M., Sertoglu, E., Ta-pan, S. and Bagci, S. (2015) Insulin Resistance but Not Visceral Adiposity Index Is Asso-ciated with Liver Fibrosis in Nondiabetic Subjects with Nonalcoholic Fatty Liver Disease. Metabolic Syndrome and Related Disorders, 13, 319-325. http://dx.doi.org/10.1089/met.2015.0018

Submit or recommend next manuscript to SCIRP and we will provide best service for you:
Accepting pre-submission inquiries through Email, Facebook, LinkedIn, Twitter, etc. A wide selection of journals (inclusive of 9 subjects, more than 200 journals) Providing 24-hour high-quality service User-friendly online submission system Fair and swift peer-review system Efficient typesetting and proofreading procedure Display of the result of downloads and visits, as well as the number of cited articles Maximum dissemination of your research work
Submit your manuscript at: http://papersubmission.scirp.org/ Or contact [email protected]