Embed Size (px)
Citation preview

Insulin Action on Heart and Skeletal Muscle Glucose Uptakein Essential HypertensionPirjo Nuutila,* Maija MWUI,* Hanna Laine,* M. Juhani Knuuti,* Ulla Ruotsalainen,ll Matti Luotolahti,' Merja Haaparanta,11Olof SoWing Antti Jula,** Veikko A. Koivisto,* Uisa-Maria Voipio-Pulkki,* and Hannele Yki-JArvinenff*Department of Medicine, *Department of Clinical Physiology, Department of Nuclear Medicine, IlTurku University Cyclotron/PETCenter, University of Turku, lAccelerator Laboratory, Abo Akademi, FIN-20520 Turku, Finland, * *The Rehabilitation Research Centreof Social Insurance Institution, FIN-20720 Turku, ttSecond and 55Third Department of Medicine, University of Helsinki,FIN-00190 Helsinki, Finland
Abstract
Essential hypertension is characterized by skeletal muscleinsulin resistance but it is unknown whether insulin resis-tance also affects heart glucose uptake. We quantitatedwhole body (euglycemic insulin clamp) and heart and skele-tal muscle (positron emission tomography and 18F-fluoro-2-deoxy-D-glucose) glucose uptake rates in 10 mild essentialhypertensive (age 33±1 yr, body mass index 23.7±0.8 kg/mI, blood pressure 146±3/97±3 mmHg, Vo2, v 37±3 ml/kg per min) and 14 normal subjects (29±2 yr, 22.5±0.5kg/M2, 118±4/69±3 mmHg, 43±2 ml/kg per min). Leftventricular mass was similar in the hypertensive (155±15g) and the normotensive (164±13 g) subjects. In the hyper-tensives, both whole body (28±3 vs 44±3 jamol/kg per mimP < 0.01) and femoral (64±11 vs 94±8 ,umol/kg muscleper min, P < 0.05) glucose uptake rates were decreasedcompared to the controls. In contrast, heart glucose uptakewas 33% increased in the hypertensives (939±51 vs 707±46jzmol/kg muscle per min, P < 0.005), and correlated withsystolic blood pressure (r = 0.66, P < 0.001) and the minutework index (r = 0.48, P < 0.05). Weconclude that insulin-stimulated glucose uptake is decreased in skeletal musclebut increased in proportion to cardiac work in essentialhypertension. The increase in heart glucose uptake in mildessential hypertensives with a normal left ventricular massmay reflect increased oxygen consumption and represent anearly signal which precedes the development of left ventricu-lar hypertrophy. (J. Clin. Invest. 1995. 96:1003-1009.) Keywords: insulin resistance * hypertrophy lleft ventricletomography
Introduction
Insulin resistance characterizes patients with essential hyperten-sion (1-3). When glucose uptake is measured during insulinstimulation, the majority (70-80%) of glucose is taken up byskeletal muscles in normal subjects (4) and patients with essen-
Address correspondence to Pirjo Nuutila, Department of Medicine, Uni-versity of Turku, FIN-20520 Turku, Finland. Phone: 358-21-2611 611;FAX: 358-21-2612 030.
Receivedfor publication 23 November 1994 and accepted in revisedform 21 March 1995.
tial hypertension (5). Thus, whole body insulin resistance canbe attributed to diminished glucose uptake by skeletal musclesin these patients (5). However, the heart rather than skeletalmuscle is the organ ultimately adversely affected by hyperten-sion. Physiological insulin concentrations increase glucose up-take in the heart in normal subjects by about eightfold undernormoglycemic conditions (6, 7). It is unknown whether thisaction of insulin is altered in essential hypertension.
In rats, induction of cardiac hyperfunction by interventionssuch as aortic constriction (8) or atrial pacing (9), increasesoxygen and energy consumption per unit mass of myocardiumin proportion to the degree of hyperfunction. Aortic constrictionalso increases glucose uptake in the rat heart (8). In the latterstudy, the increase in glucose uptake was attributed to doublingof blood glucose concentrations due to the stress of aortic con-striction, and an increase in plasma norepinephrine concentra-tions. In hearts of severely hypertensive fed rats, Yonekura etal. (10) found increased glucose uptake but in this study theconcentration of circulating substrates and hormones was notdetermined. Long-term systemic hypertension induces left ven-tricular pressure and volume overload, and ultimately cardiachypertrophy (11) . Under such conditions, oxygen consumptionis generally normal per unit mass of myocardium, althoughtotal heart oxygen consumption is increased (8). It is unclear,however, whether these data are pertinent for understanding theeffect of hypertension on heart glucose metabolism in humans.The present study was therefore undertaken to determine,whether and how glucose utilization in the mildly hypertensiveheart is altered during insulin stimulation. We also examinedwhether poor physical fitness is associated with insulin resis-tance in patients with mild essential hypertension. Heart andmuscle glucose uptake rates were determined during insulinstimulation in essential hypertensives and normal subjects usingpositron emission tomography (PET)' derived 15F-fluoro-2-deoxy-D-glucose (18FDG) kinetics. Whole body insulin sensi-tivity was determined simultaneously but independent of theregional measurements using the euglycemic insulin clamptechnique.
Methods
Subjects. The study group consisted of 10 ambulatory patients withuntreated mild essential hypertension (Table I). The diagnosis was madewhen diastolic blood pressure equaled or exceeded 100 mmHgon atleast three occasions, with the patient in supine position. A completemedical workup was carried out to exclude secondary forms of hyperten-
1. Abbreviations used in this paper: 18FDG, 18F-fluoro-2-deoxy-D-glu-cose; PET, positron emission tomography.
Heart and Muscle Insulin Sensitivity in Hypertension 1003
J. Clin. Invest.X The American Society for Clinical Investigation, Inc.0021-9738/95/08/1003/07 $2.00Volume 96, August 1995, 1003-1009

Table I. Subject Characteristics
Hypertensives Controls P
Age (yr) 33±1 29±2 NSMale/Female 4/6 8/6 NSBody mass index (kg/M2) 23.7±0.8 22.5±0.5 NSVo2max (ml/kg per min) 37±3 43±2 NSBlood pressure
systolic (mmHg) 146±3 118±4 < 0.001diastolic (mmHg) 97±3 69±3 < 0.001
Heart rate (1/min) 69±3 65±2 NSRate-pressure product
(mmHg/min) 10120±458 7608±433 < 0.001Left ventricular mass (g) 155± 15 164±13 NSLeft ventricular mass index (g/m2) 88±6 87±6 NSEjection fraction 64±1 62±1 NSMinute work per myocardial mass
(mmHg x liter/min x g) 5.4±0.5 3.9±0.4 < 0.02Minute work index (mmHg x
liter/min X m2) 457±37 338±39 < 0.05
sion. Renal, liver, and endocrine function tests were normal, and noneof the subjects had any signs or symptoms of ischemic heart disease orother disease. 14 normotensive healthy subjects matched for age, gender,and body mass index formed the control group (Table I). None of thenormal subjects or hypertensives used any medications.
At least 3 d before the study, the subjects consumed a weight-maintaining diet containing at least 200 g of carbohydrate and avoidedparticipation in any physical training. The nature, purpose, and potentialrisks of the study were explained to all subjects before they gave theirvoluntary consent to participate. The study was approved by the EthicalCommittee of the Turku University Hospital, Turku, Finland.
Study design. In each subject whole body glucose uptake was mea-sured using the euglycemic insulin clamp technique and regional (heartand femoral muscle) glucose uptake using PET and '8FDG. In addition,VO2ma, and left ventricular structure were determined using a standardincremental bicycle ergometer test and M-mode echocardiography, re-spectively. The study consisted of a 120-min hyperinsulinemic period(Fig. 1). Between 0 and 120 min, whole body glucose uptake wasmeasured under normoglycemic hyperinsulinemic conditions using theeuglycemic insulin clamp technique. For measurement of heart andskeletal muscle glucose uptake, '8FDG was injected at 60 min, anddynamic scanning was started (Fig. 1). Blood samples for the measure-ment of plasma glucose, serum insulin, FFA concentrations, and '8FDGradioactivity were taken as detailed below.
Whole body glucose uptake. Whole body glucose uptake was deter-mined using the euglycemic insulin clamp technique (12). All studieswere performed starting at 8:00 a.m. after a 10-12-h overnight fast.Two catheters were inserted, one in an antecubital vein for infusions ofglucose and insulin and injection of '8FDG, and one in a heated (70'C)hand vein for sampling of arterialized venous blood.
At 0 min, serum insulin was increased for 120 min using a primed-continuous infusion of insulin (Actrapid; Novo Nordisk A/S, Copenha-gen, Denmark). The rate of the continuous insulin infusion was 1 mU(6 pmol)/kg per min. Normoglycemia was maintained using a variablerate infusion of 20% glucose. The rate of the glucose infusion wasadjusted according to the plasma glucose concentration, which was mea-sured every 5 min from arterialized venous blood using the glucoseoxidase method (13). Hepatic glucose production is completely sup-pressed under these conditions (14). The rate of whole body glucoseuptake was calculated during the time of PET scanning (60-120 min).Blood samples were taken at 20-30-min intervals for measurement ofserum insulin (15) and EFA (16) concentrations.
-J PET, ThRMRmION
m PETr, PEGORALREOOM I 'aPDG INJECTED
IZ IBiZ
20% GLUCOSEINFUSION
I R I Ifi I IinIfii|n:
0 s0 120TIME (mmn)
Figure 1. Design of the study. The arrow indicates the time of the"8FDG injection. After the injection, dynamic PET scanning of the tho-racic and femoral regions was performed to quantitate regional glucoseuptake rates. Whole body glucose uptake was measured using the eugly-cemic insulin clamp technique (insulin infusion rate 1 mU/kg per min).
Regional glucose uptake by heart and skeletal muscles. These mea-surements were performed using positron emission tomography as pre-viously described (6). The method included the following procedures.
Preparation of "8FDG. "8FDG was synthesized with an automaticapparatus essentially described by Hamacher et al. (17). The specificradioactivity at the end of the synthesis was 2 Ci/pmol and theradiochemical purity exceeded 98%.
Image acquisition. A 15 slice ECAT931/08-tomograph (Siemens/CTI Corp., Knoxville, TN) was used. The device has a measured axialresolution of 6.7 mmand resolution of 6.5 mmin plane (18). Thesubject was positioned in the tomograph first with arms on sides so thatthe heart was within the gantry. Thereafter images were obtained fromfemoral regions. Before emission scanning, a transmission scan for cor-rection of attenuation in the body was performed for 20-30 min. Ineach plane 15-30 X 106 counts were obtained.
1 h after starting the insulin infusion, 7-8 mCi of '8FDG was injectedintravenously over 20 s (Fig. 1). Dynamic scanning of the thoracicregion was started simultaneously and continued for 40 min (8 x 152 x 30, 2 x 120, 1 x 180, 6 x 300 s). Thereafter, five dynamic scansof 180 s each were taken from the femoral region. Blood samples formeasurement of plasma radioactivity was withdrawn once during eachframe time to create the time activity curve.
Image processing. All data were corrected for deadtime, decay, andmeasured photon attenuation as previously described (6) and recon-structed into a 256 X 256 matrix. For determination of myocardialglucose uptake, elliptical regions of interest (ROIs) were placed onseven different segments of the myocardium (19). Myocardial timeactivity curves were corrected for partial volume and spillover effects(20). In the femoral muscle, we used posterior, anterolateral, and ante-romedial muscular compartments of the femoral region (four slices inboth legs). Their localization was verified by comparison with the posi-tion observed in the transmission images. An example of the correctedtime activity curves in the plasma, heart, and femoral muscles is shownin Fig. 2. Trapping of '8FDG in the heart was more intense in hyperten-sive than the normal subjects, while 18FDG activity in the femoral mus-cles was higher in the control than in hypertensive subjects.
Calculation of regional glucose uptake. The three compartmentmodel of 18FDG kinetics was used as previously described (6, 21).Plasma and tissue time activity curves were analyzed graphically toquantitate the fractional rate of tracer uptake and phosphorylation Ki(22). Ki is equal to (k1 x k3lk2 + k3), where k, is the transfer coefficientfrom vascular space into the tissue, k2 is the initial clearance and effluxcoefficient and k3 is the phosphorylation rate constant. The Patlak analy-sis assumes that the rate of dephosphorylation (k4) is zero (22). Asshown in reference 23, at least in the heart k4 will become importantafter 60 min. In the present study, the measurements were done within65 min from the injection. If in the graphical analysis the plot is linear,
1004 Nuutila et al.

A
E 1500
21I1000.
500
B 2000
100
0 20 40 6 80Time (mlin)
Figure 2. Example of corrected time activity curves for plasma (m),myocardium (*), and femoral muscle (A) in a control subject (A) andin a hypertensive subject (B).
for some period, the underlying assumptions of the method are validfor that period (22). In this study, the fitted plasma time activity curvewas used as the input function and a minimum of six time points wereused to determine the slope by linear regression for the thoracic studyand five points were used for the femoral study. The plots between thepoints were linear (for myocardium r = 0.96±0.03; for skeletal muscle r= 0.84±0.05) and the residuals of the regression lines were stocasticallyscattered. Although the linear regression r value was lower for skeletalmuscle than for myocardium, the scanning period of 15 min was longenough since both r values (0.84±0.05 vs 0.85±0.06 for five [15 min] vsfour [12 min] points and Ki values (0.0176±0.0042 vs 0.0177±0.0054)remained unchanged when only four points (12 mmn) were used todetermine the slope.
The rate of glucose utilization is obtained by multiplying Ki by theplasma glucose concentration [ Glc ]p divided by a lumped constant term(LC): rGU = [Glc]pILC) X Ki(. The lumped constant accounts fordifferences in the transport and phosphorylation rate of 18F1G and glu-cose. Lumped constant values of 0.67 for the heart (6, 23, 24) and 1.0for the skeletal muscle (6. 25) were used as previously described.
Left ventricular structure. M-mode and two-dimensional echocardi-ography (Ac!sWn 128XP/5; Acuson Inc., Mountain View, CA) wereperformed In- the hypertensives and control subjects to determine end-diastolic and end-systolic left ventricular dimensions, and septal andposterior fr-ee wall thicknesses. Left ventricular mass was calculatedaccording to the Penn convention (26). Minute work for the myocar-dium was calculated according to the equation: mean blood pressurex cardiac output (27). Minute work index was calculated by dividing
minute work by body surface area, and minute work per mass by divid-ing minute work by left ventricular mass.
Maximal aerobic power (Vo2..) Vo2,. was determined in the studysubjects using an electrically braked cycle ergometer (Ergoline 800 S;Mijnhardt, Bunnik, Netherlands) with a continuous incremental proto-col. Direct respiratory measurements were made using an automatedsystem (Medikro 202; Medicro Oy, Kuopio, Finland). Subjects breathedthrough a Daniel's valve, with expired gases directed to a mixing cham-ber for paramagnetic 02 and infrared CO2 analysis (Datex Division;Instrumentarium Corp., Helsinki, Finland). Outputs from these instru-ments were directed to a computer for calculation of ventilation, 02consumption (Vo2), CO2production (VCo2), and respiratory exchangeratio (R) every 30 s. The Vo2,., test consisted of a short warm-up, afterwhich the load was increased from 100 Wby 30 Wevery 2 min untilexhaustion. The criteria used to establish the Vo2,n,,, were a plateau inVo2 with increasing exercise intensity and R> 1.10. Calibration againststandard gases (16% 02 and 4%C02), volume (3,000 ml), room tem-perature, and barometric pressure was performed before and immedi-ately after each test.
Statistical procedures. Statistical comparisons between hypertensivesubjects and controls were performed using the unpaired t test andcorrelations were calculated using Pearson's correlation coefficients.Analysis of covariance was used to study the influence of age andVoqn on glucose uptake rates between the two groups using the Systatstatistical package (SYSTAT Inc., Evanston, IL). Data are expressedas means±SE.
Results
Glucose, insulin, and FFA concentrations. Plasma glucose con-centrations were similar in the hypertensive and control subjectsboth in the basal state (5.2±0.1 vs 5.3±0.1 mmol/liter) andduring hyperinsulinemia (5.1±0.1 vs 4.8±0.1 mmol/liter). Thefasting serum insulin concentration in the hypertensives(49±12) was slightly but not significantly higher than in thenormal subjects (34±6 pmol/liter). During hyperinsulinemia,serum insulin concentrations were similar in the two groups(418±24 vs 394±23 pmol/liter, respectively).
Fasting plasma FFA concentrations were higher in the hy-pertensive than the normal subjects in the basal state (829±59vs 544±51 ,smol/liter P < 0.001) and during hyperinsulinemia(139±8 vs 96±9 pmol/liter, P < 0.01). The increased FFAconcentrations in the face of comparable insulin concentrationssuggest insulin resistance of antilipolysis in the hypertensives.
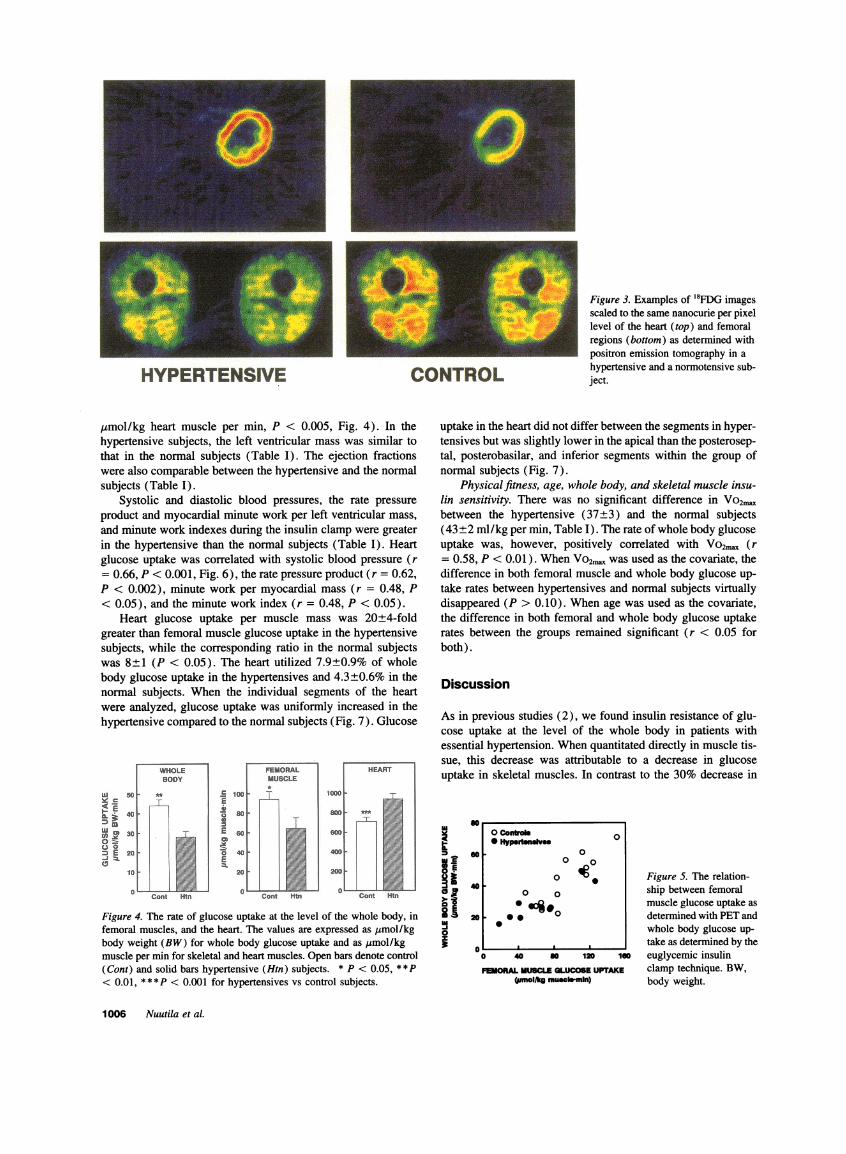
Whole body and skeletal muscle glucose uptake. The hyper-tensive subjects were insulin resistant since the rate of wholebody glucose uptake was 36%lower than in the normal subjects(28±3 vs 44±3 timol/kg per min, respectively, P < 0.01).
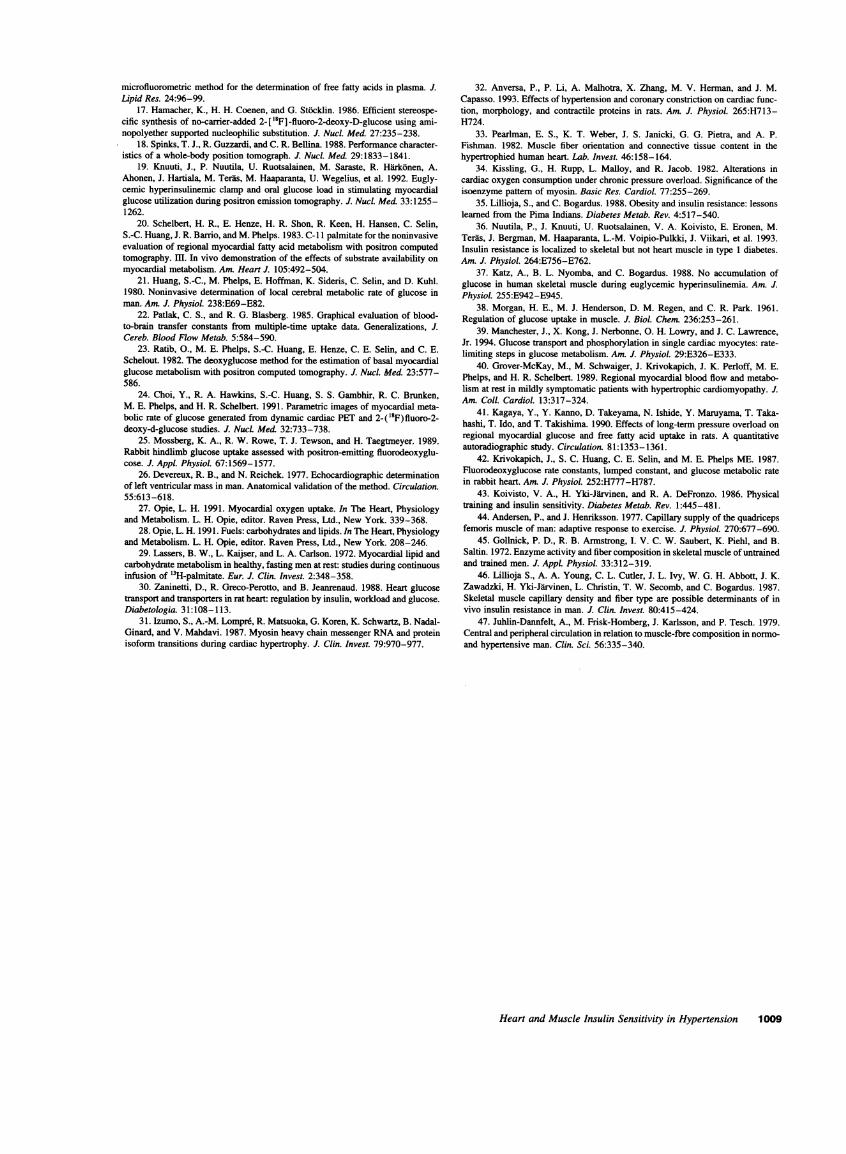
When individual PETderived images of `8FDG uptake rateswere scaled to the same nCi/pixel level, 18FDG uptake wasdecreased in femoral muscles in the hypertensives subjects (Fig.3). Femoral muscle glucose uptake averaged 64±11 /mol/kgper min in the hypertensive subjects which was 32% lower thanin the normal subjects (94±8 Ismol/kg per min, P < 0.05, Fig.4). There was a positive correlation between femoral muscleand whole body glucose uptake both in the hypertensives (r= 0.89, P < 0.001) and the normal subjects (r = 0.84, P<0.001, Fig. 5).
Myocardial glucose uptake. When individual PET derivedimages of '8FDG uptake rates were scaled to the same nCi/pixel level, 18FDG uptake was increased in the heart of thehypertensive subjects compared to the normal subjects (Fig. 3).The actual rate of glucose uptake was 33% higher in the heartof hypertensives (939±51) than the normal subjects (707±46
Heart and Muscle Insulin Sensitivity in Hypertension 1005
HYPERTENSIVE CONTROL
,umol/kg heart muscle per min, P < 0.005, Fig. 4). In thehypertensive subjects, the left ventricular mass was similar tothat in the normal subjects (Table I). The ejection fractionswere also comparable between the hypertensive and the normalsubjects (Table I).
Systolic and diastolic blood pressures, the rate pressureproduct and myocardial minute work per left ventricular mass,and minute work indexes during the insulin clamp were greaterin the hypertensive than the normal subjects (Table I). Heartglucose uptake was correlated with systolic blood pressure (r= 0.66, P < 0.001, Fig. 6), the rate pressure product (r = 0.62,P < 0.002), minute work per myocardial mass (r = 0.48, P< 0.05), and the minute work index (r = 0.48, P < 0.05).
Heart glucose uptake per muscle mass was 20+4-foldgreater than femoral muscle glucose uptake in the hypertensivesubjects, while the corresponding ratio in the normal subjectswas 8±1 (P < 0.05). The heart utilized 7.9±0.9% of wholebody glucose uptake in the hypertensives and 4.3±+0.6% in thenormal subjects. When the individual segments of the heartwere analyzed, glucose uptake was uniformly increased in thehypertensive compared to the normal subjects (Fig. 7). Glucose
Y c
00
0=E
c
IE
I
Cont Htn
Figure 4. The rate of glucose uptake at the level of the whole body, infemoral muscles, and the heart. The values are expressed as Amol/kgbody weight (BW) for whole body glucose uptake and as umol/kgmuscle per min for skeletal and heart muscles. Open bars denote control(Cont) and solid bars hypertensive (Htn) subjects. * P < 0.05, **P< 0.01, * * * P < 0.001 for hypertensives vs control subjects.
Figure 3. Examples of 18FDG imagesscaled to the same nanocurie per pixellevel of the heart (top) and femoralregions (bottom) as determined withpositron emission tomography in ahypertensive and a normotensive sub-ject.
uptake in the heart did not differ between the segments in hyper-tensives but was slightly lower in the apical than the posterosep-tal, posterobasilar, and inferior segments within the group ofnormal subjects (Fig. 7).
Physical fitness, age, whole body, and skeletal muscle insu-lin sensitivity. There was no significant difference in Vo2",between the hypertensive (37±3) and the normal subjects(43 ±2 ml/kg per min, Table I). The rate of whole body glucoseuptake was, however, positively correlated with Vo2,,, (r= 0.58, P < 0.01). WhenVO2m was used as the covariate, thedifference in both femoral muscle and whole body glucose up-take rates between hypertensives and normal subjects virtuallydisappeared (P > 0.10). When age was used as the covariate,the difference in both femoral and whole body glucose uptakerates between the groups remained significant (r < 0.05 forboth).
Discussion
As in previous studies (2), we found insulin resistance of glu-cose uptake at the level of the whole body in patients withessential hypertension. Whenquantitated directly in muscle tis-sue, this decrease was attributable to a decrease in glucoseuptake in skeletal muscles. In contrast to the 30% decrease in
Ii
if0z
soo conyoas* H"yportnv 0
60 0
0 o40 0
0 o420 - .-:0 0
0
0 40 s0 120 160
FEMORALMUSCLEGLUCOSEUPTAKE(umol/kg mucho-min)
Figure 5. The relation-ship between femoralmuscle glucose uptake asdetermined with PETandwhole body glucose up-take as determined by theeuglycemic insulinclamp technique. BW,body weight.
1006 Nuutila et al.

120
1000
Zo
, -E
if
o convol * S* HypevtenelIwI
0o 0 10.j0o CIO 0 00
00
.5. 0,____ , . Figure 6. The relation-
100 120 140 160 ship between systolicSYSTOLIC BLOODPRESSURE blood pressure and heart
(wu~i~hgp glucose uptake.
glucose uptake in skeletal muscle, insulin stimulated glucoseuptake was 30% increased in the myocardium. The increase inmyocardial glucose uptake in the hypertensives was observeddespite similar left ventricular masses in the two groups. Thenormal size of the left ventricle is compatible with the mildhypertension characterizing the present study subjects and sug-
gests a relatively short period or mild severity of pressure over-
load.Regarding the mechanisms of the increased heart glucose
uptake, both a shift in fuel utilization, and a change in cardiacwork should be considered. The heart is able to derive energy
from a variety of sources including glucose, FFA, lactate, aminoacids, and ketone bodies (28). Postprandially and during brieffasting, glucose and FFA are the predominant fuels. In humans,the serum FFA concentrations and the arterial-coronary sinusglucose differences (29) and glucose uptake (7) are closelyand inversely correlated after an overnight fast. Since serum
EFA concentrations were higher both basally and during hyper-insulinemia in the hypertensive than the normal subjects, dimin-ished FFA utilization is unlikely to explain the increase in heartglucose uptake. This implies that factors other than a shift in
fuel preference was responsible for the increased heart glucoseuptake in the hypertensives.
Systolic blood pressure and rate pressure product, and mi-nute work per heart mass and body surface area were all higherin the hypertensives than the control subjects, suggesting an
increased need of energy per contractile unit. Heart glucoseuptake was also correlated with systolic blood pressure and
the rate pressure product and minute work. In animal studies,immediately after a rise in myocardial tension, myocardial oxy-gen consumption and thus energy production in the myocardiumincreased in proportion to the increase in tension (8, 9). Inhumans, cardiac hyperfunction induced by acute exercise (8)and atrial pacing (9) is accompanied by considerable augmen-tation of myocardial oxygen consumption per unit mass of myo-cardium. During incremental atrial pacing after an overnightfast, both oxygen consumption and glucose uptake rise linearly(9). In perfused hearts of normal rats, acutely increasing cardiacwork by raising the perfusion pressure also induces parallelincreases in oxygen consumption and glucose in the absence ofinsulin (30). The present finding of an increase in glucoseconsumption per unit heart mass, which was proportional toestimated cardiac work is therefore compatible with the ideathat the increase in glucose utilization reflected an increase inoxygen consumption.
The present data are unlikely to be applicable to patientswith long-standing hypertension and left ventricular hypertro-phy. In such patients, myocardial oxygen consumption and en-ergy production per unit mass of myocardium are usually nor-mal (8), although cardiac work load is increased. This apparentparadox seems to be explained by distribution of myocardialfunction throughout an increased mass. Thus, we interpret theincreased glucose uptake in patients with mild essential hyper-tension and a normal left ventricular mass to represent an earlyevent which precedes the development of left ventricular hyper-trophy. In rats, the increase in myocardial mass and accompa-nying decrease in oxygen consumption per unit heart mass to-wards normal, which is characteristic for the development ofleft ventricular hypertrophy, is associated with a shift in myosinisoenzymes from a faster (VI) to a slower (V3) enzymatic form,a decrease in adenosinetriphosphatase activity, and increase inconnective tissue and a decrease in myocardial contractility (8,31-33). Oxygen consumption of working hearts decreasesupon increasing V3 expression (34). These changes may reflectan attempt of the myocardium to restore oxygen consumptionand energy production towards normal.
Although glucose uptake per heart mass was increased dur-ing hyperinsulinemia in the hypertensives, this finding does notnecessarily exclude the existence of insulin resistance in heartmuscle. As suggested by Lillioja and Bogardus (35), perhaps
lu
s 1000E
A,
Dl
ouE
':3:C-
T __ _|.ll;.^1 1^_l___- l_ A____ _---a_-_ RN__s __ ____s____|-__-A_ __-_ l_-_-
---- |--- - |
He |-- -s-|----|
E-_ __ _-_ _-_s----|-|----------X -A_God________________ ______AD_ a_ __ _ - ____ AMEN__ ________-__ ____ ______ __ _- __ __ __ __-_____ __ __ __ __ _s____-_--___ __|__ __A_ __-
__ __-_ __ _-_ __A__s __ __ __ A_
__________ _X---At-|-----|----i-|---
-----s-| s w . ED v ff
HYPERTENSIVES
1 2 3 4 5 6 7
CONTROLS
Figure 7. Comparison of heartglucose uptake rates betweenmyocardial segments between pa-
tients with hypertension and thenormal subjects in different myo-cardial segments. Glucose uptakewas higher in every segment in thehypertensives than the normalsubjects (P < 0.05 or less). * P< 0.05 segment 5 vs segments 4,6, and 7. 1, anteroseptal; 2, ante-rior; 3, lateral; 4, posteroseptal; 5,apical; 6, posterobasilar; 7, infe-rior segment of the myocardium.
Heart and Muscle Insulin Sensitivity in Hypertension 1007
I
I2I
Ir -
IL,rise
0L

most accurate way to normalize metabolic data is to relate sub-strate utilization rates to the basal metabolic rate of a tissue. Aswe did not measure energy expenditure directly in the presentstudy, we cannot compare insulin-stimulated glucose uptakerates adjusted for oxygen consumption between hypertensivesand normal subjects. However, heart glucose uptake and therate pressure product, a crude measure of cardiac work as wellas systolic blood pressure, were linearly correlated and seemedto fall on the same regression line in both groups (Fig. 6).This suggests that glucose uptake was not diminished in thehypertensives even if it had been related to cardiac work, andpresumably oxygen consumption. Thus, the hypertensive heartmuscle seems neither insulin resistant nor abnormally sensitiveto insulin. This finding resembles that found in previous studiesin type 1 diabetic patients in which skeletal muscle insulinresistance was not associated with insulin resistance in the heart(36). The reason for these divergent responses of skeletal andheart muscles is unknown but could be related to inherent differ-ences in glucose metabolism between the two tissues. For exam-ple, glucose transport is rate limiting in skeletal muscle undereuglycemic-hyperinsulinemic conditions (37) in contrast toglucose phosphorylation which limits glucose utilization in theheart (38, 39).
In patients with hypertrophic cardiomyopathy, in which theseptum is thicker than the lateral wall, a relative decrease inseptal flow, and glucose and free fatty acid uptake has beenshown by PET (40). Wedid not detect differences in glucoseuptake rates between anatomical regions in hypprtensives whohad no myocardial hypertrophy (Fig. 7). Yonekura et al. (10)found accelerated '4C-deoxy-glucose uptake and decreased fattyacid ('4C-beta-methyl heptadecanoid acid) extraction in se-verely hypertensive rats. These changes were localized to thesubendocardial layer of the left ventricular wall in salt-sensitivehypertensive rats, while in the study of Kagaya et al. "4C-deoxy-glucose uptake was similar between the inner and outer halvesof the left ventricular wall (41). Our technique does not allowquantitation of glucose uptake in different layers of the myocar-dium (Fig. 3).
For glucose uptake calculations we assumed a lumped con-stant (LC) of 0.67 for the heart and 1.0 for skeletal muscle inboth hypertensives and control subjects. The validity of 1.0 asthe lumped constant for skeletal muscle is supported by ourprevious finding of similar glucose uptake rates measured with15FDGand PET and the forearm balance technique under condi-tions identical to those of the present study (6). Also, the closecorrelation between whole body glucose uptake, measured si-multaneously but independently of PET methodology with theinsulin clamp technique, and femoral glucose uptake, measuredwith PET, supports the validity of the method (Fig. 5). A LCof 0.67 is commonly used for the heart (23, 24). Previousstudies have shown that neither changes in the nutritional statenor those in work load affect the LC for heart (42).
Previous studies have documented skeletal muscle insulinsensitivity to be highly correlated with VO2ma,, and to increaseby physical training (43). In endurance-trained athletes, thenumber of capillaries per fiber is increased (44) as is the percenttype 1, insulin-sensitive fibers (45, 46). In hypertensives, oppo-site alterations in muscle fiber type distribution and the numberof capillaries per fiber have been described (47). Such changesin muscle histology might explain the lower Vo2m, and insulinsensitivity in the hypertensive than the normal subjects. How-ever, in a cross-sectional analysis, it is not possible to determine
whether poor physical fitness causes insulin resistance in hyper-tension or vice versa, or whether the correlation between VO2m.axis merely coincidental.
In conclusion, the present data demonstrate that insulin re-sistance in patients with mild untreated essential hypertensionis localized to skeletal muscle. In these patients without cardiachypertrophy, myocardial glucose uptake is increased. It mayreflect increased myocardial oxygen consumption and be anearly signal for the development of left ventricular hypertrophy.
Acknowledgments
Wethank the technicians at the Turku University Cyclotron/PET Centerfor their skill and dedication throughout this study. Wealso thank JukkaKapanen, M. Sci. and the Paavo Nurmi Center for the Vo2max determina-tions.
This study was supported by the grants of the Finnish Academy ofScience (H. Yki-Jdrvinen, P. Nuutila), Nordisk Insulinfonds Komite(H. Yki-Jdrvinen, P. Nuutila), and Turku University Foundation (P.Nuutila).
References
1. Modan, M., H. Halkin, S. Almog, A. Lusky, A. Eshkol, M. Shefi, A. Chetrit,and Z. Fuchs. 1985. Hyperinsulinemia: a link between hypertension, obesity andglucose intolerance. J. Clin. Invest. 75:809-817.
2. Ferrannini, E., G. Buzzigoli, R. Bonadonna, M. A. Giorico, M. Oleggini,L. Graziadei, R. Pedrinelli, L. Brandi, and S. Bevilacqua. 1987. Insulin resistancein essential hypertension. N. Engl. J. Med. 317:350-357.
3. Pollare, T., H. Lithell, and C. Berne. 1990. Insulin resistance is characteristicfeature of primary hypertension independent of obesity. Metab. Clin. Exp. 39:167-174.
4. DeFronzo, R. A., E. Jacot, E. Jequier, E. Maeder, J. Wahren, and J. P.Felber. 1981. The effect of insulin on the disposal of intravenous glucose. Resultsfrom indirect calorimetry and hepatic and femoral venous catheterization. Diabe-tes. 30:1000-1007.
5. Natali, N., D. Santoro, C. Palombo, M. Cerri, S. Ghione, and E. Ferrannini.1991. Impaired insulin action on skeletal muscle metabolism in essential hyperten-sion. Hypertension (Dallas). 17:170-178.
6. Nuutila, P., V. A. Koivisto, J. Knuuti, U. Ruotsalainen, M. Terds, M.Haaparanta, J. Bergman, 0. Solin, L.-M. Voipio-Pulkki, U. Wegelius, and H.Yki-Jarvinen. 1992. Glucose-free fatty acid cycle operates in human heart andskeletal muscle in vivo. J. Clin. Invest. 89:1767-1744.
7. Nuutila, P., M. J. Knuuti, U. Ruotsalainen, M. Teras, L.-M. Voipio-Pulkki,M. Haaparanta, 0. Solin, U. Wegelius, and H. Yki-Jdrvinen. 1994. Effect ofantilipolysis on heart and skeletal muscle glucose uptake in overnight fastedhumans. Am. J. Physiol. 267:E941-E946.
8. Meerson, F. Z. 1969. Transformation of energy in the myocardium inhyperfunction, hypertrophy, and heart failure. Circ. Res. 25(Suppl. II):II-55-II-81.
9. Camici, P., P. Marraccini, M. Marzilli, R. Lorenzoni, G. Buzzigoli, R.Puntoni, C. Boni, C. R. Bellina, G. A. Klassen, A. L'Abbate, and E. Ferrannini.1989. Coronary hemodynamics and myocardial metabolism during and after pac-ing in normal humans. Am. J. Physiol. 257:E309-E317.
10. Yonekura, Y., A. B. Brill, P. Som, K. Yamamoto, S. C. Srivastava, J.Iwai, D. R. Elmalch, E. Livini, H. W. Strauss, M. M. Goodman, and F. F. Knapp,Jr. 1985. Regional myocardial substrate uptake in hypertensive rats: a quantitativeautoradiographic measurement. Science (Wash. DC). 227:1494-1496.
11. Frohlich, E. D. 1989. Heart Failure hypertrophy, cardiac diseases andhypertension: recent experiences. J. Am. Coll. Cardiol. 14:1587-1594.
12. DeFronzo, R. A., J. D. Tobin, and R. Andres. 1979. The glucose clamptechnique: a method for quantifying insulin secretion and resistance. Am. J. Phys-iol. 237:E214-E223.
13. Kadish, A. H., R. L. Little, and J. C. Sternberg. 1968. A new and rapidmethod for the determination of glucose by measurement of rate oxygen consump-tion. Clin. Chem. 14:116-131.
14. Yki-Jarvinen, H., A. Consoli, N. Nurjhan, A. A. Young, and J. E. Gerich.1989. Mechanism for underestimation of isotopically determined glucose disposal.Diabetes. 38:744-751.
15. Kuzuya, H., P. M. Blix, D. L. Horwitz, D. F. Steiner, and A. Rubenstein.1977. Determination of free and total insulin and C-peptide in insulin-treateddiabetics. Diabetes. 26:22-29.
16. Miles, J., R. Glasscock, J. Aikens, J. Gerich, and M. Haymond. 1983. A
1008 Nuutila et al.
microfluorometric method for the determination of free fatty acids in plasma. J.Lipid Res. 24:96-99.
17. Hamacher, K., H. H. Coenen, and G. Stocklin. 1986. Efficient stereospe-cific synthesis of no-carrier-added 2- [ '8F] -fluoro-2-deoxy-D-glucose using ami-nopolyether supported nucleophilic substitution. J. Nucl. Med. 27:235-238.
18. Spinks, T. J., R. Guzzardi, and C. R. Bellina. 1988. Performance character-istics of a whole-body position tomograph. J. Nucl. Med. 29:1833-1841.
19. Knuuti, J., P. Nuutila, U. Ruotsalainen, M. Saraste, R. Harkonen, A.Ahonen, J. Hartiala, M. Terls, M. Haaparanta, U. Wegelius, et al. 1992. Eugly-cemic hyperinsulinemic clamp and oral glucose load in stimulating myocardialglucose utilization during positron emission tomography. J. Nucl. Med. 33:1255-1262.
20. Schelbert, H. R., E. Henze, H. R. Shon, R. Keen, H. Hansen, C. Selin,S.-C. Huang, J. R. Barrio, and M. Phelps. 1983. C-Il palmitate for the noninvasiveevaluation of regional myocardial fatty acid metabolism with positron computedtomography. HI. In vivo demonstration of the effects of substrate availability onmyocardial metabolism. Am. Heart J. 105:492-504.
21. Huang, S.-C., M. Phelps, E. Hoffman, K. Sideris, C. Selin, and D. Kuhl.1980. Noninvasive determination of local cerebral metabolic rate of glucose inman. Am. J. Physiol. 238:E69-E82.
22. Patlak, C. S., and R. G. Blasberg. 1985. Graphical evaluation of blood-to-brain transfer constants from multiple-time uptake data. Generalizations, J.Cereb. Blood Flow Metab. 5:584-590.
23. Ratib, O., M. E. Phelps, S.-C. Huang, E. Henze, C. E. Selin, and C. E.Schelout. 1982. The deoxyglucose method for the estimation of basal myocardialglucose metabolism with positron computed tomography. J. Nucl. Med. 23:577-586.
24. Choi, Y., R. A. Hawkins, S.-C. Huang, S. S. Gambhir, R. C. Brunken,M. E. Phelps, and H. R. Schelbert. 1991. Parametric images of myocardial meta-bolic rate of glucose generated from dynamic cardiac PET and 2-('8F)fluoro-2-deoxy-d-glucose studies. J. Nucl. Med. 32:733-738.
25. Mossberg, K. A., R. W. Rowe, T. J. Tewson, and H. Taegtmeyer. 1989.Rabbit hindlimb glucose uptake assessed with positron-emitting fluorodeoxyglu-cose. J. Appl. Physiol. 67:1569-1577.
26. Devereux, R. B., and N. Reichek. 1977. Echocardiographic determinationof left ventricular mass in man. Anatomical validation of the method. Circulation.55:613-618.
27. Opie, L. H. 1991. Myocardial oxygen uptake. In The Heart, Physiologyand Metabolism. L. H. Opie, editor. Raven Press, Ltd., New York. 339-368.
28. Opie, L. H. 1991. Fuels: carbohydrates and lipids. In The Heart, Physiologyand Metabolism. L. H. Opie, editor. Raven Press, Ltd., New York. 208-246.
29. Lassers, B. W., L. Kaijser, and L. A. Carlson. 1972. Myocardial lipid andcarbohydrate metabolism in healthy, fasting men at rest: studies during continuousinfusion of 13H-palmitate. Eur. J. Clin. Invest. 2:348-358.
30. Zaninetti, D., R. Greco-Perotto, and B. Jeanrenaud. 1988. Heart glucosetransport and transporters in rat heart: regulation by insulin, workload and glucose.Diabetologia. 31:108-113.
31. Izumo, S., A.-M. Lompre, R. Matsuoka, G. Koren, K. Schwartz, B. Nadal-Ginard, and V. Mahdavi. 1987. Myosin heavy chain messenger RNAand proteinisoform transitions during cardiac hypertrophy. J. Clin. Invest. 79:970-977.
32. Anversa, P., P. Li, A. Malhotra, X. Zhang, M. V. Herman, and J. M.Capasso. 1993. Effects of hypertension and coronary constriction on cardiac func-tion, morphology, and contractile proteins in rats. Am. J. Physiol. 265:H713-H724.
33. Pearlman, E. S., K. T. Weber, J. S. Janicki, G. G. Pietra, and A. P.Fishman. 1982. Muscle fiber orientation and connective tissue content in thehypertrophied human heart. Lab. Invest. 46:158-164.
34. Kissling, G., H. Rupp, L. Malloy, and R. Jacob. 1982. Alterations incardiac oxygen consumption under chronic pressure overload. Significance of theisoenzyme pattern of myosin. Basic Res. Cardiol. 77:255-269.
35. Lillioja, S., and C. Bogardus. 1988. Obesity and insulin resistance: lessonslearned from the Pima Indians. Diabetes Metab. Rev. 4:517-540.
36. Nuutila, P., J. Knuuti, U. Ruotsalainen, V. A. Koivisto, E. Eronen, M.Terais, J. Bergman, M. Haaparanta, L.-M. Voipio-Pulkki, J. Viikari, et al. 1993.Insulin resistance is localized to skeletal but not heart muscle in type 1 diabetes.Am. J. Physiol. 264:E756-E762.
37. Katz, A., B. L. Nyomba, and C. Bogardus. 1988. No accumulation ofglucose in human skeletal muscle during euglycemic hyperinsulinemia. Am. J.Physiol. 255:E942-E945.
38. Morgan, H. E., M. J. Henderson, D. M. Regen, and C. R. Park. 1961.Regulation of glucose uptake in muscle. J. Biol. Chem. 236:253-261.
39. Manchester, J., X. Kong, J. Nerbonne, 0. H. Lowry, and J. C. Lawrence,Jr. 1994. Glucose transport and phosphorylation in single cardiac myocytes: rate-limiting steps in glucose metabolism. Am. J. Physiol. 29:E326-E333.
40. Grover-McKay, M., M. Schwaiger, J. Krivokapich, J. K. Perloff, M. E.Phelps, and H. R. Schelbert. 1989. Regional myocardial blood flow and metabo-lism at rest in mildly symptomatic patients with hypertrophic cardiomyopathy. J.Am. Coll. Cardiol. 13:317-324.
41. Kagaya, Y., Y. Kanno, D. Takeyama, N. Ishide, Y. Maruyama, T. Taka-hashi, T. Ido, and T. Takishima. 1990. Effects of long-term pressure overload onregional myocardial glucose and free fatty acid uptake in rats. A quantitativeautoradiographic study. Circulation. 81:1353-1361.
42. Krivokapich, J., S. C. Huang, C. E. Selin, and M. E. Phelps ME. 1987.Fluorodeoxyglucose rate constants, lumped constant, and glucose metabolic ratein rabbit heart. Amt. J. Physiol. 252:H777-H787.
43. Koivisto, V. A., H. Yki-Jarvinen, and R. A. DeFronzo. 1986. Physicaltraining and insulin sensitivity. Diabetes Metab. Rev. 1:445-481.
44. Andersen, P., and J. Henriksson. 1977. Capillary supply of the quadricepsfemoris muscle of man: adaptive response to exercise. J. Physiol. 270:677-690.
45. Gollnick, P. D., R. B. Armstrong, I. V. C. W. Saubert, K. Piehl, and B.Saltin. 1972. Enzyme activity and fiber composition in skeletal muscle of untrainedand trained men. J. Appl. Physiol. 33:312-319.
46. Lillioja S., A. A. Young, C. L. Cutler, J. L. Ivy, W. G. H. Abbott, J. K.Zawadzki, H. Yki-Jarvinen, L. Christin, T. W. Secomb, and C. Bogardus. 1987.Skeletal muscle capillary density and fiber type are possible determinants of invivo insulin resistance in man. J. Clin. Invest. 80:415-424.
47. Juhlin-Dannfelt, A., M. Frisk-Homberg, J. Karlsson, and P. Tesch. 1979.Central and peripheral circulation in relation to muscle-fbre composition in normo-and hypertensive man. Clin. Sci. 56:335-340.
Heart and Muscle Insulin Sensitivity in Hypertension 1009