Embed Size (px)
Citation preview
INSTRUDIVE: A MUSIC VISUALIZATION SYSTEM BASED ONAUTOMATICALLY RECOGNIZED INSTRUMENTATION
Takumi Takahashi1,2 Satoru Fukayama2 Masataka Goto2
1 University of Tsukuba, Japan2 National Institute of Advanced Industrial Science and Technology (AIST), Japan
[email protected], {s.fukayama, m.goto}@aist.go.jp
ABSTRACT
A music visualization system called Instrudive is presentedthat enables users to interactively browse and listen to mu-sical pieces by focusing on instrumentation. Instrumenta-tion is a key factor in determining musical sound charac-teristics. For example, a musical piece performed with vo-cals, electric guitar, electric bass, and drums can generallybe associated with pop/rock music but not with classical orelectronic. Therefore, visualizing instrumentation can helplisteners browse music more efficiently. Instrudive visu-alizes musical pieces by illustrating instrumentation withmulti-colored pie charts and displays them on a map inaccordance with the similarity in instrumentation. Userscan utilize three functions. First, they can browse musicalpieces on a map by referring to the visualized instrumen-tation. Second, they can interactively edit a playlist thatshowing the items to be played later. Finally, they can dis-cern the temporal changes in instrumentation and skip to apreferable part of a piece with a multi-colored graph. Theinstruments are identified using a deep convolutional neu-ral network that has four convolutional layers with differ-ent filter shapes. Evaluation of the proposed model againstconventional and state-of-the-art methods showed that ithas the best performance.
1 INTRODUCTION
Since multiple musical instruments having different tim-bres are generally used in musical pieces, instrumentation(combination or selection of musical instruments) is a keyfactor in determining musical sound characteristics. Forexample, a song consisting of vocals, electric guitar, elec-tric bass, and drums may sound like pop/rock or metal butnot classical or electronic. Consider, for example, a lis-tener who appreciates gypsy jazz (featuring violin, acousticguitar, clarinet, and double bass). How can he/she discoversimilar-sounding music? Searching by instrumentation canreveal musical pieces played with the same, slightly differ-
c⃝ Takumi Takahashi, Satoru Fukayama, Masataka Goto.Licensed under a Creative Commons Attribution 4.0 International Li-cense (CC BY 4.0). Attribution: Takumi Takahashi, Satoru Fukayama,Masataka Goto. “Instrudive: A Music Visualization System Based onAutomatically Recognized Instrumentation”, 19th International Societyfor Music Information Retrieval Conference, Paris, France, 2018.
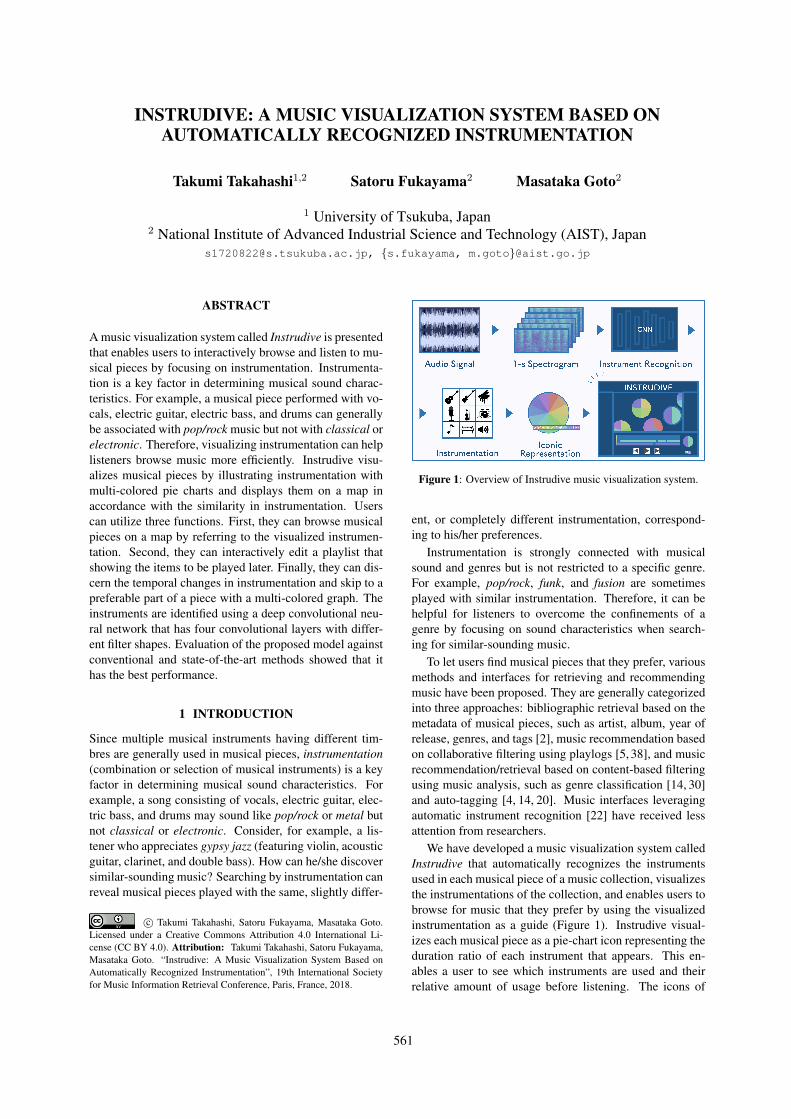
Figure 1: Overview of Instrudive music visualization system.
ent, or completely different instrumentation, correspond-ing to his/her preferences.
Instrumentation is strongly connected with musicalsound and genres but is not restricted to a specific genre.For example, pop/rock, funk, and fusion are sometimesplayed with similar instrumentation. Therefore, it can behelpful for listeners to overcome the confinements of agenre by focusing on sound characteristics when search-ing for similar-sounding music.
To let users find musical pieces that they prefer, variousmethods and interfaces for retrieving and recommendingmusic have been proposed. They are generally categorizedinto three approaches: bibliographic retrieval based on themetadata of musical pieces, such as artist, album, year ofrelease, genres, and tags [2], music recommendation basedon collaborative filtering using playlogs [5, 38], and musicrecommendation/retrieval based on content-based filteringusing music analysis, such as genre classification [14, 30]and auto-tagging [4, 14, 20]. Music interfaces leveragingautomatic instrument recognition [22] have received lessattention from researchers.
We have developed a music visualization system calledInstrudive that automatically recognizes the instrumentsused in each musical piece of a music collection, visualizesthe instrumentations of the collection, and enables users tobrowse for music that they prefer by using the visualizedinstrumentation as a guide (Figure 1). Instrudive visual-izes each musical piece as a pie-chart icon representing theduration ratio of each instrument that appears. This en-ables a user to see which instruments are used and theirrelative amount of usage before listening. The icons of
561
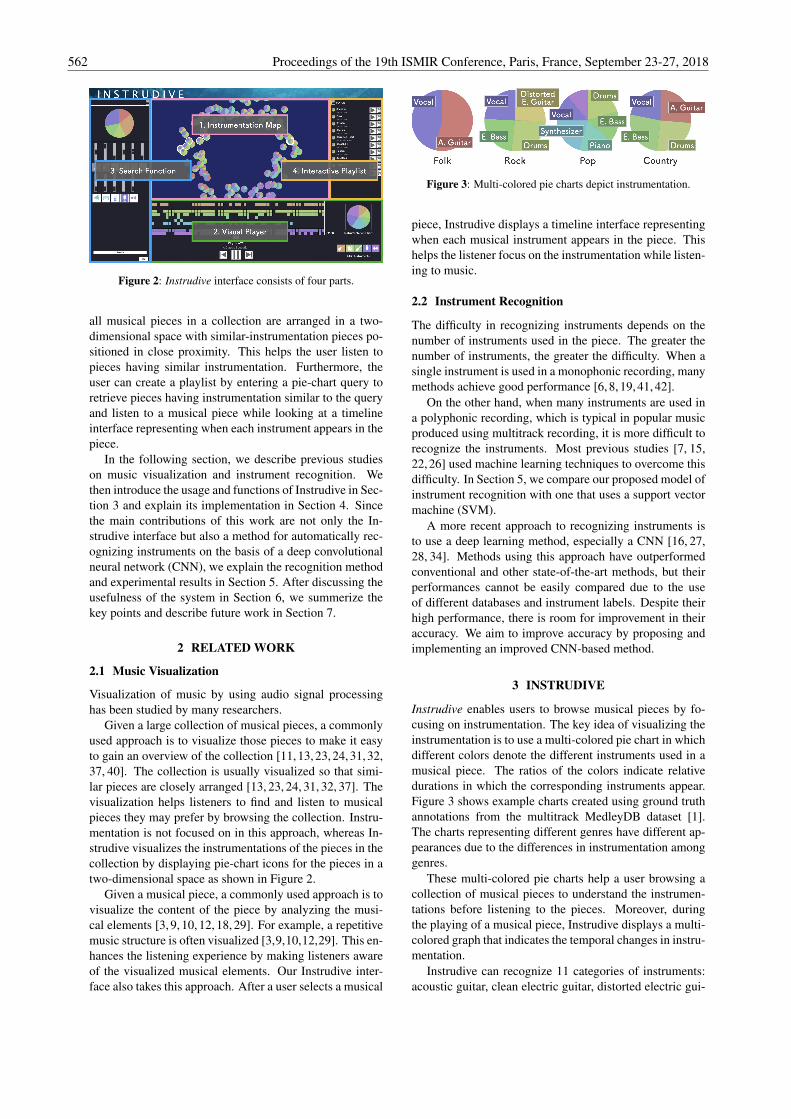
Figure 2: Instrudive interface consists of four parts.
all musical pieces in a collection are arranged in a two-dimensional space with similar-instrumentation pieces po-sitioned in close proximity. This helps the user listen topieces having similar instrumentation. Furthermore, theuser can create a playlist by entering a pie-chart query toretrieve pieces having instrumentation similar to the queryand listen to a musical piece while looking at a timelineinterface representing when each instrument appears in thepiece.
In the following section, we describe previous studieson music visualization and instrument recognition. Wethen introduce the usage and functions of Instrudive in Sec-tion 3 and explain its implementation in Section 4. Sincethe main contributions of this work are not only the In-strudive interface but also a method for automatically rec-ognizing instruments on the basis of a deep convolutionalneural network (CNN), we explain the recognition methodand experimental results in Section 5. After discussing theusefulness of the system in Section 6, we summerize thekey points and describe future work in Section 7.
2 RELATED WORK
2.1 Music Visualization
Visualization of music by using audio signal processinghas been studied by many researchers.
Given a large collection of musical pieces, a commonlyused approach is to visualize those pieces to make it easyto gain an overview of the collection [11, 13, 23, 24, 31, 32,37, 40]. The collection is usually visualized so that simi-lar pieces are closely arranged [13, 23, 24, 31, 32, 37]. Thevisualization helps listeners to find and listen to musicalpieces they may prefer by browsing the collection. Instru-mentation is not focused on in this approach, whereas In-strudive visualizes the instrumentations of the pieces in thecollection by displaying pie-chart icons for the pieces in atwo-dimensional space as shown in Figure 2.
Given a musical piece, a commonly used approach is tovisualize the content of the piece by analyzing the musi-cal elements [3, 9, 10, 12, 18, 29]. For example, a repetitivemusic structure is often visualized [3,9,10,12,29]. This en-hances the listening experience by making listeners awareof the visualized musical elements. Our Instrudive inter-face also takes this approach. After a user selects a musical
Figure 3: Multi-colored pie charts depict instrumentation.
piece, Instrudive displays a timeline interface representingwhen each musical instrument appears in the piece. Thishelps the listener focus on the instrumentation while listen-ing to music.
2.2 Instrument Recognition
The difficulty in recognizing instruments depends on thenumber of instruments used in the piece. The greater thenumber of instruments, the greater the difficulty. When asingle instrument is used in a monophonic recording, manymethods achieve good performance [6, 8, 19, 41, 42].
On the other hand, when many instruments are used ina polyphonic recording, which is typical in popular musicproduced using multitrack recording, it is more difficult torecognize the instruments. Most previous studies [7, 15,22,26] used machine learning techniques to overcome thisdifficulty. In Section 5, we compare our proposed model ofinstrument recognition with one that uses a support vectormachine (SVM).
A more recent approach to recognizing instruments isto use a deep learning method, especially a CNN [16, 27,28, 34]. Methods using this approach have outperformedconventional and other state-of-the-art methods, but theirperformances cannot be easily compared due to the useof different databases and instrument labels. Despite theirhigh performance, there is room for improvement in theiraccuracy. We aim to improve accuracy by proposing andimplementing an improved CNN-based method.
3 INSTRUDIVE
Instrudive enables users to browse musical pieces by fo-cusing on instrumentation. The key idea of visualizing theinstrumentation is to use a multi-colored pie chart in whichdifferent colors denote the different instruments used in amusical piece. The ratios of the colors indicate relativedurations in which the corresponding instruments appear.Figure 3 shows example charts created using ground truthannotations from the multitrack MedleyDB dataset [1].The charts representing different genres have different ap-pearances due to the differences in instrumentation amonggenres.
These multi-colored pie charts help a user browsing acollection of musical pieces to understand the instrumen-tations before listening to the pieces. Moreover, duringthe playing of a musical piece, Instrudive displays a multi-colored graph that indicates the temporal changes in instru-mentation.
Instrudive can recognize 11 categories of instruments:acoustic guitar, clean electric guitar, distorted electric gui-
562 Proceedings of the 19th ISMIR Conference, Paris, France, September 23-27, 2018
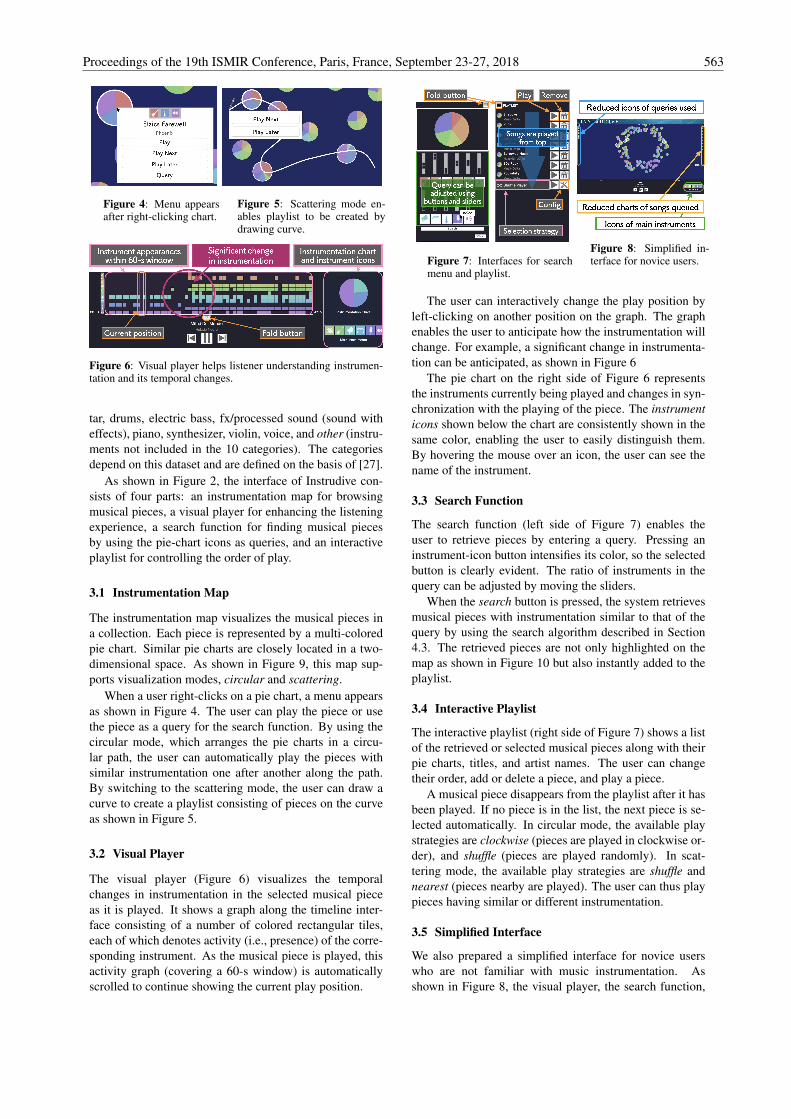
Figure 4: Menu appearsafter right-clicking chart.
Figure 5: Scattering mode en-ables playlist to be created bydrawing curve.
Figure 6: Visual player helps listener understanding instrumen-tation and its temporal changes.
tar, drums, electric bass, fx/processed sound (sound witheffects), piano, synthesizer, violin, voice, and other (instru-ments not included in the 10 categories). The categoriesdepend on this dataset and are defined on the basis of [27].
As shown in Figure 2, the interface of Instrudive con-sists of four parts: an instrumentation map for browsingmusical pieces, a visual player for enhancing the listeningexperience, a search function for finding musical piecesby using the pie-chart icons as queries, and an interactiveplaylist for controlling the order of play.
3.1 Instrumentation Map
The instrumentation map visualizes the musical pieces ina collection. Each piece is represented by a multi-coloredpie chart. Similar pie charts are closely located in a two-dimensional space. As shown in Figure 9, this map sup-ports visualization modes, circular and scattering.
When a user right-clicks on a pie chart, a menu appearsas shown in Figure 4. The user can play the piece or usethe piece as a query for the search function. By using thecircular mode, which arranges the pie charts in a circu-lar path, the user can automatically play the pieces withsimilar instrumentation one after another along the path.By switching to the scattering mode, the user can draw acurve to create a playlist consisting of pieces on the curveas shown in Figure 5.
3.2 Visual Player
The visual player (Figure 6) visualizes the temporalchanges in instrumentation in the selected musical pieceas it is played. It shows a graph along the timeline inter-face consisting of a number of colored rectangular tiles,each of which denotes activity (i.e., presence) of the corre-sponding instrument. As the musical piece is played, thisactivity graph (covering a 60-s window) is automaticallyscrolled to continue showing the current play position.
Figure 7: Interfaces for searchmenu and playlist.
Figure 8: Simplified in-terface for novice users.
The user can interactively change the play position byleft-clicking on another position on the graph. The graphenables the user to anticipate how the instrumentation willchange. For example, a significant change in instrumenta-tion can be anticipated, as shown in Figure 6
The pie chart on the right side of Figure 6 representsthe instruments currently being played and changes in syn-chronization with the playing of the piece. The instrumenticons shown below the chart are consistently shown in thesame color, enabling the user to easily distinguish them.By hovering the mouse over an icon, the user can see thename of the instrument.
3.3 Search Function
The search function (left side of Figure 7) enables theuser to retrieve pieces by entering a query. Pressing aninstrument-icon button intensifies its color, so the selectedbutton is clearly evident. The ratio of instruments in thequery can be adjusted by moving the sliders.
When the search button is pressed, the system retrievesmusical pieces with instrumentation similar to that of thequery by using the search algorithm described in Section4.3. The retrieved pieces are not only highlighted on themap as shown in Figure 10 but also instantly added to theplaylist.
3.4 Interactive Playlist
The interactive playlist (right side of Figure 7) shows a listof the retrieved or selected musical pieces along with theirpie charts, titles, and artist names. The user can changetheir order, add or delete a piece, and play a piece.
A musical piece disappears from the playlist after it hasbeen played. If no piece is in the list, the next piece is se-lected automatically. In circular mode, the available playstrategies are clockwise (pieces are played in clockwise or-der), and shuffle (pieces are played randomly). In scat-tering mode, the available play strategies are shuffle andnearest (pieces nearby are played). The user can thus playpieces having similar or different instrumentation.
3.5 Simplified Interface
We also prepared a simplified interface for novice userswho are not familiar with music instrumentation. Asshown in Figure 8, the visual player, the search function,
Proceedings of the 19th ISMIR Conference, Paris, France, September 23-27, 2018 563
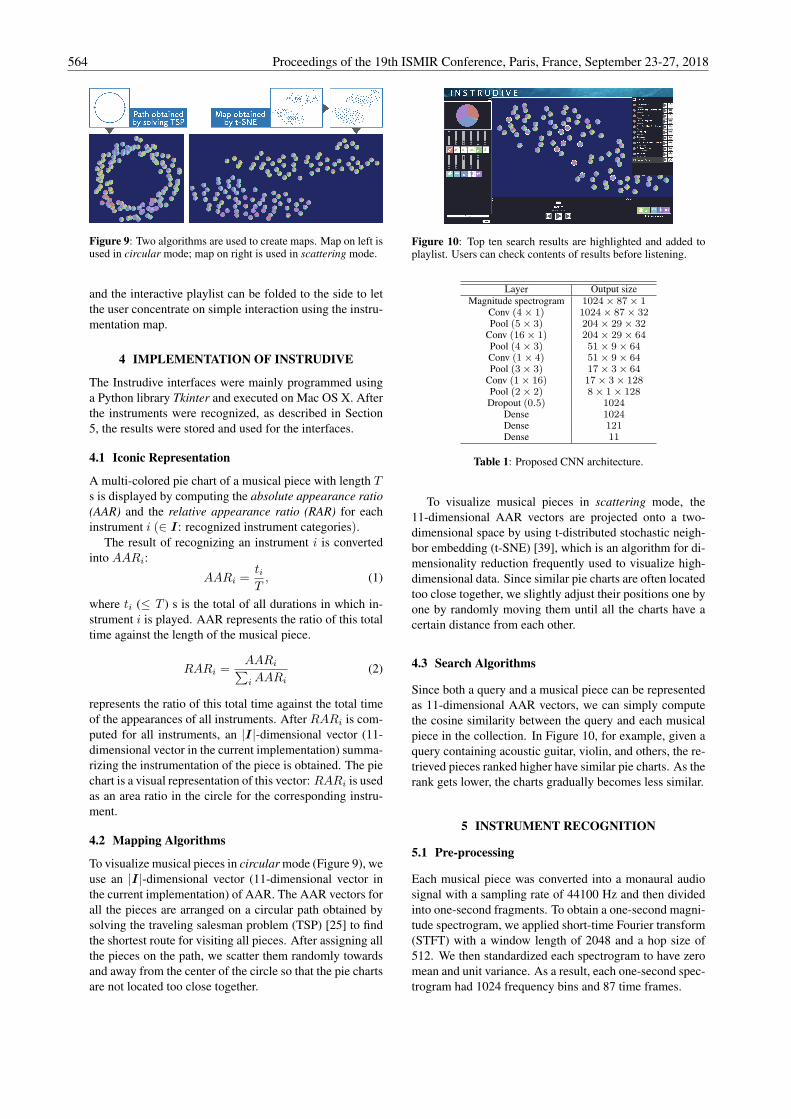
Figure 9: Two algorithms are used to create maps. Map on left isused in circular mode; map on right is used in scattering mode.
and the interactive playlist can be folded to the side to letthe user concentrate on simple interaction using the instru-mentation map.
4 IMPLEMENTATION OF INSTRUDIVE
The Instrudive interfaces were mainly programmed usinga Python library Tkinter and executed on Mac OS X. Afterthe instruments were recognized, as described in Section5, the results were stored and used for the interfaces.
4.1 Iconic Representation
A multi-colored pie chart of a musical piece with length Ts is displayed by computing the absolute appearance ratio(AAR) and the relative appearance ratio (RAR) for eachinstrument i (∈ I: recognized instrument categories).
The result of recognizing an instrument i is convertedinto AARi:
AARi =tiT, (1)
where ti (≤ T ) s is the total of all durations in which in-strument i is played. AAR represents the ratio of this totaltime against the length of the musical piece.
RARi =AARi∑i AARi
(2)
represents the ratio of this total time against the total timeof the appearances of all instruments. After RARi is com-puted for all instruments, an |I|-dimensional vector (11-dimensional vector in the current implementation) summa-rizing the instrumentation of the piece is obtained. The piechart is a visual representation of this vector: RARi is usedas an area ratio in the circle for the corresponding instru-ment.
4.2 Mapping Algorithms
To visualize musical pieces in circular mode (Figure 9), weuse an |I|-dimensional vector (11-dimensional vector inthe current implementation) of AAR. The AAR vectors forall the pieces are arranged on a circular path obtained bysolving the traveling salesman problem (TSP) [25] to findthe shortest route for visiting all pieces. After assigning allthe pieces on the path, we scatter them randomly towardsand away from the center of the circle so that the pie chartsare not located too close together.
Figure 10: Top ten search results are highlighted and added toplaylist. Users can check contents of results before listening.
Layer Output sizeMagnitude spectrogram 1024× 87× 1
Conv (4× 1) 1024× 87× 32Pool (5× 3) 204× 29× 32
Conv (16× 1) 204× 29× 64Pool (4× 3) 51× 9× 64Conv (1× 4) 51× 9× 64Pool (3× 3) 17× 3× 64
Conv (1× 16) 17× 3× 128Pool (2× 2) 8× 1× 128Dropout (0.5) 1024
Dense 1024Dense 121Dense 11
Table 1: Proposed CNN architecture.
To visualize musical pieces in scattering mode, the11-dimensional AAR vectors are projected onto a two-dimensional space by using t-distributed stochastic neigh-bor embedding (t-SNE) [39], which is an algorithm for di-mensionality reduction frequently used to visualize high-dimensional data. Since similar pie charts are often locatedtoo close together, we slightly adjust their positions one byone by randomly moving them until all the charts have acertain distance from each other.
4.3 Search Algorithms
Since both a query and a musical piece can be representedas 11-dimensional AAR vectors, we can simply computethe cosine similarity between the query and each musicalpiece in the collection. In Figure 10, for example, given aquery containing acoustic guitar, violin, and others, the re-trieved pieces ranked higher have similar pie charts. As therank gets lower, the charts gradually becomes less similar.
5 INSTRUMENT RECOGNITION
5.1 Pre-processing
Each musical piece was converted into a monaural audiosignal with a sampling rate of 44100 Hz and then dividedinto one-second fragments. To obtain a one-second magni-tude spectrogram, we applied short-time Fourier transform(STFT) with a window length of 2048 and a hop size of512. We then standardized each spectrogram to have zeromean and unit variance. As a result, each one-second spec-trogram had 1024 frequency bins and 87 time frames.
564 Proceedings of the 19th ISMIR Conference, Paris, France, September 23-27, 2018
5.2 CNN Architecture
We compared several CNN models; the one that showedthe best performance is summerized in Table 1. The modelmainly consists of four convolutional layers with max-pooling and ReLU activation. A spectrogram representsthe structure of frequencies with one axis and its tempo-ral changes against the other axis, which is unlike an im-age that represents spatial information with both axes. Weset the shape of each layer to have length along only oneaxis (frequency or time). For convolutions, feature mapswere padded with zeros so that dimensionality reductionwas done only by using max-pooling layers. By doing this,we could use various shapes of layers and their combina-tions without modifying the shapes of other layers. After a50% dropout was applied to prevent overfitting, two denselayers with ReLU and an output dense layer with a sig-moid function were used to output an 11-dimensional vec-tor. Batch normalization [17] was applied to each of theconvolutional and dense layers. In training, we used theAdam algorithm [21] as the optimizer and binary cross-entropy as the loss function. The mini-batch size was 128,and the number of epochs was 1000.
This proposed CNN model outputs 1-s instrument la-bels as a vector. By gathering the vectors corresponding toeach musical piece, we can represent each musical pieceas a sequence of 11-dimensional vectors (instrument la-bels/activations), which are used to calculate the instru-mentation described in Section 4.
5.3 Dataset
To evaluate the proposed CNN model and apply it to In-strudive, we used the MedleyDB dataset [1]. This datasethas 122 multitrack recordings of various genres and instru-ment activations representing the sound energy for eachstem (a group of audio sources mixed together), individu-ally calculated along with time frames with a hop size of46.4 ms.
We generated instrument labels and split the data onthe basis of the source code published online [27]. Weused the 11 categories listed in Section 3 based on theground truth annotations from the multitrack MedleyDBdataset [1]. Since our system does not depend on thesecategories, it can be generalized to any set of categoriesgiven any dataset.
The 122 musical pieces were divided into five groupsby using the algorithm in [35] so that the instrument labelswere evenly distributed among the five groups. Four of thegroups were used for training, and the fifth was used forevaluation. All the musical pieces that appear in Instrudivewere included in the data used for evaluation, and theirinstrumentations were predicted using cross validation.
5.4 Baseline
For comparison with our model, we used a conventionalbag-of-features method, a state-of-the-art deep learningmethod with mel-spectrogram input, and a state-of-the-artdeep learning method with raw wave input.
Layer Output sizeMel-spectrogram 128× 43× 1
Conv (3× 3) 130× 45× 32Conv (3× 3) 132× 47× 32Pool (2× 2) 44× 15× 32
Dropout (0.25) 44× 15× 32Conv (3× 3) 46× 17× 64Conv (3× 3) 48× 19× 64Pool (2× 2) 16× 6× 64
Dropout (0.25) 16× 6× 64Conv (3× 3) 18× 8× 128Conv (3× 3) 20× 10× 128Pool (2× 2) 6× 3× 128
Dropout (0.25) 6× 3× 128Conv (3× 3) 8× 5× 256Conv (3× 3) 10× 7× 256Global pool 1× 1× 256
Dense 1024Dropout (0.5) 1024
Dense 11
Table 2: Han’s architecture.
Layer Output sizeRaw wave 44100× 1
Conv (3101) 41000× 256Pool (40) 2049× 256
Conv (300) 1750× 384Pool (30) 87× 384Conv (20) 68× 384Pool (8) 16× 384
Dropout (0.5) 16× 384Dense 400Dense 11
Table 3: Li’s architecture.
5.4.1 Bag-of-features
For the bag-of-features method, we used the features de-scribed by [15], consisting of 120 features obtained bycomputing the mel-frequency cepstral coefficients and 16spectral features [33]. We trained an SVM with a radial ba-sis function (RBF) kernel by feeding it these 136 features.
5.4.2 Mel-spectrogram (Han’s CNN model)
For the deep learning method with mel-spectrogram input,we used Han’s CNN architecture [16] (Table 2). This ar-chitecture is based on VGGNet [36], a commonly usedmodel in the image processing field. Each one-secondfragment of the audio signal was resampled into 22050 Hz,converted into a mel-spectrogram, and standardized. Everyactivation function was LReLU (α = 0.33) except the out-put sigmoid.
In preliminary experiments, training this model failedin almost 700 epochs due to a gradient loss. Therefore,we applied batch normalization to each of the convolu-tional and dense layers, enabling us to successfully com-plete 1000 epochs of training. We also used 500 epochs,but the performance was worse than for 1000.
5.4.3 Raw Waveform (Li’s CNN model)
For the deep learning method with raw wave input, we usedLi’s CNN model in [27] (Table 3). This model performsend-to-end learning using a raw waveform. We standard-ized each one-second fragment of the monaural audio sig-nal obtained in pre-processing. Every activation functionwas ReLU except the output sigmoid. Batch normalizationwas again applied to each layer. We trained the model with1000 epochs.
5.5 Metrics
We evaluated each model using four metrics: accuracy, F-micro, F-macro, and AUC.
Accuracy was defined as the ratio of predicted labelsthat exactly matched the ground truth. Each label predictedby the CNN at every one-second fragment in all pieces was
Proceedings of the 19th ISMIR Conference, Paris, France, September 23-27, 2018 565
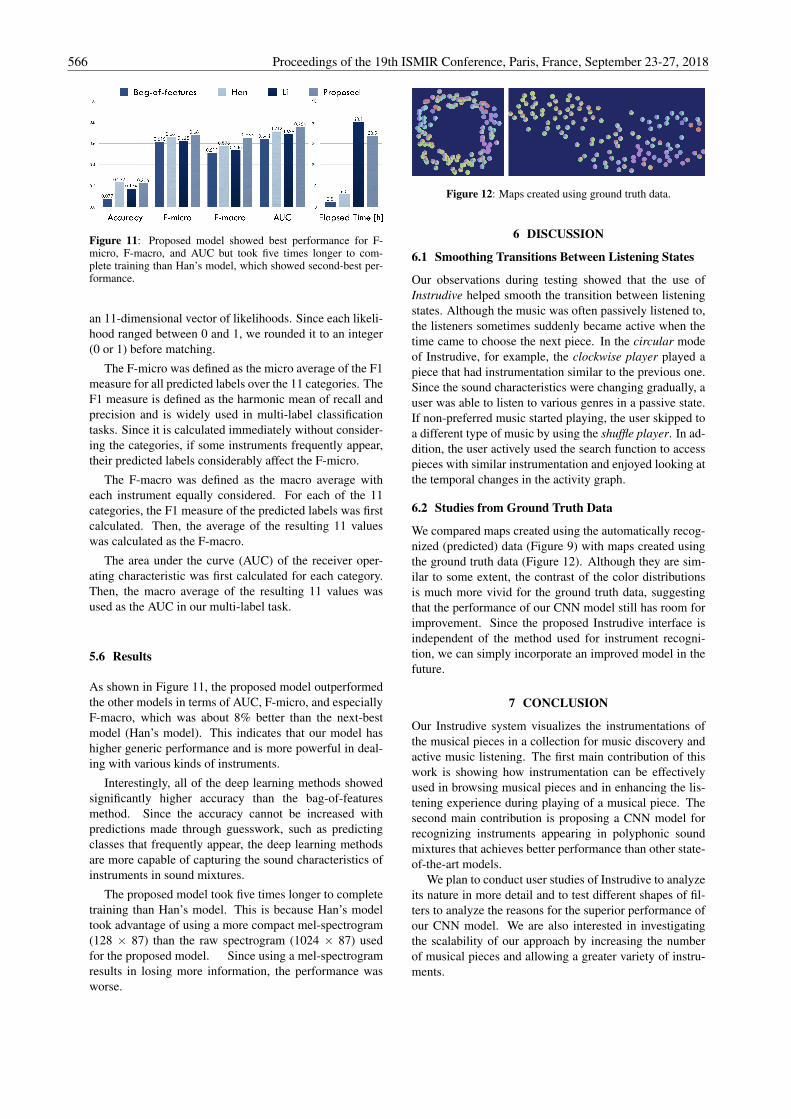
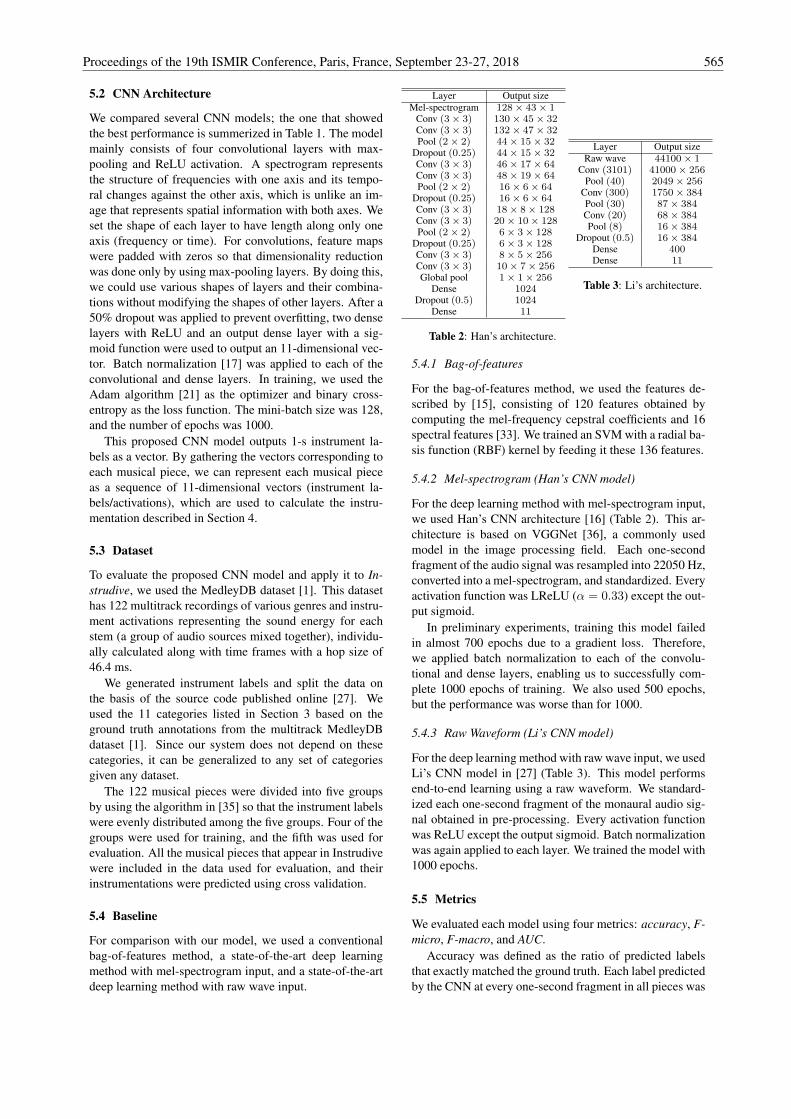
Figure 11: Proposed model showed best performance for F-micro, F-macro, and AUC but took five times longer to com-plete training than Han’s model, which showed second-best per-formance.
an 11-dimensional vector of likelihoods. Since each likeli-hood ranged between 0 and 1, we rounded it to an integer(0 or 1) before matching.
The F-micro was defined as the micro average of the F1measure for all predicted labels over the 11 categories. TheF1 measure is defined as the harmonic mean of recall andprecision and is widely used in multi-label classificationtasks. Since it is calculated immediately without consider-ing the categories, if some instruments frequently appear,their predicted labels considerably affect the F-micro.
The F-macro was defined as the macro average witheach instrument equally considered. For each of the 11categories, the F1 measure of the predicted labels was firstcalculated. Then, the average of the resulting 11 valueswas calculated as the F-macro.
The area under the curve (AUC) of the receiver oper-ating characteristic was first calculated for each category.Then, the macro average of the resulting 11 values wasused as the AUC in our multi-label task.
5.6 Results
As shown in Figure 11, the proposed model outperformedthe other models in terms of AUC, F-micro, and especiallyF-macro, which was about 8% better than the next-bestmodel (Han’s model). This indicates that our model hashigher generic performance and is more powerful in deal-ing with various kinds of instruments.
Interestingly, all of the deep learning methods showedsignificantly higher accuracy than the bag-of-featuresmethod. Since the accuracy cannot be increased withpredictions made through guesswork, such as predictingclasses that frequently appear, the deep learning methodsare more capable of capturing the sound characteristics ofinstruments in sound mixtures.
The proposed model took five times longer to completetraining than Han’s model. This is because Han’s modeltook advantage of using a more compact mel-spectrogram(128 × 87) than the raw spectrogram (1024 × 87) usedfor the proposed model. Since using a mel-spectrogramresults in losing more information, the performance wasworse.
Figure 12: Maps created using ground truth data.
6 DISCUSSION
6.1 Smoothing Transitions Between Listening States
Our observations during testing showed that the use ofInstrudive helped smooth the transition between listeningstates. Although the music was often passively listened to,the listeners sometimes suddenly became active when thetime came to choose the next piece. In the circular modeof Instrudive, for example, the clockwise player played apiece that had instrumentation similar to the previous one.Since the sound characteristics were changing gradually, auser was able to listen to various genres in a passive state.If non-preferred music started playing, the user skipped toa different type of music by using the shuffle player. In ad-dition, the user actively used the search function to accesspieces with similar instrumentation and enjoyed looking atthe temporal changes in the activity graph.
6.2 Studies from Ground Truth Data
We compared maps created using the automatically recog-nized (predicted) data (Figure 9) with maps created usingthe ground truth data (Figure 12). Although they are sim-ilar to some extent, the contrast of the color distributionsis much more vivid for the ground truth data, suggestingthat the performance of our CNN model still has room forimprovement. Since the proposed Instrudive interface isindependent of the method used for instrument recogni-tion, we can simply incorporate an improved model in thefuture.
7 CONCLUSION
Our Instrudive system visualizes the instrumentations ofthe musical pieces in a collection for music discovery andactive music listening. The first main contribution of thiswork is showing how instrumentation can be effectivelyused in browsing musical pieces and in enhancing the lis-tening experience during playing of a musical piece. Thesecond main contribution is proposing a CNN model forrecognizing instruments appearing in polyphonic soundmixtures that achieves better performance than other state-of-the-art models.
We plan to conduct user studies of Instrudive to analyzeits nature in more detail and to test different shapes of fil-ters to analyze the reasons for the superior performance ofour CNN model. We are also interested in investigatingthe scalability of our approach by increasing the numberof musical pieces and allowing a greater variety of instru-ments.
566 Proceedings of the 19th ISMIR Conference, Paris, France, September 23-27, 2018
8 ACKNOWLEDGMENTS
This work was supported in part by JST ACCEL GrantNumber JPMJAC1602, Japan.
9 REFERENCES
[1] Rachel M. Bittner, Justin Salamon, Mike Tierney,Matthias Mauch, Chris Cannam, and Juan PabloBello. MedleyDB: A multitrack dataset for annotation-intensive MIR research. In Proceedings of the 15thInternational Society for Music Information RetrievalConference (ISMIR 2014), pages 155–160, 2014.
[2] Dmitry Bogdanov and Perfecto Herrera. How muchmetadata do we need in music recommendation? Asubjective evaluation using preference sets. In Pro-ceedings of the 12th International Society for MusicInformation Retrieval Conference (ISMIR 2011), pages97–102, 2011.
[3] Mattew Cooper and Jonathan Foote. Automatic musicsummarization via similarity analysis. In Proceedingsof the 3rd International Conference on Music Informa-tion Retrieval (ISMIR 2002), 2002.
[4] Sander Dieleman and Benjamin Schrauwen. End-to-end learning for music audio. In Proceedings of theIEEE International Conference on Acoustics, Speech,and Signal Processing (IEEE ICASSP 2014), pages6964–6968, 2014.
[5] Michael D. Ekstrand, John T. Riedl, and Joseph A.Konstan. Collaborative filtering recommender systems.Foundations and Trends in Human-Computer Interac-tion, 4(2):81–173, 2010.
[6] Antti Eronen and Aussi Klapuri. Musical instrumentrecognition using cepstral coefficients and temporalfeatures. In Proceedings of the IEEE InternationalConference on Acoustics, Speech, and Signal Process-ing (IEEE ICASSP 2000), volume 2, pages 753–756,2000.
[7] Slim Essid, Gael Richard, and Bertrand David. In-strument recognition in polyphonic music based onautomatic taxonomies. IEEE Transactions on Audio,Speech, and Language Processing, 14(1):68–80, 2006.
[8] Slim Essid, Gael Richard, and Bertrand David. Mu-sical instrument recognition by pairwise classificationstrategies. IEEE Transactions on Audio, Speech, andLanguage Processing, 14(4):1401–1412, 2006.
[9] Jonathan Foote. Visualizing music and audio usingself-similarity. In Proceedings of the Seventh ACM In-ternational Conference on Multimedia (ACM Multime-dia 1999), pages 77–80, 1999.
[10] Masataka Goto. A chorus section detection method formusical audio signals and its application to a music lis-tening station. IEEE Transactions on Audio, Speech,and Language Processing, 14(5):1783–1794, 2006.
[11] Masataka Goto and Takayuki Goto. Musicream: Inte-grated music-listening interface for active, flexible, andunexpected encounters with musical pieces. IPSJ Jour-nal, 50(12):2923–2936, 2009.
[12] Masataka Goto, Kazuyoshi Yoshii, Hiromasa Fujihara,Matthias Mauch, and Tomoyasu Nakano. Songle: Aweb service for active music listening improved byuser contributions. In Proceedings of the 12th Interna-tional Society for Music Information Retrieval Confer-ence (ISMIR 2011), pages 311–316, 2011.
[13] Masahiro Hamasaki and Masataka Goto. Songrium: Amusic browsing assistance service based on visualiza-tion of massive open collaboration within music con-tent creation community. In Proceedings of the 9th In-ternational Symposium on Open Collaboration (ACMWikiSym + OpenSym 2013), pages 1–10, 2013.
[14] Philippe Hamel and Douglas Eck. Learning featuresfrom music audio with deep belief networks. In Pro-ceedings of the 11th International Society for MusicInformation Retrieval Conference (ISMIR 2010), pages339–344, 2010.
[15] Philippe Hamel, Sean Wood, and Douglas Eck. Auto-matic identification of instrument classes in polyphonicand poly-instrument audio. In Proceedings of the 10thInternational Society for Music Information RetrievalConference (ISMIR 2009), pages 399–404, 2009.
[16] Yoonchang Han, Jaehun Kim, and Kyogu Lee. Deepconvolutional neural networks for predominant instru-ment recognition in polyphonic music. IEEE/ACMTransactions on Audio, Speech, and Language Pro-cessing, 25(1):208–221, 2017.
[17] Sergey Ioffe and Christian Szegedy. Batch nor-malization: Accelerating deep network training byreducing internal covariate shift. arXiv preprintarXiv:1502.03167, 2015.
[18] Dasaem Jeong and Juhan Nam. Visualizing music inits entirety using acoustic features: Music flowgram. InProceedings of the International Conference on Tech-nologies for Music Notation and Representation, pages25–32, 2016.
[19] Ian Kaminskyj and Tadeusz Czaszejko. Automaticrecognition of isolated monophonic musical instru-ment sounds using kNNC. Journal of Intelligent Infor-mation Systems, 24(2):199–221, 2005.
[20] Taejun Kim, Jongpil Lee, and Juhan Nam. Sample-level cnn architectures for music auto-tagging usingraw waveforms. In Processings of the 14th Sound andMusic Computing Conference (SMC 2017), 2017.
[21] Diederik P. Kingma and Jimmy Ba. Adam: Amethod for stochastic optimization. arXiv preprintarXiv:1412.6980, 2014.
Proceedings of the 19th ISMIR Conference, Paris, France, September 23-27, 2018 567
[22] Tetsuro Kitahara, Masataka Goto, Kazunori Komatani,Tetsuya Ogata, and Hiroshi G. Okuno. Instrogram:Probabilistic representation of instrument existence forpolyphonic music. IPSJ Journal, 2(1):279–291, 2007.
[23] Peter Knees, Markus Schedl, Tim Pohle, and Ger-hard Widmer. An innovative three-dimensional user in-terface for exploring music collections enriched withmeta-information from the web. In Proceedings of the14th ACM International Conference on Multimedia(ACM Multimedia 2006), pages 17–24, 2006.
[24] Paul Lamere and Douglas Eck. Using 3D visualiza-tions to explore and discover music. In Proceedings ofthe 8th International Conference on Music InformationRetrieval (ISMIR 2007), pages 173–174, 2007.
[25] Gilbert Laporte. The traveling salesman problem: Anoverview of exact and approximate algorithms. Euro-pean Journal of Operational Research, 59(2):231–247,1992.
[26] Pierre Leveau, David Sodoyer, and Laurent Daudet.Automatic instrument recognition in a polyphonic mix-ture using sparse representations. In Proceedings ofthe 8th International Conference on Music InformationRetrieval (ISMIR 2007), pages 233–236, 2007.
[27] Peter Li, Jiyuan Qian, and Tian Wang. Auto-matic instrument recognition in polyphonic musicusing convolutional neural networks. arXiv preprintarXiv:1511.05520, 2015.
[28] Vincent Lostanlen and Carmine-Emanuele Cella. Deepconvolutional networks on the pitch spiral for music in-strument recognition. In Proceedings of the 17th Inter-national Society for Music Information Retrieval Con-ference (ISMIR 2016), pages 612–618, 2016.
[29] Meinard Muller and Nanzhu Jiang. A scape plot rep-resentation for visualizing repetitive structures of mu-sic recordings. In Proceedings of the 13th InternationalSociety for Music Information Retrieval Conference(ISMIR 2012), pages 97–102, 2012.
[30] Sergio Oramas, Oriol Nieto, Francesco Barbieri, andXavier Serra. Multi-label music genre classificationfrom audio, text and images using deep features. InProceedings of the 18th International Society for Mu-sic Information Retrieval Conference (ISMIR 2017),pages 23–30, 2017.
[31] Elias Pampalk, Simon Dixon, and Gerhard Widmer.Exploring music collections by browsing differentviews. In Proceedings of the 4th International Con-ference on Music Information Retrieval (ISMIR 2003),2003.
[32] Elias Pampalk and Masataka Goto. MusicRainbow: Anew user interface to discover artists using audio-basedsimilarity and web-based labeling. In Proceedings ofthe 7th International Conference on Music InformationRetrieval (ISMIR 2006), pages 367–370, 2006.
[33] Geoffroy Peeters. A large set of audio features forsound description (similarity and classification) in theCUIDADO project. Technical report, IRCAM, 2004.
[34] Jordi Pons, Olga Slizovskaia, Rong Gong, EmiliaGomez, and Xavier Serra. Timbre analysis of music au-dio signals with convolutional neural networks. In Pro-ceedings of the 25th European Signal Processing Con-ference (EUSIPCO 2017), pages 2744–2748, 2017.
[35] Konstantinos Sechidis, Grigorios Tsoumakas, andIoannis Vlahava. On the stratification of multi-labeldata. In Machine Learning and Knowledge Discoveryin Databases, pages 145–158, 2011.
[36] Karen Simonyan and Andrew Zisserman. Very deepconvolutional networks for large-scale image recogni-tion. arXiv preprint arXiv:1409.1556, 2014.
[37] Marc Torrens, Patrick Hertzog, and Josep-Lluis Arcos.Visualizing and exploring personal music libraries. InProceedings of the 5th International Conference onMusic Information Retrieval (ISMIR 2004), 2004.
[38] Aaron van den Oord, Sander Dieleman, and BenjaminSchrauwen. Deep content-based music recommenda-tion. In Proceedings of the 26th International Confer-ence on Neural Information Processing Systems (NIPS2013), pages 2643–2651, 2013.
[39] Laurens van der Maaten and Geoffrey Hinton. Visual-izing data using t-SNE. Journal of Machine LearningResearch, 9:2579–2605, 2008.
[40] Kazuyoshi Yoshii and Masataka Goto. Music Thumb-nailer: Visualizing musical pieces in thumbnail imagesbased on acoustic features. In Proceedings of the 9thInternational Conference on Music Information Re-trieval (ISMIR 2008), pages 211–216, 2008.
[41] Guoshen Yu and Jean-Jacques Slotine. Audio classi-fication from time-frequency texture. In Proceedingsof the IEEE International Conference on Acoustics,Speech, and Signal Processing (IEEE ICASSP 2014),pages 1677–1680, 2009.
[42] Xin Zhang and Zbigniew W. Ras. Differentiated har-monic feature analysis on music information retrievalfor instrument recognition. In Proceedings of theIEEE International Conference on Granular Comput-ing, pages 578–581, 2006.
568 Proceedings of the 19th ISMIR Conference, Paris, France, September 23-27, 2018


![GPU-Based 3D Texture Advection for the Visualization of ...weiskopf... · visualization, and even simulation. So far, however, 3D Image-Based Flow Visualization (IBVF) [Tel03] is](https://img.pdfslide.us/doc/110x75/5ebffe049d34820f11258804/gpu-based-3d-texture-advection-for-the-visualization-of-weiskopf-visualization.jpg)