Embed Size (px)
Citation preview
ACCESSIBILITY
Confidential
Continental Shelf Institute
Institutt forkontinentaisokkeiundersøkelse r
REPORT TITLE
BIOSJRATIGRAPHY
NORWEGIAN NORTH
AND.17 /12-2 .
CONTRACTOR
I KU
CONTRACTORS REF
AND
SEAORGANIC GEOCHEMISTRY OF
WELLS 1 8 / 1 1 - 1 , 17 /12-1
CTATEUS
JOB. NO.
P-249/1
SCIENTIST
Be l l , Bjærke, Bjorøy, Rønningsland, VigranDEPARTMENT
Geology and Environment
DATE
December 1979NO OF PAGES
PROJECT NO
P-249NO OF ENCLOSURE
RESPONSIBLE SCIENTIST
M. Bjorøy and D.G. Bell
SUMMARY
Fairly uniform claystone sequences in Norwegian North Sea Wells18/11-1, 17/12-1 and 17/12-2 are mostly of earliest Cretaceous toLate/Middle Jurassic age though some older sediments may be present.A complete organic geochemical including oil source rock correlationwas carried out and showed only poor correlation between potential sourcerocks and the oils recovered.
KEY WORDS'
Norw. blocks 17 & 18
Biostrat./Source rock
1 Jurassic
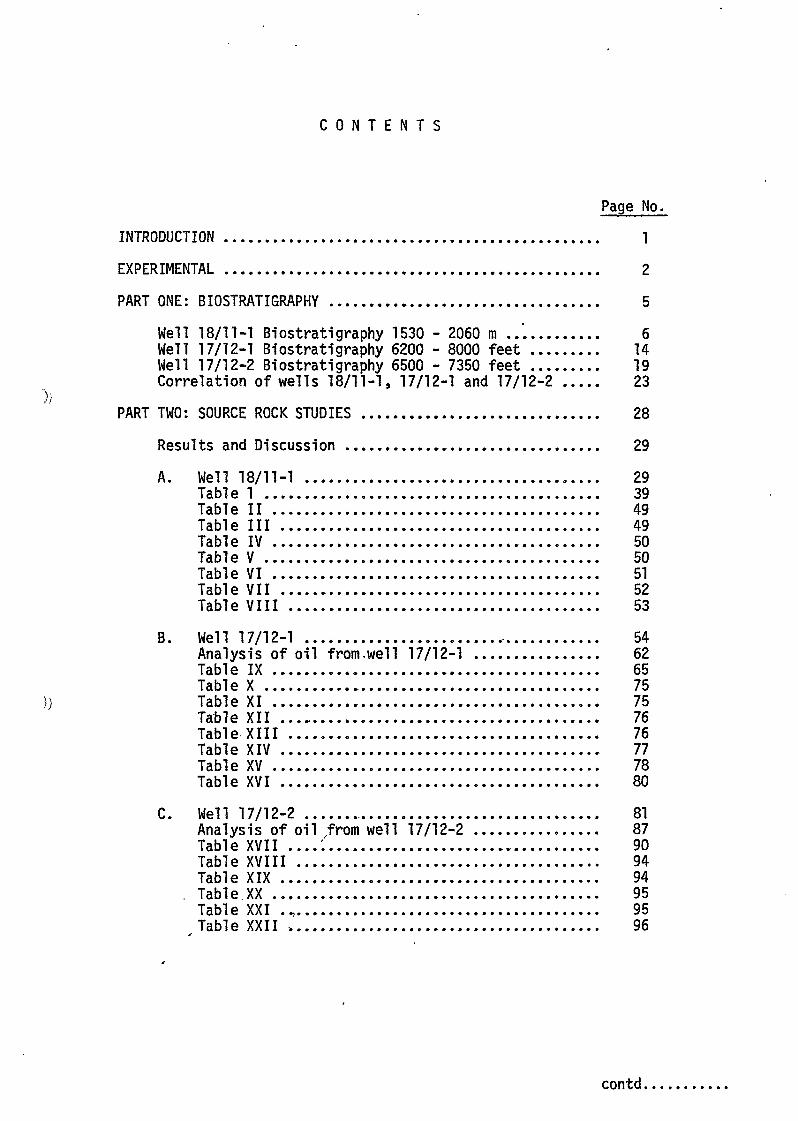
C O N T E N T S
Page No.
INTRODUCTION 1
EXPERIMENTAL 2
PART ONE: BIOSTRATIGRAPHY 5
Well 18/11-1 Biostratigraphy 1530 - 2060 m ..". 6Well 17/12-1 Biostratigraphy 6200 - 8000 feet 14Well 17/12-2 Biostratigraphy 6500 - 7350 feet 19Correlation of wells 18/11-1, 17/12-1 and 17/12-2 23
PART TWO: SOURCE ROCK STUDIES 28
Results and Discussion 29
A. Wel l 18 /11-1 29Table 1 39Table II 49Table III 49Table IV 50Table V 50Table VI 51Table VII 52Table VIII 53
B. Well 17/12-1 54Analysis of o i l from.well 17/12-1 62Table IX 65Table X 75
I) Table XI 75Table XII 76Table XIII 76Table XIV 77Table XV 78Table XVI 80
C. Well 17/12-2 81Analysis of oil /from well 17/12-2 87Table XVII ..... 90Table XVIII 94Table XIX 94
. Table XX 95Table XXI 95Table XXII 96
contd.
- 2 -
EXPERIMENTAL
Total Organic Carbon (TOC)
The various selected samples were crushed on a centrifugal mill and sieved.The portions with a particle size between 0.125 mm and 0.063 mm were usedin the further work. Aliquotes of the samples were treated with hot 6N HC1to remove carbonate and washed twice with distilled water to remove tracesof HC1, then placed in a vacuum oven at 50°C, evacuated to 20 mm Hg for12 hrs. The samples were then analysed on a Leco E C 12 carbon determinator,to determine the total organic carbon (TOC).
) )Extractable Organic Matter (EOM)
From the TOC results samples were selected for extraction. Of the selectedsamples, approximately 100 gm of each was extracted on soxhlet apparatusfor 48 hrs using dichloromethane (DCM) as solvent. The DCM used as solventwas distilled in an all glass apparatus to remove contaminants. The paperthimbles used in the soxhlet apparatus were previously washed with DCM on alarge soxhlet apparatus for 48 hrs. to remove any soluble components.
Activated copper foil was used in the flasks to remove any free sulphurfrom the samples.
After extraction, the solvent was removed on a Buchi Rotavapor and ) )transferred to a 50 ml flask. The rest of the solvent was then removed andthe amount of extractable organic matter (EOM) determined.
Chromatographic Separation
The extractable organic master (EOM) was separated on chranatographiccolumns, packed with silica, Riedel & HShn, 0.063 mm, using the slurrymethod with hexane as solvent. On top of the silica, small amounts ofalumina,' approximately 2 cm, was added. The EOM, after it was "taken up" onalumina, «as transferred to the top of the columns, which were then elutedwith predistilled hexane, benzene and methanol using a ratio of 200 ml ofeach solvent pr. gm of EOM.
32/A/1
- 3 -
The various eluants were removed on a Buchi Rotavapor and the samples
transferred to vials and dried at 40°C in a stream of dry nitrogen, and the
amount of the various fract ions, saturated, aromatic and NSO fract ion
(Nitrogen, Sulphur, Oxygen), determined. The saturated fractions were
analysed gas chromatographically on a 25 m OV 101 glass capil lary column
with He as carrier gas (0.7 ml/min.) using the spl i t less injection tech-
nique. The glass capil lary column was mounted in a Carlo Erba F V 2150 gas
chromatograph.
V i t r i n i t e Reflectance
Samples, taken at various intervals, were sent for v i t r i n i t e reflectance
measurements at Geoconsultants, Newcastle-upon-Tyne. The samples were
mounted in Bakelite resin blocks; care being taken during the setting of
the plastic to avoid temperatures in excess of 100°C.Jhe samples where
then ground, i n i t i a l l y on a diamond Jap followed by two grades of corundum
paper. All grinding and subsequent polishing stages in the preparation were
carried out using isopropyl alcohol as lubricant, since water leads to the
swelling and disintegration of the clay fraction of the samples.
Polishing of the samples was performed on Selvyt cloths using three grades
of alumina, 5/20, 3/50 and Gamma, followed by careful cleaning of the
surface.
Reflectance determinations were carried out on a Leitz M.P.V. microphoto-
meter under o i l immersion, R.I. 1.516 at a wavelength of 546 nm. The f i e l d
measured was varied to sui t the size of the organic par t ic le , but was
usually of the order of 2 micron diameter.
The surface of the polished block was searched by the operator for suitable
areas of v i t r i n i t i c material in the sediment. The reflectance of the organic
part icle was determined relat ive to optical glass standards of known,
reflectance. Where possible, a minimum of twenty individual particles of
v i t r i n i t e was measured, although in many cases this number could not be
achieved.,
32/A/2
- 4 -
Processing of Samples for Evaluation of Visual Kerogen
The rock samples were crushed and afterwards treated with hydrochloric andhydrofluoric acids to remove the minerals. A series of microscopic slideswas mounted in glycerine jelly:
T-slide represents the total acid insoluble residue.0-slide represents the residue screened through 15 sieves.N-1,2,3 slides contain palynodebris remaining after flotation (Zn Br2) toremove disturbing heavy minerals.X-1,2,3 slides contain oxidized residues, when oxidizing is required due tohigh coalification or much sapropel.
T & 0 slides are necessary to evaluate kerogen composition/palynofacieswhich is closely related to sample lithology.
Screened slides are normally required to consentrate the larger fragments,and to study palynomorphs (pollen, spores and dinoflagellates) for paleo-dating and colour evaluation.
So far visual evaluations of kerogen have been undertaken from residuesmounted in glycerine jelly, and studied by Leitz Dialux in normal light(halogene) using xlO and x40 objectives.
Rock-Eva! Pyrolyses
100 mg crushed sample was put into a boat whose bottom and cover are madeof sintered steal and analysed on a Rock-Eva! pyrolyser.
Palynology
Standard techniques were employed using HC1, HF, flotation in zinc bromidewhere necessary, and screening through 15 u nylon nets. Minimal oxidationwith HN03 was carried out on some samples to provide cleaner residues.
32/A/3
•" D "™
PART ONE: BIOSTRATIGRAPHY
- 6 -
PART ONE: BIOSTRATIGRAPHY
As the available material was in some cases limited it was decided palynologywould provide the most effective means of dating the intervals. The followingaccount is based largely on the occurrence of dinoflagellate cysts. Definitivedating of the sequences (i.e. assigning an unqualified age) is not alwayspossible due to the restrictions which the material imposes.
Caved contamination was a problem encountered in all of the wells underconsideration, particularly in the uppermost part as there is no control onthe sections above the intervals described below. The most serious problemswere met in well 17/12-2, and the proposed biostratigraphy of this well israther uncertain. Detailed descriptions of the lithology of individualcuttings samples can be found in the geochemical part of this study underthe total organic carbon (TOC) results for each well.
Well 18/11-1 Biostratigraphy 1530 - 2060 m
This well provided the best overall stratigraphic control. Biostratigraphyis based on stratigraphically significant dinocysts assemblages and isrefined by distintive changes in kerogen composition and lithology.
1530 - 1635 ro. Ryazanian to ?Hauterivian
Lithology
The lithology of this interval consists largely of grey claystones withvarying amounts of sandstone. At the top of the interval up to about 30 %of the cuttings fraction Consists of medium to coarse sands in which glauco-nite was observed. Sand decreases rapidly downwards though there are sporadicand significant influxes at 1550 m (15 %)t 1565 (20 % fine to medium) 1610(15 % medium to coarse) 1635 (25 % fine to medium) and 1645 m (10 55). Smallamounts of limestone occur throughout most of the interval. Glauconite isfrequent towards the lower part of the interval around 1565 - 1575 m and1595 - 1610 m. Also of note are shell fragments recovered from the 1575 and1585 m samples.
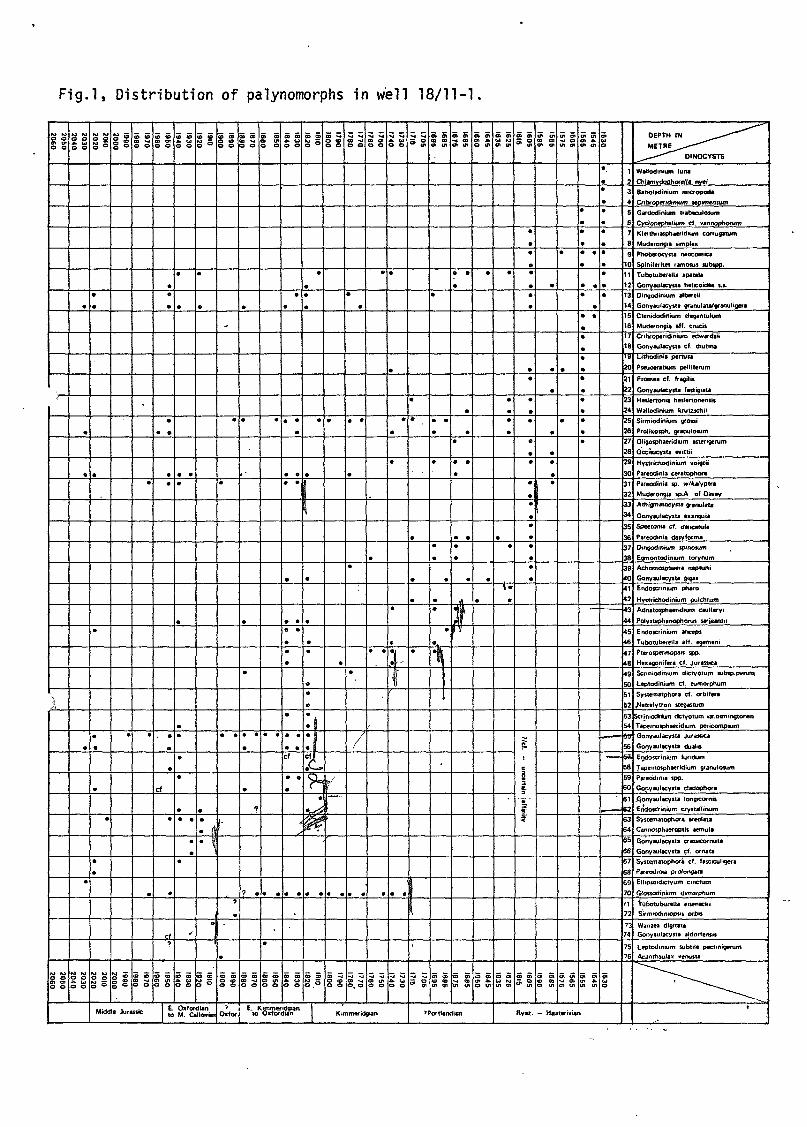
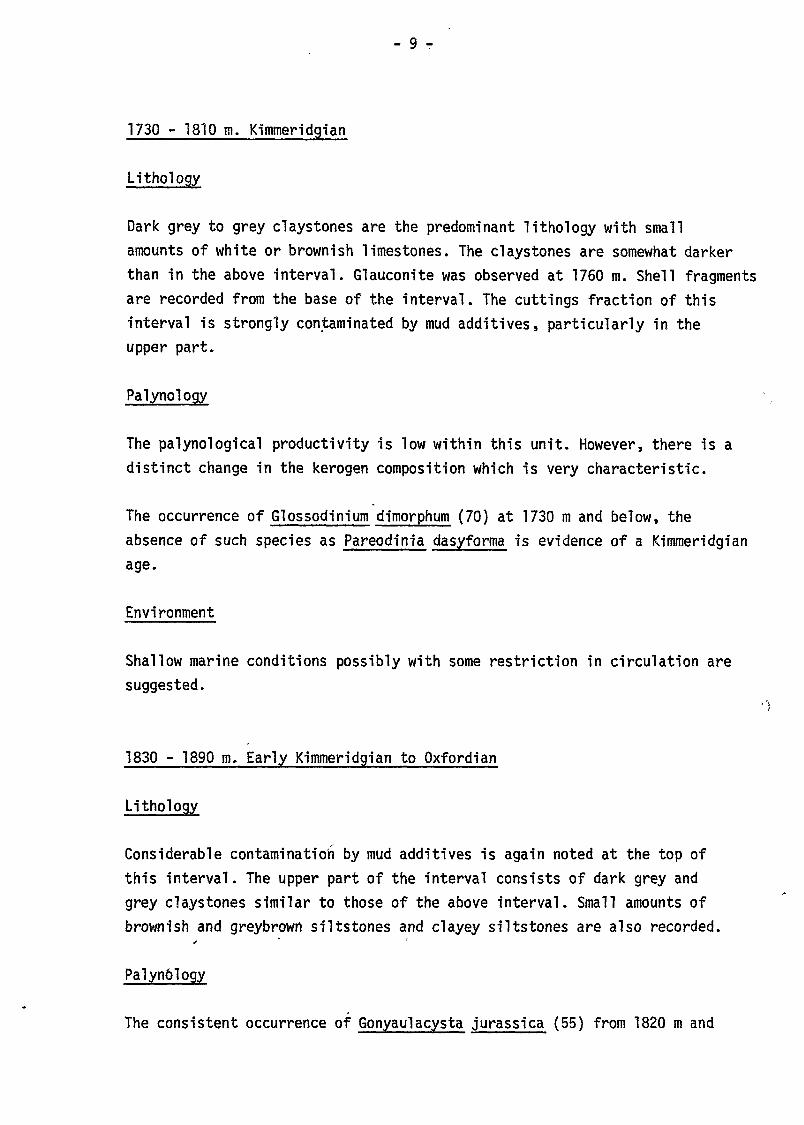
Fig.l, Distribution of palynomorphs in well 18/11-1.
ggo o
},
20502060
1 2030
1 2040
#
«
*
20302040
1 2010
1 2020
• •
*
*
*
#
20102020
1 1990
| 2000
•
. OO
OZ06
81
1 1970
1 1980
•
ft
ft
ft
0861
0161
0961
I
#
V
• *
•
a
cf
*
•
cf
0961
0961
1 1930
1 1940
*
m
• ft
*
m
*
*
m
* *
*
•
19301940
1 1910
I 1920
*
0061
0681
*#
1
•
1910
Middl. Jura»* 1 jj; JfgJEjfc,
s
0061
0681
Oxfo.
0181
*
?
0881
0181
1 1850
1 1660
*
*
0981
0981
1 1830
| 1840
#
* *
• •
* *
• •
*
• ftcf
• ••
18301840
18101820
*
• •
*
#
• •
4-tt
a ago
E. Ktmmeridgianlo Oxfordian
ooet
08Z
I
f
0091
06 a
08
ilOi
l) 1
ft
ft
ft
ft
ft
/
,091
101
11
| 17501760
*
#
• •
0911
0911
17301740
*
*
•
«
i
17301740
Kimmeridgian
1705
•
17051715
9691
9891
1
*
* *
*
*
\
s
9691
9891
919!
999.
]
ft ft
ft
ft
ft ft
• ft
ft ft
ft
A1V
16651675
1 16451650
*
3 5O VI
'Portiandicn
16251635
*
• •
*
•
1»
16251636
9191
9091
#
*
• •
*
*
*
• •
• •
• •
7/cf. -
uncurtain [affinity
9191
9091
9691
9B9I
#
*
*
15851596
1 15651575
*
9191
9991
1545i
1555
• •
• •
#
*
•ft
ft
• •
• ft
• •
*
*
15451555
j i
* •
*
..
• ft
ft •
.
1530
Ryu. - Hauttrivitn
1
3
4
5
6
7
8
9
10
11
12
13
14
15
16
17
18
19
20
21
22
23
24
25
26
27
28
29
30
31
32
3334
35
36
37
38
39
<0
11
42
*3
44
45
46
17
48
49
50
51
52
5354
56
»
58
59
SO
SI
63
64
65
66
67
68
£9
70
n72
74
7576
DEPTH IN ^
^øø~~*-'^~*'^ D1NOCYSTS
Wattodinnun lura
Chlamvdophorelia nvei
BaHotadinium mtcropods
Crtbroperidinium lepwnentum
Gardodinium trabtculosum
Cyclonephelium cf. vannophorum
Kleithnajphaeridiufn corrugatum
Muderongia simplex
Phoberocysu neocomica
Spiniferites ramosus tubtpp.
Tubotubereila apatela
Gonyaulacysta hetcoidn t.s.
Dingodinium aioertii
Gonyaufacysta granutata/granuligera
Ctenidodinium eleganmlum
Muderongi* iff. crucil
Crtbroperidinium edwardsii
Gonyauiacysu cf, dmtina
Lithodinis pertusa
Pseuceratium pelliferum
Frames cf. fragilis
Gonyauiacysu fastigiit*
Heslertonia hosiertonensis
Watiodinium krutlichii
Sirmiodintum grossi
Protixosph, granuioum
Oligosphaendium astengerum
Occlajcysta witt i i
Hyitrichodmkim voigtii
Pareodinia ceratophora
Pareodinia ip. w/kifyplra
Muderongia sp.A of Davey
Adiigmatocysu granulata
Gonyaulacysta exangui»
Spvetorua cf. delicatula
Pareodinia dasyforma
Dingodmiuni spinosum
Egmontodinum torynum
Achomosphwra neptuni
Gonyauiacysu gigas
Endoscriniuni pharo
Hystrichodinium pulchrum
Adnatosphaertdrgm cauMeryi
Polystephanophorus sarieantu
Endoscrinium anceps
Tubotubereita aff. egemeni
Pterospermopsis spp.
Hexagonifera cf. juiasttca
Scriniodinium dictyotum subsp.pyrum
Leptodinium cf. eumorprium
Systematpbora cf. orbifera
/Jetreiyiron itegastum
5crimodinun dctyotum w.osmingtonenTapetnosphaeridium pericompsum
Gonyauiacysu Jurassic*
Gorjyauiacysta dual is
Endoscriniuni luridum
Tapeinosphaeridium granulosum
Pareodtnia spp.
Gonyaulacysta cladophora
gonyauiacysu longicorntsEndoscriniom crysullinum
Systematophora. areolata
Cannosph^fopiis aemula
Gonyaulacysta crasstcornuu
Gonyaulacysta cf. ornata
Systemawphori cf. fasctculigera
Pateodmta prolongau
Ellipsotdictyum cmctum
Glossodinium dimorphum
Tubotuburelta eisenackiSirmiodiniopus orbis
Wanaea digitataGonyaulacysta aldorf«mis
Leptodinium subtile pectmigerumAcanthaulax wrnusta
*
- 7 -
Paiynology
Palynomorph productivity is medium to high in the samples from 1530 to1625 m. At 1635 and 1645 m the productivity is low and the sample at 1650 mis almost barren. Preservation is good to very good.
A number of stratigraphically significant species are present between 1530and 1625 m (species no. 1-42, figure 2). They are all characteristic of theLower Cretaceous (Ryazanian-Hauterivian). Gardodinium trabeculosum (5),Ctenidodinium elegantulum (15), Muderongia aff. crucis (16), Cribroperidiniumsepimentum (4), Lithodinia pertusa (19) and Gonyaulacysta fastigiata (22)represent an Hauterivian element in the uppermost part of the unit. Theoccurrence of Tuboterella apatel a (11) at 1530 m suggests, however, thatthe presence of these younger elements may be due to caving, and that thetrue age for this interval may be slightly older, i.e. Valanginian.
The first downhole occurrence of Pareodinia dasyforma (36), Dingodiniumspiosum (37) and Egmontodinium torynum (38) in association with the lowermostoccurrences of Phoberocysta neocomica (9) and Pseudocerati urn pel 1 i ferum (20)at T6u5m further suggests that we are close to the Ryazanian - Valanginianboundary and that the lower part of the interval (below 1605 m) may be ofRyazanian age. Endoscrinium pharo (41) is present at 1625 m.
These observations together with the general composition of the assemblagesare regarded as evidence for the presence of the Ryazanian and Valanginianand possibly the Hauterivian stages within unit I.
The base of the interval is not definitely established though we here
prefer to set this at 1635 m on lithological grounds.
Environment
Shallow marine, probably fairly close to shore, possibly with slightlyrestricted conditions towards the base.
- 8 -
1635 - 1715/20 m - ?Port1andian
Lithoiogy
Grey silty claystones, micaceous in part are the predominant lithoiogythough in the upper part these grade to clayey siltstone (1665 - 75 m).Small amounts of white limestone are a fairly consistent component of thecuttings fraction throughout most of the interval though this is slightlymore common around 1690 m. The uppermost occurrence of white limestonefragments is at 1635 m. The 1635 and 1645 m samples are also highly pyritic.Minor, but noteworthy influxes of sand occur at 1670, 1690 and 1720 m.Other minor components include glauconite at 1710 m, sporadic occurrencesof pyrite and light grey marls around 1715 - 20 m.
Palynoiogy
The evidence for the age of this unit is here rather tentative as palynomorphproductivity is only medium between 1665 and 1695 m and low in the remaininginterval. Preservation is fair.
The first appearance of Adnatosphaeridium cauleryi (43), Endoscriniumanceps (45) and Tubotuberelia cf. egemenii (46) and the persistent occurrence°f Pareodinia dasyforma (36) and Dingodinium spinosum (37) between 1665 and1695 m suggest a possible Portiandian age Also of note in the presence ofPterospermopsis sp. Further evidence is the absence of a number of speciescharacteristic of the above interval.
Environment
Shallow marine conditions with some restriction in circulation are suggested.The uppermost part of this' interval contains considerable amounts of pyritewhich, if indigenous suggests rather poor circulation, possibly poor inoxygen. Otherwise the dinoflagellate assemblages recovered suggest a shallowmarine environment.
_ 9 _
1730 - 1810 m. Kimmeridgian
Lithoiogy
Dark grey to grey claystones are the predominant lithoiogy with smallamounts of white or brownish limestones. The claystones are somewhat darkerthan in the above interval. Glauconite was observed at 1760 m. Shell fragmentsare recorded from the base of the interval. The cuttings fraction of thisinterval is strongly contaminated by mud additives, particularly in theupper part.
Paiynology
The palynological productivity is low within this unit. However, there is adistinct change in the kerogen composition which is very characteristic.
The occurrence of Glossodinium dimorphum (70) at 1730 m and below, theabsence of such species as Pareodinia dasyforma is evidence of a Kimmeridgianage.
Environment
Shallow marine conditions possibly with some restriction in circulation aresuggested.
1830 - 1890 m. Early Kimmeridgian to Oxfordian
Lithology
Considerable contamination by mud additives is again noted at the top ofthis interval. The upper part of the interval consists of dark grey andgrey claystones similar to those of the above interval. Small amounts ofbrownish and greybrowrt siltstones and clayey siltstones are also recorded.
Palyndlogy
The consistent occurrence of Gonyaulacysta jurassica (55) from 1820 m and
- 10 -
A number of other species, e.g. Leptodinium cf. eumorphum, Scrim'odiumdictyotum var osmingtonense (53) and Gonyaulacysta cladiphora (60) alsomake their first downhole occurrence in this interval. These are corro-borative evidence of an Early Kimmeridgian/Oxfordian age.
The consistent occurrence of Glossodinium dimorphum in all samples down to1879 m and possibly in 1880 m further suggests that the whole of thisinterval may be of Kimmeridgian age. However, this could be caved from theabove deposits and without sidewall control a Kimmeridgian age cannot beconfi rmed.
The evidence for an Oxfordian age lies in the occurrence of a single poorlypreserved specimen of Endoscrinium crystal!i num (62) and a possible recordat 1870 m. This species is usually common in Oxfordian deposits though itis known to extend up to the basal Kimmeridgian. This cannot be considered asparticularly strong evidence for an Oxfordian age and may be due to reworking.Other species common in the Oxfordian (e.g. Endoscrinium galleriturn arelacking.
In summary, the fossils present in this interval favour a Kimmeridgianrather than an Oxfordian age though as we cannot exclude the possibilitythat these are caved into poorly fossiliferous Oxfordian deposits we leaveopen a possible Oxfordian age.
Environment
Shallow marine possibly with somewhat restricted circulation.
1890 - 1900 m. ?0xfordian
Lithology
Dark grey to black claystones and light grey to light brown clay/siItstones
to si Itstones, grading to \/ery fine sandstone.
- 11 -
Paiynology
Fossils are sparse in this interval though G. jurassica (55) is recorded.The absence of G. dimorphum below 1870/80 m may suggest a pre-Kimmeridgian(i.e. ?0xfordian) age for 1890/1900 m. This is however rather tentative.
Comment
he main reason for recognising this interval is the distinctive lithology.
Environment
Probably shallow marine to deltaic.
1905 - 1955 m. Early Oxfordian to Late/Middle Callovian
Lithology
Fine to medium, angular to subangular sands, light grey in colour, togetherwith dark grey claystones are present in the uppermost part of the interval.At 1920 m considerable amounts (40 %) of silt/claystone to silt-stone are also recorded. Below this level dark grey claystones (mostlystrongly contaminated by mud additives) are dominant.
Palynology
This interval contains similar forms to the above interval though a numberof new elements are present such as Systematophora areolata, Ctenidodiniumcf ornatum etc. The record of Manaea digitata at 1910 m may however, betaken as evidence of an earliest Oxfordian to Late or possibly MiddleCallovian age. The record of G. dimorphum (70) towards the base of theinterval, is thought to be due to caving.
It shoulcl be pointed out however, that the assemblages recorded here arenoteably poorer than is usually encountered in rocks of this age. Of parti-cular note is the continued absence of abundant specimens of E. crystal!iniurn(62) and E. galleriturn. Occasional specimens of E. crystal!i num (62) arerecorded though these are uncommon and sporadic.
- 12 -
Environment
Shallow marine, possibly coastal to deltaic. The environment of this intervalmay explain the relatively poor dinoflagellate cyst assemblages.
1960(?)/1970 - 2020 m. Middle Jurassic. ?Bathonian to Bajocian
Lithology
The 1960 and 1965 m samples, consist of coal and mud additive. They arethought to belong to this interval. Dark grey to black and some brownishclaystones, micaceous in parts together with sands and the dominant lithologies.The proportion of clay to sandstones varies somewhat; claystone rich horizonsare recorded at 2000 m and 2020 m. In the upper part of the interval clay-stones rapidly give way (downwards) to sandstones with minor coals. Notableoccurrences of coarse or very coarse sands are recorded in the lower partof the interval.
Palynology
Dinoflagellate cysts are less common in this interval and most of thosepresent may be caved (e.g. Dinogodinium alberti (13) at 2020 m).
There are few certain occurrences of stratigraphically significent formsthough the somewhat uncertain records of Gonyaulacysta cf. aldorfensis and?Leptodinium subtile subsp. pectinigerum at 1950 m may possibly suggest aBathonian age at this level. The record of Pareodinia prolongata at 2020 mmay also suggest a Bathonian age though once again the possibility ofcaving from younger strata (this species extends up to the Callovian)cannot be excluded. •'
The evidence for the age of this interval is not conclusive though it seemsthat a Bathonian age is the more likely. A Bajocian age can not be excluded.A Callovfan age is possible though seems rather less likely.
The spores and pollen recorded from this interval are mostly long rangingand of little stratigraphic'significance at this level. They are indicativeof a Middle or Late Jurassic age.
- 13 -
Environment
Probably deltaic with marked marine influxes at times.
2025 - 2060 m. Indeterminate
Lithology
Sands and ciaystones are again the predominant lithologies. The ciaystonesare dark grey, grey, green, yellowgreen and brown in colour. The uppermostoccurrence of green ciaystones is at 2025 m which is designated as theupper limit of this interval.
Palynology
This interval is more or less barren of indigenous palynomorphs thoughoccasional evidently caved forms are recorded.
Comment
There is more or less no evidence for the age of this interval which isdefined on lithological criteria. A Triassic age seems possible though notruly "red" beds are encountered. Moreover if the minor amounts of coalrecorded are in situ and not caved/mud additives a Middle Jurassic agewould seem likely. However, if this were the case, we would expect somewhatricher spore/pollen assemblages. The 2050 and 2060 m samples are completelybarren.
- 14 -
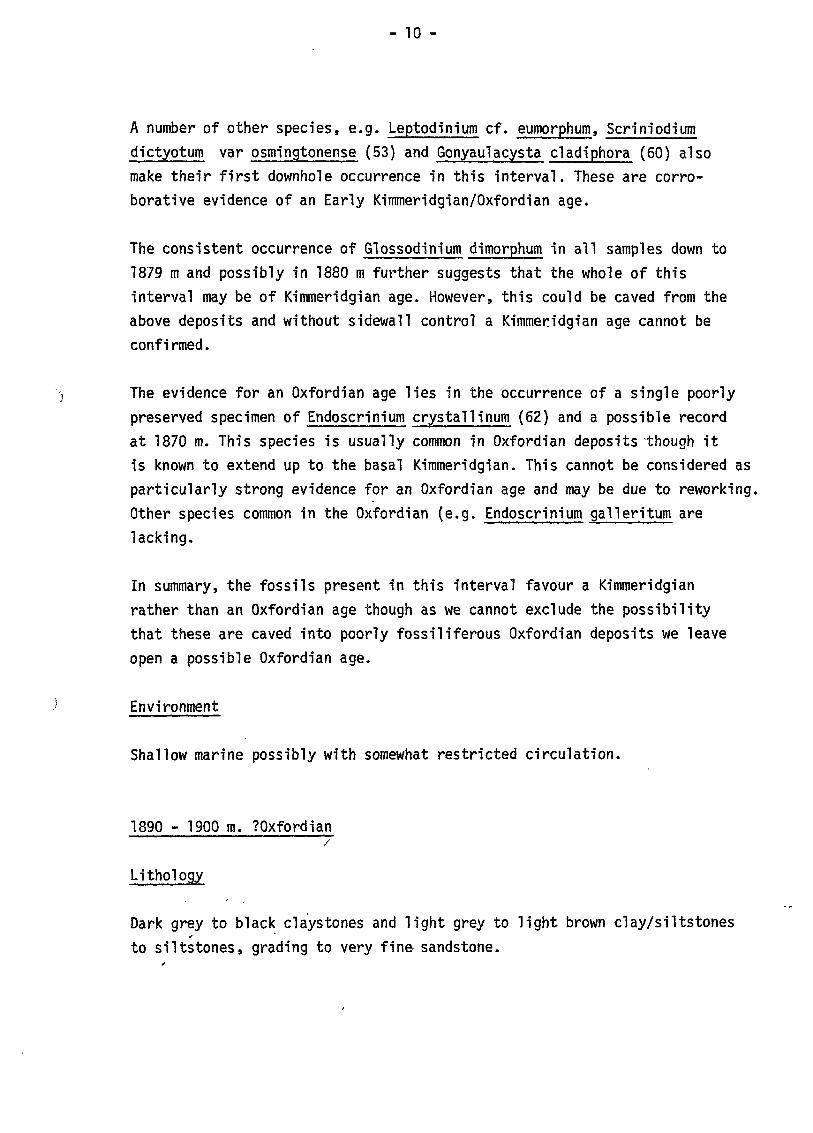
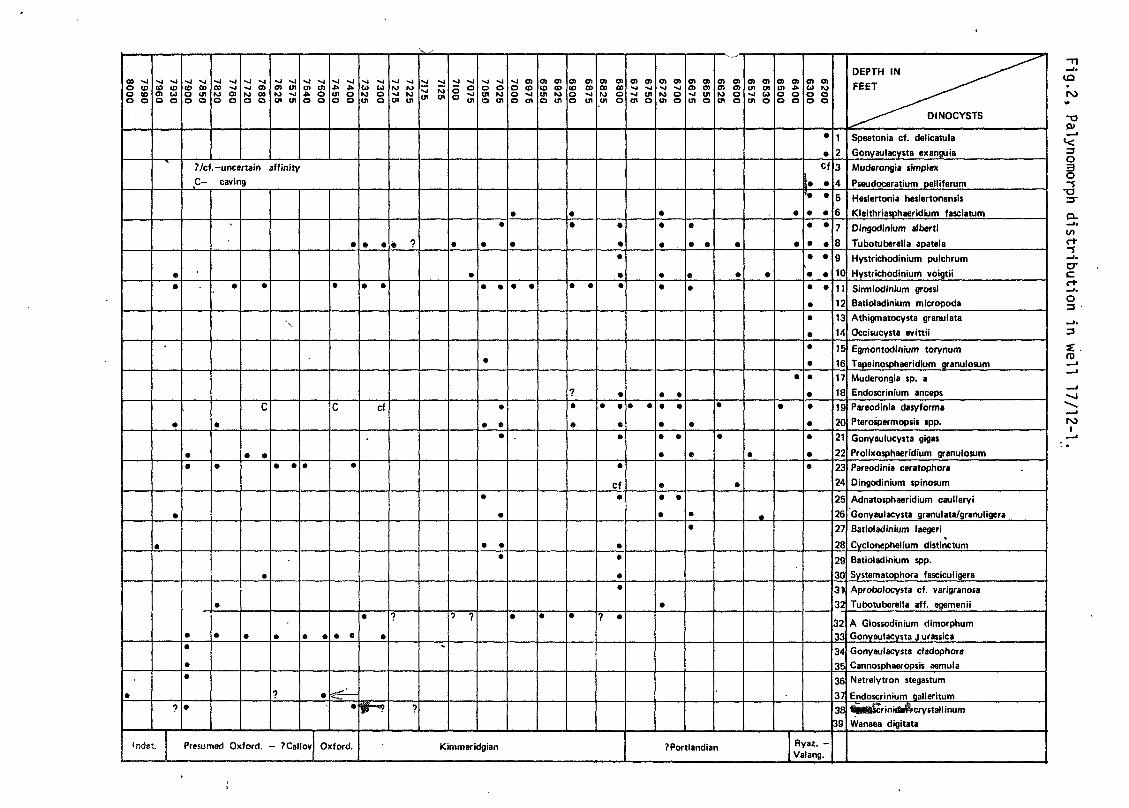
Well 17/12-1 - Biostratigraphy 6200 - 8000 feet
This well shows a somewhat more uniform sequence than 18/11-1 and thedistribution of significant dinocysts is more sporadic. Sample coverage forbiostratigraphic studies in the uppermost part is also poorer than in18/11-1.
6200' - 6400' - Ryazanian to ?Valangian
Lithology
) Silty grey claystones, micaceous in parts are the main lithology down to6325' below which silty grey, dark grey and some lighter grey claystonesare present. Pyrite is observed sporadically.
Palynology
Palynomorph productivity is high at 6200' and 6300', but low at 6400'.Preservation good.
A number of species at 6200' and 6300' again point to an early Lower Cretaceousage for this horizon. Gonyauiacysta exanguia (2), Muderongia simplex (3),and Pseudocerati urn pel1 i ferurn (4) in association with Tubotuberella apatela (8),Occisucysta evittii (14), and Egmontodinium torynum (15) at 6200' and 6300'show a Ryazanian or possibly early Vaianginian age. The sample at 6400'yielded a poor assemblage, and we are uncertain if this should be assignedto the Cretaceous or the Jurassic. In this respect the incoming of somewhatdarker shales at 6325' may be of significance. However, we prefer to includethis 6400' sample on the basis of a slight change in the kerogen compositionand preservation, and an abrupt change in total organic carbon contentbetween 6400' and 6500'.
Comment
The change in total organic carbon referred to above takes place between6425' - 6450'. However, there was insufficient material for both geochemicaland biostratigraphic studies,.
- 15 -
Environment
A shallow marine environment is suggested on the basis of the dinoflagellatecysts.
*(6500') - 6775' - Portlandian
Lithology
Grey to dark grey claystones predominate, though some lighter grey andbrownish claystones are present at some horizons, noteably from 6625' tothe base of the interval. The claystones are often silty and grade toclayey siltstones around 6575'.
Palynology
The upper boundary for this unit is not marked by any distinct change indinocyst assemblage. Between 6500' and 6650' extremely poor assemblageswere recorded. At 6675', 6700' and 6725' there is a higher productivitywith the first downhole occurrence of Adnatosphaerdium cauleryi (25) andTubotuberella cf. egemenii (32). Dingodinium spinosum (24) is present inassemblages from 6600' and 6725' but was not recorded from the Cretaceousin this well.
Also of note is the consistent occurrence of Pareodinia dasyforma in thelower part of this interval from 6700' and below. This species is known tobe particularly common in the Early Portlandian.
The data is not completely conclusive though a Portlandian age seems likely
for this interval.
Comment, . .
This interval probably extends to up 6450'. See comment for the above
i nter'val.
79908000
1 7930
1 7960
*
?
irsdst.
1 7850
[ 7900
1 7760
1 7820
76807720
75757625
75007540
C74007450
?/cf.-uncertain affinity
C— caving
*
*
*
•
*
•
*
C
* * *
#
Presumed Oxford. — 7Callov
#
c
•
Oxford.73007325
* *
cf
*
172257275
: ?
0
1 7,25
I 7175
170757100
0
V ?70257050
* *
•
*
•
*
r69757000
• •
*
69256950
*
68756900
*
* *
?
r68006825
*
*
cf•
#
•
7 •
Kimmeridgian
67506775
67006725
*
•
• •
#
* *
#
L66506675
c •
#
#
•
Tl 6600
| 6625
#
#
*
65306575
r64006500
62006300
#
1 "r •
• • *
•
*
?Portlandian
* *
# #
•
•
*
*
•
Rya*. -Valang.
1
2
3
4
5
6
789
10
11
12
13
14
15
16
17
18
19
20
21
22
23
24
25
26
27
28
29
30
*• C
MPl
CO
3233
34
35
36
37
383 9
DEPTH IN _i^~*'^
FEET ^ ^ > * ^ ^
^ ^ ^ ^ DINOCYSTS
Speetonia cf. delicatula
Gonyaulacysta exanguia
Muderongia simplex
Pseudoceratium pelliferum
Heslertonia heslertonensis
Kleithriasphaeridium fasciatum
Dingodinium al bert i
Tubotuberella apatela
Hystrichodinium pulchrum
Hystrichodinium voigtii
Sirmiodinium grossiBatioladinium micropoda
Athigmatocysta granulata
Occisucysta evittii
Egmontodinium torynum
Tapeinosphaeridium granulosum
Muderongia sp. a
Endoscrinium anceps
Pareodinia dasyforma
Pterospermopsis spp.
Gonyaulucysta gigas
Prolixosphaeridium granulosum
Pareodinia ceratophora
Dingodinium spinosum
Adnatosphaeridium caulleryi
Gonyaulacysta granulata/granuligera
Batioladinium laegeri
Cyclonephelium distinctum
Batioladinium spp.
Systematophora fasciculigera
Aprobolocysta cf. varigranosa
Tubotuberella aff. egemenii
A Glossodinium dimorphumGonyaulacysta J urassica
Gonyaulacysta cladophora
Cannosphaeropsis aemula
Netrelytron stegastum
Endoscrinium galleritumfiHBacrinidwcrystall i num
Wanaea digitata
ro
-o
O
o•a
c/ic+-i
erc
fl>
roi
- 16 -
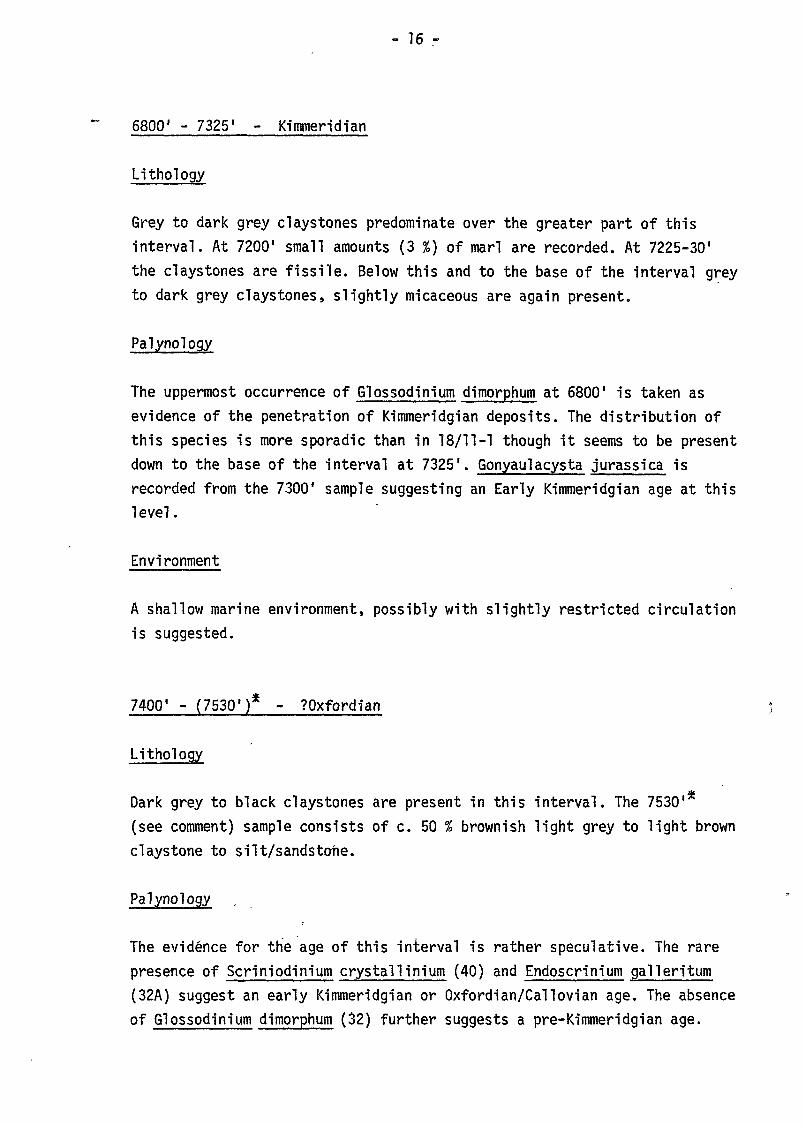
6800' - 7325' - Kimmeridian
Lithology
Grey to dark grey claystones predominate over the greater part of thisinterval. At 7200' small amounts (3 %) of marl are recorded. At 7225-30'the claystones are fissile. Below this and to the base of the interval greyto dark grey claystones, slightly micaceous are again present.
Palynology
The uppermost occurrence of Giossodinium dimorphum at 6800' is taken asevidence of the penetration of Kimmeridgian deposits. The distribution ofthis species is more sporadic than in 18/11-1 though it seems to be presentdown to the base of the interval at 7325'. Gonyaulacysta jurassica isrecorded from the 7300* sample suggesting an Early Kimmeridgian age at thislevel.
Environment
A shallow marine environment, possibly with slightly restricted circulationis suggested.
7400' - (7530')* - ?0xfordian
Lithology
Dark grey to black claystones are present in this interval. The 7530'*(see comment) sample consists of c. 50 % brownish light grey to light brownclaystone to silt/sandstone.
Palynology
The evidence for the age of this interval is rather speculative. The rarepresence of Scriniodinium crystal!i niurn (40) and Endoscrinium galleriturn(32A) suggest an early Kimmeridgian or Oxfordian/Callovian age. The absenceof Giossodinium dimorphum (32) further suggests a pre-Kimmeridgian age.
- 17 -
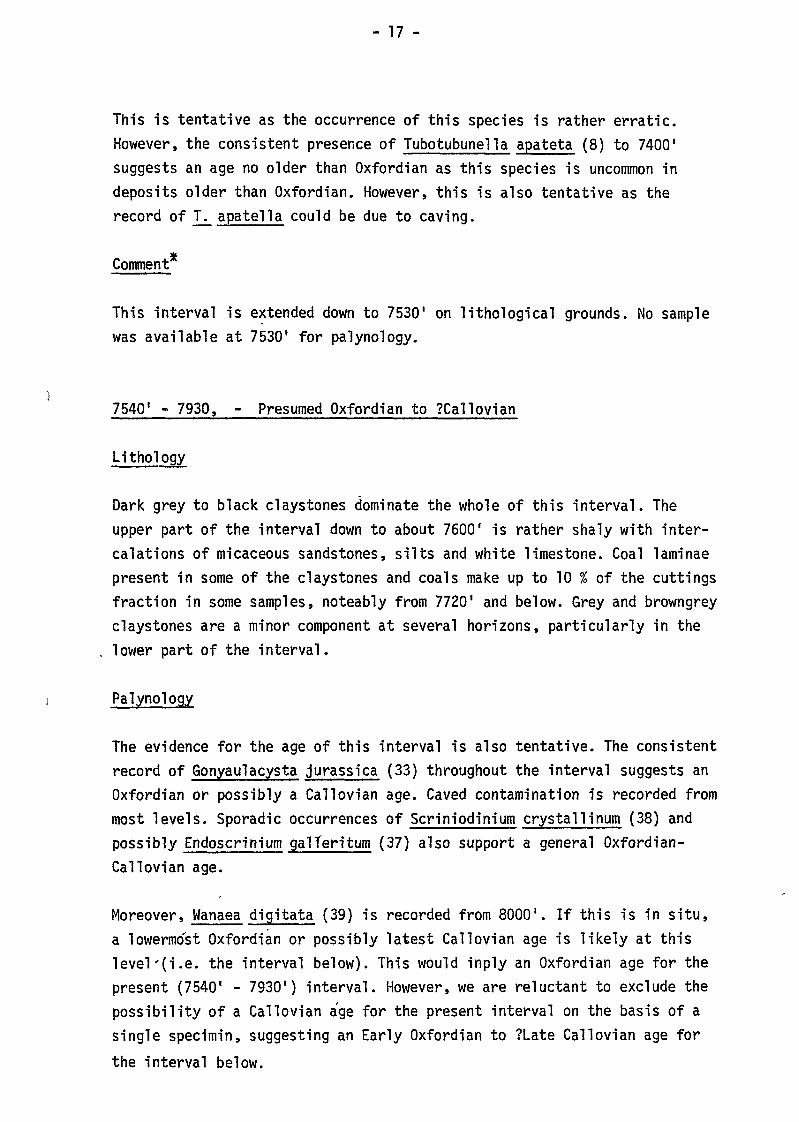
This is tentative as the occurrence of this species is rather erratic.However, the consistent presence of Tubotubuneiia apateta (8) to 74001
suggests an age no older than Oxfordian as this species is uncommon indeposits older than Oxfordian. However, this is also tentative as therecord of T. apatell a could be due to caving.
Comment*
This interval is extended down to 7530' on lithological grounds. No samplewas available at 75301 for palynology.
7540' - 7930, - Presumed Oxfordian to ?Callovian
Lithology
Dark grey to black claystones dominate the whole of this interval. Theupper part of the interval down to about 7600' is rather shaly with inter-calations of micaceous sandstones, silts and white limestone. Coal laminaepresent in some of the claystones and coals make up to 10 % of the cuttingsfraction in some samples, noteably from 7720' and below. Grey and browngreyclaystones are a minor component at several horizons, particularly in thelower part of the interval.
Palynology
The evidence for the age of this interval is also tentative. The consistentrecord of Gonyaulacysta jurassica (33) throughout the interval suggests anOxfordian or possibly a Callovian age. Caved contamination is recorded frommost levels. Sporadic occurrences of Scriniodinium crystal!inum (38) andpossibly Endoscrinium galferitum (37) also support a general Oxfordian-Callovian age.
Moreover, Wanaea digitata (39) is recorded from 8000'. If this is in situ,a lowermo'st Oxfordian or possibly latest Callovian age is likely at thislevel'(i.e. the interval below). This would inply an Oxfordian age for thepresent (75401 - 7930') interval. However, we are reluctant to exclude thepossibility of a Callovian age for the present interval on the basis of asingle specimin, suggesting an Early Oxfordian to ?Late Callovian age for
the interval below.
- 18 -
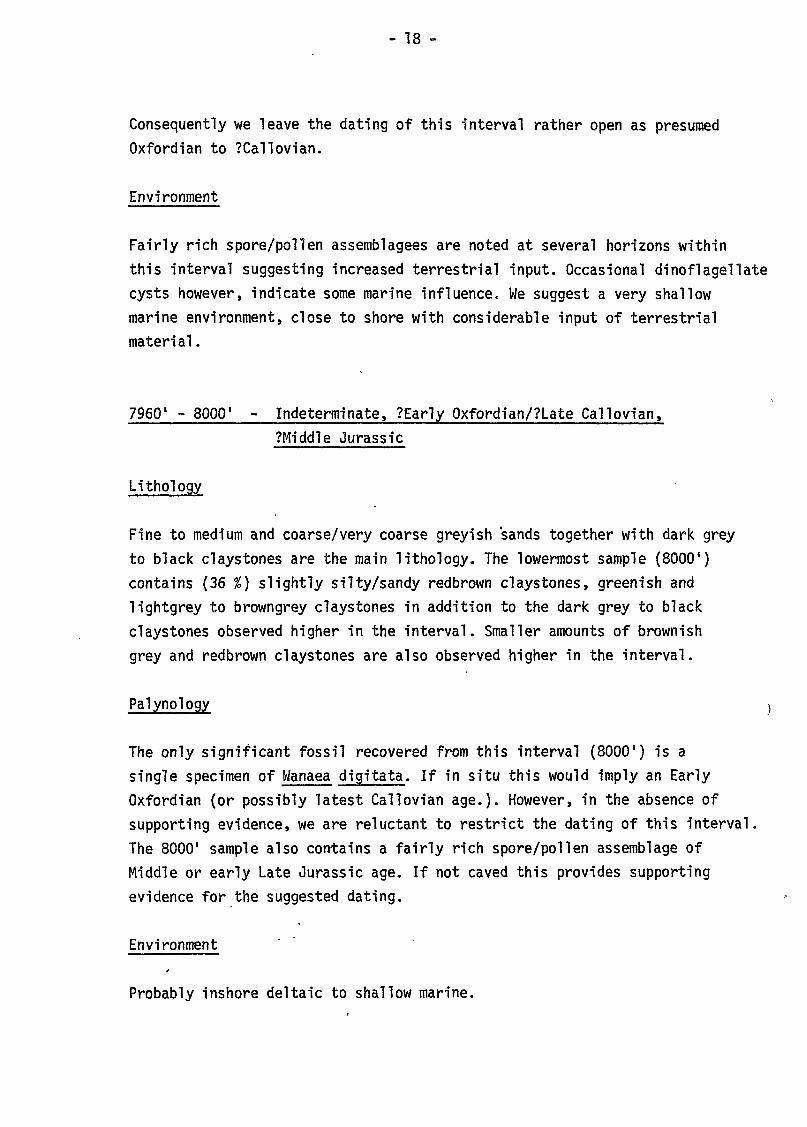
Consequently we leave the dating of this interval rather open as presumedOxfordian to ?Callovian.
Environment
Fairly rich spore/pollen assemblagees are noted at several horizons withinthis interval suggesting increased terrestrial input. Occasional dinoflagellatecysts however, indicate some marine influence. We suggest a very shallowmarine environment, close to shore with considerable input of terrestrialmaterial.
7960' - 8000' - Indeterminate, ?Early Oxfordian/?Late Callovian,?Middle Jurassic
Lithology
Fine to medium and coarse/very coarse greyish sands together with dark greyto black claystones are the main lithology. The lowermost sample (8000')contains (36 %) slightly silty/sandy redbrown claystones, greenish andlightgrey to browngrey claystones in addition to the dark grey to blackclaystones observed higher in the interval. Smaller amounts of brownishgrey and redbrown claystones are also observed higher in the interval.
Palynology
The only significant fossil recovered from this interval (8000') is asingle specimen of Wanaea digitata. If in situ this would imply an EarlyOxfordian (or possibly latest Callovian age.). However, in the absence ofsupporting evidence, we are reluctant to restrict the dating of this intervalThe 8000' sample also contains a fairly rich spore/pollen assemblage ofMiddle or early Late Jurassic age. If not caved this provides supportingevidence for the suggested dating.
Environment
Probably inshore deltaic to shallow marine.
- 19 -
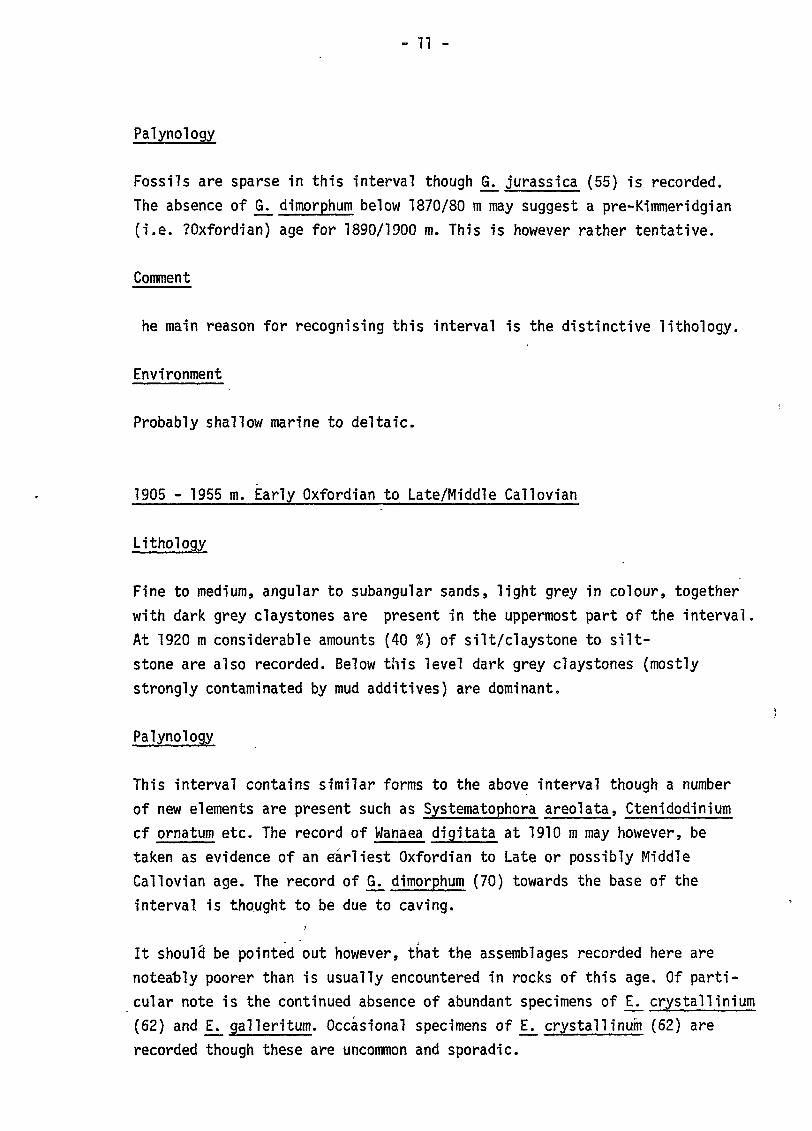
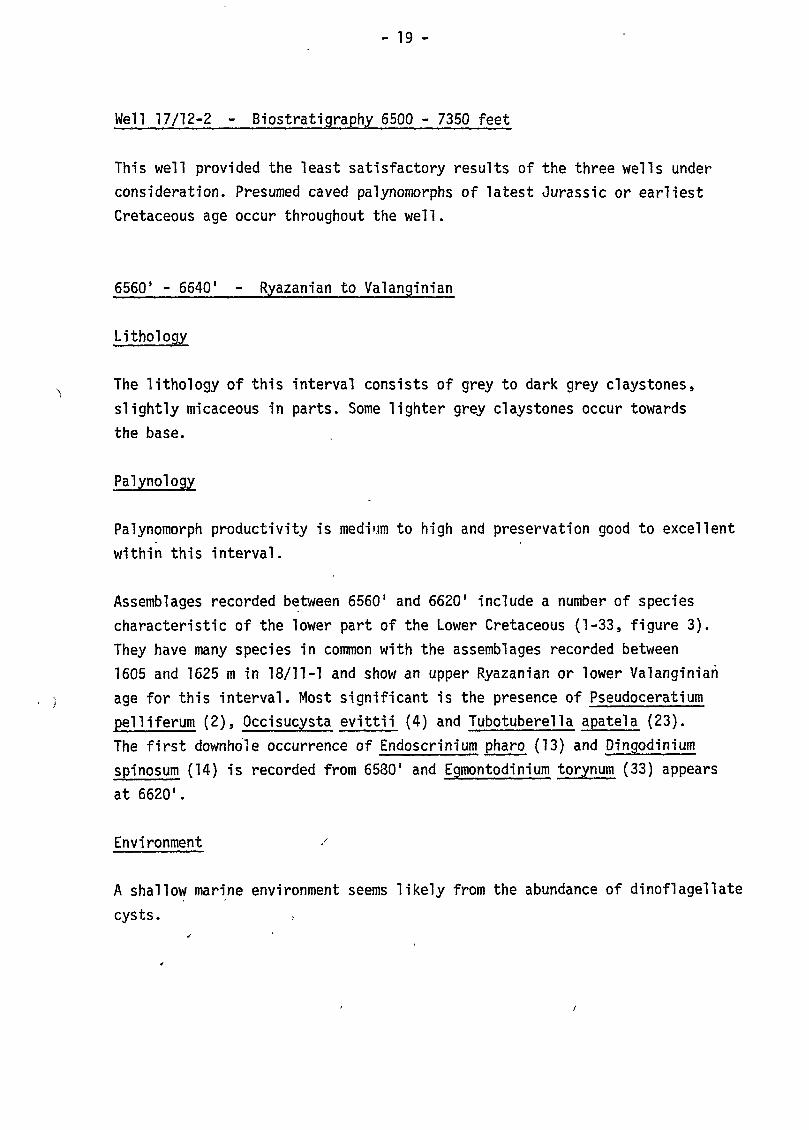
Well 17/12-2 - Biostratigraphy 6500 - 7350 feet
This well provided the least satisfactory results of the three wells underconsideration. Presumed caved palynomorphs of latest Jurassic or earliestCretaceous age occur throughout the well.
6560' - 6640' - Ryazanian to Valanginian
Lithology
The lithology of this interval consists of grey to dark grey claystones,slightly micaceous in parts. Some lighter grey claystones occur towardsthe base.
Palynology
Palynomorph productivity is medium to high and preservation good to excellent
within this interval.
Assemblages recorded between 6560' and 6620' include a number of speciescharacteristic of the lower part of the Lower Cretaceous (1-33, figure 3).They have many species in common with the assemblages recorded between1605 and 1625 m in 18/11-1 and show an upper Ryazanian or lower Valanginianage for this interval. Most significant is the presence of Pseudoceratiumpelliferum (2), Occisucysta evittii (4) and Tubotuberella apatela (23).The first downhole occurrence of Endoscrinium pharo (13) and Dingodiniumspinosum (14) is recorded from 6530' and Egmontodinium torynum (33) appearsat 6620'.
Environment /
A shallow marine environment seems likely from the abundance of dinoflagellate
cysts.
- 20 -
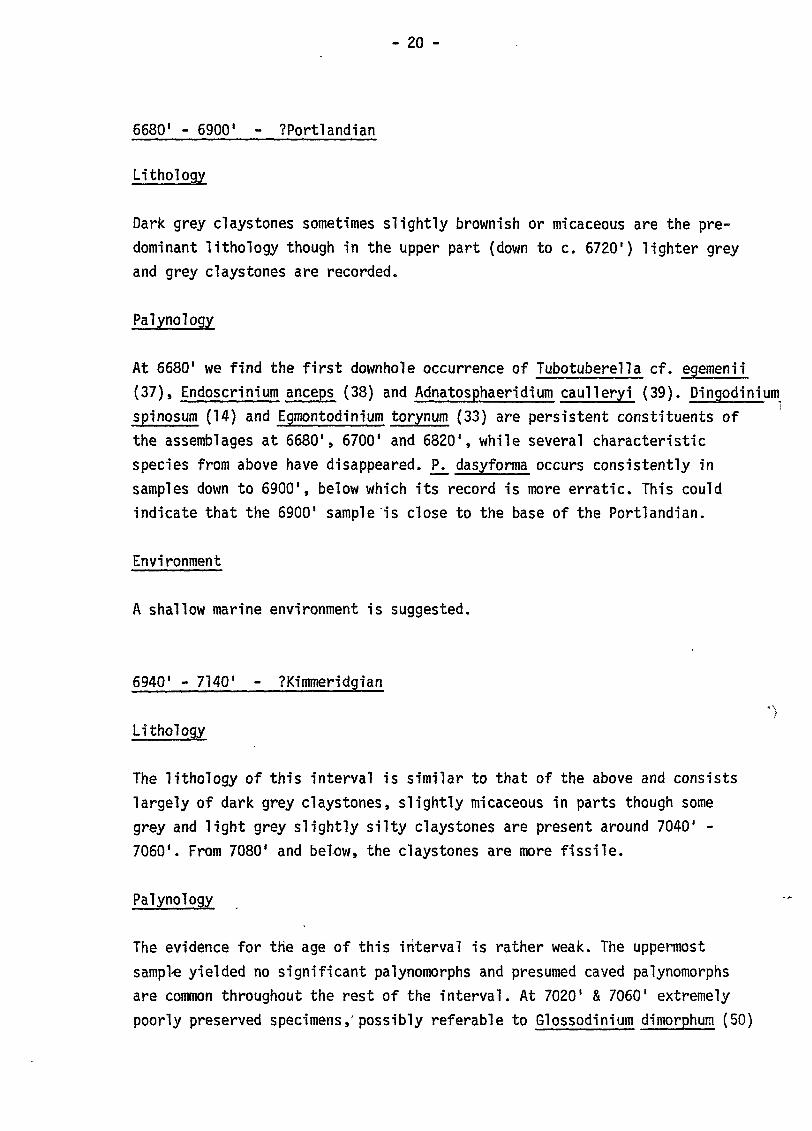
6680' - 6900' - ?Portlandian
Lithology
Dark grey claystones sometimes slightly brownish or micaceous are the pre-dominant lithology though in the upper part (down to c. 6720') lighter greyand grey claystones are recorded.
Palynology
At 6680' we find the first downhole occurrence of Tubotuberella cf. egemenii(37)» Endoscrinium anceps (38) and Adnatosphaeridium caulleryi (39). Dingodiniumspinosum (14) and Egmontodinium torynum (33) are persistent constituents ofthe assemblages at 6680', 6700' and 6820', while several characteristicspecies from above have disappeared. P. dasyfortna occurs consistently insamples down to 6900', below which its record is more erratic. This couldindicate that the 6900' sample "is close to the base of the Portlandian.
Environment
A shallow marine environment is suggested.
6940' - 7140' - ?Kimmeridgian
Lithology
The lithology of this interval is similar to that of the above and consistslargely of dark grey claystones, slightly micaceous in parts though somegrey and light grey slightly silty claystones are present around 7040' -7060*. From 7080' and below, the claystones are more fissile.
Palynology
The evidence for the age of this interval is rather weak. The uppermostsample yielded no significant palynomorphs and presumed caved palynomorphsare common throughout the rest of the interval. At 7020' & 7060' extremelypoorly preserved specimens,'possibly referable to Giossodinium dimorphum (50)
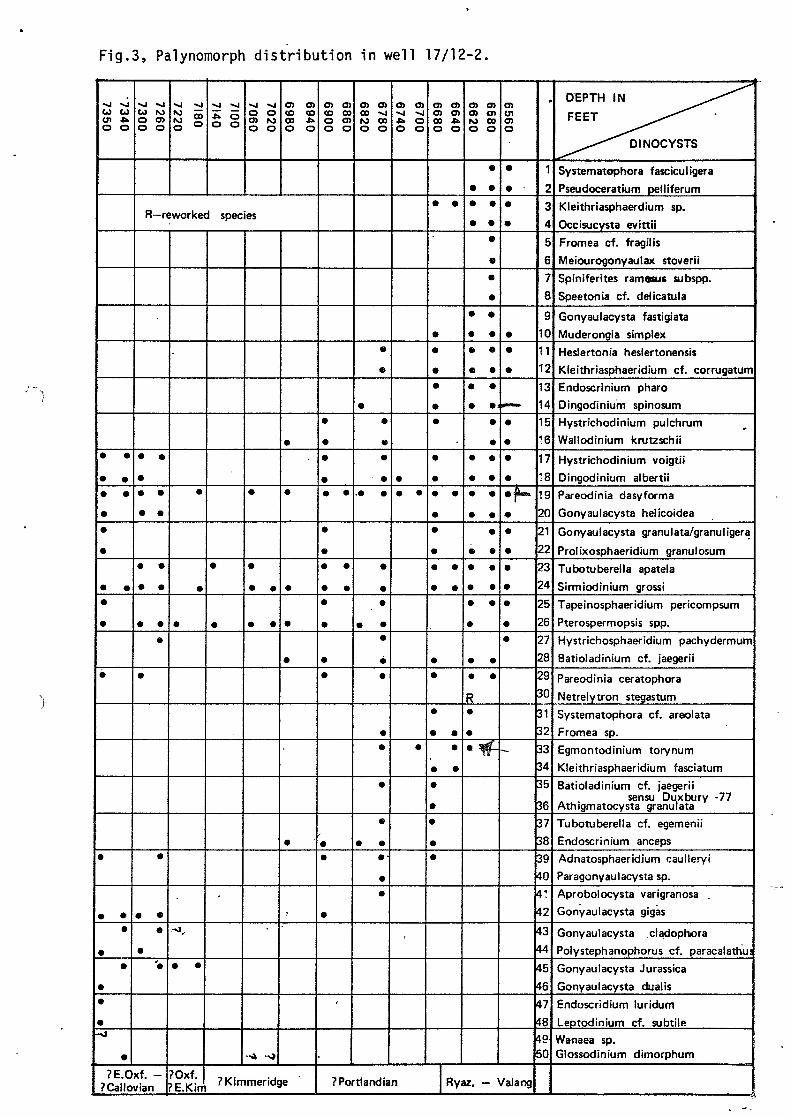
Fig.3, Palynomorph distribution in well 17/12-2.
73407350
• •• •• ••••
• •••
•
•
• ••
••
•••-o
•
72607300
71807220
71007140
170207060
169406980
R—reworked species
• •
•• •
• •
• •
• •
• ••
•
•
• ••
••
?E.Oxf. -?Callovian
•
•
•
• •
?Oxf.? E.Kim
•
•
•
•
• •
• •
•
•
•
•
•
•
?Kimmeridge
68606900
•
••
•
•
•• •
• ••
•
•
•
••
•
167806820
•
•
•
•
••
- •
•
••
• ••
••
••
•
•
• •• •
•
•
67006740
•
•
66406680
• •
•
•
•
•
•
•
•
•
•
•
•
• •
• •
•
•
•
• •
•
• •
•
•
•
•
•
?Portlandian
65806620
•
• •
• •
• •
•
•
•
•
• •
• •
• •
• •
• •
• •
•
•
• •
• •
• •
•
• •
• •
• •
• •
•
• •
• •
R•
•
6560
•
• -•
•
••
•
•
••
•
••
••
••
••
Ryaz. — Valang
i
4g
6
7
8g
1011
12
1314
15
16
17
?8
19
20
21
22
23
24
25
26
27
28
29
30
31
32
33
34
35
36
37
38
39
40
41
42
43
44
45
46
47
484950
DEPTH IN ^ ^ - " " ^ ^
FEET ^ ^ ^ ^ •
^ ^ - " " " D I NOCYSTS
Systematophora fasciculigera
Pseudoceratium pelliferum
Kieithriasphaerdium sp.Occisucysta evittii
Fromea cf. fragilisMeiourogonyaulax stoverii
Spiniferites ramesus subspp.
Speetonia cf. delicatula
Gonyaulacysta fastigiata
Muderongia simplex
Heslertonia heslertonensis
Kleithriasphaeridium cf. corrugatum
Endoscrinium pharoDingodinium spinosum
Hystrichodinium pulchrumWallodinium krutzschii
Hystrichodinium voigtii
Oingodinium albertiiPareodinia dasyforma
Gonyaulacysta helicoidea
Gonyaulacysta granulata/granuligera
Prolixosphaeridium granulosum
Tubotuberella apatela
Sirmiodinium grossi
Tapeinosphaeridium pericompsum
Pterospermopsis spp.
Hystrichosphaeridium pachydermum
Batioladinium cf. jaegerii
Pareodinia ceratophora
Netrelytron stegastum
Systematophora cf. areolata
Fromea sp.
Egmontodinium torynum
Kleithriasphaeridium fasciatum
Batioladinium cf. jaegeriisensu Duxbury -77
Athigmatocysta granulata
Tubotuberella cf. egemenii
Endoscrinium ancepsAdnatosphaeridium caulleryi
Paragonyaulacysta sp.
Aprobolocysta varigranosa
Gonyaulacysta gigas
Gonyaulacysta cladophora
Polystephanophorus cf. paracalathu;
Gonyaulacysta Jurassica
Gonyaulacysta dualis
Enduscridium luridum
Leptodinium cf. subtileWanaea sp.Glossodinium dimorphum
- 21 -
were recovered. This rather weakly suggest the possibility of a Kimmeridgianage, at least for this level. There is little positive evidence for therest of the interval, and the dating should be regarded as highly tentative.
Envi ronment
A marine environment, probably fairly shallow is indicated.
7180 - 77220 - ?0xfordian to ?Early Kimmeridgian
Lithology
Dark claystones, sometimes grading to black, and black claystones are themain lithologies though some brown and browngrey claystones are alsorecorded.
Palynology
Gonyanlacyta jurassica (45) was recorded from this interval. This may indi-cate penetration of Early Kimmeridgian, Oxfordian or even Callovian depositsthough the latter seems less likely. There is however little supportingevidence for either a Kimmeridgian or an Oxfordian age, and the most obviousaspect of the assemblages are presumed caved Portlandian to Early Cretaceouspalynomorphs.
Comment
In both 18/11-1 and 17/12-1 the occurrence of black claystones is associatedwith sediments in which the evidence seems to point to an Oxfordian ratherthan a Kimmeridgian age. This may also be the case here though we do not havefossil evidence to support this. The lower limit of this interval is uncertaindu to mud contamination.
Environment
A shallow marine to deltaic environment seems likely
- 22 -
7260' - 7360' - ?Early Oxfordian to Callovian
Lithology
The uppermost sample from this interval consists of dark grey, grey andblack claystones together with fine to coarse angular to subangular sands(20 %). Below this dark grey and light browngrey claystones with minorsands (5 %) are present down to 7300'/7320'. These give way (downwards) todark grey to black micaceous claystones which at 73401 are fissile. Thereis considerable mud contamination within this interval, and the lithologyis difficult to interpret. The upper limit of the interval is uncertain.
Palynology
Presumed caved palynomorphs are again the most obvious aspect of the assemblages,Presumed indigenous forms are for the most part very poorly preserved andcertain identification is difficult. For this reason we do not dismiss thepossibility that they are reworked.
Nevertheless, Polystephanophorus cf. paracalatus (44) is recorded from73001 and 7350' and two extremely poorly preserved specimens which mayrepresent ?Wanaea sp. were recovered from the 7350' sample. If truly indigenousthese would suggest an Early Oxfordian or Callovian age from at least7300'.
Comment
This interval is extended upwards from 7300' to 7240' on grounds of lithologyas the 7240' sample in the uppermost occurrence of sands. We have recordedno convincing fossil evidence either for or against this adjustment.
Environment
A shallow marine to deltaic environment of deposition is suggested.
- 23 -
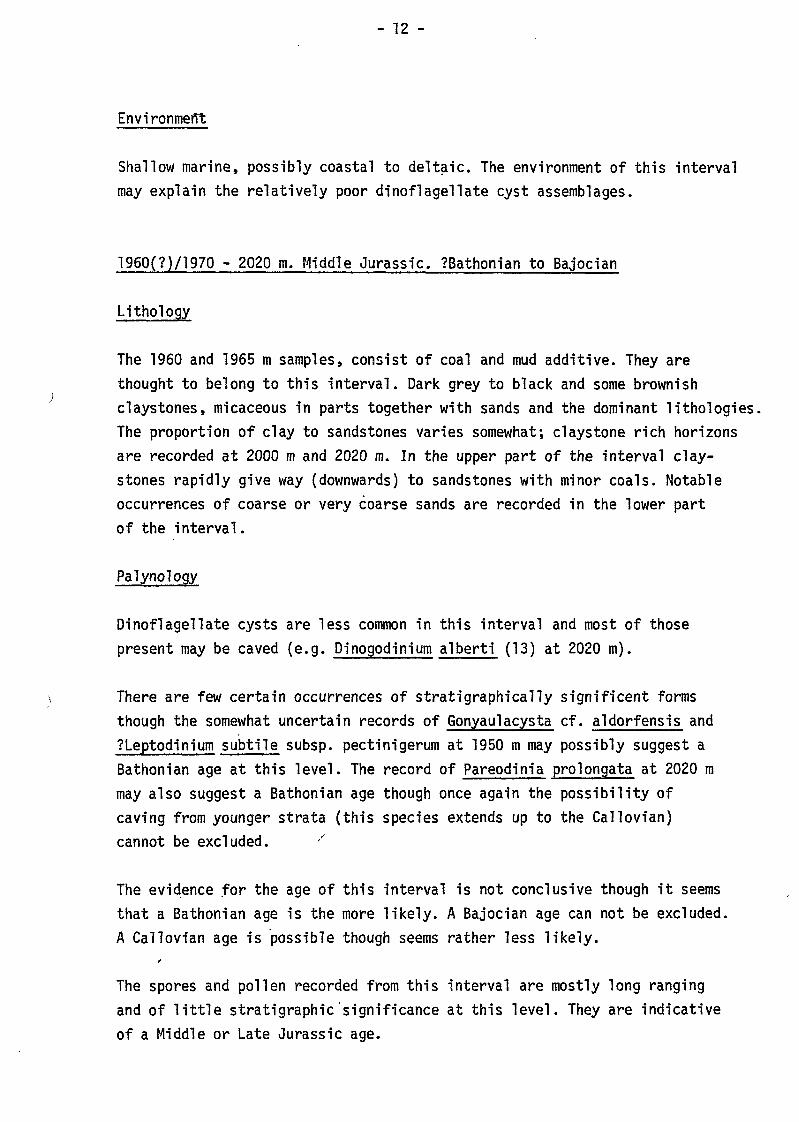
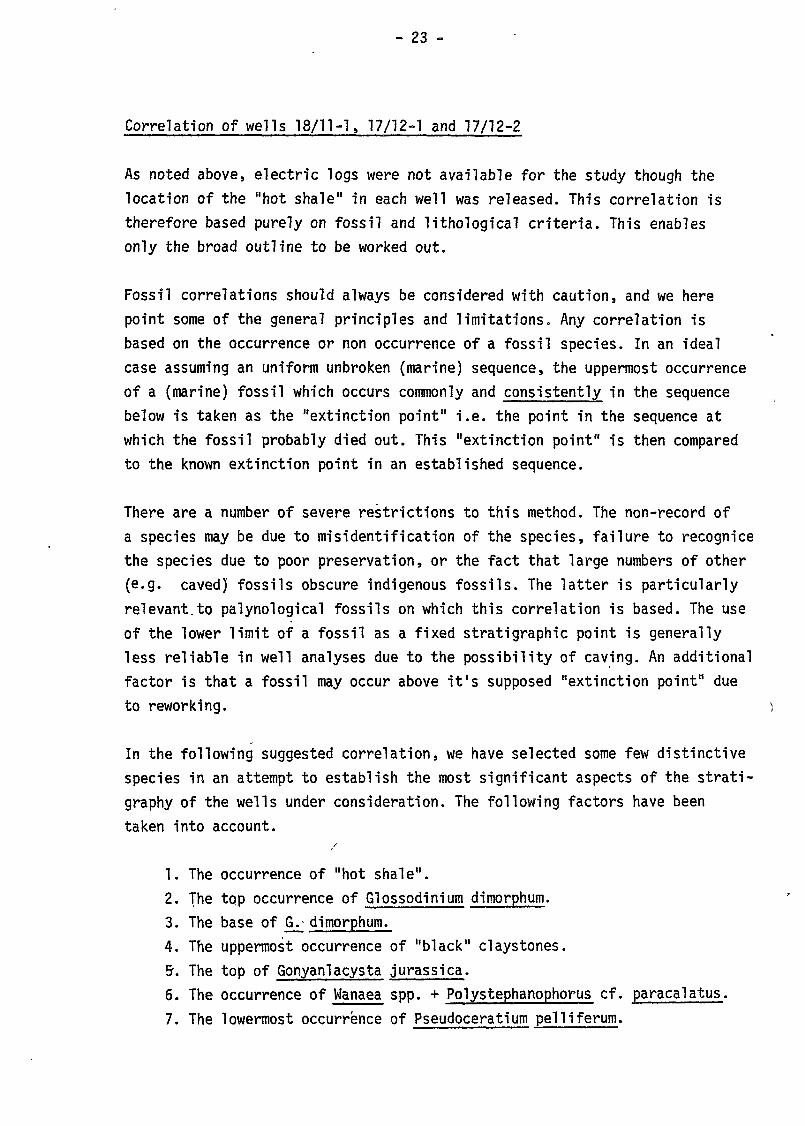
Correlation of wells 18/11-1, 17/12-1 and 17/12-2
As noted above, electric logs were not available for the study though thelocation of the "hot shale" in each well was released. This correlation istherefore based purely on fossil and lithological criteria. This enablesonly the broad outline to be worked out.
Fossil correlations should always be considered with caution, and we herepoint some of the general principles and limitations. Any correlation isbased on the occurrence or non occurrence of a fossil species. In an idealcase assuming an uniform unbroken (marine) sequence, the uppermost occurrenceof a (marine) fossil which occurs commonly and consistently in the sequencebelow is taken as the "extinction point" i.e. the point in the sequence atwhich the fossil probably died out. This "extinction point" is then comparedto the known extinction point in an established sequence.
There are a number of severe restrictions to this method. The non-record ofa species may be due to misidentification of the species, failure to recognicethe species due to poor preservation, or the fact that large numbers of other(e.g. caved) fossils obscure indigenous fossils. The latter is particularlyrelevant.to palynological fossils on which this correlation is based. The useof the lower limit of a fossil as a fixed strati graphic point is generallyless reliable in well analyses due to the possibility of caving. An additionalfactor is that a fossil may occur above it's supposed "extinction point" dueto reworking. )
In the following suggested correlation, we have selected some few distinctivespecies in an attempt to establish the most significant aspects of the strati-graphy of the wells under consideration. The following factors have beentaken into account.
1. The occurrence of "hot shale".2. The top occurrence of Glossodinium dimorphum.3. The base of G.- dimorphum.4. The uppermost occurrence of '"black" claystones.5. The top of Gonyanlacysta jurassica.6. The occurrence of Wanaea spp. + Polystephanophorus cf. paracalatus.7. The lowermost occurrence of Pseudoceratium peliiferum.
17/12 -1
18/11-1
(5J
17/12-2\
16600!"\
N 2100 -
_N __
(70001 S-
^ - "2200 -C2501-
_ __
'i'l'l'l'lII 1 I
III 1 I
III 1 I
III 1 I
III 1 I
Iililili'i! 'I'I'I'I'I'I
il i i II
II 1 1 II
II I 1 II
II 1 1 II
il i i ll
ililililili!
-Z-Z-Z-iHHI-
I.I I;II I ll1 1 I
I1 1 I
IM
illt
ill
Illlllll ii|i|i|f.i|i|i|i|i|ii
:i 1
11
11
11 I
I1
11
11
11
1 II
11
11
11
11
11
11
11
11
11 I
I1
11
11
11
1 II
!I!I!I!I!I!I!I!I!I!I!
iiiillillIIIIIIill
Égggf
1N
l l
Po
rtla
nd
ian
£.
7 K
imm
end
g
E.Kirr
fE.O
xfo
rd.-
jcal
lovi
an
2060
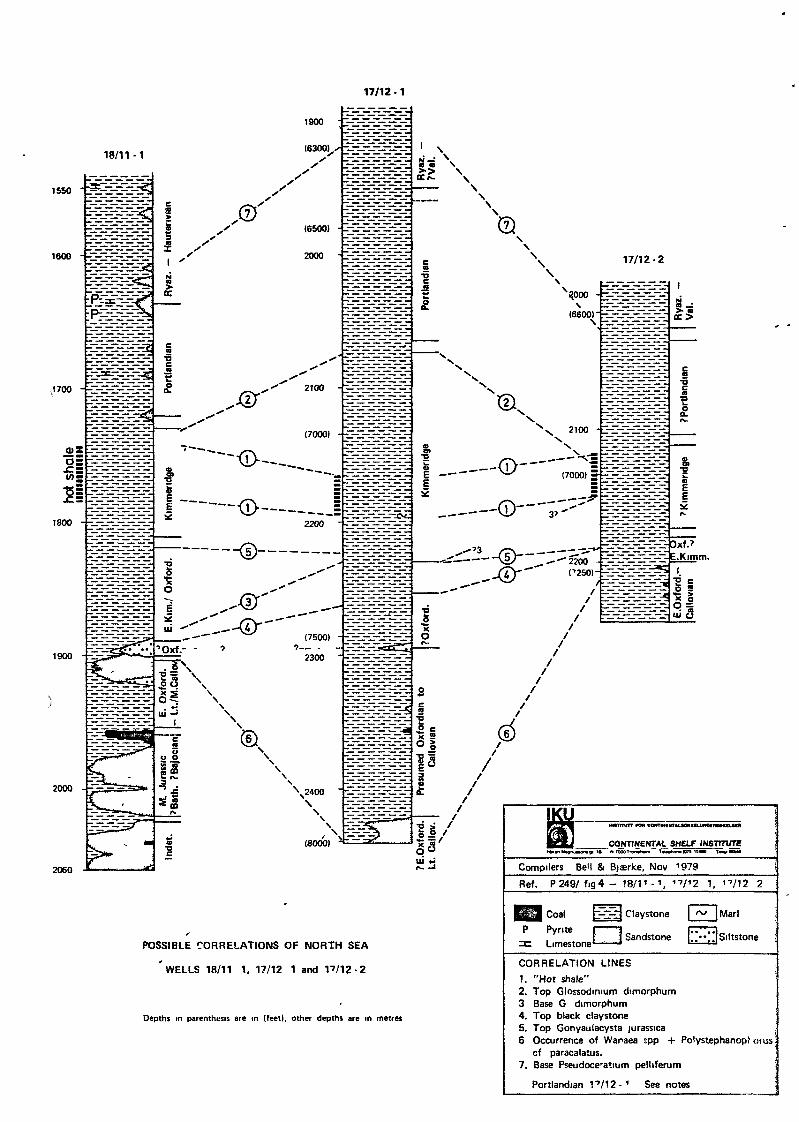
POSSIBLE CORRELATIONS OF NORTH SEA
'WELLS 18/11 1. 17/12 1 and 17/12 -2
Depths in parenthesis are in (feet), other depths are in metres
MSTnuTT FOT X0<ITINIHTUjaciia.UN0tRHtUUOI
CONTINENTAL SHELF INSTITUTEIS N ftnOTrona^wn TMonomlOn 13MD Ta*wSSMI
Compilers Be1! & Bjærke, Nov 1979
Ref. P249/ f ig4 - 18/11 - 1 , 1"'/12 1, i ' /12 2
CoalP Pyntex: Limestone'
H H J Claystone
~ J Sandstone
|Marl
lsiltstone
CORRELATION LINES
1. "Hot shale"2. Top Glossodimum dimorphum3 Base G dimorphum4. Top black claystone5. Top Gonyaulacysta jurassica6 Occurrence of Waraea jpp + Polystephanopt orus
cf paracalatus.7. Base Pseudoceratium pelliferum
Portlandian 1^/12 - 1 See notes
- 24 -
A critical examination of these correlations and the occurrence of fossilsin the different units of the three wells, may enable some refinement ofthe proposed age datings and possibly establish the time equivalence ofunits described under slightly different age limits. However, we refrainfrom this proceedure on the grounds that contamination is evident in manysamples and prefer to retain the age units described in the preceedingsection.
(7) Base of PSEUDOCERATIUM PELLIFERUM
The lower limit (base) of P. pelliferum is generally believed to be LateRyazanian (= c. Berriasian). The non-occurrence of this common speciesbelow 1605 m in 18/11-1 and 63001 in 17/12-1 may indicate that the sequencesimmediately below these levels and above the Portlandian are of Ryazanianage. A low confidence is given to this correlation due to the possibilityof caving. In 17/12-2 this species occurs down to 66201 possibly due tocaving.
0 ) Occurrence of "Hot Shale"
This is an extremely useful correlation datum andis given high confidence.It is assumed to be roughly time equivalent in each of the wells.
(2) The top occurrence of GLOSSODINIUM DIMORPHUM
Glossodinium dimorphum is normally associated with Kimmeridgian deposits.It may extend into the Early Portlandian such that the exact age limit ofthe "Kimmeridgian" as here recognised may be subject to discussion. This ishowever not relevant to its use as a stratigraphic datum in this corre-lation.
If the occurrence of "hot shale" and G. dimorphum are considered togetherin wells 18/11-1 and 17/12-1 assuming that the hot shale represents a timeplane, then the occurrence of G. dimorphum in 17/12-1 is much higher thanin 18/1VI.
Assuming that the non-record of this species in 18/11-1 is not due to non-recognition or other factors (see above), then the "post hotshale Kimmerid-gian" is in the order of 100 m in 17/12-1 and in the order of 10 m in18/11-1.
- 25 -
This suggests that this sequence is much reduced or absent in 18/11-1compared with 17/12-1.
In 17/12-2 the significance of this fossil is much reduced as it is recordedonly sporadically and in a yery poor state of preservation (no certain in situoccurence was recorded). Nevertheless, if we accept the Portlandian dating of17/12-2, then the top of the "hot shale" is more or less coincident with thetop of the Kimmeridgian. We tentatively suggest that this sequence is alsoabsent or reduced in 17/12-2.
(3) The base of GLOSSODINIUM DIMORPHUM
This is given a lower confidence rating due to the possibility of caving.It is nevertheless of significance when considered in conjunction with theoccurrence of Gonyaulacysta jurassica (datum 5, see below). The lower limitof this species is generally believed to be earliest Kimmeridgian or latestOxfordian. If the record of G. dimorphum in 18/11-1 is not due to caving,this suggests that the greater part of the interval described as "earlyKimmeridgian to Oxfordian" in this well is in fact of Kimmeridgian age.
(4) The uppermost occurrence of "black" claystones
We note here that this datum seems to be associated with the occurrence ofsuspected Oxfordian. In 18/11-1 and 17/12-1 these claystones are associatedwith siltstones. In 17/12-2 minor amounts of sand are recorded immediatelybelow the interval described as "?0xfordian ?Early Kimmeridgian".
(5) The top occurrence of GONYAULACYSTA JURASSICA
The upper limit of the occurrence of common Gonyaulacysta jurassica isgenerally thought to be Early Kinmeridgian though sporadic records areknown from higher in the Kimmeridgian.
In 18/11-1 the top record of this species is at about 1820 m. This is wellabove the .lower limit of G. dimorphum and also above the occurrence of"black" claystones in this well. In 17/12-1 the first downhole occurrenceof this species is roughly coincident with the base of G. dimorphum andto top of the "black" claystones. It is possible that non-recognition etc.accounts for the absence of this species in 17/12-1.
- 26 -
However, if the top occurrence of this species is a reliable datum in17/12-1, we tentatively suggest that some of the interval described asEarly Kimmeridgian/Oxfordian in 18/11-1 is reduced or absent in 17/12-1.
In 17/12-2 serious caving problems were encountered, and the reliabilityof the top G. jurassica datum is even more in doubt. Nevertheless, it isagain approximately coincident with the uppermost occurrence of "black"claystones. This gives some grounds for suggesting that the EarlyKimmeridgian/Oxfordian interval of 18/11-1 is also reduced in 17/12-2.
(6) Occurrence of WANAEA SPP. and PQLYSTEPHANOPQRUS of PARACALATUS
These species are members of a suite of species which have a top occurrencein earliest Oxfordian deposits and extend down into the Callovian. They aretherefore considered together as a single datum.
We are unable to rate this correlation datum highly as it is based onspecimens which are mostly in an extremely poor state of preservationmaking positive identification difficult. In addition they are rare inthe sequences examined (one or two tentative identifications in each well)such that the possibility of non-observation is rather high.
In 18/11-1 the record of these species is at the top of the sand body at1910 m, immediately below siltstones of presumed Oxfordian age. In 17/12-1a single specimen assigned to Wanaea digitata is recorded from the lowermostsample (80001) which is also a sand body. This is well below the occurrencesiltstones (see fig. 7) of presumed Oxfordian age.
This suggests that the sequence of claystones occurring in 17/12-1 between7530' and 7940' may be absent in 18/11-1.
This sequence is arbitarily assigned a presumed Oxfordian to Callovian agein 17/12-1 and need not imply time equivalence with the Early Oxfordian toLate/Middle Callovian interval (c. 1905 - 1950 m) in 18/11-1. The two sandbodies In these wells (c. 1905 - 1920 m in 18/11-1 and ca. 79601 in 17/12-2)may therefore be lateral equivalents.
In 17/12-2 j\_ cf. paraculatus and Wanaea sp. are suspected at 7300' and7350' respectively. The poor state of preservation suggests reworking, and
- 27 -
we are unwilling to propose a correlation though, we do note that if thesespecimens are indigenous, they imply that the "presumed Oxfordian toCallovian" claystone sequence of 17/12-1 may also be reduced or absent in17/12-2.
It also seems possible that the siltstone unit in 18/11-1 at ca. 1890/1900 m may correlate with the siltstone unit of 17/12-1 at ca. 7530'.
- 28 -
PART TWO: SOURCE ROCK STUDIES
- 29 -
RESULTS AND DISCUSSION
A: Well 18/11-1
Total Organic Carbon (TOC)
Samples above approximately 1500 m were very few and of a poor quality.None of these samples were analysed. From 1530 m to terminal depth a goodsuite of samples were received, and these were analysed extensively. Mostof the samples were mainly claystone. Where more than one lithology wasregistered, all lithologies, except sandstones, were analysed for totalorganic carbon.
On the basis of total organic carbon measurements, the analysed sequence ofthe well can be divided into zones.
Zone A: - 1730 m:This seems to be a very homogeneous sequence with only small variations inthe TOC values, around the 1.0 % mark.
Zone B: 1735 - 1820 m:At approximately 1740 m the TOC value changes sharply from 1.0 % in zone Ato approximately 3.5 35. The TOC values are rather constant over an intervalof approximately 80 m, then drop sharply.
Zone C: 1825 - 1900 m:The TOC values in this zone are intermediate in value to the two zonesabove, approximately 1.5 %.
Zone D: 1905 - 1920 m:Only two readings on claystone in this zone with results similar to thezone above. This zone is, however, separated out from the zone above due tothe change in lithology to siltstone and sandstone. The claystone cuttingsmight be downfall from the zone above.
Zone E: 1925 - 1960 m:At approximately 1925 m the TOC value again changes sharply to approxi-mately 3 %. This high valuer's found for most of the analysed samples.
- 30 -
Zone F: 1960 - 2060 ra:
This zone consists mainly of sandstone with thin claystone sequences inbetween. The TOC values vary considerably within this zone, and it isbelieved that this large variation is partly due to a contamination byother lithologies (sandstone) in the analysed samples. The samples were ofa poorer quality in this part of the well than higher up.
Extraction and Chromatographic Separation
Zone A: Three samples from this zone were analysed, all showing a fairabundance of extractable hydrocarbons. The ratio between saturated andaromatic hydrocarbons are approximately 1 for all three samples. The gaschromatograms of the saturated hydrocarbon fractions vary only slightlyfrom sample to sample. The n-alkanes are not very abundant while the steranes/triterpanes are very abundant. The large proportion of steranes/triterpanesindicates an input of terrestrial material and that the n-alkanes aredestroyed by bacterial activity after sampling.
Biostratigraphic examination suggests that the Cretaceous/Jurassic boundaryis approximately at 1635 m. We do not find a change either in the TOCmeasurements or in the extraction and further examination of the variousfractions.
Zone B: Three samples from zone B were extracted, all showing a fairabundance of extractable hydrocarbons, and with a saturated/aromatic andHC/TOC ratio similar to the samples from the zone above. The gas chromatogramsof the saturated hydrocarbon fractions vary considerably. The sample from1730-35 m has a distribution similar to those from the zone above while thesample from 1765-70 m has a large abundance of isoprenoids, pristane andphytane being larger than nC,^ and nC,g, and a pronounced, more unresolvedsterane hump. The most pronounced difference from the samples higher up inthe well is that phytane is more abundant than pristane. This indicatesthat the environment of deposition has been strongly reducing.
The lowermost sample in this zone, 1S05 - 1815 m also has a low abundanceof n-alkanes, especially in the higher m.w. range. The isoprenoids are
- 31 -
pronounced but not as pronounced as in sample 1765 - 1770 m, and the pristane/phytane ratio is almost equal to unity. It should, however, also be pointedout that n-C,. is very pronounced in this sample.
Zone C: Two samples from zone C were extracted. The upper sample shows agood abundance of extracted hydrocarbons, while the lower sample shows afair abundance. The ratio of saturated/aromatic hydrocarbons is similar tothe ratio found in the samples in zone A and B.
The gas chromatograms of the saturated fractions vary from sample tosample. In upper sample, 1835 - 1840 m, a pronounced unresolved steranehump is seen, and the n-alkanes, nC,,- to nC^-i, are far more abundant thanthe isoprenoids.
The gas chromatogram of the saturated hydrocarbon fraction of the nextsample, 1875 - 1880 m, is different. A large unresolved sterane hump isfound, but with a distinct pattern of n-alkanes with a high CPI value.Again the n-alkanes, nC..,. to nC2-j, are more pronounced than the isoprenoids.The most pronounced feature in this gas chromatogram is, however, the verylarge abundance of compounds in the nC,- - nC,,- area. This abundance is sogreat, that it is probably due to a contamination either of migratedmedium weight hydrocarbons, a condensate, or by a mud additive. If ordinarydiesel had been used in the mud, a greater abundance of n-C-ig - n"^20would have been expected.
Zone D: No samples from this zone was extracted.
Zone E: One sample, 1925 - 30 m, from this zone was extracted, showing agood abundance of extractable hydrocarbons.
The gas chromatogram of the saturated hydrocarbon fraction shows the strongabundance of hydrocarbons in the n-C,3 to n-C,,- area as found in the lowermostsample in zone C. A large unresolved sterane hump is also found for thissample, the heavy n-al.kanes, showing a high CPI value, is clearly distinguishedin this sample.
Zone F: Two samples from this zone were extracted both showing a richabundance of extractable hydrocarbons. The abundance of heavy n-alkanes
- 32 -
varies in the two samples. In the upper sample, 1970 - 1975 m, the heavyn-alkanes cannot be distinguished, while in the lowermost sample theheavy n-alkanes are yery pronounced with a high CPI value. This wouldindicate an input of mainly terrestic material and that the samples havebeen exposed to a various degree of bacteriological activity.
Most of the examined samples have signs of bacteriological activity,probably after sampling. In some of the samples this bacteriologicalactivity has been rather strong, and almost all the n-alkanes are destroyed,while it has a lighter degradation in other samples. Due to this theabundance of extractable hydrocarbons is less than the true value wouldbe, and these data are not reliable. In the source rock rating moreemphasis is put on the total organic carbon than normally in our evaluation.
Rock-Eva! Pyrolysis
A total of eighteen samples were pyrolysed on a Rock-Eval instrument.The analysed samples in zone A have a low hydrogen index and a yery highoxygen index, i.e. typical kerogen type III kerogen. The samples fromzone B and C have generally a hiyher hydrogen index than the samplesfrom Zone A, but still with a yery high oxygen index. These samples do,however, show a good petroleum index, in contrast to the samples fromzone A.
All the analysed samples from zone D, except the sample from 1965 -1970 m, have a low hydrogen index and a high oxygen index, which indicateskerogen type III.
Other analyses have shown these samples to be badly biodegraded, andthis would strongly effect the pyrolysis results. Due to this theamount of free hydrocarbons will be reduced at the same time as thehydrogen index and oxygen index will be affected. We would normally geta strong reduction in the S 2 readings, which will reduce the hydrogenindex at the same time as we would get an increase in the S~ readings,which will increase, the oxygen index. Due to this it is difficult todraw certain conclusions from these analyses apart from that zones A andF are definitely type III kerogen and that there are indications thatzone E is also probably of type III kerogen. Zone B and C are difficultto classify, but it is believed that these two zones are of type II
- 33 -
kerogen, and that the hydrogen index has been strongly reduced at the same
time as the oxygen index has been strongly increased due to bacteriological
activity.
The T m a x values are low for all the analysed samples, and the whole analysed
sequence must be classified as immature.
Vitrinite Reflectance
Sixteen samples were analysed for vitrinite reflectance. In the following
each sample is described, and together with the reflectance data, other
information from the analyses are given.
490 m: Shale, siltstone and carbonate, R = 0.36(9).
The sample has a low organic content with a good deal of bitumen staining
and wisps. Otherwise a few intertinite and reworked particles with a trace
of vitrinite. UV light shows a light orange fluorescence from spores and a
low exinite content.
1180 m: Calcareous shale, RQ = 0.35(21).
The sample has a low organic content, apart from overall bitumen staining.
Small particles of vitrinite with about equal proportions of inertinite and
reworked material. UV light shows a light orange fluorescence from spore
specks and a trace of exinite.
1320 m: Calcareous shale and carbonate, R = 0.34(21).
The sample contains small particles of vitrinite with about equal proportions
of reworked material and inertinite. Some bitumen staining and interstitial
material. UV light shows a light orange fluorescence from spore traces and
hydrocarbon specks together with a trace of exinite.
1470 m: Sandstone and siltstone, R = 0.41(15).
The sample contains some interstitial bitumen and staining. Otherwise
traces only of small particles of vitrinite and inertinite, mostly reworked.
UV light shows fluorescence from hydrocarbon traces and no definite exinite.
- 34 -
1535 m: Shale, RQ = 0.36(20).
The sample has a low organic content with some good particles of vitrinitewith about equal proportion of inertinite and reworked particles. UVlight shows yellow/orange to mid-orange fluorescence from spores, and atrace of exinite.
1595 m: Carbonate and pyrite, R =0.33 (21).
The sample which contains large pyrite masses, has a low organic contentwith a few loose coal fragments, wholly vitrinite plus some smallervitrinite particles. A little bitumen staining and interstitial areas.Some particles of inertinite and reworked material. UV light shows avariable carbonate fluorescence with hydrocarbon traces and light orangespores together with with a trace of exinite.
1645 m: Mixed lithologies, sandstone, shale and carbonate, Ro = 0.34(21).The sample has a low organic content with bitumen staining and interstitialareas. A few particles of reworked material and inertinite together witha trace of vitrinite particles. UV light shows a light orange fluorescencefrom spores and hydrocarbon traces together with a trace of exinite.
1695 m: Calcareous shale and silcstone, RQ = 0.29(9).The sample has a low organic content with bitumen staining. Smallparticles, mostly of inertinite and reworked material. Doubtful fragmentsof true vitrinite. UV light shows a light orange fluorescence fromspores and variable carbonate together with a low exinite content.
1750 m: Shale, RQ = 0.29(20).The sample has a low organic content with a few loose coal cuttings -wholly vitrinite. The shale contains a few small inertinite particlesand bitumen wisps. UV light shows a light orange fluorescence fromspores and variable carbonate together with a low to moderate exinitecontent.
1800 m: Shale', RQ = 0.34(20).The sample has a low to moderate organic content with bitumen particles,wisps and staining. Particles of inertinite and reworked materialtogether with a few particles of true vitrinite are recorded. UV lightshows a yellow to light orange fluorescence from spores and hydrocarbontraces together with a low to moderate exinite content.
- 35 -
1850 m: Calcareous shale, R = 0.39(21).The sample shows an overall bitumen staining, otherwise a low content ofsmall particles of vitrinite with reworked material and inertinitedominant. UV light shows a variable carbonate fluorescence plus lightand mid-orange fluorescence from spores together with a low exinitecontent.
1900 m: Calcareous shale, R = 0.35(22).
The sample has a low organic content. Particles of reworked material andinertinite are dominant, but with a good proportion of vitrinite asparticles and wisps. Bitumen wisps and heavy staining are recorded insome cuttings. UV light shows a light orange fluorescence from sporesand hydrocarbon traces together with a low exinite content.
1950 m: Calcareous shale, R = 0.36(22).The sample has a low organic content, with isolated particles and wispyparticles of vitrinite. A few coal fragments, wholly vitrinite. Only atrace of inertinite. UV light shows a light orange fluorescence fromspores and a low exinite content.
2000 m: Calcareous shale and siltstone, RQ = 0.35(20).The sample has a low - moderate organic content, yery variable. A fewinertinite and reworked particles, loose coal and vitrinite fragment.
Variable bitumen staining and wisps. A few particles of vitrinite. UVlight shows a light orange fluorescence from spores and a low exinitecontent.
2035 m: Mixed lithologies, RQ = 0.39(21).The sample contains a few loose coal fragments and a few inertinite andreworked particles. Most of the measurements are on loose material. UVlight shows a light orange fluorescence from spores and a trace ofexinite.
2060 m: Sandstone, RQ = 0.35(15).Interstitial bitumen,- but measurements on loose coal fragments andvitrinite particles in a few shale fragments. Graphite plentiful indrilling grease. UV light shows fluorescence from hydrocarbon traces anda yellow/orange fluorescence from spores together with a trace ofexinite.
- 36 -
Visual Kerogen
Fiftytwo samples were processed for palynological investigations and forevaluation of palynofacies/kerogen composition and colour/maturity ofthis well.
Three main intervals can be distinguished, 1530 - 1665 m, 1675 - 1930 m,and 1940 - 2060 i, but further subdivision is possible.
1530 m to 1605 m:Sapropel is dominant in the interval. But terrestic remains, mostlyindeterminate finely dispersed material, form up to 50 % in the samplesbetween 1585 m and 1605 m. Dark coal fragments are present and indicatereworking in most samples.Colour index: -2 down to 1545 m, 2 from 1555 to 1605 m.
1615 m to 1665 m:
Herbaceous material is in part dominating in this interval of finelydispersed residues. Aggregates indicate presence of carbonate. Up to20 % coaly fragments were noted in some of the samples.Colour index: -2/2. Probably a low energy marine area close to coast.
1675 m to 1750 m:Fairly small residues dominated by sapropel. Aggregates are commonbetween 1705 m and 740 m. 1750 m is distinguished by slightly coarserherbaceous material and includes cuticular fragments.Colour index: 2.
1760 m to 1780 m:
Rich residues which are dominated by sapropel obscuring other fossils.Aggregates are present. /Colour index: 2+. Apparently slightly increased compared with the aboveinterval.
1790 m to 1890 m: •Sapropel dominates. Palynomorphs are fairly common and are well preservedespecially in the interval 1870 n to 1890 m, which also containscuticular fragments.
- 37 -
Colour index: 2. Probably a low energy marine area of deposition.
1910 m to 1930 m:
Sapropel seems dominant, but the residues are rich in undissolvedminerals beside a minor part of terrestric remains.Colour index: 2/2+. Perhaps a slightly too high index due to oxidationin a more high energy zone of deposition.
1940 m to 1960 m:Sapropel is dominant. About 20 % terrestric material includes cuticlesas well as woody remains and indeterminate herbaceous material. Theremains seem sapropelized.Colour index: 2/2+.
1970 m to 2060 m:
The interval is evaluated as dominated by terrestric material, eitherindeterminate herbaceous or woody. However, sapropel seems to dominatein some of the uppermost samples, but this may represent downfall fromhigher in the well.
Undissolved minerals disturb most residues especially from 2010 m to2060 m.
Colour index: 2/2+, higher possibly due to oxidation between 2020 m and
2030 m.
Source Rock Evaluation
On the background of the above results, the whole analysed sequence ofthe well would be classified as immature.
Based on total organic carbon measurements, the analysed sequence isdivided into four zones which will be given the following rating.
Zone A: 1530 - 1730 m: This zone ,is lean both in total organic carbonand extractable hydrocarbons, and with a relatively large abundance ofterrestric material in the kerogen concantrate. With the background inthe described analyses it will be rated to have a fair or fair/goodpotential as a source rock for gas.
- 38 -
Zone B: 1735 - 1820 m: This zone has a far greater abundance oforganic carbon while the abundance of extractable hydrocarbons are low,probably due to bacteriological activity. The kerogen is almost 100 %sapropelic. This zone will be rated to have a rich potential as a sourcerock for oil and gas.
Zone C: 1825 - 1900 m: The abundance of organic carbon in this zone isfar lower than in zone B, while the kerogen is found to be similar, i.e.mainly sapropelic. This zone will then be rated to have a good potentialas a source rock for oil and gas.
Zone D: 1905 - 1920 m: This zone consists mainly of sand- and siltstone.Fluorescing hydrocarbons indicate migrated hydrocarbons in the sand -siltstone sequence.
Zone E: 1925 - 1960 m: The upper part of this zone has a kerogencomposition as zones B and C, while in the lower part of the zone thekerogen shows a larger input of terrestric material. On the background ofthese results, this zone will be rated to have a good to rich potentialas a source rock for gas and oil.
Zone F: 1960 - 2060 m: The main part of this zone consists of sandstonewith some thin claystone lenses. The visual kerogen examination showsthese to contain large proportions of terrestric material. The claystonein this zone has a good potential as a source rock for gas. Fluorescinghydrocarbons indicate migrated hydrocarbons in some of the sandstonelenses.
- 39 -
TABLE I
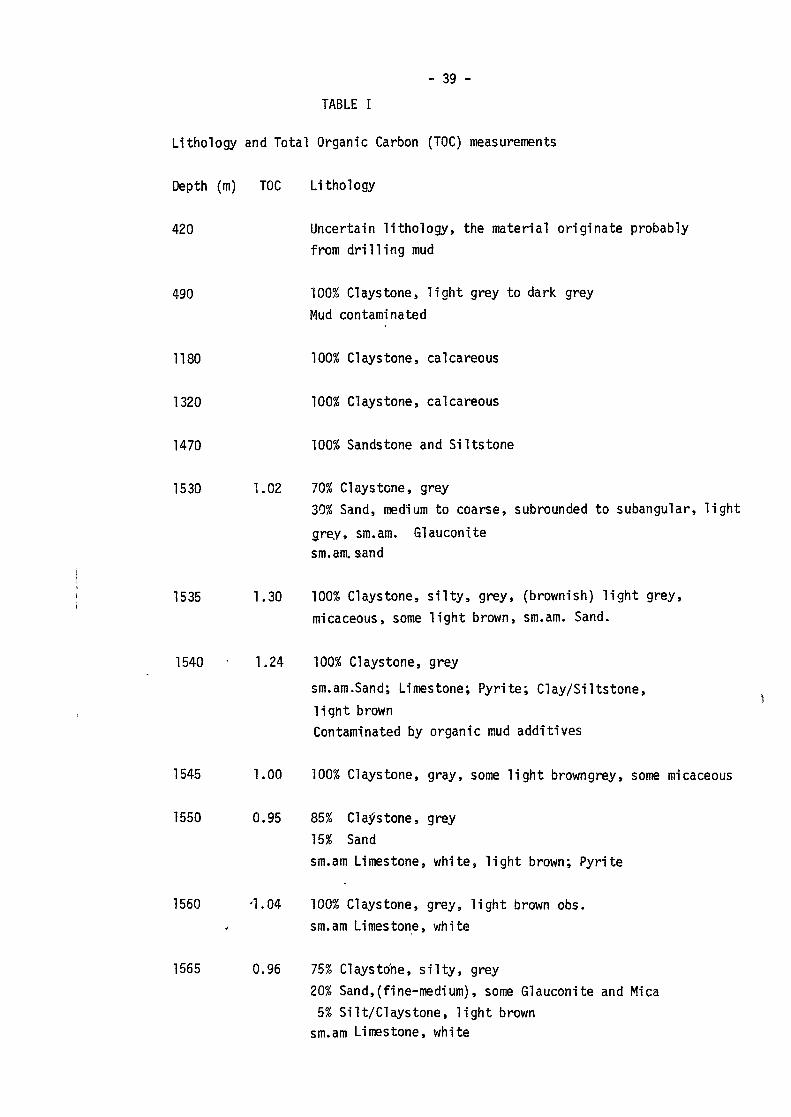
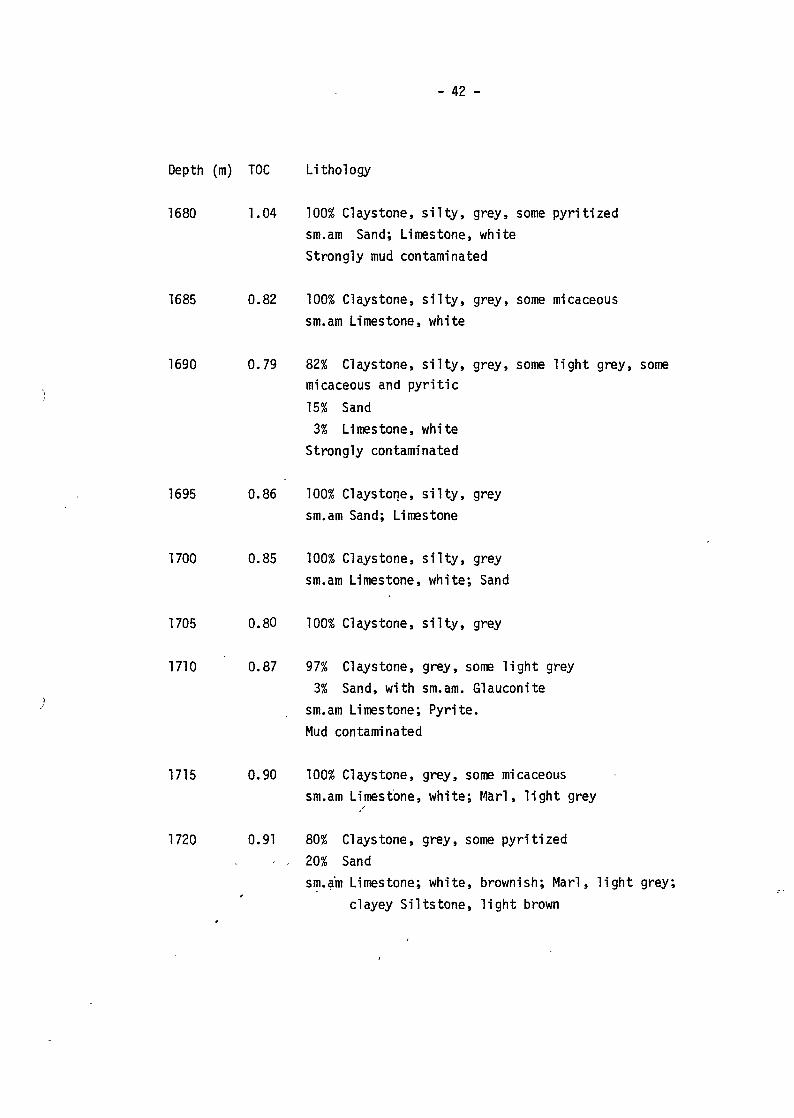
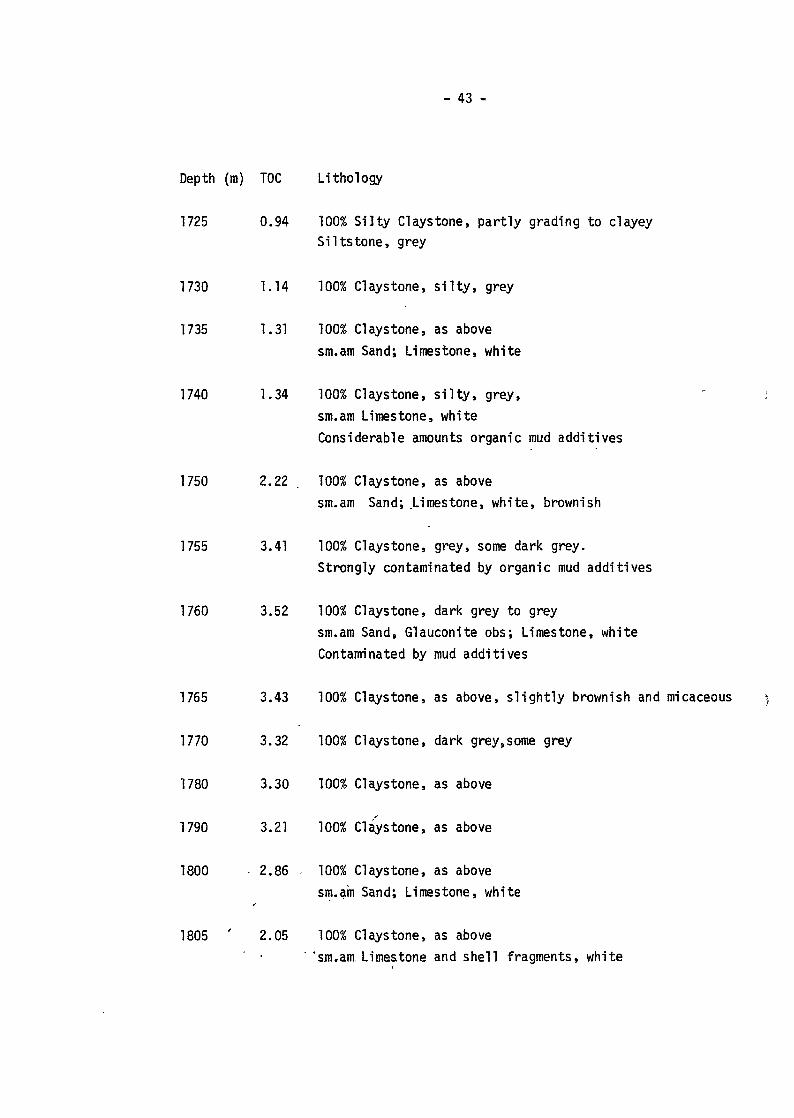
Lithology and Total Organic Carbon (TOC) measurements
Depth (m) TOC Lithology
420 Uncertain lithology, the material originate probably
from drilling mud
490 100% Claystone, light grey to dark grey
Mud contaminated
1180 100% Claystone, calcareous
1320 100% Claystone, calcareous
1470 100% Sandstone and Siltstone
1530 1.02 70% Claystone, grey
30% Sand, medium to coarse, subrounded to subangular, lightgrey, sm.am. Glauconitesm.am. aand
1535 1.30 100% Claystone, silty, grey, (brownish) light grey,micaceous, some light brown, sm.am. Sand.
1540 • 1.24 100% Claystone, grey
sm.am.Sand; Limestone; Pyrite; Clay/Si 1tstone,light brownContaminated by organic mud additives
1545 1.00 100% Claystone, gray, some l i gh t browngrey, some micaceous
1550 0.95 85% Claystone, grey
15% Sand
sm.am Limestone, white, l i gh t brown; Pyrite
1560 '1.04 100% Claystone, grey, l i gh t brown obs.
sm.am Limestone, white
1565 0.96 75% Claystone, s i l t y , grey
20% Sand,(fine-medium), some Glauconite and Mica5% Sil t /Claystone, l i gh t brown
sm.am Limestone, white
- 40 -
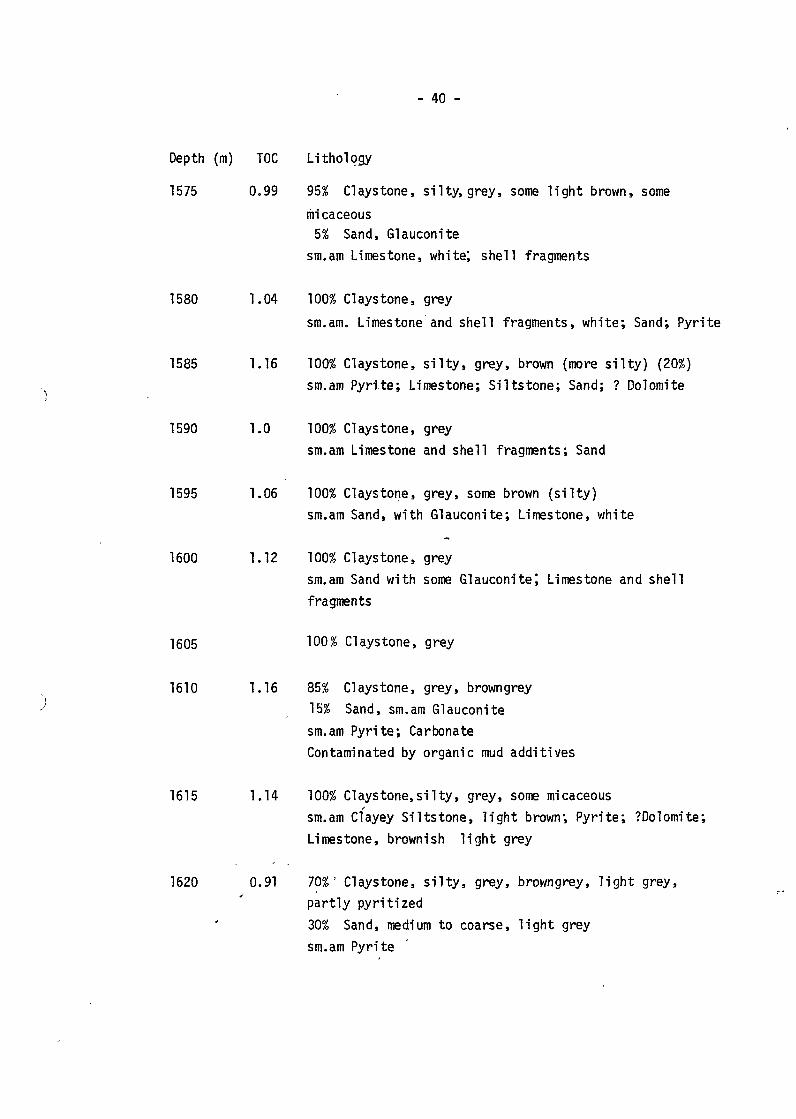
Depth (m) TOC Lithology
1575 0.99 95% Claystone, silty, grey, some light brown, some
micaceous5% Sand, Glauconite
sm.am Limestone, white; shell fragments
1580 1.04 100% Claystone, grey
sm.am. Limestone and shell fragments, white; Sand; Pyrite
1585 1.16 100% Claystone, s i l t y , grey, brown (more s i l t y ) (20%)
sm.am Pyr i te; Limestone; Si l tstone; Sand; ? Dolomite
1590 1.0 100% Claystone, grey
sm.am Limestone and shell fragments; Sand
1595 1.06 100% Claystone, grey, some brown ( s i l t y )
sm.am Sand, with Glauconite; Limestone, white
1600 1.12 100% Claystone, grey
sm.am Sand with some Glauconite; Limestone and shell
fragments
1605 100% Claystone, grey
1610 1.16 85% Claystone, grey, browngrey
15% Sand, sm.am Glauconite
sm.am Pyr i te; Carbonate
Contaminated by organic mud additives
1615 1.14 100% Claystone,si l ty, grey, some micaceous
sm.am Clayey Si l tstone, l i gh t brown; Pyr i te; ?Dolomite;
Limestone, brownish l i gh t grey
1620 0.91 70%' Claystone, s i l t y , grey, browngrey, l i gh t grey,partly pyrit ized
30% Sand, medium to coarse, l ight grey
sm.am Pyrite
- 41 -
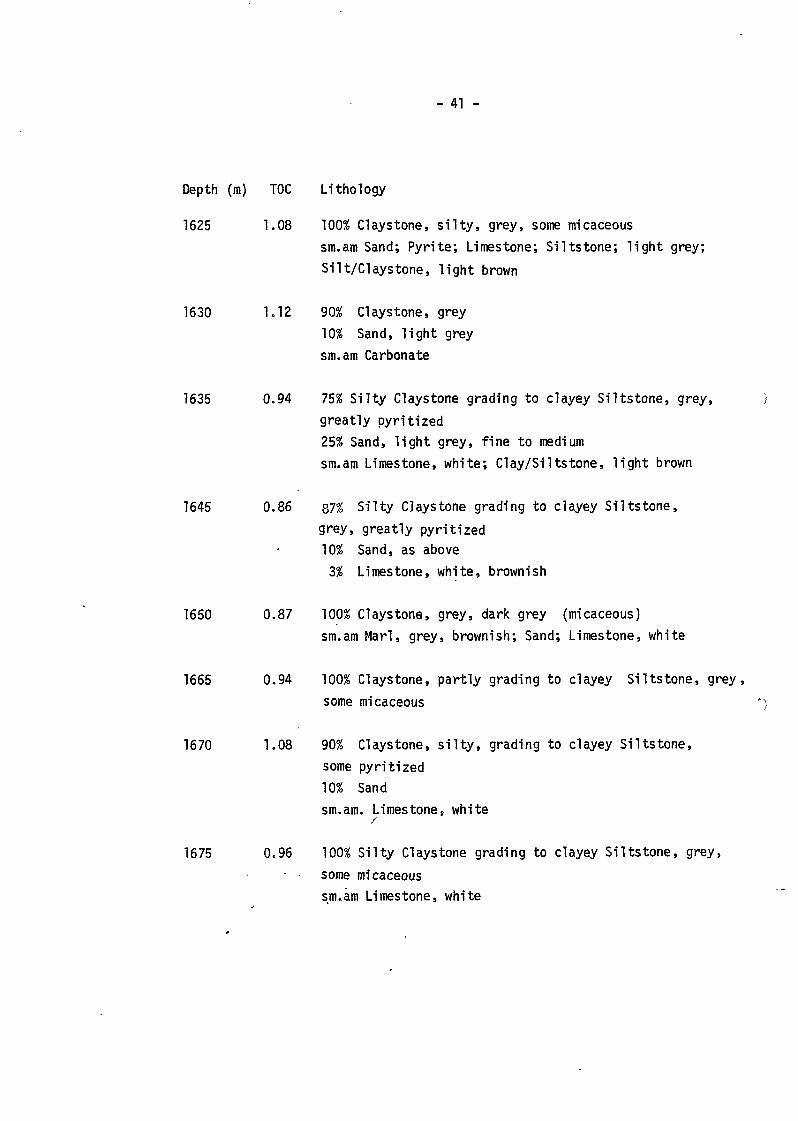
Depth (ra) TOC Lithology
1625 1.08 100% Claystone, s i l t y , grey, some micaceous
sm.am Sand; Pyr i te; Limestone; Si l tstone; l i gh t grey;
Si It/Claystone, l igh t brown
1630 1.12 90% Claystone, grey
10% Sand, l igh t grey
sm.am Carbonate
1635 0.94 75% S i l t y Claystone grading to clayey Si l tstone, grey, )
greatly pyri t ized25% Sand, l i gh t grey, f ine to mediumsm.am Limestone, white; Clay/Si I tstone, l igh t brown
1645 0.86 87% S i l t y Claystone grading to clayey Si l tstone,
grey, greatly pyrit ized10% Sand, as above3% Limestone, white, brownish
1650 0.87 100% Claystone, grey, dark grey (micaceous)
sm.am Marl, grey, brownish; Sand; Limestone, white
1665 0.94 100% Claystone, partly grading to clayey Si l tstone, grey,
some micaceous *}
1670 1.08 90% Claystone, silty, grading to clayey Siltstone,some pyritized10% Sandsm.am. Limestone, white
1675 0.96 100% Silty Claystone grading to clayey Siltstone, grey,
- • some micaceoussnuam Limestone, white
- 42 -
Depth (m) TOC Lithology
1680 1.04 100% Claystone, s i l t y , grey, some pyr i t ized
sm.am Sand; Limestone, white
Strongly mud contaminated
1685 0.82 100% Claystone, s i l t y , grey, some micaceous
sm.am Limestone, white
1690 0.79 82% Claystone, s i l t y , grey, some l igh t grey, some
micaceous and py r i t i c
15% Sand
3% Limestone, white
Strongly contaminated
1695 0.86 100% Claystone, s i l t y , grey
sm.am Sand; Limestone
1700 0.85 100% Claystone, s i l t y , grey
sm.am Limestone, white; Sand
1705 0.80 100% Claystone, s i l t y , grey
1710 0.87 97% Claystone, grey, some l i gh t grey
3% Sand, with sm.am. Glauconite
sm.am Limestone; Pyri te.
Mud contaminated
1715 0.90 100% Claystone, grey, some micaceous
sm.am Limestone, white; Marl, l i gh t grey
1720 0.91 80% Claystone, grey, some pyr i t ized
- . 20% Sand
sm.am Limestone; white, brownish; Marl, l i gh t grey;
clayey Si l tstone, l i gh t brown
- 43 -
Depth (ra) TOC Lithology
1725 0.94 100% S i l t y Claystone, part ly grading to clayeySi I ts tone, grey
1730 1.14 100% Claystone, s i l t y , grey
1735 1.31 100% Claystone, as above
sm.am Sand; Limestone, white
1740 1.34 100% Claystone, s i l t y , grey,
sm.ara Limestone, white
Considerable amounts organic mud additives
1750 2.22 100% Claystone, as above
sm.am Sand; .Limestone, white, brownish
1755 3.41 100% Claystone, grey, some dark grey.
Strongly contaminated by organic mud additives
1760 3.52 100% Claystone, dark grey to grey
sm.am Sand, Glauconite obs; Limestone, white
Contaminated by mud additives
1765 3.43 100% Claystone, as above, s l i gh t l y brownish and micaceous
1770 3.32 100% Claystone, dark grey,some grey
1780 3.30 100% Claystone, as above
1790 3.21 100% Claystone, as above
1800 2.86 100% Claystone, as above
sm.am Sand; Limestone, white
1805 ' 2.05 100% Claystone, as above
' 'SJTI.am. Limestone and shell fragments, white
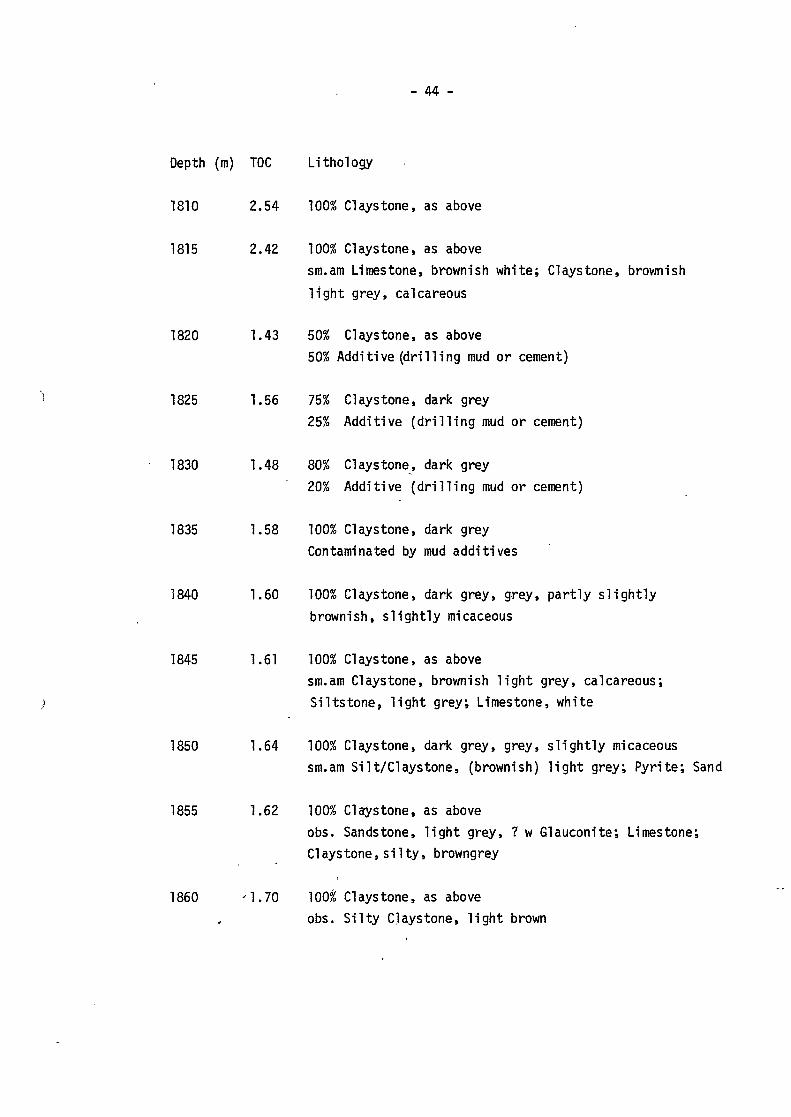
- 44 -
Depth (m) TOC Lithology
1810 2.54 100% Claystone, as above
1815 2.42 100% Claystone, as above
sm.am Limestone, brownish white; Claystone, brownish
l i gh t grey, calcareous
1820 1.43 50% Claystone, as above
50% Additive (d r i l l i ng mud or cement)
1825 1.56 75% Claystone, dark grey
25% Additive ( d r i l l i n g mud or cement)
1830 1.48 80% Claystone, dark grey
20% Additive ( d r i l l i n g mud or cement)
1835 1.58 100% Claystone, dark grey
Contaminated by mud additives
1840 1.60 100% Claystone, dark grey, grey, part ly s l i gh t l y
brownish, s l i gh t l y micaceous
1845 1.61 100% Claystone, as above
sm.am Claystone, brownish l i gh t grey, calcareous;
Si l ts tone, l i gh t grey; Limestone, white
1850 1.64 100% Claystone, dark grey, grey, s l i gh t l y micaceous
sm.am Sil t /Claystone, (brownish) l i gh t grey; Pyr i te ; Sand
1855 1.62 100% Claystone, as above
obs. Sandstone, l i gh t grey, ? w Glauconite; Limestone;
Claystone, s i l t y , browngrey
1860 '1.70 100% Claystone, as aboveobs. Si l ty Claystone, l i gh t brown
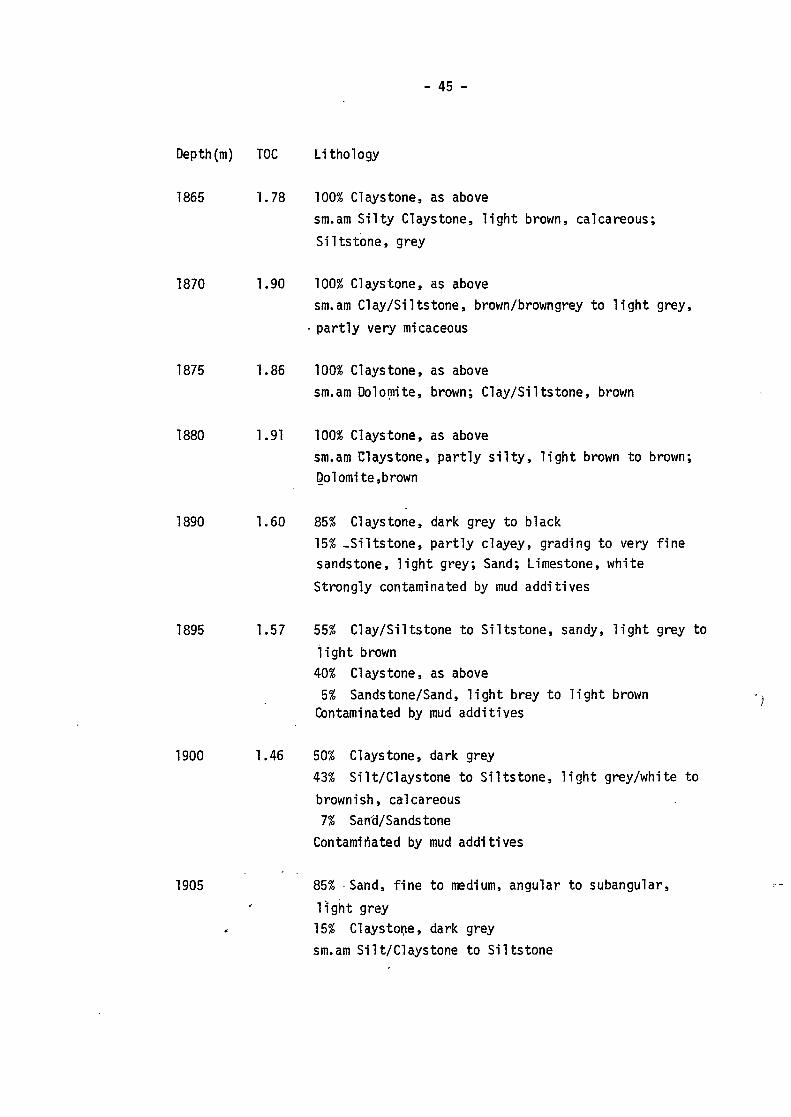
- 45 -
Depth(m) TOC Lithology
1865 1.78 100% Claystone, as abovesm.am Silty Claystone, light brown, calcareous;Siltstone, grey
1870 1.90 100% Claystone, as abovesm.am Clay/SiItstone, brown/browngrey to light grey,
• partly very micaceous
1875 1.86 100% Claystone, as abovesm.am Dolomite, brown; Clay/Siltstone, brown
1880 1.91 100% Claystone, as abovesm.am Claystone, partly s i l t y , light brown to brown;Dolomite,brown
1890 1.60 85% Claystone, dark grey to black15% -.Siltstone, partly clayey, grading to very finesandstone, light grey; Sand; Limestone, whiteStrongly contaminated by mud additives
1895 1.57 55% Clay/Siltstone to Si l tstone, sandy, l i gh t grey to
l igh t brown40% Claystone, as above5% Sandstone/Sand, light brey to light brown
Contaminated by mud additives
1900 1.46 50% Claystone, dark grey43% Silt/Claystone to Siltstone, light grey/white tobrownish, calcareous7% Sand/Sandstone
Contaminated by mud additives
1905 85% Sand, fine to medium, angular to subangular,
light grey15% Claystone, dark greysm.am Silt/Claystone to Siltstone
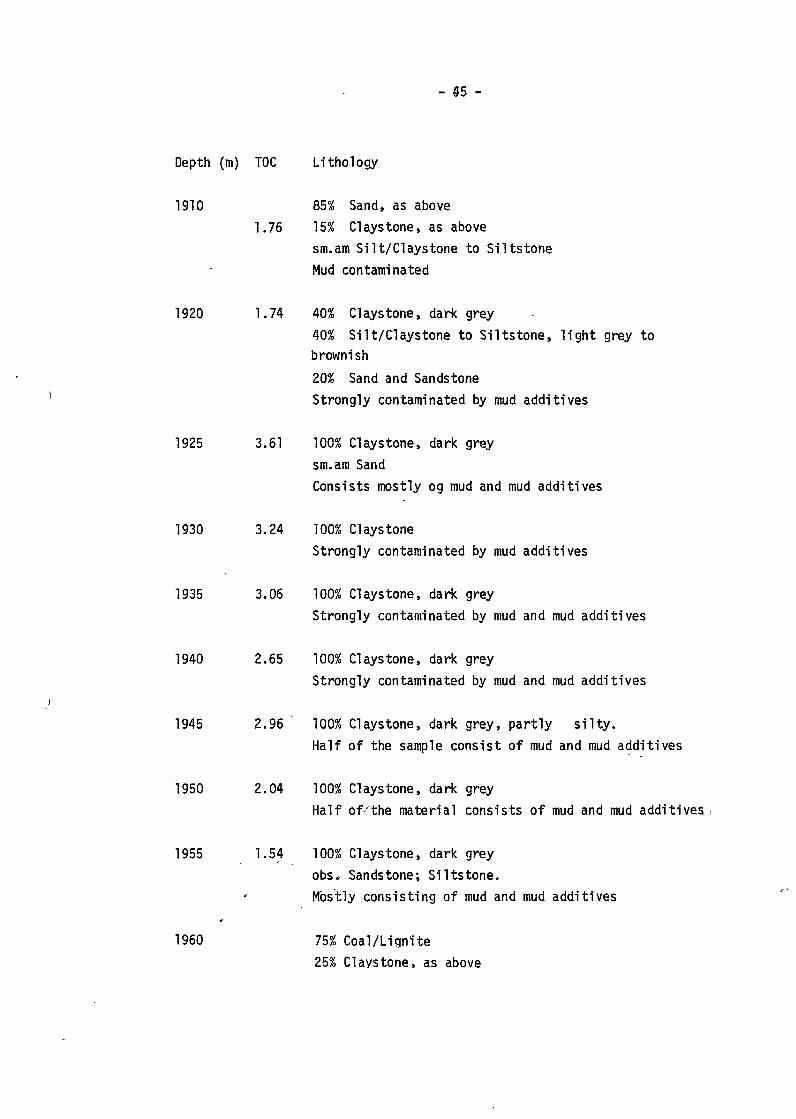
Depth (m) TOC Lithoiogy
1910 85% Sand, as above1.76 15% Claystone, as above
sin.am Silt/Claystone to SiltstoneMud contaminated
1920 1.74 40% Claystone, dark grey40% Si It/Claystone to Siltstone, light grey tobrownish
20% Sand and SandstoneStrongly contaminated by mud additives
1925 3.61 100% Claystone, dark greysm.am SandConsists mostly og mud and mud additives
1930 3.24 100% ClaystoneStrongly contaminated by mud additives
1935 3.06 100% Claystone, dark greyStrongly contaminated by mud and mud additives
1940 2.65 100% Claystone, dark greyStrongly contaminated by mud and mud additives
1945 2.96 100% Claystone, dark grey, partly silty.Half of the sample consist of mud and mud additives
1950 2.04 100% Claystone, dark greyHalf of-'the material consists of mud and mud additives.
1955 1.54 100% Claystone, dark greyobs- Sandstone-, Siltstone.Mostly consisting of mud and mud additives
1960 75% Coal/Li gni te25% Claystone, as above
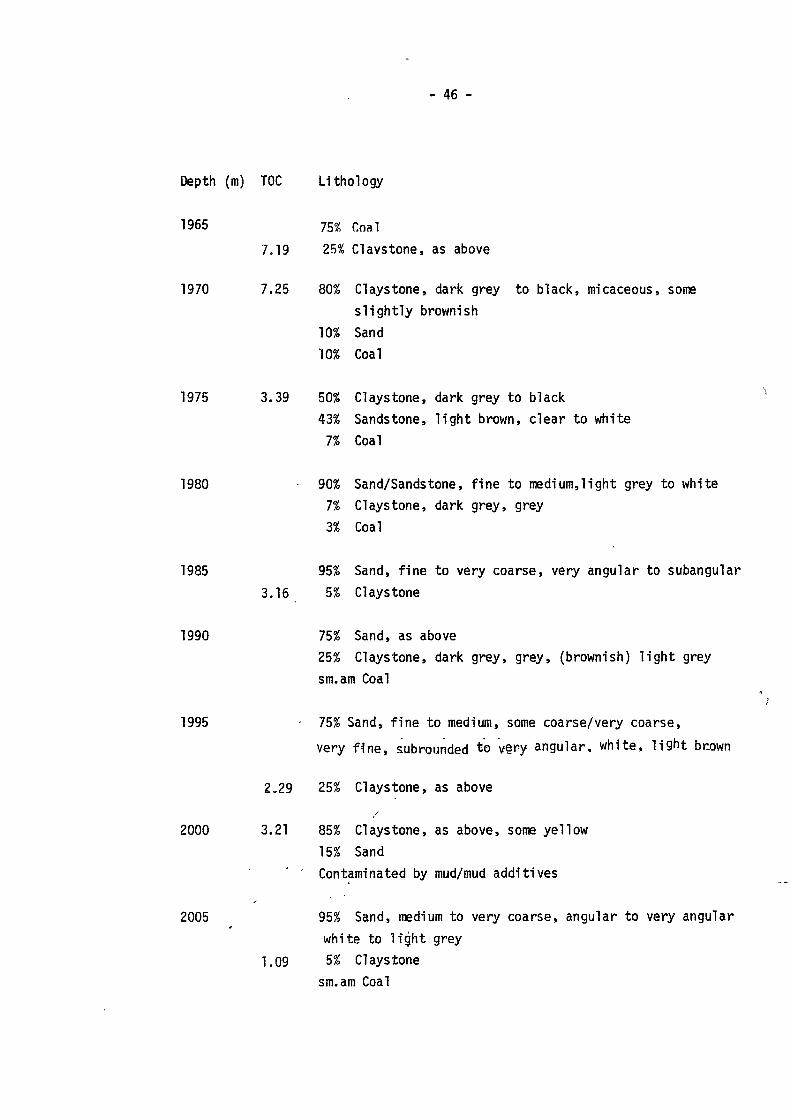
- 46 -
Depth (m) TOC Lithology
1965 755!! Cnal
7.19 25°/ Cl avs tone, as above
1970 7.25 80% Claystone, dark grey to black, micaceous, someslightly brownish
10% Sand10% Coal
1975 3.39 50% Claystone, dark grey to black43% Sandstone, l ight brown, clear to white
7% Coal
1980 90% Sand/Sandstone, fine to medium,light grey to white7% Claystone, dark grey, grey3% Coal
1985 95% Sand, fine to very coarse, very angular to subangular
3.16 5% Claystone
1990 75% Sand, as above25% Claystone, dark grey, grey, (brownish) l ight greysm.am Coal
*/
1995 • 75% Sand, fine to medium, some coarse/very coarse,
very fine, subrounded to vefy angular, white, l ight bnown
2.29 25% Claystone, as above
2000 3.21 85% Claystone, as above, some yellow15% SandContaminated by mud/mud additives
2005 95% Sand, medium to very coarse, angular to very angularwhite to l ight grey
1.09 5% Claystonesm.am Coal
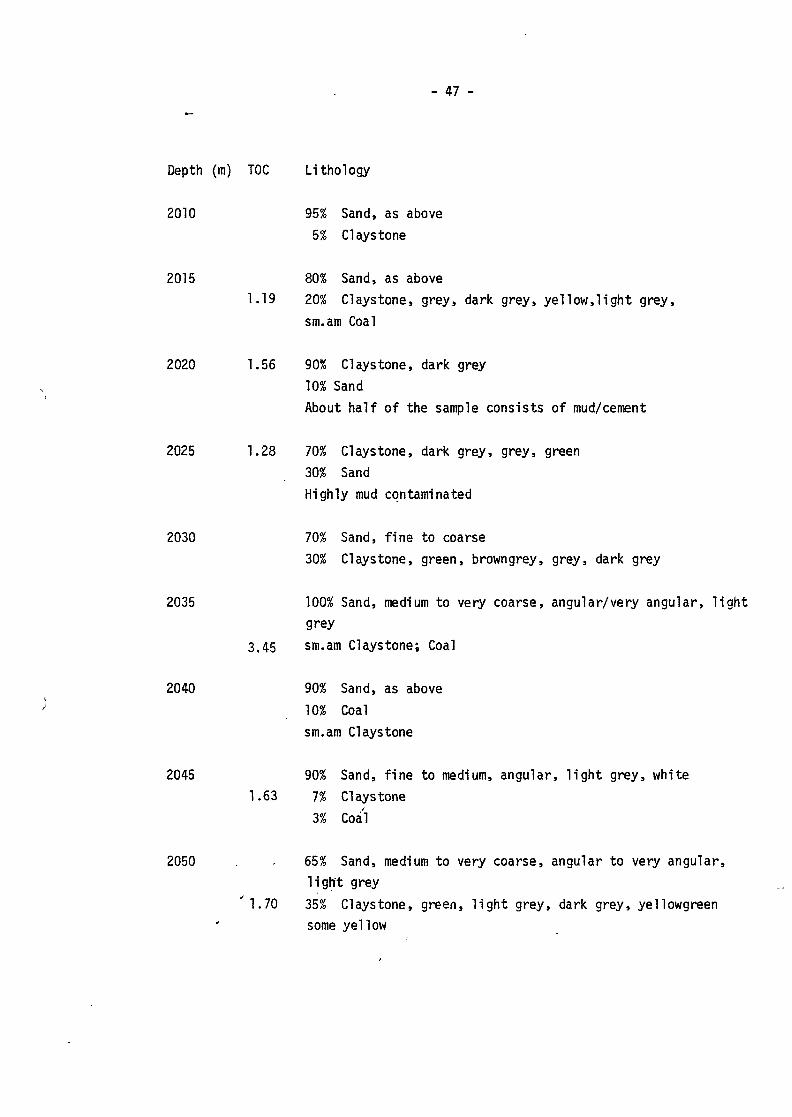
- 47 -
Depth (m) TOC Lithoiogy
2010 95% Sand, as above
5% Claystone
2015 80% Sand, as above
20% Clays
sm.am Coal
80% Sand, as above
1.19 20% Claystone, grey, dark grey, y e l l o w , l i g h t grey,
sm.am Coal
2020 1.56 90% Claystone, dark grey10% SandAbout half of the sample consists of mud/cement
2025 1.28 70% Claystone, dark grey, grey, green
30% Sand
Highly mud contaminated
2030 70% Sand, f ine to coarse
30% Claystone, green, browngrey, grey, dark grey
2035 100% Sand, medium to very coarse, angular/very angular, l i g h t
grey
3.45 sm.am Claystone; Coal
2040 90% Sand, as above
10% Coal
sm.am Claystone
2045 90% Sand, f ine to medium, angular, l i g h t grey, white
1.63 7% Claystone
3% Coal
2050 . - 65% Sand, medium to very coarse, angular to very angular,
l i g h t grey
' 1 . 7 0 35% Claystone, green, l i g h t grey, dark grey, yellowgreen
some yellow
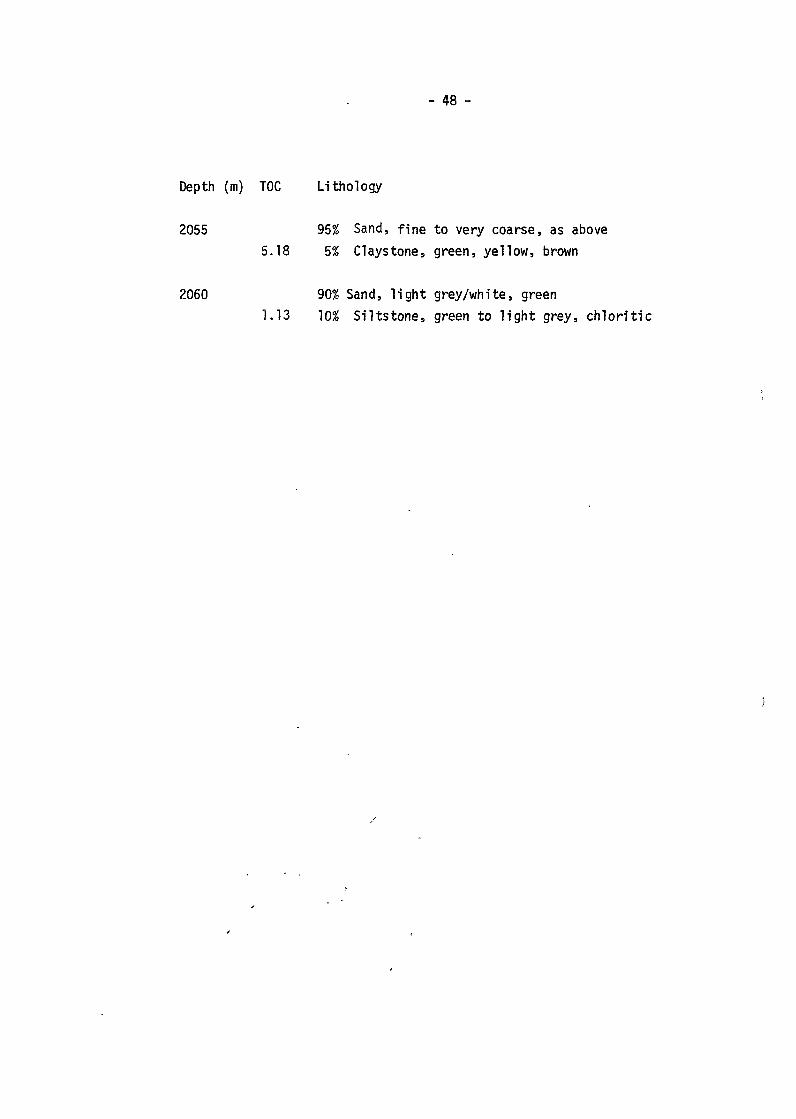
- 48 -
Depth (m) TOC Lithology
2055 95% Sand, fine to very coarse, as above5.18 5% Claystone, green, yellow, brown
2060 90% Sand, light grey/white, green1.13 10% Siltstone, green to light grey, chloritic
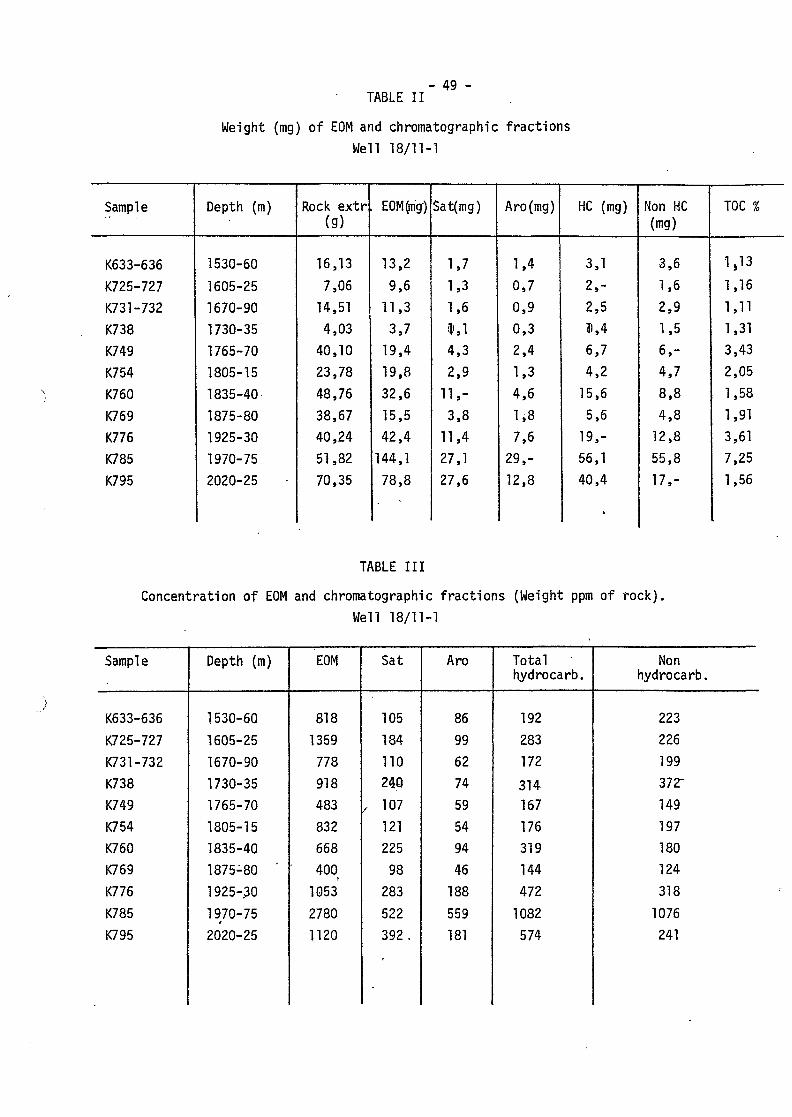
- 49 -TABLE II
Weight (mg) of EOM and chromatographic fractionsWell 18/11-1
Sample
K633-636
K725-727
K731-732
K738
K749
K754
K760
K769
K776
K785
K795
Depth (m)
1530-60
1605-25
1670-90
1730-35
1765-70
1805-15
1835-40
1875-80
1925-30
1970-75
2020-25
Rock ex t r(g)
16,13
7,06
14,51
4,03
40,10
23,78
48,76
38,67
40,24
51,82
70,35
EOM (nig)
13,2
9,6
11,3
3,7
19,4
19,8
32,6
15,5
42,4
144,1
78,8
Sat(mg)
1,7
1,3
1,6
s?,l
4,3
2,9
1 1 , -
3,8
11,4
27,1
27,6
Aro(mg)
1,40,7
0,9
0,3
2,4
1,34,6
1,87,6
29, -
12,8
HC (mg)
3,1
2,-2,5
3),4
6,7
4,2
15,6
5,6
19,-
56,1
40,4
Non HC(mg)
3,6
1,6
2,9
1,5
6,-4,7
8,8
4,8
12,8
55,8
17,-
TOC %
1,13
1,16
1,111,313,43
2,05
1,58
1,913,617,25
1,56
TABLE II I
Concentration of EOM and chromatographic fractions (Weight ppm of rock).
Well 18/11-1
Samp!e
K633-636
K725-727
K731-732
K738
K749
K754
K760
K769
K776
K785
K795
Depth (m)
1530-60
1605-25
1670-90
1730-35
1765-70
1805-15
1835-40
1875-80
1925-30
1970-75
2020-25
EOM
818
1359
778
918
483
832
668
' 400
1053
2780
1120
Sat
105
184
110240
, 107
121
225
98
283
522
392,
Aro
86
99
62
74
59
54
94
46
188
559
181
Totalhydrocarb.
192
283
172
314167
176
319
144
472
1082
574
Nonhydrocarb.
223
226
199
372"
149
197180
124
318
1076
241
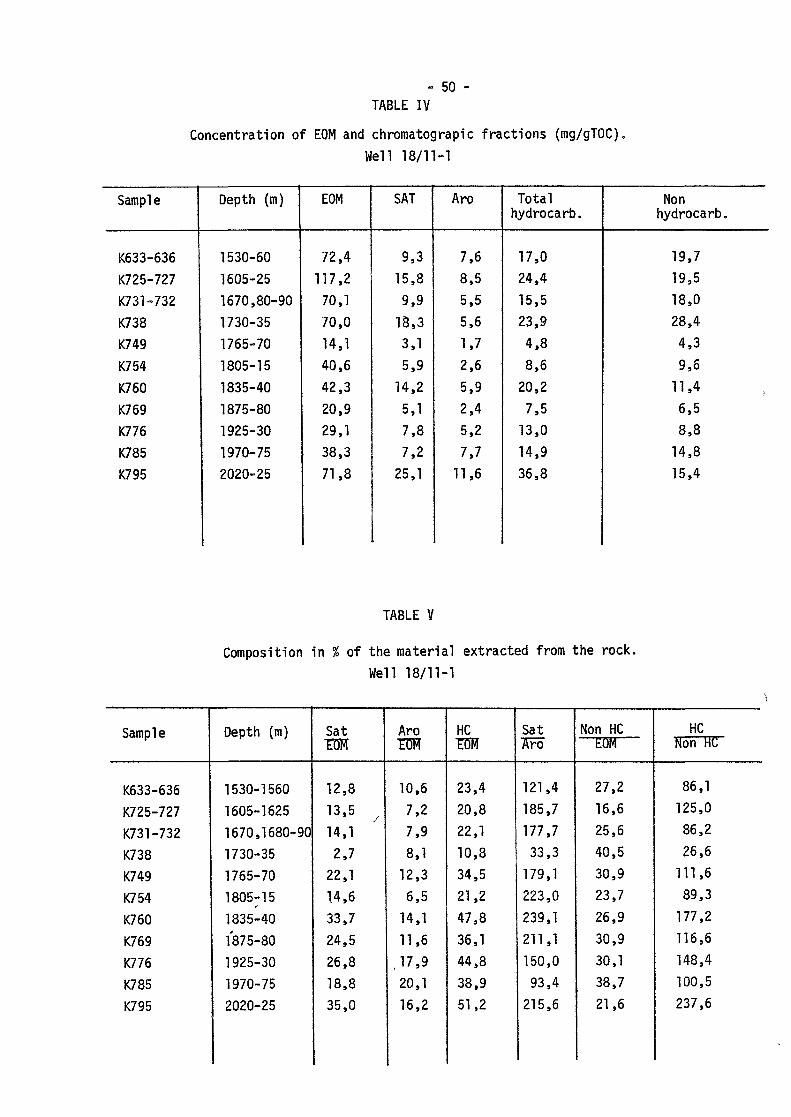
- 50 -TABLE IV
Concentration of EOM and chromatograpic f rac t ions (mg/gTOC)
Well 18/11-1
Sample
K633-636
K725-727
K731-732
K738
K749
K754
K760
K769
K776
K785
K795
Depth (m)
1530-60
1605-25
1670,80-90
1730-35
1765-70
1805-15
1835-40
1875-80
1925-30
1970-75
2020-25
EOM
72,4
117,2
70,1
70,0
14,1
40,6
42,3
20,9
29,1
38,3
71,8
SAT
9,3
15,8
9,9
18,3
3,15,9
14,2
5,17,8
7,2
25,1
Aro
7,6
8,5
5,5
5,6
1,7
2,6
5,9
2,4
5,2
7,7
11,6
Totalhydrocarb.
17,0
24,4
15,5
23,9
4,8
8,6
20,2
7,5
13,0
14,9
36,8
Nonhydrocarb.
19,7
19,5
18,0
28,4
4,3
9,6
11,4
6,5
8,8
14,8
15,4
TABLE V
Composition in % of the material extracted from the rock.
Well 18/11-1
Sample
K633-636
K725-727
K731-732
K738
K749
K754
K760
K769
K776
K785
K795
Depth (m)
1530-1560
1605-1625
1670,1680-90
1730-35
1765-701805;15
1835-40
1875-801925-30
1970-75
2020-25
SatIDH
12,8
13,5
14,12,7
22,1
14,6
33,7
24,5
26,8
18,8
35,0
AroTOR
10,6
7,2
7,98,1
12,3
6,5
14,111,6
,17,9
20,1
16,2
HC"EM
23,4
20,8
22,1
10,8
34,5
21,2
47,8
36,1
44,8
38,9
51,2
SatI r o
121,4
185,7
177,7
33,3
179,1
223,0
239,1
211,1
150,0
93,4
215,6
Non HCtUM
27,2
16,6
25,6
40,5
30,9
23,7
26,9
30,9
30,1
38,7
21,6
HCNon HC
86,1
125,0
86,2
26,6
111,6
89,3
177,2
116,6
148,4
100,5
237,6
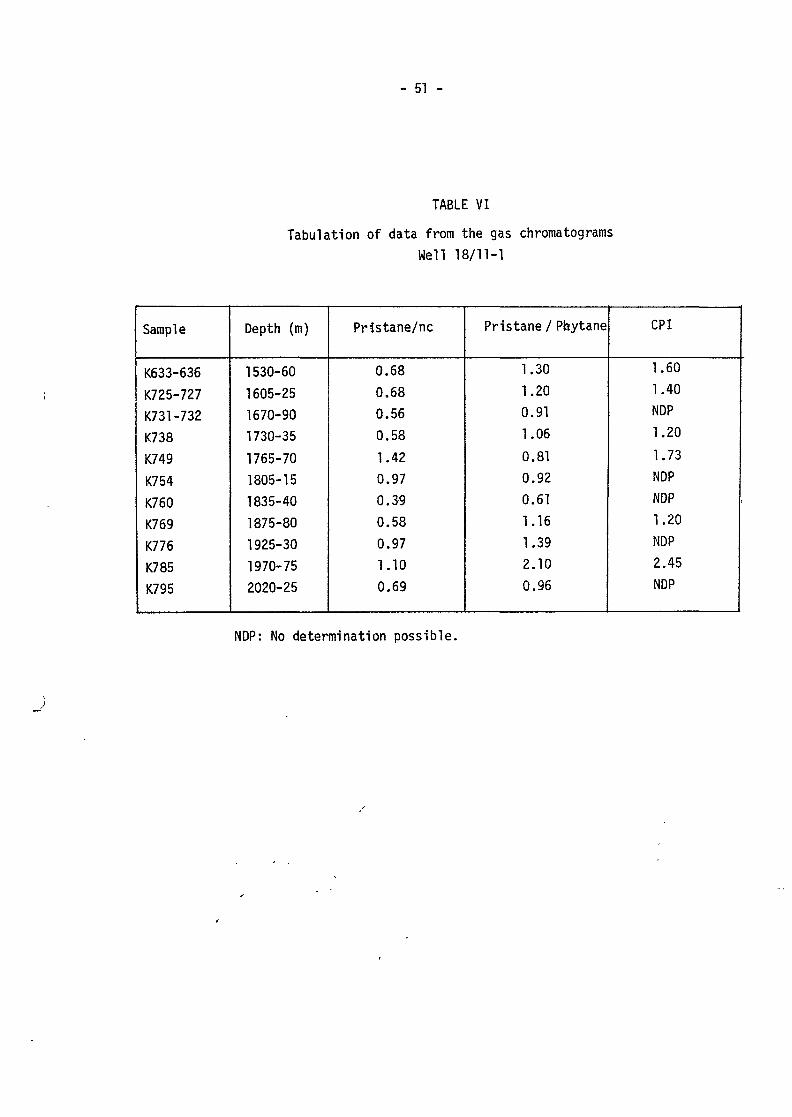
- 51 -
TABLE VI
Tabulation of data from the gas chromatogramsWell 18/11-1
Sample
K633-636
K725-727
K731-732
K738
K749
K754
K760
K769
K776
K785
K795
Depth (m)
1530-60
1605-25
1670-90
1730-35
1765-70
1805-15
1835-40
1875-80
1925-30
1970-75
2020-25
PHstane/nc
0.68
0.68
0.56
0.58
1.42
0.97
0.39
0.58
0.97
1.10
0.69
Pristane / Pbytane
1.30
1.20
0.91
1.06
0.81
0.92
0.61
1.16
1.39
2.10
0.96
CPI
1.60
1.40
NDP1.20
1.73
NDP
NDP
1.20
NDP
2.45
NDP
NDP: No determination possible.
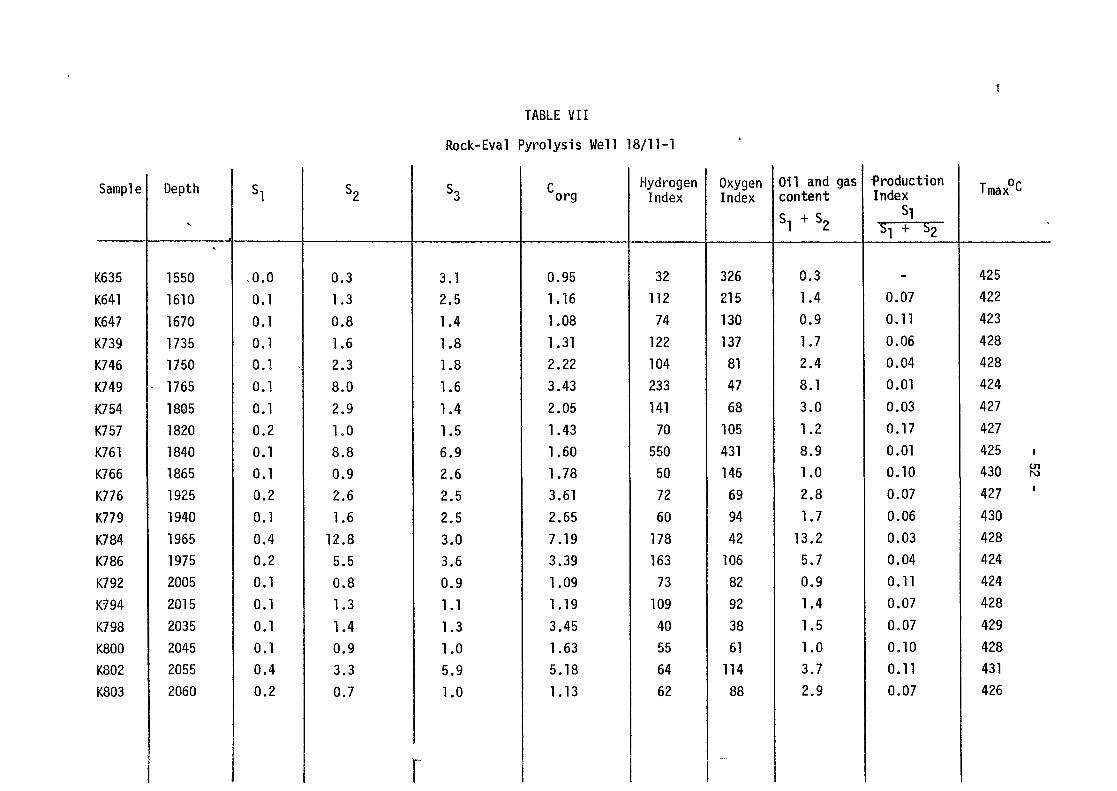
TABLE VII
Rock-Eval Pyrolysis Well 18/11-1
Sample
K635
K641
K647
K739
K746
K749
K754
K757
K761
K766
K776
K779
K784
K786
K792
K794
K798
K800
K802
K803
Depth
1550
1610
1670
1735
1750
- 1765
1805
1820
1840
1865
1925
1940
1965
1975
2005
2015
2035
2045
2055
2060
S l
-0.0
0.1
0.1
0.1
0.1
0.1
0.1
0.2
0.1
0.1
0.2
0.1
0.40.2
0.1
0.1
0.1
0.1
0.4
0.2
S2
0.3
1.3
0.8
1.6
2.3
8.0
2.9
1.0
8.8
0.9
2.6
1.6
12.8
5.5
0.8
1.3
1.4
0.9
3.3
0.7
S3
3.1
2.5
1.4
1.8
1.8
1.6
1.4
1.5
6.9
2.6
2.5
2.5
3.0
3.6
0.9
1.1
1.3
1.0
5.9
1.0
r
org
0.95
1.16
1.08
1.31
2.22
3.43
2.05
1.43
1.60
1.78
3.61
2.65
7.19
3.39
1.09
1.19
3.45
1.63
5.18
1.13
HydrogenIndex
32
112
74
122
104
233
141
70
550
50
72
60
178
163
73
109
40
55
64
62
OxygenIndex
326
215
130
137
81
47
68
105
431
146
69
94
42
106
82
92
38
61
114
88
Oil and gascontent
s 1 + s 2
0.3
1.4
0.9
1.7
2.4
8.1
3.0
1.2
8.9
1.0
2.8
1.7
13.25.7
0.9
1.4
1.5
1.0
3.7
2.9
•ProductionIndex
S| + i>2
0.07
0.11
0.06
0.04
0.01
0.03
0.17
0.01
0.10
0.07
0.06
0.03
0.04
0.11
0.07
0.07
0.10
o.n0.07
Tmax C
425
422
423
428
428
424
427
427
425 i
430 ro
427 '
430
428
424
424
428
429
428
431
426
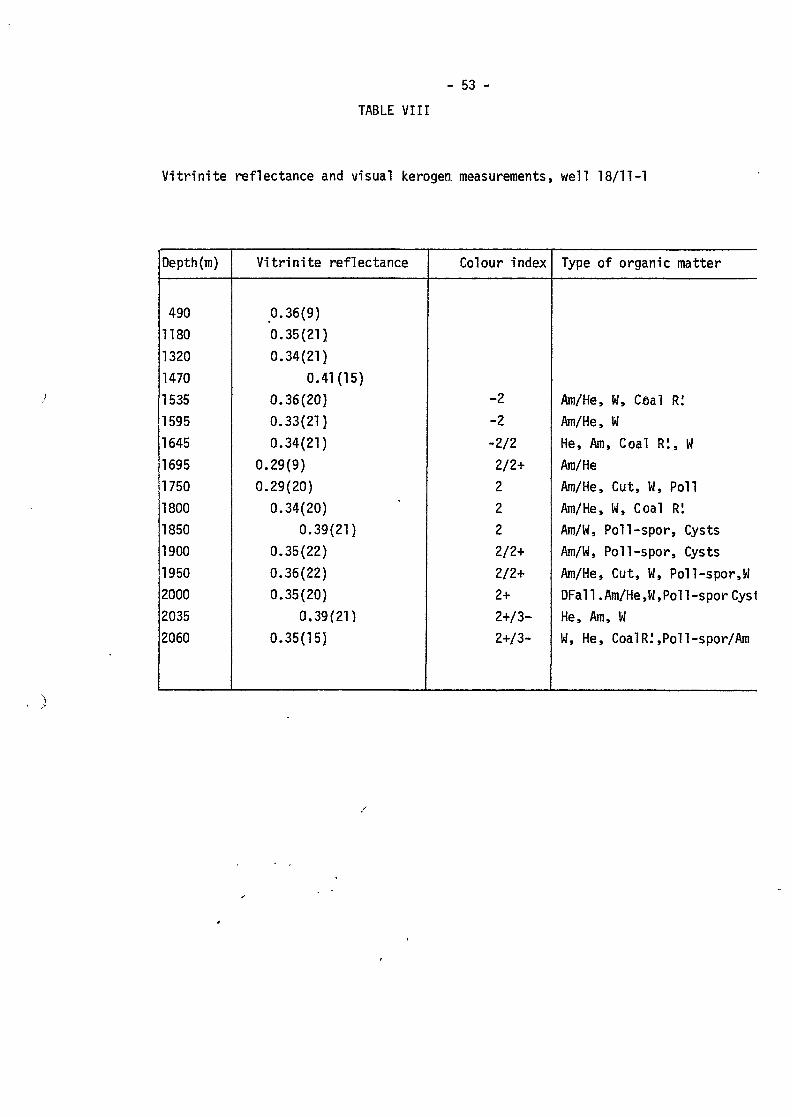
- 53 -
TABLE VI I I
V i t r i n i te reflectance and visual kerogea measurements, well 18/11-1
Depth(m)
490
1180
1320
1470
1535
1595
1645
1695
1750
1800
1850
1900
1950
2000
2035
2060
Vi t r in i te reflectance
0.36(9)
0.35(21)
0.34(21)
0.41(15)
0.36(20)
0.33(21)
0.34(21)
0.29(9)
0.29(20)
0.34(20)
0.39(21)
0.35(22)
0.36(22)
0.35(20)
0.39(21)
0.35(15)
Colour index
-2
-2
-2/2
2/2+
2
2
2
2/2+
2/2+
2+
2+/3-
2+/3-
Type of organic matter
Ara/He, W, Coal R!
Ara/He, W
He, Am, Coal RI, U
Ara/He
Am/He, Cut, W, Pol l
Am/He, W, Coal R!
Am/W, Po l l -spor , Cysts
Am/W, Po l l -spor , Cysts
Am/He, Cut, W, Poll-spor,W
DFall.Am/He,W,Poll-spor Cyst
He, Am, tf
W, He, CoalRi,Poll-spor/Am
54 -
B: Well 17/12-1
Total Organic Carbon
The samples from the upper part of the well, i.e. down to 6200' wereof very poor quality, and only a few were received for analyses. From6200' -8000* a good collection of samples were received and these wereanalysed extensively. This section of the well is divided into sixzones on the background of the TOC analyses.
Zone I: - 6450':The TOC values of this zone is relatively constant, approximately1.0 %.
Zone J: 6450 - 6750':The TOC value jumps sharply to approximately 1.5 % at 6450' and isrelatively constant down to 6800' where another sharp increase isseen.
Zone K: 6800 - 7100':At 6750' the TOC values increase sharply compared to the samplesabove and continue to increase slightly with increasing depth down to7100' where the TOC values are approximately 2 %. Zone K is mainlyseparated from zone J due to the sharp increase at 6800' and thesteeper increase in TOC values from 6800 - 7100' than in the zoneabove. We are not certain if this small change justifies a separatezone.
Zone L: 7100 - 7325':The TOC values increase sharply at 7100' to approximately 4.0 % andare relatively constant throughout the zone.
Zone M: 7325 - 74001:No samples available.
Zone N: 7400 - 7500':The few samples in this zone have TOC values at approximately the samelevel as zone L.
- 55 -
Zone 0: 7500 - 7960':
The TOC values in this zone are all very high but very erratic.
Zone P: 7960 - 8000':
The TOC values drop sharply in this zone, which also contains a largeproportion of sandstone. A general drop in TOC values is also seen for thelast 150' in zone E, but the readings are more erratic and it is thereforenot separated out from zone E.
Extraction and Chromatographic Separations
Zone I: No samples from this zone were extracted, mainly due to verysmall amounts of cuttings in each sample.
Zone J: One sample, 6400 - 6500', was extracted. This sample has a richabundance of extracted hydrocarbons. The hydrocarbon/total organic carbon(HC/TOC) ratio is rather high,.which indicates contamination of migratedhydrocarbons. The gas chromatogram of the saturated hydrocarbon fractionshows a smooth front biased unimodal distribution, probably due-to contam-ination of diesel from the drilling mud. The pristane/n-C,7 ratio is largerthan 1.0 and this is not common in destination products. The gas chromato-grams of the saturated hydrocarbon fraction of the oil from 17/12-1 have acompletely different pattern to the chromatograms seen here, and due tothis the analysed samples can not have been contaminated by this oil.
Zone K: No samples were extracted from this zone.
Zone L: One sample from zone L, 7150 - 7225', was extracted showing arich abundance of extractable hydrocarbons. The HC/TOC ratio is lower forthis sample than for the sample in zone B, while the saturated/aromaticratio is increased. The gas chromatogram of the saturated hydrocarbonfractions varies only slightly, mainly in the n-C17 -
n-C-i7 area ^rom tne
sample in zone J. Due to this, we would not exclude contamination of freehydrocarbons similar to the sample in zone J, even if the HC/TOC ratio isthat low that such a contamination is not evident.
- 56 -
Zone M: No samples available.
Zone N: One sample from zone N, 7400 - 7425', was extracted, showingalmost identical results as the sample from zone L.
Zone 0: Four samples from zone 0 were extracted, showing almost identicalresults as the samples from zones L and N.
Zone D: No samples from this zone was extracted.
Rock-Eva! Pyrolysis
A total of 27 samples from this well were pyrolysed by the Rock-Evalmethod. All the samples have a low T value, indicating immaturesamples, increasing to moderate mature towards the lower end of thewell.
The samples have a relatively low hydrogen index except for a fewsamples between 72001 and 74001. The oxygen index is high for theuppermost analysed samples down to 7000', while the interval between7000' and 7970' has a low oxygen index. The two lowermost samples showagain a high oxygen index. This would indicate type III kerogen in theupper interval, down to 70001, and in the last 30' of the well, whilethe interval between 7000' and 7970' is of kerogen type II. This is incontradiction to the visual kerogen estimation, which shows the wholeanalysed sequence, 6200' - 8000' to be dominated by amorphous material.The reason for this contradiction is not fully understood presently,but the upper part of the analysed sequence is found by the vitrinitereflectance measurements to contain a large proportion of reworkedmaterial. This will lower the hydrogen index and increase the oxygenindex compared to the true material, and in such a way distort themeasurements. Due to this, more emphasis is put on the visual kerogenthan on the pyrolysis" on this well in the evaluation of type of kerogen.
- 57 -
The Rock-Eval pyrolysis does, however, by the oil and gas content andthe production index measurement, indicate oil detections throughoutmost of the measured interval. This can either be migrated oil or mudadditives.
Vitrinite Reflectance
Twenty samples were analysed for vitrinite reflectance. In the followingeach sample is described, and together with the reflectance data,other information from the analyses are given.
I860': Calcareous shale and carbonate, R = 0.27(14).The sample has a very low organic content with small vitrinite particles,mostly in carbonate. A trace of inertinite and reworked material. UVlight shows a yellow/orange fluorescence from spores and carbonatetogether with a low exinite content.
42801: Calcareous shale, RQ = 0.34(290).The sample has a low organic content with small particles of inertiniteand reworked material, mostly reworked material and true vitrinite. UVlight shows a yellow and yellow/orange fluorescence from spore specksand a low exinite content.
47501: Shale and carbonate, RQ = 0.34(20).The sample has a low to moderate organic content with small particlesmostly of inertinite and reworked material, only a trace of truevitrinite. UV light shows a yellow/orange fluorescence from spores andcarbonate together with a low exinite content.
5225': Shale and carbonate, RQ = 0.42(21).The sample has a moderate organic content, restricted to the shale.Particles of reworked material and inertinite are dominant, only atrace of wispy, particles of true vitrinite. UV light shows a yellow toorange fluorescence from spores and a trace of exinite.
- 58 -
6075': Calcareous shale and carbonate, RQ = 0.40(21).The sample has a low organic content with small particles of vitriniteand inertinite. A trace of small vitrinite wisps and bitumen tracesare recorded. UV light shows a light orange fluorescence from sporespecks and a trace of exinite.
6275': Shale and carbonate, R = 0.38(19).The sample has a low organic content, mostly small particles ofvitrinite and inertinite with bitumen wisps. A few vitrinite wisps,but the inertinite is dominant. UV light shows a light orange fluorescencefrom spores and carbonate together with a trace of exinite.
6375': Mixed shale lithologies, RQ = 0.34(20).The sample has a low organic content with bitumen wisps and particlesof vitrinite and inertinite in about equal proportions. UV light showsa light orange fluorescence from spores and a low to moderate exinitecontent.
6530': Shale, RQ 0.31(20).The sample has a low organic content with small particles of inertiniteand reworked material dominant. A few vitrinite wispy particles and afew included vitrinite lignite fragments in the shale matrix. UV lightshows a light to mid orange fluorescence from spores, and a moderateto rich exinite content.
6650': Calcareous shale, RQ = 0.48(20).The sample has a low organic content, nearly all reworked material andinertinite particles. Only a trace of wispy particles of vitrinite. UVlight shows a light to mid-orange fluorescence and a moderate to richexinite content.
6825': Shale and carbonate, R = 0.51(16).The sample has a low organic content with reworked material and inertiniteparticles being dominant. A trace of possibly true vitrinite particlesand occasional bitumen wisps. UV light shows a light orange fluorescencefromyspores and a moderate exinite content.
- 59 -
69751: Shale, RQ = 0.51(15).
The sample has a low to moderate organic content with small particles,almost entirely reworked material and inertinite. Only a trace of doubtfultrue material. UV light shows a light orange fluorescence from spores and amoderate exinite content.
71251: Shale, rather pyritic, RQ = 0.37(20).The sample has a low organic content with small particles of vitrinite andinertinite with appreciable reworking. Plentiful bitumen wisps. UV lightshows a yellow to orange and light orange fluorescence from spores and amoderate exinite content.
72501: Shale, RQ = 0.33(20).The sample has a moderate organic content with small particles of vitriniteand inertinite dominating. Only a trace of true vitrinite, differentiationdifficult. Some bitumen staining. UV light shows a light orange fluorescencefrom spores and a moderate to rich exinite content.
73251: Mixed shale and carbonate litholcgies, R = 0.43(20).The sample contains some cuttings which are rather rich in bitumen wispsand staining. Otherwise a low content of inertinite and reworked material.Only a trace of true vitrinite. UV light shows a yellow to orange and lightorange fluorescence from spores, together with a moderate to rich exinitecontent.
7500': Shale, RQ = 0.44(12) and RQ = 0.56(8).The sample has a moderate organic content with bitumen wisps and staining.Inertinite particles are dominant. Only a low content of poor vitriniteparticles. UV light shows a light orange fluorescence from spores, and alow to moderate exinite content.
76001: Shale, rather pyritic, RQ = 0.48(21).The sample is moderate to rich in organic material with an overall bitumenstaining and wisps. Plentiful coal fragments and included particles ofvitrinite and inertinite. UV light shows a light and mid-orange fluorescencefrom spores and a low to moderate exinite content.
- 60 -
77001: Shale, Ro = 0.50(20).The sample has a moderate organic content with overall bitumen staining.Particles of inertinite are dominant together with some vitrinite particlesand some coal fragments. UV light shows light and orange fluorescencefrom spores and a low exinite content.
7800': Shale, RQ = 0.47(21).The sample is moderate to rich in organic material with an overallbitumen staining and wisps. Loose and included coal fragments togetherwith plentiful vitrinite wisps and stringers with inertinite particles.UV light shows a light orange fluorescence from spores and a low exinitecontent.
7900": Mixed shale lithologies, RQ = 0.45(22).
The sample has a moderate organic content with loose coal fragments andincluded particles of vitrinite and inertinite, with the latter dominant.Only a trace of bitumen. UV light shows a light orange fluorescence fromspores and hydrocarbon impregnation together with a low to moderateexinite content.
80001: Shale, RQ = 0.42(8), RQ = 0.54(11) and RQ = 0.70(1).The sample has a moderate organic content with bitumen wisps and staining.A suggestion of some oxidation is seen. Particles of inertinite aredominant and only a trace of poor vitrinite particles and wisps arerecorded. UV light shows a light/mid-orange fluorescence from spores andhydrocarbon traces together with a poor exinite content.
Visual kerogen
As in well 17/12-2, presence of undissolved minerals has to be consideredto evaluate a suite of residues all dominated by amorphous (marine)material.
Forty-seven samples were processed for kerogen/maturation studies andfor palynological investigation from 62001 down to 8000'.
4
There are few striking events through this well judged only from theorganic residues; marine conditions prevail down to 7540', further downwe suggest more deltaic conditions.
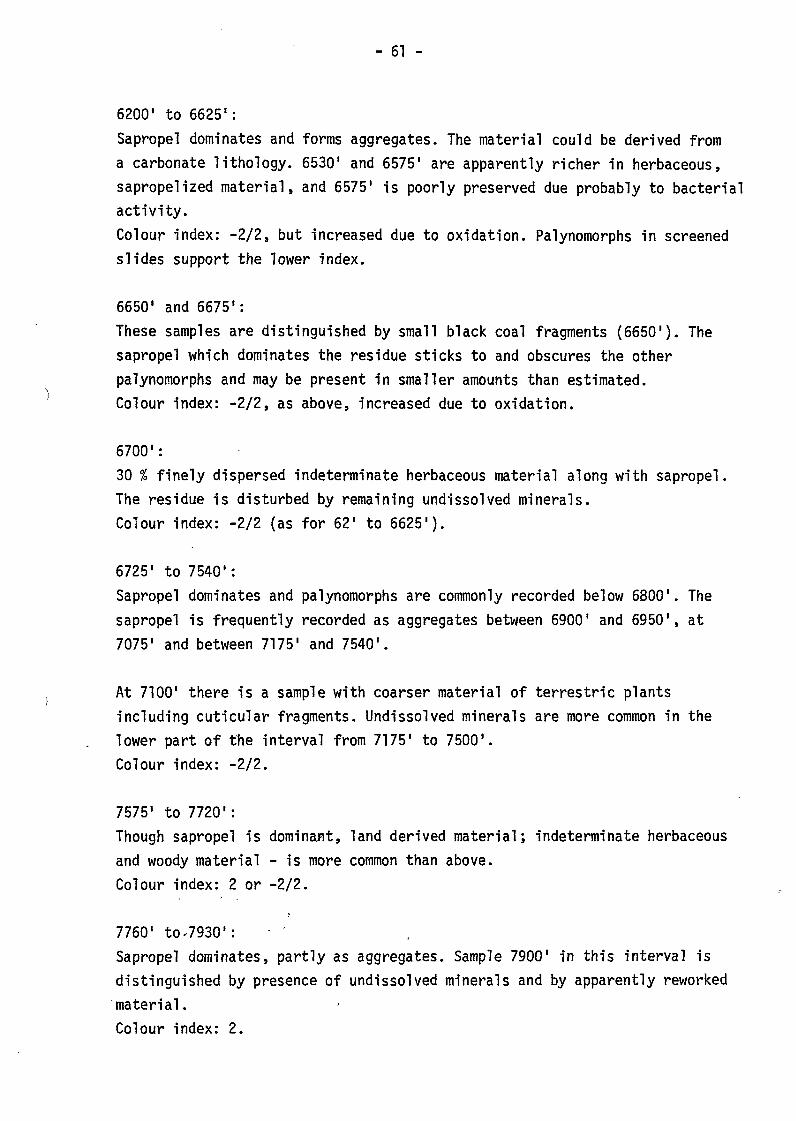
- 61 -
6200' to 6625':
Sapropel dominates and forms aggregates. The material could be derived froma carbonate lithology. 6530' and 6575' are apparently richer in herbaceous,sapropelized material, and 6575' is poorly preserved due probably to bacterialactivity.Colour index: -2/2, but increased due to oxidation. Palynomorphs in screenedslides support the lower index.
6650' and 6675':
These samples are distinguished by small black coal fragments (66501). Thesapropel which dominates the residue sticks to and obscures the otherpalynomorphs and may be present in smaller amounts than estimated.Colour index: -2/2, as above, increased due to oxidation.
6700':30 % finely dispersed indeterminate herbaceous material along with sapropel.The residue is disturbed by remaining undissolved minerals.Colour index: -2/2 (as for 62' to 6625').
6725' to 7540':
Sapropel dominates and palynomorphs are commonly recorded below 6800'. Thesapropel is frequently recorded as aggregates between 6900' and 6950', at7075' and between 7175' and 7540'.
At 7100' there is a sample with coarser material of terrestric plantsincluding cuticular fragments. Undissolved minerals are more common in thelower part of the interval from 7175' to 7500'.Colour index: -2/2.
7575' to 7720':Though sapropel is dominant, land derived material; indeterminate herbaceousand woody material - is more common than above.Colour index: 2 or -2/2.
7760' to'7930':Sapropel dominates, partly as aggregates. Sample 7900' in this interval isdistinguished by presence of undissolved minerals and by apparently reworked
material.Colour index: 2.
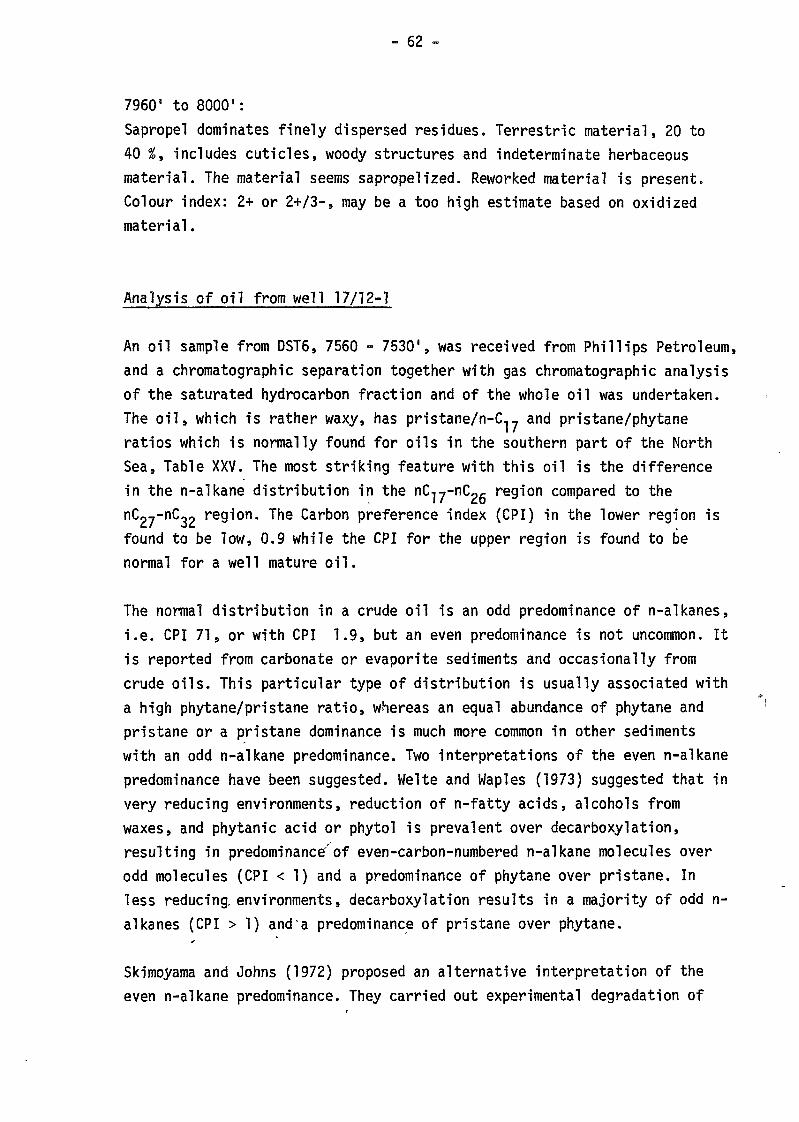
- 62 -
7960' to 8000':
Sapropel dominates finely dispersed residues. Terrestric material, 20 to40 %9 includes cuticles, woody structures and indeterminate herbaceousmaterial. The material seems sapropelized. Reworked material is present.Colour index: 2+ or 2+/3-, may be a too high estimate based on oxidizedmaterial.
Analysis of oil from well 17/12-1
An oil sample from DST6, 7560 - 7530', was received from Phillips Petroleum,and a chromatographic separation together with gas chromatographic analysisof the saturated hydrocarbon fraction and of the whole oil was undertaken.The oil, which is rather waxy, has pristane/n-C-7 and pristane/phytaneratios which is normally found for oils in the southern part of the NorthSea, Table XXV. The most striking feature with this oil is the differencein the n-alkane distribution in the nC-.y-nC?fi region compared to thenCpy-nC-^ region. The Carbon preference index (CPI) in the lower region isfound to be low, 0.9 while the CPI for the upper region is found to benormal for a well mature oil.
The normal distribution in a crude oil is an odd predominance of n-alkanes,i.e. CPI 71, or with CPI 1.9, but an even predominance is not uncommon. Itis reported from carbonate or evaporite sediments and occasionally fromcrude oils. This particular type of distribution is usually associated witha high phytane/pristane ratio, whereas an equal abundance of phytane andpristane or a pristane dominance is much more common in other sedimentswith an odd n-alkane predominance. Two interpretations of the even n-alkanepredominance have been suggested. Welte and Waples (1973) suggested that iny&ry reducing environments, reduction of n-fatty acids, alcohols fromwaxes, and phytanic acid or phytol is prevalent over decarboxylation,resulting in predominance' of even-carbon-numbered n-alkane molecules overodd molecules (CPI < 1) and a predominance of phytane over pristane. Inless reducing, environments, decarboxylation results in a majority of odd n-alkanes (CPI > 1) and a predominance of pristane over phytane.
Skimoyama and Johns (1972) proposed an alternative interpretation of theeven n-alkane predominance. They carried out experimental degradation of
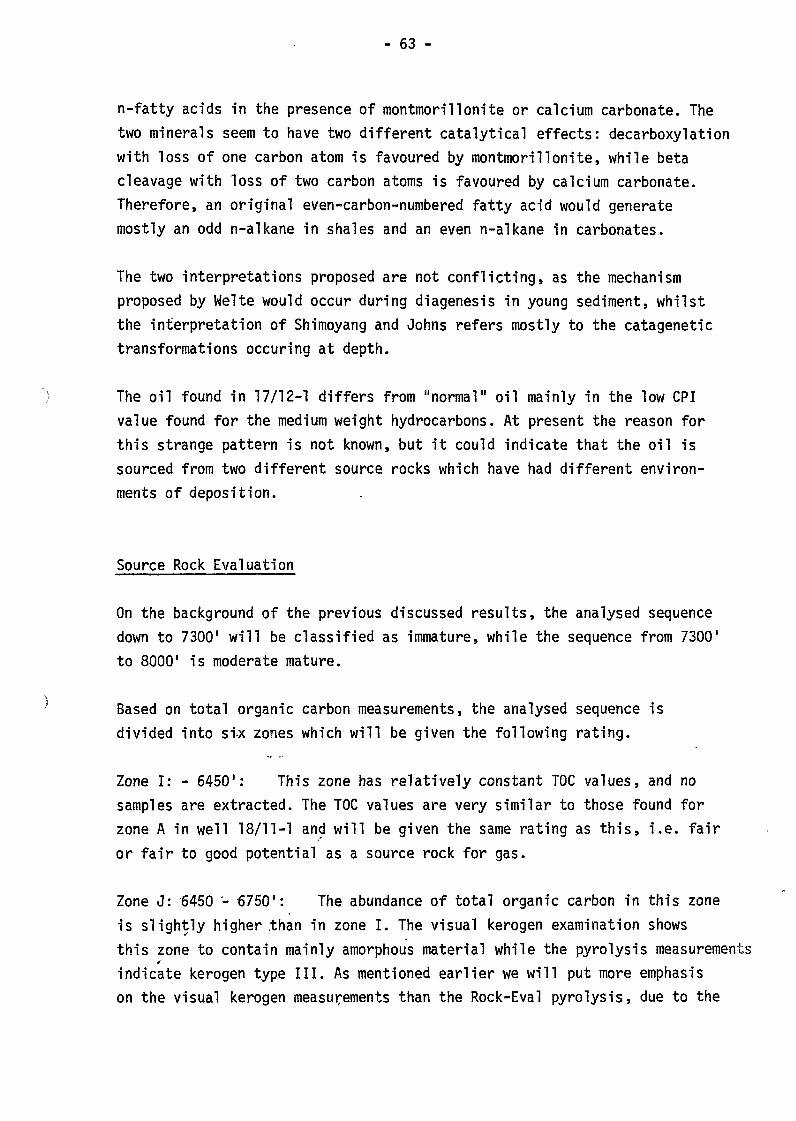
- 63 -
n-fatty acids in the presence of montmorillonite or calcium carbonate. Thetwo minerals seem to have two different catalytical effects: decarboxylationwith loss of one carbon atom is favoured by montmorillonite, while betacleavage with loss of two carbon atoms is favoured by calcium carbonate.Therefore, an original even-carbon-numbered fatty acid would generatemostly an odd n-alkane in shales and an even n-alkane in carbonates.
The two interpretations proposed are not conflicting, as the mechanismproposed by Welte would occur during diagenesis in young sediment, whilstthe interpretation of Shimoyang and Johns refers mostly to the catagenetictransformations occuring at depth.
The oil found in 17/12-1 differs from "normal" oil mainly in the low CPIvalue found for the medium weight hydrocarbons. At present the reason forthis strange pattern is not known, but it could indicate that the oil issourced from two different source rocks which have had different environ-ments of deposition.
Source Rock Evaluation
On the background of the previous discussed results, the analysed sequencedown to 7300' will be classified as immature, while the sequence from 73001
to 8000' is moderate mature.
Based on total organic carbon measurements, the analysed sequence isdivided into six zones which will be given the following rating.
Zone I: - 6450': This zone has relatively constant TOC values, and nosamples are extracted. The TOC values are yery similar to those found forzone A in well 18/11-1 and will be given the same rating as this, i.e. fairor fair to good potential as a source rock for gas.
Zone J: 6450 - 6750': The abundance of total organic carbon in this zoneis slightly higher .than in zone I. The visual kerogen examination showsthis zone to contain mainly amorphous material while the pyrolysis measurementsindicate kerogen type III. As mentioned earlier we will put more emphasison the visual kerogen measurements than the Rock-Eva! pyrolysis, due to the
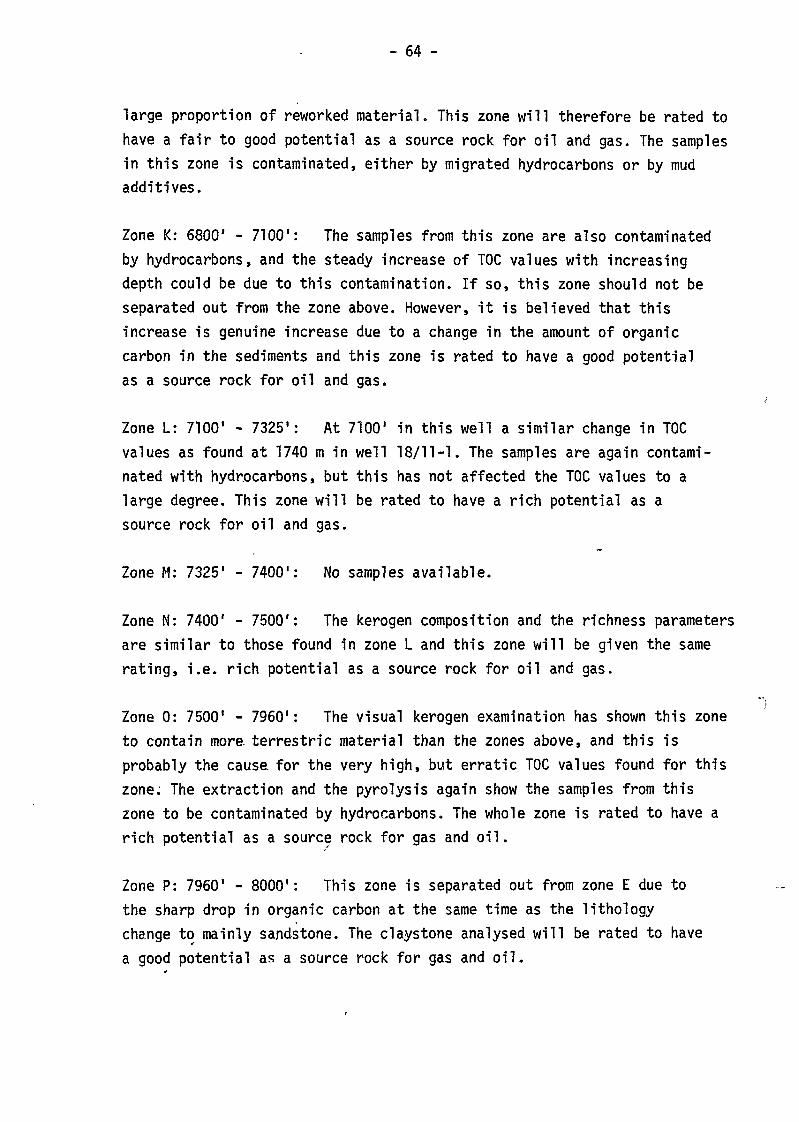
- 64 -
large proportion of reworked material. This zone will therefore be rated tohave a fair to good potential as a source rock for oil and gas. The samplesin this zone is contaminated, either by migrated hydrocarbons or by mudadditives.
Zone K: 68001 - 7100': The samples from this zone are also contaminatedby hydrocarbons, and the steady increase of TOC values with increasingdepth could be due to this contamination. If so, this zone should not beseparated out from the zone above. However, it is believed that thisincrease is genuine increase due to a change in the amount of organiccarbon in the sediments and this zone is rated to have a good potentialas a source rock for oil and gas.
Zone L: 7100' - 7325': At 7100' in this well a similar change in TOCvalues as found at 1740 m in well 18/11-1. The samples are again contami-nated with hydrocarbons, but this has not affected the TOC values to alarge degree. This zone will be rated to have a rich potential as asource rock for oil and gas.
Zone M: 7325' - 7400': No samples available.
Zone N: 7400' - 7500': The kerogen composition and the richness parametersare similar to those found in zone L and this zone will be given the samerating, i.e. rich potential as a source rock for oil and gas.
Zone 0: 7500' - 7960": The visual kerogen examination has shown this zoneto contain more terrestric material than the zones above, and this isprobably the cause, for the very high, but erratic TOC values found for thiszone. The extraction and the pyrolysis again show the samples from thiszone to be contaminated by hydrocarbons. The whole zone is rated to have arich potential as a source rock for gas and oil.
Zone P: 7960' - 8000': This zone is separated out from zone E due tothe sharp drop in organic carbon at the same time as the lithologychange to mainly sandstone. The claystone analysed will be rated to havea good potential as a source rock for gas and oil.
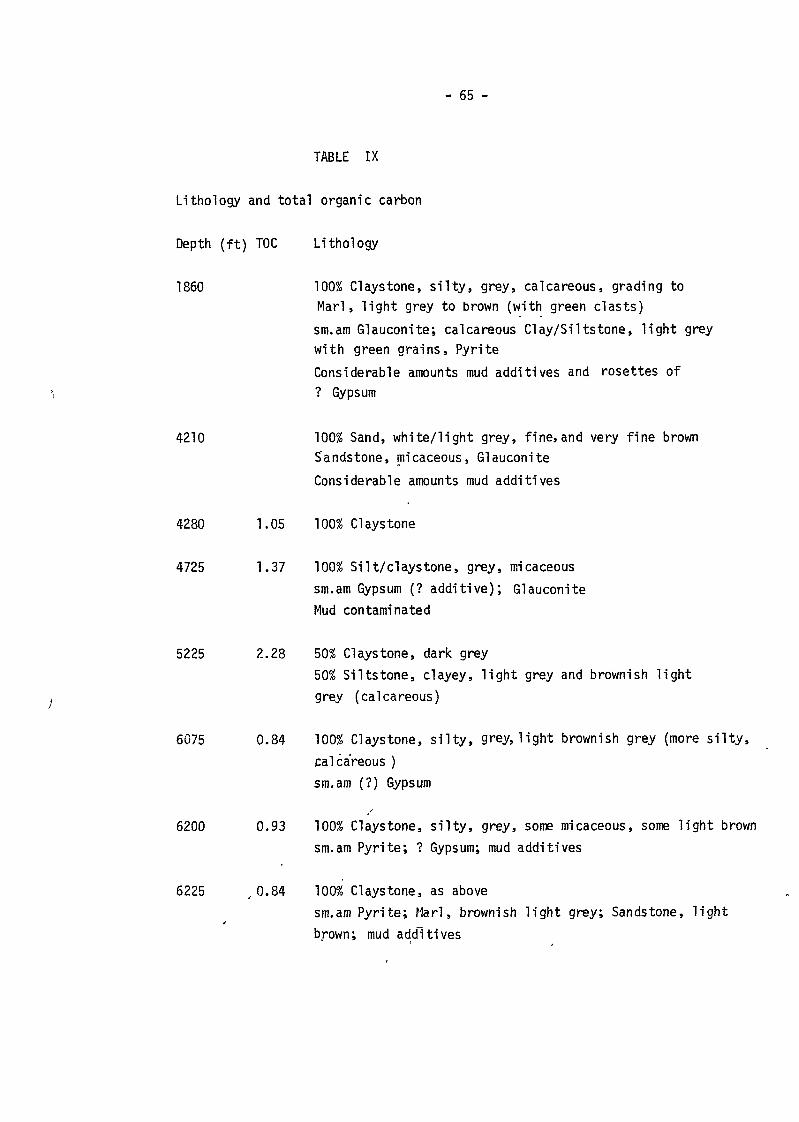
- 65 -
TABLE IX
Lithoiogy and total organic carbon
Depth ( f t ) TOC Lithology
1860 100% Claystone, s i l t y , grey, calcareous, grading to
Marl, l igh t grey to brown (with green clasts)
sm.am Glauconite; calcareous Clay/Si I tstone, l igh t grey
with green grains, PyriteConsiderable amounts mud additives and rosettes of? Gypsum
4210 100% Sand, whi te/ l ight grey, f ine, and very f ine brown
Sandstone, micaceous, Glauconite
Considerable amounts mud additives
4280 1.05 100% Claystone
4725 1.37 100% Sil t /c laystone, grey, micaceous
sm.am Gypsum (? addit ive); Glauconite
Mud contaminated
5225 2.28 50% Claystone, dark grey50% Si I tstone, clayey, l i gh t grey and brownish l igh t
grey (calcareous)
6075 0.84 100% Claystone, s i l t y , grey, l igh t brownish grey (more s i l t y ,
calcareous )
sm.am (?) Gypsum
6200 0.93 100% Claystone, s i l t y , grey, some micaceous, some l igh t brown
sm.am Pyr i te; ? Gypsum; mud additives
6225 ,0.84 100% Claystone, as abovesm.am Pyr i te; Marl» brownish l i gh t grey; Sandstone, l i gh t
brown; mud additives
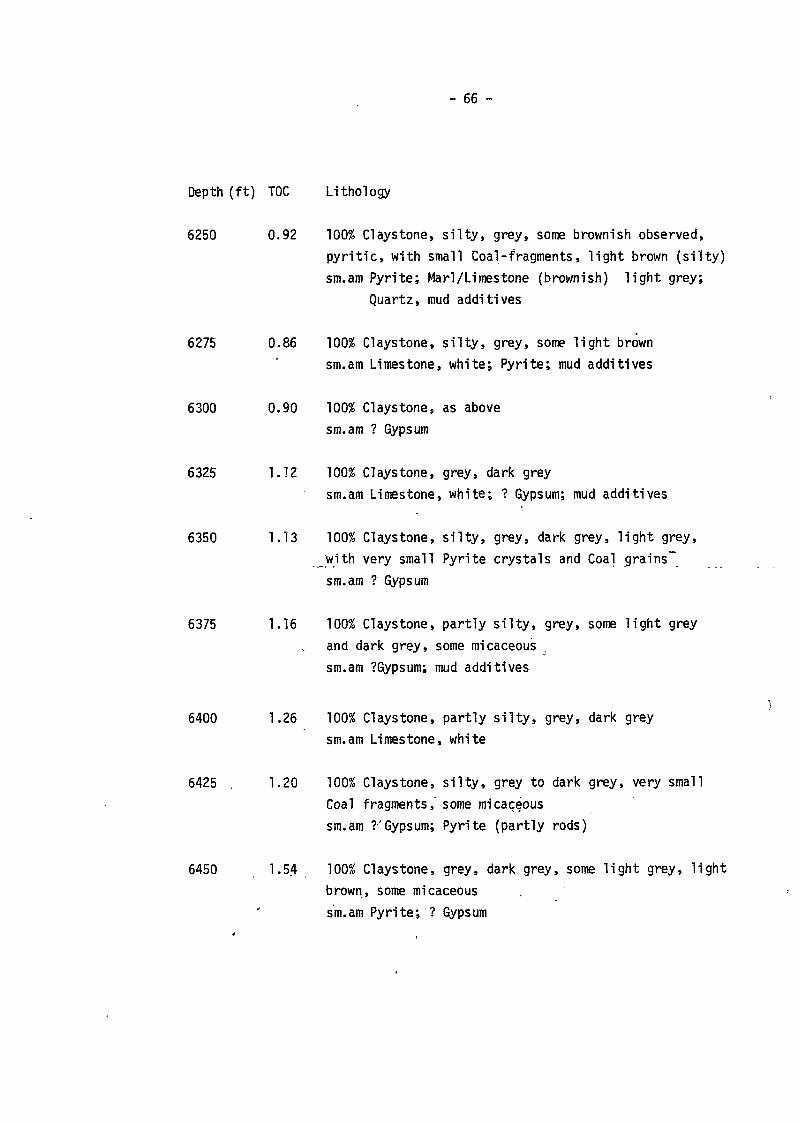
- 66 -
Depth ( f t ) TOC Lithoiogy
6250 0.92 100% Claystone, s i l t y , grey, some brownish observed,
py r i t i c , with small Coal-fragments, l igh t brown (s i l t y )
sm.am Pyri te; Marl/Limestone (brownish) l i gh t grey;
Quartz, mud additives
6275 0.86 100% Claystone, s i l t y , grey, some l igh t brown
sm.am Limestone, white; Pyri te; mud additives
6300 0.90 100% Claystone, as above
sm.am ? Gypsum
6325 1.12 100% Claystone, grey, dark grey
sm.am Limestone, white; ? Gypsum; mud additives
6350 1.13 100% Claystone, s i l t y , grey, dark grey, l igh t grey,
with very small Pyrite crystals and Coal grains"
sm.am ? Gypsum
6375 1.16 100% Claystone, partly s i l t y , grey, some l igh t grey
and dark grey, some micaceous
sm.am ?Gypsum; mud additives
6400 1.26 100% Claystone, partly s i l t y , grey, dark grey
sm.am Limestone, white
6425 . 1.20 100% Claystone, s i l t y , grey to dark grey, very small
Coal fragments, some micaceous
sm.am YGypsum; Pyrite (partly rods)
6450 1.54 100% Claystone, grey, dark grey, some l igh t grey, l ight
brown, some micaceous
sm.am Pyri te; ? Gypsum
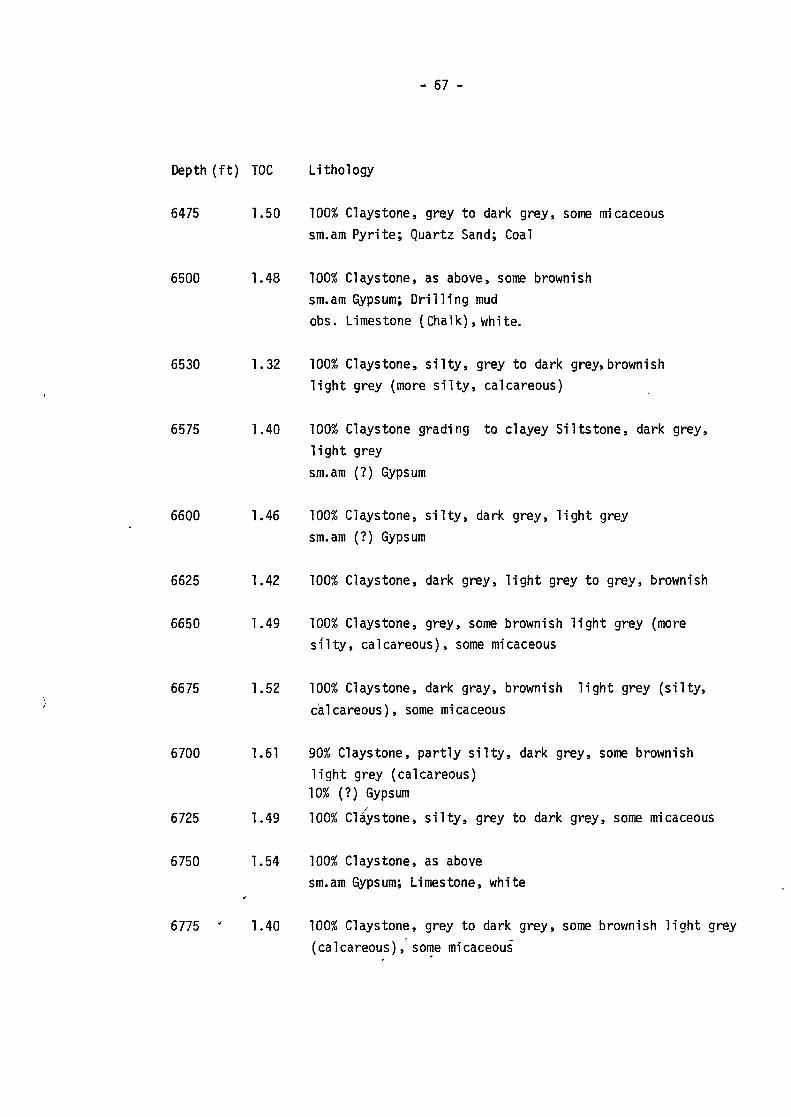
- 67 -
Depth ( f t ) TOC Lithology
6475 1.50 100% Claystone, grey to dark grey, some micaceous
sm.am Pyr i te; Quartz Sand; Coal
6500 1.48 100% Claystone, as above, some brownish
sm.am Gypsum; Dr i l l i ng mud
obs. Limestone (Chalk), white,
6530 1.32 100% Claystone, s i l t y , grey to dark grey, brownish
l igh t grey (more s i l t y , calcareous)
6575 1.40 100% Claystone grading to clayey Si l tstone, dark grey,
l igh t grey
sm.am (?) Gypsum
6600 1.46 100% Claystone, s i l t y , dark grey, l i gh t grey
sm.am (?) Gypsum
6625 1.42 100% Claystone, dark grey, l i gh t grey to grey, brownish
6650 1.49 100% Claystone, grey, some brownish l igh t grey (more
s i l t y , calcareous), some micaceous
6675 1.52 100% Claystone, dark gray, brownish l i gh t grey ( s i l t y ,
calcareous), some micaceous
6700 1.61 90% Claystone, part ly s i l t y , dark grey, some brownish
l igh t grey (calcareous)10% (?) Gypsum
6725 1.49 100% Claystone, s i l t y , grey to dark grey, some micaceous
6750 1.54 100% Claystone, as above
sm.aTO Gypsum; Limestone, white
6775 ' 1.40 100% Claystone, grey to dark grey, some brownish l igh t grey
(calcareous), some micaceous
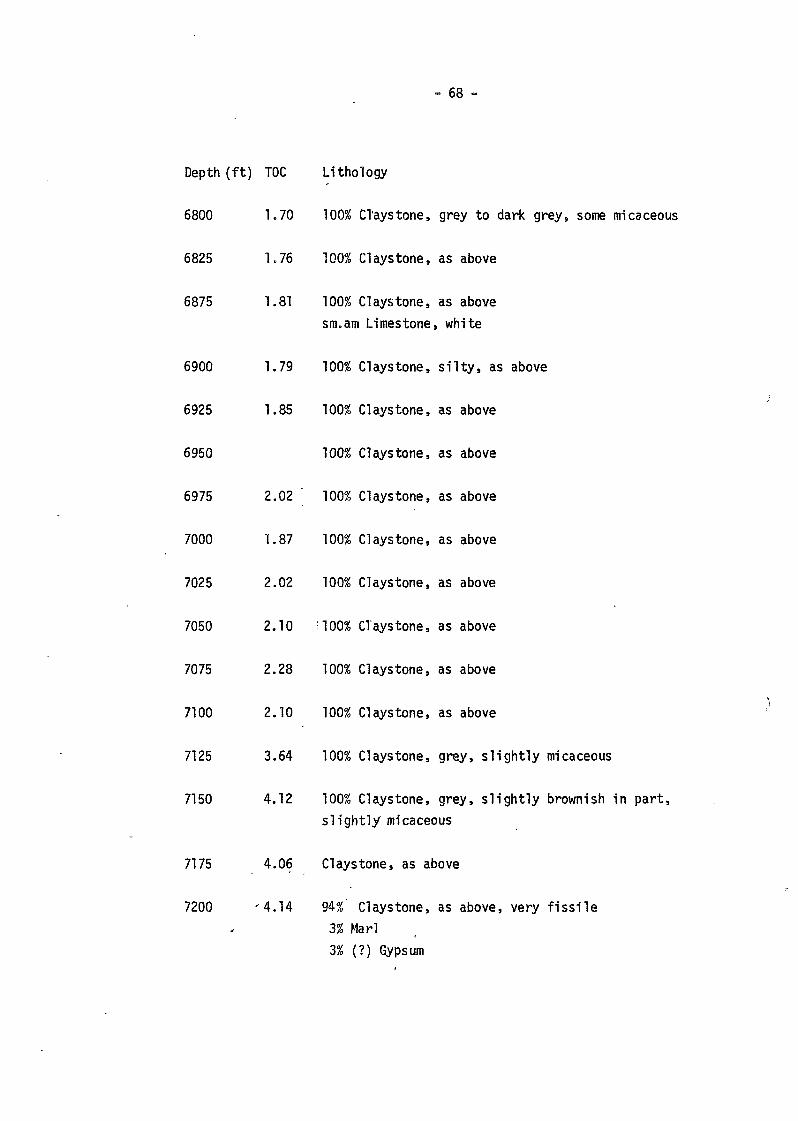
- 68
Depth (ft) TOC Lithology
6800 1.70 100% CTaystone, grey to dark grey, some micaceous
6825 1.76 100% Claystone, as above
6875 1.81 100% Claystone, as abovesm.am Limestone, white
6900 1.79 100% Claystone, silty, as above
6925 1.85 100% Claystone, as above
6950 100% Claystone, as above
6975 2.02 100% Claystone, as above
7000 1.87 100% Claystone, as above
7025 2.02 100% Claystone, as above
7050 2.10 !100% CTaystone, as above
7075 2.28 100% Claystone, as above
7100 2.10 100% Claystone, as above
7125 3.64 100% Claystone, grey, slightly micaceous
7150 4.12 100% Claystone, grey, slightly brownish in part,slightly micaceous
7175 4.06 Claystone, as above
7200 '4.14 94% Claystone, as above, very fissile3% Marl3% (?) Gypsum
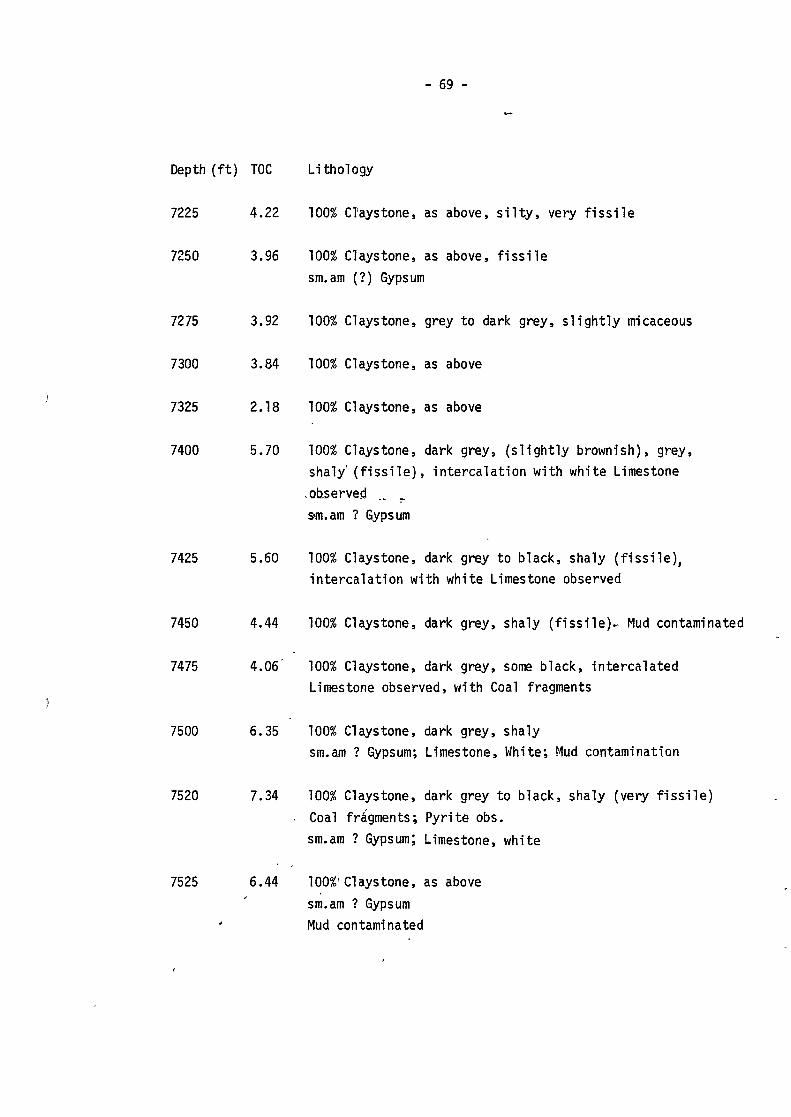
- 69 -
Depth ( f t ) TOC Lithology
7225 4.22 100% Claystone, as above, s i l t y , very f i s s i l e
7250 3.96 100% Claystone, as above, f i s s i l e
sin.am (?) Gypsum
7275 3.92 100% Claystone, grey to dark grey, s l igh t ly micaceous
7300 3.84 100% Claystone, as above
7325 2.18 100% Claystone, as above
7400 5.70 100% Claystone, dark grey, (s l ight ly brownish), grey,
shaly' ( f i s s i l e ) , intercalat ion with white Limestone
.observed
sni.am ? Gypsum
7425 5.60 100% Claystone, dark grey to black, shaly ( f i s s i l e ) ,
intercalation with white Limestone observed
7450 4.44 100% Claystone, dark grey, shaly ( f iss i le) . - Mud contaminated
7475 4.06 100% Claystone, dark grey, some black, intercalated
Limestone observed, with Coal fragments
7500 6.35 100% Claystone, dark grey, shalysm.am ? Gypsum; Limestone, White; Mud contamination
7520 7.34 100% Claystone, dark grey to black, shaly (very f i ss i l e )
• Coal fragments; Pyrite obs.
sm.am ? Gypsum; Limestone, white
7525 6.44 100%'Claystone, as above
sm.am ? GypsumMud contaminated
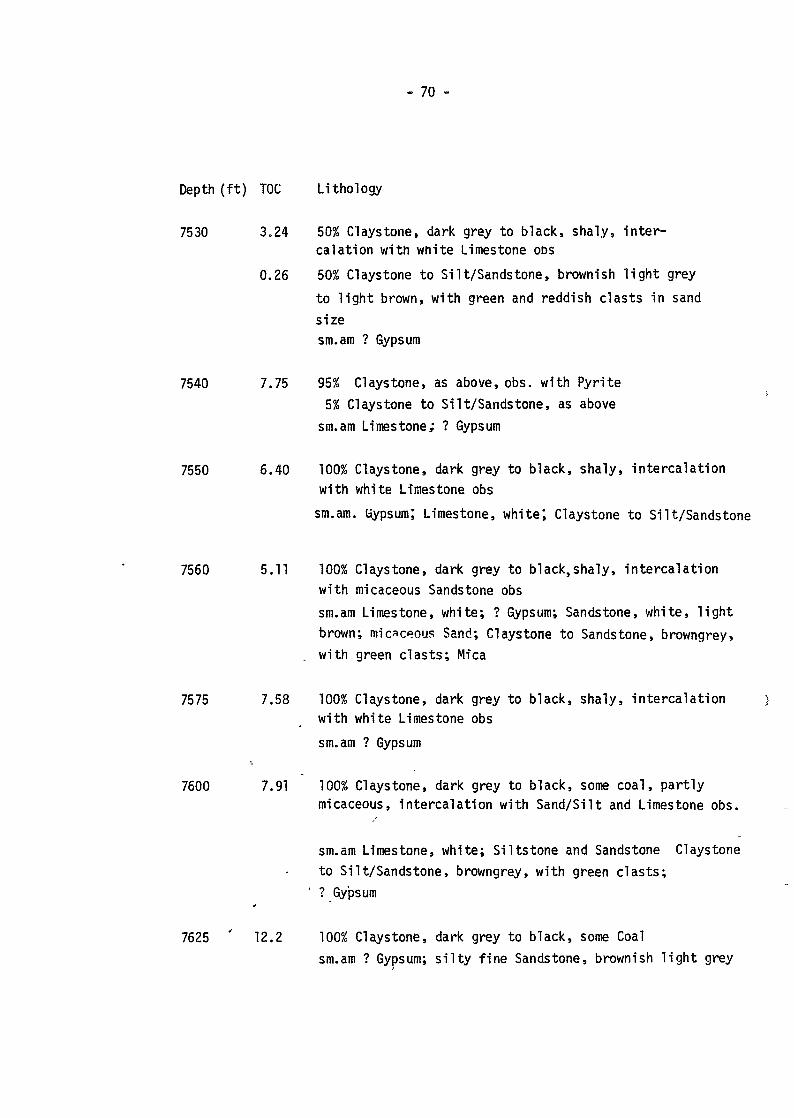
- 70 -
Depth ( f t ) TOC Lithoiogy
7530 3.24 50% Claystone, dark grey to black, shaly, in ter -calation with white Limestone ods
0.26 50% Claystone to Silt/Sandstone, brownish l i gh t grey
to l i gh t brown, with green and reddish clasts in sand
size
sm.am ? Gypsum
7540 7.75 95% Claystone, as above, obs. with Pyrite
5% Claystone to Silt/Sandstone, as above
sm.am Limestone; ? Gypsum
7550 6.40 100% Claystone, dark grey to black, shaly, intercalat ionwith white Limestone obs
sm.am. Gypsum; Limestone, white', Claystone to Silt/Sandstone
7560 5.11 100% Claystone, dark grey to black,shaly, intercalat ion
with micaceous Sandstone obs
sm.am Limestone, white; ? Gypsum; Sandstone, white, l i gh t
brown; micaceous Sand; Claystone to Sandstone, browngrey,
. with green c lasts ; Mica
7575 7.58 100% Claystone, dark grey to black, shaly, intercalat ion )with white Limestone obs
sm.am ? Gypsum
7600 7.91 100% Claystone, dark grey to black, some coal, part lymicaceous, intercalation with Sand/Silt and Limestone obs.
sm.am Limestone, white; Siltstone and Sandstone Claystoneto Silt/Sandstone, browngrey, with green c lasts;
' ? Gypsum
7625 ' 12.2 100% Claystone, dark grey to black, some Coalsm.am ? Gypsum; s i l t y f ine Sandstone, brownish l i gh t grey
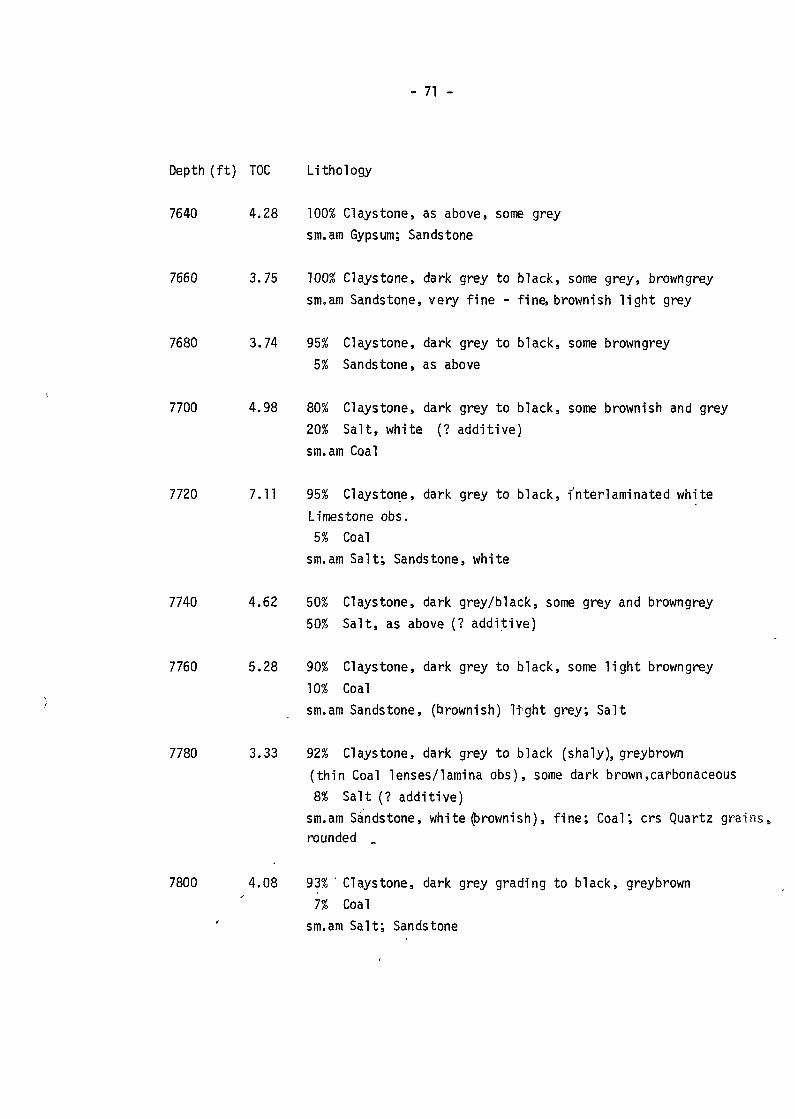
- 71 -
Depth ( f t ) TOC Lithoiogy
7640 4.28 100% Claystone, as above, some grey
sm.am Gypsum; Sandstone
7660 3.75 100% Claystone, dark grey to black, some grey, browngrey
sm.am Sandstone, very f ine - f ine, brownish l i gh t grey
7680 3.74 95% Claystone, dark grey to black, some browngrey
5% Sandstone, as above
7700 4.98 80% Claystone, dark grey to black, some brownish and grey
20% Sal t , white (? additive)
sm.am Coal
7720 7.11 95% Claystone, dark grey to black, inter!aminated white
Limestone obs.5% Coal
sm.am Salt ; Sandstone, white
7740 4.62 50% Claystone, dark grey/black, some grey and browngrey
50% Sal t , as above (? additive)
7760 5.28 90% Claystone, dark grey to black, some l i gh t browngrey
10% Coal
sm.am Sandstone, (brownish) l tgh t grey; Salt
7780 3.33 92% Claystone, dark grey to black (shaly), greybrown
(th in Coal lenses/lamina obs), some dark brown,carbonaceous
8% Salt (? additive)sm.am Sandstone, white (brownish), f i ne ; Coal; crs Quartz grains»rounded _
7800 4.08 93% ' Claystone, dark grey grading to black, greybrown
7% Coal
sm.am Salt ; Sandstone
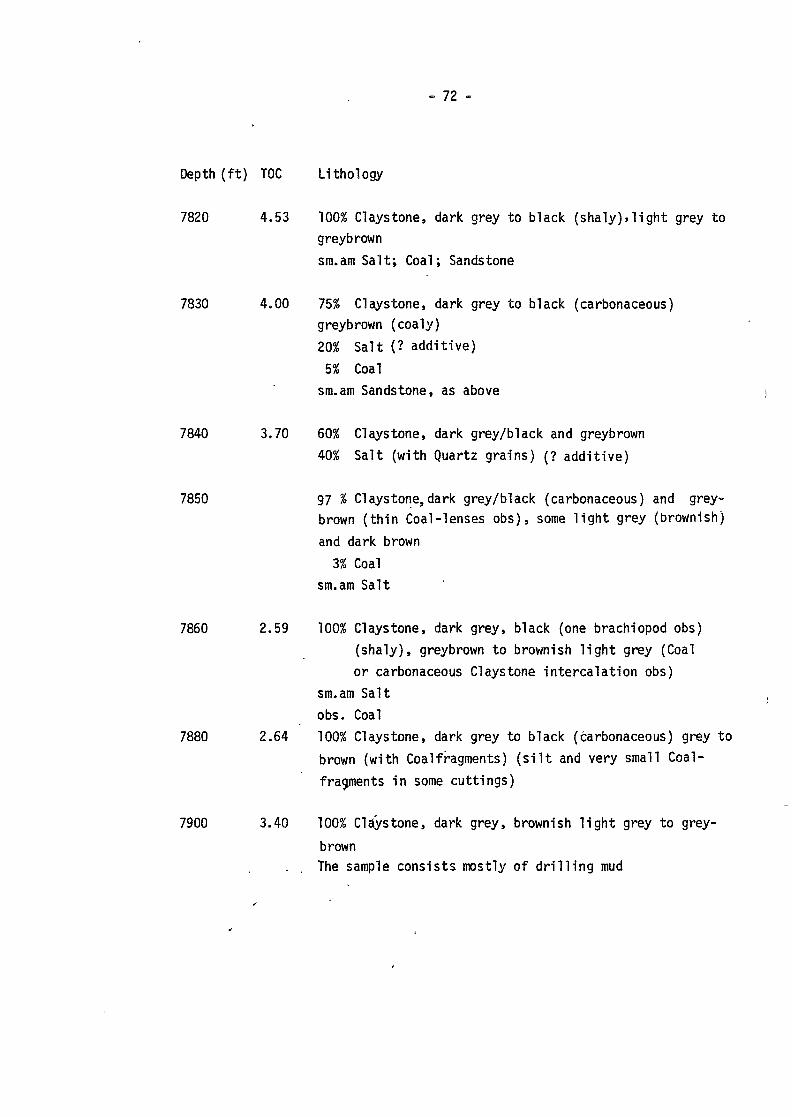
72 -
Depth ( f t ) TOC Lithology
7820 4.53 100% Claystone, dark grey to black (shaly)>light grey togreybrown
sra.am Salt ; Coal; Sandstone
7830 4.00 75% Claystone, dark grey to black (carbonaceous)greybrown (coaly)
20% Salt (? additive)
5% Coal
sm.am Sandstone, as above
7840 3.70 60% Claystone, dark grey/black and greybrown
40% Salt (with Quartz grains) (? additive)
7850 97 % Claystone,dark grey/black (carbonaceous) and grey-
brown ( thin Coal-lenses obs), some l ight grey (brownish)
and dark brown
3% Coalsm.am Salt
7860 2.59 100% Claystone, dark grey, black (one brachiopod obs)
(shaly), greybrown to brownish l igh t grey (Coal
or carbonaceous Claystone intercalation obs)
sm.am Salt
obs. Coal
7880 2.64 100% Claystone, dark grey to black (carbonaceous) grey to
brown (with Coal fragments) ( s i l t and very small Coal-
fragments in some cuttings)
7900 3.40 100% Claystone, dark grey, brownish l igh t grey to grey-
brown. . The sample consists mostly of d r i l l i n g mud
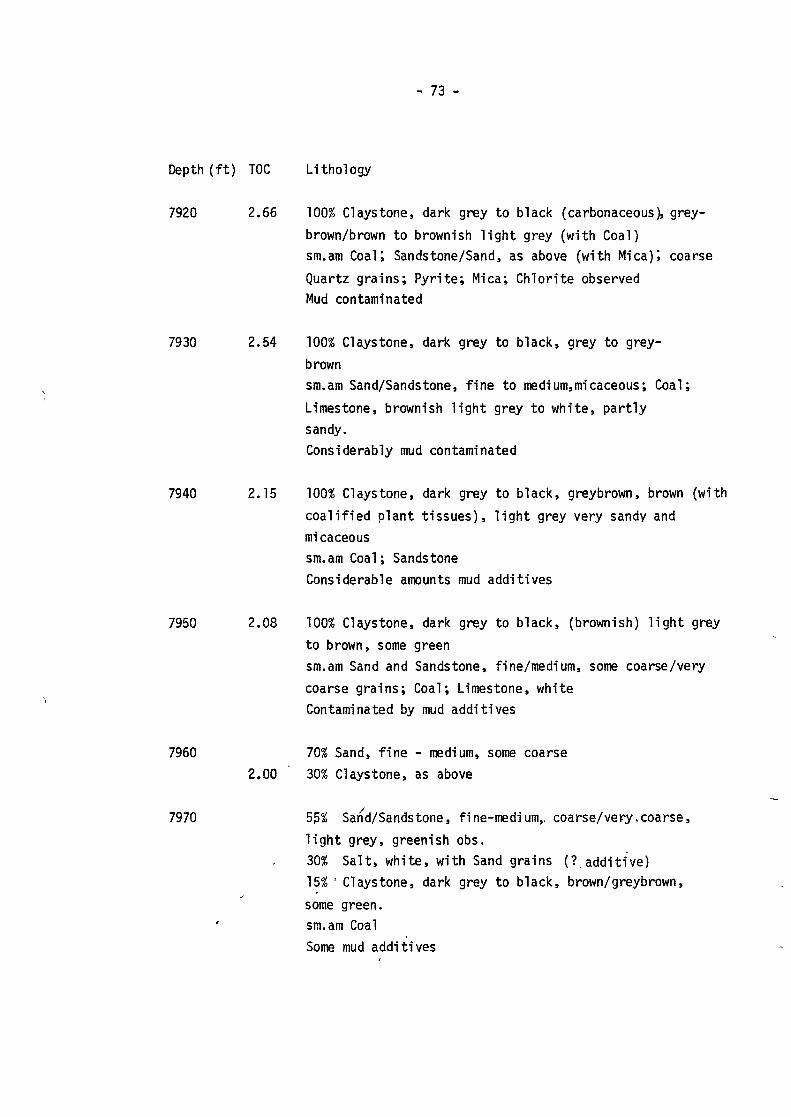
- 73 -
Depth ( f t ) TOC Lithology
7920 2.66 100% Claystone, dark grey to black (carbonaceous), grey-
brown/brown to brownish l igh t grey (with Coal)sm.ara Coal; Sandstone/Sand, as above (with Mica); coarseQuartz grains; Pyr i te; Mica; Chlorite observedMud contaminated
7930 2.54 100% Claystone, dark grey to black, grey to grey-
brown
sm.am Sand/Sandstone, f ine to medium,micaceous; Coal;
Limestone, brownish l igh t grey to white, part ly
sandy.
Considerably mud contaminated
7940 2.15 100% Claystone, dark grey to black, greybrown, brown (with
coal i f ied plant t issues), l i gh t grey very sandy andmicaceoussm.am Coal; SandstoneConsiderable amounts mud additives
7950 2.08 100% Claystone, dark grey to black, (brownish) l i gh t grey
to brown, some green
sm.am Sand and Sandstone, fine/medium, some coarse/very
coarse grains; Coal; Limestone, white
Contaminated by mud additives
7960 70% Sand, f ine - medium, some coarse
2.00 30% Claystone, as above
7970 55% Sand/Sandstone, fine-medium,, coarse/very.coarse,
l i gh t grey, greenish obs.
30% Salt , white, with Sand grains (?.additive)
15% ' Claystone, dark grey to black, brown/greybrown,
some green,
sm.am Coal
Some mud additives
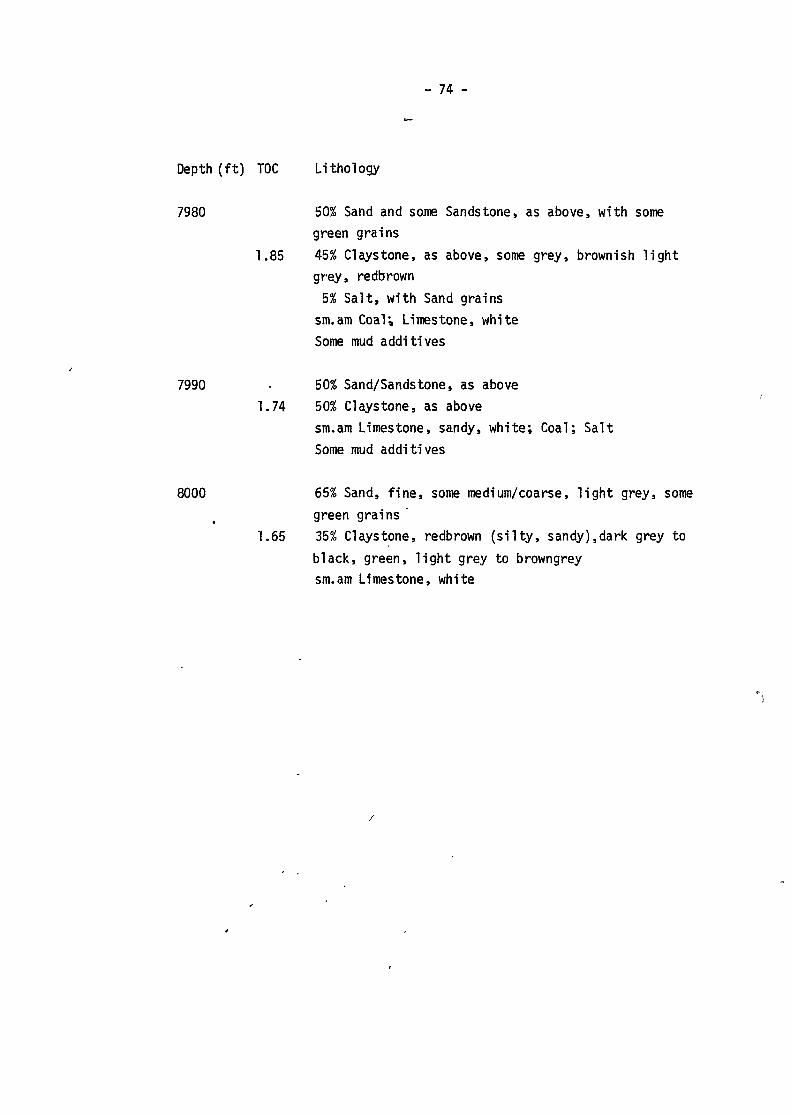
74 -
Depth (ft) TOC Lithoiogy
7980 50% Sand and some Sandstone, as above, with somegreen grains
1.85 45% Claystone, as above, some grey, brownish l i gh t
grey, redbrown
5% Sal t , with Sand grains
sm.am Coal i Limestone, white
Some mud additives
7990 50% Sand/Sandstone, as above
1.74 50% Claystone, as above
sm.am Limestone, sandy, white; Coal; Salt
Some mud additives
8000 65% Sand, f i ne , some medium/coarse, l i gh t grey, some
green grains
1.65 35% Claystone, redbrown ( s i l t y , sandy)sdark grey to
black, green, l i gh t grey to browngrey
sm.am Limestone, white
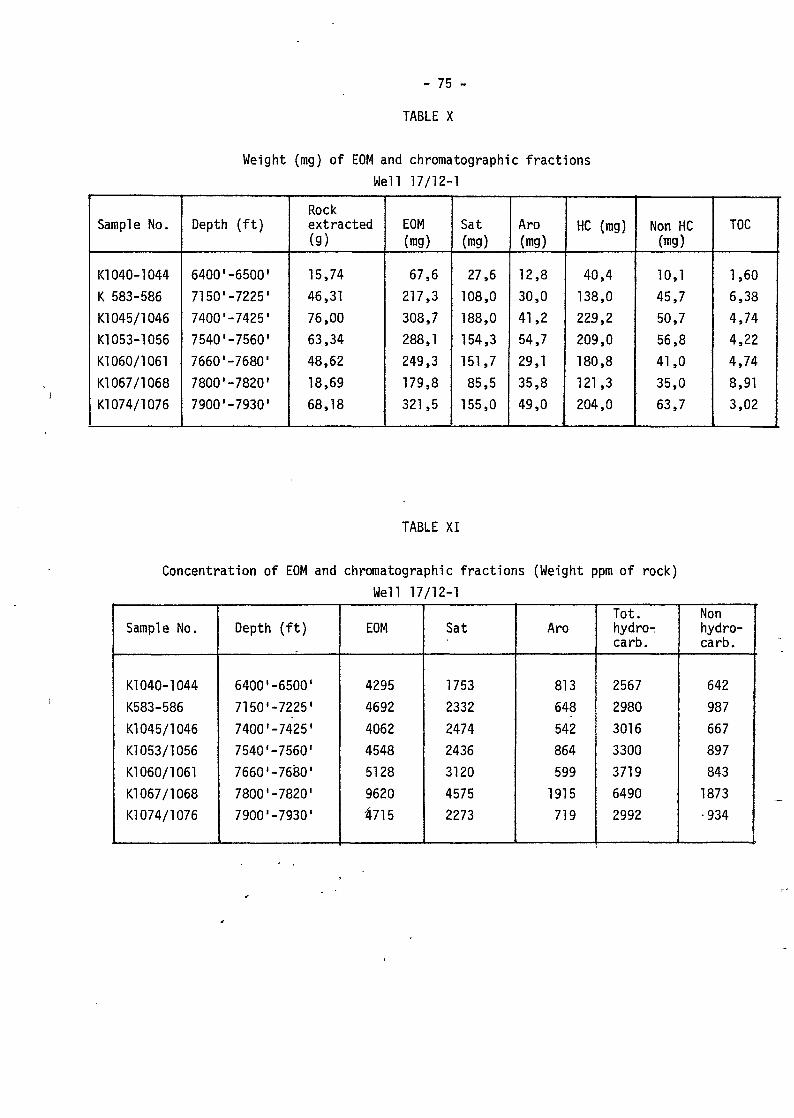
- 75 -
TABLE X
Weight (mg) of EOM and chromatographic fractionsWell 17/12-1
Sample No.
Kl 040-1044
K 583-586
Kl045/1046
Kl053-1056
Kl 060/1061
Kl067/1068
Kl074/1076
Depth ( f t )
6400'-6500'
7150'-7225'
7400'-7425'
7540'-7560'
7660'-7680'
7800•-7820'
7900'-7930'
Rockextracted(g)
15,74
46,31
76,00
63,34
48,62
18,69
68,18
EOM
(mg)
67,6
217,3
308,7
288,1
249,3
179,8
321,5
Sat
(mg)
27,6
108,0
188,0
154,3
151,7
85,5
155,0
Aro
(mg)
12,8
30,0
41,2
54,7
29,1
35,8
49,0
HC (ing)
40,4
138,0
229,2
209,0
180,8
121,3
204,0
Non HC(mg)
10,1
45,7
50,7
56,8
41,0
35,0
63,7
TOC
1,60
6,38
4,74
4,22
4,74
8,91
3,02
TABLE XI
Concentration of EOM and chromatographic fractions (Weight ppm of rock)Well 17/12-1
Sample No.
Kl040-1044
K583-586
Kl 045/1046
Kl 053/1056
Kl060/1061
Kl067/1068
Kl074/1076
Depth ( f t )
6400'-6500'
7150'-7225'
7400'-7425'
7540'-7560'
7660'-7680'
7800'-7820'
7900'-7930'
EOM
4295
4692
4062
4548
5128
9620
'4715
Sat
1753
2332
2474
2436
3120
4575
2273
Aro
813
648
542
864
599
1915
719
Tot.hydro-:carb.
2567
2980
3016
3300
3719
6490
2992
Nonhydro-carb.
642
987
667
897
843
1873
•934
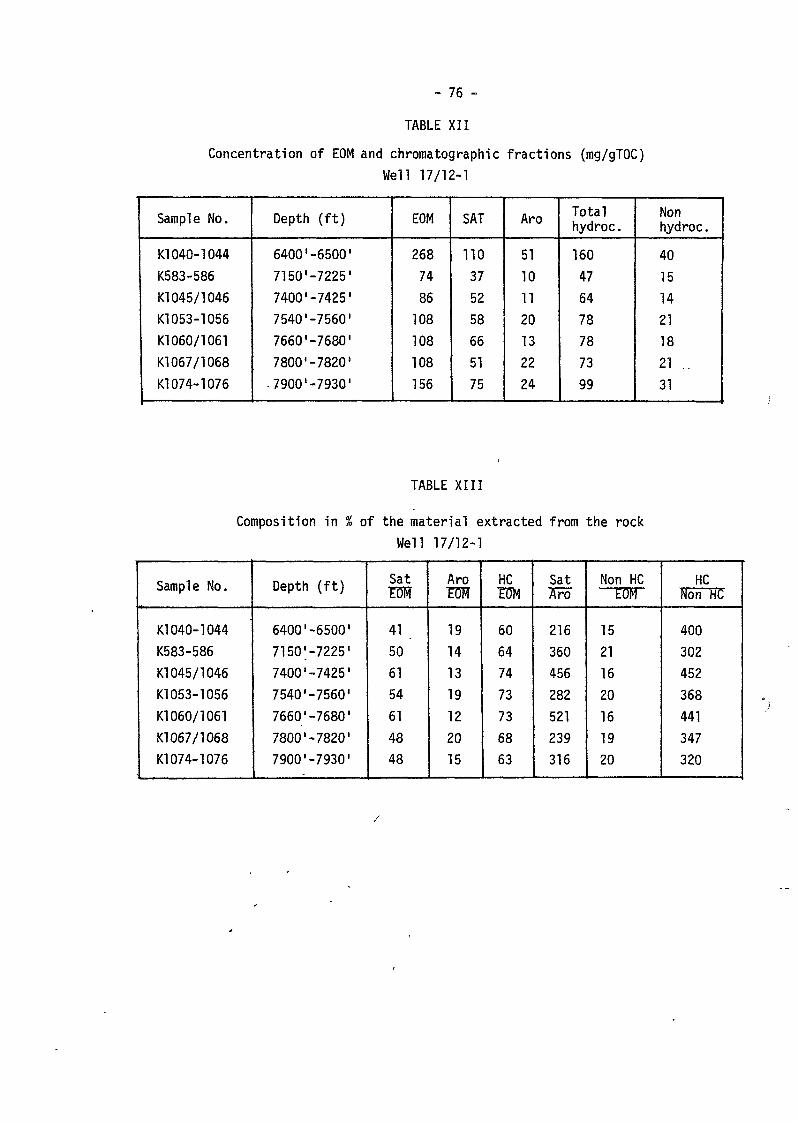
- 76 -
TABLE XII
Concentration of EOM and chromatographic fractions (mg/gTOC)
Well 17/12-1
Sample No.
Kl 040-1044
K583-586
Kl 045/1046
Kl 053-1056
Kl 060/1061
Kl 067/1068
Kl 074-1076
Depth (ft)
6400'-6500'
7150'-7225'
7400'-7425'
7540'-7560'
7660'-7680'
7800'-7820'
7900'-7930'
EOM
268
7486
108
108
108
156
SAT
no37
52
58
66
51
75
Aro
51
10
11
20
13
22
24
Totalhydroc.
160
47
64
78
78
73
99
Nonhydroc.
40
15
14
21
18
21 ..
31
TABLE XIII
Composition in % of the material extracted from the rock
Well 17/12-1
Sample No.
Kl 040-1044
K583-586
Kl045/1046
Kl053-1056
Kl060/1061
Kl067/1068
Kl 074-1076
Depth (ft)
6400'-6500'
7150'-7225'
7400'-7425'
7540'-7560'
7660'-7680'
7800'-7820'
7900'-7930'
SatTM
41
50
61
54
61
48
48
Aro"EOT
19
14
13
19
12
20
15
HC"E0M
60
64
74
73
73
68
63
SatJro
216
360
456
282
521
239
316
Non HCEOM
15
21
16
20
16
19
20
HCNon HC
400
302
452
368
441
347
320
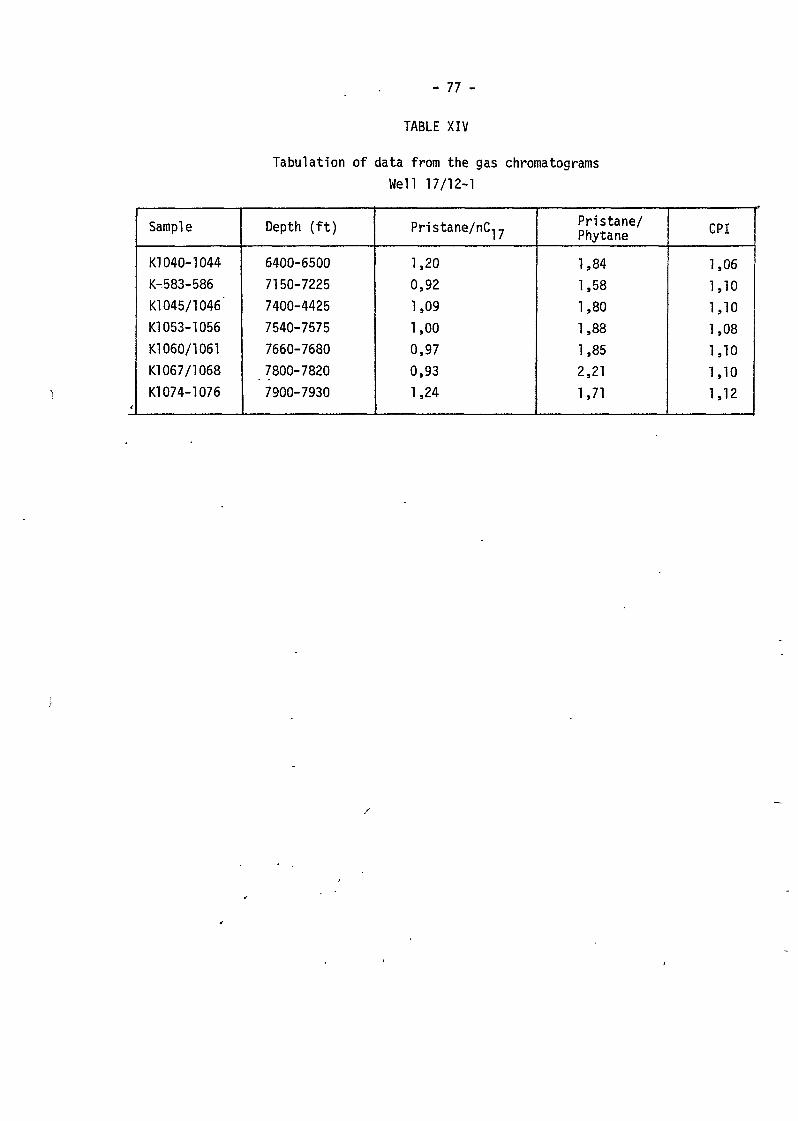
- 77 -
TABLE XIV
Tabulation of data from the gas chromatogramsWell 17/12-1
f
Sampie
K1040-1044
K-.583-586
Kl 045/1046'
K1053-1056
Kl060/1061
Kl067/1068
Kl074-1076
Depth ( f t )
6400-6500
7150-7225
7400-4425
7540-7575
7660-7680
7800-7820
7900-7930
Pristane/nC,y
1,20
0,92
1,09
1,00
0,97
0,93
1,24
Pr istane/Phytane
1,84
1,58
1,80
1,88
1,85
2,21
1,71
GPI
1,06
1,10
1,10
1,08
1,10
1,10
1,12
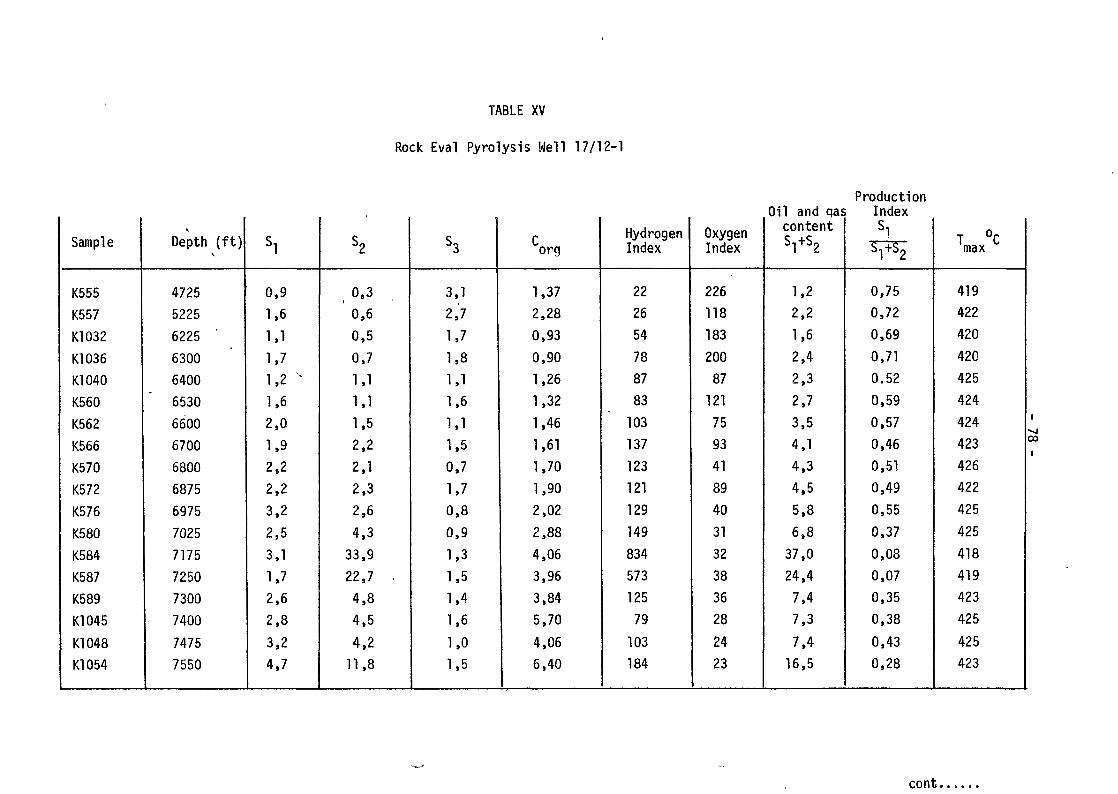
TABLE XV
Rock Eva! Pyrolysis Well 17/12-1
Sample
K555
K557
K1O32
K1036
K1040
K560
K562
K566
K570
K572
K576
K580
K584
K587
K589
K1045
K1048
K1054
Depth (ft)
4725
5225
6225
6300
6400
6530
6600
6700
6800
6875
6975
7025
7175
7250
7300
7400
7475
7550
Sl
0,9
1,6
1,11,7
1,2 v
1,6
2,0
1,92,2
2,2
3,2
2,5
3,1
1,72,6
2,8
3,2
4,7
S2
0,3
0,6
0,5
0,7
1,11,11,5
2,2
2,12,3
2,6
4,3
33,9
22,7 .
4,8
4,5
4,2
11,8
S3
3,12,7
1,7
1,8
1,11,6
1,11,5
0,7
1,70,8
0,9
1,3
1,5
1,4
1,6
1,0
1,5
org
1,37
2,28
0,93
0,90
1,26
1,32
1,46
1,61
1,70
1,90
2,02
2,88
4,06
3,96
3,84
5,70
4,06
6,40
HydrogenIndex
22
26
547887
83
103
137
123
121
129
149
834
573
125
79
103
184
OxygenIndex
226
118
183
200
87
12175
93
4189
40
31
32
38
36
28
2423
Oil and qascontent
s]+s2
1,22,2
1,6
2,4
2,3
2,7
3,5
4,14,3
4,5
5,8
6,8
37,0
24,4
7,47,3
7,416,5
ProductionIndexSl
SyFSJ
0,75
0,72
0,69
0,71
0.52
0,59
0,57
0,46
0,51
0,49
0,55
0,37
0,08
0,07
0,35
0,38
0,43
0,28
T °Cmax
419
422
420
420
425
424424
423
426
422
425
425
418
419
423
425
425
423
00
I
cont.
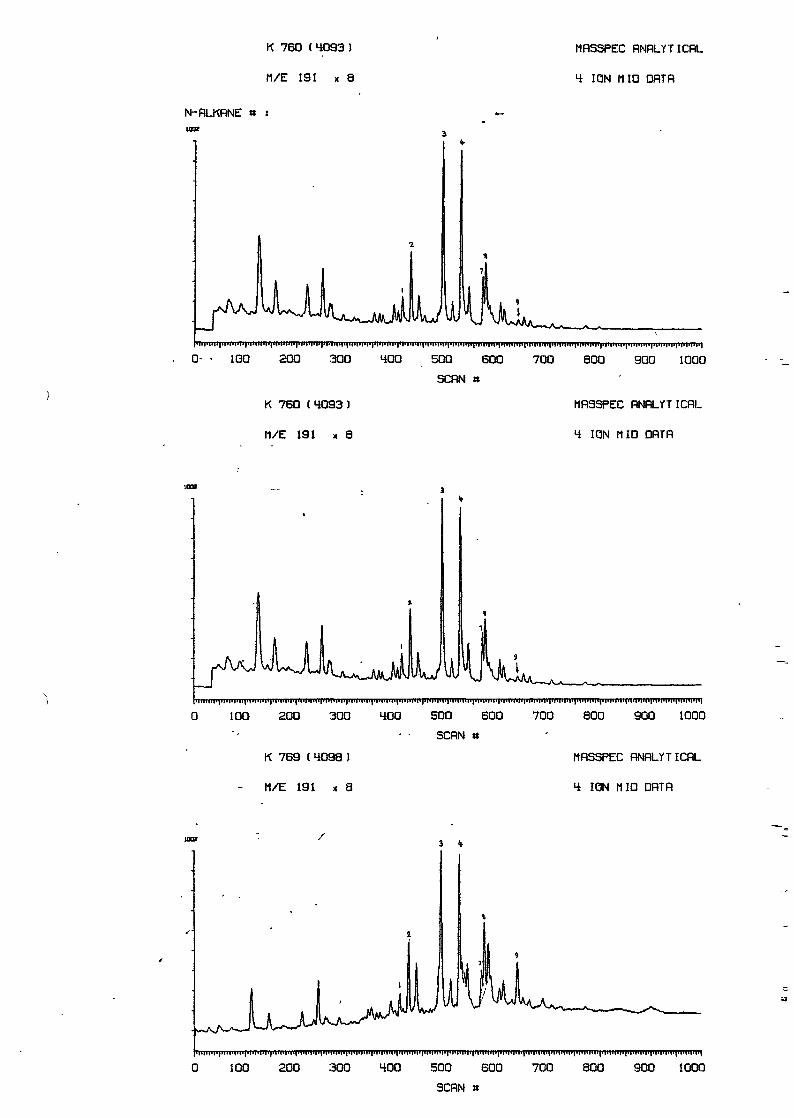
K 76D ( 4093 )
MÆ 191 x 8
N-RLKRNE » s
i
MRSSPEC RNRLYTICRL
4 ION MID DRTR
0- • 100 200 300 400
K 760 (4093)
M/E 191 x 8
500 600
SCRN »
700 800 900 1000
MRSSPEC RNRLYTICRL
4 ION MID DRTR
kj0 10O 200 300 400 500 600 700 800 900 1000
SCRN »
K 769 (4098) MRSSPEC RNRLYTICRL
M/E 191 x 8 4 ION MID DRTR
100 200 300 400 500 600 700 800 900 1000
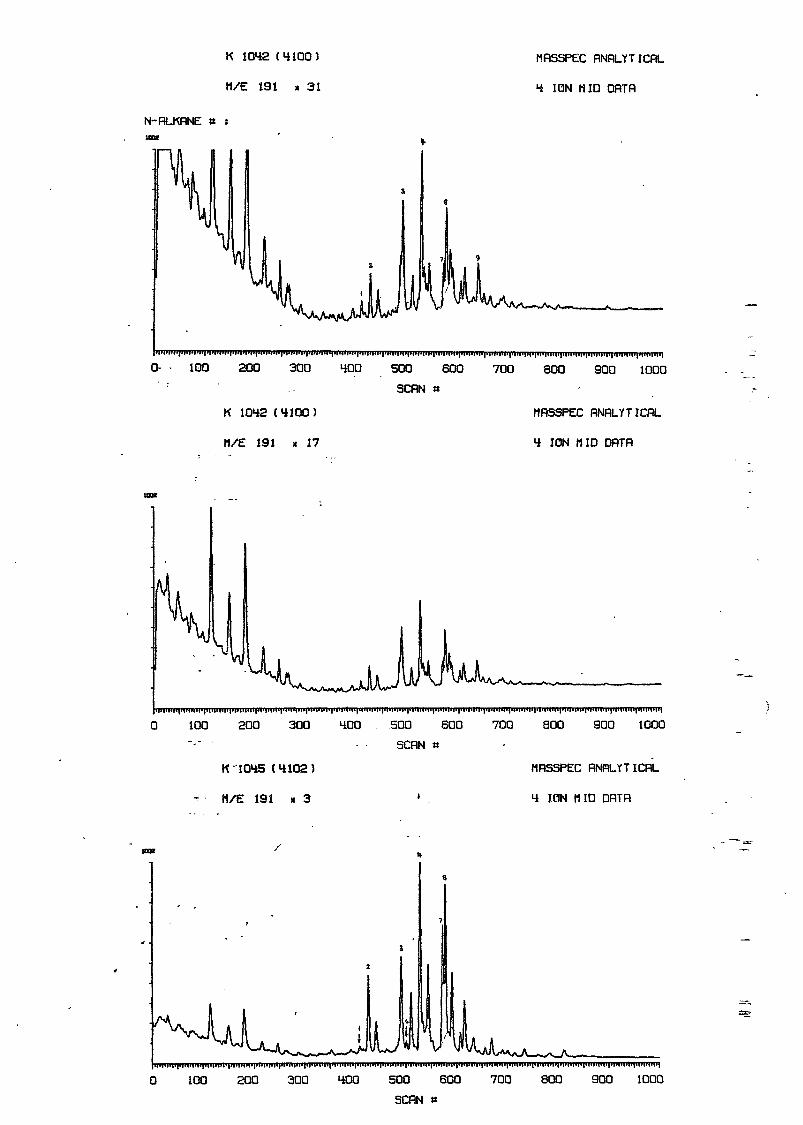
K 1042 ( 4 1 0 0 )
M/E 191 x 31
MRSSPEC RNRLYTICflL
4 ION MID ORTR
N-RLKRNE a s
100 200 300 400
K 1042 (4100)
M/E 191 x 17
500 600 700 800 900 1000
SCflN »
MRSSPEC RNRLYTICflL
4 ION MID ORTR
0 100 200 300 400 . .500 600 700 800 900 1000
"-" • • SCflN «
K'1045 (4102) MRSSPEC RNRLYTICRL
M/E 191 x 3 4 ION MID DRTR
V
0 100 200 300 400 500 600 700 800 900 1000
SCRN a
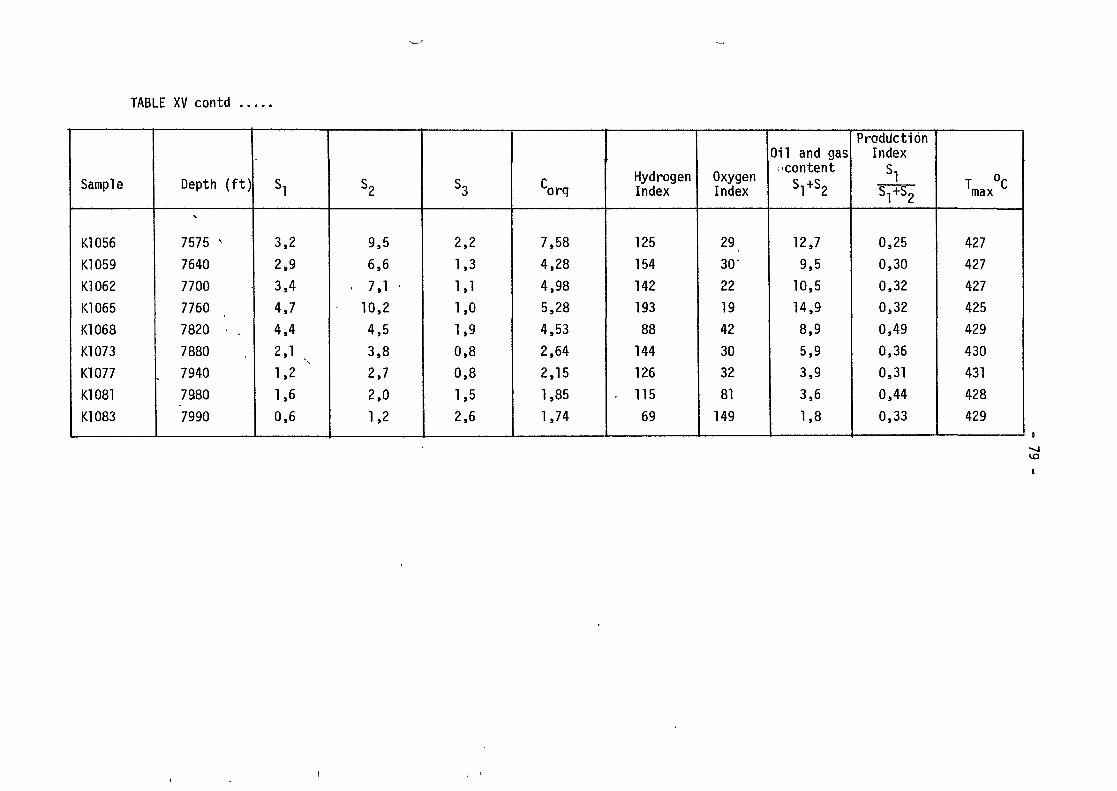
TABLE XV contd
Sample
K1056
K1059
K1062
K1065
K1068
K1073
K1077
K1081
K1083
Depth (ft)
7575 -
7640
7700
7760
7820
7880
7940
7980
7990
Sl
3,2
2,9
3,4
4,7
4,4
1,2
1,6
0,6
S2
9,5
6,6
• 7 , 1 •
10,2
4,5
3,8
2,7
2,0
1,2
S3
2,2
1,3
1,11,0
1,9
0,8
0,8
1,52,6
Corq
7,58
4,28
4,98
5,28
4,53
2,64
2,15
1,85
1,74
HydrogenIndex
125
154
142
193
88
144
126
• 1 1 5
69
OxygenIndex
29
30-
22
19
42
30
32
81
149
Oil and gasi content
s 1 +s 2
12,7
9,5
10,5
14,9
8,9
5,9
3,9
3,6
1,8
ProductionIndex
Sl
0,25
0,30
0,32
0,32
0,49
0,36
0,31
0,44
0,33
T °Cmax
427
427
427
425
429
430
431
428
429
I
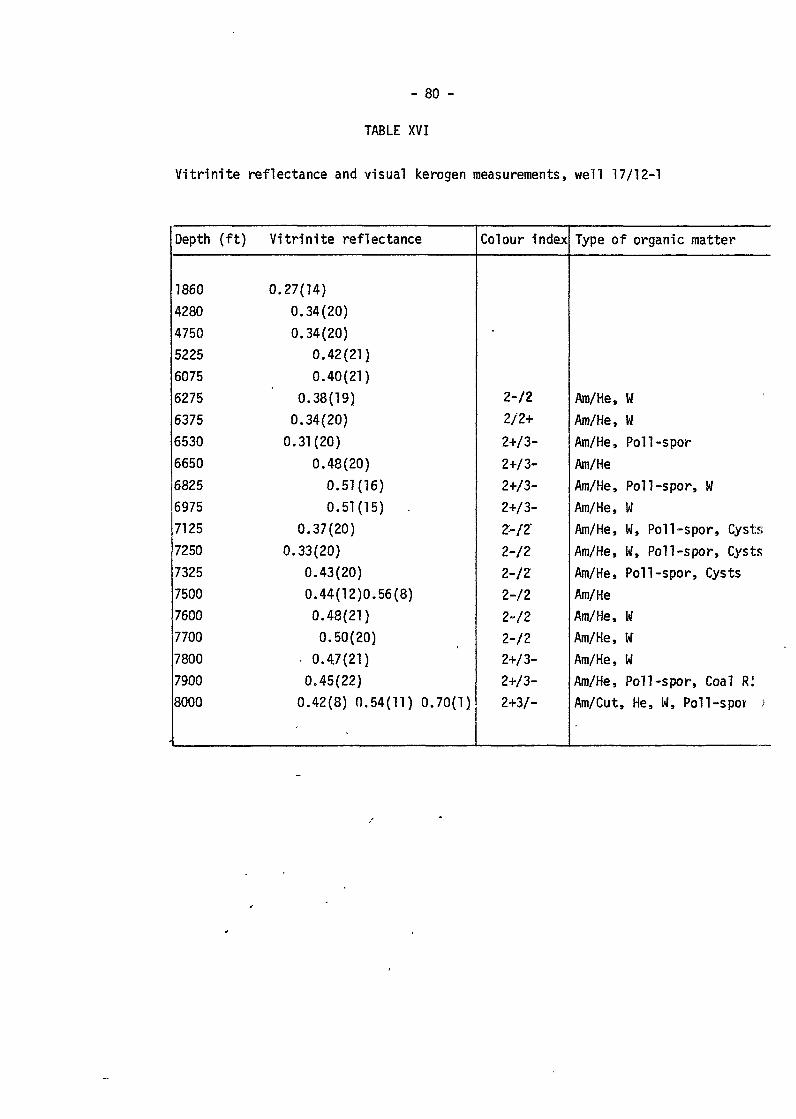
- 80 -
TABLE XVI
V i t r in i te reflectance and visual kerogen measurements, well 17/12-1
Depth (ft)
1860
4280
4750
5225
6075
6275
6375
6530
6650
6825
6975
7125
7250
7325
7500
7600
7700
7800
7900
8000
Vitrinite reflectance
0.27(14)
0.34(20)
0.34(20)
0.42(21)
0.40(21)
0.38(19)
0.34(20)
0.31(20)
0.48(20)
0.51(16)
€.51(15) .
0.37(20)
0.33(20)
0.43(20)
0.44(12)0.56(8)
0.48(21)
0.50(20)
- 0.47(21)
0.45(22)
0.42(8) 0.54(11) 0.70(1)
Colour index
2-/2
2/2+
2+/3-
2+/3-
2+/3-
2+/3-
Z-fZ2-/2
1-/1
1-/1
1-/1
1-/12+/3-
2+/3-
2+3/-
Type of organic matter
Ara/He, W
Am/He, W
Am/He, Poll-spor
Am/He
Am/He, Poll-spor, W
Am/He, W
Am/He, W, Poll-spor, Cysts
Am/He, W, Poll-spor, Cysts
Am/He, Poll-spor, Cysts
Am/He
Am/He, W
Am/He, W
Am/He, W
Am/He, Poll-spor, Coal R!
Am/Cut, He, W, Poll-spor ,»
- 81 -
C: Well 17/12-2
Total Organic Carbon (TOC)
This well had a reasonable sample coverage of the sequence from 6600' to7360', while only spot samples were available from higher up in thewell. On the basis of the TOC measurements, the analysed sequence willbe divided into three zones:
Zone S: - 6580':Only a few measurements, showing very erratic values, due to lack ofsamples, especially in the upper part.
Zone T: 6580' - 6640':
The TOC values of this zone are quite constant, approximately 1.5 %.
Zone U: 6680' - 6720':The TOC values start to increase slightly at 6680' and show a steadyincrease down to 6720'.
Zone V: 6750' - 7000':At approximately 6750' the TOC values show a sudden jump and are foundto vary between 2 and 2.5 % for this zone.
Zone W: 7020' - 7080':At 7020' another sudden jump for the TOC values is found, and most ofthe TOC values, in this zone are found to be approximately 4 %.
Zone X: 7100' : 7160':At 7100' another jump in the TOC values are recorded and the samples inthis zone are found to have TOC values at approximately 6 %.
lone Y: 7180' - 7360':At 7180' the TOC values drop to approximately 3 % with exceptance ofsample 7220' which.has a TOC value of 11.2 %. This is probably caused bycontamination of small particles of coal or mud additive stuck to theclaystone cuttings.
- 82 -
Extraction and Chromatigraphic Separation
No samples were extracted from zones S, T and U mainly due to the smallamount and the qualities of the available samples.
Zone V: Sample; 6740' - 6820' was extracted showing a rich abundanceof extractable hydrocarbons. The saturated/aromatic ratio is very highfor the sample. The gas chromatogram of the saturated hydrocarbon fractionof the sample, shows a smooth, unimodal front biased distribution with alow pristane n-C,y ratio, and a relatively low pristane/phytane ratio.This is in sharp contrast to the analysed samples from well 17/12-1,which have pristane/n-C,y ratios larger or almost equal to 1.0. Thepristane/phytane ratios are also found to be a lot larger in the samplesfrom well 17/12-1 than in the analysed sample from zone V in well 17/12-2.
The total hydrocarbon/TOC ratio of this sample is rather high, and thesample might be contaminated with migrated hydrocarbons or diesel.
Zone W: One sample from this zone, 7000' - 7100' was extracted, showinga rich abundance of extractable hydrocarbons. The sample shows a highHC/TOC ratio which might indicate that this sample is contaminated byhydrocarbons. The saturated/aromatic ratio of this sample is approximatelyof the same value as that found for the sample in the zone above.
The gas chromatogram of the saturated hydrocarbon fraction is almostidentical to the one from the zone above.
Zone X: One sample from this zone, 7120' - 7180', was extracted showinga rich abundance of extractable hydrocarbons.
The HC/TOC ration for thfs sample is a lot lower than in the samplesfrom the zones above and there is also a large change in the saturated/aromatic ratio.
The gas éhromatograms of the saturated hydrocarbon fractions of thesample are almost identical to those from the zones above.
- 83 -
Zone Y: Two samples from this zone, 7200' - 7260' and 7280' - 7360',were extracted both showing a rich abundance of extractable hydrocarbons.The uppermost sample is found to have almost identical parameters to thelowermost sample in zone W (71201 - 7180*) while the lowermost sample,7280' - 7360' is distinctly different both in the composition of hydro-carbons and in the HC/TOC ratio. These parameters are more like thosefound for the sample from zone V and the uppermost sample in zone W. Thegas chromatograms of the saturated hydrocarbon fractions are, however,almost identical to the rest of the samples analysed from this well.
Rock-Eva! Pyrolysis
A total of fifteen samples were pyrolysed by the Rock-Eval method. Theresults are very similar to those found for well 17/12-2 with low hydrogenindex and hydrocarbon detection throughout the most of the analysedsequence. A similar contradiction between the visual kerogen examinationand the Rock-Eval analyses as found for well 17/12-1 is found for thiswell, and the same restriction should be put on the Rock-Eval pyrolysisresults from well 17/12-2 as was done on 17/12-1.
Vitrinite Reflectance
Fourteen samples were analysed for vitrinite reflectance. In the followingeach sample is described, and together with the reflectance data, otherinformation from the analyses are given.
2210': Siltstone, RQ = 0.29(21).The sample has'only a trace of organic material, bitumen staining and afew small particles of vitrinite and 'inertinite. UV light shows a yellowto light orange f 1 uoresce'nce from spores and hydrocarbon specks togetherwith a low exinite content.
3150': Calcareous shale,' RQ = 0.34(14).The sample has only a trace of organic material, bitumen staining and afew particles of vitrinite, inertinite and bitumen. Some reworking. UVlight shows a yellow and yellow/orange fluorescence from spores togetherwith a low exinite content.'
- 84 -
51701: Shale, RQ = 0.35(7).The sample has a low organic content with small particles of inertinite andreworked material with bitumen wisps. Only a trace of poor particles ofvitrinite. UV light shows a yellow and light orange fluorescence fromspores, and a trace of exinite.
5410': Shale and carbonate, R = 0.37(20).The organic material is virtually restricted to shale with an overallmoderate content. Particles of inertinite and reworked material with atrace of true vitrinite as wispy particles. UV light shows a light orangefluorescence from spores and hydrocarbon specks together with a trace ofexinite.
59201: Shale, RQ = 0.38(11) and RQ = 0.63(1).The sample has a low organic content, mostly reworked and inertiniteparticles. Some bitumen staining and a trace of true vitrinite particles.UV light shows a light orange fluorescence from spore fragments and a traceof exinite.
63201: Calcareous siltstone and carbonate, R = 0.38(5).The sample has a low organic content with a few particles of inertinite andreworked material together with a trace of possible vitrinite particles. UVlight shows a light orange fluorescence from spores and a low exinitecontent.
65601: Calcareous shale, RQ = 0.37(9).The sample has .a low organic content with particles of reworked material,and inertinite with bitumen wisps. Only a trace of true vitrinite as wispyparticles and particles. UV light shows only a light to mid-orange fluorescencefrom spores and a low exinite content.
66001: Mixed shale lithology, RQ = 0.38(22).The sample has a low to moderate organic content, mostly gnarled particlesof reworked material and inertinite. Some bitumen wisps and wispy particlestogether with particles of true vitrinite are recorded. UV light shows alight orange fluorescence from spores and hydrocarbon specks together witha low'exinite content.
- 85 -
6720': Shale, RQ = 0.37(20).The sample has a moderate organic content with particles of reworkedmaterial and inertinite dominating. Bitumen wisps and a trace of smallvitrinite particles are recorded. UV light shows a yellow to orange andlight orange fluorescence from spores, rather dull, and a moderate exinitecontent.
6860': Shale and carbonate, RQ = 0.37(7).The sample has a low organic content with bitumen wisps and small particlesof inertinite and reworked material. Only a handful of small particles ofdoubtful vitrinite located. UV light shows a yellow/orange and lightorange fluorescence from spores and a moderate exinite content.
7000': Shale, RQ = 0.38(7).
The sample has a moderate organic content with small particles of reworkedmaterial and vitrinite. Plentiful bitumen wisps and only a trace of doubtfultrue vitrinite particles. UV Light shows a yellow to light orange fluorescencefrom spores and a moderate to rich exinite content.
7160': Coal, carbargillite and shale, R = 0.39(23).The coal, wholly vitrinite, is rather scruffy, showing cell structure. Inthe carbargillite the inertinite particles is dominant, but with some goodvitrinite wisps. UV light shows a yellow fluorescence from hydrocarbonspecks plus light orange spores and a low to moderate exinite content.
7300': Calcareous shale, RQ = 0.43(21).
The sample has a low organic content, mostly particles of reworked materialand inertinite. A little bitumen staining and a few coal fragments plus atrace of vitrinite particles. UV light shows a light orange fluorescencefrom spores and a low exinite content.
7360': Coal, carbargillite and shale, RQ = 0.39(22).Vitrinite is dominant in the sample but very "scruffy" looking and withvariable reflectance. UV.light shows a yellow to orange and light orangefluorescence from spores and algae together with a moderate exinite content.
- 86 -
Visual Kerogen
Twenty-three samples were investigated to evaluate kerogen compositionand maturity of the organic residues.
The finely dispersed residues are all such as derived from marine toshallow marine sites of deposition: Sapropel is dominant. Besides whichis recorded 5-10 % finely dispersed terrestric remains down to 71001.There are increased amounts of terrestric material in the lowest 200' ofthe well. To distinguish any zonation, also undissolved heavy mineralsand possibly caved material or mud additives were considered since suchfactors may be of importance especially in intervals poor in indigenousorganic material.
65601. and 65801:Sapropel dominates, but remaining undissolved crystals distinguish thesamples from the interval below (6620').Colour index: -2.
6620' to 66401:Sapropel dominates and is partly recovered as aggregates. Black coalfragments recorded, may represent mud additives.Colour index: -2.
66801 to 6820':Sapropel is dominant. The upper part of the interval is characterized byundissolved minerals, the lower 80' by aggregates. .Colour index: -2.
6860' to 6940'^ .Sapropel dominates. Palynomorphs are frequently observed.Colour index: -2.
6980' to 7140':Sapropel dominates arid is often reporded as aggregates, increasing to7100' and decreasing further up in the interval. Terrestric remainsincluding cuticles are more frequent at 7100' and 7140'.Colour index: -2/2.
- 87 -
7180' to 7220':Sapropel dominates. Palynomorphs are frequent.Colour index: 2.
7260' to 7350':
Sapropel dominates. Terrestric material includes cuticles and suggestedreworked fragments. Undissolved minerals are present. The interval seems togive evidence of more deltaic conditions then above.Colour index: 2.
Analysis of oil from well 17/12-2
An oil sample from well 17/12-2, 7078' - 7094', was also received andanalysed in the same way as the oil from well 17/12-1. The gas chromato-grams of the saturated hydrocarbon fraction and the whole oil are quitedifferent from the sample from well 17/12-1. Firstly the amount of n-alkanes lighter than n-Cj5 are.less in 17/12-2 than in 17/12-1, and adistinct maximum is seen at n-C-6 for the oil from 17/12-2. The pristane/n-C,7 ratio is larger than 1.0 in 17/12-2, while it was distinctly smallerin 17/12-1. The pristane/phytane ratio is almost equal to 1.0 in 17/12-2while it was quite low in 17/12-1. The only similarity found between thetwo oils is their strange n-alkane distributions discussed previously. Thedifference in the composition of this sample compared to the sample from17/12-1 could either be caused by a difference in thermal alteration forthe two samples or that the percentage from the two suggested source rocksis different in 17/12-1 compared to 17/12-2.
Comparison between the Oils and the Sediment Extracts from Well 17/12-1and 17/12-2
When the gas chromatograms of the saturated hydrocarbon fractions of theextracts from well 17/12-1 and 17/12-2 are compared with the gas chromato-grams from the respective oils it is noted that the extracts from 17/12-1,which are found to be contaminated with either mud additive (diesel),migrated hydrocarbons or both, have a strong resemblence to the oil fromM/M-Zt especially in the medium m.w. area (nC,, - nC 2 Q ) , while there isa strong deficit of heavy n7alkanes in the extracts. Similar resemblance is
also seen between the saturated hydrocarbon fractions of the extracts fromthe sediments in well 17/12-2 and the oil from well 17/12-1.
Due to this we cannot exclude an error in labelling on the two oil samplessent our institute. It has, however, been too short a time after analysesof these samples to get new samples from England and conduct new analyses.
Source Rock Evaluation
On the background of the previous discussed results, the analysed sequenceof the well will be classified as immature.
Based on total organic carbon measurements, the analysed sequence isdivided into, four zones which will be given the following rating.
Zone S: -658O1:. Only a few samples were received from this interval.The TOC values are very erratic and there was not enough material for acomplete study. Due to this a source rock rating will not be given.
Zone T: 65801 - 66401: The TOC values are quite constant for this zone,approximately 1.5 %. The visual kerogen show the zone to contain mainlyamorphous material and the zone is rated to have a fair to good potentialas a source rock for oil and gas. Fluorescing hydrocarbons in the lowerpart of this zone indicate migrated hydrocarbons.
i
Zone U: 66801 - 6720': This zone is separated out from the zone above dueto a steady increase in the TOC values, it will, however, be given the samerating as zone T.
Zone V: 67501 - 70001: The TOC values in this zone are noticeably higherthan in the zone above, approximately 2 - 2.5 %. The yield of extractablehydrocarbons indicates contamination by either migrated hydrocarbons ordiesel, while the gas chromatogram of the saturated hydrocarbons favoursthe latter. The kerogen is completely dominated by amorphous material whilethe Rock-Eval pyrolysis shows a medium hydrogen index and a low oxygenindex. The pyrolysis measurements also indicate that the samples from thisinterval are contaminated by hydrocarbons. Based on this, this zone will berated to have a good to rich potential as a source rock for oil and gas.
- 89 -
Zone W: 70201 - 70801: The TOC values in this zone are found to be approxi-mately 4 % while the extraction gives a rich abundance of extractablehydrocarbons. The yield is, however, noticeably lower, measured in mg HC/gTOC,than the zone above and the contaminations of free hydrocarbons is thereforebelieved not to be as pronounced as in zone V. The visual kerogen examinationstill shows the samples to be dominated by amorphous kerogen while the RockEva! pyrolysis shows both a low hydrogen and oxygen index. Based on this,zone W will be rated to have a rich potential as a source rock for oil andgas.
Zone X: 7100' - 7160': The TOC values are somewhat higher for this zonethan the zone above and the extraction shows a rich abundance of extractablehydrocarbons. The visual kerogen examination shows a larger impact ofterrestric material than in the zone above. This zone will on the backgroundof this be rated to have a rich potential as a source rock for gas and oil.
Zone Y: 7180' - 7360': The TOC values drop sharply at the start of thiszone and are approximately 3 % for most of the zone. The kerogen compositionchanges in this zone compared to the zones above to a more terrestricorigin. Based on these analyses, together with the Rock Eva! pyrolysis andextraction results, this zone will be rated to have a rich potential as asource rock for gas and oil. Extraction and fluorescing hydrocarbons indicatemigrated hydrocarbons in parts of this zone, probably mixed with dieselfrom the drilling mud..
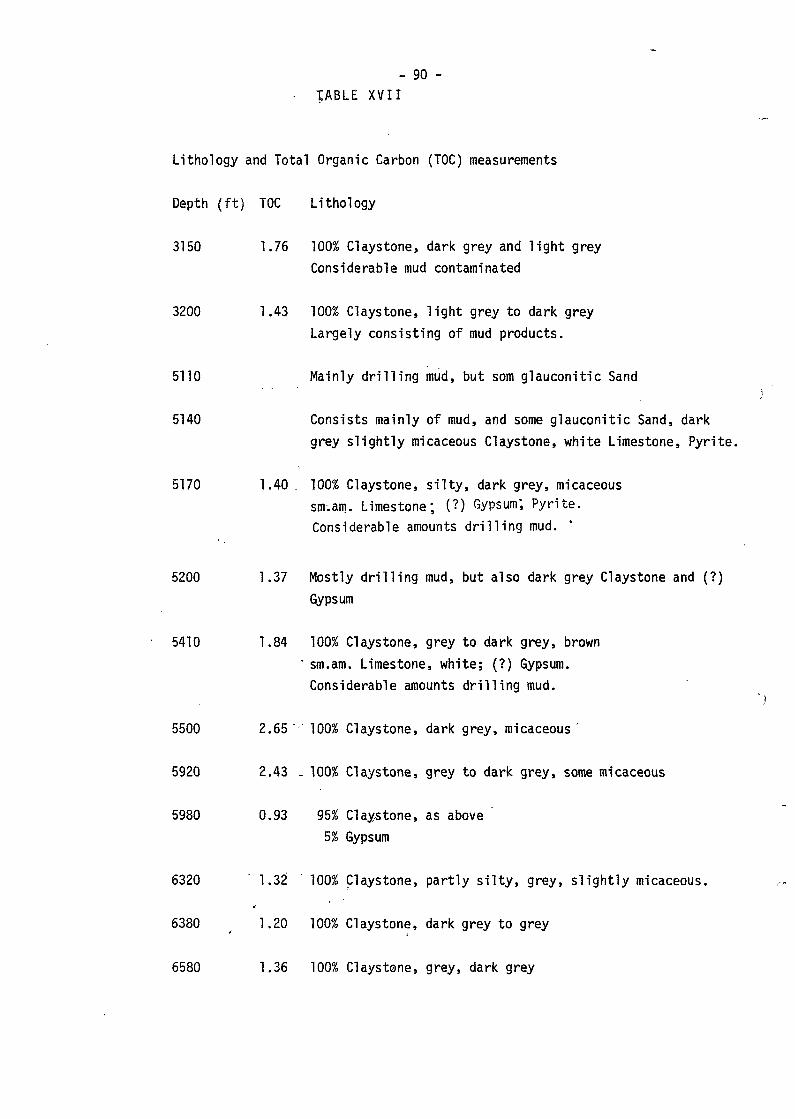
- 90 -
TABLE XVII
Lithology and Total Organic Carbon (TOC) measurements
Depth (ft) TOC Lithology
3150 1.76 100% Claystone, dark grey and light grey
Considerable mud contaminated
3200 1.43 100% Claystone, light grey to dark grey
Largely consisting of mud products.
5110 Mainly drilling mud, but som glauconitic Sand
5140 Consists mainly of mud, and some glauconitic Sand, dark
grey slightly micaceous Claystone, white Limestone, Pyrite.
5170 1.40 . 100% Claystone, silty, dark grey, micaceoussm.am. Limestone; (?) Gypsum; Pyrite.Considerable amounts drilling mud. '
5200 1.37 Mostly drilling mud, but also dark grey Claystone and (?)
Gypsum
5410 1.84 100% Claystone, grey to dark grey, brown
' sm.am. Limestone, white; (?) Gypsum.
Considerable amounts drilling mud.
5500 2.65 100% Claystone, dark grey, micaceous '
5920 2.43 - 100% Claystone, grey to dark grey, some micaceous
5980 0.93 95% Clay-stone, as above
5% Gypsum
6320 1.32 100% Claystone, partly silty, grey, slightly micaceous.
6380 t 1.20 100% Claystone, dark grey to grey
6580 1.36 100% Claystone, grey, dark grey
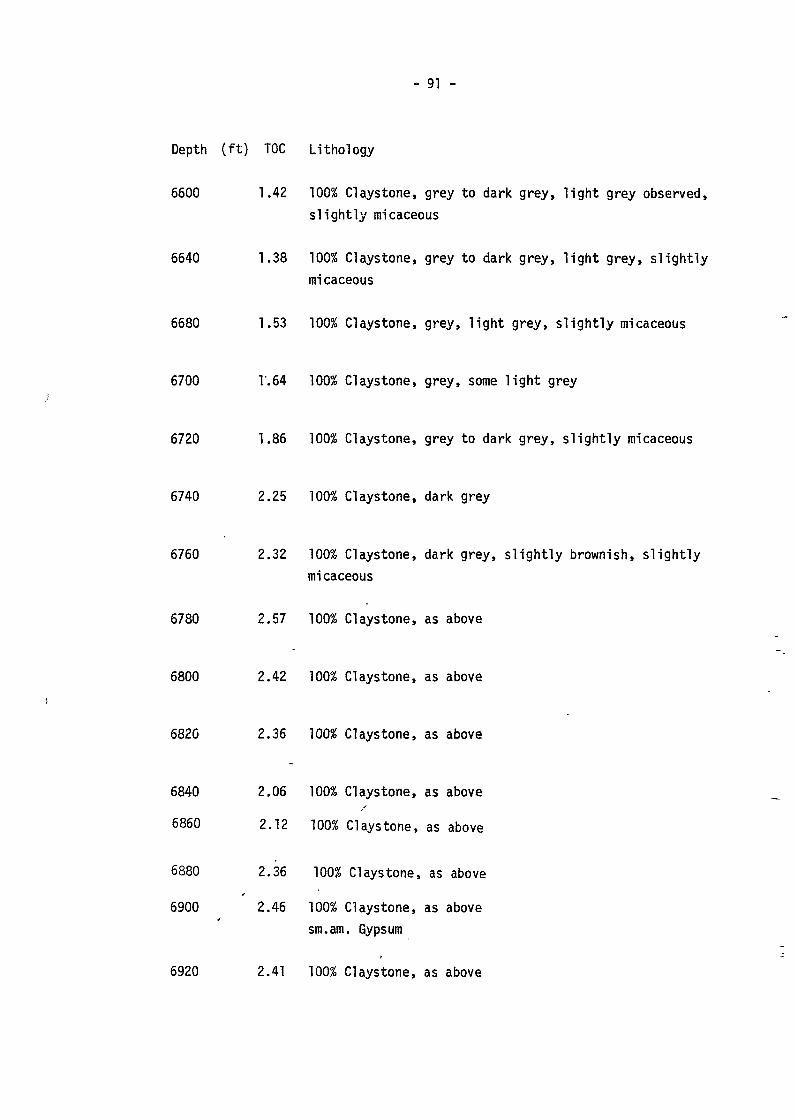
- 91 -
Depth (ft) TOC Lithology
6600 1.42 100% Claystone, grey to dark grey, light grey observed,
slightly micaceous
6640 1.38 100% Claystone, grey to dark grey, light grey, slightly
micaceous
6680 1.53 100% Claystone, grey, light grey, slightly micaceous
6700 V.64 1001 Claystone, grey, some light grey
6720 1.86 100% Claystone, grey to dark grey, slightly micaceous
6740 2.25 100% Claystone, dark grey
6760 2.32 100% Claystone, dark grey, slightly brownish, slightly
micaceous
6780 2.57 100% Claystone, as above
6800 2.42 100% Claystone, as above
6820 2.36 100% Claystone, as above
6840 2.06 100% Claystone, as above
6860 2.12 100% Claystone, as above
6880 2.36 100% Claystone, as above
6900 2.46 100% Claystone, as above
sm.am. Gypsum
6920 2.41 100% Claystone, as above
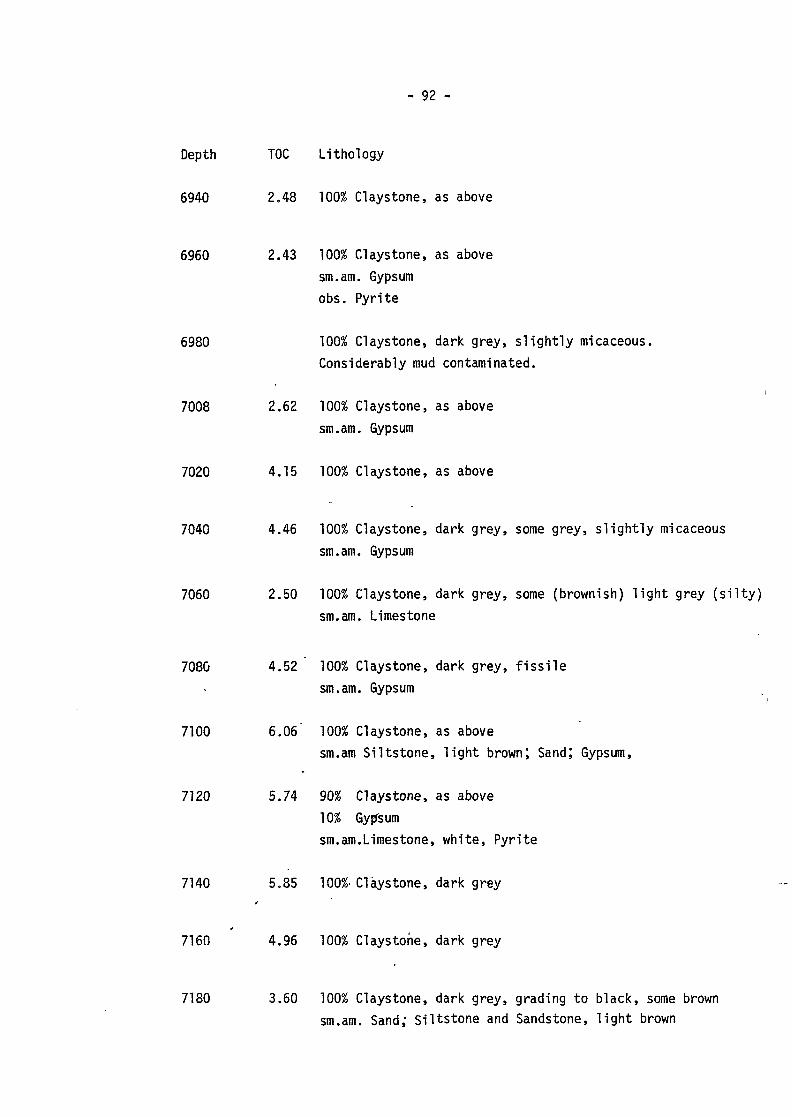
- 92 -
Depth TOC Lithology
6940 2.48 100% Claystone, as above
6960 2.43 100% Claystone, as abovesm.am. Gypsumobs. Pyrite
6980 100% Claystone, dark grey, slightly micaceous.Considerably mud contaminated.
7008 2.62 100% Claystone, as abovesm.am. Gypsum
7020 4.15 100% Claystone, as above
7040 4.46 100% Claystone, dark grey, some grey, slightly micaceoussm.am. Gypsum
7060 2.50 100% Claystone, dark grey, some (brownish) light grey (silty)sm.am. Limestone
7080 4.52 100% Claystone, dark grey, fissilesm.am. Gypsum
7100 6.06 100% Claystone, as abovesm.am Siltstone, light brown; Sand; Gypsum,
7120 5.74 90% Claystone, as above10% Gyp's urnsm.am.Limestone, white, Pyrite
7140 5.85 100%- Claystone, dark grey
7160 4.96 100% Claystohe, dark grey
7180 3.60 100% Claystone, dark grey, grading to black, some brownsm.am. Sand; Siltstone and Sandstone, light brown
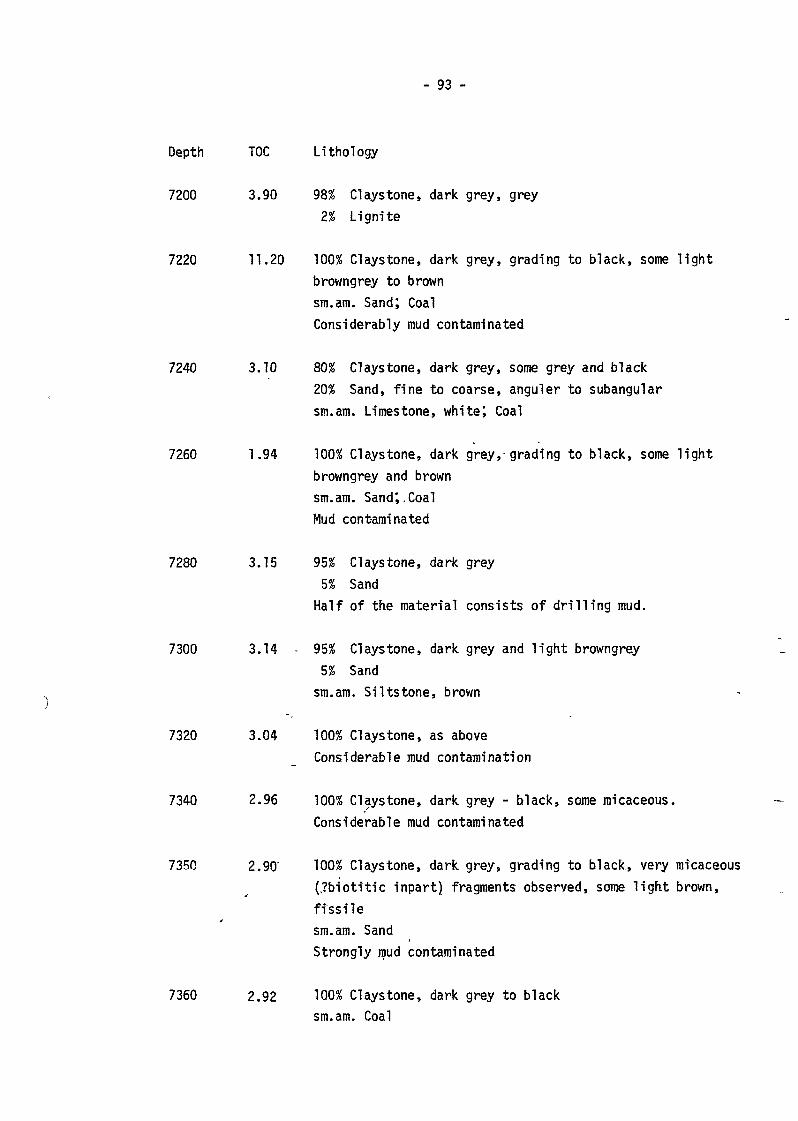
- 93 -
Depth TOC Lithology
7200 3.90 98$ Claystone, dark grey, grey
2% Lignite
7220 11.20 100% Claystone, dark grey, grading to black, some light
browngrey to brown
sm.am. Sand; Coal
Considerably mud contaminated
7240 3.10 80% Claystone, dark grey, some grey and black
20% Sand, fine to coarse, anguler to subangglar
sm.am. Limestone, white; Coal
7260 1.94 100% Claystone, dark grey, grading to black, some light
browngrey and brown
sm.am. Sand;.Coal
Mud contaminated
7280 3.15 95% Claystone, dark grey
5% Sand
Half of the material consists of drilling mud.
7300 3.14 - 95% Claystone, dark grey and light browngrey
5% Sand
sra.am. Siltstone, brown
7320 3.04 100% Claystone, as above
Considerable mud contamination
7340 2.96 100% Claystone, dark grey - black, some micaceous.
Considerable mud contaminated
7350 2.90' 100% Claystone, dark grey, grading to black, very micaceous
(,?biotitic inpart) fragments observed, some light brown,
fissile
sm.am. Sand
Strongly mud contaminated
7360 2.92 100% Claystone, dark grey to blacksm.am. Coal
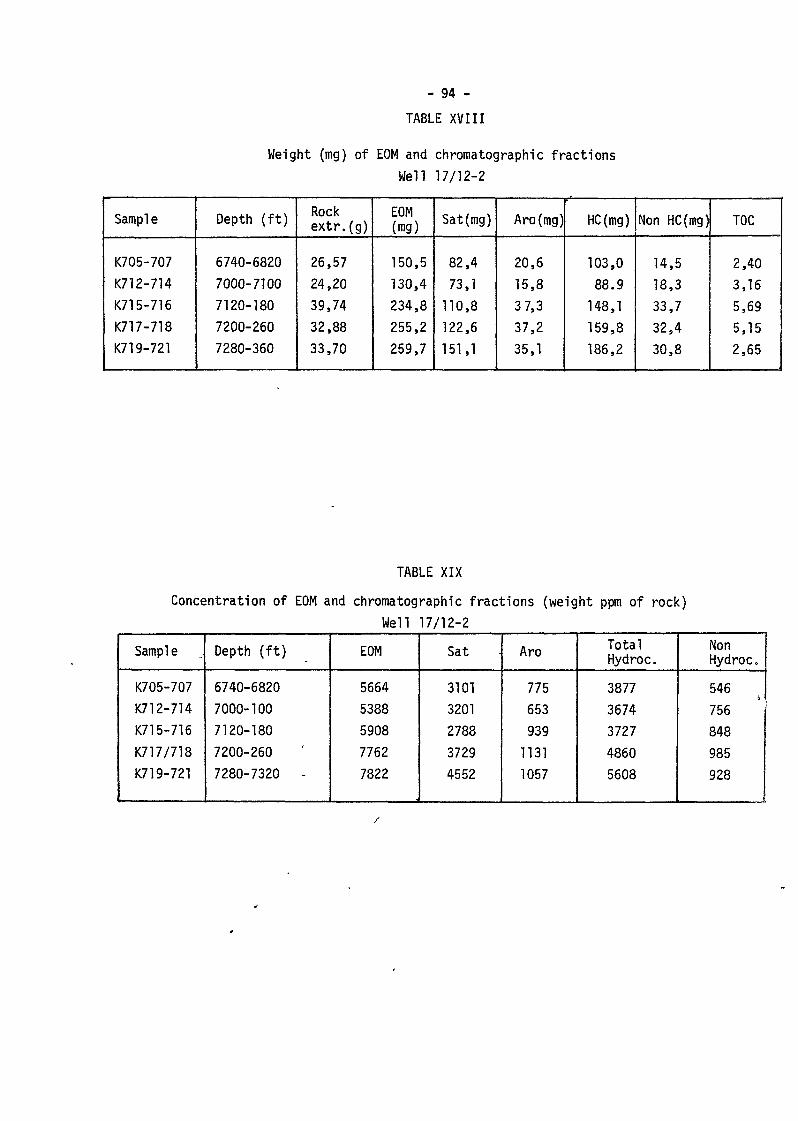
- 94 -
TABLE XVIII
Weight (mg) of EOM and chromatographic fractions
Well 17/12-2
Sample
K705-707
K712-714
K715-716
K717-718
K719-721
Depth (ft)
6740-6820
7000-7100
7120-180
7200-260
7280-360
Rockextr.(g)
26,57
24,20
39,74
32,88
33,70
EOM(mg)
150,5
130,4
234,8
255,2
259,7
Sat(mg)
82,4
73,1
110,8
122,6
151,1
Aro(mg)
20,6
15,8
3 7,3
37,2
35,1
HC(mg)
103,0
88.9
148,1
159,8
186,2
Non HC(mg)
14,5
18,3
33,7
32,4
30,8
TOC
2,40
3,16
5,69
5,15
2,65
TABLE XIX
Concentration of EOM and chromatographic fractions (weight ppm of rock)
Well 17/12-2
Sample
K705-707
K712-714
K715-716
K717/718
K719-721
Depth (ft)
6740-6820
7000-100
7120-180
7200-260
7280-7320 -
EOM
5664
5388
5908
7762
7822
Sat
3101
3201
2788
3729
4552
Aro
775
653
939
1131
1057
TotalHydroc.
3877
3674
3727
4860
5608
NonHydroc.
546
756 |
848
985
928
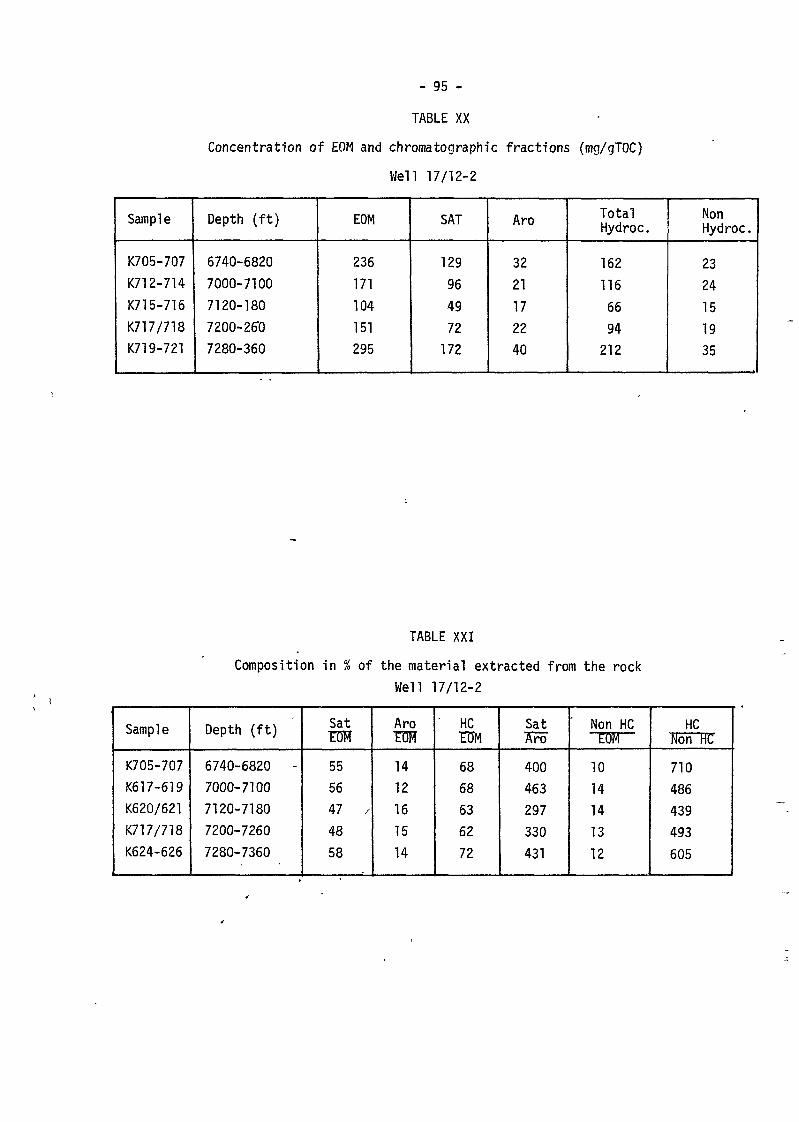
- 95 -
TABLE XX
Concentration of EOM and chromatographic fractions (mg/gTOC)
Well 17/12-2
Sample
K705-707
K712-714
K715-716
K717/718
K719-721
Depth ( f t )
6740-6820
7000-7100
7120-180
7200-260
7280-360
EOM
236
171
104
151
295
SAT
129
96
49
72
172
Aro
32
21
17
22
40
TotalHydroc.
162
116
66
94
212
NonHydroc.
23
24
15
19
35
TABLE XXI
Composition in % of the material extracted from the rockWell 17/12-2
Sample
K705-707
K617-619
K620/621
K717/718
K624-626
Depth ( f t )
6740-6820 -
7000-7100
7120-7180
7200-7260
7280-7360
SatIDM
55
56
47 /
48
58
AroIDM
14
12
16
15
14
' HCIDM
68
68
63
62
72
SatAro
400
463
297
330
431
Non HCEOM
10
14
14
13
12
HCNon HC
710
486
439
493
605
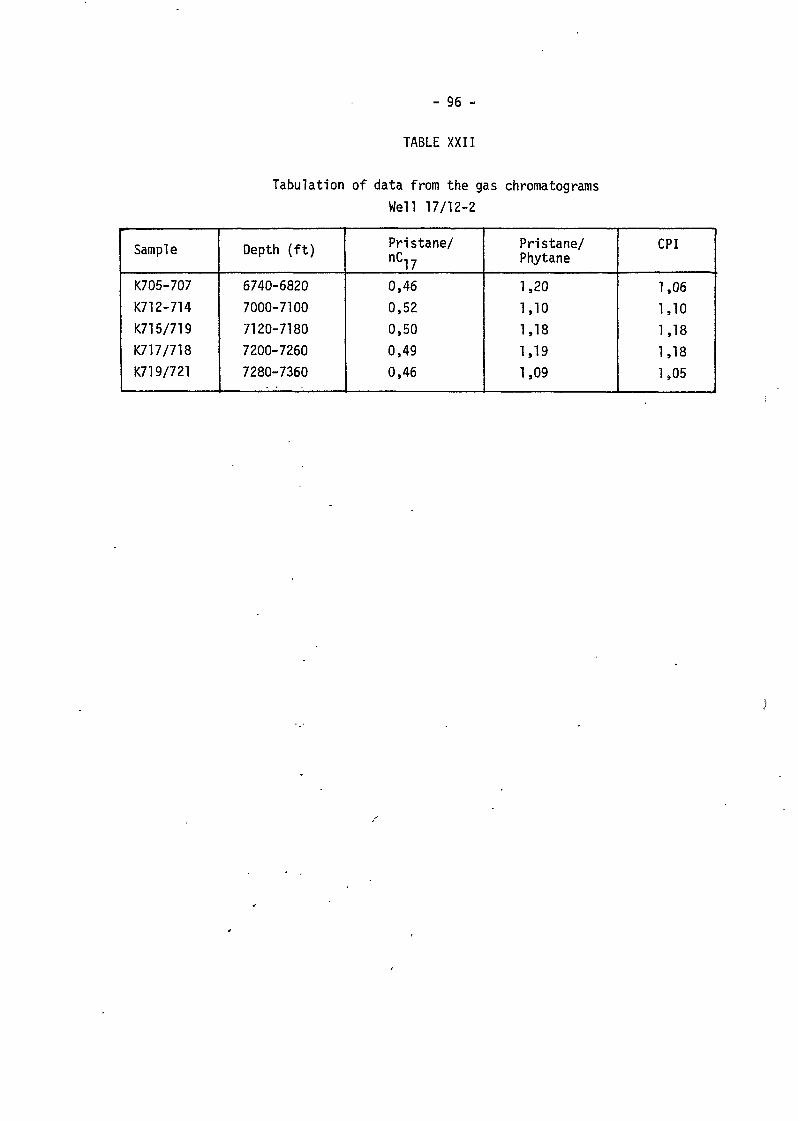
- 96 -
TABLE XXII
Tabulation of data from the gas chromatogramsWell 17/12-2
Sample
K705-707
K712-714
K715/719
K717/718K719/721
Depth ( f t )
6740-6820
7000-7100
7120-7180
7200-7260
7280-7360
Pristane/nC]7
0,46
0,52
0,50
0,49
0,46
Pristane/Phytane
1,20
1,10
1,18
1,191,09
CPI
1,06
1,10
1,18
1,18
1,05
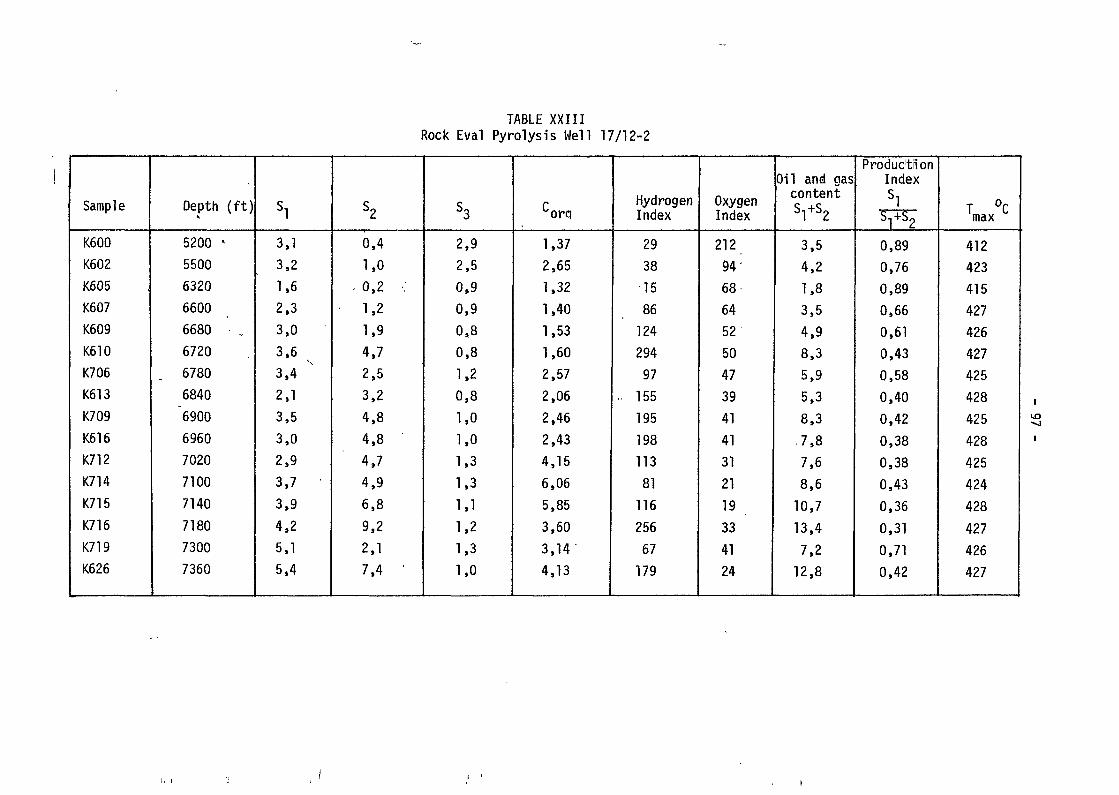
TABLE XXII IRock Eval Pyrolysis Well 17/12-2
Sample
K600
K602
K605
K607
K609
K610
K706
K613
K709
K616
K712
K714
K715
K716
K719
K626
Depth (ft)
5200 -
5500
6320
6600
6680
6720
6780
6840
6900
6960
7020
7100
7140
7180
7300
7360
Sl
3,1
3,2
1,6
2,3
3,0
3,6
3,4
2,13,5
3,0
2,9
3,7
3,9
4,2
5,1
5,4
S2
0,4
1,0. 0,2 •:
1,2
1,9
4,7
2,5
3,2
4,8
4,8
4,7
4,9
6,8
9,2
2,17,4 '
S3
2,9
2,5
0,9
0,9
0,8
0,8
1,2
0,8
1,0
1,0
1,3
1,3
1,11,21,3
1,0
corq
1,37
2,65
1,32
1,40
1,53
1,60
2,57
2,06
2,46
2,43
4,15
6,06
5,85
3,60
3,14
4,13
HydrogenIndex
29
38
15
86
124
294
97
. 155
195
198
113
81
116
256
67
179
OxygenIndex
21294-
68
64
52
50
47
39
41
4131
21
19
33
41
24
Oil and gascontent
s 1 +s 2
3,5
4,2
1,8
3,5
4,9
8,3
5,9
5,3
8,3
,7,8
7,6
8,6
10,7
13,4
7,2
12,8
ProductiionIndexSl
Sl+S2
0,89
0,76
0,89
0,66
0,61
0,43
0,58
0,40
0,42
0,38
0,38
0,43
0,36
0,31
0,71
0,42
T °Cmax
412
423
415
427
426
427
425
428
425
428
425
424
428
427
426
427
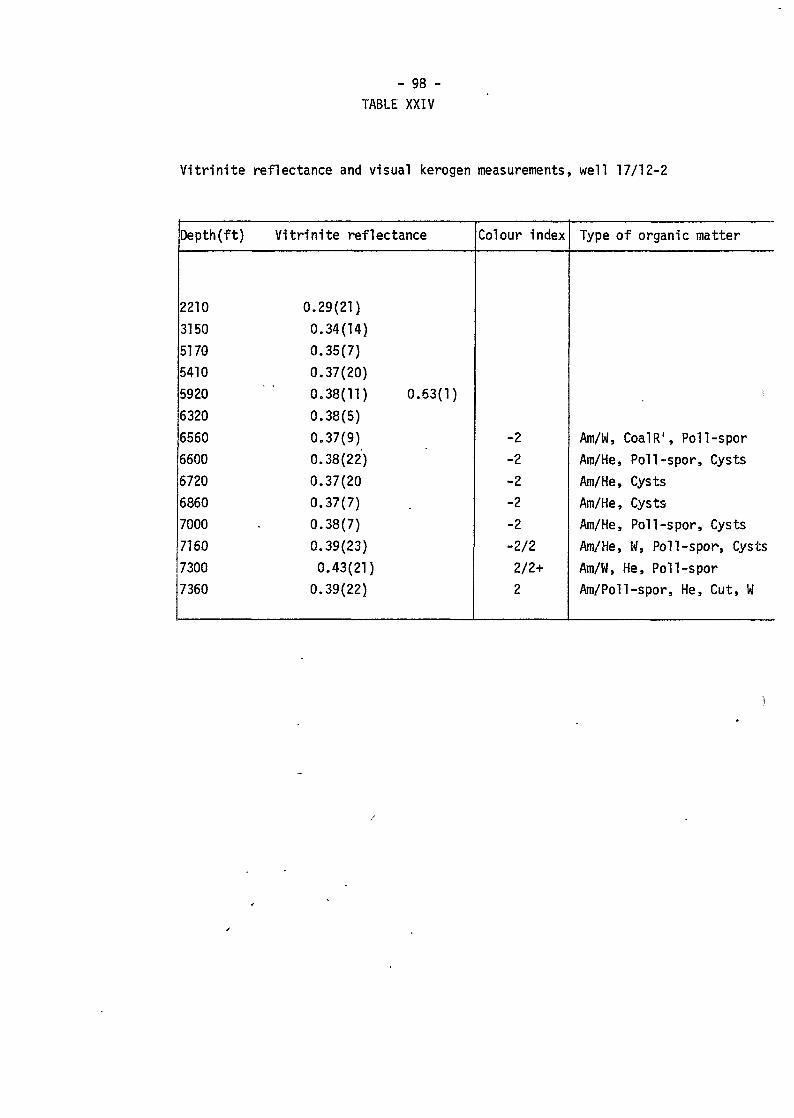
- 98 -TABLE XXIV
V i t r i n i t e reflectance and visual kerogen measurements, well 17/12-2
Depth(ft)
2210
3150
5170
5410
5920
6320
6560
6600
6720
6860
7000
7160
7300
7360
Vi t r in i te reflectance
0.29(21)
0.34(14)
0.35(7)
0.37(20)
0.38(11) 0.63(1)
0.38(5)
0.37(9)
0.38(22)
0.37(20
0.37(7)
0.38(7)
0.39(23)
0.43(21)
0.39(22)
Colour index
-2
-2
-2
-2
-2
-2/2
2/2+
2
Type of organic matter
Am/W, CoalR1, Poll-spor
Am/He, Poll-spor, Cysts
Am/He, Cysts
Am/He, Cysts
Am/He, Poll-spor, Cysts
Am/He, W, Poll-spor-, Cysts
Am/W, He, Poll-spor
Am/Poll-spor, He, Cut, W
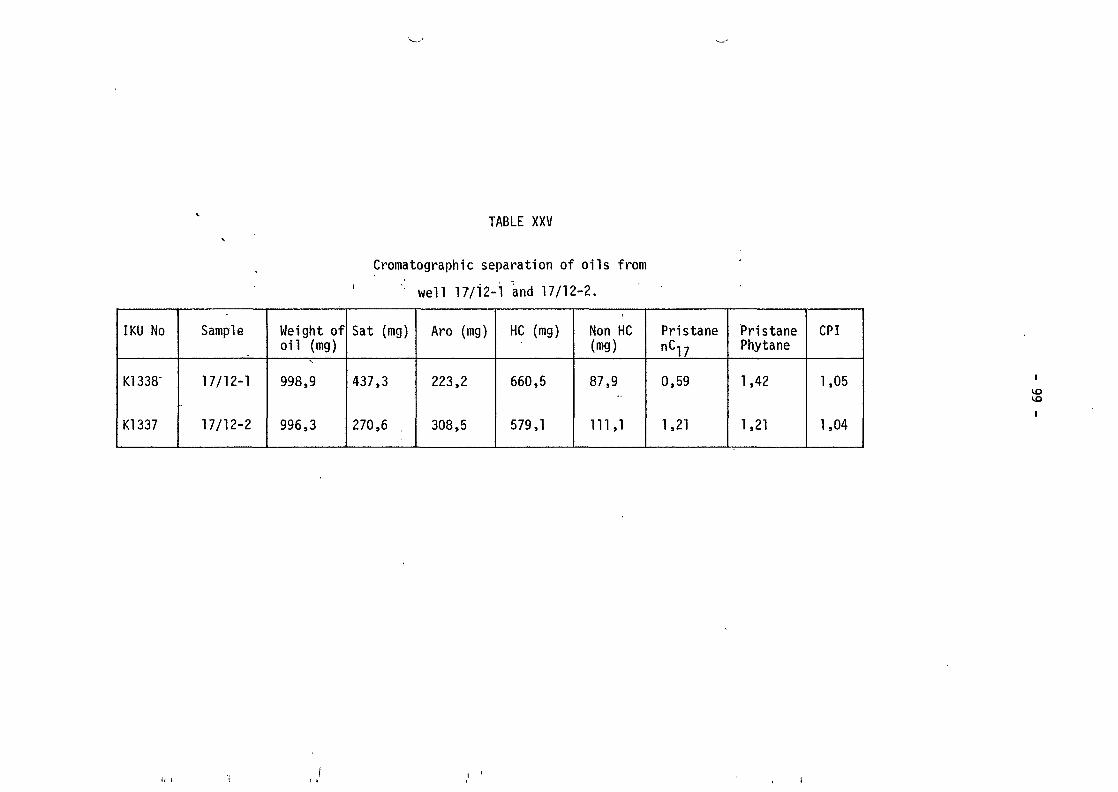
TABLE XXV
Cromatographic separation of oils from
well 17/12-1 and 17/12-2.
IKU No
K1338'
K1337
Sample
17/12-1
17/12-2
Weight ofo i l (mg)
998,9
996,3
Sat (mg)
437,3
270,6
Aro (mg)
223,2
308,5
HC (mg)
660,5
579,1
Non HC(mg)
87,9
111,1
PristanenC1?
0,59
1,21
PristanePhytane
1,42
1,21
CPI
1,05
1,04
IDID
- 100 -
Oil - Source Rock Correlation
Nine rock extracts together with the saturated hydrocarbon fraction of thetwo oil were sent to Masspec Analytical for GC-MC analysis, concentratingon the steranes and triterpanes which are most environmented indicative.The rock extracts were selected from various zones in the three wells whichwere found to have a rich enough potential to be possible source rocks foroil and gas.
Experimental
All fractions were examined as received (no urea clathration was performed)under the following conditions:
Instrument: Finnian 3200/6100 CGCMS systemGC: 10 m x 0.3 mm 0V-1 WCOT column
programmed 150° - 270°C at 8°C/min.MS: 300yA emission, 70 eV electron energy. Masses m/e
85, 19i, 217 and 253 were scanned in M.I.D. mode(max. integration time 64 mS per ion) every 1 S.
Results
General
The primary data are enclosed in a separate appendix. The fragmentogramsare grouped by m/e and arranged within each m/e group in the sample orderlisted in table'XXVI.
Where fragmentograms plotted by the usual output procedures are normalizedto a peak not in the "fingerprint region" (e.g. Kl 042, m/e 217), an additionalplot has been, supplied in which data is re-normalized to the most intensepeak in the "fingerprint region" and multiplication factors adjusted accordingly.The additional plots are produced by a newly developed Masspec program andare distinguished by the legend 'N-ALKANE NO.: ' written above the y-axis.(The legend concerns a program option which is not employed here).
- 101 -
Peak intensities were measured using the same peak nomenclature and criteriaas for previous MID data. Additional peaks considered (triterpanes 7, 8, 9)are identified in table XXX. The peak intensities are listed in tableXXVII.
Eight triterpane peak ratios were calculated and listed in table XXVIIItogether with thirteen sterane peak ratios, table XXIX.
Table XXX lists tentative assignments of the peaks primarily used forinterpretation. The assignments are based on relative retention time (RRT),and comparison with assignments made in earlier correlation report for IKU.
Sterane peak ratios 8/17 and 12/17 (i.e. Co7^29 regular cholestanes) andtriterpane rations 3/4 (i.e. 17a(H) norhopane/17a(H) hopane) were chosen asthe main indicators of environment of deposition for the purpose of thisreport. Similarly, sterane ratio 17/14 (20R/20S 14a(H)/17a(H) ethylcholestane)and triterpane ratios 9/4 (22R 17g(H) homohopane/17a(H) hopane), and 8/7(22S/22R 17a(H) homohopane) were chosen as the main maturity indicators,the ethylcholestanes being selected because peaks 17 and 14 are in a lesscomplicated region of the m/e 217 fragmentogram and are therefore morereliably measured than the peaks corresponding to the R and S epimers of14a(H) 17a(H) cholestane and methylcholestane.
The chosen maturity-indicating ratios (triterpane 9/4 and 8/7 and sterane17/14) all decrease with increasing maturity.
Comparison between samples: summary
The main indicator ratios described above are listed separately in tableXXXI with comment on the principal deductions made from them, and withcomment on other major features of the m/e 191 and 217 fragmentograms notreflected in the ratios.
- 102 -
Comparison between samples: Triterpanes (m/e 191)
(i) Oils, K1337 (17/12-2) and K1338 (17/12-1
The alkane fractions of the two oils, K1337 and K1338, displayedtriterpane distributions typical of many crude oils. Peak 5 wasobserved in K1337 and peak 6 in K1338. The chosen ratios indicatea broadly similar depositional environment for the two oils, andthat Kl 338 is less mature than K1337.
(ii) K731,. K749r K760 and K769
All are less mature than the oils. K731 and K749 are more similarto the oils in environment, ratio 3/4 being 0.67 and 0.70 respectively(oils, 0.53).
(iii) K1042 and Kl045
Both extracts are less mature than the oils. An unidentified peakeluting halfway between peaks 3 and 4 is observed in K1042 (intensity24 % peak 4) and K1045 (intensity 32 % peak 4). This peak isminor feature of the oils (ca^ 8 % peak 4). Peak 6 is observed inK1045 but not in K1042. The ratio 3/4 is more similar to the oils(0.53) in K1045 (0.50) than K1042 (0.75).
*)(iv) K706, K713 and K715
All are less mature than the oils. The ratio 3/4 is similar tothat of the oils (0.53) for each of this group (K715:0.54, K713:0.569K706:0.67) but there is a major peak eluting immediately beforepeak 4 in all three fractions which is not observed for the oils.On the basis of RRT alone, this peak might tentatively be assignedthe identity 18a(H) oleanane. If this assignment were correct,then K706, K713 and K715 are unlikely to be sources for the oils,
' and in any case do not appear to be sufficiently mature.
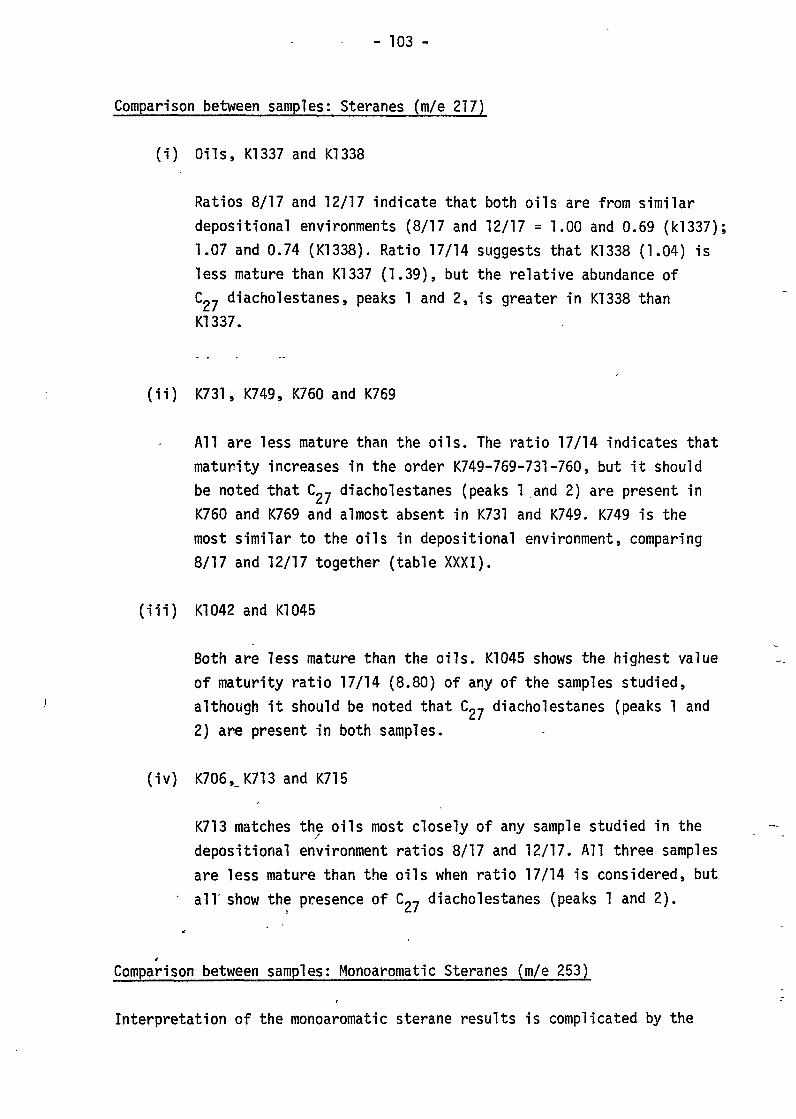
- 103 -
Comparison between samples: Steranes (m/e 217)
(i) Oils, K1337 and K1338
Ratios 8/17 and 12/17 indicate that both oils are from similardepositional environments (8/17 and 12/17 = 1.00 and 0.69 (k!337);1.07 and 0.74 (K1338). Ratio 17/14 suggests that K1338 (1.04) isless mature than K1337 (1.39), but the relative abundance ofC 2 7 diacholestanes, peaks 1 and 2, is greater in K1338 thanK1337.
(ii) K731, K749, K760 and K769
All are less mature than the oils. The ratio 17/14 indicates thatmaturity increases in the order K749-769-731-760, but it shouldbe noted that Cp, diacholestanes (peaks 1 and 2) are present inK760 and K769 and almost absent in K731 and K749. K749 is themost similar to the oils in depositional environment, comparing8/17 and 12/17 together (table XXXI).
(iii) K1042 and K1045
Both are less mature than the oils. K1045 shows the highest valueof maturity ratio 17/14 (8.80) of any of the samples studied,although it should be noted that C 2 7 diacholestanes (peaks 1 and2) are present in both samples.
(iv) K706,_K713 and K715
K713 matches the oils most closely of any sample studied in thedepositional environment ratios 8/17 and 12/17. All three samplesare less mature than the oils when ratio 17/14 is considered, butall' show the presence of C 2 7 diacholestanes (peaks 1 and 2).
4
Comparison between samples: Monoaromatic Steranes (m/e 253)
Interpretation of the monoaromatic sterane results is complicated by the
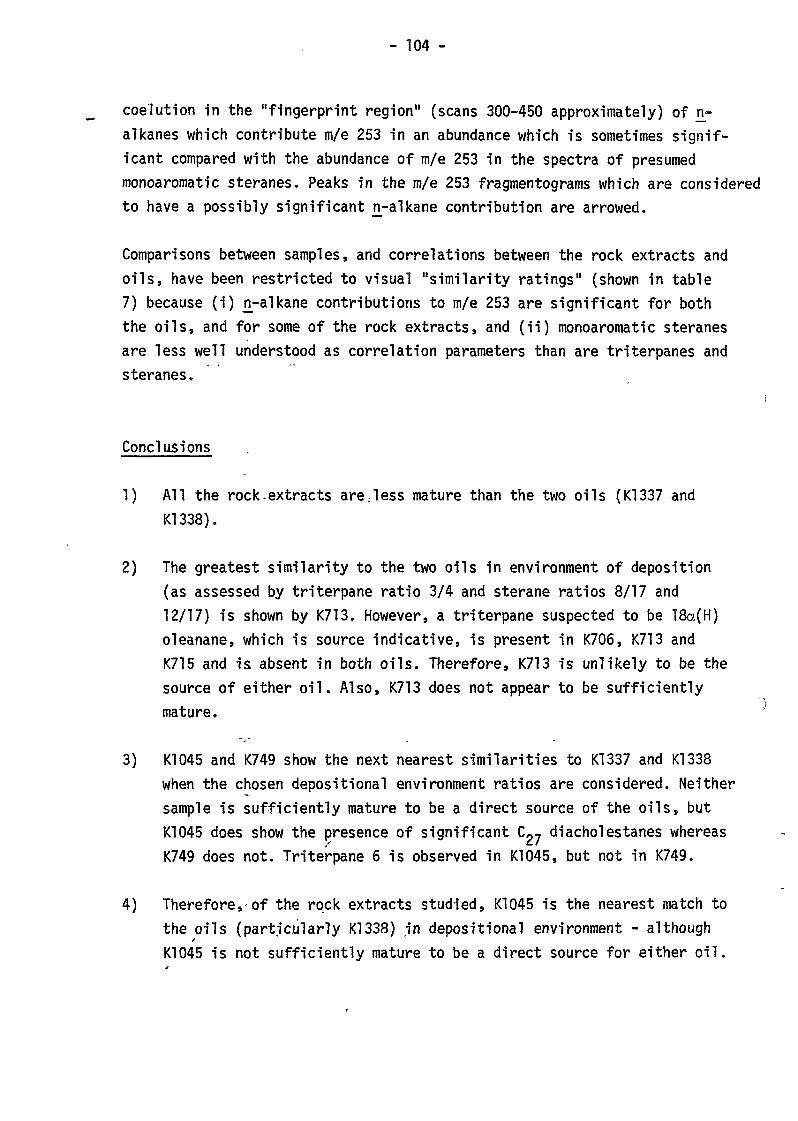
- 104 -
coelution in the "fingerprint region" (scans 300-450 approximately) of JT-alkanes which contribute m/e 253 in an abundance which is sometimes signif-icant compared with the abundance of m/e 253 in the spectra of presumedmonoaromatic steranes. Peaks in the m/e 253 fragmentograms which are consideredto have a possibly significant ji-alkane contribution are arrowed.
Comparisons between samples, and correlations between the rock extracts andoils, have been restricted to visual "similarity ratings" (shown in table7) because (i) jr-alkane contributions to m/e 253 are significant for boththe oils, and for some of the rock extracts, and (ii) monoaromatic steranesare less well understood as correlation parameters than are triterpanes andsteranes.
Conclusions
1) All the rock.extracts are:less mature than the two oils (K1337 andK1338).
2) The greatest similarity to the two oils in environment of deposition(as assessed by triterpane ratio 3/4 and sterane ratios 8/17 and12/17) is shown by K713. However, a triterpane suspected to be 18a(H)oleanane, which is source indicative, is present in K706, K713 andK715 and is absent in both oils. Therefore, K713 is unlikely to be thesource of either oil. Also, K713 does not appear to be sufficientlymature.
3) K1045 and K749 show the next nearest similarities to K1337 and K1338when the chosen depositional environment ratios are considered. Neithersample is sufficiently mature to be a direct source of the oils, butK1045 does show the presence of significant C 2 7 diacholestanes whereasK749 does not. Triterpane 6 is observed in K1045, but not in K749.
4) Therefore, of the rock extracts studied, K1045 is the nearest match tothe oils (particularly K1338) in depositional environment - althoughK1045 is not sufficiently mature to be a direct source for either oil.
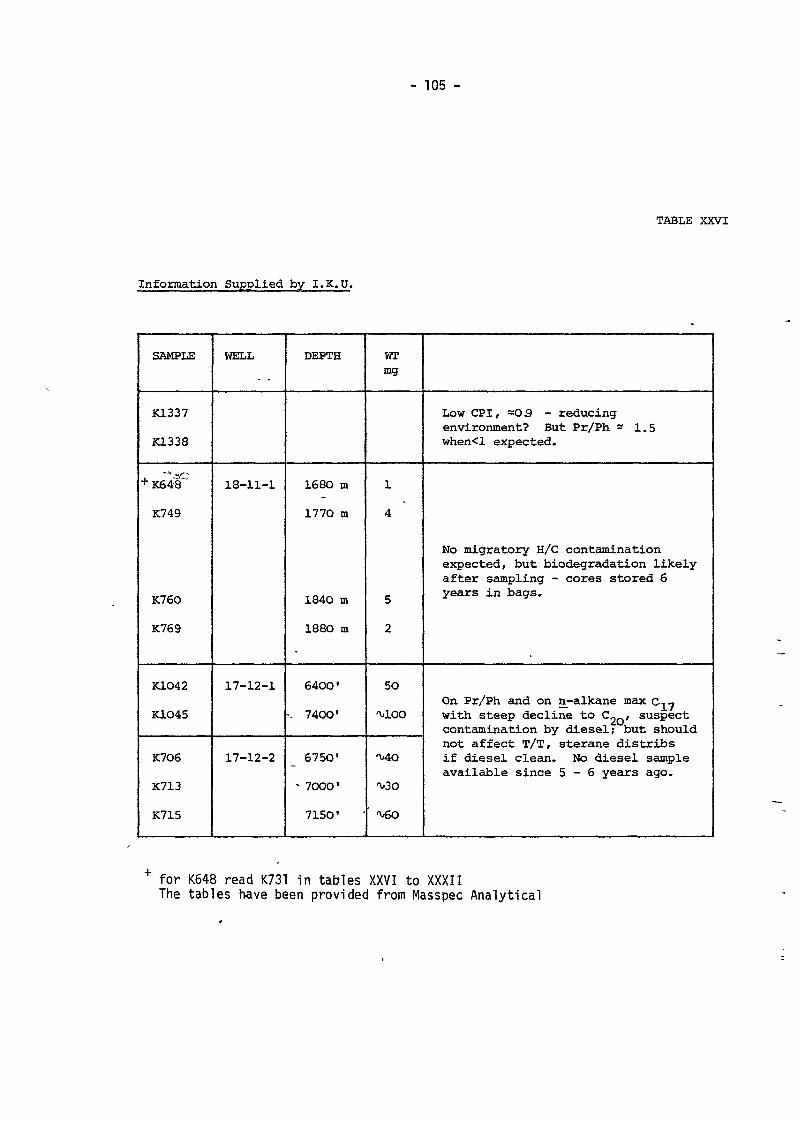
- 105 -
TABLE XXVI
Information Supplied by I.K.U.
SAMPLE
K1337
K1338
+ «4f
K749
K76O
K769
K1O42
K1O45
K7O6
K713
K715
WELL
18-11-1
17-12-1
17-12-2
DEPTH
168O m
1770 m
1840 m
1880 m
64OO'
•- 7400'
6750'
- 7OOO1
715O'
WTmg
1
4
5
2
50
^100
^30
Low CPI, =03 - reducingenvironment? But Pr/Ph - 1.5when<l expected.
No migratory H/C contaminationexpected, but biodegradation likelyafter sampling - cores stored 6years in bags.
On Pr/Ph and on n-alkane max c,^with steep decline to C_o, suspectcontamination by diesel; but shouldnot affect T/T, sterane distribsif diesel clean. No diesel sampleavailable since 5 - 6 years ago.
for K648 read K731 in tables XXVI to XXXIIThe tables have been provided from Masspec Analytical
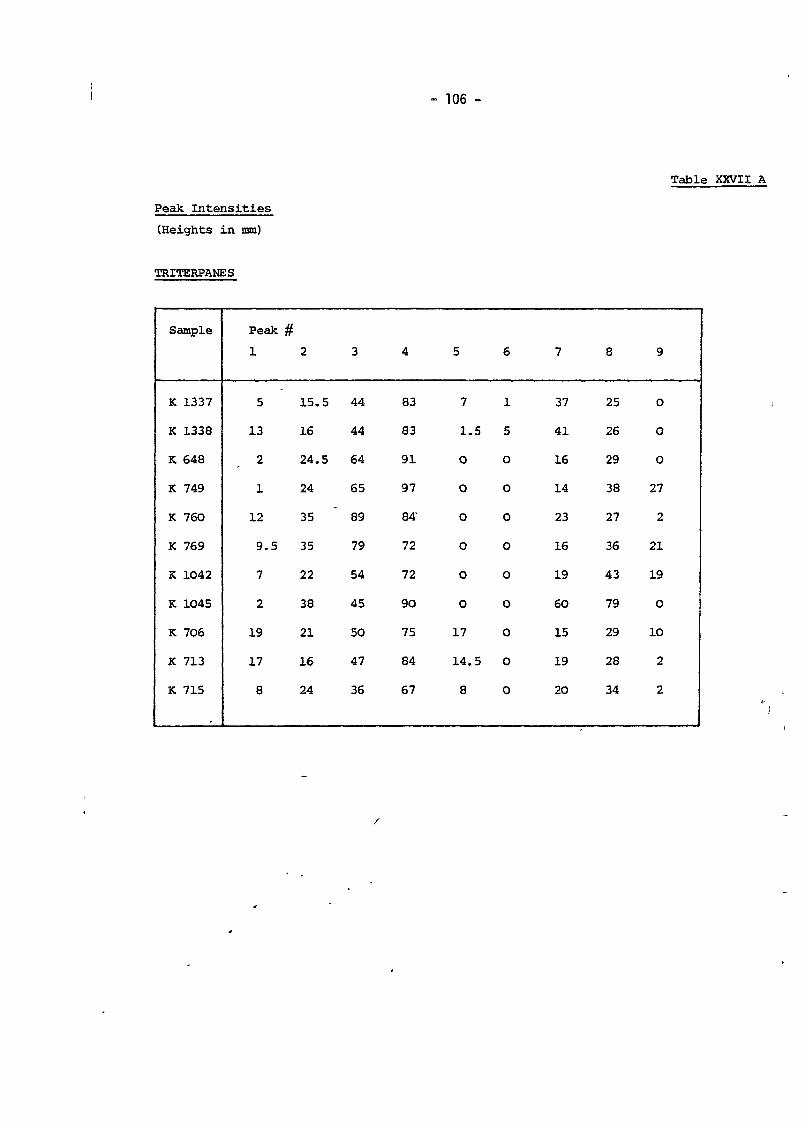
Peak Intensities
(Heights in mm)
TRITERPANES
- 106 -
Table XXVII A
Sample
K 1337
K 1338
K 643
K 749
K 760
K 769
K 1O42
K 1045
K 706
K 713
K 715
Peak
1
5
13
2
1
12
9.5
7
2
19
17
8
2
15.5
16
24.5
24
35
35
22
38
21
16
24
3
44
44
64
65
89
79
54
45
50
47
36
4
83
83
91
97
84"
72
72
9O
75
84
67
5
7
1.5
O
O
0
o
0
0
17
14.5
8
6
1
5
0
0
0
0
O
0
0
O
0
7
37
41
16
14
23
16
19
6O
15
19
2O
8
25
26
29
38
27
36
43
79
29
28
34
9
0
0
O
27
2
21
19
O
10
2
2
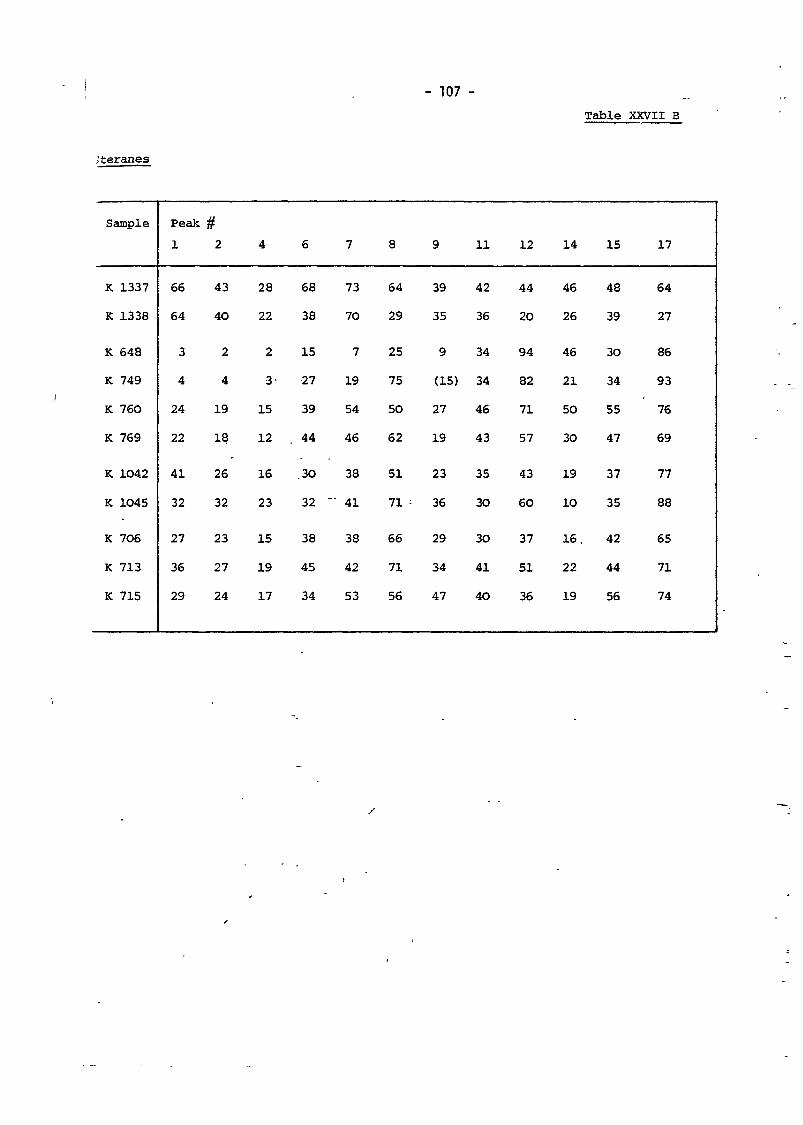
Jteranes
- 107 -
Table XXVII B
Sample
K 1337
K 1338
K 648
K 749
K 76O
K 769
K 1042
K 1045
K 706
K 713
K 715
Peak
1
66
64
3
4
24
22
41
32
27
36
29
#
2
43
40
2
4
19
18
26
32
23
27
24
4
28
22
2
3-
15
12
16
23
15
19
17
6
68
38
15
27
39
44
.30
32
38
45
34
7
73
70
7
19
54
46
38
"" 41
38
42
53
8
64
29
25
75
5O
62
51
71 =
66
71
56
9
39
35
9
(15)
27
19
23
36
29
34
47
11
42
36
34
34
46
43
35
3O
3O
41
40
12
44
20
94
82
71
57
43
6O
37
51
36
14
46
26
46
21
50
30
19
10
16.
22
19
15
48
39
3O
34
55
47
37
35
42
44
56
17
64
27
86
93
76
69
77
88
65
71
74
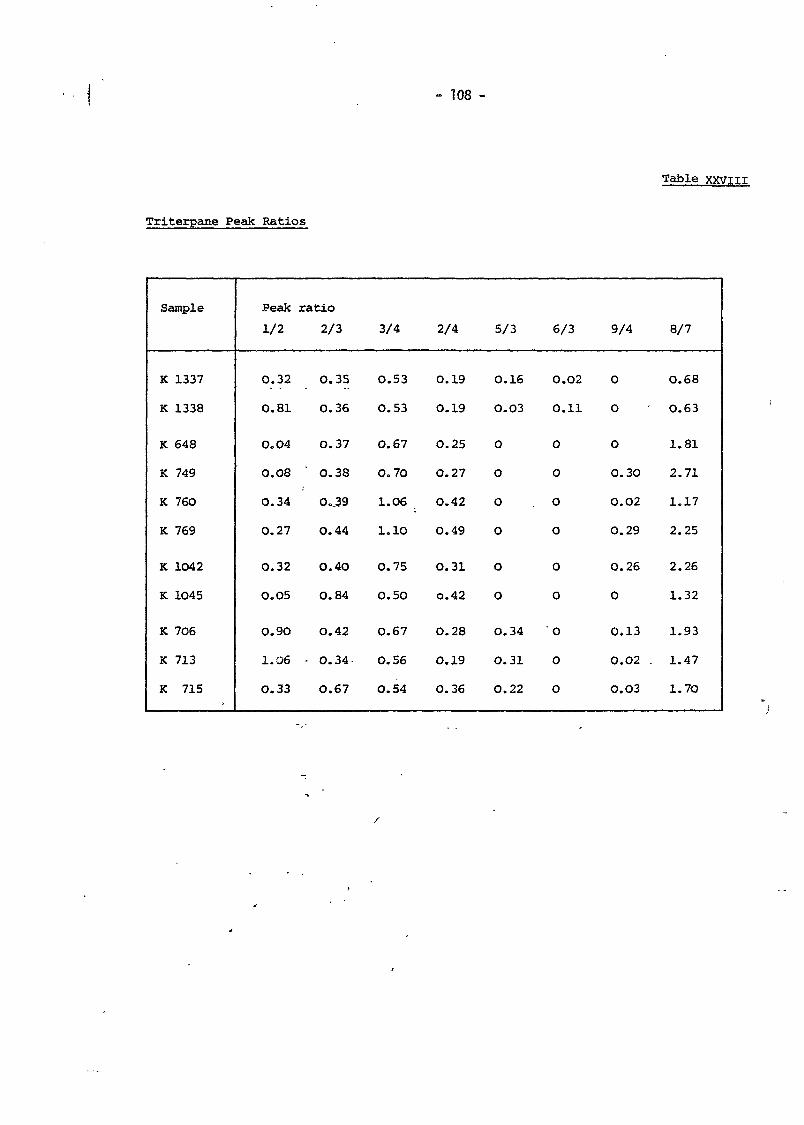
Triterpane Peak Ratios
- 108 -
Table XXViil
Sample
K 1337
K 1338
K 648
K 749
K 76O
K 769
K 1042
K 1045
K 706
K 713
K 715
Peak
1/2
0.32
0.81
0.04
0.08
0.34
0.27
0.32
0.05
O.9O
1.06
0.33
ratio
2/3
O.35
0.36
0.37
0.38
O.39
O.44
O.4O
O.84
O.42
- O.34
0.67
3/4
0.53
O.53
0.67
O.7O
1.O6
1.1O
0.75
O.5O
0.67
O.56
0.54
2/4
O.19
0.19
0.25
0.27
0.42
0.49
O.31
O.42
O.28
0.19
0.36
5/3
0.16
O.O3
0
O
O
0
O
O
O.34
0.31
0.22
6/3
O.O2
O.ll
0
0
O
O
0
0
O
O
0
9/4
0
O
0
O.3O
0.02
0.29
0.26
0
0.13
0.02 .
0.03
8/7
0.68
0.63
1.81
2.71
1.17
2.25
2.26
1.32
1.93
1.47
1.70
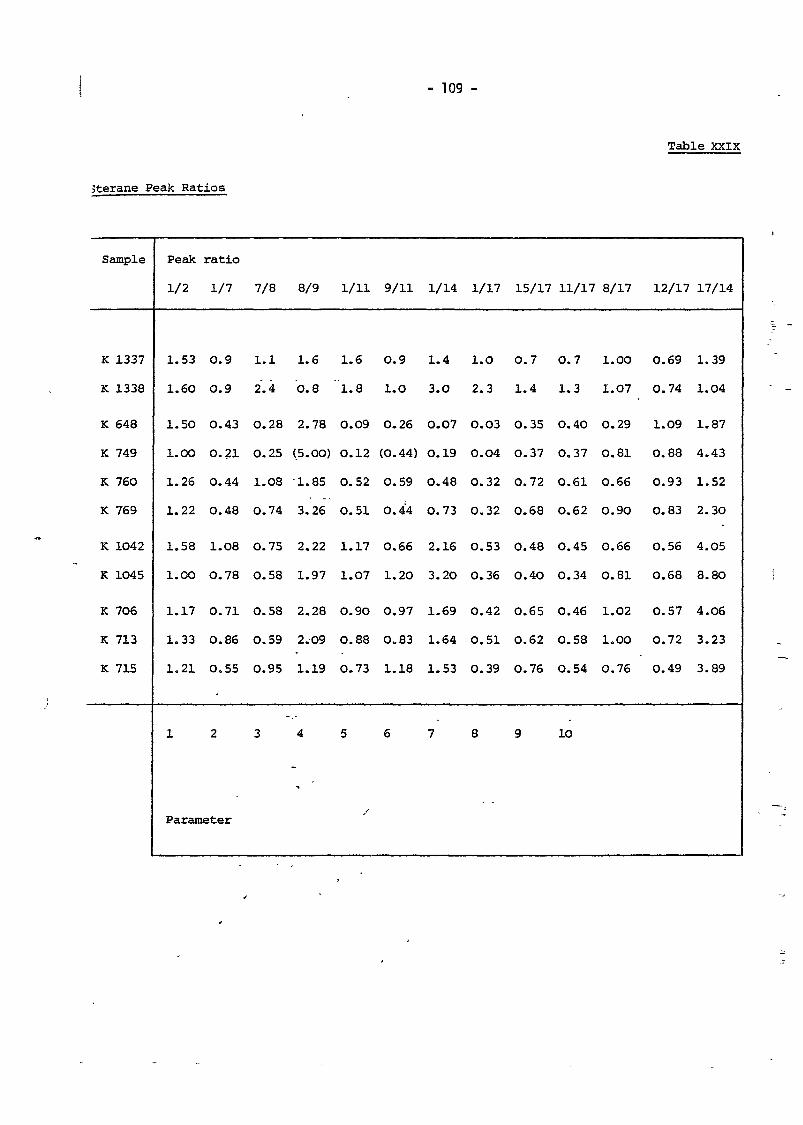
- 109 -
Table XXIX
Sterane Peak Ratios
Sample
K
K
K
K
K
K
K
K
K
K
K
1337
1338
648
749
76O
769
1042
1045
706
713
715
Peak
1/2
1.53
1.60
1.50
1.00
1.26
1.22
1.58
l.OO
1.17
1.33
1.21
1
ratio
1/7
O.9
0.9
0.43
0.21
O.44
0.48
1.O8
O.78
0.71
O.86
0.55
2
Parameter
7/8
1.1
2.4
O.28
0.25
1.08
0.74
O.75
0.58
0.58
O.59
O.95
3
8/9
1.6
O.8
2.78
(5.OO)
1.85
3.26
2.22
1.97
2.28
2.09
1.19
4
1/11
1.6
"l.8
O.O9
0.12
O.52
0.51
1.17
1.07
O.9O
0.88
0.73
5
9/11
0.9
1.0
0.26
(0.44)
0.59
0.44
0.66
1.20
O.97
0.83
1.18
6
1/14
1.4
3.0
O.O7
O.19
0.48
0.73
2.16
3.2O
1.69
1.64
1.53
7
1/17
l.O
2.3
0.03
O.O4
O.32
0.32
O.53
0.36
0.42
0.51
0.39
8
15/17
O.7
1.4
0.35
0.37
0.72
0.68
0.48
O.4O
0.65
0.62
O.76
9
11/17
0.7
1.3
0.40
0.37
0.61
0.62
0.45
0.34
0.46
0.58
O.54
1O
8/17
1.00
1.07
0.29
0.81
0.66
0.90
0.66
0.81
1.02
1.00
0.76
12/17
0.69
0.74
1.09
0.88
0.93
0.83
O.56
0.68
0.57
0.72
0.49
17/14
1.39
1.04
1.87
4.43
1.52
2.3O
4.05
8.80
4.06
3.23
3.89
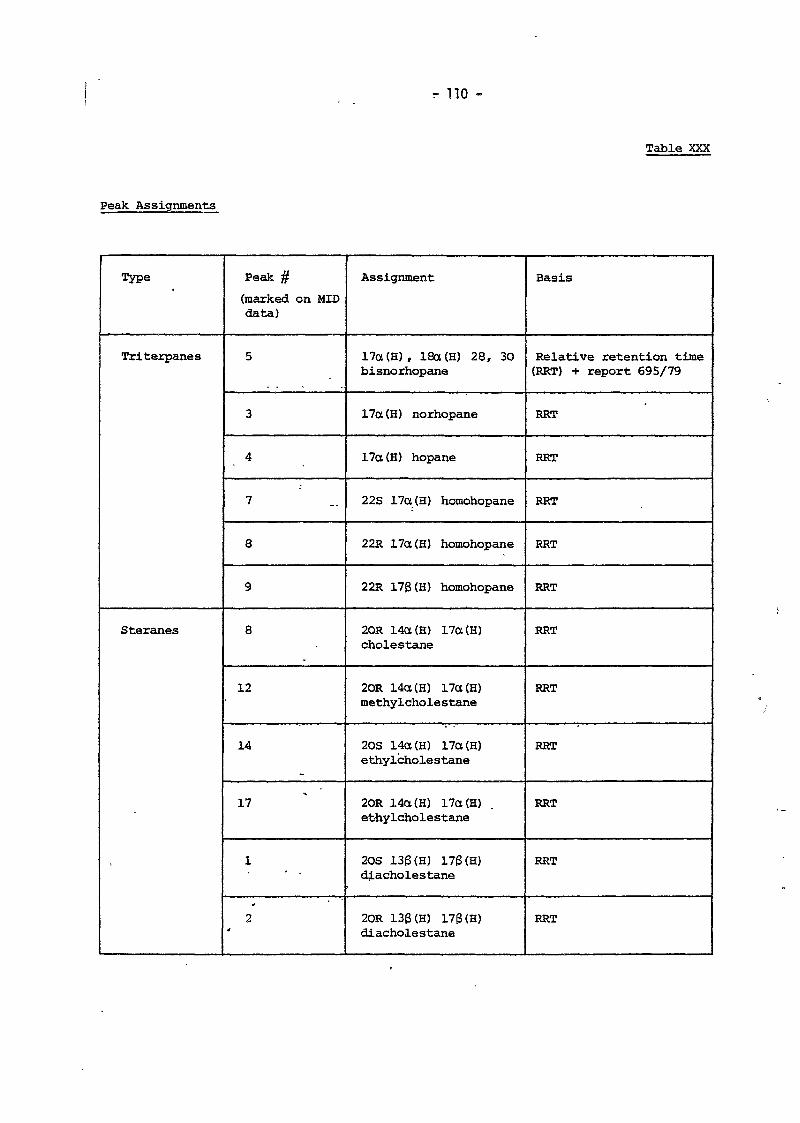
Peak Assignments
- no -
Table XXX
Type
Triterpanes
Steranes
Peak #
(marked on MIDdata)
5
3
4
7
8
9
8
12
14
17
1
2
Assignment
17a (H) , 18a (H) 28, 30bisnorhopane
17a(H) norhopane
17a(H) hopane
22S 17a(H) homohopane
22R 17a(H) homohopane
22R 176 (H) homohopane
20R 14a (H) 17a(H)cholestane
20R 14a (H) 17a (H)methylcholestane
20S 14a (H) 17a (H)ethylcholestane
20R 14a (H) 17a (H)ethylcholestane
2OS 130(H) 176(H)diacholestane
20R 136(H) 176(H)diacholestane
Basis
Relative retention time(RRT) + report 695/79
RRT
RRT
RRT
RRT
RRT
RRT
RRT
RRT
RRT
RRT
RRT
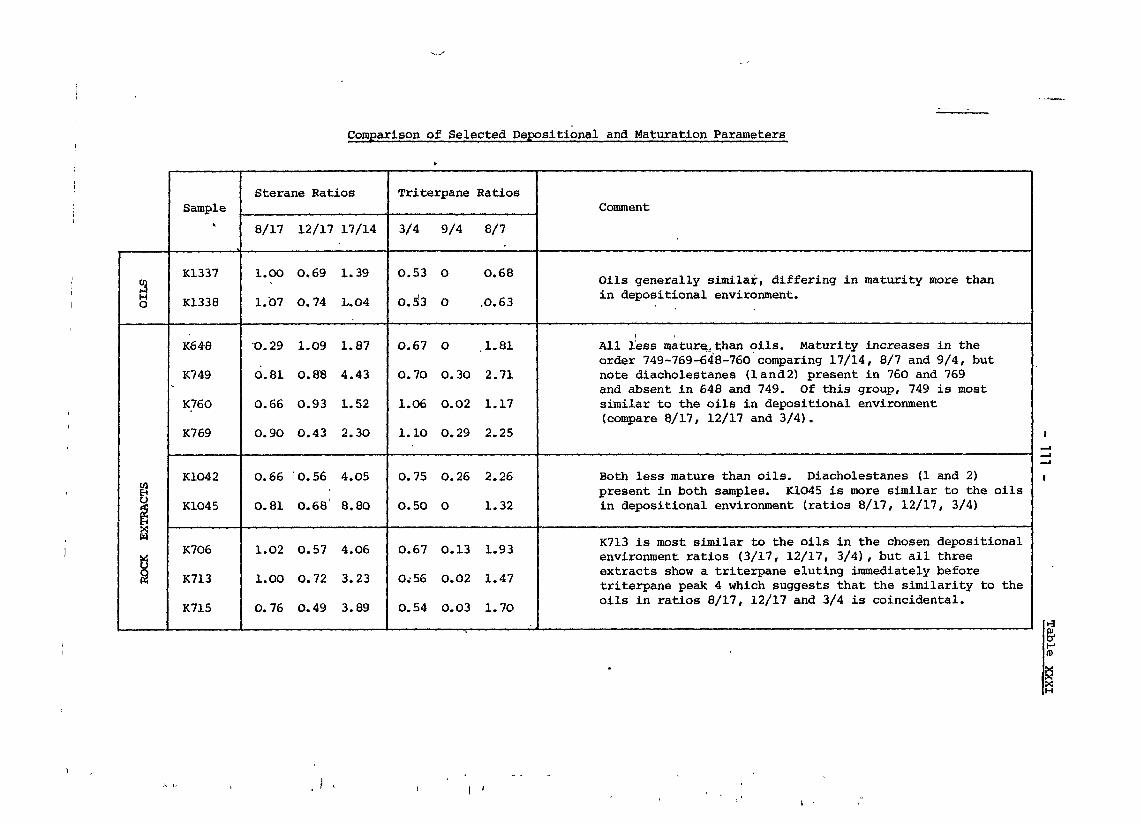
Comparison of Selected Depositional and Maturation ParametersO
ILS
RO
CK
E
XT
RA
CT
S
Sample
K1337
K1338
K648
K749
K76O
K769
K1O42
K1O45
K7O6
K713
K715
Sterane Ratios
8/17 12/17 17/14
l.OO 0.69 1.39
1.07 O.74 L.O4
X>.29 1.09 1.87
6.81 O.8B 4.43
0.66 0.93 1.52
0.90 0.43 2.30
0.66 0.56 4.O5
0.81 0.68 8.80
1.O2 0.57 4.06
1.00 0.72 3.23
0.76 0.49 3.89
Triterpane Ratios
3/4 9/4 8/7
0.53 0 0.68
O.S^ 0 .0.63
0.67 0 ,1.81
0.70 0.30 2.71
1.06 0.02 1.17
1.10 0.29 2.25
0.75 0.26 2.26
0.50 0 1.32
0.67 0.13 1.93
0.56 0.02 1.47
0.54 O.O3 1.70
Comment
Oils generally similar, differing in maturity more thanin depositional environment.
All less mature, than oils. Maturity increases in theorder 749-769-648-760 comparing 17/14, 8/7 and 9/4, butnote diacholestanes (land2) present in 760 and 769and absent in 648 and 749. Of this group, 749 is mostsimilar to the oils in depositional environment(compare 8/17, 12/17 and 3/4).
Both less mature than oils. Diacholestanes (1 and 2)present in both samples. K1O45 is more similar to the oilsin depositional environment (ratios 8/17, 12/17, 3/4)
K713 is most similar to the oils in the chosen depositionalenvironment ratios (3/17, 12/17, 3/4), but all threeextracts show a triterpane eluting immediately beforetriterpane peak 4 which suggests that the similarity to theoils in ratios 8/17, 12/17 and 3/4 is coincidental.
H(D
X
I •
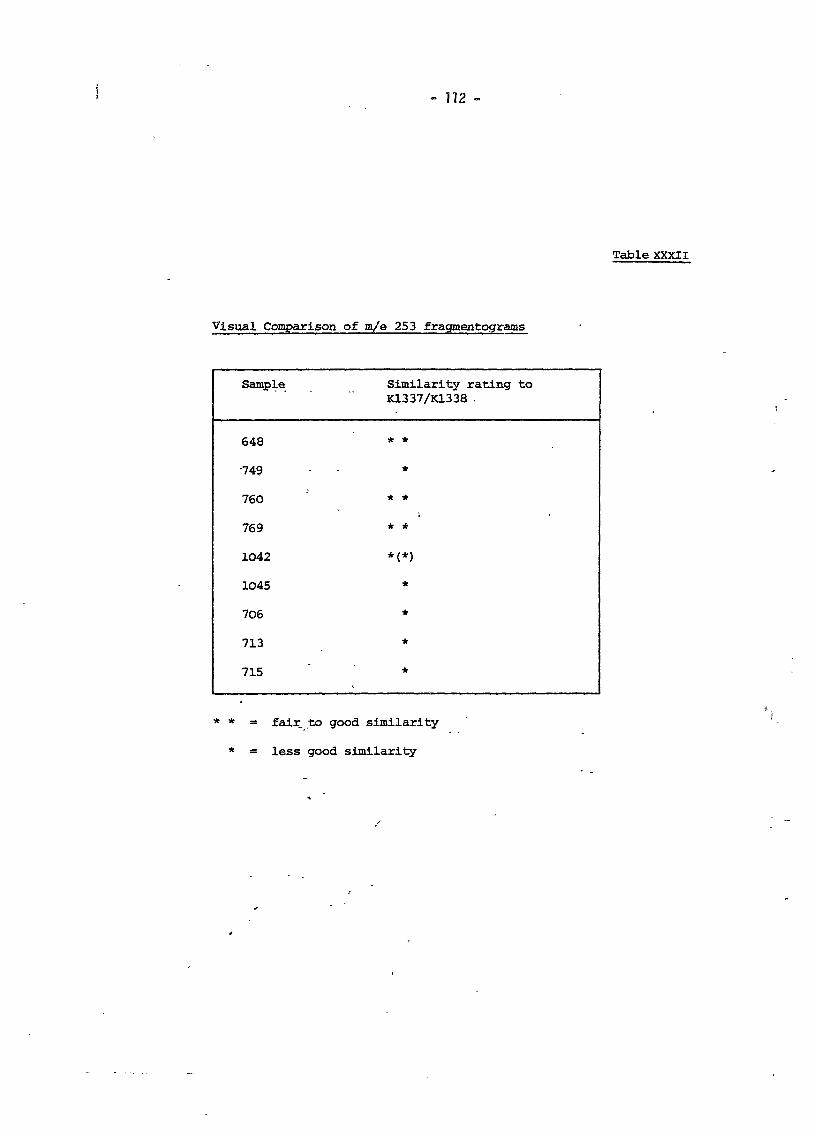
- 112 -
Table XXXII
Visual Comparison of m/e 253 fragmentograms
Sample
648
-749
760
769
1O42
1O45
706
713
715
Similarity rating toK1337/K1338 .
* *
*
* *
* *
*(*)
*
*
*
*
* * = fair to good similarity
* = less good similarity
- 113 -
PART THREE: SUMMARY AND CONCLUSIONS
- 114 -
DATA SUMMARY AND CONCLUSION
A direct correlation of the various zones in the three wells is difficult\/ due to lack of necessary information, such as logs, etc. The various data. from the three wells will be summed up and a final conclusion drawn from
this.
The analysed sequences of the three wells are immature with exception ofthe lower 700" of well 17/12-1 which is moderate mature. Due to this thedetected oil in well 17/12-1 and 17/12-2 cannot have been sourced by any ofthe penetrated sequences. Large parts of these sequences have,.however,good or rich potentials as source rocks for oil and gas if they were matureenough. The zones with such possibilities would be zones A and B in well18/11-1, J - N in well 17/12-1 and V and W in well 17/12-2. Zones T and Uin well 17/12-2. would also be source rocks for oil and gas, but with aslightly lower potential. The upper part of the wells together with thelower part contain a larger proportion of terrestric material and are ratedas possible source rock for gas (and oil).
To try to correlate the oils from wells 17/12-1 and 17/12-2 with possiblesource rock samples from various zones together with the two oil sampleswere analysed by GC-MS, concentrating on steranes and triterpanes. Some ofthe measured parameters are main indicators of environment, and as so willnot change with increasing maturation, while others are typical maturityindicators. With the background in these analyses it is believed that thetwo analysed oils are sourced from the same source rock and the largedifference seen in the whole saturated hydrocarbon fraction is only due toa difference immaturity of the two oils, with the oil from 17/12-1 beingless mature than the oil from 17/12-2.
The correlation study between the two oils and the various sediment samplesdoes not give any definitive correlating between any of the analysed sedimentsamples and the oils. Only one sample, K1045 (7400-74251) well 17/12-1,shows some kind of similarity. Therefore, although not a likely sourcerock, zone N can be said to be "the least unlikely".
- 115 -
As was mentioned previously, the sediments from both wells 47/12-1 and17/12-2 are contaminated by diesel. Normally diesel will not contain triter-panes, but on the chance that the triterpane suspected to be 18a(H) oleane,found in all samples from 17/12-2 is from diesel or another mud additivethan sample K713 (7000-71001, well 17/12-2) shows the greatest similarityto the two oils, and zones V and W would be likely source rocks for theoils where they have reached a high enough maturity.
APPENDIX: RESULTS FROM MASSPEC ANALYTICAL
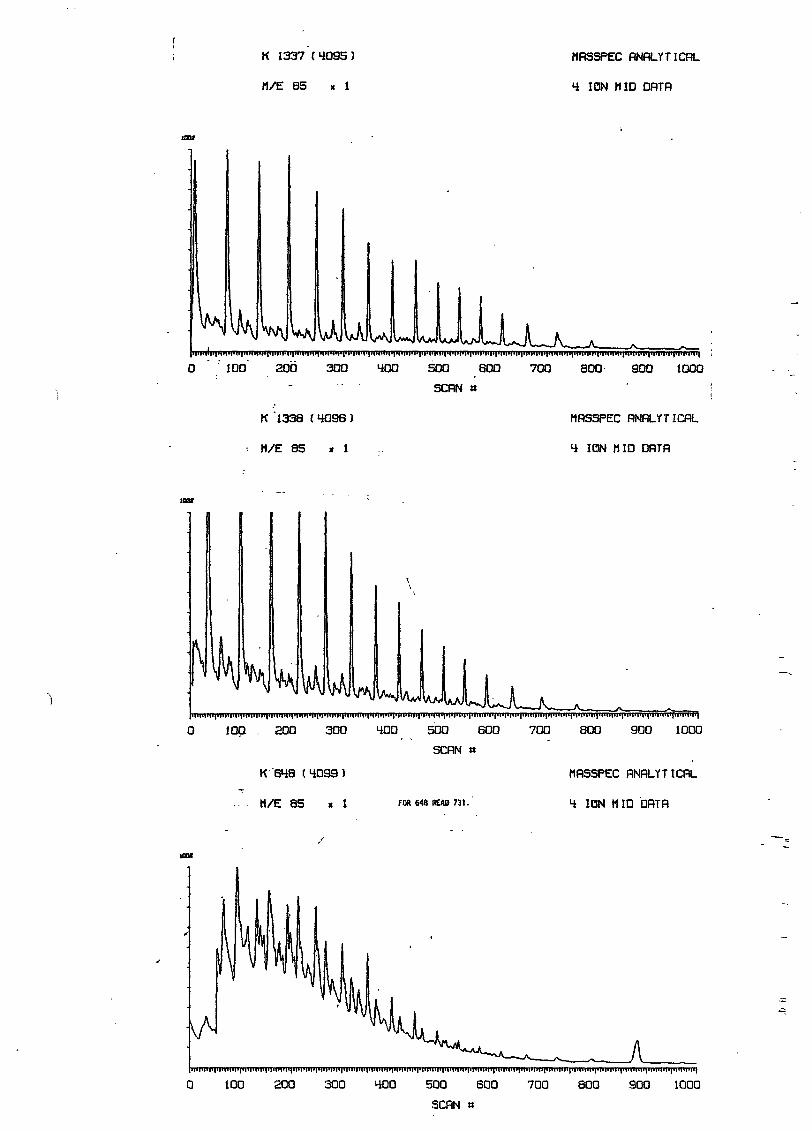
K 1337 (4095)
M/E 85 x 1
MRSSPEC RNRLYTICRL
4 ION MID ORTR
0 100 200 300 400 500 600 700 800 300 1000
SCRN « ' !
K 1338 (4096)
M/E 85 x 1
MRSSPEC RNRLYTICRL
4 ION MID DRTR
0 100 . 200 300 400 500 600 700 800 900 1000
K 648 (4099)
M/E 85 x 1
SCRN
FOR 648 READ 731.
MRSSPEC RNflLYTICRL
4 ION MID DRTR
'•I'»*' M*i"f «i«iTt»i*pi
0 100 200 300 400 500 SOO
SCRN »
700 800 900 1000
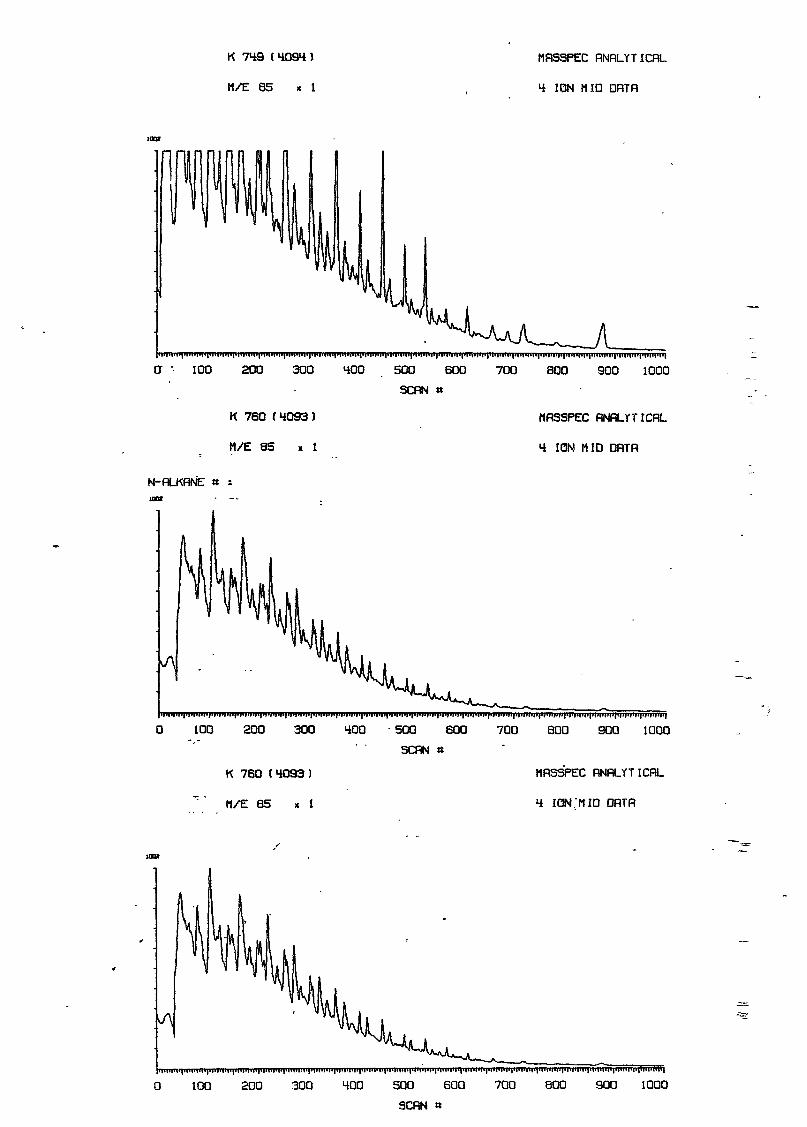
K 749 ( 4094 )
M/E 85 * 1
MflSSPEC RNRLYTICRL
4 ION MID DRTR
0" • 100 200 300 400 500 600 700 800 900 1000
SCRN «
K 760 ( 4093 )
M/E 85 » 1
MRSSPEC RNRLYTICRL
4 ION MID ORTR
N-RLKRNE »UXtt *
100 200 300
K 760 (4093)
M/E 85 x 1
400 500 600 700 800 900 1000
SCRN «
MRSSPEC RNRLYTICRL
4 ION.MID DRTR
0 100 200 300 400 500 600 700 800 900 1000
SCRN a
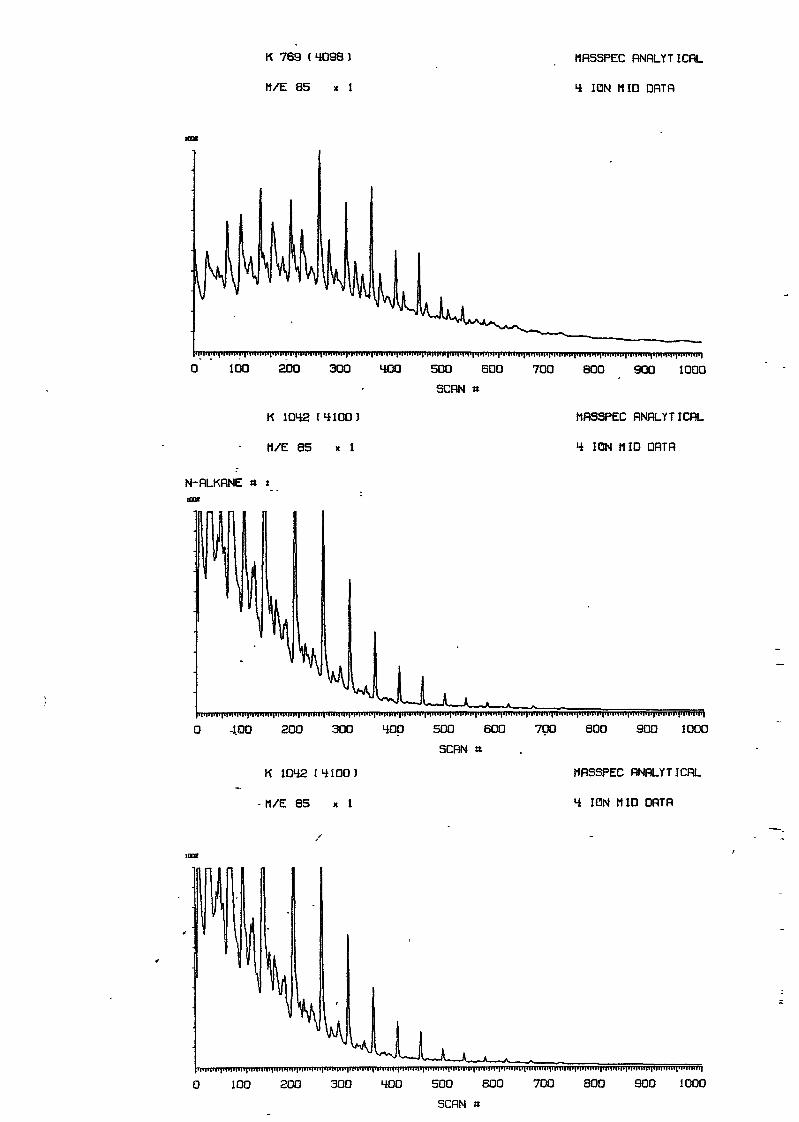
K 769 (4098)
M/E 85 x 1
MRSSPEC RNRLYTICRL
4 ION MID ORTfl
100 200 300 400
K 1042 ( 4100 )
M/E 85 x 1
500 600 700 800 900 1000
SCRN »
MRSSPEC RNRLYTICRL
4 ION MID DRTR
N-RLKRNE « :
0 400 200 300 400 500 600 700 800 900 1000
SCRN »
MRSSPEC RNRLYTICRLK 1042 (4100)
M/E 85 x 1 4 ION MID DRTR
100 200 300 400 500 600 900 1000
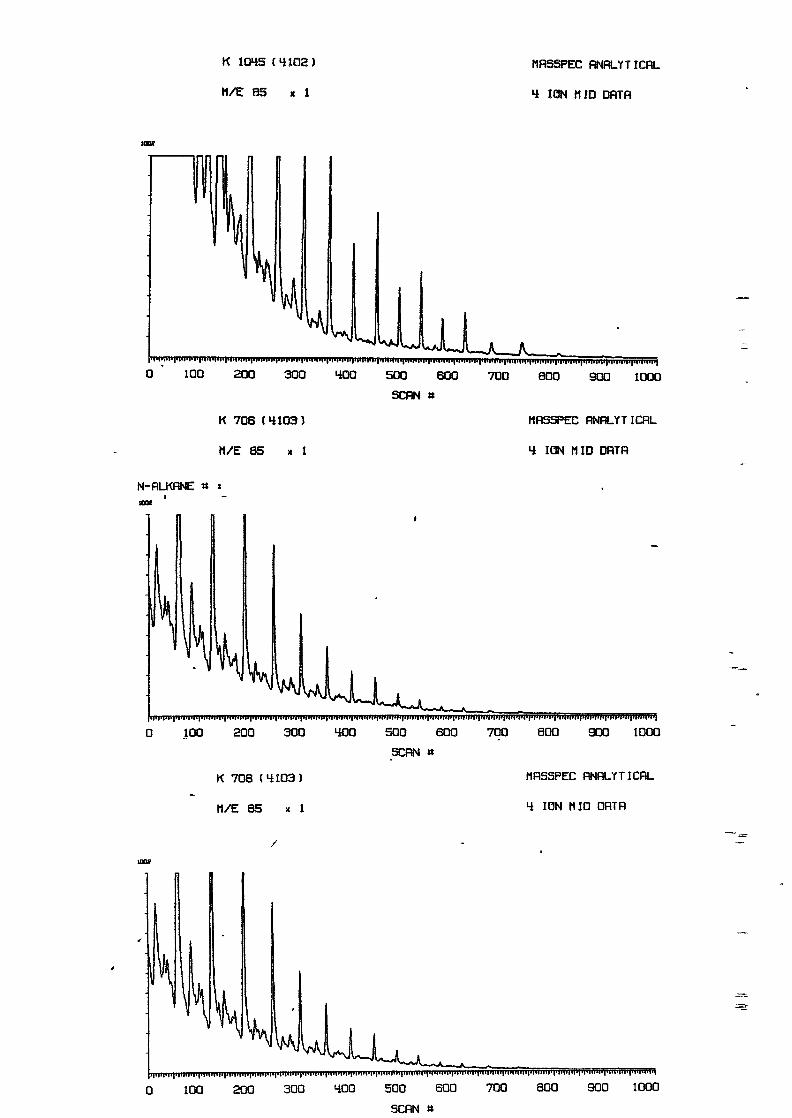
K 1045 (4102)
M/E 85 x i
HRSSPEC RNHLYTICHL
4 ION HID DRTR
100 200 300 400
K 706 (4103)
H/E 85 x 1
500 600 700 800 900 1000
SCRN «
HRSSPEC RNRLYTICRL
4 ION HID DRTR
N-RLKRNE «
200 300
K 706 (4103)
M/E 85 x 1
400 500 600 700 800 900 1000
SCRN »
HRSSPEC RNRLYTICRL
4 ION MID DRTR
100 200 300 400 500 600 700 800 900 1000
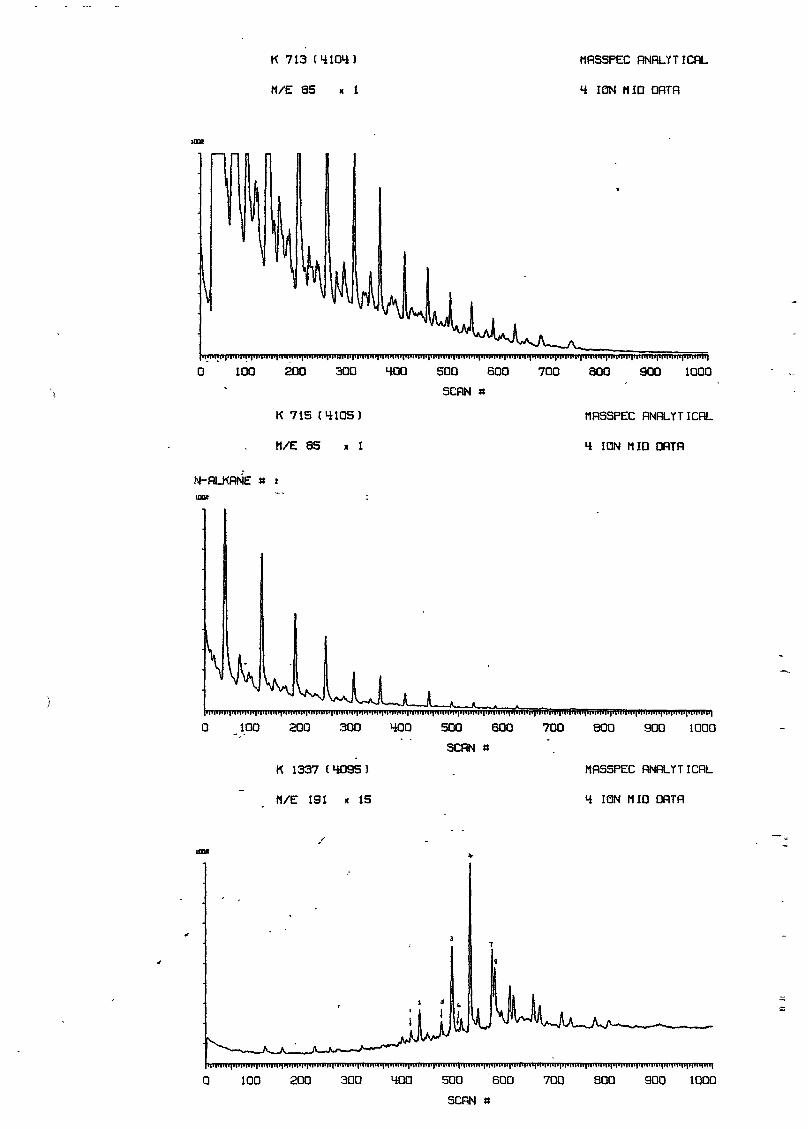
K 713 ( 4 1 0 4 )
H/E 85 x 1
MRSSPEC RNHLYTICRL
4 ION MID DRTR
H0 100 200 300 400 500 600 700 800 900 1000
SCRN *
K 715 (4105) MRSSPEC RNRLYTICRL
M/E 8 5 % 1 4 ION MID DRTR
N-RLKRNE » s
100 200 300 400 500 600 700 800 900 1000
SCRN «
K 1337 (4095) MRSSPEC RNflLYTICRL
H/E 191 x 15 4 ION MID DRTR
0 100 200 300 400 500 600 700 800 900 1000
SCRN «
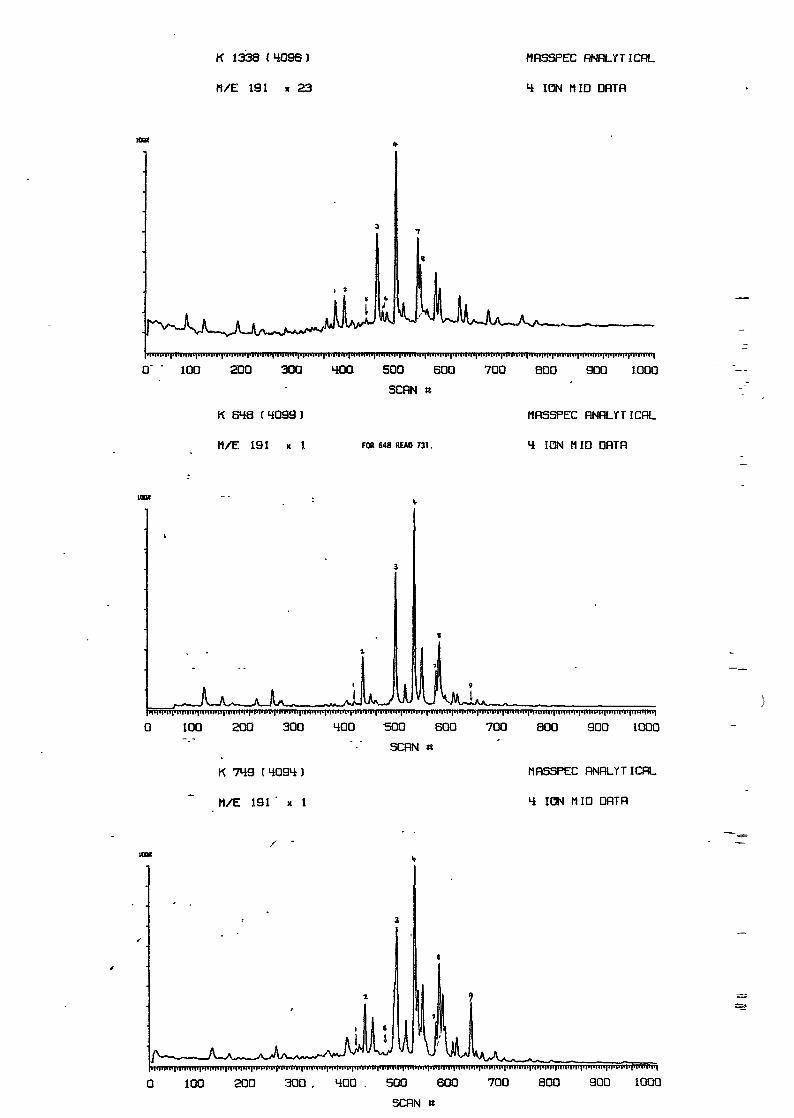
K 1338 ( 4096 )
H/E 191 x 23
HRSSPEC RNRLYTICRL
4 IQN HID DRTR
500 600
SCRN «
0' ' 100 200 300 400
K 648 (4099)
M / E 1 9 1 X 1 FOR 648 REAO 731.
700 800 900 1000
MRSSPEC RNRLYTICRL
4 ION MID DRTR
100 200 300 400 SOO 600 700 800 900 1000
SCRN «
MRSSPEC RNRLYTICRLK 749 ( 4094 )
M Æ 191 x 1 4 ION MID DRTR
0 100 200 300 , 400 . 500 600 700 800 900 1000
SCRN «
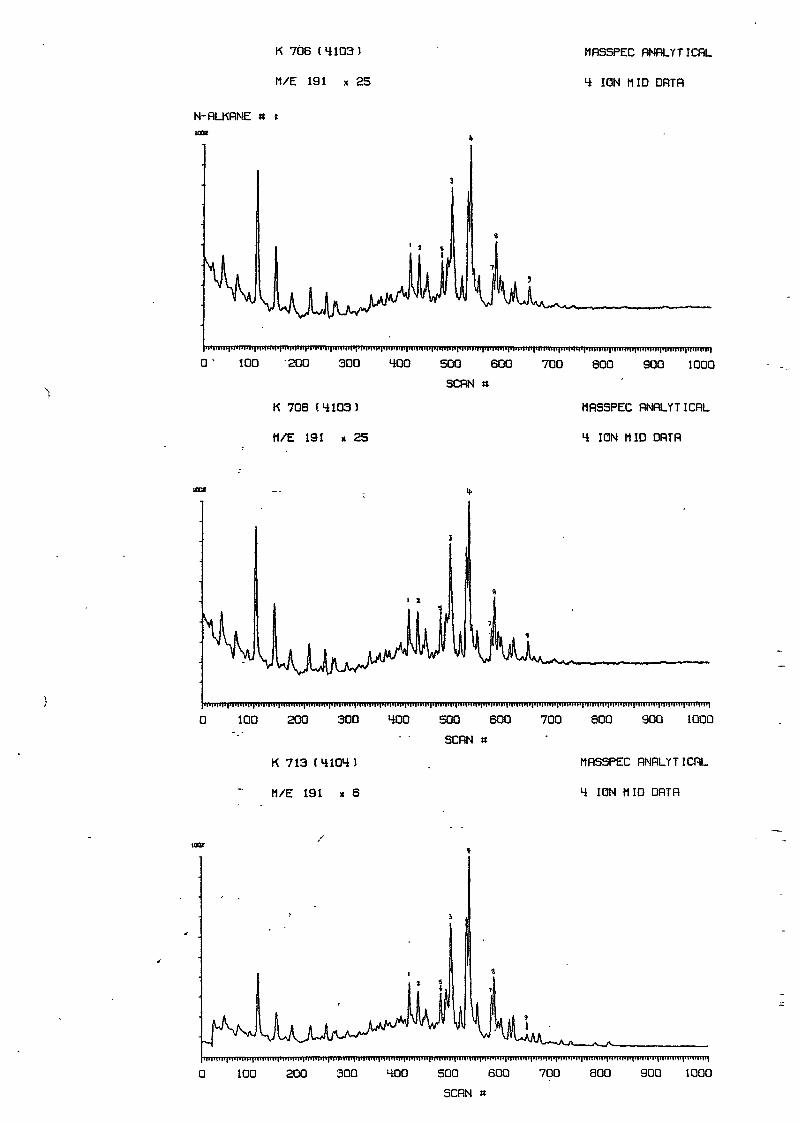
K 706 (4103)
M/E 191 x 25
N-RLKRNE « :
MRSSPEC RNRLYTICRL
4 ION MID DRTR
0' 100 200 300 400
K 706 (4103)
M/E 191 x 25
500 600 700 800 900 1000
SCRN «
MRSSPEC RNRLYTICRL
4 ION MID DflTR
i. 1
!
1 1
U9
100 200 300 400
K 713 (4104)
M/E 191 x 6
500 600 700 800 900 1000
SCRN »
MRSSPEC RNRLYTICRL
4 ION MID DflTR
0 100 200 300 400 500 600 700 800 900 1000
SCRN «
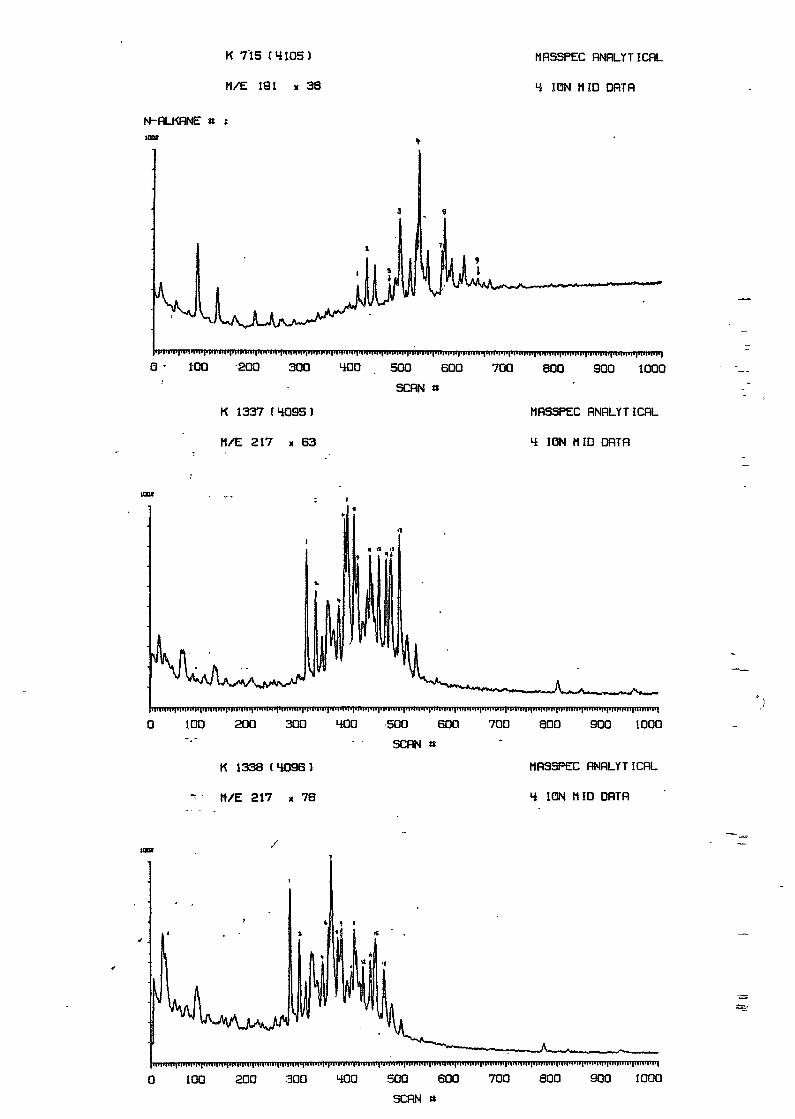
K 715 (4105)
M/E 191 x 38
N-RLKRNE u sloot
MRSSPEC RNRLYTICRL
4 ION MID ORTR
0 • tOO 200 300 400
K 1337 ( 4095 )
M/E 217 x 63
500 600 700 800 900 1000
SCRN n
MRSSPEC RNRLYTICRL
4 ION MID DRTR
/Sw.
0 100 200 300 400 500 600 700 800 900 1000
SCRN «
K 1338 ( 4096 ) MRSSPEC RNRLYTICRL
~ M/E 217 * 76 4 ION MID DRTR
JV ^
0 100 200 300 400 500 600 700 800 900 1000
SCRN »
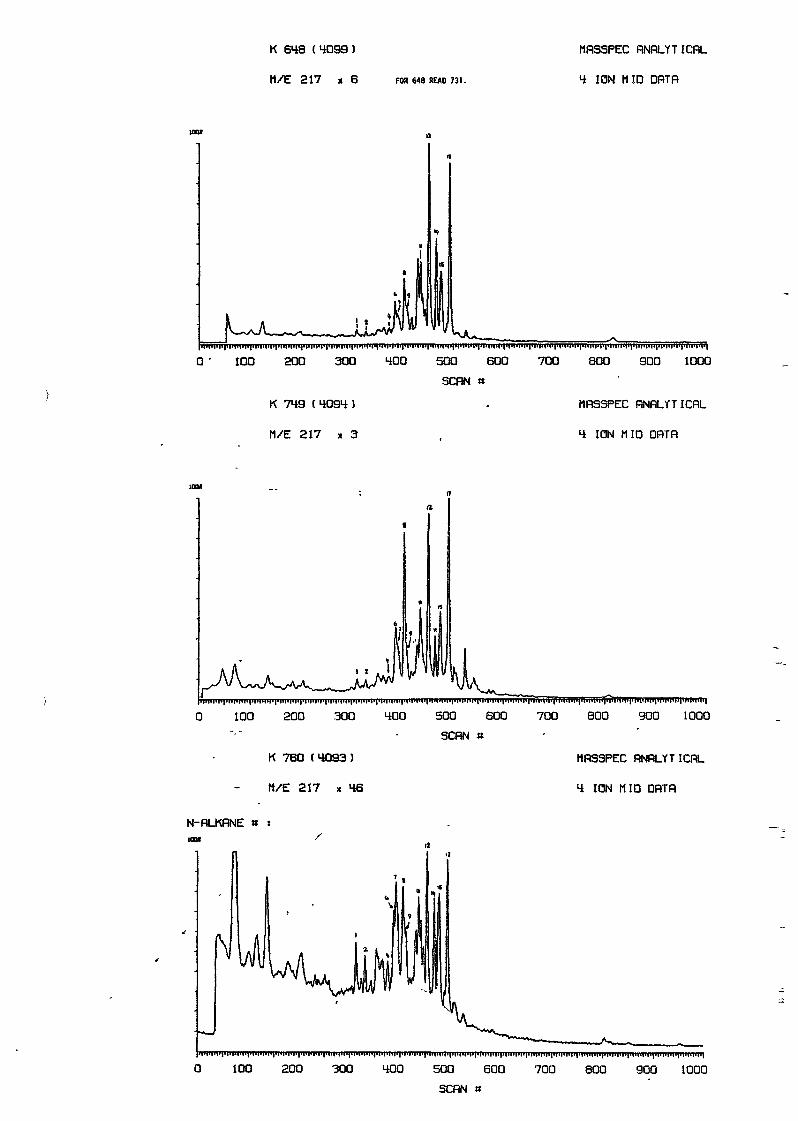
K 648 ( 4099 )
M/E 217 x 6 FOR 648 READ 7 3 1 .
MRSSPEC RNflLYTICRL
4 ION MID DRTR
0 • 100 200 300 400
K 749 (4094)
M/E 217 x 3
500 600 700 800 900 1000
SCflN «
MRSSPEC RNRLYTICRL
4 ION MID ORTR
0 100 200 300 400 500 600 700 800 900 1000
SCRN «
K 760 ( 4093 ) MRSSPEC RNflLYTICRL
M/E 217 x 46 4 ION MID ORTfl
N-RLKRNE » s
0 100 200 300 400 500 600 700 800 900 1000
SCRN «
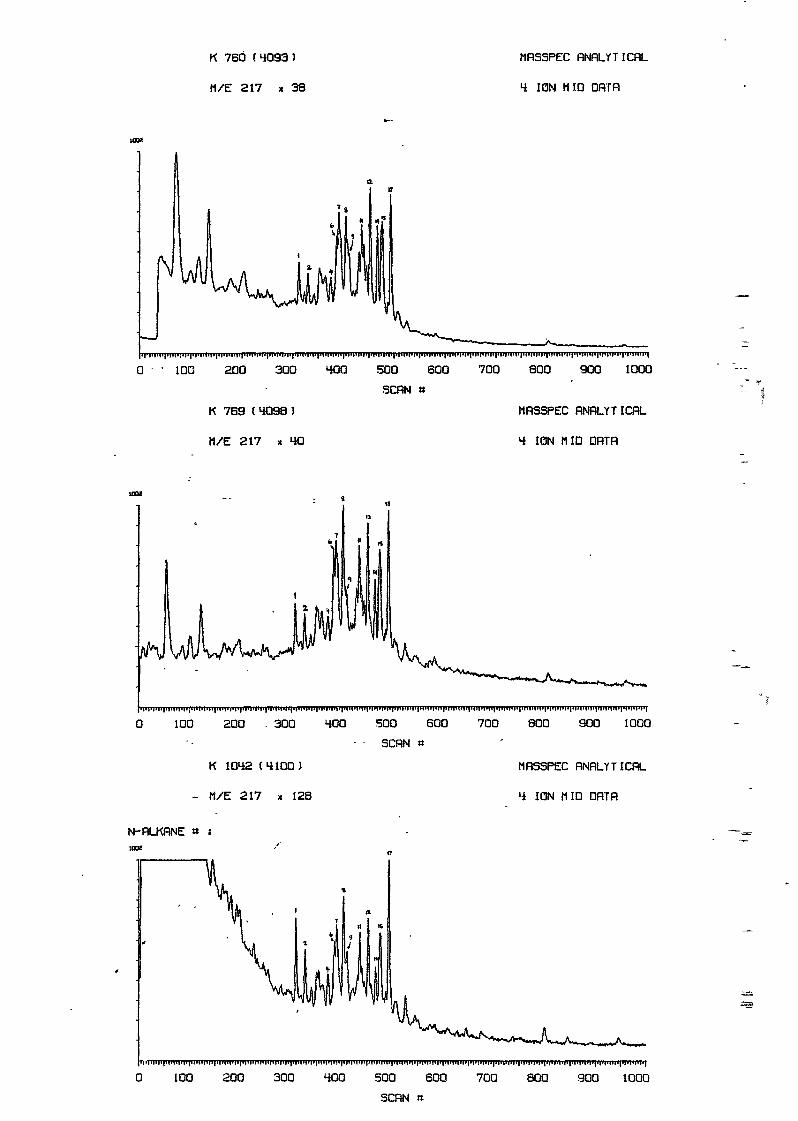
K 760 (4093)
M/E 217 x 38
MRSSPEC RNRLYTICRL
4 ION MID DRTR
0 - • 100 200 300 400 500 600 700 800 900 1000
SCRN »
K 769 ( 4098 ) MRSSPEC RNRLYTICRL
M/E 217 x 40 4 ION MID DRTR
0 100 200 . 300 400 500 600 700 800 900 1000
SCRN «
K 1042 (4100) MRSSPEC RNRLYTICRL
- M/E 217 x 128 4 ION MID DRTR
N-RLKflNE * s
100 200 300 400 500 600 700 800 900 1000
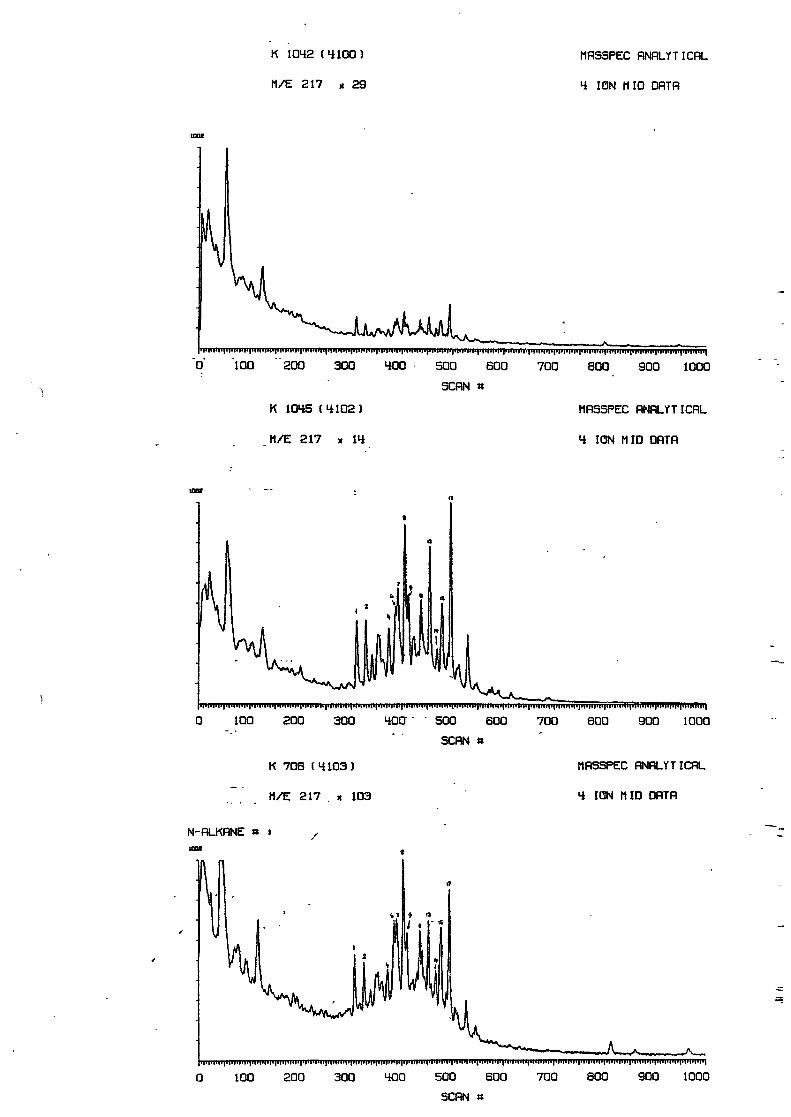
K 1042 (4100)
M/E 217 i 29
MRSSPEC RNRLYTICRL
4 ION MID DflTR
0 100 "200 300 400 500 600 700 800 900 1000
SCRN *
K 1045 (4102)
M/E 217 x 14
MRSSPEC RNRLYTICRL
4 ION MID ORTR
100 200 300 40CT 500 600 700 800 900 1000
K 706 (4103)
M/E 217 x 103
MRSSPEC RNRLYTICRL
4 ION MID DRTR
N-flLKHNE »
A.100 200 300 400 500 600
SCRN »
700 800 900 1000
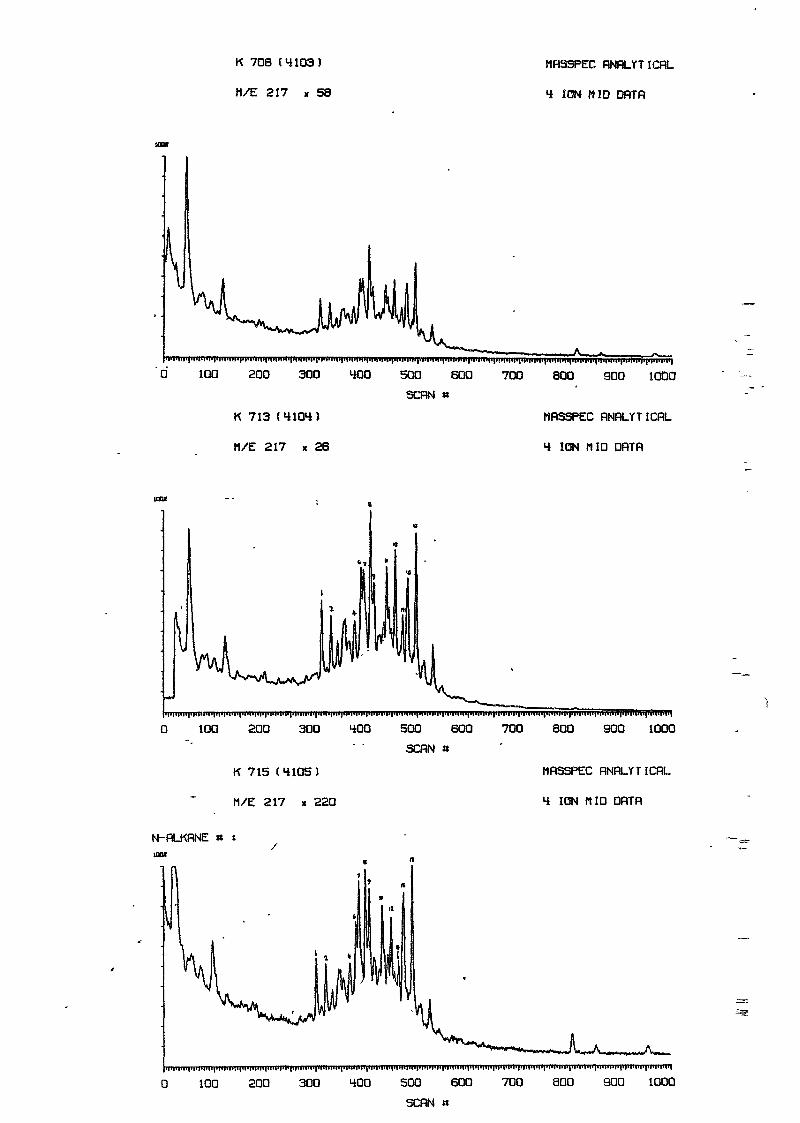
K 70S (4103)
M Æ 217 x 58
MRSSPEC RNRLYTICRL
4 ION MID DRTR
100 200 300 400
K 713 (4104)
M/E 217 x 26
500 600
SCRN «
700 800 900 1000
MRSSPEC RNRLYTICRL
4 ION M10 DRTR
0 100 200 300 400
K 715 (4105)
M/E 217 x 220
N-RLKRNE «
500 600
SCRN »
700 800 eoo
MRSSPEC RNRLYTICflL
4 ION MID DRTR
0 100 200 300 400 500 600 700 SOO 900 1000
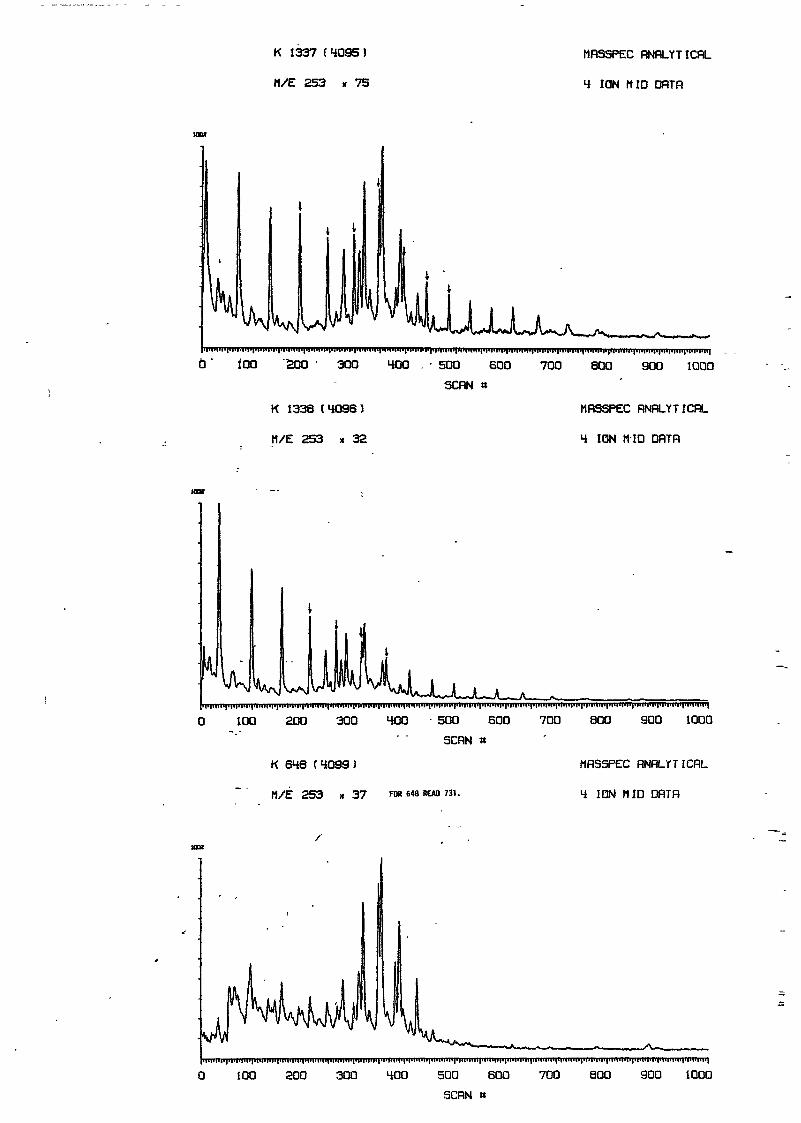
K 1337 ( 4095 )
M/E 253 x 75
MRSSPEC RNRLYTICRL
4 ION MID DRTR
0' 100 200 • 300 400
K 1338 ( 4096 )
M/E 253 x 32
500 600
SCRN «
700 800 900 1000
MRSSPEC RNRLYTICRL
4 ION MID ORTR
111100 200 300 400 500 600
SCRN «
K 648 (4099)
M/É 253 x 37 648 READ 731.
700 800 900 1000
MRSSPEC RNRLYTICRL
4 ION MID DRTR
0 100 200 300 400 500 600 700 800 900 1000
SCRN »
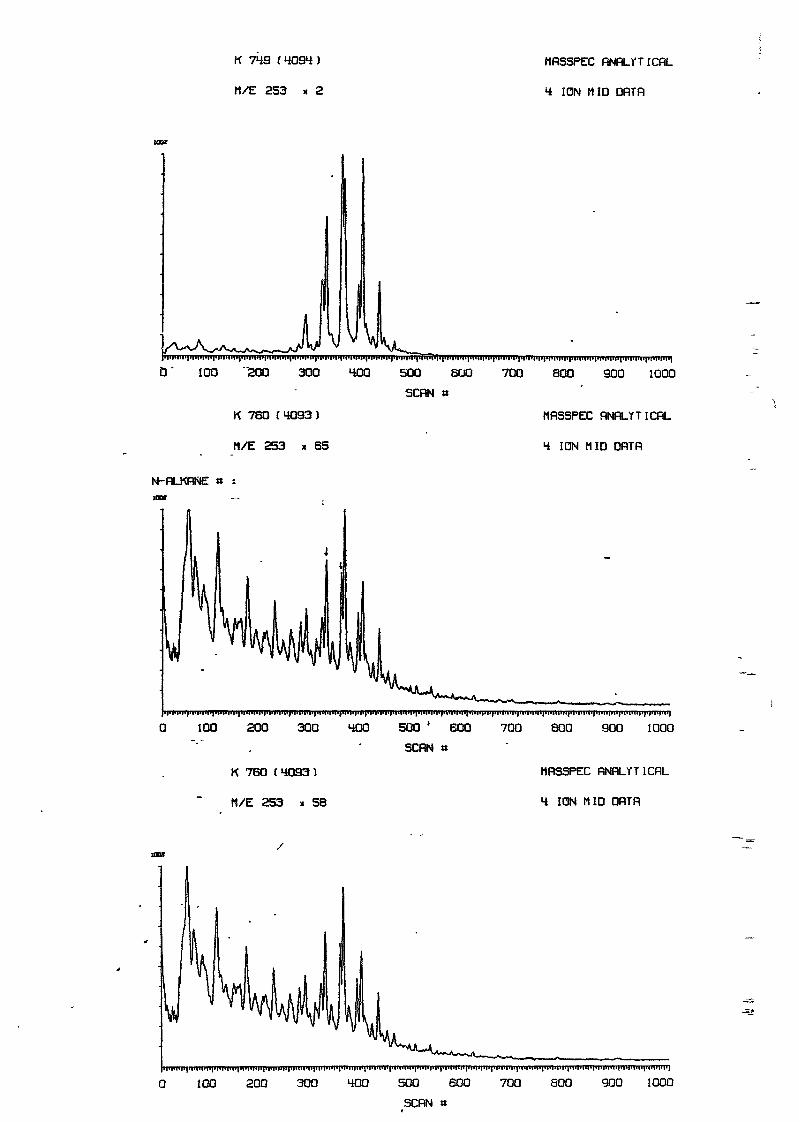
K 749 ( 4094 )
M/E 253 x 2
MRSSPEC RNRLYTICRL
4 ION MID DRTR
0' 100 "200 300 400 500 600 700 800 900 1000
SCRN a
K 760 (4093) HRSSPEC RNRLYTICRL
tt/E 253 x 65 4 ION MID DRTfl
N-RLKRNE * t
0 100 200 300 400 500 ' 600 700 800 900 1000
SCRN »
K 760 (4093) MRSSPEC flNRLYTICRL
M/E 253 x 58 4 ION MID ORTR
100 200 300 400 500 600 700 800 900 1000
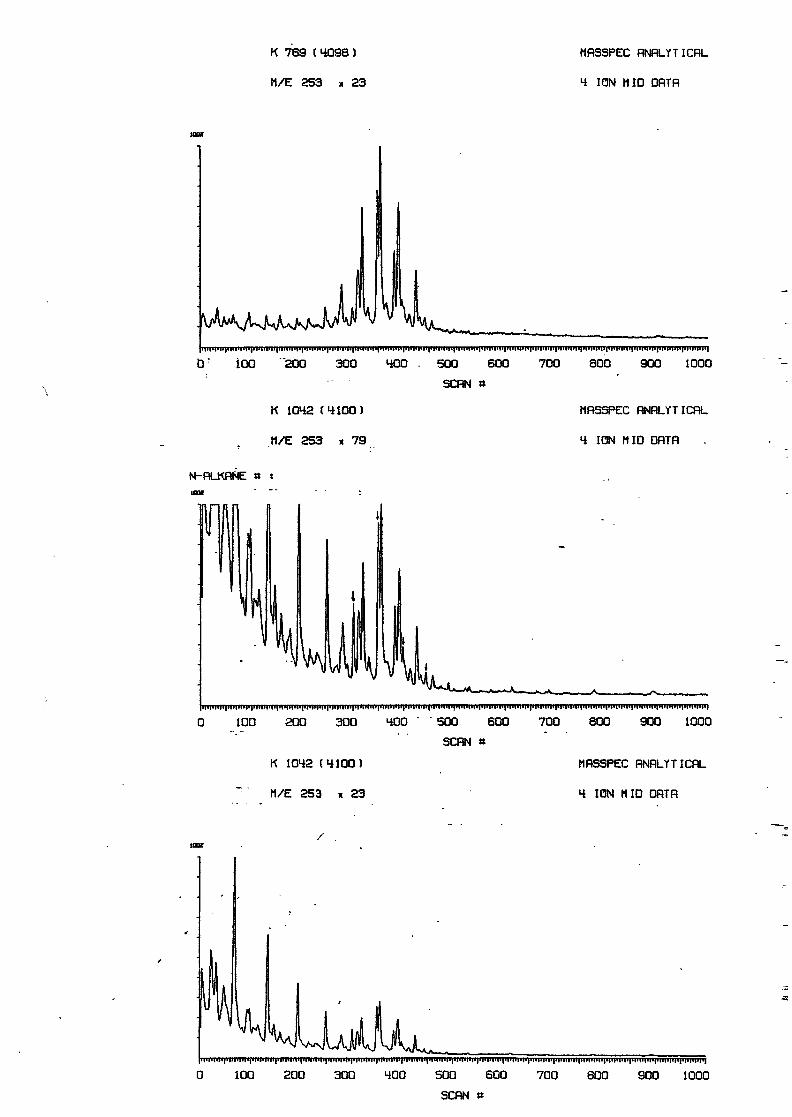
K 769 (4098)
M/E 253 x 23
HRSSPEC RNRLYTICRL
4 ION MID DRTR
0: 100 "200 300 400 . 500 600 700 800 900 1000
SCRN «
K 1042 (4100)
M/E 253 x 79
MRSSPEC RNRLYTICRL
4 ION MID DRTfl
N-RLKRNE *
100 200 300 400 500 600 700 800 900 1000
SCflN *
K 1042 (4100) MRSSPEC RNRLYTICRL
M/E 253 x 23 4 ION MID DRTR
0 100 200 300 400 500 600 700 800 900 1000
SCRN »
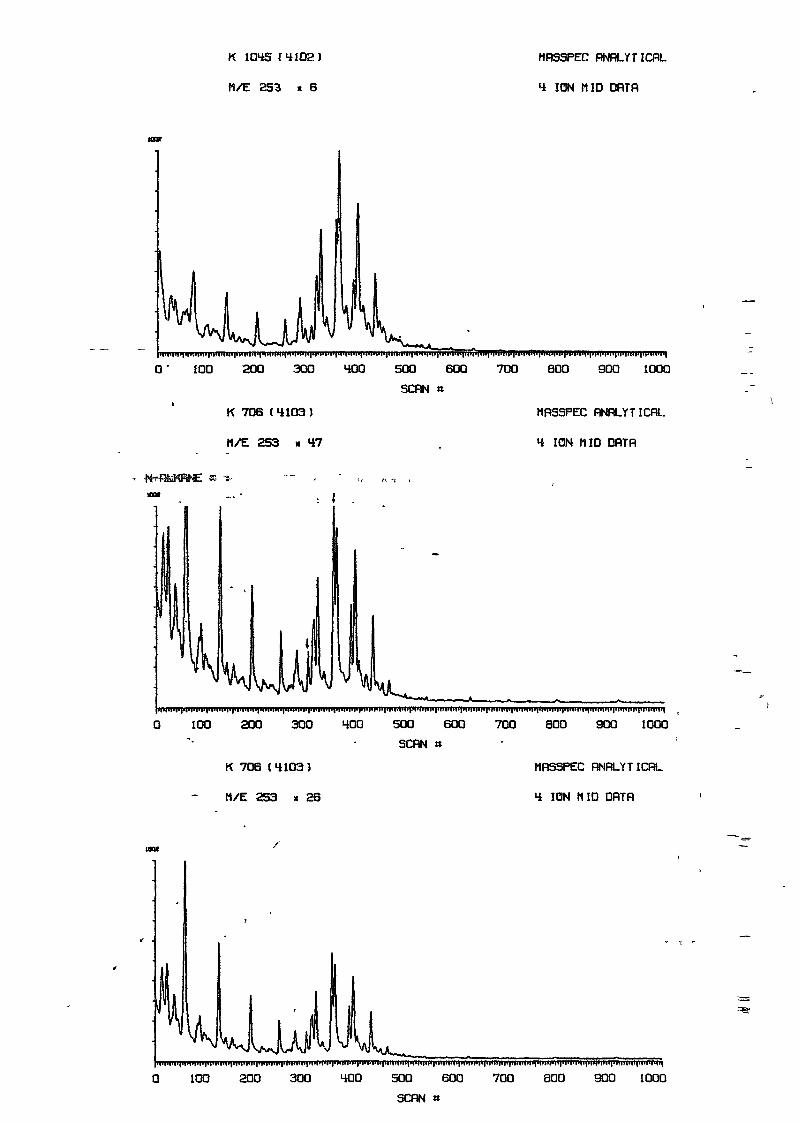
K 1045 ( 4102 )
M/E 253 x 6
MRSSPEC RNRLYTICRL
4 ION MID ORTR
0* 100 200 300 400 500 600 700 800 900 1000
SCRN «
K 706 (4103) MRSSPEC RNRLYTICRL
M/E 253 K 47 4 ION MID DRTR
100 200 300 400
K 706 C4103)
M/E 253 x 26
500 600 700 800 900 1000
SCRN *
MRSSPEC RNRLYTICRL
4 ION MID DRTR
0 100 200 300 400 500 600 700 800 900 1000
SCRN «
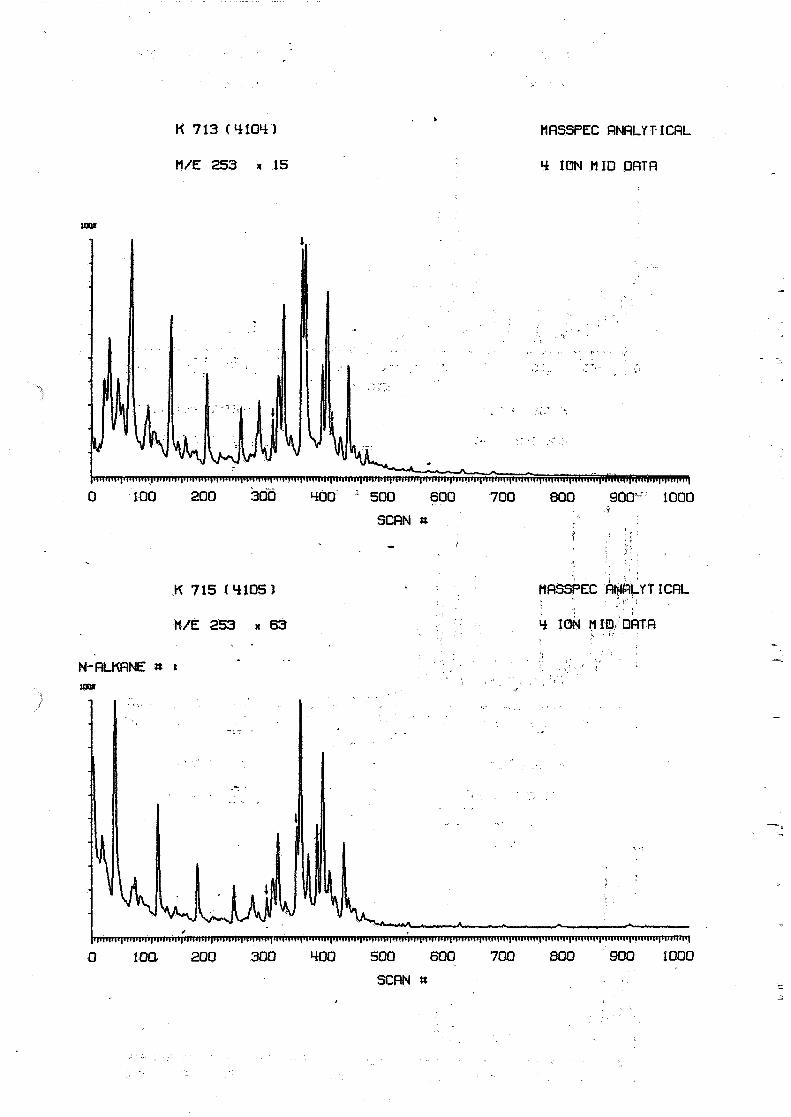
K 713 (4104) HRSSPEC RNRLfTICRL
M/E 253 x 15 4 ION MID DRTR
0 100 200 300 400 : 500 600 700 800 900" 1000
SCRN »
K 715 (4105) MRSSPEC RljJRLYTICRL
M/E 253 * 63 4 ION MIDrDRTfl
N-RLKRNE » tioai
10Q 200 300 400 500 600 700 800 900 1000
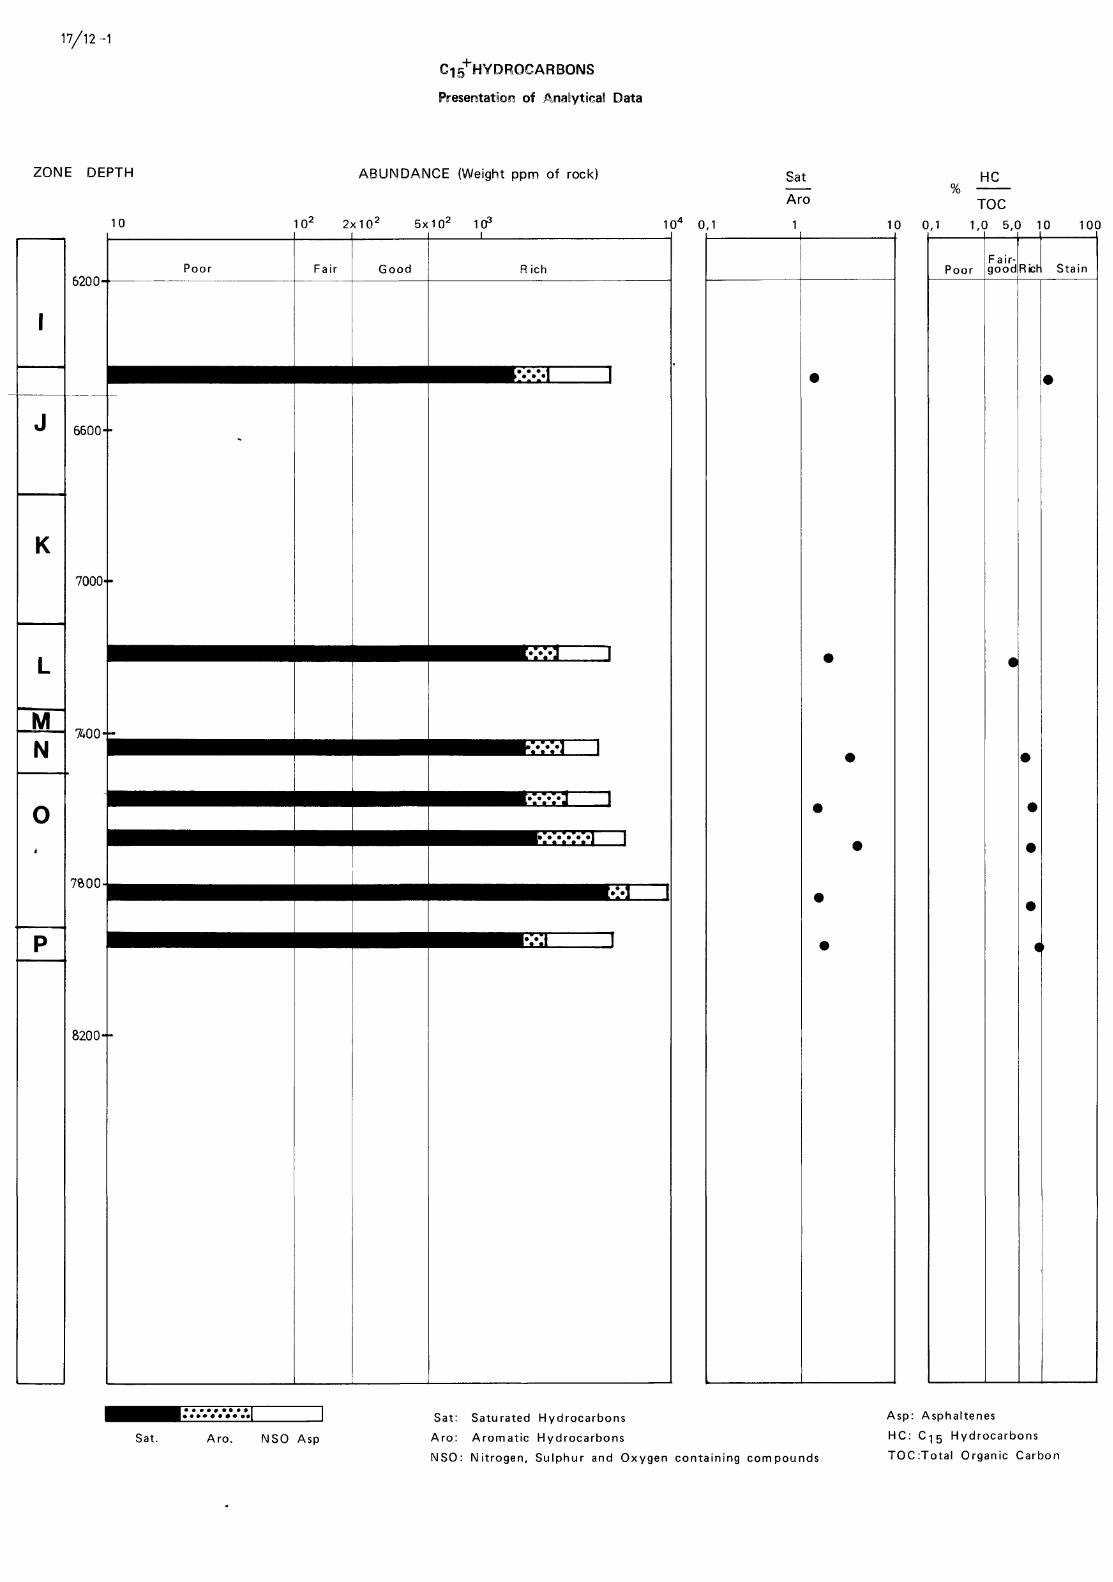
17/12-1
C-I5 HYDROCARBONS
Presentation of Analytical Data
ZONE DEPTH
10
K
MN
6200-
6600-
7000--
H00- -
7800
8200--
ABUNDANCE (Weight ppm of rock)
102 2x10² 5x10² 103
Poor Fair Good Rich
Sat
Aro
104 0,1 1
Sat. Aro. NSO Asp
HC%
TOC10 0,1 1,0 5,0 10 100
PoorFair-goodRicr Stain
Sat: Saturated Hydrocarbons
Aro: Aromatic Hydrocarbons
NSO: Nitrogen, Sulphur and Oxygen containing compounds
Asp: Asphaltenes
HC: Gig Hydrocarbons
TOC:Total Organic Carbon
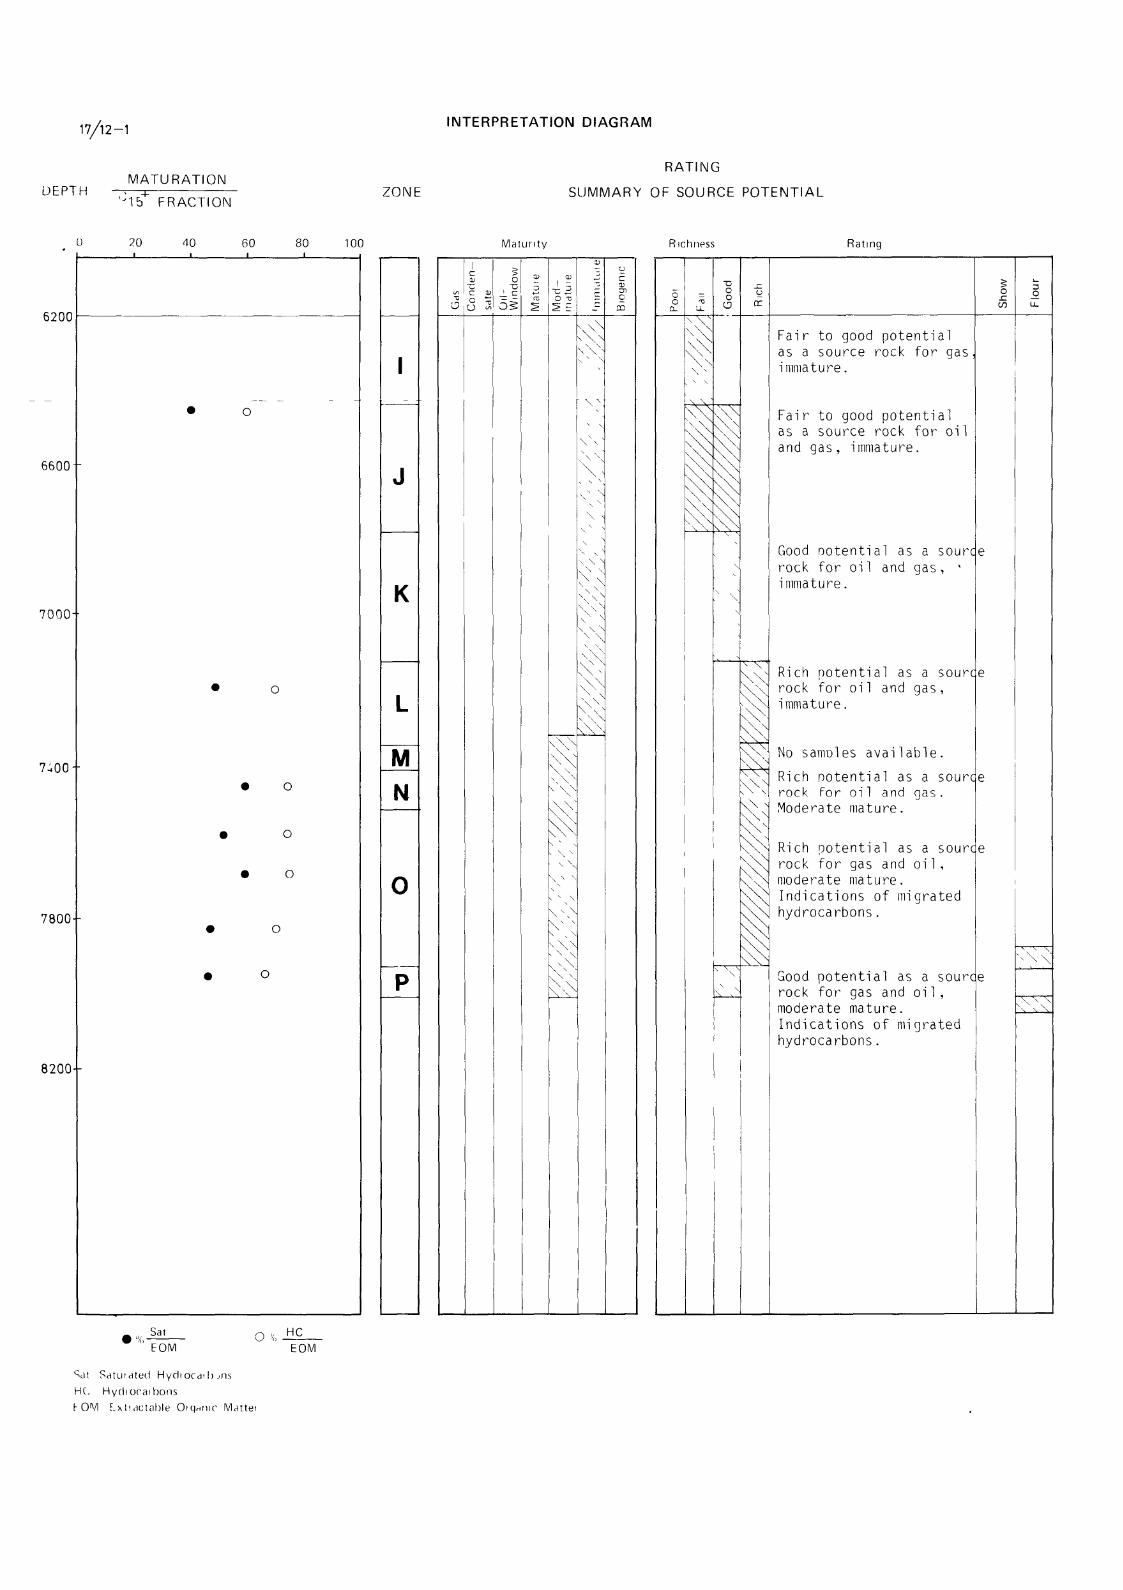
17/12-1 INTERPRETATION DIAGRAM
DEPTHMATURATION
°15+ FRACTIONZONE
RATING
SUMMARY OF SOURCE POTENTIAL
0 20 40 60 80 100 Maturity
6200
6600-
7000-
7-iOO-
7800
8200--
K
MN
cCD
Richness
Po
oi
Fan
\^\ \
\ \ •
\ \ N
\ \ \
\ \ \
i
Goo
\ \ >
\ \
\ \
\
x \
Rid
w\\
\V-\ \N\ \ x
\ N
Rating
Fair to goodas a sourceimmature.
Fair to goodas a source
potentirock for
potentirock
and gas, immature
Good ootentirock for oi1immature.
Rich potentirock for oilimmature.
al asand
al asand
for
agas
agas
No samoles available
Rich notentirock for oil
al asand
Moderate mature.
Rich potentirock for gas
al asand
moderate mature.Indi cations of mihydrocarbons.
Good potential asrock for gasandmoderate mature.Indicationshydrocarbons
of mi
agas
aoil
algas,
aloil
sourc
sourc
sourc
sourc
grated
aoil
sourc
grated
s
Sho
e
e
e
e
e
Flo
i
^\ \
Sat
EOMO \ HC
EOM
^dt Satuiated Hydiordi h jnsH(. Hycliorai bonsf-OM E.\tidctable Oiq^nir Mattel
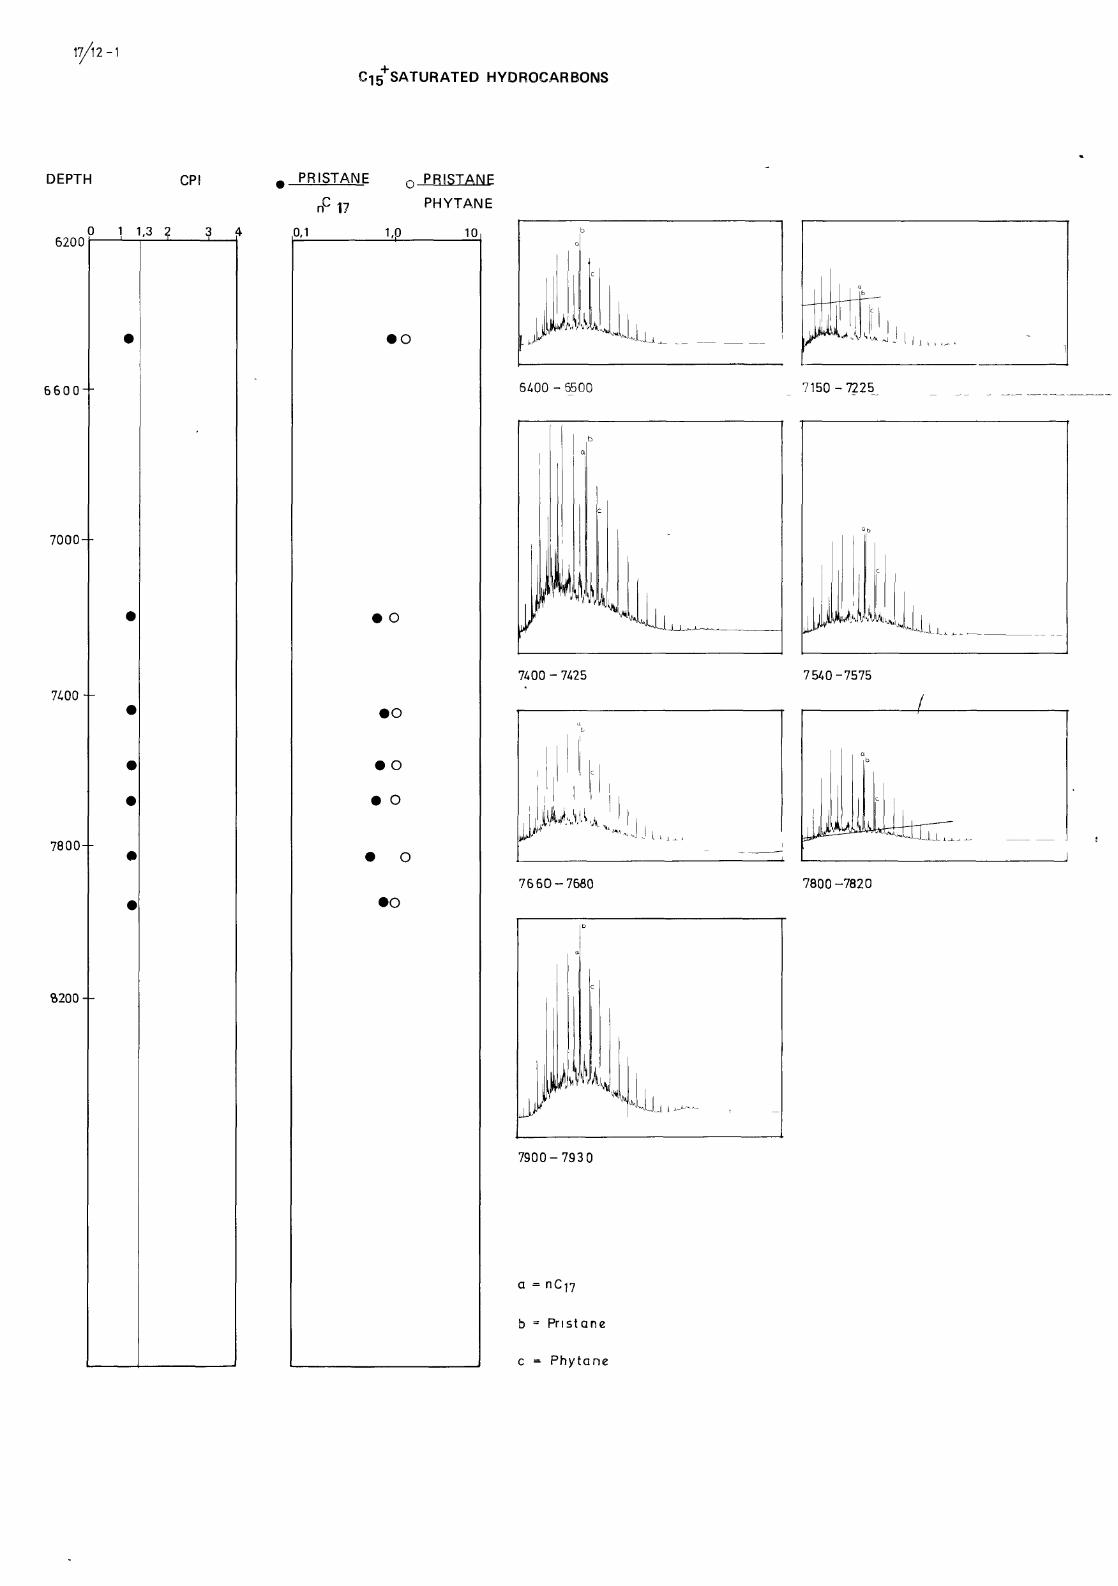
17/12-1
SATURATED HYDROCARBONS
DEPTH CPI
62000 1 1,3 2 3
6 6 0 0 - -
7000--
7400 - -
7800--
6200 - -
PRISTANE o PRISTANE
Il ^W«j V A -V.. LLu.
6Z.00 - 6500 7150-7225
7A00 - 7425 7540-7575
7660-7680 7800-7820
7900-793 0
a =
b = Pristane
c = Phytane
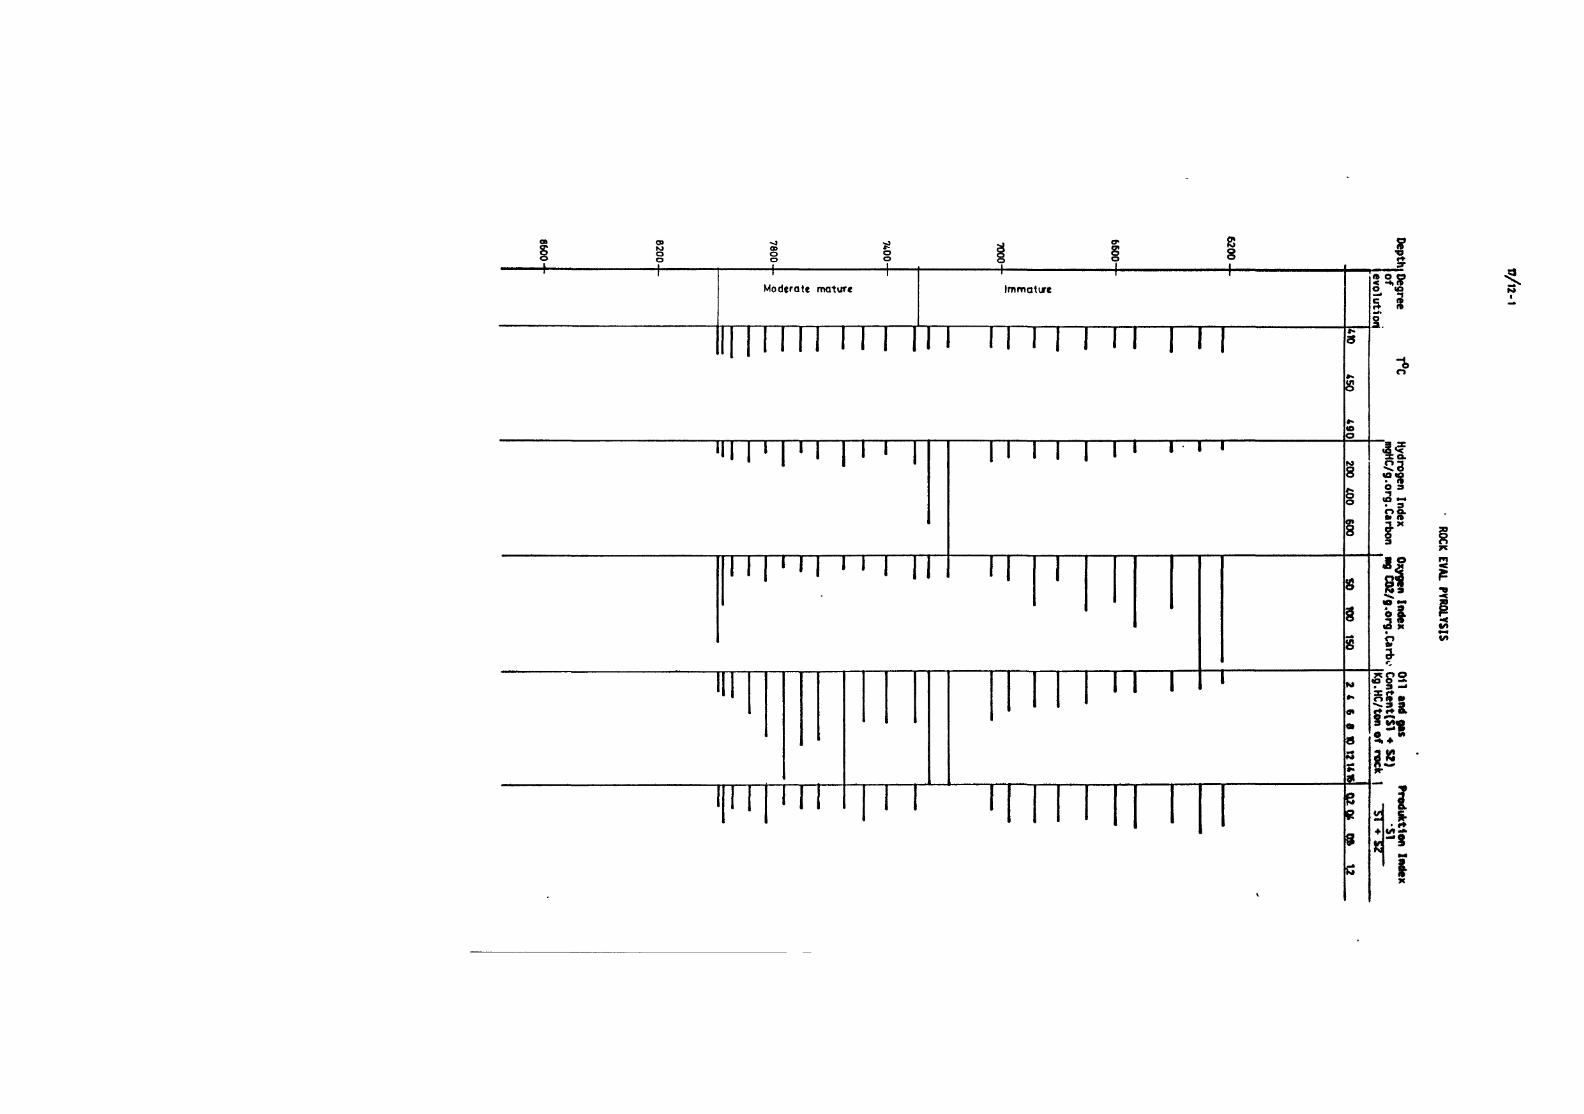
sModerate mature Immature
M M I I I II I I I I 1 I I I I I I
ts
3,1?
HI | I I I I I T T i • i i ft53a a
2-l
I I | ' I I > > I I I TTIS
9-
i
TT
I l l " 'B8S
sis
9
i
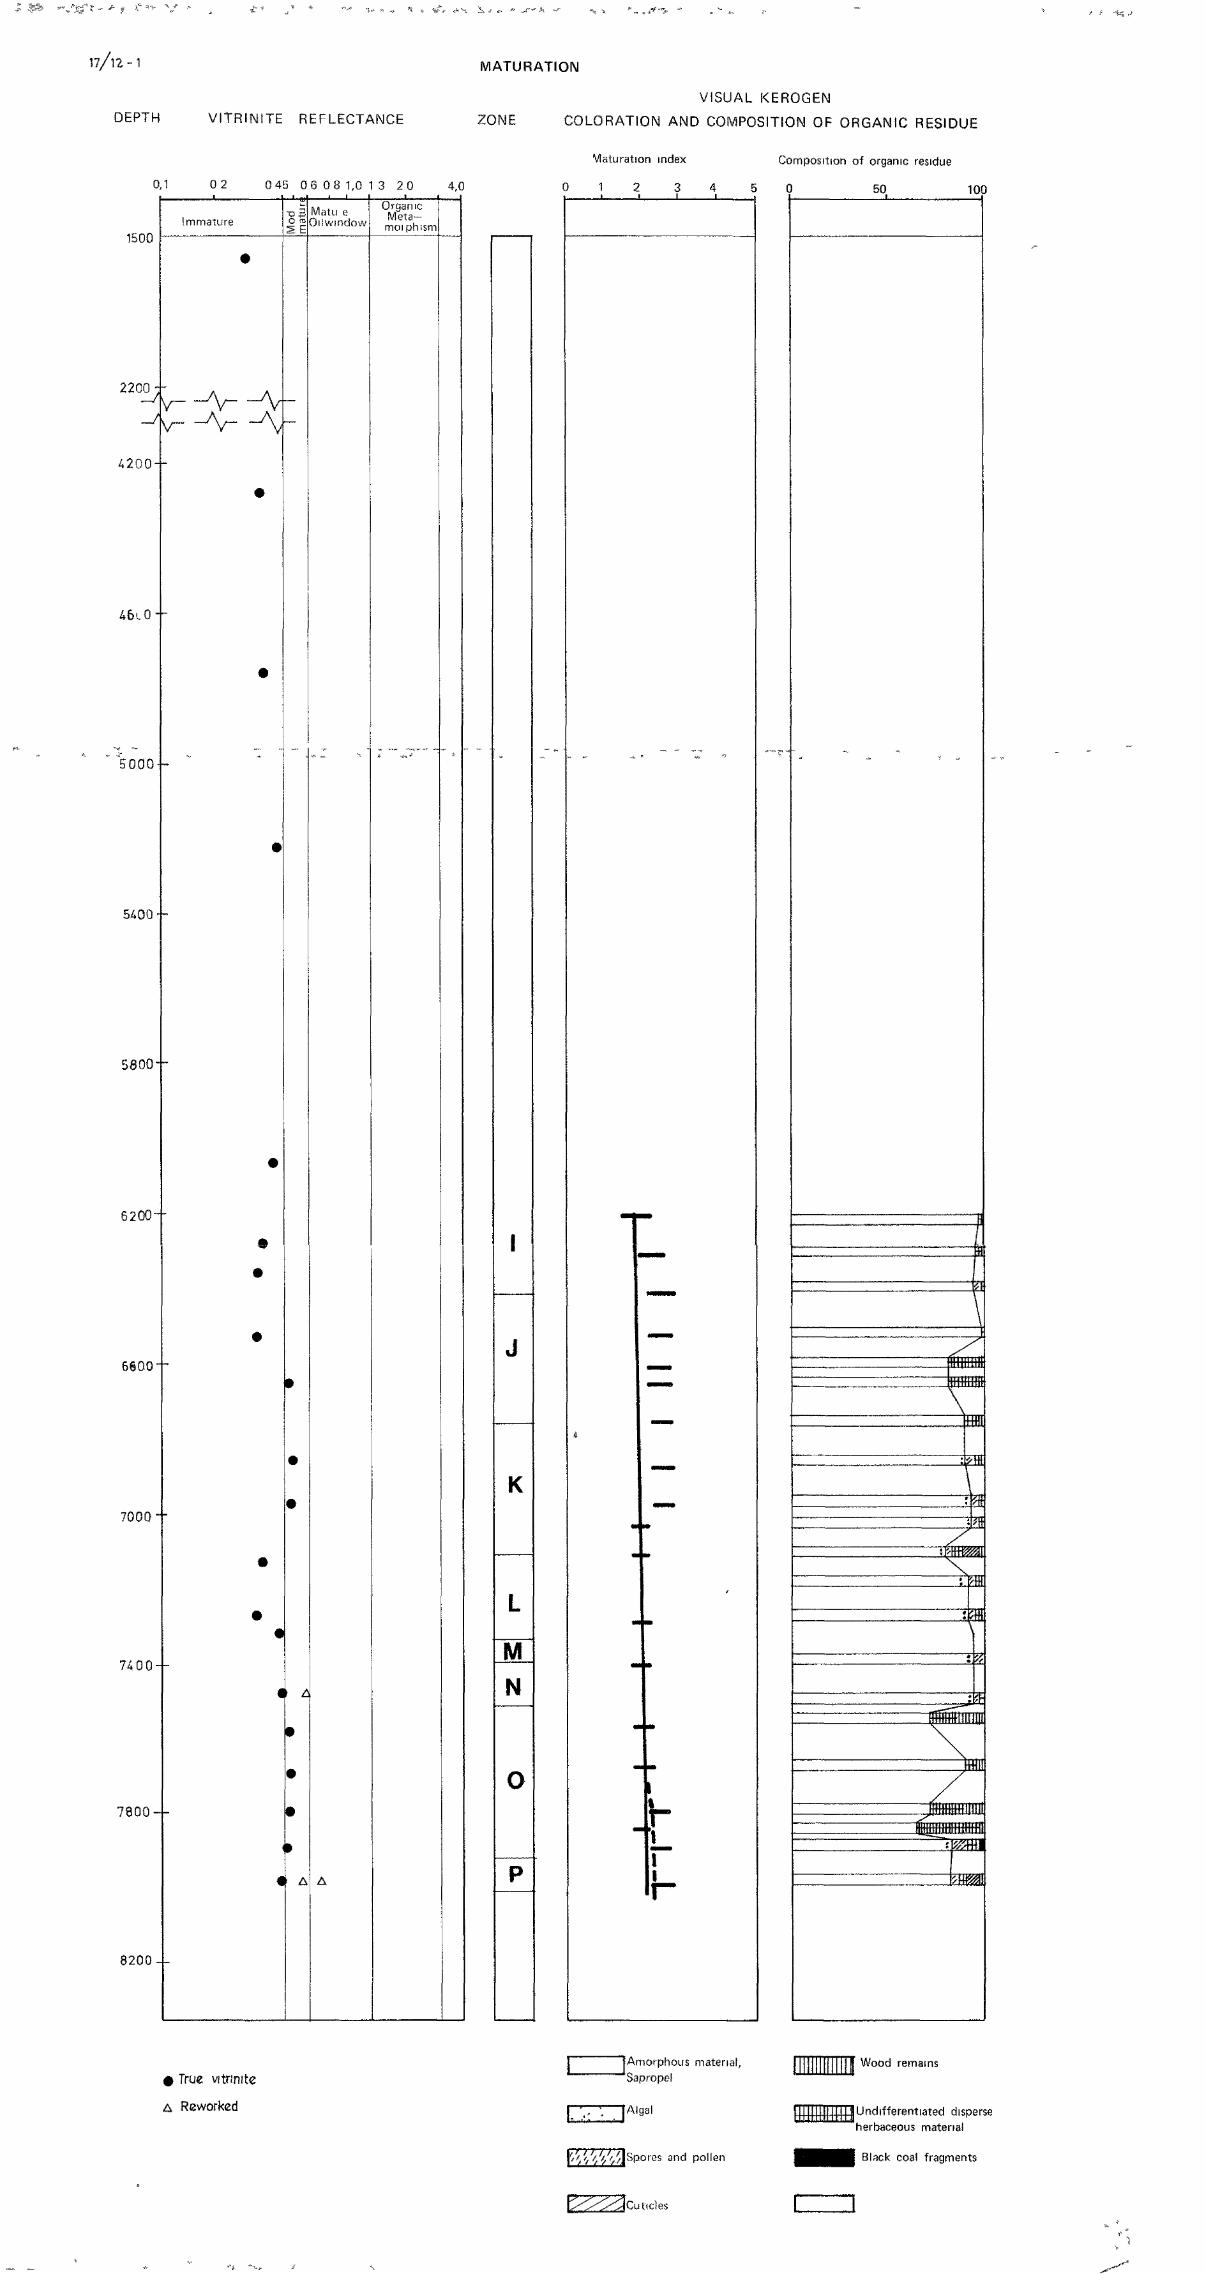
DEPTH
0,1
VITRINITE REFLECTANCE
MATURATION
VISUAL KEROGEN
ZONE COLORATION AND COMPOSITION OF ORGANIC RESIDUE
Maturation index
0 2 0 45 06 08 1,0 1 3 2 0 4,0 0 1
1500
2200 : -
5 0 0 0 - -
SiOO--
5800-"
6200- '
6600- -
700Q--
7 4 0 0 - -
7 8 0 0 - -
8 2 0 0 - -
Immature
-V
X3 :O •
SE
Matu eOiiwindow
A
OrganicMeta-moi phism
K
MN
3I
Composition of organic residue
5 0 50 100
\
W
\vmrn.
J
% True vitnnitc
A Reworked
(Amorphous material,SapropeS
Wood remains
\/'/>///'/'//\Spores and pollen
Jndifferentiated disperse"herbaceous matena)
Black coal fragments
-i *t.» 3
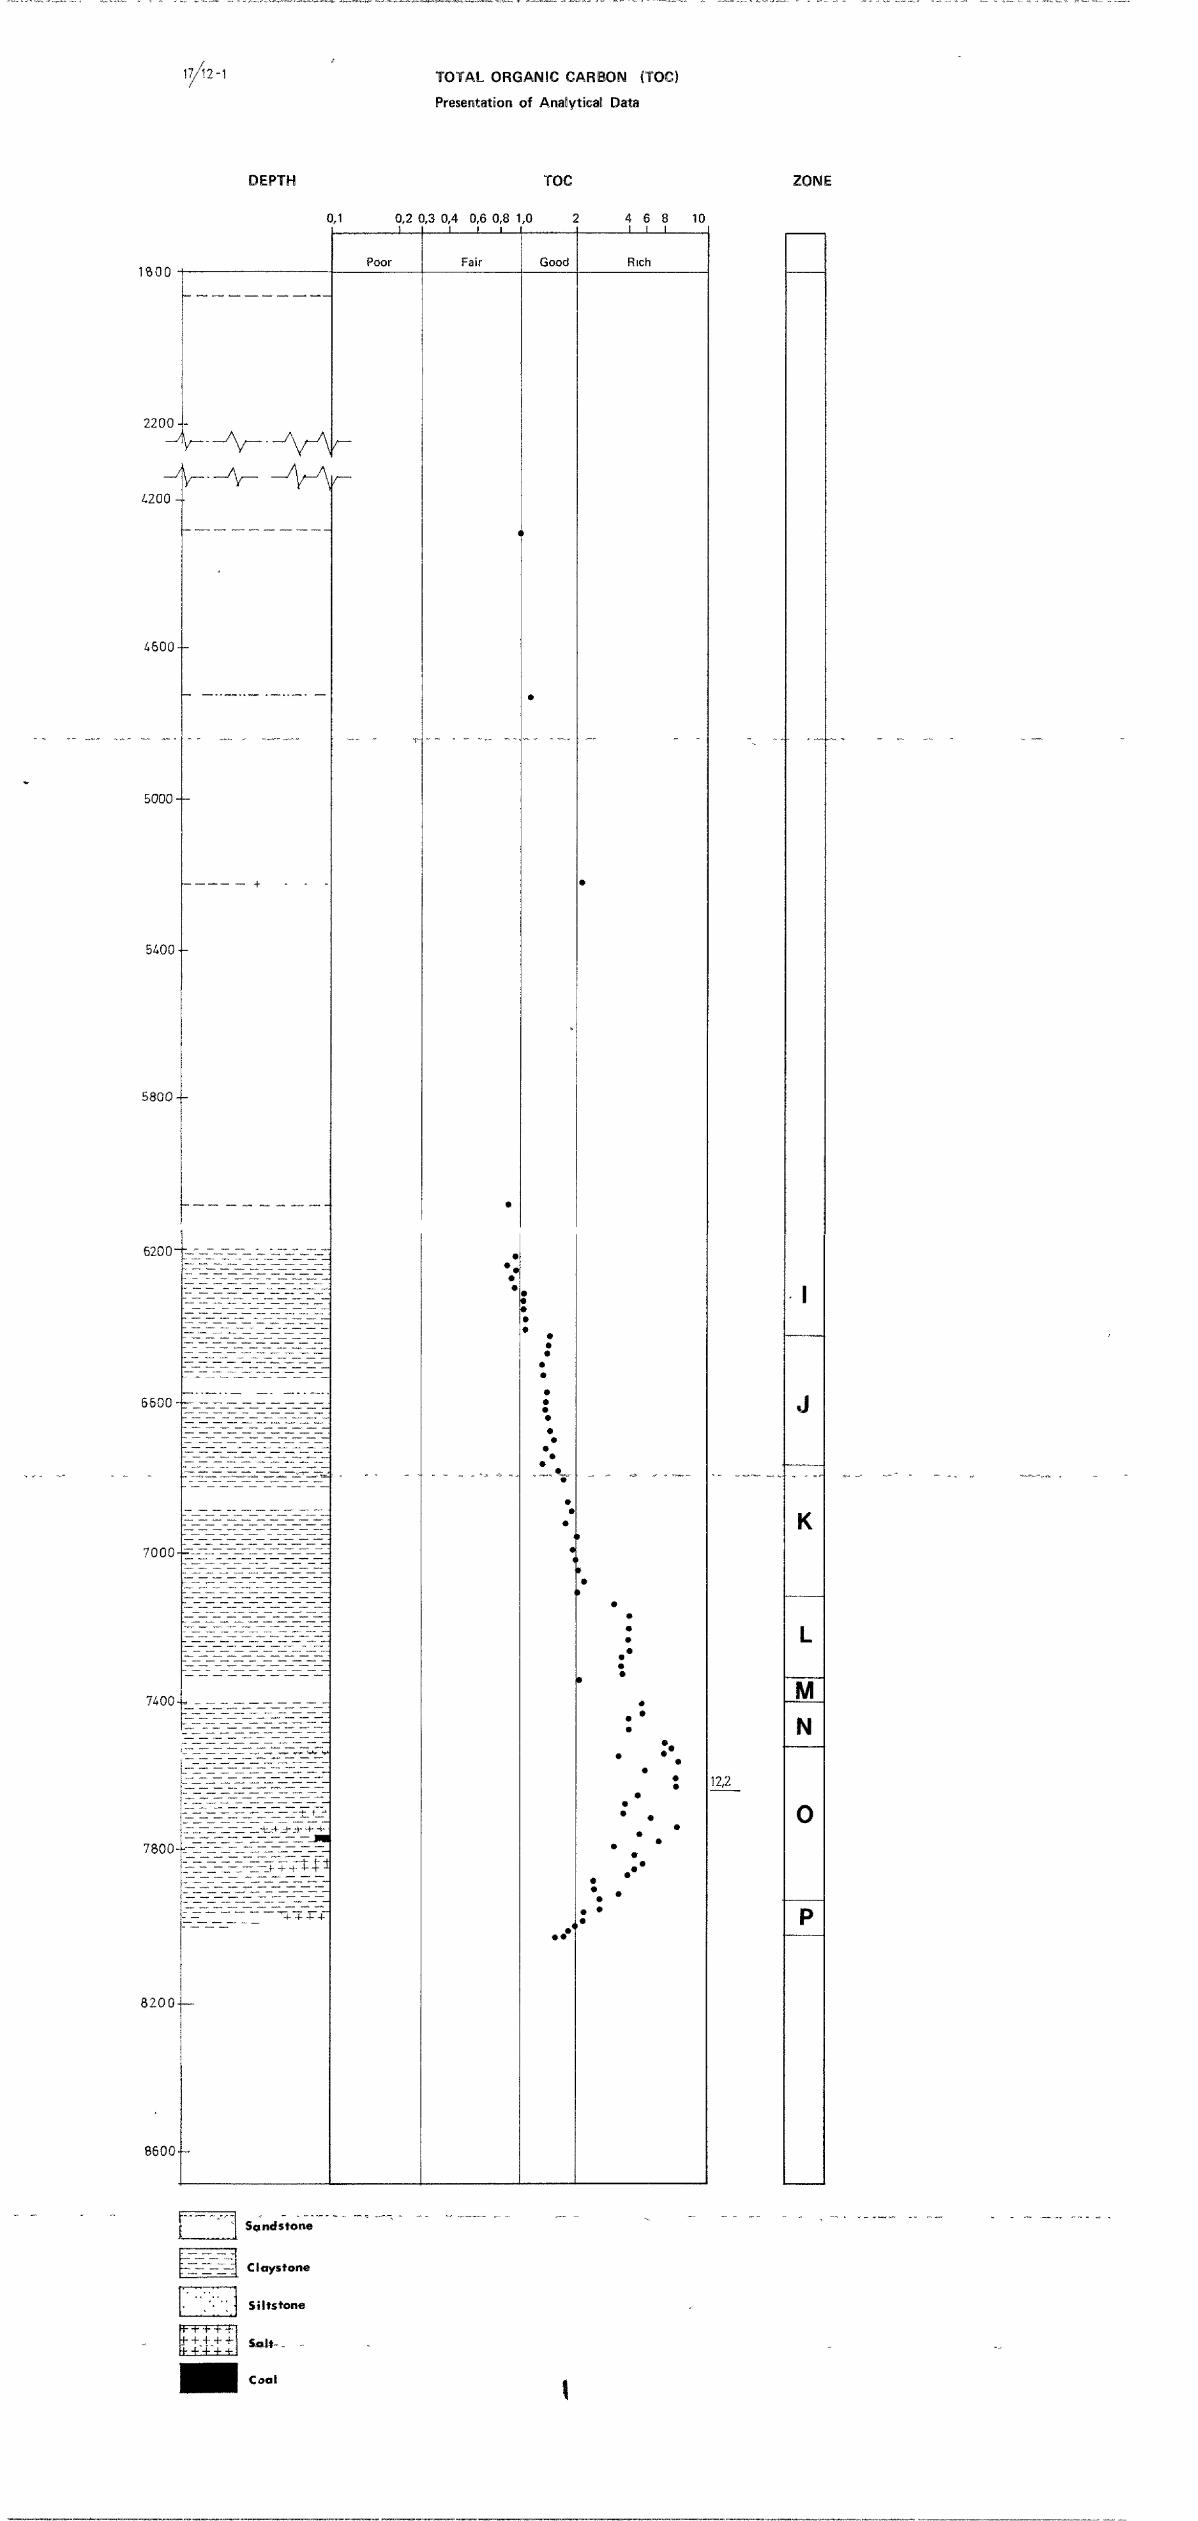
17/12-1 TOTAL ORGANIC CARBON {TOO
Presentation of Analytical Data
DEPTH TOC ZONE
(
1n nn
2200-_J
4200 -
4600-
5000-
5400-
5800-
6200-
6500™
7000-
7400-
7800-
8200-
860G-
V—\—VA
Z~Z—Z-£?Z>Z-Zr£KHI-
_ .
I-Z—Z-Z-Z-Z-Z-Z—Z-Z-Z
—_—•-—.L^~_ri_—_~__ri-r2_~_
rZ~Z-Z-Z-Z~Z—Z-Z-Z—Z
r-Z-Z-Z-Z-£I—Z~ZrZ—Z~Z". r , *, "z.r~i._"i.--~T.-.~"~—^" •
z-z-z-z-ZrZ-z-z-i: c-
-Z-Z-Z-3ZHI-^p~rt Ft
),1 0,2 C
Poor
),3 0,4 0,6 0,8 1i i i
Fair
t
*l
,o :
Good
i
•
I 4 6 8 10i i i
Rich
•
»
»
•
•• •
• *
J
K
N
12,2
rZrZrZH
" • ' . ' • •
Sandstone
Clays tone
Siltstone
&*lt~. -
Coal
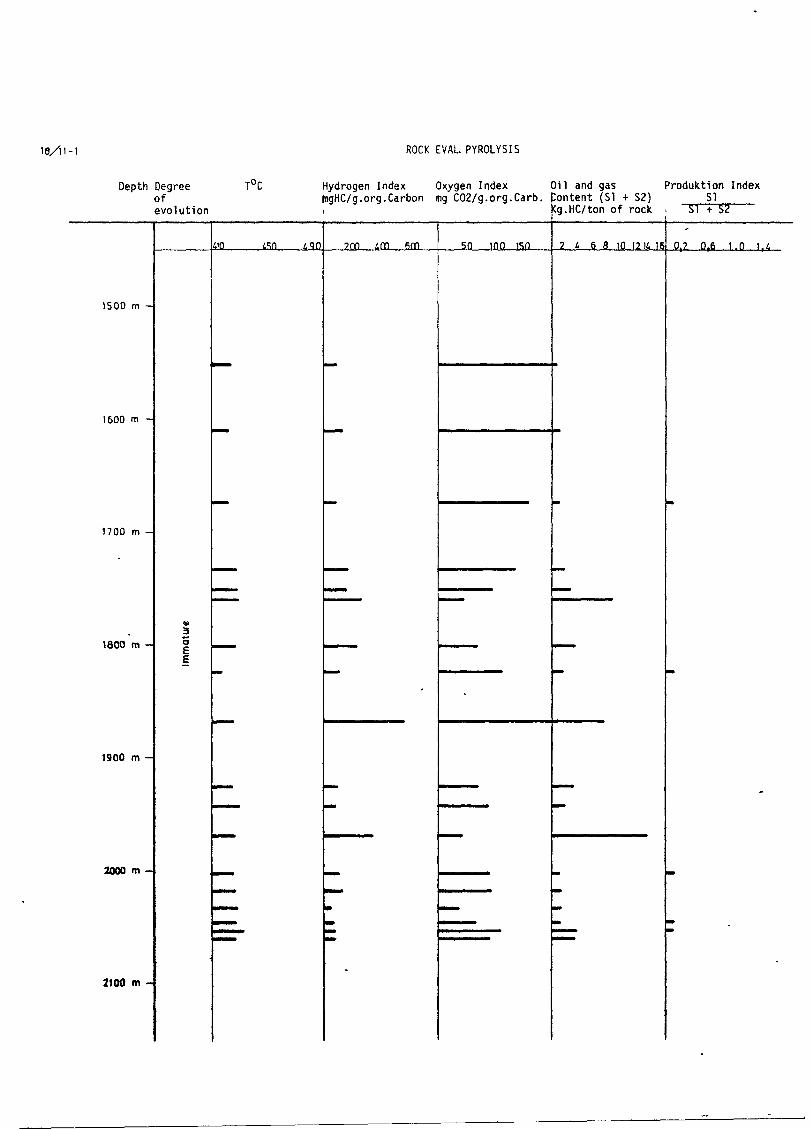
18/11-1 ROCK EVAL PYROLYSIS
Depth Degreeofevolution
T°C Hydrogen Index Oxygen Index Oil and gas Produktion IndexItigHC/g.org.Carbon mg C02/g.org.Carb. Content (SI + S2) SIlontent (SI + S2)
Cg.HC/ton of rock . SI + 52
1500 m -
1600 m -
1700 m -
1800 m -
1900 m -
2000 m -
2100 m -
oE
A go ?nn 6m 50 100 150 2 U 6 8 10 12 It 16 0.2 0.6 1.0 \.u
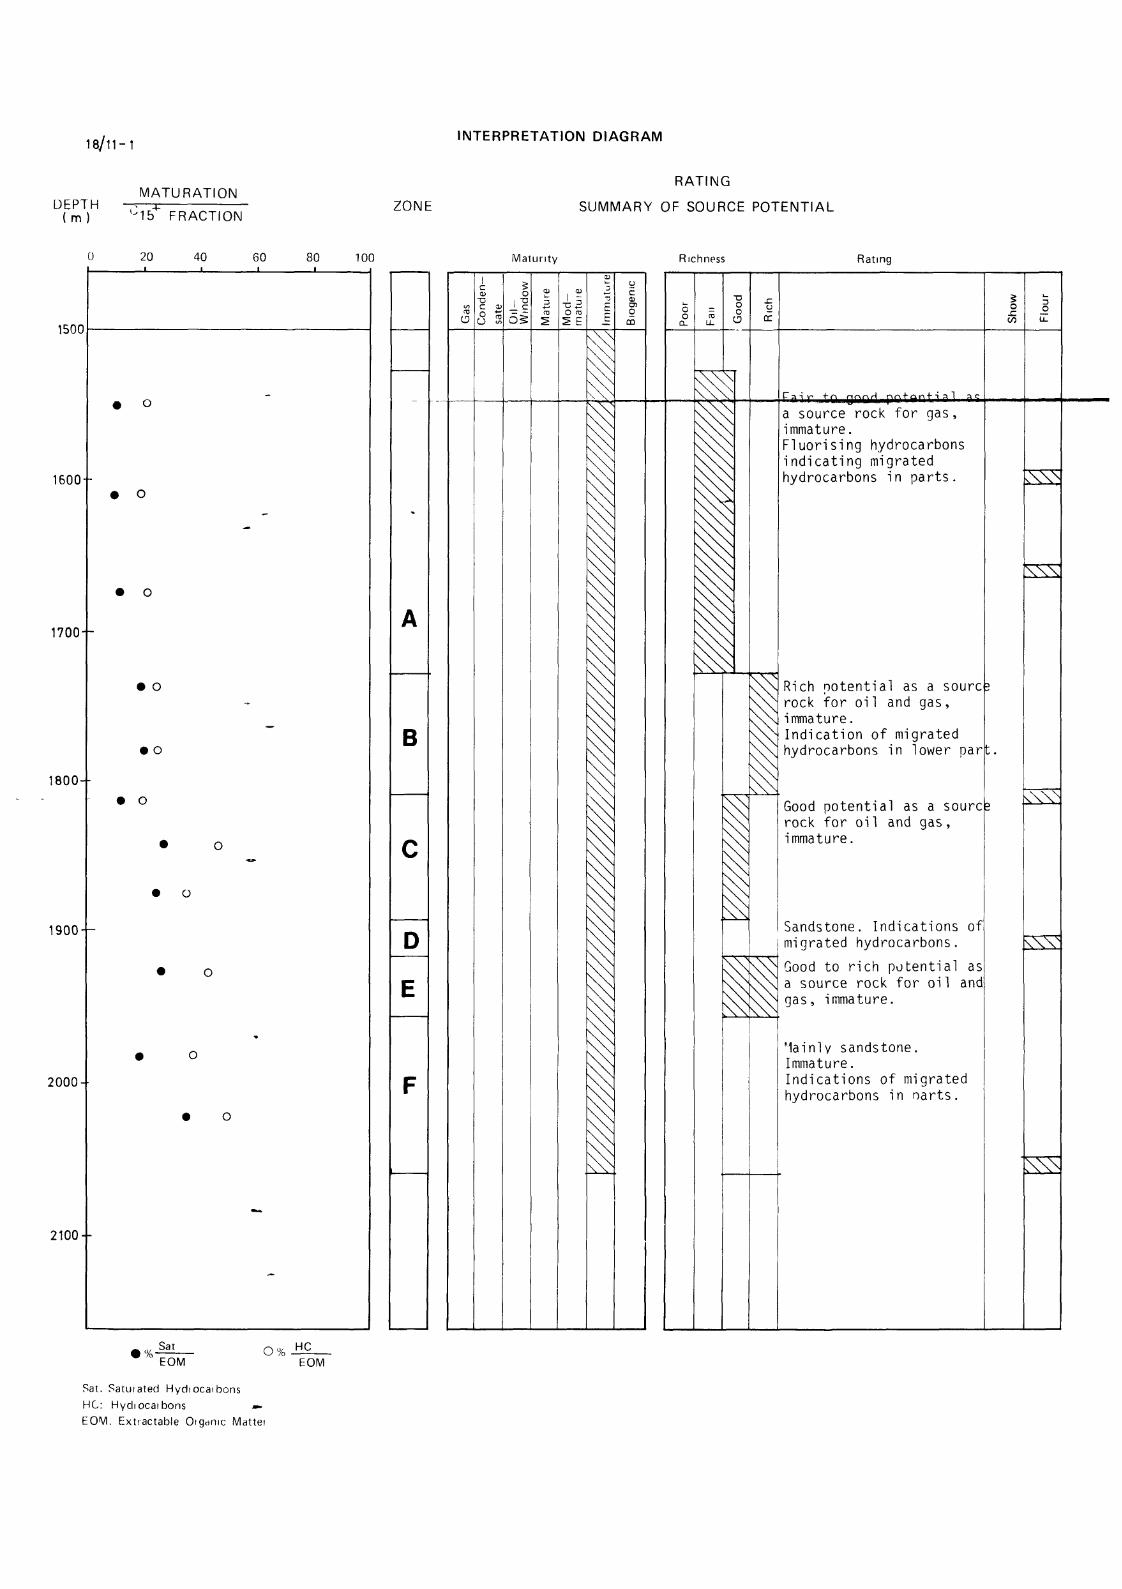
18/11-1 INTERPRETATION DIAGRAM
DEPTHMATURATION
(m) °15 FRACTIONZONE
RATING
SUMMARY OF SOURCE POTENTIAL
0 20 40 60 100
1500
1600--
1700--
1800--
1900- -
2000-
2100- -
Maturity Richness Rating
B
so
± cOg
O ro
2 E
enO O
oQ.
a source rock for gas,immature.Ftuorising hydrocarbonsindicating migratedhydrocarbons in parts.
Rich potential as a sourorock for oil and gas,immature.Indication of migratedhydrocarbons in lower par
Good potential as a sourcerock for oil and gas,immature.
Sandstone. Indications ofmigrated hydrocarbons.
Good to rich potential asa source rock for oil andgas, immature.
Mainly sandstone.Immature.Indications of migratedhydrocarbons in narts.
O
Sat
EOMO% HC
EOM
Sat. Satuiated HydiocaibonsHC: Hydiocaibons m-EOM. Extractable Oigdmc Mattel
\V\
\VV
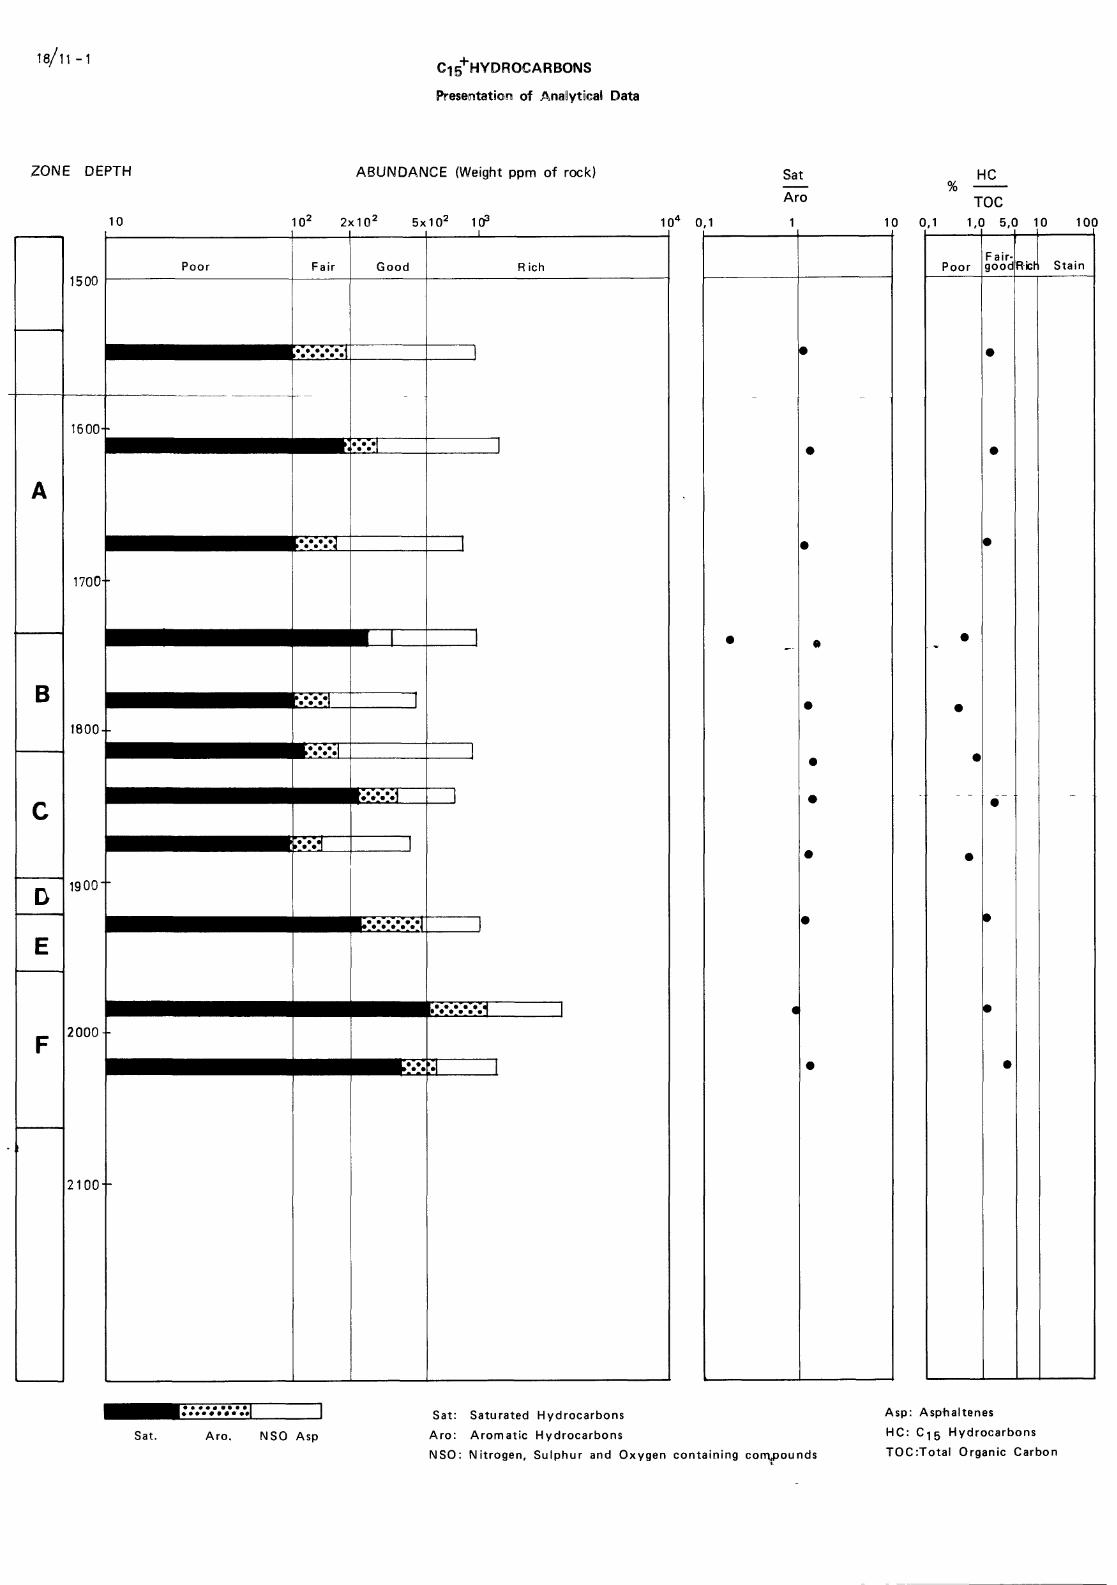
Ci5+HYDR0CARB0NS
Presentation of Analytical Data
ZONE DEPTH
10
ABUNDANCE (Weight ppm of rock)
102 2x10² 5x10² 103 104 0,1
Sat
Aro
1
HC%
TOC
10 0,1 1,0 5,0 10 100
PoorFairgoodRch Stain
Sat. Aro. NSO Asp
Sat: Saturated Hydrocarbons
Aro: Aromatic Hydrocarbons
NSO: Nitrogen, Sulphur and Oxygen containing compounds
Asp: Asphaltenes
HC: C15 Hydrocarbons
TOC:Total Organic Carbon
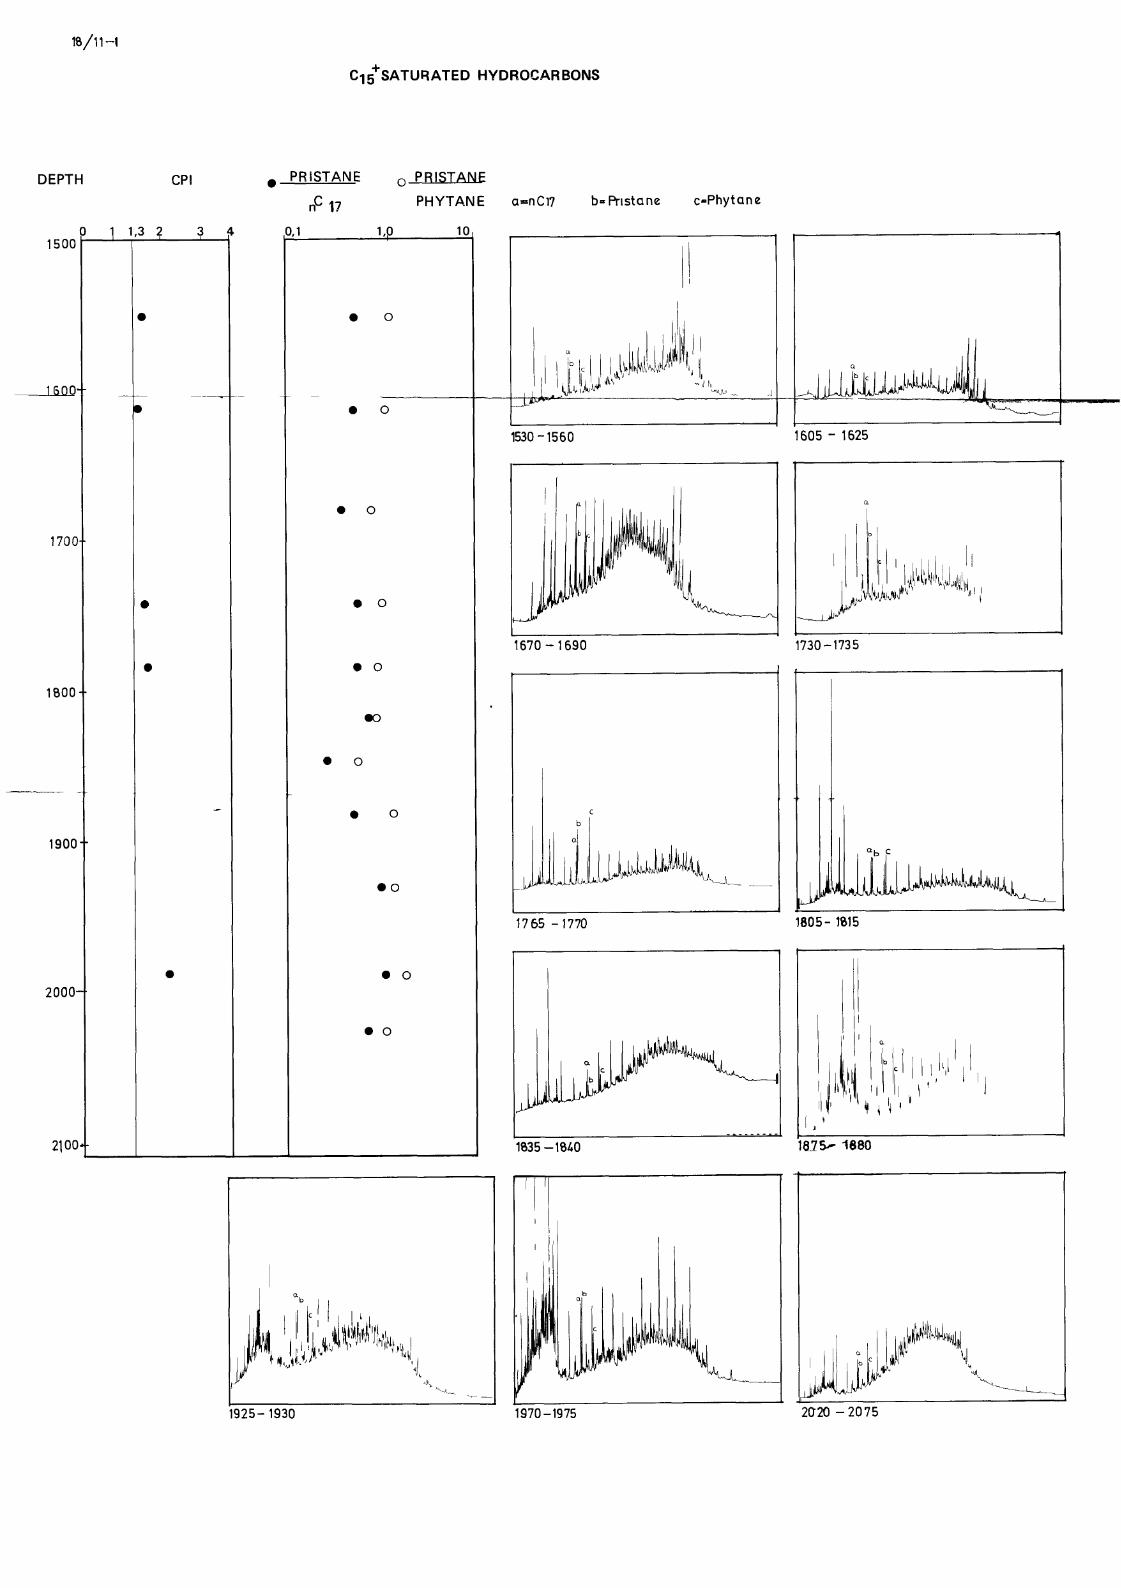
18/11-1
C15+SATURATED HYDROCARBONS
DEPTH
1500
CPI PRISTANE ~ PRISTANE
nC17 PHYTANE a=nCl7 b-Pristane c-Phytane
isno-+
1700+
1800 +
1900-
2000-+
21004
D 1 1
•
,3 2 3 |
•
•
•
•
D.1 1,0 10
• O
• o
• o
• o
• o
•o
• o
• o
• o
• o
• o
, ,l
II li Ju,
, Li. i 111lb I
I ttl miÅø
i
j
'ia i l l
1 I f H 1 i Ukjij 1111
11
1530-1560 1605-1625
Ja.
b c
wMuilin
a
11
1670-1690 1730-1735
cb
a
i i h i I Uilii11'
-•
1765-1770 1805-1815
I O-
i
LLJJi LiniyiwkMii i
1 Up1 w ^WHIJ
1835--1840
r1 a
|
i
1 1i
J
1815 - 1880
1925-1930 1970-1975 2020 -2075
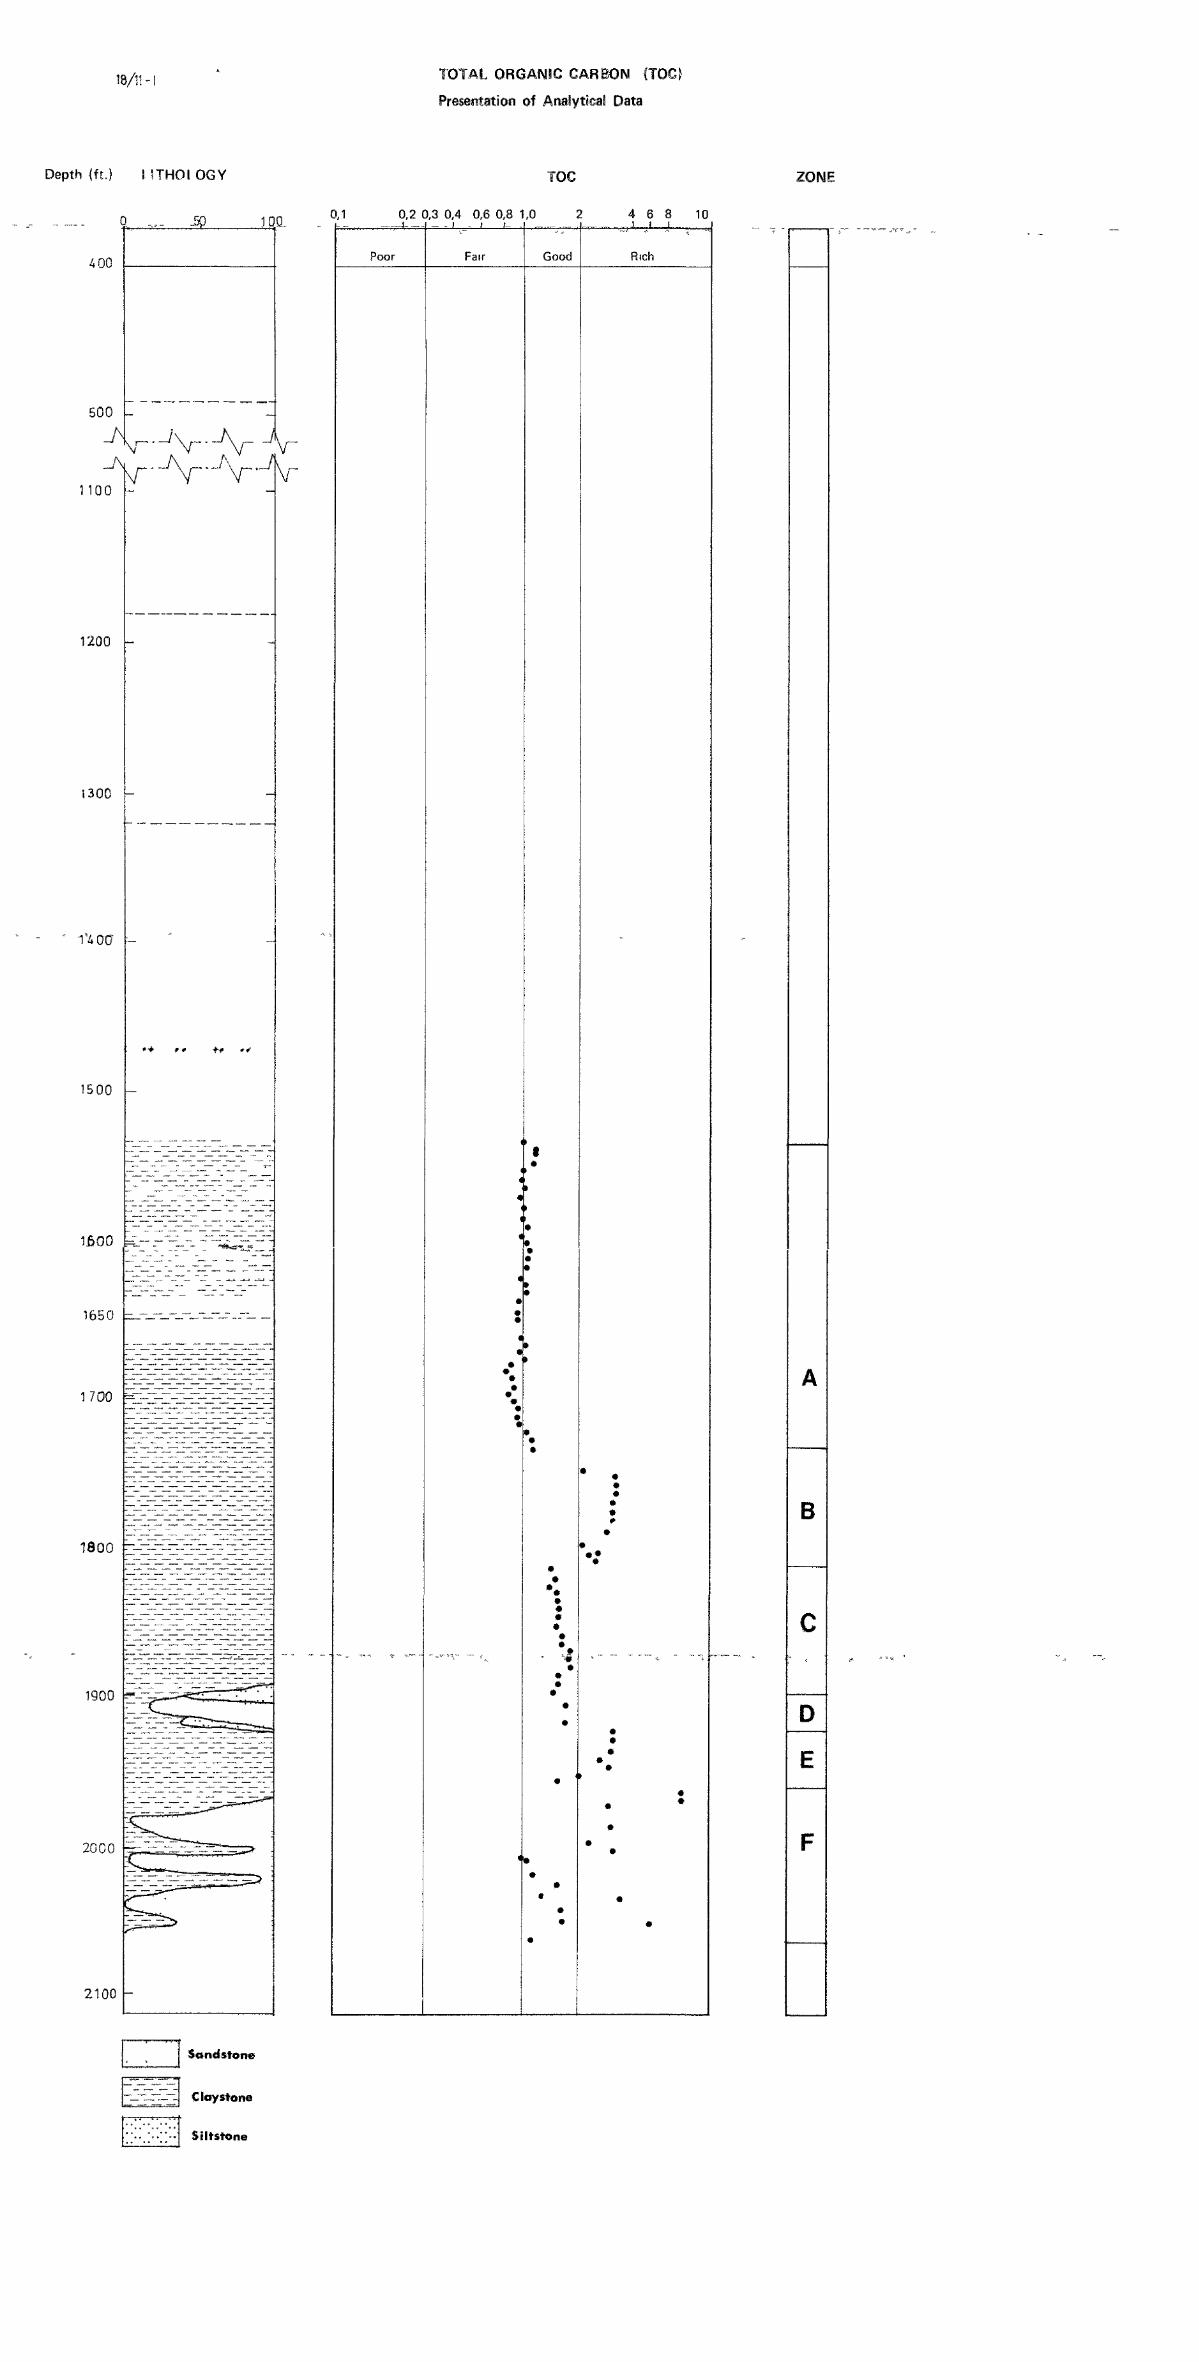
18/11 -1 TOTAL ORGAN8C CARBON (TOG)
Presentation of Analytical Data
Depth (ft.) I 'THOl OGY TOC ZONE
400
500
DEL
1100
1200
1300
1500
1500
1650
1700
igoo ?•_-.;
2100 -
\T
0,1 0,2 0,3 0,4 0,6 0,8 1,0 4 6 8 10
1800 =-.:-i---_-_
2000 ^zl-Z^^J^r:
V
Poor Fair Good Rich
* B
D
Sandstone
Clay stone
Siltstone
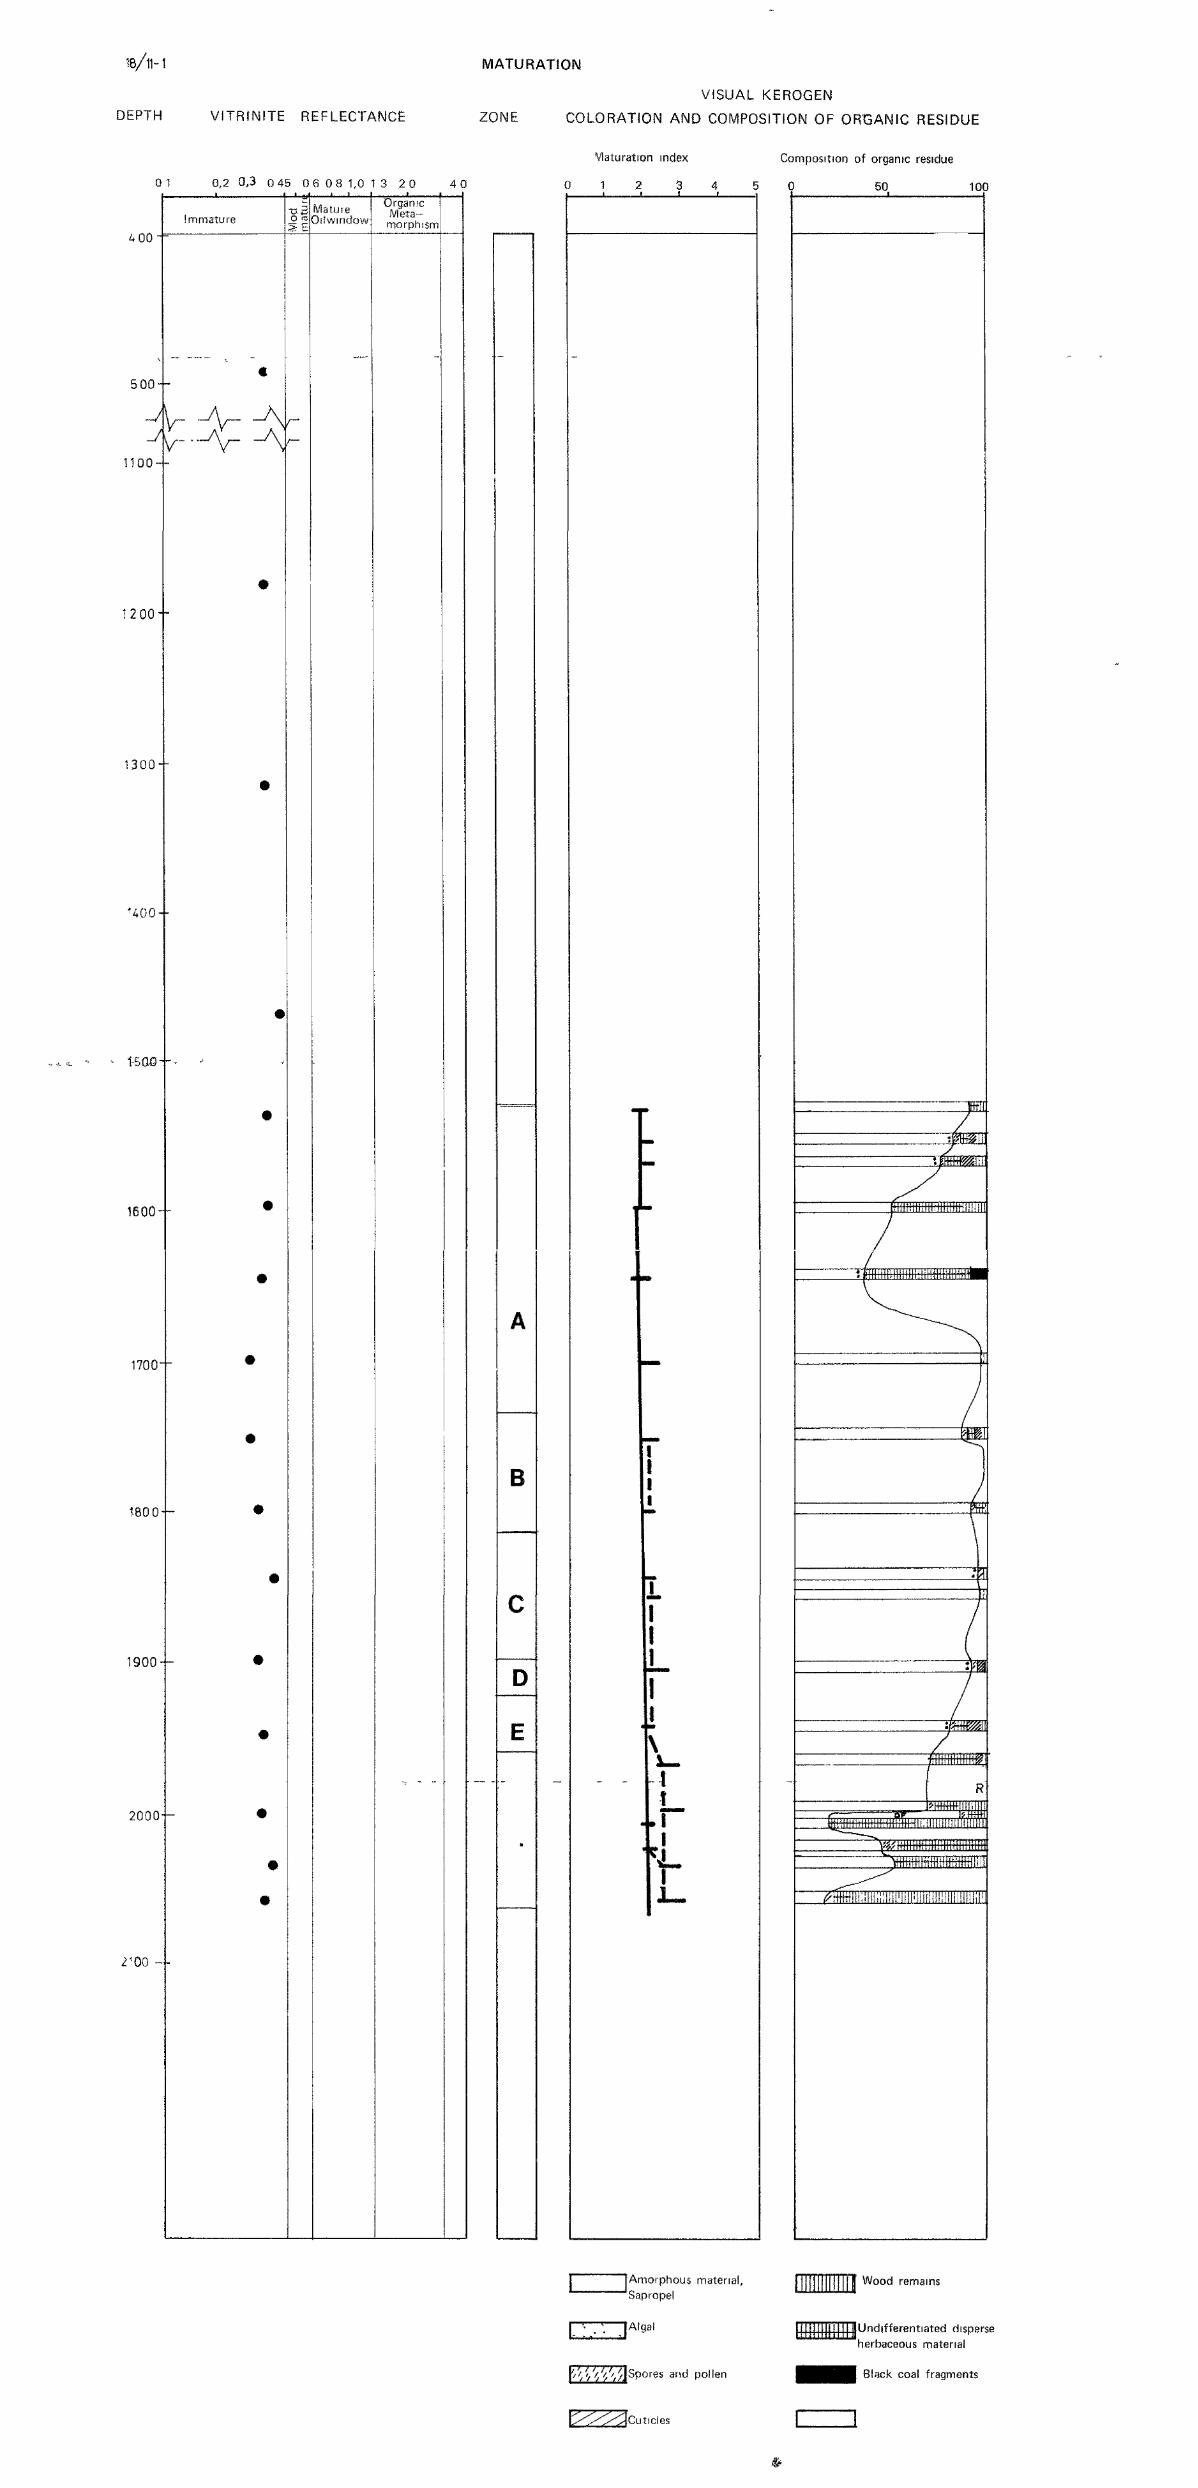
MATURATION
DEPTH VITRfNITE REFLECTANCE ZONE
VISUAL KEROGEN
COLORATION AND COMPOSITION OF ORGANIC RESIDUE
0 1 0,2 0,3 0 45 0 6 08 1,0 1 3 2 0 4 0
Maturation index
0 1 2 3
500 —
JJ
1100-
1 2 0 0 "
1 3 0 0 - -
UO0--
1600--
1700--
t800
1900--
2000--
2^00
Immature
V
O toMatureOilwmdow
OrganicMeta-morphism
B
f
Composition of organic residue
5 0 50 100
-mm
^tttlt i l l l^Hii l l l i l ' i i l l i l l iHil l i f l l l l l lHIil
"fAmorphous material,Sapropel
[Algal
and pollen
Wood remains
llinjUndifferentiated disperseherbaceous material
Black coal fragments
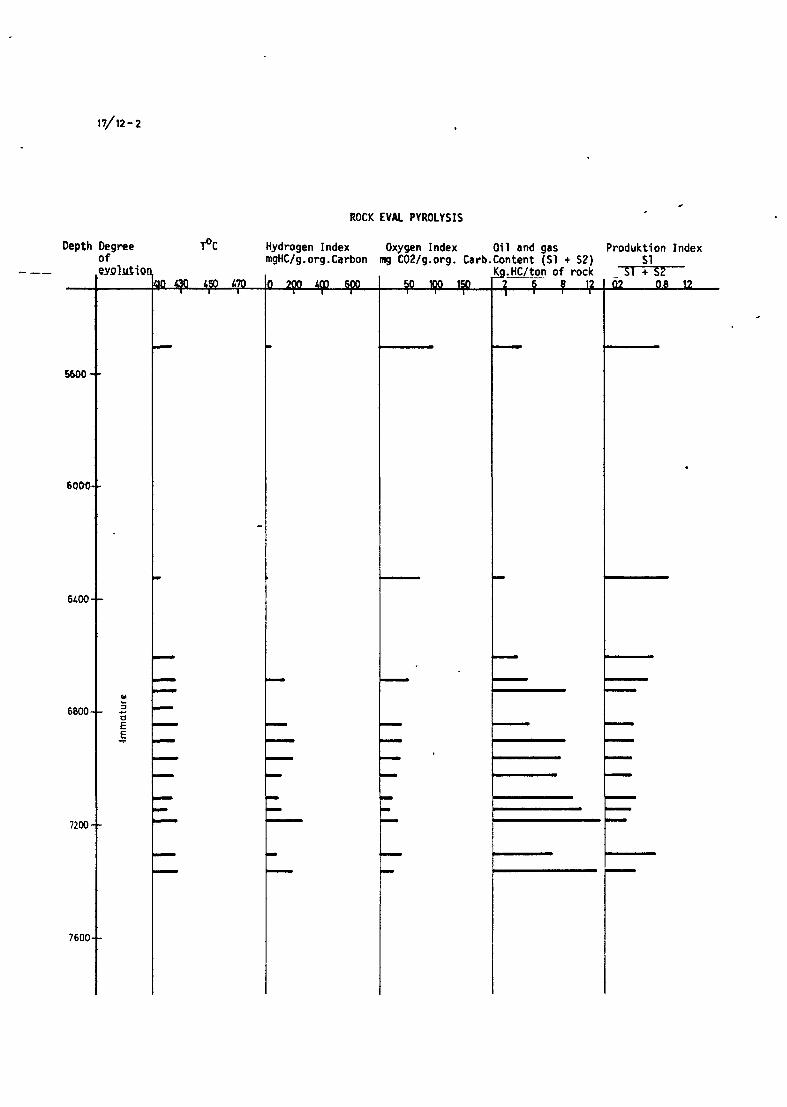
n/i2-2
ROCK EVM. PYROLYSIS
Depth Degreeof
5600- -
6000- -
6400- -
7200- -
7600- -
6800-4- -a
T°C
450 470
Hydrogen IndexmgHC/g.org.Carbon
200 AGO 600
Oxygen Index Oil and gastng C02/g.org. Cart».Content (SI + S2)
KgJ^C/tpn of rock50 100 ISO
Produktion IndexSI
SI + S202 0.6 12
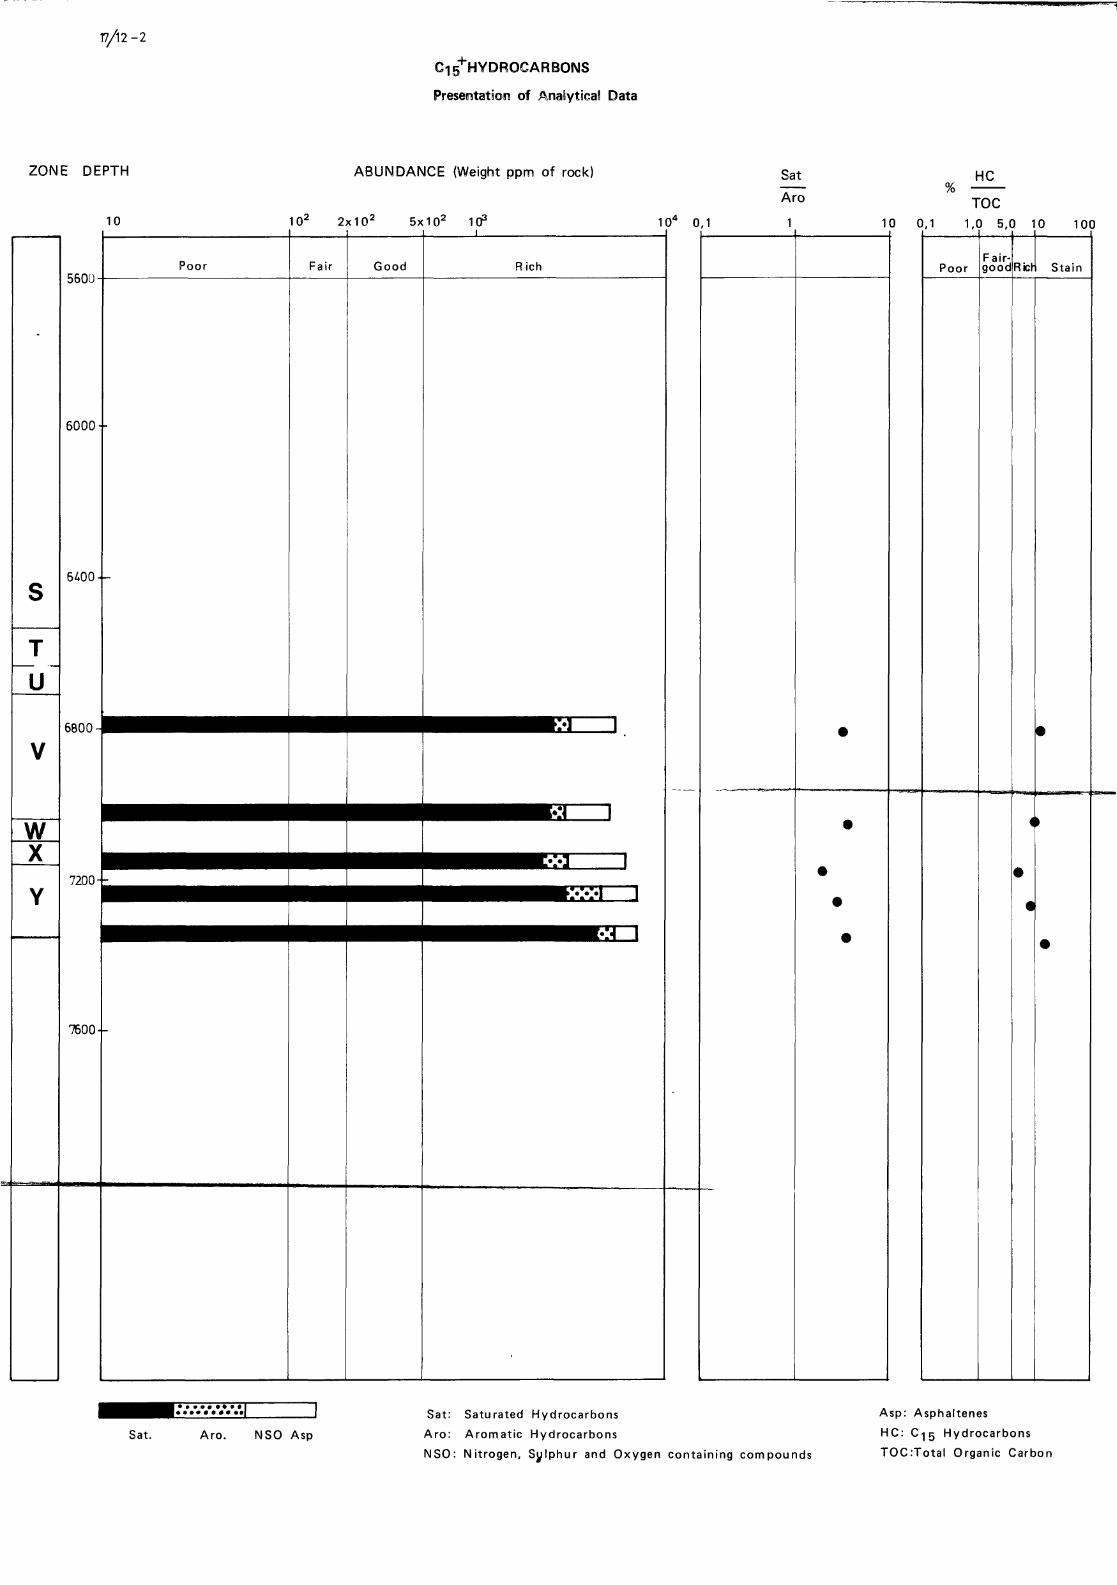
17/12 -2
Ci5+HYDR0CARB0NS
Presentation of Analytical Data
ZONE DEPTH
10
_T~U
W
5600
6000••
6400 - -
6800
7200
7600--
ABUNDANCE (Weight ppm of rock)
102 2x10² 5x10² 103
Poor
104 0,1
Sat
Aro
1
Fair Good Rich
HC%
TOC10 0,1 1,0 5,0 10 100
PoorFair-goodRicr Stain
Sat. Aro. NSO Asp
Sat: Saturated Hydrocarbons
Aro: Aromatic Hydrocarbons
NSO: Nitrogen, Sylphur and Oxygen containing compounds
Asp: Asphaltenes
HC: C-|g Hydrocarbons
TOC.Total Organic Carbon
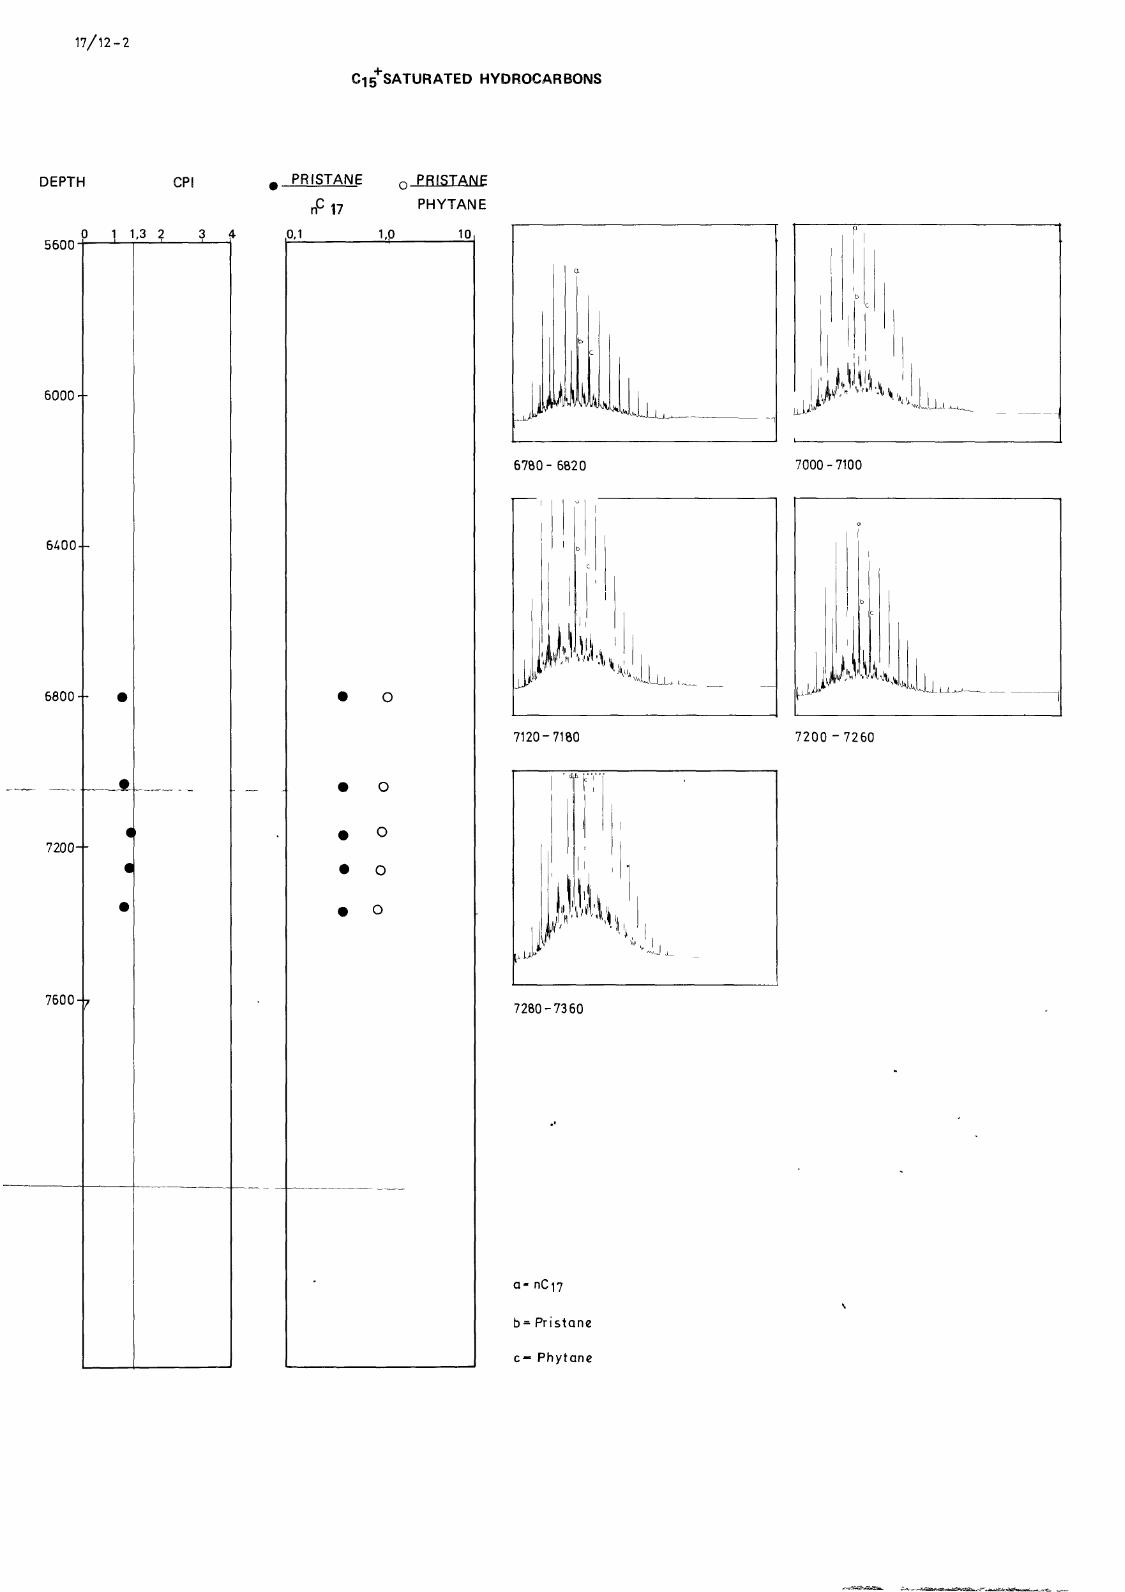
17/12-2
SATURATED HYDROCARBONS
DEPTH CP!
56000 1 1,3 2 3 ft
PRISTANE 0 PRISTANE
nC 1 7 PHYTANE
0,1 1,0 10
6000 - -
6400--
6800-- •
I7200--
7600-
6780- 6820
7120-7180
7280-7360
a - nC 17
b= Pristane
c— Phytane
i J
b
'i
c
7000-7100
7200 -7260
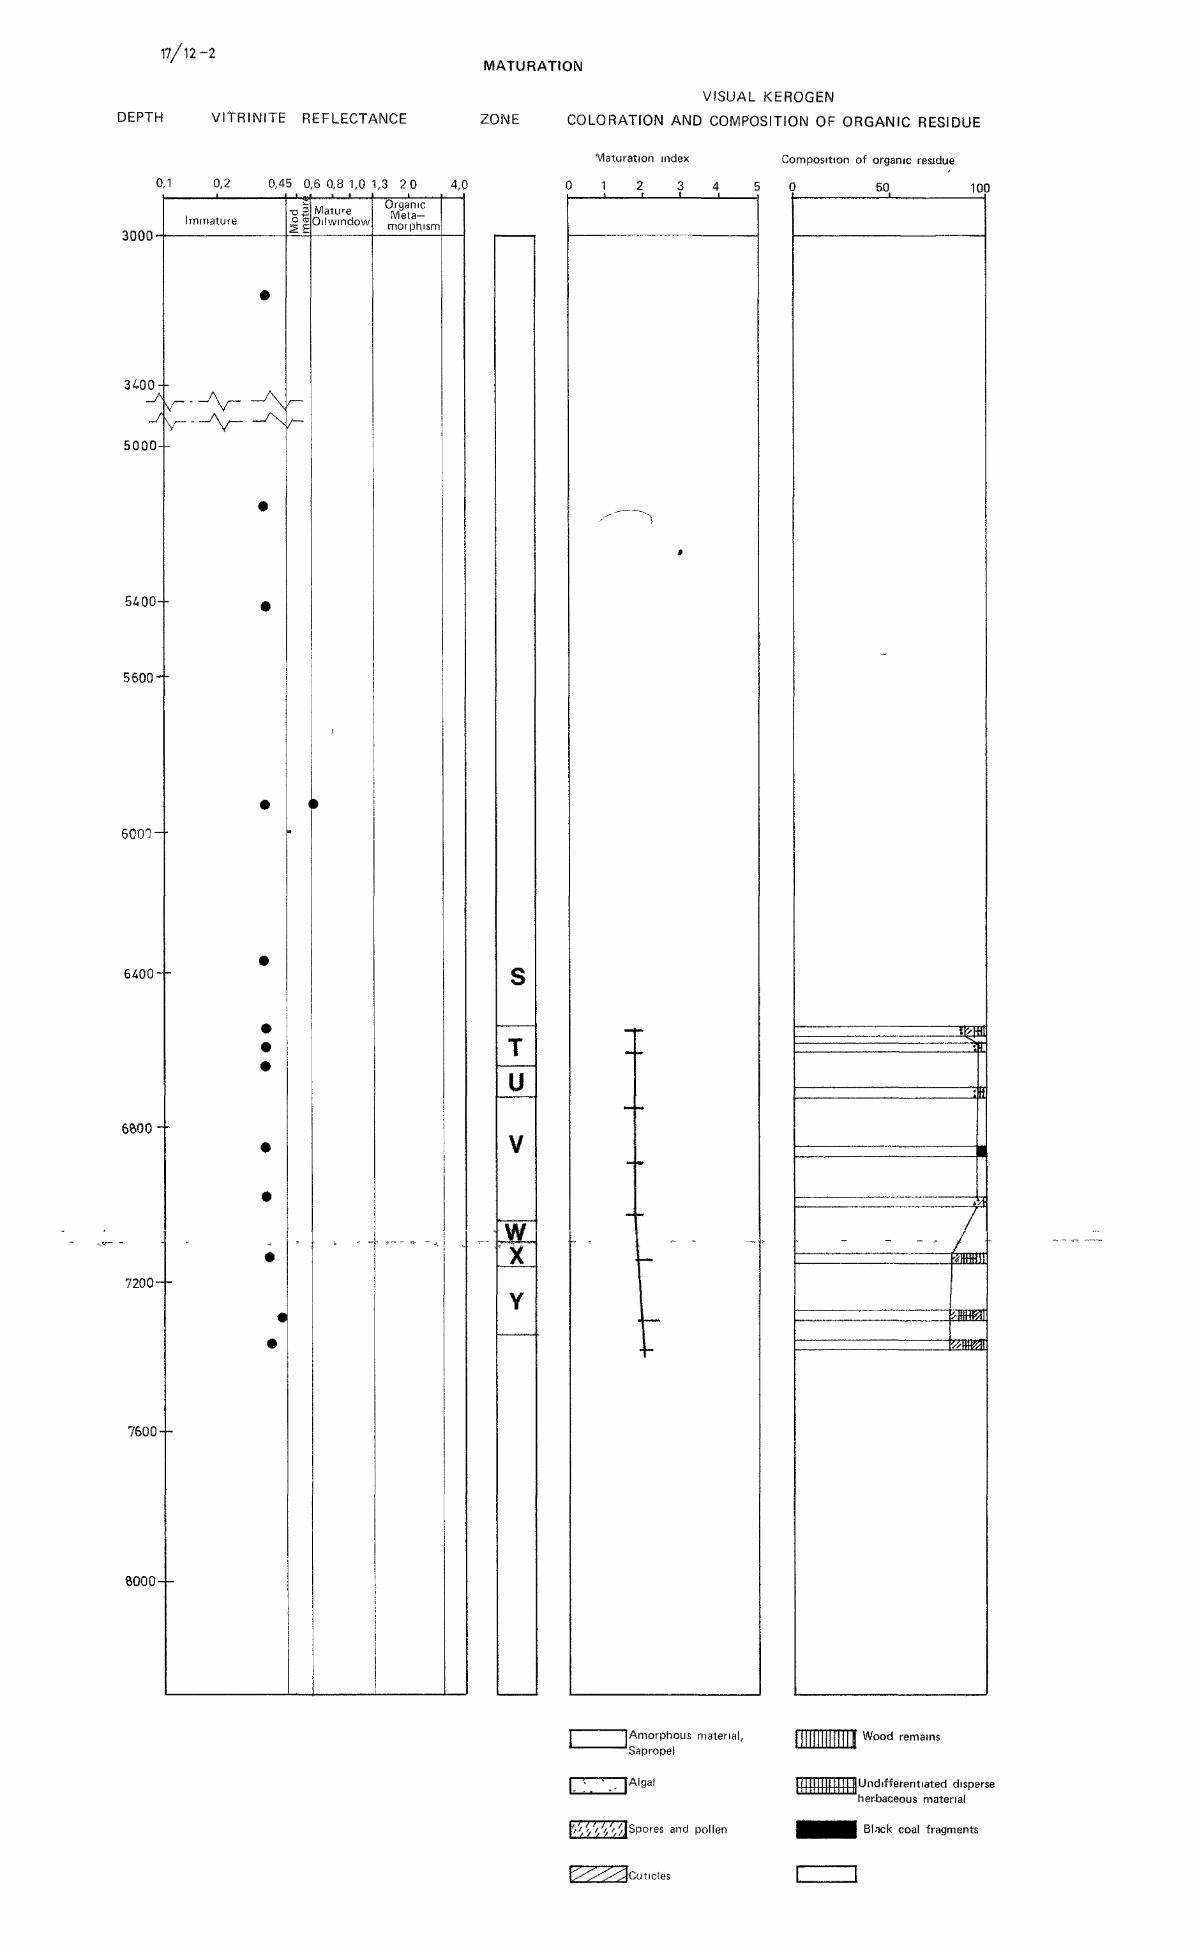
17/12-2
DEPTH VITRINITE REFLECTANCE
MATURATION
VISUAL KEROGEN
ZONE COLORATfON AND COMPOSITION Of ORGANIC RESIDUE
0,1 0,2 0,45 0,6 0,8 1,0 1,3 2 0 4,0
Saturation index
0 1 2 3
3000-
3400--
J
5000--
5400--
5600--
6000-
6400'
6&00 - -
7200-
7600»-
8000--
Irnmature
V~
2 E
MatureOifwinctow
OrganicMeta-morphism
Composition of organic residue
5 0 50 100
u
V
wiKBt
•km
Amorphous material,Sapropel
| '• ' _ ]Algal
a n d p o l l e n
Wood remains
lated disperseherbaceous material
Bkck coal fragments
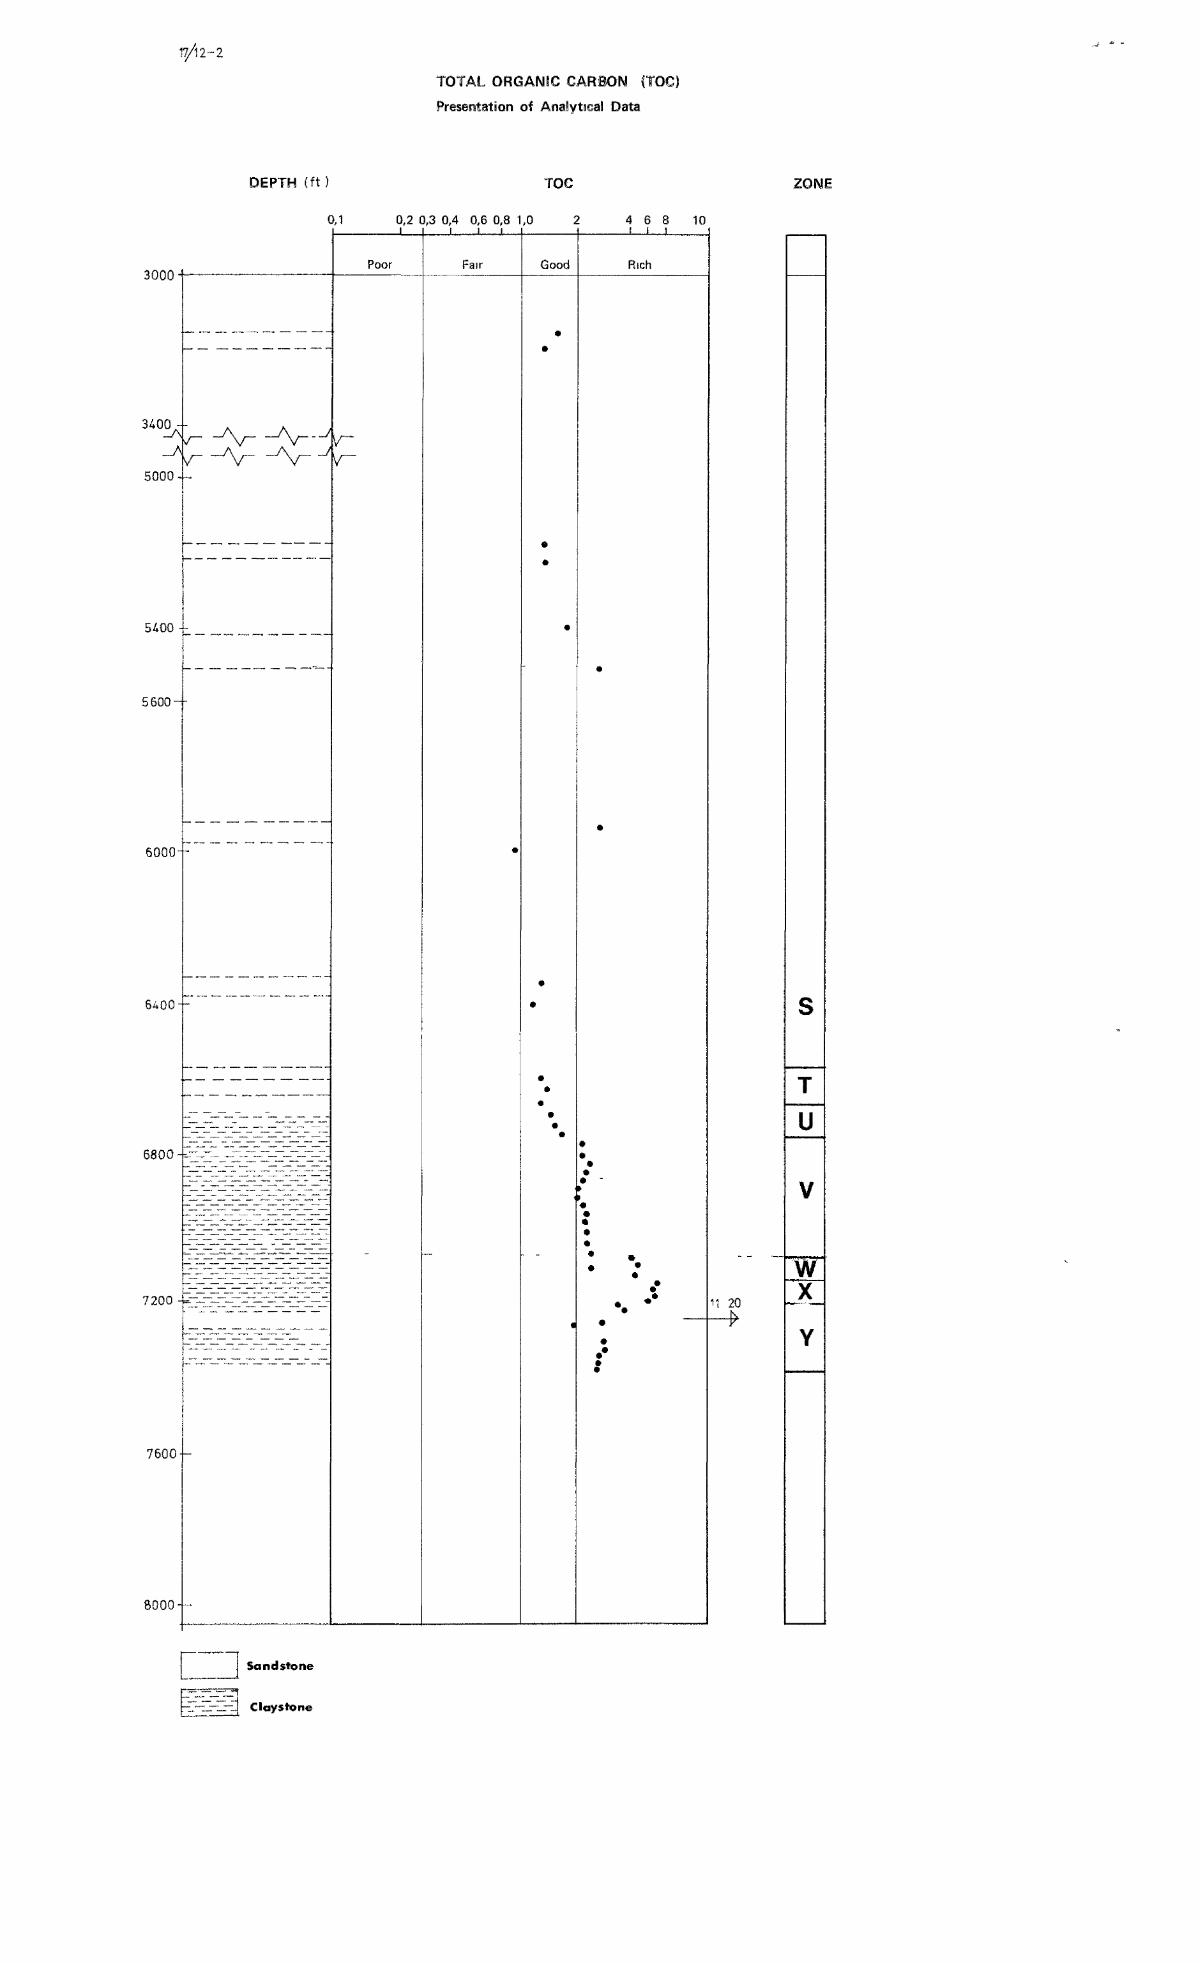
n/n-i
TOTAL ORGANIC CARBON {TOC}
Presentation of Analytical Data
DEPTH (ft TOC ZONE
0,1 0.2 0.3 0.4 0.6 0.8 1
3000-
-A
5000-
5AOO -
5600-
6000-
6400-
6800-
7200 -
7600-
8000-
—
V V V
1 .
I—Z-Z" -Z-Z-IHI-Ir-Z-Z—I
I-Z-Z—ZHI-£HIH~Z~Z~
~^™i~r~—~T_^"7—~s~—r^-i~_r*i_r
—„ — .
i
Poor
i i |
Fair
•
0 1
Good
••
•
•
•
••
••*
_
«
! 4 6 8 10i i i
Rich
•
•
••
••• -y
i
«
••
•
• •
• •
•
•
11 20
u
wJLY
Sandstone
Claystone
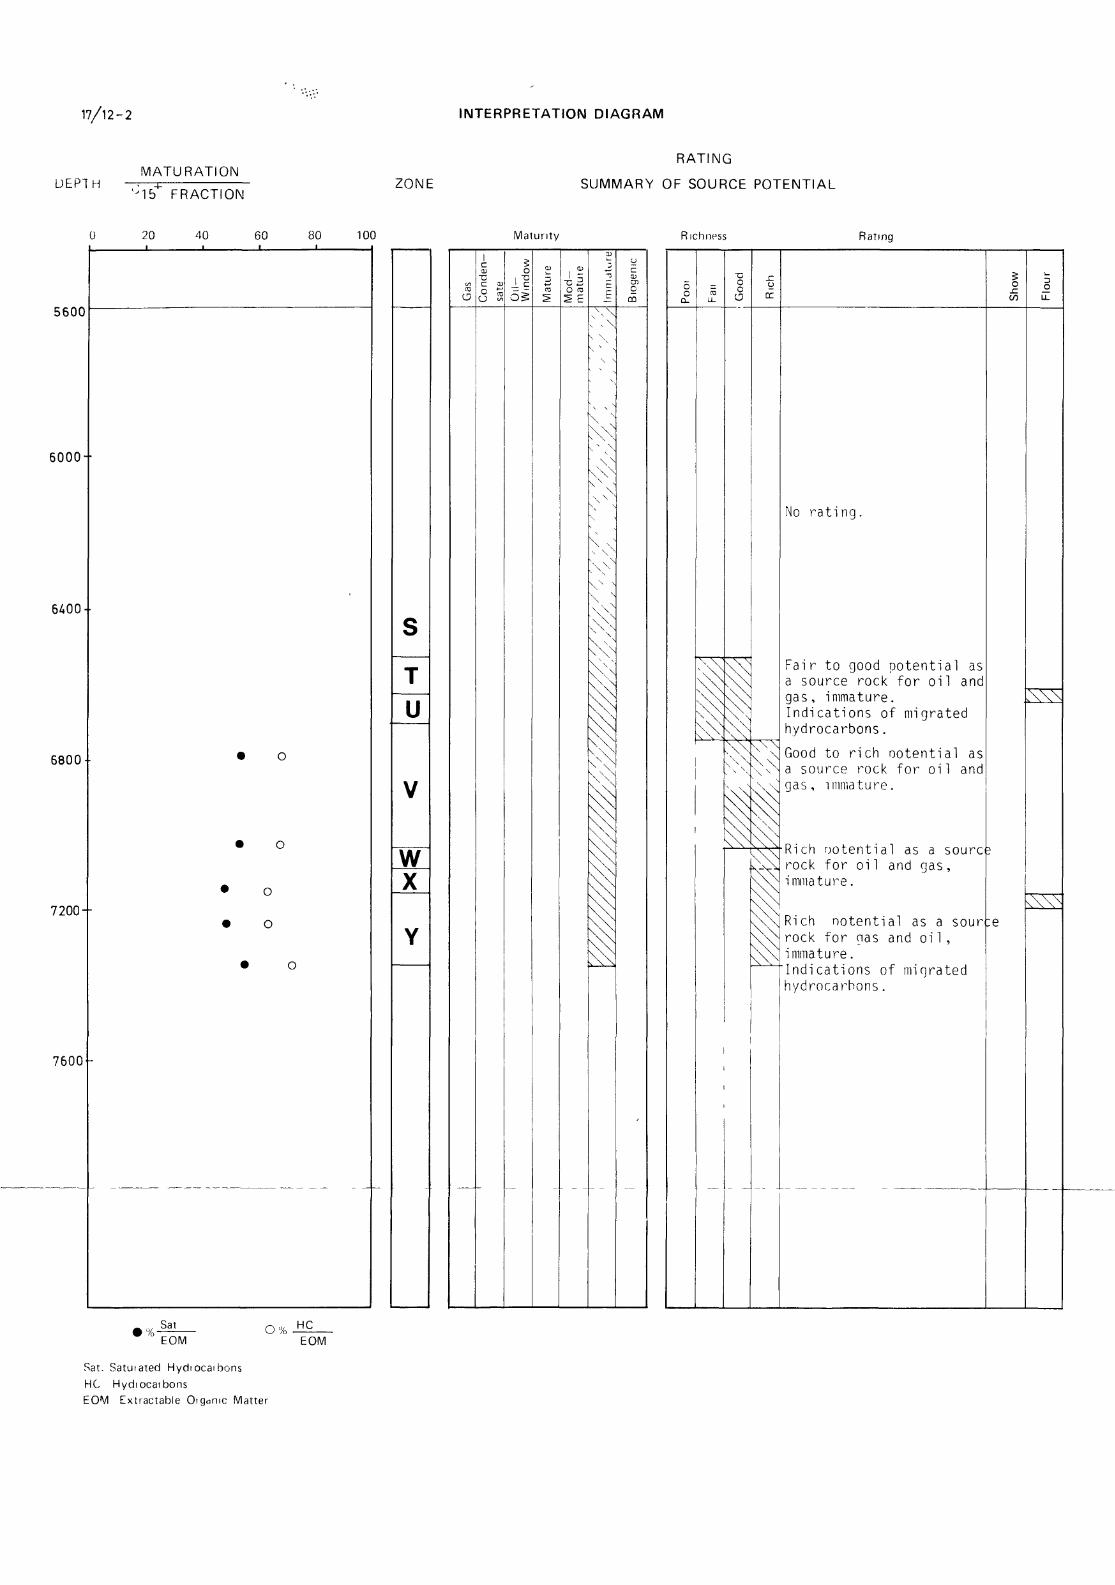
17/12-2 INTERPRETATION DIAGRAM
UEP1HMATURATION
lJ1b+ FRACTIONZONE
RATING
SUMMARY OF SOURCE POTENTIAL
20 40 100
5600
6000--
6400
6800-
7200--
7600 -
Maturity Richness Rating
u
w
O g-c dO 03
2 E
SatEOM
O% HCEOM
Sat. Satuiated HydiocaibonsHC HydiocaibonsEOM Extractable Oigdnic Matter
s \ \
\ \
No rating.
Fair to good potential asa source rock for oil andgas, immature.Indications of migratedhydrocarbons.
Good to rich ootential asa source rock for oil andgas, immature.
Rich ootential as a sourcrock for oi1 and gas,immature.
Rich notential as a sourterock for nas and oi1,immature.Indications of migratedhydrocarbons.
oCO
o