Embed Size (px)
Citation preview

Instituto Tecnológico de Aeronáutica
09
14th ICCRTS
“C2 and Agility” Automatic Alerts in Net-Centric C2 Systems:
Effects in the Situational Awareness Daniel Maier de Carvalho
Carlos Henrique Costa Ribeiro
1
14th ICCRTS
“C2 and Agility”
Automatic Alerts in Net-Centric C2 Systems: Effects in the Situational Awareness
Topic 8: C2 Assessment Tools and Metrics
DANIEL MAIER DE CARVALHO – MSc STUDENT (2 years full time in program)
CARLOS HENRIQUE COSTA RIBEIRO – PhD (Master thesis supervisor)
Instituto Tecnológico de Aeronáutica Pça Mal. do Ar Eduardo Gomes,50
Vila das Acácias São José dos Campos – SP – Brasil
12228-611
+55-12-39476897

2
14th ICCRTS : “C2 and Agility”
Automatic Alerts in Net-Centric C2 Systems: Effects in the Situational Awareness
Abstract
Network-centric-warfare translates information superiority into combat power by effectively
linking knowledgeable entities in the battle space. This advantage, allied to the modern
resources of Telecommunications and Computer Science, allows greater agility in the decision
cycle and helps enhancing the situational awareness (SA). With the increase in the amount of
information made available, it might be important to consider a system of automatic alerting
for data monitoring and to provide notifications when critical events occur. However,
experiments with these systems, in other areas, have shown that alert automation can,
paradoxically, contribute to the reduction of SA. During high stress or high workload periods,
alerts may actually become intrusive, and responding to them can increase workload and shift
the operator's attention. This work shows the result of an experiment that informs as SA varies
when we use a system that generates automatic alerts. Participants operated a simulation of a
net-centric system, the "C2 em Combate" Brazilian Army software, which was modified to
include an automatic alerting system. SA was measured both with the alerting system enabled
and disabled, and the results indicate when automated alerting systems do improve or not the
user SA. The results can be used to help designing automated feedback in C2 systems.
Keywords: Net-Centric Warfare, Alerts, Situation Awareness.
INTRODUCTION
The sharing of information over a computer network is becoming a common means of
communications in many fields. Armed Forces have taken advantage of this technology to
improve the performance in activities of Command and Control (C2) in military operations. For
example, commanders in battlefields geographically away, but communicating itself through a
network, can attend the events of the maneuver in a computer screen almost in real time [1].
The use of networked computers to enhance agility in C2 has opened new possibilities. Data
can be analyzed by computers and results displayed to leaders, providing them better
information on which to base decisions. Leaders can be provided with immediate feedback
about their performances. A promising technology would be a computer system to monitor
the data stream and provide alerts when critical events occur to ensure they are not missed by
the operator.
As well as the troops gain more experience in net-centric digital C2 systems, more functionality
is required and added to the systems. Features such as the automated alert system,
mentioned above, can help direct the user`s attention to important events and increase the
Situational Awareness (SA).
Situational Awareness always is associated with the monitoring of the maneuver in a military
operation, but more than this, SA, is basically a “cognitive human state” [2]. This state is
constructed with information from many sources and is affected by factors such as personality,
fatigue, load of work (mental workload), fear, etc.
However, experiments in other areas with systems that aim at driving SA through alerting have
shown that automation can, paradoxically, contribute to the reduction of SA. During high

3
stress or high workload periods, alerts may actually become intrusive, and responding to them
can increase workload and mistakenly shift the operator's attention. This raises the question of
whether immediate feedbacks enhance SA or interfere with SA. This work shows the result of
an experiment on C2 that informs as SA varies when we use a system that generates automatic
alerts. Participants operated a simulation of a net-centric system, the "C2 em Combate"
Brazilian Army software, which included an automatic alerting system. SA was measured both
with the alerting system enabled and disabled, and the results indicate when automated
alerting systems do improve or not user’s SA. These results can be used to help designing
automated feedback in C2 systems.
In the first part of this paper we explain the concept of SA as an important cognitive measure
for C2 systems operators.We then explain how to measure SA and why we choose the
Situation Awareness Global Assessment Technique (SAGAT). A brief description of the software
used for the units of the Brazilian Army is provided, and then we explain some concepts about
the alerts system used in the experiment. The second part of the paper details the
experiments and the results obtained, and finally the last part presents the main conclusions.
An example of a SAGAT questionnaire is presented in the Appendix.
BACKGROUND
SITUATION AWARENESS
It is critical that human operators have an awareness of what is happening in C2 situations, so
that they can understand the tasks they are conducting and the context within which they are
working.
In the 1950s, the U.S. Air Force coined the winning element in air-to-air combat engagements
in Korea and Vietnam as the “ace factor” or what they called having good situation awareness
[3]. Since the term SA originated, it has expanded to include almost any domain that involves
humans performing tasks on complex, dynamic systems. As applications have spread and
increased, so have SA definitions and measurement techniques.
Some SA definitions are human-centric, others are technology-centric, and some encompass
both the human aspect and the technology, but all generally refer to knowing what is going on
and what will happen next. SA is important because it frequently guides decision making and
action [4]. The most widely accepted definition is Endsley’s human-centric interpretation [5]
that “situation awareness is the perception of elements in the environment within a volume of
time and space (level 1), the comprehension of their meaning (level 2), and the projection of
their status in the near future (level 3)” (refer to Figure 1).
Military and C2 applications, often refer to SA as knowledge of the physical elements in the
environment (equivalent to Endsley’s level 1 SA), while the other levels (equating to levels 2
and 3) are referred to as situational understanding and assessment [6]. Technology-centric
definitions of SA are linked to C2 applications insofar as they often refer to the quantity and
quality of the information provided by the technology and include data visualization [7].

4
Figure 1: Endsley’s Model of SA
Human-system definitions have recently gained maturity and popularity and relate the
information provided by the system to the information needed by the operator. Miller and
Shattuck’s model leverages Endsley’s human-centric definition and the lens concept in a multi-
step process shown in Figure 2 [8].The left hand side illustrates the technology part of situation
awareness while the right hand side represents the human or cognitive situation awareness.
As can be seen, some amount of the information from the world is detected by sensors and
some amount of that information is made available to the human, who then perceives the
information being displayed, comprehends or makes sense of that information, and finally
uses it to predict what will happen in the world.
Figure 2: A Dynamic Model of Situated Cognition

5
No matter the SA definition, SA is challenging to measure. The information that is required at a
particular time and in a particular situation depends on the current goals and objectives of the
C2 organization, which are often dynamic. Even when all information is accessible, only a
subset of that information is needed to plan and assess the current goals and objectives.
Finding the right information at the right time to be aware of what is happening is a challenge,
as is gathering pertinent information to be able to make a decision. In complex, real world
scenarios, it is critical that SA measurement questions and methodology are tailored to the
domain and context in which they will be used.
SITUATION AWARENESS MEASURES
Various methods have been developed for measuring situation awareness particularly in the
aviation domain [9]. These include performance based measures, subjective techniques and
questionnaires/queries. An example of a performance based measure for a Brigade
Headquarters may be the battle outcome, such as the loss exchange ratio. Such measures are
attractive because they are objective, non-intrusive and are generally easy to obtain. However,
in a complex environment, they lack sensitivity and diagnostic value since factors other than
situation awareness are likely to contribute to performance. Subjective ratings of situation
awareness by the participants may be inaccurate because the subjects may not be aware that
they are missing information. Observer ratings may be more valid if the observers know the
situation intimately and if they are trained in observing the participants’ behavior. The non-
intrusiveness of observer ratings works in its favor. Questionnaires administered after an
exercise can be misleading due to the delay between the time when the events occurred and
that of questioning.
Because of the limitations in the various methods outlined above, the direct questioning
technique based on SAGAT (Situation Awareness Global Assessment Technique) was used.
SAGAT involves interrupting the simulation at random times during which subjects are
questioned. The responses to the questions or probes are compared to the situation in the
simulation at the time of the interruption. This comparison makes the technique less biased
than self-ratings or observer ratings of situation awareness. SAGAT contains a set of probes
that are relevant to the domain being studied. These probes, which cover all three levels of
situation awareness, are based on the situation awareness requirements for the task. From the
set of probes a random subset are asked during a freeze. This randomization is necessary so
that participants do not selectively pay attention to the issues raised in the previous freezes.
Randomization also emphasizes the need to cover all aspects of the situation in the probes,
rather than only asking highly significant questions [10].
The development of the situation awareness probes for SAGAT involved a three stage process
(Figure 3). These critical SA requirements can by identified utilizing a Goal Directed Task
Analysis (GDTA), a unique form of cognitive task analysis that involves conducting extensive
knowledge elicitation sessions with domain subject matter experts [11]. The objective of the
GDTA is to identify the major goals and decisions that drive performance in a particular
job/position as well as to delineate the critical, dynamic information requirements associated
with each goal and decision [12]. Interviews were conducted with Army Officers to elicit the
cognitive processes in conducting their tasks. Analyses of the interview results identified a list
of the information required for situation awareness. This was in turn used to formulate the
situation awareness probes. In addition, we found several examples of cognitive task analysis
for several Army Brigade staff positions (Intelligence (S2), Operations (S3), Logistics (S4), and
Engineer) to define the goals, decisions, and information requirements relevant to successful
mission completion with respect to each specific position [13].

6
Figure 3: The process for the development of situation awareness probes.
NET-CENTRIC C2 SYSTEMS
Networked C2 systems provide to the commander, together with its bigger state, to carry
through tasks that before were executed manually or for applicatory programs that were not
specific. For example, the planning of missions using a mosaic of topographical maps contend
the battlefield and acetates as maneuver showing the areas of obstacles, forces friends and
enemies, amongst other information, can be made using digital maps and layers of
visualization with filters.
The digital age increases not only the combat capacity, but also the security by reducing
fratricide possibilities or incidents involving friendly elements [1]. It is expected that units of
combat that use digital systems keep better SA for faster planning and execution operations
then the ones that do not use them.
Digital C2 systems help to visualize the battlefield and supply information in formats that help
to increase the SA of the commander. They are provided with analytical tools with proper
language and symbols, as analysis and filtering of the land, that automatically contribute with
the SA without necessity of clarifying texts.
There are many different digital C2 systems. Some are specific for determined activities, as
intelligence, support of fire, logistic, etc. Others can operate on many activities and be
observed by specialists, each one using the system from his or her specific point of view.
The Brazilian Army uses “C2 em Combate” as network C2 system. It is constituted of decision
support program and by centers of Interface and Integration (CII) called “Telematic Modules”.
Information on the tactical situations can be distributed around the infrastructure of
communications that is mounted with CIIs. A screen is shown in the Fig. 4.
Fig. 4. Screenshot of the “C2 em Combate” program.
7
Presentation of a map for graphical visualization of the maneuver allows inclusion of unfolding
of the friendly and enemy forces; zones of action and objectives and other measures of
coordination and control (Limits, Points of Meeting etc.). It is also possible to consider
fragmentary orders, reports, plans and messages.
The program thus presents a dynamic vision of the battlefield. Units endowed with Global
Positioning System (GPS) automatically bring up to date its position, sent by the network
according to a protocol of response and distribution of the information, in a way that the
image can be rendered in real time in all the machines that are connected. As a result, the
commander can spend less time in identifying and getting knowledge of the situation, and
more time in planning and executing the action lines.
AUTOMATED ALERTING SYSTEM
An automated alerting system is a tool used to monitor the data and to provide alert when
critical events occur, with the purpose of guaranteeing that these are not forgotten by the
operator. In fact, an important consideration is that operators who visualize computer screens
might fail in detecting changes that occur on those displays, in a phenomenon called change
blindness.
Change blindness tends to occur concurrently with various types of visual transients such as
icon movement, screen flashes or eye blinks. In addition, operators may fail to detect changes
if they are performing others tasks or working in a given level of zoom and alterations happen
outside his or her area of vision. Individuals tended to detect changes in icon appearance/
disappearance and color changes, but have more difficulty detecting changes in icon type and
movement, particularly if the icon was in the periphery of the screen and the movement has
small amplitude.
The concept of change blindness is related with a system of alarms in two forms. First, alerts
can call the attention for critical events that the operator of the system is not monitoring.
Second, alerts can “blind” the operator capturing its attention at inopportune moments. Both
effects influence the SA of the operator.
The “C2 em Combate” software can store all the inserted information, also with an evaluation
of the information source, but it does not possess an automated alerting digital system.
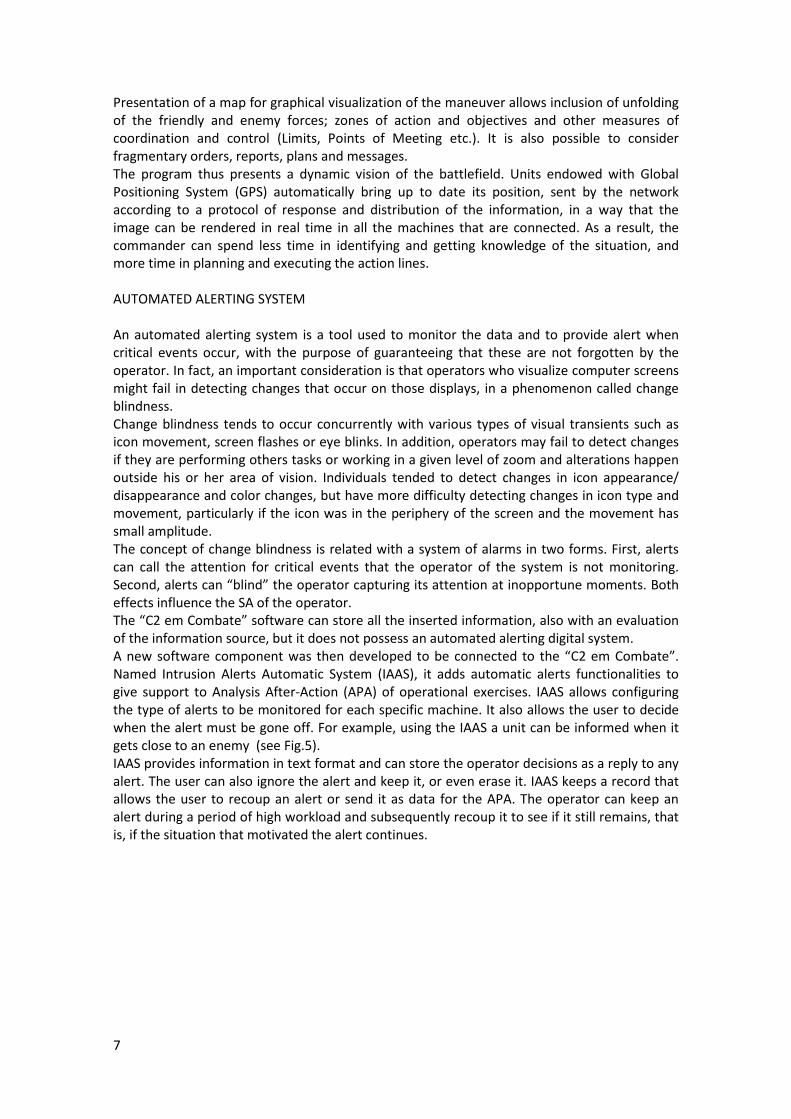
A new software component was then developed to be connected to the “C2 em Combate”.
Named Intrusion Alerts Automatic System (IAAS), it adds automatic alerts functionalities to
give support to Analysis After-Action (APA) of operational exercises. IAAS allows configuring
the type of alerts to be monitored for each specific machine. It also allows the user to decide
when the alert must be gone off. For example, using the IAAS a unit can be informed when it
gets close to an enemy (see Fig.5).
IAAS provides information in text format and can store the operator decisions as a reply to any
alert. The user can also ignore the alert and keep it, or even erase it. IAAS keeps a record that
allows the user to recoup an alert or send it as data for the APA. The operator can keep an
alert during a period of high workload and subsequently recoup it to see if it still remains, that
is, if the situation that motivated the alert continues.

8
Fig. 5. IAAS alert example.
EXPERIMENT
METHOD
Participants: fifteen Brazilian Army Soldiers. The mean age was 37,2 (SD = 4,2), with averaged
17 years (SD = 4,6) of military experience. Ranks ranged from Sergeant to officer. None of the
Soldiers had prior experience with “C2 em Combate”.
Materials: A simulation of a networked C2 system was presented on a laptop computer
(Core 2 Duo) using a 14" graphics monitor operating under 1280 by 800 pixel resolution. The
C2 system simulated was the “C2 em Combate”. The simulation presented a map display
showing locations of friendly units, enemy units and battlefield graphics such as phase lines,
unit boundaries, obstacle belts, etc. For the purposes of this experiment, three Army training
scenarios were programmed, namely a practice scenario and two full length experimental
scenarios, each based on different topographical maps and orders of events. A screen of the
experimental scenario is shown in Figure 4. The experimental scenarios were based on real
operations, standing out the point of view of a Brigade of Infantry in military operations.
A simulation of IAAS ran concurrently with the “C2 em Combate” task during experimental
trials. The current experiment employed IAAS alerts triggered by five significant events: unit
approaching a minefield, receipt of an enemy report, a new friendly unit appearing on the
display, approach of enemy units, or a unit approaching a nuclear- biological- chemical (NBC)
contaminated area. The IAAS system has a number of other features which were not used for
this research as they would have added unnecessary complexity to the experiment. This
experiment employed IAAS textual alerts, but it did not include graphical alerts or other
capabilities. Further, participants were required to interact with the alerts to remove them
from the screen. The features used were the visual alerts.
Workload was varied by manipulating task difficulty, defined as the number of significant
events (i.e., minefield, enemy report, etc.). In one “C2 em Combate” scenario, the task
difficulty per time interval, was low, whereas in another scenario was high. A low difficulty

9
condition had on average 1 event every 30 seconds (10 total events). The high difficulty
condition had on average 1 event every 20 seconds (20 total events). The order of significant
events was randomized with the constraint that each type of event appeared equally as often
as the other events.
Participants' SA was measured using the SAGAT. Example queries included recalling the
approximate number of friendly units currently on display and drawing conclusions about
which objective the commander's unit (icon) is heading towards. For an example of a SAGAT
questionnaire please see Appendix A.
At the end of the experiment participants completed an exit questionnaire, which asked
participants their opinion of how the alerts affected their performance or how they may affect
the performance of others when using “C2 em Combate”. Responses were made on an
agreement scale (1 = Strongly Disagree; 4 = Strongly Agree).
Procedure: After completing an informed consent and demographics questionnaire,
participants were asked to complete a training session, which informed them about their task
during the experiment and introduced them to the basic information they would need on “C2
em Combate” and automated alerts. Following the training, the participants were given a
training evaluation; this evaluation ensured that they understood the task and the basic
information on “C2 em Combate” and IAAS needed to complete the task. After successfully
completing the training, participants were given a six-minute practice scenario followed by the
SAGAT questionnaires to familiarize them with how the experiment would proceed. An
explanation of SAGAT procedures and detailed instructions for answering each query was also
provided before testing.
Participants then completed two experimental sessions of approximately 12 minutes each.
During the sessions they were asked to view the “C2 em Combate” display and monitor it for
significant events. For one session, alerts were enabled, while for the other session alerts were
disabled. The conditions (alerts enabled or disabled) and scenarios (which of the programmed
“C2 em Combate” scenarios they observed) were counterbalanced, creating four possible
orders.
At pre-programmed intervals of every six minutes, the “C2 em Combate” simulation was
halted and the display replaced by a blank screen. Immediately after the simulation was
stopped, the SAGAT questionnaire were administered to the participants. After the
participants completed the questionnaires, they continued monitoring the “C2 em Combate”
display from the point at which it was stopped. These stops were repeated two times for each
12 minute scenario; this number was chosen based on Endsley report that no decrements of
performance with up to three stops within a fifteen minute period are significant [5]. In all,
there were two SAGAT measures for each “C2 em Combate” session, for a total of four
measures for the two sessions. The participants were instructed to attend to their tasks as they
normally would, with the SAGAT queries considered as secondary.
The questions on the position of all the elements of combat simulation for the operator were
of greater responsibility. The great changes in this level of data would be most significant in
influencing the decision of the commander. Following the two sessions, participants were
asked to complete the exit questionnaire.
RESULTS
Participants were asked on several aspects of the situation executed, and all the SA levels were
evaluated. The SAGAT performance results are displayed in Figure 6. We examined the
equivalence of the two “C2 em Combate” scenarios. Scenarios A and B corresponds to the two
different infantry operations. In the vertical axis we show the percentual SAGAT scores for the
questionnaires. Both scenarios were evaluated with and without alerts.

10
Fig. 6. SAGAT performance.
We also constructed histograms that show the frequencies distribution with and without the
use of alerts (Figures 7 and 8). In the horizontal axis we have the percentage of SAGAT scores
and in the vertical axle the number of subjects who reached that score.
Fig. 7. Histogram with alerts system
Fig. 8. Histogram without alerts system
The graphs indicated that the two conditions (with and without alerts) produce significant
differences with respect to SAGAT performance. For statistical validation, we verified if the
means of the samples are equal. Before this, we carry through a F-test to examine if the
samples had the same variance. The results are in Table 1.

11
Table. 1. F-test , two samples
How the F value 0,633 is greater than F critical 0,388, we can consider the same variability
for the two samples. We then applied a t-test to verify if the means are equal (results in Table
2).
With Alerts Without Alerts
Mean 0,561428571 0,665
Variance 0,013705495 0,021665385
occurrences 14 14
Variance group 0,01768544
Hypothesis µ1-µ2=0
df 26
Stat t -2,060540037
P(T<=t) one-sided 0,024741902
t critical one-sided 1,705617901
P(T<=t) two-sided 0,049483804
t critical two-sided 2,055529418
Table. 2. T-teste: two samles, variances equivalents, α=0,05
The result show that the value |T| 2,06 and T critical for two-sided 2,055 are to next,
because this is difficult say that the means are equal or different. However if we want to
evaluate, only, if the mean of the results with the use of alerts is equal or below the mean
without the use of alerts, with a confidence level of 95% we can discard the null hypothesis
and argue that the mean performance from the use of alerts is lower then when the alerts are
disabled.
To better examine SAGAT performance and verify the influence of the two different scenarios,
we carried out an ANOVA with two conditions of alerts and the two scenarios.
Df Sum Sq Mean Sq F value Pr(>F)
scenario 1 0.05316 0.05316 0.7053 0.40928
alerts 1 0.27087 0.27087 3.5941 0.07009
scenario:alerts 1 0.00688 0.00688 0.0912 0.76521
residuals 24 1.80874 0.07536
Table. 3. ANOVAT with two alert conditions and two scenarios
The results confirm that scenarios A and B can be considered equivalent, that is, although they
represent simulations of different operations, the difficulties are similar. On the other hand we
With Alerts Without Alerts
Mean 0,561428571 0,665
Variance 0,013705495 0,021665385
occurrences 14 14
df 13 13
F 0,632598717
P(F<=f) 0,210009109
F critical 0,388059098

12
can consider that the use of alerts reduce SAGAT scores, that is, the results show that when we
use an alerts system the SA decreases.
Another interesting result consider both the use of alerts and the workload conditions (Figure
9).
Fig. 9. SAGAT with alerts and workload conditions
For analyzing the results we carried out two t-tests, one for low and another for high workload.
Results are in Tables 4 and 5.
With Alerts Without Alerts
Mean 0,538571 0,691429
Variance 0,017275 0,022552
occurrences 14 14
Variance group 0,019913
Hypothesis 0
df 26
Stat t -2,86592
P(T<=t) one-sided 0,004064
t critical one-sided 1,705618
P(T<=t) two-sided 0,008129
t critical two-sided 2,055529
Table. 4. t-test: low workload
We verify that under low workload alerting was not significant, however under high workload
the t-test revealed that the SAGAT scores without alerts were higher than with alerts, with a
confidence level of 95%.
Regarding the exit questionnaire, the majority of the participants answered that the alerts
system had a positive influence in their performances

13
With Alerts Without Alerts
Mean 0,584286 0,638571
Variance 0,019749 0,033813
Occurrences 14 14
Variance group 0,026781
Hypothesis 0
DF 26
Stat t -0,87764
P(T<=t) one-sided 0,194087
t critical one-sided 1,705618
P(T<=t) two-sided 0,388175
t critical two-sided 2,055529
Table. 5. t-test: high workload
DISCUSSION
With a confidence interval of 95%, the results indicated that alerts negatively affected the SA
of the group of participants as a whole.
Analyzing the two scenarios the results indicated a not significant difference in SAGAT
performances. However the SA differences as function of the workload were noticeable. In
fact, the results indicated that the high difficulty condition generated significantly higher
SAGAT scores when the alerts were disabled. This result should not be necessarily interpreted
as providing an advantage for C2 systems with no alert conditions, as alerts are important in
bringing critical tactical situations to the attention of operator and users of networked C2
systems, however, attention must be given to the relationship between workload and the
agility to enhance SA. In the current experiment, task difficulty was operationally defined in
terms of the frequency of events occurrence presented to the participants via the display.We
found that perceived workload increased as task difficulty was intensified. Workload also had
an affect on SA, as participants had greater SA scores at the low difficulty level when alerts
were enabled.
The reason why alerts diminish SA can be related with the way the alerts were shown and the
interaction of the human with the computer.
Taken together, these findings underpins the connection between SA and mental workload.
Both SA and mental workload require the same cognitive resources (attention), so that
increased mental workload may reduce the individual ability to maintain SA [4].
We must also take in consideration the average age of the participants (37 years) and their
inexperience in the use of the system “C2 em Combate”. Additionally, all had military careers
with low emphasys on knowledge of the subjects which the questions of the SAGAT
questionnaire approached, namely infantry military operations.

14
CONCLUSION
The results of the experiments reported herein suggest that an automated alerting systems, as
IAAS, can diminish the SA even under low levels of workload. In fact, it was shown that IAAS
had negative effects on SA at several levels of workload.
In contrast to what would be expected from previous results [1], we argue that the alerts
system diminishes the SA of the operators, mainly under high mental workload conditions.
We can raise two causes that contributed to this conclusion. The first one is the human-
computer interaction itself. Alerts sometimes confused situation following, and shifted the
operator attention.Once the alert was issued, the operator concentrated in that event and
temporarily lost a general vision, mainly when under high workload.
The second cause is related to the profile of the operators that took part in the experiment.
Those were military personnel with many years of experience, experts in specific functions and
procedures that never considered decision making procedures such as the ones demanded by
the experiment. Interestingly, the majority of them reported that the alerts system influenced
positively their performances, even though the experiments showed otherwise

15
REFERENCES
[1] Barnett J. S. and Ross J.M. “Automated Feedback and Situation Awareness in Net-Centric
C3”, United States Army Research Institute for the Behavioral and Social Sciences, February
2008.
[2] Dixon, M. Combat ID and Force Traking – Technological Challenges and Perspectives.
Centre for Opeational Research and Analysis, Defence R&D Canada. IV SEDOP July, 2008.
[3] Spick, M. (1988). The ace factor: Air combat and the role of situational awareness.
Annapolis, MD: Naval Institute Press.
[4] Fracker, M. L. (1989). Attention allocation in situation awareness. Proceedings of the
Human Factors Society 33rd annual meeting, 1396-1400.
[5] Endsley M. R. Direct measurement of situation awareness: Validity and use of SAGAT. In M.
R. Endsley and D. J. Garland (Eds.), Situation Awareness Analysis and Measurement. (pp. 147-
173) Mahwah, NJ: Lawrence Erlbaum Associates.2000
[6] Dostal, B. C. (2007, Enhancing situational understanding through the employment of
unmanned aerial vehicles. army transformation taking shape ...interim brigade combat team
newsletter.[Electronic version].(No. 01-18).
[7] Bowman, E. K., & Kirin, S. (2006). The state of the art and the state of practice: Improving
platoon leader situation awareness with unmanned sensor technology.
[8] Miller, N. L., & Shattuck, L. G. (2004). A process model of situated cognition in military
command and control. Paper presented at the San Diego, CA.
[9] Neville S. Situation Awareness Assessment Methods. In Neville S. Human factors methods:
a practical guide for engineering and design. (pp. 213-300) Ashgate Publishing, Ltd., 2005
[10] French, H.T. & Hutchinson, A. (2002). Measurement of Situation Awareness in A C4ISR
Experiment. Land Operations Division. Defence Science & Technology Organisation. Edinburgh.
Australia.
[11] Endsley, M. R., Bolte, B., & Jones, D. G. (2003). Designing for situation awareness: An
approach to humancentered design. London: Taylor & Francis.
[12] Bolstad, C.A., Cuevas, H.M. Team Coordination and Shared Situation Awareness in Combat
Identification. SA Technologies. Marietta, GA.
[13] Bolstad, C. A., Riley, J. M., Jones, D. G., & Endsley, M. R. (2002). Using goal directed task
analysis with Army brigade officer teams. Proceedings of the Human Factors and Ergonomics
Society 46th Annual Meeting. Santa Monica, CA: Human Factors and Ergonomics Society.

16
Appendix A
Example SAGAT Questionnaire from Experiment
1. What is the localization of the 51 Bda Inf Mtz?
(A) (B) (C) (D) (E) (None)
2. Which subordinated units are present in the first step?
(A) (B) (C) (D) (E) (None)
3. Which enemy troops are next to your Unit?
(A) (B) (C) (D) (E) (None)

17
4. How many progression axes are leased in the map? 0 1 2 3 4 5 6 7+
5. It sketches the progression axes for the enemy troops located?
6. Which are the enemy units value? Squad Company Battalion Brigade Division
7. What is your mission? a. To destroy enemy troops. b. To fix enemy troops. c. To defend an area. d. Recognition. e. None the previous ones.
8. Which subordinated unit is more apt to carry out the main attack? a. 51 Esqd C Mec b. 411 BIB c. 511 BIMtz d. 512 BIMtz e. 513 BIS
9. What are the movements foreseen by the enemy? a. Retraction. b. Frontal Attack. c. Penetration. d. Envolvement. e. None.

18
10. Mark in the map the foreseen direction of attack by the enemy in case it takes the
initiative.
11. Indicate one potential route of escape in the map.
12. Describe two risks for the maneuvre. a.
b.