Embed Size (px)
Citation preview

Department of Physics, Chemistry and Biology
Degree project 16 hp
Camilla Hiding
LiTH-IFM- Ex--12/2659--SE
Supervisor: Karl-Olof Bergman, Linköping University
Examiner: Anders Hargeby, Linköping University
Department of Physics, Chemistry and Biology
Linköping University
581 83 Linköping
Diversity of birds in relation to area,
vegetation structure and connectivity in urban
green areas in La Paz, Bolivia

Rapporttyp
Report category
Examensarbete
C-uppsats
Språk/Language
English
Titel/Title:
Diversity of birds in relation to area, vegetation structure and connectivity in urban green areas in
La Paz, Bolivia Författare/Author:
Camilla Hiding
Sammanfattning/Abstract:
With a growing human population, cities keep growing worldwide altering ecosystem and thereby
affecting the species living in these areas. Most studies of urbanization and its effect on ecosystem have
been conducted in the western world and little is known about its effect in the neotropical part of the
world. I examined effects of fragment size, vegetation structure and connectivity of urban green areas on
bird species richness, mean abundance, diversity and biomass in La Paz, Bolivia. Additionally, the effects
of different disturbance variables on bird community were evaluated. In total, 36 bird species were found
in 24 fragment of varying size, connectivity and level of disturbance. Bird species richness decreased with
increasing disturbance while connectivity and fragment size did not contribute significantly to explain the
variation in species richness at count point scale (p>0.005, multiple linear regression). At fragment scale,
however, species richness increased with fragment sizes, which has been shown in other studies from
neotrophical regions. Variation in abundance, diversity or biomass could not be explained by connectivity,
fragment size or disturbance. Furthermore, coverage of construction had a negative effect on species
richness while coverage of bushes and coverage of herbs were negatively related to biomass and diversity,
respectively. The composition of bird species differed with size and disturbance of the fragments, so that
more omnivorous and granivorous species such as Zonotrichia capensis, Turdus chiguanco and Zenaida
auriculata, were present in areas highly affected by human activities. Larger fragments, less affected by
human presence held a larger proportion of insectivorous species.
ISBN
LITH-IFM-G-EX—12/2659—SE
______________________________________________
____
ISRN
______________________________________________
____
Serietitel och serienummer ISSN
Title of series, numbering
Handledare/Supervisor Karl-Olof Bergman
Ort/Location: Linköping
Nyckelord/Keyword:
Bird communities, connectivity, disturbance, fragment area, neotropic, urbanization, species richness
Datum/Date
2012-05-31
URL för elektronisk version
Institutionen för fysik, kemi och biologi
Department of Physics, Chemistry and Biology

Contents
1. Abstract ............................................................................................... 2
2. Introduction ......................................................................................... 2
3. Material & methods ............................................................................ 4
3.1 Study area ..................................................................................... 4
3.2 Choice of fragment ....................................................................... 4
3.3 Bird surveys ................................................................................. 5
3.4 Disturbance surveys ..................................................................... 6
3.5 Data analysis ................................................................................ 6
4. Results ................................................................................................. 9
5. Discussion ......................................................................................... 12
6. Conclusion ........................................................................................ 13
7. Acknowledgements ........................................................................... 14
8. References ......................................................................................... 15

2
1. Abstract
With a growing human population, cities keep growing worldwide altering ecosystem
and thereby affecting the species living in these areas. Most studies of urbanization
and its effect on ecosystem have been conducted in the western world and little is
known about its effect in the neotropical part of the world. I examined effects of
fragment size, vegetation structure and connectivity of urban green areas on bird
species richness, mean abundance, diversity and biomass in La Paz, Bolivia.
Additionally, the effects of different disturbance variables on bird community were
evaluated. In total, 36 bird species were found in 24 fragments of varying size,
connectivity and level of disturbance. Bird species richness decreased with increasing
disturbance while connectivity and fragment size did not contribute significantly to
explain the variation in species richness at count point scale (p>0.005, multiple linear
regressiom). At fragment scale, however, species richness increased with fragment
sizes, which has been shown in other studies from neotrophical regions.. Variation in
abundance, diversity or biomass could not be explained by connectivity, fragment size
or disturbance. Furthermore, coverage of construction had a negative effect on
species richness while coverage of bushes and coverage of herbs were negatively
related to biomass and diversity, respectively. The composition of bird species
differed with size and disturbance of the fragments, so that more omnivorous and
granivorous species such as Zonotrichia capensis, Turdus chiguanco and Zenaida
auriculata ,were present in areas highly affected by human activities. Larger
fragments, less affected by human presence held a larger proportion of insectivorous
species.
2. Introduction
Urbanization is one of the largest threats to biodiversity worldwide (Ricketts &
Imhoff, 2003). Today more than 50 % of the world population lives in urban areas.
The world population is expected to increase to nine billion over the next 30 years,
with the main growth located to cities (McKinney, 2006). In USA urbanization
endangers more species than any other human activity and is one of the leading
causes of species extinction (Czech, Krausman & Devers, 2000).
Urbanization affects ecosystem in a number of ways which ultimately affect
biodiversity (Bierwagen, 2007). In most cities 80 % of the down town urban area is
covered by buildings and pavement (Blair & Launer, 1997), reducing the original
vegetated area available to plants and animals, causing both fragmentation and habitat
loss. For many taxa species richness decrease with decreasing vegetation cover
(McKinney, 2002). This is true for birds (Goldstein, Gross & DeGraaf, 1986), insects
(McIntyre, 2000), mammals and amphibians (Dickman, 1987). Reduction of habitat
area results in smaller population sizes leading to increasing probability of extinction
due to environmental or demographical stochasticity and catastrophes (Burkey, 1995).
Fragmentation of habitat area and habitat loss affects the connectivity in the landscape
effecting ecological processes such as migration and dispersal (Andrzejewski,
Babinska-Werka, Gliwicz & Goszczynski, 1978; Hess, 1994; Weber, Houston & Ens,
1999; McCallum & Dobson, 2002). The habitat disturbance due to urban growth
generally favors only a few species adapted to urban conditions and affects the habitat
of native species negatively resulting in a biotic homogenization (McKinney, 2006)
and changes in species composition (Bierwagen 2006).
3
A recent review show that urbanization caused a decrease in species richness in 70 %
of all studies of urbanization effect on invertebrates (McKinney, 2006).
Corresponding values for non-avian vertebrates were 88 %. Reported research on
birds and urbanization (Marzluff, Bowman & Donnelly, 2001) stated that 61 % of all
examined bird studies showed decreasing species richness with increasing
urbanization. In the cases where species richness did not decrease, studies showed no
changes or even an increase in species richness with increasing urbanization.
Although most urban growth are expected to occur in developing countries, most
studies of urbanization and its effect on biodiversity has been done in developed
countries (Marzluff et al. 2001). The few studies conducted on bird species richness in
Latin America shows consistent results with most studies in other continents; a
decreasing number of species with increasing level of urbanization (Villegas and
Garitano-Zavala 2010) and an increasing dominance of a few species (Levau and
Levau 2005). Furthermore, Pauchard et al. (2006) suggested that the impact of
urbanization on biodiversity differs between developed and less developed countries
where the latter tend to replace native habitats with pavement and buildings and often
use non-native species as ornamental plants. In developed countries the effect of
urbanization is mainly fragmentation of big areas. While the urbanization tends to be
concentrated to the urban core in developing countries (Pauchard et al. 2006) the
developed countries show a different trend where populations move away from city
center resulting in a larger proportion of land being urbanized (Marzluff et al., 2001).
Not much is known about urbanization effect on biodiversity in the neotropical region
even though countries in this area are predicted to grow fast, resulting in larger
urbanized areas (United Nations population fund 2007). Biodiversity in the neotropic
region is rich, making the lack of conducted studies in this region problematic
(Marzluff et al., 2001). A study conducted in Mexico city showed that bird species
richness decreased with increasing levels of urbanization and that a few generalist
species were dominating the bird community in areas much affected by humans,
while the bird species abundance were more even in green areas (Ortega-Álvarez &
MacGregor-Fors, 2009). Additional studies conducted in the neotropical region has
evaluated urbanization effect on bird communities in the aspect of species
composition. Those studies show that omnivorous, insectivorous and granivorous bird
species tend to be more common in highly urbanized areas while highly specialized
species, frugivorous species and nectarivorous species decrease with increasing urban
development (Mendonça-Krügel & dos Anjos, 2000; MacGregor-Fors, 2008).
La Paz is the third largest city in Bolivia and keeps growing, primarily due to
migration from the surrounding rural areas to the city (Villagomez, 1991). The
increasing urban population result in an expansion of the city where available land
area in slopes and on hillsides is now being built upon, leaving only fragments of
different size, connectivity and vegetation inside the city center (Villegas & Garitano-
Zavala, 2010). So far a small number of studies have been conducted to evaluate the
urbanization effect on bird community in the La Paz area. The studies have focused
on species richness and abundance in park areas and along a gradient of increasing
urbanization, as well as the possibility of using different groups of bird species as an
indicator of human impact (Villegas & Garitano-Zavala, 2010).
To date, no studies have evaluated how size or connectivity of the unbuilt fragments
left inside La Paz, affect bird species richness, abundance, diversity and biomass.
4
Neither has the effect of disturbance variables in this fragments and how they affect
birds in general as well as specific groups of birds, been evaluated. The aim of this
study is therefore twofold: i) first to look at the urbanization effect on birds of La Paz,
Bolivia, and how species richness depends on the size and connectivity in fragments
of green areas inside the city, ii) second to evaluate the level of disturbance in the
fragments to see if variables such as vegetation cover and presence of exotic plant
species affect species richness and species composition in the bird community.
The hypotheses are that species richness is positively correlated to size and
connectivity, while abundance will differ amongst different species with a few species
dominating in areas highly affected of human activities while other, more sensitive,
species disappears as fragment area decreases and human impact increases.
3. Material & methods
3.1 Study area
La Paz is located in the west of Bolivia, in the central Andes. The city is 186 km2
and
has a population of 835 000 inhabitants (2008). The elevation extends from 2700-
4100 m.a.s.l with the majority of the settled area at 3600 m.a.s.l. (RED habitat 2004).
The topography of La Paz had set natural limit for the settled area, but with a
continuously growing population, due to migration from rural surroundings
(Villagomés, 1991), more of the areas consisting of slopes and steep hillsides at
higher elevations get built on (Villegas & Garitano-Zavala, 2010). This results in a
reduction of the green-areas and fragments of native vegetation in the city.
Today the vegetation in the city is impoverished and many of the native tree species
are replaced by exotic ones such as Cupressus macrocarpa, Eucalyptus globulus,
Populus balsamifera, Pinus radiate, Acasia dealbata, Acacia retinoides and Populus
nigra (García 1991). The bushes in the city consists of second-growth species such as
Baccharis spp. Viguiera pazensis, Mutisia acuminata, Adesmia miraflorensis,
Nicotiana glauca, Malva parviflora, and Cortaderia spp. Originally the La Paz region
was covered with Polylepis forest and by bush and shrubs such as Achyrocline
satureoides, Dunalia brachyacantha and Psoralea pubescens (Navarro & Maldonado,
2002). In the lower elevation the original dry forest consisted of species such as
Caesalpinia bangii, Prosopis laevigata, and Tecoma arequipensis.
3.2 Choice of fragment
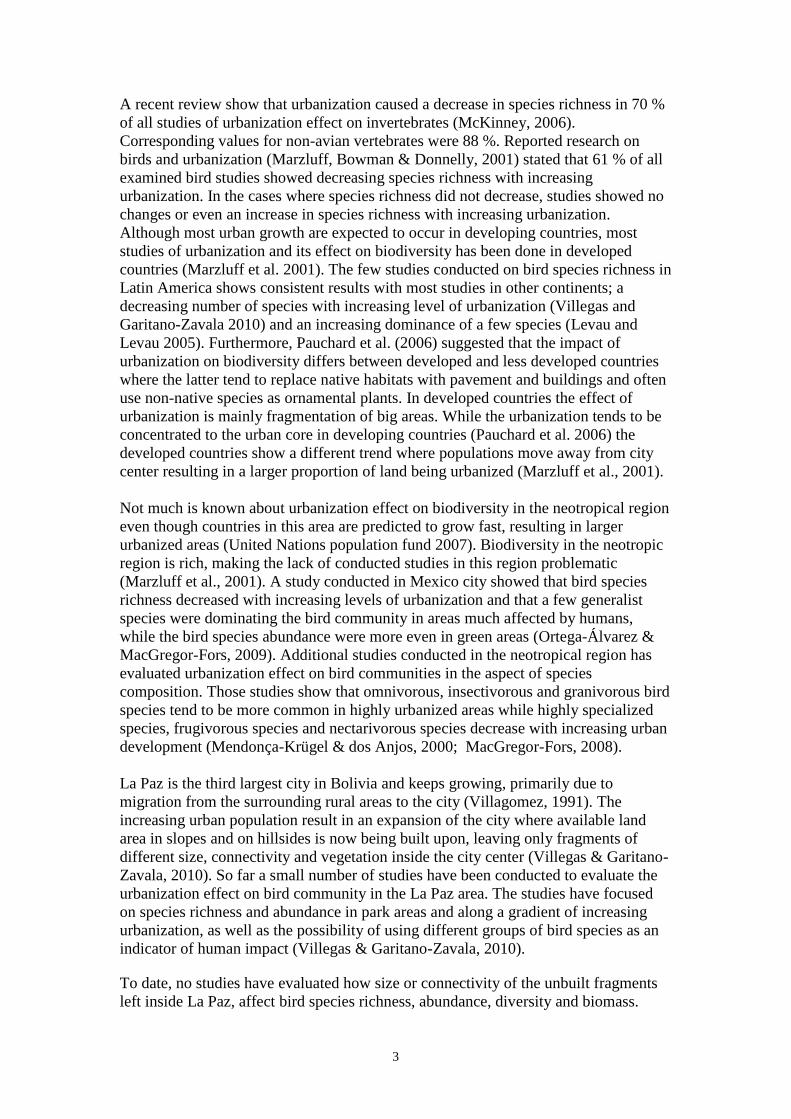
The fragments of native vegetation and green areas inside the city borders used in this
study were identified by help of Google Earth (Fig 1). All fragments with the
following criteria were mapped:
Inclusion criteria
Fragment larger than 0.785 ha
Fragment at an altitude between 3500- 4100 m.a.s.l.
Fragment separated by at least one row of houses, a road broader than 10 m or
an un-vegetated area larger than 50 m

5
Exclusion criteria
areas connected with continuous natural areas outside La Paz
cultivated areas
peoples private lawn or areas that belong to private properties
football fields
All fragments (mean ± SD patch size 33.34 ± 61.60 ha, range = 1.22-215 ha) were
divided into five groups according to size of the fragments (0.785-2 ha, 2-5 ha, 5-10
ha, 10-50 ha, 50+ ha). Fragments from each group were selected with regard to
different levels of isolation and with an even distribution of size, resulting in a total of
24 fragments. A number of count points were distributed in the fragments. Fragments
were sampled at one count point per 10 ha, maximum ten points per fragment and no
points closer than 250 m to another within the same fragment.
3.3
3.4
3.5
3.6
3.3 Bird surveys
59 count points were distributed in the 24 fragments. In those cases the chosen point
was impossible to reach because of topography or fences, a point as close to the
original one as possible was chosen. All count points were marked with GPS
(GPS60CSx). In each fragment, birds were counted in fixed-radius (50 m) point
counts (Villegas & Garitano-Zavala, 2010). Due to time limitation, all points were
visited once. During a 15 minutes period per point count, abundance and number of
species of all perching birds within the 50 m radius circle, were counted. The birds
were surveyed between 6.00-11.00 am from 31 /3-27/4- 2012. No
surveys were conducted on rainy days. Binoculars were used in the identification of
birds (112m/1000m).
Figure 1. Map showing the neotropical region and a map of La Paz
showing all 176 identified fragments.
6
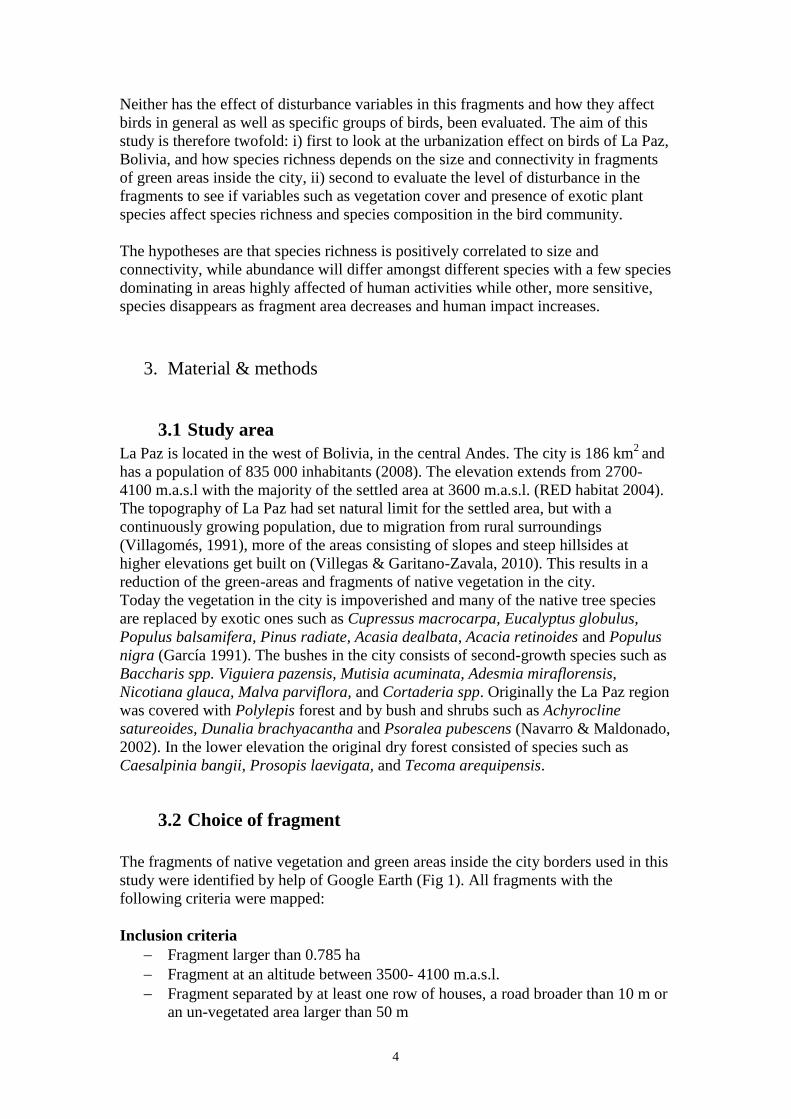
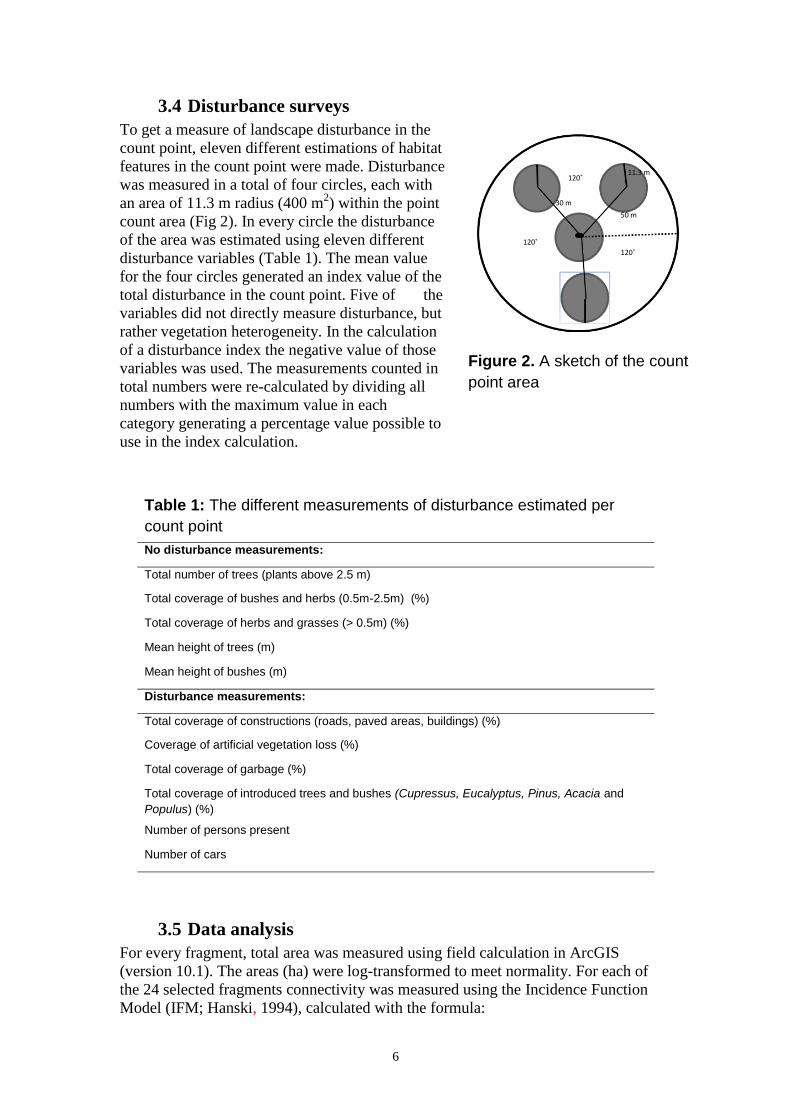
Figure 2. A sketch of the count
point area
120˚
120˚
30 m
11.3 m 120˚
50 m
3.4 Disturbance surveys
To get a measure of landscape disturbance in the
count point, eleven different estimations of habitat
features in the count point were made. Disturbance
was measured in a total of four circles, each with
an area of 11.3 m radius (400 m2) within the point
count area (Fig 2). In every circle the disturbance
of the area was estimated using eleven different
disturbance variables (Table 1). The mean value
for the four circles generated an index value of the
total disturbance in the count point. Five of the
variables did not directly measure disturbance, but
rather vegetation heterogeneity. In the calculation
of a disturbance index the negative value of those
variables was used. The measurements counted in
total numbers were re-calculated by dividing all
numbers with the maximum value in each
category generating a percentage value possible to
use in the index calculation.
3.5 Data analysis
For every fragment, total area was measured using field calculation in ArcGIS
(version 10.1). The areas (ha) were log-transformed to meet normality. For each of
the 24 selected fragments connectivity was measured using the Incidence Function
Model (IFM; Hanski, 1994), calculated with the formula:
Table 1: The different measurements of disturbance estimated per
count point
No disturbance measurements:
Total number of trees (plants above 2.5 m)
Total coverage of bushes and herbs (0.5m-2.5m) (%)
Total coverage of herbs and grasses (> 0.5m) (%)
Mean height of trees (m)
Mean height of bushes (m)
Disturbance measurements:
Total coverage of constructions (roads, paved areas, buildings) (%)
Coverage of artificial vegetation loss (%)
Total coverage of garbage (%)
Total coverage of introduced trees and bushes (Cupressus, Eucalyptus, Pinus, Acacia and
Populus) (%)
Number of persons present
Number of cars

7
(1)
Where Si is the connectivity for fragment I, Aj is the area (ha) of fragment j and dij is
the distance (km) between fragment i and j. α is scaling the effect of distance on
connectivity where 1/α is the mean migration distance. α was set to 0.002, which
measure up to a migration distance of 500 m. This measure takes in to account the
size and distance to all potential source population and the size of the focal patch, and
gives a consistent result for highly fragmented habitats (Moilanen & Neiminen,
2002).
A disturbance index was calculated using the mean value of all the landscape
variables (lack of trees, bushes, herbs and grasses, coverage of construction, garbage,
exotic species and presence of cars and persons) measured in the field (mean= 33.60,
S.D.= 2.50). To see which variable that best explained species richness, diversity,
abundance and biomass, two groups were created. One consisted of disturbance
variables such as cover of exotic species, cover of garbage and cover of artificial loss
of vegetation, as a measurement. The other category was thought to evaluate what
variable of vegetation heterogeneity that best explained species richness, biomass,
abundance and diversity, and consisted of variables for bush- and herb cover, number
of trees and mean height for bushes and herbs over 50 cm. The variable for artificial
vegetation loss was square root- transformed to meet normality needed in the
parametric statistical test.
For every point count, species richness (the sum of all species recorded in the count
point), abundance (number of individuals recorded in a count point), diversity and
biomass (the sum of the mean weight for each individual of each species) were
calculated. To estimate the species richness and abundance, a mean value per point
was calculated by dividing the total sum of observations with the number of count
points in the fragment. The species diversity per point and per fragment was
calculated with Simpson’s diversity index:
(2)
where ni, is the individual i, and N is the total number of individuals. The biomass
was calculated using the estimated weight of each species given in “The Handbook of
Birds of the World” (del Hoyo et al 1992-2011) and log-transformed to meet
normality. The mean weight of each individual was summed up to give an estimation
of the total biomass per point and also per fragment (mean= 6.94 g, S.D= 0.74).
Furthermore, all birds were categorized in groups depending on food selection. Six
different categories, frugivores, nectarivores, carnivores, insectivores and granivores,
were identified (categorization follows “Handbook of the birds of the world”)(Table2)

8
Table 2. All bird species found during point count, what food selection
category the species belong to ( I= Insectivorous, G= granivorous, N=
nectarivorous, O= omnivorous C=carnivorous, F= frugivorous), the
frequencies (number of count point in which the bird was recorded
divided with the total number of count point), total abundance (total
number of individuals found of each species) in which they appeared, the
range of the fragment area that each species was found, English names
and mean weight of each bird species.
Species
Food
selection
Frequency
of
occurrence
(%) Abundance
Range
(ha) English names
Mean weight
(g)
Anairetes parulus I 30 3 130- 207 Tufted Tit-Tryant 3
Asthenes dorbignyi I 3 37 1- 215 Rusty-vented Canastero 12
Carduelis atrata G 3 67 1- 215 Yellow-bellied Siskin 16 Carduelis
xanthogastra G 4
31 1- 215 Black Siskin
12
Catamenia analis G 5 16 3- 215 Band-tailed Seedeater 14
Colaptes rupicola I 59 1 13- Andean Flicker 173
Colibri coruscans N 2 51 2- 215 Sparkling Violeater 8
Columba livia O 2 67 1- 215 Rock Dove 309
Columba maculosa O 4 44 2- 215 Spot-winged pigeon 126
Conirostrumcinereum O 8 13 6- 215 Cinereous Conebill 9
Diglossa carbonaria O 6 19 1- 215 Grey-bellied Flowerpiercer 12
Falco sparverius C 6 13 5- 215 American Kestrel 100
Larus serranus C 59 1 6- Andean Gull 790 Leptasthenura
fuliginiceps I 59
3 130- Brown-capped Tit-spinetail
37
Metriopelia ceciliae O 2 76 2- 215 Bare-faced ground dove 73
Mimus dorsalis O 59 1 207- Brown-backed Mockingbird 59 Muscisaxicola
rufivertex I 59
1 130-
Rufous-naped Ground
Tryant 20 Ochthoeca
oenanthoides I 7
17
10-
215 D’Orbigny’s Chat-tryant
13
Oreotrochilus estella N 59 1 130- Andean Hillstar 8
Patagona gigas N 7 10 1- 215 Giant Hummingbird 19 Phalcoboenus
megalopterus C 12
8 5- 215 Mountain Caracara
398
Phrygilus fruticeti G 59 1 67- Mourning Sierra-finch 39
Phryilus punensis G 3 56 1- 215 Peruvian Sierrs-finch 37
Phytotoma rutila F 8 16 10- 215 White-tipped Plant-cutter 44 Poospiza
hypochondria G 30
2 207-
Rufous-sided Warbling-
finch 21 Saltator
aurantiirostris O 10
10 10- 215 Golden-billed Salator
39
Sappho sparganura N 10 8 9- 207 Red-tailed Comet 6
Sicalis flaveola G 30 3 9- 215 Saffron Finch 18
Sicalis luteola G 12 9 67- 215 Grassland Yellow-finch 16
Sicalis olivascens G 3 112 3- 215 Greenish Yellow-finch 21
Thraupis sacaya O 20 5 2- 215 Sacaya Tanager 31
Troglodytes aedon I 5 19 3- 207 House Wren 12
Turdus chiguanco O 2 101 2- 215 Chiguanco Thrust 54
Zenaida auriculata O 2 103 1- 215 Eared dove 56
Zonotrichia capensis G 1 268 1- 215 Rufous-collared Sparrow 24

9
The proportions of the different food selection categories were divided in different
fragment size categories (0-5 ha, 5-10 ha, 10-50 ha, 50+ ha) (Fig 4).
All variables were tested for normality and transformed using either log-
transformation (area, biomass) or square root transformation (number of individuals
per point, artificial loss of vegetation, omnivorous species, carnivorous species) in
those cases normality was not achieved. Standard multiple regressions were used to
identify which variable (area, connectivity, and disturbance) that significantly
explained the variation in the dependent variables; species richness, abundance,
biomass and diversity, in each point. Multiple linear regressions were also performed
to evaluate what landscape variable (disturbance, connectivity or fragment size) that
explained the different food selection categories.
To evaluate the effect of fragment size on species richness on a fragment scale, the
total number of species in all larger fragments (fragments containing more than one
count point) were compared to the number of different species in a corresponding
number of the smallest fragments with only one count point each (Fig 3).
Pearson linear correlation was used to evaluate the relation between the different
landscape variables. All statistical analyses were performed using the statistical
program SPSS® for Windows (version 18).
4. Results
Out of the 176 fragments that were located in La Paz, 24 fragments in different size-
and connectivity classes were chosen. Fragment size ranged between 1.17 – 215.14 ha
(S.D= 1,53, mean area= 2.28 ha). 59 count points were distributed in the 24
fragments. All together 35 bird species were counted, with a total of 1193 individuals.
The most common species were Zonotrichia capensis (names follow Fjeldså and
Krabbe, 1990) (268 individuals, 24 sites), Turdus chiguanco (113, 18), Sicalis
olivascens (112,10), Zenaida auriculata (109,20 ) , Metriopelia ceciliae(78,17) and
Carduelis atrata (69,12). Columbia livia were highly abundant in 17 of the 24 sites.
Fewer than 10 individuals were found of Sicalis luteola (9,3), Phalcoboenus
megalopterus (8,4), Sappho sparaganura (8,3), Thraupis sacaya (5,3), Anaitetes
parulus (3,2), Leptasthenura fuliginiceps (3,1), Sicalis flaveola(3,2) and Poospiza
hypochondria(2,2). Only one individual was found of Colaptes rupicola, Larus
seranus and Mimus dorsalis (English names are given in appendix 1). The occurrence
of species differed along the size gradient of the fragments with some species only
occurring in larger areas (Table 2).
There was a significant negative effect on the number of species detected per count
point with increasing disturbance (Table 3). Neither fragment size or connectivity had
a significant impact on mean species richness, mean abundance, diversity or biomass
(Table 3) at a count point scale. Cover of constructions had a negative effect on
species richness while no other disturbance variables (cover of exotic species, garbage
and constructions) significantly explained any other variation in species richness,
biomass, diversity or abundance (Table 3). Among the variables describing vegetation
heterogeneity (coverage of bushes and herbs, number of trees, mean height of bushes)
coverage of herbs had a negative effect on diversity while coverage of bushes and

10
herbs over 50 cm were a negative predictor of biomass. No other variables were
significant predictors of any other variation in the dependent variables (Table 3).
At fragment scale, the six fragments that were larger than 20 ha, containing more than
one count point per fragment, the four largest had more species than the
corresponding number of smaller fragments containing only one count point (Fig 3).
In the fragments smaller than 50 ha, containing two and three count point
respectively, the corresponding number of single fragments held more species in total
(Fig 3).
The relation between the different disturbances variables were evaluated using
Pearson linear correlation. The result showed positive correlations between mean
number of trees and coverage of bushes and herbs above 50 cm (r=0.863, P< 0.001),
number of trees and coverage of garbage (r=0.443,P= 0.03), coverage of bushes and
herbs above 50 cm and coverage of garbage (r=0.673,P< 0.001) and number of cars
correlates with number of persons (r=0.743, P= 0.004). A negative correlation was
found between mean tree height and number of persons (r=-0.804, P= 0.001) and
between coverage of garbage and coverage of exotic vegetation (r=-0.482, P=0.017).
Of all 35 bird species that were found during point counts, 28.6 % (10) were
omnivorous, 22.9 % (8) were granivorous, 20 % (7) insectivorous, 11.4 % (4)
nectarivorous and 9 % (3) species were carnivorous and frugivorous. Eleven species
were found in the entire range of fragment areas (1.22 ha-215 ha) while eight species
only occurred in fragment larger than 50 ha. Of the species found in the entire range
45.5 % (5) were omnivorous, 18.2 % were nectarivorous or granivorous and 9.1 % of
the species were either insectivorous or frugivorous. Of the species only found in
fragment larger than 50 ha, 37.5 % (3) were insectivorous or granivorous while 12.5
% (1) were nectarivorous or omnivorous.
Figure 3. A comparison between the number of species in a larger fragment and a corresponding number of count points located in several smaller fragments.
0
5
10
15
20
25
30
29 38 66 129 207 215
Nu
mb
er
of
spe
cie
s
Area
Number of species in largerfragment
Number of species incorresponding number ofsmaller fragments

11
Table 3. Standard multiple regression models describing the effect of landscape variables (fragment size, connectivity, disturbance, coverage of bushes and herbs, garbage, exotic species and the mean number of trees and mean height of bushes) on mean bird species richness, mean abundance, biomass and diversity in the city of La Paz.
Mean species
richness
Sqrt_mean abundance Log_biomass Diversity
Beta P R2
Beta P R2
Beta P R2
Beta P R2
Log_size -0.35 0.18 0.24 -0.46 0.08 0.22 -0.44 0.08 0.32 0.13 0.59 0.26
Connectivity -0.31 0.16 -0.42 0.06 -0.44 0.26 -0.32 0.14
Disturbance
index -0.51 0.04* -0.33 0.17 -0.52 0.38 -0.23 0.32
Cover of exotic
species -0.37 0.12 0.30 -0.26 0.33 0.13 0.09 0.71 0.18 -0.32 0.21 0.19
Cover of
garbage -0.42 0.07 -0.41 0.10 -0.39 0.11 -0.29 0.22
Cover of
constructions -0.45 0.04* -0.05 0.84 0.11 0.64 -0.39 0.09
Mean number
of trees 0.11 0.80 0.17 0.00 1.0 0.23 0.10 0.19 0.42 0.08 0.85 0.26
Cover of
bushes -0.37 0.40 -0.35 0.41 -0.91 0.02* -0.21 0.61
Cover of herbs 0.23 0.30 -0.09 0.66 -0.19 0.31 -0.46 0.04*
Mean height of
bushes -0.14 0.52 -0.27 0.22 -0.18 0.33 -0.16 0.43
Figure 4. The proportional distribution of food selection categories in different fragment size classes.
0
0,05
0,1
0,15
0,2
0,25
0,3
0,35
0,4
0,45
1-5 ha 5-10 ha 10-50 ha 50+ ha
Pro
po
rtio
ns
Granivorous
Frugivorous
Carnivorous
Nectarivorous
Omnivorous
Insectivorous

12
5. Discussion
With an increasing urban development resulting in a larger proportion of the human
population living in cities, understanding how this trend affects different ecosystem
and groups of organisms, is required (McKinney 2005).
In this study, disturbance had a negative effect on species richness but not on species
diversity, biomass or mean abundance. Disturbance was the sum of many different
landscape variables measuring as well disturbance factors as landscape heterogeneity.
As shown in several studies, bird species richness decrease with increasing
disturbance. For instance, studies has shown that car rate (Reijnen et al. 1997) and
presence of humans (Schlesinger, Manley & Holyoak, 2008) have a negative impact
on species richness. Vegetation heterogeneity is known to affect the bird species
richness in a positive way (Roth 1976). Further analysis showed that the coverage of
construction had a negative effect on species richness, a pattern seen in several studies
conducted on different taxa (Blair 2001; Mackin-Rogalska et al. 1988). The decrease
of species richness as the coverage of construction increased was likely due to the loss
of vegetation constructions brought about. In many studies on many different taxa, a
significant correlation between coverage of vegetation and the number of species is
shown (Goldstein et al. 1986; Dickman 1987). Furthermore, regression analysis
showed that neither fragment area or fragment connectivity had any significant effect
on bird diversity, mean abundance, species richness or total biomass in this study at
the count point scale (Table 2). However, at fragment scale, a comparison between
the number of species in the larger fragments containing more than one count point,
and a corresponding number of smaller fragments showed that the four largest
fragments had more species than the smaller ones. This result suggests that the point
scale (7850 m2) could be too small to detect any correlation between fragment area
and species richness. Although not statistically shown, the result of the fragment scale
comparison indicates that a larger area is crucial to those species only found in the
larger fragments. Out of the 35 bird species that were found in the study, eight of
them were only found in fragments with an area larger than 50 ha. Furthermore, 38 %
of these species were insectivorous and only one were omnivorous. The proportion of
omnivorous species seemed to decrease with increasing fragment area, a pattern
shown in previous studies (Kark et al, 2007). The carnivorous species were absent in
the smallest fragment category (0-5 ha), but were not more abundant in the largest
fragments compared to the medium sized. It seemed that fragment structure played a
more important role than fragment size, as all the detected carnivores were found in
fragments that contained rock formations offering a wide field of view. Nectarivouous
species were found evenly in all the fragment size categories and seemed to be more
dependent on some plant species, like Eucalyptus, than fragment size. Also
frugivorous and granivorous species were evenly distributed in different fragment
size categories with some species existing in the entire size range while some only
were found in the larger ones. This is probably due to variation among different
species within the same food selection category where some species have traits more
useful in urban areas than others. For example, some studies have shown that more
social species are more common in highly urbanized areas (Kark et al, 2007). Since
the result of the point scale studies did not correspond to the result of the fragment
scale evaluation, more large scale research is needed to further evaluate the
relationship between species richness and fragment size in this area.

13
Further analysis showed that coverage of herbs were a negative predictor of diversity.
Herbs, in this case, were vegetation below 0.5 m and were more common in parks
while vegetation in areas of more native character mostly consisted of bushes and
larger herbs. Park areas is often largely affected of human activities and tend to attract
a few number of species well adapted to human activities (McKinney 2005). Perhaps
this could partly explain why coverage of bushes (i.e. plants above 0.5 m) was a
negative predictor of biomass since park areas tended to consist mostly of herbs. Park
areas attracted a large number of a few species like Columba livia, Turdus chiguanco
and Zenaida auriculata generating a large biomass because of the species relatively
large weights (Appendix 1). This concentration of specific species results in a biotic
homogenization with a high abundance of only a few, often non-native, species
(McKinney 2005). Some of the most abundant species found during count points were
Zonotrichia capensis, Turdus chiguanco, Zenaida auriculata and Metropelia ceciliae.
All of this species, including Columba livia, were highly abundant in parks and other
very disturbed areas. This is also shown in previous research in La Paz (Garitano-
Zavala & Gismondi, 2003).This species are all omnivorous except for Z. capensis that
is granivorous , and can survive and reproduce successfully in areas highly influenced
by human activities because of their ability to eat of a broad range of food resources
(Donnelly & Marzluff, 2006). Species with a more specialized and narrower food
selection are predicted to disappear from sites where human activities has altered the
ecosystem changing the native landscape (Kark, Iwaniuk, Schalimtzek & Bankeret,
2007). Eleven of the 35 species that were found during point count where found in the
total range of the investigated fragments showing a large tolerance capacity to human
activities. The largest food selection categories represented were omnivorous species
(45%), granivorous and nectarivorous species (19% each). Eight of the species found
were only found in fragments larger than 50 ha. In this group the distribution of food
selection categories differed from the group occurring in the entire fragment range.
The majority of bird species were insectivorous species (38%). This is consistent with
previous studies concluding that bird communities in highly urbanized areas tend to
consist of granivorous species and species with generalist feeding habit while the
presence of insectivorous species decrease with increasing urbanization (Kark et al.
2007).
6. Conclusion
In the hypothesis of this study the prediction was that both increasing fragment size
and increasing connectivity would cause an increase in both species richness and
species diversity. Several previous studies shows result of this connection (Tilghman
1987). The previous studies from the La Paz area shows result consistent with that of
many other studies; a decreasing species richness with increasing urbanization
(Villegas & Garitano-Zavala 2010). At point scale, most of the results of this study
were not consistent with previous studies, disturbance were a negative predictor of
species richness, but other landscape variables such as connectivity and fragment area
could not explain any of the variation in species richness, abundance, biomass or
diversity. At fragment scale, however, the results indicated increased species richness
with increasing fragment area. This indicates that perhaps the point scale was too
small to detect any differences in bird species richness between points whereas
comparison at fragment level showed increasing bird species richness with increasing
fragment size. Further, I hypothesized that the disposition of the bird communities

14
would change in highly urbanized areas, with a few species clearly dominating,
resulting in a biotic homogenization. This pattern was shown in a comparison of bird
communities in fragments of varying levels of urbanization, when bird communities
in small and very disturbed areas consisted of a few very abundant species while
some of the species were never found in highly urbanized areas. The, somewhat
inconsistent, result of this study further emphasizes the need for continuous studying
of bird communities in this part of the world.
7. Acknowledgements
I thank Karl-Olof Bergman, Per Milberg and Alvaro Garitano-Zavala for your
patience and all your support and valuable comments and contribution in making this
report. I also thank my bodyguards; Daniella Morales and Veronica Zegarra for your
incredible generosity and support during my field work. Finally, I would like to thank
Sara Båsjö for your amazing commitment and for all your clever opinions and
comments. This project was founded by a Minor Field scholarship financed by Sida.

15
8. References
Andrzejewski, R., Babinska-Werka, J., Gliwicz, J & Goszczynski, J. (1978).
Synurbization processes in population of Apodemus agrarius. I. Characteristics of
populations in an urbanization gradient. Acta Theriol, 23, 341–358.
Bonier F, Martin PR, Wingfield JC (2007) Urban birds have broader environmental
tolerance. Biological Letters 3:670–673
Britta G. Bierwagen (2007) Connectivity in urbanizing landscapes: The importance
of habitat configuration, urban area size, and dispersal. Urban Ecosyst 10:29–42
DOI 10.1007/s11252-006-0011-6
Burkey, Tormod Vaaland (1995). Extinction Rates in Archipelagoes: Implications for
Populations in Fragmented Habitats. Conservation Biology, Vol. 9, No. 3 , pp. 527-
541
Blair RB, Launer AE (1997) Butterfly diversity and human land use: species
assemblages along an urban gradient. Biological Conservation 80:113–125
Blair R (2004) The effects of urban sprawl on birds at multiple levels of biological
organization. Report. Ecological Sociaty 9: 2.
http://www.ecologyandsociety.org/vol9/iss5/art2
Çağan H. Şekercioğlu, Gretchen C. Daily, and Paul R. Ehrlich (2004). Ecosystem
consequences of bird declines. PNAS , December 28, vol. 101 _ no. 52
Czech B, Krausman PR, Devers PK (2000) Economic associations among causes of
species endangerment in the United States. BioScience 50:593–601
Díaz IA, Armesto JJ (2003) La conservación de las aves silvestres en ambientes
urbanos de Santiago. Revista Ambiente Desarrollo de CIPMA 19:31–38
Dickman CR. 1987. Habitat fragmentation and vertebrate species richness in an urban
environment. Journal of Applied Ecology 24: 337–351.
Donnelly R, Marzluff JM (2006) Relative importance of habitat quantity, structure,
and spatial pattern to birds in urbanizing environments. Urban Ecosyst 9:99–117

16
García E (1991) Flora de la ciudad de La Paz. In: Baudoin M, Forno E (eds) Historia
Natural de un Valle en
Garitano-Zavala A, Gismondi P (2003) Variación de la riqueza y diversidad de la
ornitofauna en áreas verdes urbanas de las ciudades de La Paz y El Alto (Bolivia).
Ecol Bolivia 38:65–78
Los Andes: La Paz. Instituto de Ecología–UMSA, La Paz, pp 151–169
Goldstein EL, Gross M, DeGraaf RM. 1986. Breeding birds and vegetation: A
quantitative assessment. Urban Ecology 9: 377–385.
Hanski, I. (1994). A practical model of metapopulation dynamics. Journal. Anim.
Ecol., 63, 151–162.
Hess GR (1994) Conservation corridors and contagious disease: a cautionary note.
Conservation Biology 8:256–262
del Hoyo, J., Elliot, A. & Sargatal, J. (1992). Handbook of the Birds of
the World. Vol. I. Barcelona: Lynx Editions.
del Hoyo, J., Elliot, A. & Sargatal, J. (1994). Handbook of the Birds of
the World. Vol. 2. Barcelona: Lynx Editions.
del Hoyo, J., Elliot, A. & Sargatal, J. (1999). Handbook of the Birds of
the World. Vol. 5. Barcelona: Lynx Editions.
del Hoyo, J., Elliot, A. & Sargatal, J. (2002). Handbook of the Birds of
the World. Vol. 7. Barcelona: Lynx Editions.
del Hoyo, J., Elliot, A. & Sargatal, J. (2004). Handbook of the Birds of
the World. Vol. 9. Barcelona: Lynx Editions.
del Hoyo, J., Elliot, A. & Sargatal, J. (2005). Handbook of the Birds of
the World. Vol. 10. Barcelona: Lynx Editions.
del Hoyo, J., Elliot, A. & Sargatal, J. (2006). Handbook of the Birds of
the World. Vol. 11. Barcelona: Lynx Editions.
del Hoyo, J., Elliot, A. & Sargatal, J. (2007). Handbook of the Birds of
the World. Vol. 12. Barcelona: Lynx Editions.
del Hoyo, J., Elliot, A. & Sargatal, J. (2008). Handbook of the Birds of

17
the World. Vol. 13. Barcelona: Lynx Editions.
del Hoyo, J., Elliot, A. & Sargatal, J. (2009). Handbook of the Birds of
the World. Vol. 14. Barcelona: Lynx Editions.
del Hoyo, J., Elliot, A. & Sargatal, J. (2010). Handbook of the Birds of
the World. Vol. 15. Barcelona: Lynx Editions.
del Hoyo, J., Elliot, A. & Sargatal, J. (2011). Handbook of the Birds of
the World. Vol. 16. Barcelona: Lynx Editions.
Fjeldså, J., Krabbe, N.(1990). Birds of the high Andes. Copenhagen, Apollo Books.
Kark S, Iwaniuk A, Schalimtzek A, Bankeret E (2007) Living in the city: can anyone
become an ‘urban exploiter’? J Biogeogr 34:638–651
Leveau CM, Leveau LM (2005) Avian community response to urbanization in the
pampean region, Argentina. Ornitol Neotrop 16:503–510
McIntyre NE. 2000. Ecology of urban arthropods:A review and a call to ac- tion.
Annals of the Entomological Society of America 93: 825–835.
MacGregor-Fors I (2008) Relation between habitat attributes and bird richness in a
western Mexico suburb.
Mackin-Rogalska R, Pinowski J, Solon J,Wojcik Z. 1988. Changes in vege- tation,
avifauna, and small mammals in a suburban habitat. Polish Eco- logical Studies 14:
293–330.
McCallum H, Dobson A (2002) Disease, habitat fragmentation and conservation. Proc
R Soc Lond, B 269:2041–2049
Marzluff JM, Bowman R, Donnelly R (2001) A historical perspective on urban bird
research: trends, terms and approaches. In: Marzluff JM, Bowman R, Donnelly R
(eds) Avian ecology and conservation in an urbanizing world. Kluwer Academic,
Norwell, pp 1–17
McKinney M (2002) Urbanization, biodiversity, and conservation. Bioscience
52:883–890
McKinney ML (2006) Urbanization as a major cause of biotic homogenization. Biol
Conserv 127:247–
260
McKinney M (2008) Effects of urbanization on species richness: a review of plants
and animals. Urban Ecosyst 11:161–176

18
Mendonça-Krügel M, dos Anjos L (2000) Bird communities in forest remnants in the
city of Maringá, Paraná State, Brazil. Ornitol Neotrop 11:315–330
Moilanen, A. & Nieminen, M. (2002). Simple connectivity measures in spatial
ecology. Ecology, 83, 1131–1145. Landsc Urban Plann 84:92–98
Navarro G, Maldonado M (2002) Geografía Ecológica de Bolivia. Vegetación y
ambientes acuáticos. Centro de Ecología Difusión Simón I. Patiño, Santa Cruz
Ortega-Álvarez R, MacGregor-Fors I (2009) Living in the city: effects of urban land-
use on bird community structure, diversity, and composition. Landsc Urban Plann
90:189–195
Pauchard A, Aguayo M, Pena E, Urrutia R (2006) Multiple effects of urbanization on
the biodiversity of developing countries: the case of a fast-growing metropolitan area
(Concepcion, Chile). Biol Conserv 127:272–281
Reijnen R, Foppen R, Veenbaas G (1997) Disturbance by traffic of breeding birds:
evaluation of the effect and considerations in planning and managing road corridors.
Biodiv Conserv 6:567–581
Ricketts, T. and M. Imhoff. 2003. Biodiversity, urban areas, and agriculture: locating
priority ecoregions for conservation. Conservation Ecology 8(2): 1. [online] URL:
http://www.consecol.org/vol8/iss2/art1
Roth.R.R. (1976). Spatial heterogenity and bird species diversity. Ecology 57, pp 773-
782
Schlesinger MD, Manley PN, Holyoak M (2008) Distinguishing stressors acting on
land bird communities in an urbanizing environment. Ecology 89:2302–2314
Tilghman NG. 1987. Characteristics of urban woodlands affecting breeding bird
diversity and abundance. Landscape and Urban Planning 14: 481–495.
Tobar, D., 2003. Bases para la elaboracio´n de un plan de manejo orientado a la
conservacio´n del humedal dulceacuı´cola Chepe-Carriel Sur. Regio´n del Biobı´o,
Concepcio´ n, Chile.
United Nations Population Fund (2007) The State of the World Population 2007,
Unleashing the Potential of
Urban Growth. UNFPA, New York
19
Villagómez C (1991) Asentamientos humanos. In: Baudoin M, Forno E (eds) Historia
Natural de un Valle en Los Andes: La Paz. Instituto de Ecología–UMSA, La Paz, pp
47–56
Villegas, M and Garitano-Zavala, A. 2010. Bird community responses to different
urban conditions in La Paz, Bolivia. Urban Ecosyst 13:375–391
Weber TP, Houston AI, Ens BJ (1999) Consequences of habitat loss at migratory
stopover sites: a theoretical investigation. J Avian Biol 30:416–426