Embed Size (px)
Citation preview

i
INSTITUTIONAL REFORMS AND THEIR EFFECTS ON SERVICE QUALITY IN
PUBLIC SECTOR ORGANISATIONS: A CASE OF UGANDA REVENUE AUTHORITY
MODERNIZATION PROGRAMME
BY
BETTY LIZZIE KATOOKO MUVUMA
09/MMSPPM/18/012
A DISSERTATION SUBMITTED IN PARTIAL FULFILMENT OF THE
REQUIREMENTS FOR THE AWARD OF MASTERS DEGREE IN MANAGEMENT
STUDIES (PROJECT PLANNING AND MANAGEMENT) OF UGANDA
MANAGEMENT INSTITUTE
FEBRUARY, 2011
ii
DECLARATION
I, Betty Lizzie Muvuma hereby declare that this research work is my own original work. No
other work known to me has been submitted either in part or full to any academic institution
known to me on this topic for any academic requirement.
Signed …………………………. Date ……………………..

iii
APPROVAL
This dissertation has been submitted for examination with the approval of the following
supervisors:
............................................... Date.......................................................
Dr. Rose Namara
UMI Based Supervisor
.............................................. Date...................................................
Dr. Isaac Magoola Wanzige
Work Based Supervisor

iv
DEDICATION
To my parents Faith and Abel, for the love and care accorded to me. To my family, my beloved
husband Fred, our children Sparkle, Emmanuel, Jemima, Mira, Sandra and my sisters and
brothers in the Lord for the support and encouragement given to me.

v
ACKNOWLEDGEMENT
I wish to convey my appreciation to all those people who made this study possible. To my
supervisors; Dr. Rose Namara and Dr. Isaac Magoola for their expertise, professional guidance
and advice. Their positive attitude towards the study has made a huge impact on my own goals,
approach and motivation. Their unrelenting support to me during the study has made me
complete the study within schedule.
Special thanks go to Ms Susannah Najuma for her continued professional assistance. She will
always be my role model of excellence in imparting knowledge and encouragement wherever I
was stuck.
I am also heartily grateful to my husband for the moral support and friendship, my children for
the understanding and my siblings, brethren in the lord for the prayers and spiritual support.

vi
Table of Contents
APPROVAL .................................................................................................................................................... III
DEDICATION ................................................................................................................................................. IV
ACKNOWLEDGEMENT ................................................................................................................................ V
LIST OF ABBREVIATIONS ........................................................................................................................ XIII
ABSTRACT ....................................................................................................................................................... XIV
CHAPTER ONE ................................................................................................................................................... 15
1.1 BACKGROUND OF THE STUDY .................................................................................................... 15
1.2 PROBLEM STATEMENT ................................................................................................................. 19
1.4 PURPOSE OF THE STUDY .............................................................................................................. 20
1.5 OBJECTIVES OF STUDY................................................................................................................. 20
1.6 RESEARCH QUESTIONS ................................................................................................................ 20
1.7 HYPOTHESES OF THE STUDY ...................................................................................................... 20
1.8 CONCEPTUAL FRAMEWORK. ...................................................................................................... 21
1.9 SCOPE OF THE STUDY ................................................................................................................... 22
1.10 JUSTIFICATION OF THE STUDY .............................................................................................................. 23
1.11 SIGNIFICANCE OF THE STUDY ............................................................................................................... 23
1.12 OPERATIONAL DEFINITIONS....................................................................................................... 24
CHAPTER TWO .................................................................................................................................................. 26
2.1 INTRODUCTION ................................................................................................................................... 26
2.2 THE ATTRIBUTES OF SERVICE QUALITY AND INSTITUTIONAL REFORMS ................................................ 26
2.3 ONLINE BOOST AND ITS INFLUENCE ON SERVICE QUALITY ................................................................... 27
2.4 INFORMATION DISSEMINATION (COMMUNICATION) AND SERVICE QUALITY ....................................... 29
2.5 BUSINESS PROCESSES REFORMS AND SERVICE QUALITY ....................................................................... 34
2.6 RETOOLING REFORMS AND SERVICE QUALITY ...................................................................................... 36

vii
2.7 SUMMARY OF THE LITERATURE REVIEW .............................................................................................. 38
CHAPTER THREE ......................................................................................................................................... 40
METHODOLOGY .......................................................................................................................................... 40
3.1 INTRODUCTION .............................................................................................................................. 40
3.2 RESEARCH DESIGN ........................................................................................................................ 40
3.3 STUDY POPULATION ..................................................................................................................... 41
3.4 SAMPLE SIZE AND SELECTION ................................................................................................... 41
THE TABLE1: SHOWING STRUCTURE OF THE STUDY POPULATION SAMPLE AND
CATEGORIES ................................................................................................................................... 42
(FACTOR 175/320*) ........................................................................................................................................ 42
3.5 DATA COLLECTION METHODS AND TOOLS ............................................................................ 42
3.5.1 SELF‐ADMINISTERED QUESTIONNAIRE METHOD ...................................................................................................... 43
3.5.2 IN‐DEPTH INTERVIEWS METHOD .......................................................................................................................... 43
3.5.3 OBSERVATION METHOD ..................................................................................................................................... 44
3.5.4 DOCUMENT REVIEW METHOD ............................................................................................................................ 44
3.6 DATA COLLECTION INSTRUMENTS ........................................................................................... 44
3.6.1 QUESTIONNAIRE ............................................................................................................................ 44
3.6.2 INTERVIEW GUIDE ........................................................................................................................ 45
3.6.3 OBSERVATION GUIDE ................................................................................................................... 45
3.6.4 DOCUMENT CHECK LIST .............................................................................................................. 46
3.7 VALIDITY OF THE INSTRUMENT ................................................................................................ 46
3.8 RELIABILITY ................................................................................................................................... 46
3.9 DATA ANALYSIS: ............................................................................................................................ 47
3.9.1 PROCEDURE OF STATISTICAL ANALYSIS ................................................................................ 47
3.9.2 TECHNIQUE NUMBER ONE: FACTOR ANALYSIS TECHNIQUE.............................................. 47
3.5.5 STEP 1: PREPARING DATA .................................................................................................................................. 48
3.5.6 STEP 2: SELECTING A FACTOR MODEL AND DETERMINING THE NUMBER OF FACTORS ...................................................... 49
FIGURE: 2 SCREE PLOTS OF FACTORS. .................................................................................................. 50

viii
3.10 QUANTITATIVE DATA ANALYSIS ............................................................................................... 52
3.11 QUALITATIVE DATA ANALYSIS .................................................................................................. 53
CHAPTER FOUR ........................................................................................................................................... 54
PRESENTATION, ANALYSIS AND INTERPRETATION OF FINDINGS .................................................. 54
4.1 INTRODUCTION .............................................................................................................................. 54
4.2 RESPONSE RATE ............................................................................................................................. 55
TABLE 4 RESPONSE RATE .......................................................................................................................... 55
4.3 BACKGROUND INFORMATION OF RESPONDENTS ................................................................. 56
4.3.1 LENGTH OF STAY WITH THE ORGANIZATION ............................................................................................................ 56
TABLE 5: LENGTH OF STAY WITH URA .................................................................................................. 56
4.3.2 SEX OF THE RESPONDENTS .................................................................................................................................. 57
FIGURE 3: GENDER OF RESPONDENTS ................................................................................................... 57
4.3.4 AGE OF RESPONDENTS ...................................................................................................................... 58
4.3.5 DESIGNATION OF RESPONDENT ................................................................................................. 59
4.4 FACTOR ANALYSIS ........................................................................................................................ 59
FIGURE 4: THE MODIFIED CONCEPTUAL FRAME WORK .................................................................. 65
4.5 EMPIRICAL FINDINGS ................................................................................................................... 66
4.5.1 ONLINE BOOST AND SERVICE QUALITY IN URA ..................................................................... 66
4.5.2 INFORMATION DISSEMINATION (COMMUNICATION) AND SERVICE QUALITY .............. 74
TABLE 13: SUMMARY INFORMATION DISSEMINATION (COMMUNICATION) AND SERVICE
QUALITY .......................................................................................................................................... 75
THE HYPOTHESIS THAT THERE IS SIGNIFICANT POSITIVE RELATIONSHIP BETWEEN
INFORMATION DISSEMINATION (COMMUNICATION) AND SERVICE QUALITY HAS
BEEN SUPPORTED. ......................................................................................................................... 81
4.5.3 BUSINESS PROCESSES AND SERVICE QUALITY ....................................................................... 81
5.1 INTRODUCTION ...................................................................................................................................... 91
5.6 CONTRIBUTION OF STUDY ................................................................................................................ 101
5.7 LIKELY AREAS OF FURTHER RESEARCH ....................................................................................... 101

ix
APPENDICES: Appendix A: Questionnaire..............................................................................97-100
Appendix B: Interview guide...........................................................................101-102
Appendix C: Observation guide .................................................................................103
Appendix D: Document check list...............................................................................103
Appendix E: Letter of Authorization from UMI........................................................104

x
LIST OF TABLES
Table 1: Distribution of study population and sample size..............................................35
Table 2: Reliability of variables.......................................................................................40
Table 3: Factor reliability.................................................................................................46
Table.4: Response rate......................................................................................................50
Table 5: Length of stay at the organization......................................................................51
Table .6: Age of respondents.............................................................................................53
Table 7: Designation of respondents................................................................................54
Table 8: Summary of factor loadings...............................................................................55
Table .9: Summary of Online boost...................................................................................59
Table 10: Relationship between online boost and service Quality.....................................63
Table 11: Regression results for online boost and service quality.....................................64
Table 12: ANOVA Distribution for online boost and service quality ...............................65
Table 13: Descriptive analysis of information dissemination............................................66
Table 14: Cross tabulation results of information dissemination ......................................67
Table 15: Relationship between Information dissemination and service quality...............68
Table 16: Regression results for Information dissemination and service ..........................69
Table 17: ANOVA Distribution........................................................................................70
Table 18: Descriptive analysis on Business Process..........................................................71
Table 19: Relationship between business process and service quality...............................72
Table 20: Regression results for business process and service quality..............................73
Table 21: ANOVA Distribution of business process.........................................................74
Table 22: Descriptive analysis of corporate image.............................................................76

xi
Table 23: Relationship between corporate image and service quality................................77
Table 24: Regression results on corporate image and service quality................................78
Table 25: ANOVA Distribution of corporate image..........................................................79
Table 26: Summary of hypotheses results......................................................................... 79
xii
LIST OF FIGURES
Figure 1: Showing the conceptual frame work ..............................................................19
Figure 2: Scree plots........................................................................................................44
Figure 3: Gender of respondents.....................................................................................52
Figure 4: Modified frame work.......................................................................................59

xiii
LIST OF ABBREVIATIONS
ASYCUDA Automated Systems of Customs Data
SYCUDA++ Version of ASYCUDA
CPD Continuous Professional Development.
COMESA Common Market for Eastern and Southern Africa
URA Uganda Revenue Authority
ITAS Integrated Tax Administration System
ICT Information Communication Technology.
IMF International Monetary Fund
IT Information Technology.
MOF Ministry of Finance.
SPSS Statistical Package for Social Science.
UMI Uganda Management Institute
xiv
ABSTRACT The study sought to examine institutional reforms and their effect on service quality in Uganda
Revenue Authority (URA). The objectives of the study were to investigate the effect of online
boost on service quality in URA; to establish the effect of information dissemination
(communication) on service quality in URA; to assess the effect of business process reforms on
the service quality in URA; and to examine the effect of corporate image reforms on service
quality of URA. The study employed cross-sectional case study and correlation research designs,
both quantitative and qualitative methods were used in the study. A total 116 respondents of the
selected sample of 175 representing a 66 percent response rate were subjected to questionnaires
and interviews. Data was collected from both internal (staff) and external (taxpayers) customers
in Kampala based offices. The study revealed a significant positive relationship between online
boost and service quality; information dissemination and quality service; corporate image and
service quality, a partial relationship between business process reforms and service quality.
It was thus concluded that institutional reforms have a positive significant relationship with
service quality in Uganda Revenue Authority.
On the basis of the study’s findings and its comparison with local and international literature, it
was therefore recommended that efforts to improve on the corporate image, on line boost,
communication and business processes would be vital to achieve excellent service quality. URA
ought to be online facility, information dissemination, business processes and corporate image.
URA needs to have well defined structures, systems and information dissemination
(communication) should be an integral part so as to reinforce and support service quality.
Emphasis should be laid in synchronization of external and internal communication mechanisms.

15
CHAPTER ONE
1.1 INTRODUCTION This study investigated the effects of institutional reforms on service quality in Uganda
Revenue Authority (URA). Institutional reforms in URA included online boost, information
dissemination (communication), business processes, and corporate image improvement. This
chapter presents the background to the study, problem statement, purpose, the objectives,
questions, the hypotheses, the scope and significance of the study as well as operational
definition of terms and concepts used in the study.
1.2 Background of the Study
The study adopted the broader-narrow approach of background development as suggested by
Mugenda and Mugenda (1999). Globally, in recent decades, the challenges facing the public
sector are many and varied and include constant change, growing competition, market
testing, reduced costs and increased customer expectations within the delivery of government
services under best value principles. The challenge to authorities is to deliver the services to a
standard at least comparable with that of the private sector provision. Government service
providers must identify and implement best practices, in comparison with key service quality
measures (Shelfeid and Coleshil, 2001).
Several studies have suggested that there are a number of distinct differences between private
and public sector organisations, because the two sectors operate in distinctively different
environments. In particular, a United Kingdom study of public sector organisations reveals
that these operate in an environment characterised by resource constraints, market
competition and growing customer expectations (Robinson, 2003).
Research in Asia revealed that the public sector is inherently inefficient because of the

16
absence of incentives that exist in the private sector which operates in an open market and has
a decentralised model of decision-making (Bhatta, 2001). The purpose of the public sector in
the current environment can be viewed as a paradox-the pursuit of public good and a
sustainable competitive advantage (Mathews and Shulman, 2005).
In the United Kingdom private sector’s singular focus is on economic efficiency, as it is
generally viewed that profit and/or cost reduction are key ingredients to survival and growth
(Cooper, 2004). It can therefore be argued that public services that are free of charge are less
inclined to adopt service quality practices unless pushed by customer demands and
government legislation. The disparity in service performance in Taiwan between the public
and private sector and the resulting public dissatisfaction has instigated government
legislation to render public service entities to be more customer-oriented. Service
enhancements through customer orientation provide the public sector with an opportunity to
gain confidence from the tax –paying public (Chen, Yu, Yang and Chang, 2004)
During the last two decades, most countries have embarked on comprehensive public sector
reform programmes. Public sector management reforms are a central feature of economic
policy reform programmes. Many African countries such as Ethiopia, Ghana, Mauritius,
Senegal and Uganda have embarked on comprehensive reforms aimed at improving the
quality of life of their citizens and creating new government machinery to establish efficient
and effective management systems. However, the performance of such reforms in Africa
remains hindered by a myriad of factors including lack of efficiency, lack of accountability,
inefficient management practice and corruption (Economic Commission for Africa, 2004).
In recent studies by Common Market for Eastern and Southern Africa (COMESA) study

17
conducted in October 2009, the major reforms that have been made by the Government of
Uganda to promote investment have mainly focused on supporting the private sector as the
engine of growth. Government has moved away from doing business and privatized most of
the state owned enterprises. At the local scene, recent initiatives in URA tax administration
have emphasized reduction of tax compliance costs as a means of maximizing revenue. These
costs are often reflected in employing middlemen on behalf of taxpayers, extensive
transactions delays and non-tariff barriers to movement of goods (Revenues, 2002).
The Government of Uganda established Uganda Revenue Authority (URA) as a statutory
body in 1991 as a monopoly responsible for Tax Administration in the country; URA Statute
(1991). It came about as a result of an amalgamation of the formerly existing Departments of
the Ministry of Finance; Inland Revenue and Customs and Excise Departments. the URA
exist to: “To provide the most effective contribution to the national development through
maximizing central government tax collection systems with a highly motivated and
professional staff and strict expenditure management” (URA Statute, 1991).
Uganda Revenue Authority has traversed just over a decade of existence since its birth on 5th
September1991. Revenue collection has grown from annual collection of Shs. 133 billion (6
percent of gross domestic product( GDP) ten years ago to shs.1250 billion, International
Trade taxes grew by 23 percent, consumption taxes by 80 percent and fees and license by
35.5 percent (Revenues 2003). This was attributed to the concerted effort and commitment of
employees.
In July 2004, government started another set of reforms in the tax body by appointing a new
Board of Directors. Subsequently, the board appointed a new Commissioner General in
18
November 2004. This was followed by implementation of other reform initiatives that
included developing a new flat organization structure that reduced the reporting levels from
eleven to seven. Consequently, staff establishment also reduced from 2076 to 1805. The top
heavy structure was reduced from eleven to five Commissioners. The reforms were aimed at
ushering in a complete transformation of the tax body in virtually all aspects.
In November, 2004 URA embarked on a number of reforms that have had tremendous impact
on the organizations performance. Over the last five years URA has greatly improved her
corporate image and as a result many agencies and institutions are willing to partner within
its transformation drive. Revenue performance has steadily improved with net collections
growing from 1923.52bn in 2004/05 to UGX 3,662.32bn in 2008/09 (Revenues, 2009).
The initiatives identified are in line with the modernization strategy with the overall goal of
totally transforming URA. In addition to the projected automation of most business
processes, like continued roll out of the automated system for customs data (ASYCUDA++),
the introduction of Integrated Tax Administration (ITAS), URA had to set priorities and
objectives to be achieved by successfully implementing key initiatives and strategies.
The strategic objectives of URA for the period 2002–2006 corporate plans included
maximizing central government revenue, improving and sustaining the quality of service
delivery, recognizing the importance of the human resource through improved staff
motivation, minimizing revenue leakages through automated tax administration systems and
improving the URA corporate image. Five strategies were developed to achieve these
objectives.

19
The five strategies included – revenue collection, quality service delivery, human resource,
management information systems and the corporate image improvement.
In its efforts to implement these strategies, the Organization registered considerable progress.
Revenue grew from Shs.1, 264 billion in 2001 to Shs.2, 336bn in 2005. Annual nominal
growth rate rose from 6 Percent in 1999 to 18 percent in 2005. A competence based
performance management system was introduced. Quality assurance was established as a
significant item within the URA priorities. There was a substantial increase in the number of
staff using Internet/Intranet services. The number of networked personal computers with
internet services increased from 56 in 2001 to 380 by 2005 (URA Business Plan, 2009).
1.3 Problem Statement
Institutional reforms are upheld by many scholars, with major emphasis laid on service
quality. Institutional reforms are now moving to the forefront of public sector management as
a result of the combined pressure of growing customer expectations. Drawing from the
findings of a study carried out in Malaysia, according to Berkley (2003) and Kadir, Abudallar
and Agus (2000), little attention has been given to the application of service quality in the
(Malaysian) public service. This led to a situation where the concept of ‘quality schemes’
became an integral part of public service management. However, their impact on service
delivery remains largely unknown (Robinson, 2003).
Despite the many reforms in Uganda Revenue Authority in the past decade, a study by
International Monitory Fund (IMF) conducted in Uganda Revenue Authority to assess the
immediate effects of restructuring concluded that the organizational changes were still in
their initial stages and URA needed to consolidate its systems and procedures in the areas of

20
business processes, corporate image and information communications technology (IMF,
2007). This poses the question of how the reforms are affecting service quality. This study
therefore examined the effects of institutional reforms on service quality of Uganda Revenue
Authority. The study questions the extent to which reforms affect service quality.
1.4 Purpose of the study The purpose of the study was to examine the effects of institutional reforms on service
quality at Uganda Revenue Authority
1.5 Objectives of study a. To establish the effect of automation reforms on service quality in Uganda Revenue
Authority.
b. To examine the effect of structural reforms on service quality of Uganda Revenue
Authority.
c. To explore the effect of retooling reforms on service quality of Uganda Revenue
Authority.
1.6 Research Questions The study will be guided by the following research questions.
a. To what extent do automation reforms affect service quality at Uganda Revenue
Authority?
b. What effects have structural reforms had on service quality at Uganda Revenue
Authority?
c. What has been the effect of retooling reforms on service quality at Uganda Revenue
Authority?
1.7 Hypotheses of the study The following hypotheses guided the study

21
H1 = There is significant positive relationship between automation and service quality in
Uganda Revenue Authority.
H2 = Structural reforms significantly affect service quality in Uganda Revenue Authority.
H3 = There is significant positive relationship between retooling reforms and service
quality at Uganda Revenue Authority.
1.8 Conceptual Framework.
The conceptual framework below presupposes that there is a relationship between
institutional reforms and service quality in Public Sector Organizations. The two concepts
have been further operationalized on the basis of extensive literature review on reforms and
service quality. In figure 1, the operationalizations of all variables are presented.

22
Figure 1: The conceptual framework for understanding the relationship between
institutional reforms and service quality.
I.V: Institutional Reforms
Reforms in URA Developed from: Kadir et al (2000)
In figure 1, the study conceptualised the institutional reforms as automation reforms,
structural reforms and retooling reforms. On the other hand service quality had a number of
dimensions that were formulated after reviewing the literature, like (Kadir et al., 2000). The
model has been drawn from the original service quality (SERVQUAL) which looks at service
quality in terms of reliability; accessibility of service, competence, responsiveness and
courtesy of staff. This was customised to suit the URA situation by the researcher. This has
advantages in that it helps one understand the various dimensions of quality.
1.9 Scope of the study The study was carried out in URA offices in Kampala District comprising of Nakawa Head
quarters, customs business centre (CBC), large tax payer office (LTO), medium taxpayer
office (MTO), Kampala central located at crested towers building Kampala, Nakawa house
D.V:Service qualityAutomation Reforms • Computerization • Communication
Retooling Reforms • Re- training staff • Business process
reengineering
Structural reforms • Structure merging. • Staff reductions.
• Effectiveness • Efficiency • Reliability

23
and internal audit. This was for easy accessibility and 80 percent of URA staff is based in this
area. The study covered the period November 2004 to October 2009. This period is crucial as
far as the various reforms are concerned; various reforms took place in this period. It focused
on the objective of the research which included automation reforms, communication reforms,
business process reforms and corporate image improvement and how they affect service
quality in URA.
1.10 Justification of the study
A number of processes, systems and structures in Uganda Revenue Authority are undergoing
constant change that affects the quality of services provided to both internal and external
customers. These reforms were aimed at creating coherent and transparent systems across the
organization. Consequently, Uganda Revenue Authority is searching to redefine its
operations in bid to improve service quality. Hence efficient and effective ways of delivering
quality Revenue Service being critically considered in the strategic plans. Emphasis put on
maximizing the unique contributions of each individual departments thus removing non value
adding processes and creating a competitive tax administration system.
1.11 Significance of the study
The research findings and recommendations will enable various stakeholders that are
supporting reforms in the public sector to re-assess their strategies in order to develop
effective systems and mechanisms which will enhance quality service.
The findings that institutional reforms of corporate image improvement, online boost,
information dissemination and business process reforms significantly affect service quality at
URA meaning that more efforts and resources are required with specific emphasis on
24
corporate image improvement. This was found to be the highest predictor of service quality at
URA. But this does not mean that no effort is required in the area of business process reform
which ranked lowest among the four predictors; the various business processes should be
continuously reviewed according to customer needs and requirements.
The research results added the existing body of knowledge on Service Quality in URA.
The findings of this study provided knowledge on institutional reforms. The study was
deemed of great significant to many stakeholders and scholars of institutional reforms on one
hand and service quality on the other hand. The findings, conclusions and recommendations
from the study are expected to help decision makers, especially tax administrators and their
governing bodies the Ministries in understanding the underlying components as Corporate
Image predicting 37 percent of the variations in service quality, Online boost being the
second predictor with 18 percent, closely followed by Communication with 17 percent and
Business Process contributing 7 percent
1.12 Operational definitions
Service quality: In this study service quality was taken to mean the organizations judgement
about entity’s excellence or superiority (Parasuraman et al.., 2003).
Institutional reform: According to Bezes and Lodge (2006), reform means to change a
system, modernization of systems of public administrations refers in this study institutional
reform means changes in structure, personnel, and organization performance measurement
systems.
Communication: This can be broadly defined as an interchange of thoughts or information

25
to bring about a mutual understanding between two or more parties. In this study
communication will be used interchangeably with information dissemination.

26
CHAPTER TWO
LITERATURE REVIEW
2.1 Introduction This chapter focused on the critical review of literature on the key concepts and variables
shown in the conceptual framework. The chapter is arranged along the variables of the study.
The literature discusses the institutional reforms as the independent variable and service
quality as the dependent variable.
The source of literature was both internal and external to URA, including journals articles,
textbooks and relevant reports on the research topic. The procedure of reviewing literature
was be done by defining the conceptual variables as suggested by various scholars and
thereafter discussing the various reviews so as to demonstrate the gaps in the literature.
2.2 The attributes of Service Quality and Institutional Reforms Service quality is at times referred to as the level of quality of service, or the guaranteed
service quality where the technical aspects of quality predominate; the quality of the service
provider cannot be separated from the measurement of service quality (Berry, 2003). The
attributes of quality of service include timeliness, effectiveness, efficiency, and friendliness
of the service providers making the measurement of service quality a challenging issue.
Service delivery occurs through human interaction, thus customer contact with employees
during the service encounter largely determines the level of service quality delivered (O’Neil,
2004).

27
Parasuraman (2002), defined service quality as customer oriented activities carried out by the
organization towards meeting customer needs and expectations. In brief service quality is the
manner in which customer needs are met.
According to Bezes and Lodge (2006) Institutional Reform entails changes either in
constitutional or collective choice rules. This is done through changes of operational rules
and practices in root organizations. Institutional Reform in this study was used
interchangeably with modernization of public administrations.
2.3 Online boost and its influence on service quality The impact of advance in technology, and the rate of change it produces, is not easy to
forecast. However, the increasing use of website technology is altering the expectations of
customers on the availability of services and the nature of services provided. Customer
expectations vary with their concept of technology. Technology from this point of view also
offers efficiency to service providers (Parasuraman, 2000).
Julia, Kiely and Colin et al (2004) argued that future developments in network
communications will increase the opportunities for home –based and field based remote
work. They further posited that this will increase the reach and speed of customer
communication and flexibility in service operations. However, the potential for home and
field working is not restricted to technical or other specialists. Call-centre organizations with
large numbers of customers are also rethinking future network communications, with a view
to developing home working in these operations.
Many organizations are aware that the increasing complexity of products and services
28
requires customer service professionals (CSPs) to be competent in training and educating
customers. This will require CSPs to have competent communication skills (soft skills) as
well as technical expertise (Julia et al, 2004). A significant element in the future competitive
strategy of organisational success.
In the various literature reviewed there was general agreement that CSPs will need to be
efficient in the use of new communication modes, including e-mail. This aspect of future
service was especially a matter of concern to companies in financial services,
telecommunications, public utilities and distribution. The dominant modes of communication
at the present are telephone and e-mail messages, with e-mail in particular becoming
increasingly significant. CSPs need to handle both modes of communication competently
and sometimes simultaneously. Thus Strategy of organizations is the enhancement of
communication modes to expand information dissemination, E-mail facility and telephone.
The URA ICT strategy 2004 identified three major components; first re-engineering the core
business processes of international trade and domestic taxes. The second component was re-
engineering processes and services that support the core business. The strategy identified
business driving factors as cross linkages between all sources of tax information, simplified
procedures, minimizing duplication of effort, improved turnaround time and achieving a high
level of voluntary compliance. The automation of business processes including a base
communication infrastructure was therefore not an option but a prerequisite necessary
intervention in URA. The third key component of the ICT strategy was therefore a secure and
reliable base communication voice and data infrastructure.
URANET was conceived in 2006 to address ICT infrastructure requirements including Data

29
and voice communication between URA stations and nominated third party entities. The
scope of URANET linking sixty URA stations across the country. This was assumed to
improve the quality of service because of its faster means of communication (The Taxman,
2008).
2.4 Information dissemination (communication) and service quality Cheeseman and Wood, (2003-2004) regard internal communication as working together with
colleagues and providing good services so that as a team, the organisation can achieve its
goals. In addition, Milkovich and Boudreau (2003) established that the variety of
communication approaches ranges from annual written reports to abstracts and seminars.
Communication is seen as a check point and a sign of personal assessment among employees
towards personal development, performance and job commitments thus improving quality of
service to both internal and external customers.
Nazalemo (2003) also argued that managers should develop a habit of spending a great deal
of time talking to employees because transparency drives to improved performance when all
employees know what their key annual performance targets are. In addition feedback is
essential for accurate control, and calls for change in case of any deviations in
communication procedure or standards. Thus the current study intended to establish how
communication with external customers improves the quality of service. Staff and customers
are stakeholders in the organization, who should be informed of changes in the organization
before they occur so as to be able to answer questions that arise. They stated that ‘the two-
way flow of information is important as managers hear staff” views and opinions and staff
get to know managements’ objectives, views and plans. This can be through regular
meetings, performance reviews and meetings with senior managers when discussing an

30
organizations overall performance and future developments. They encouraged effective use
of newsletters, notice boards and internal networking through e-mails, telephone connections.
They added that organizations should encourage suggestion boxes to enable complaints
handling, as they help to identify ways of improving.
In a study by Muhenda and Lwanga (2009) to investigate the effect of information
communication technologies on intra knowledge transfers success among information
workers in higher public institutions of learning in Uganda, it was recommended that
institutions of learning should invest substantially in training information workers in ICTs.
According to Saito, Umemoto and Ikeda, (2007), for instance, technologies can be
categorized as collaboration technologies that support the creation of personalized
knowledge; dissemination technologies that support the transfer of personalized knowledge,
discovery technologies that support the creation of especially codified knowledge and
repository technologies that support the codified knowledge
This finding by Syed-Ikhsan and Rowland (2004) who reported that ICT infrastructure allows
individuals to create and share knowledge effectively and contribute to organizational
performance. Their study found a significant positive relationship between ICT know how
and performance in organizations. This study addressed this gap because information
dissemination cannot be appreciated without paying attention to technology, and its impact
on the process. It is against this background that this study considered information
dissemination (communication) that affects service quality.
Scattered Organizational data can be integrated through ICT via network. (Hoon, 2003).In
revenue services, ICT plays an important role in the operations of organizations, as they can

31
collect and share innovative ideas from and between every corner of the organization and
finally come up with excellent products and processes which can significantly improve the
quality of service (Lin and Wei, 2005). ICT use and quality service are closely linked as ICT
enables rapid search, access and retrieval of information and supports communication and
collaboration among organizational members at the same time overcoming geographical
boundaries (Lin, 2007; Carrillo and Chinowsky, 2006).
In revenue administration, the use of ICT is likely to make the internal and external
collaboration faster and more efficient thus improving service quality. This is because some
of the benefits of service quality include time and cost saving and the use of the computer as
a tool to organize, store, and retrieve knowledge as soon as it is required. In this context, ICT
can be considered a key enabler of service quality.
Effective information dissemination depends on people sharing their knowledge through
computer facilities that users throughout the organization have access to. Blood good and
Salisbury 2001 argue that IT can be seen as embodying two general capabilities with respect
to knowledge. First, knowledge may be modified into a decision support or expert system by
making it explicit. Second, it helps to keep track of persons with particular expertise and
enabling rapid communication between them. Thus up-to-date ICT infrastructure helps
employees create and share information within the organization.
Swee 2002, in his study suggested developing horizontal communication flows which go
beyond using technology. He stated that one approach is to encourage cross-functional teams
and team work in organizations. This is very crucial for public workers. A public
organization can design tasks that require cross-functional collaboration to be accomplished.

32
For example in the management of unpaid revenue such an approach forces individuals and
groups from the public to begin learning to communicate horizontally. Swee (2002), states
that knowledge exchange policy should be instituted in organizations if effective
communication is to be realized. He argues that without a proper policy in place effective
communication will be impossible.
In a study by Muhenda and Lwanga (2009) conducted to investigate the effect of information
communication Technologies on intra-Knowledge transfers success among information
workers in Higher public Institutions of learning in Uganda , it was recommended that
institutions of learning should invest substantially in training information workers in ICTs.
Other researchers have also acknowledged the importance of ICT in information
dissemination and management initiatives. Results of such studies confirm how technology
plays a key role in knowledge dissemination in organizations (Kim and Lee, 2006).
According to Saito, Umemoto and Ikeda, (2007) technologies can be categorized as
collaboration technologies that support the creation of personalized knowledge;
dissemination technologies that support the transfer of personalized knowledge, discovery
technologies that support the creation of especially codified knowledge and repository
technologies that support the codified knowledge. Kim and Lee specifically reported a
positive significant effect between employee usage of IT applications and levels of employee
dissemination capabilities for public sector employees’. This finding is amplified by Syed-
Ikhsan and Rowland (2004) who reported that ICT infrastructure allow individuals to create
and disseminate information effectively do contribute to service quality in organizations.
Their study found positive a significant relationship between ICT know how and the
performance of organizations. This study addressed this gap because we cannot appreciate
dissemination efforts without paying attention to technology, and to the impact of technology

33
on the process. And it is against this background that this study considered information
dissemination (communication) and their affect on service quality.
Many factors have transformed the way organizations view information and information
dissemination, but perhaps most pivotal is the dramatically extended reach of knowledge
through new information technology. However, most of the literature reviewed suggests that
technology, particularly ICT, is not service quality is. Technology is a key enabler in
implementing a successful service quality program and strategy. Although technology is an
enabler to service quality, it is still considered as the most effective means of capturing,
storing, transforming and disseminating information.
Referring to the technological dimension, the huge potential of information and
communication technologies (ICTs) to support knowledge transfer has been stressed by many
authors .The current development of ICTs is now increasing opportunities; information can
be captured, codified and stored in repositories, where it can be easily shared, accessed and
used by anyone in the organization .However, the real value of information technology in
supporting service quality schemes is not yet fully understood. The first class is for
information creation such as Computer Aided design systems. The second class is under
office automation systems such as Word Processors and Databases. The third class is
systems that facilitate information sharing such as intranets, internet, group ware, document
management systems, electronic mails and bulletin boards. The fourth class is for information
capture and codification with artificial intelligence technology (Carneiro, 2001).
Organizational scattered data can be integrated through ICT via the network (Hoon, 2003). ,
ICT plays an important role on how the institutions operate, as they can collect and share
innovative ideas from and between every corner of the organization and finally come up with
34
excellent service standards and new processes which can significantly outperform the
competitors (Lin & Wei, 2005). ICT use and information dissemination are closely linked as
ICT enables rapid search, access and retrieval of information and supports communication
and collaboration among organizational employees at the same time overcoming
geographical boundaries (Lin, 2007; Carrillo and Chinowsky, 2006. the use of ICT is likely
to make the internal and external collaboration faster and more efficient. As some of the
benefits of information dissemination include time and lost saving, the use of the computer as
a tool to organize, store, and retrieve knowledge as soon as it is required would be beneficial
towards the organization. In this context, ICT can be considered as a key enabler to
information dissemination within and without the organization in question. Therefore, ICT in
place in revenue service supports information dissemination to both internal individuals and
other organizations.
Effective information dissemination depends on people sharing their information through
computer facilities that users throughout the organization have access to. Bloodgood and
Salisbury argue that IT can be seen as embodying two general capabilities with respect to
information. First, knowledge may be modified into a decision support or expert system by
making it explicit. Second, it helps to keep track of persons with particular expertise and
enabling rapid communication between them (Bloodgood and Salisbury, 2001) With regard
to ICT infrastructure, up-to-date ICT infrastructure will help employees to create, share and
disseminate information within and without the organization.
2.5 Business processes reforms and service quality Reforms in URA were embarked upon in all the departments, this was by revamping, re-
engineering and automation of business processes. For instance the domestic taxes
35
modernization by developing an integrated tax administration mode (ITAS), the customs
introduction of automated system of customs data (ASYCUDA) (URA Modernization,
newsletter, 2007).
Modernization through the process being reengineering aimed at reducing tax administration
costs and compliance thus improvement of the quality of service. The re-engineered
processes provide coherent and transparent systems across the organization (Modernization,
2009). The modernization of URA business demanded adoption of modern, efficient and
effective processes/systems in order to collect tax and customs revenues that meet the set
target of 16 percent revenue to GDP tax ratio by the year 2010.
Organizations often reform to achieve increased productivity, improved quality, enhanced
competitive advantage and success. This is due to reduction of overhead costs, faster decision
making, smoother communication and optimal resource utilisation that result from such
reforms (Decenzo and Robbins, 2002)
A number of corporate bodies have restructured in Uganda including Civil Aviation
Authority(CAA), Uganda Posts and Telecommunications Corporation (UTL), Uganda Hotels
Ltd, Uganda Airlines, Uganda Peoples Defence Forces(UPDF), Dairy Corporation, Uganda
Electricity Board (UEB), Uganda Commercial Bank (UCB), National Insurance Corporation
(NIC),Uganda Revenue Authority (URA) to mention but a few.
According to the International Monetary Fund report (IMF) 2000/01. Uganda’s various
ministries and institutions have been implementing an ambitious and successful program of
macroeconomic adjustments and structural reforms since 1987, with strong support from
multilateral and bilateral creditors and donors. In line with this report similar finding by the

36
International Monetary Fund (IMF) report states that after the restructuring exercise in URA
led to URA structural adjustments like reduced power gaps and provided for clear reporting
lines within the organization which basically implies effective feedback mechanisms thus
better information flow (IMF, 2007).
2.6 Retooling reforms and service quality The literature reviewed indicates employees who are courteous and keen to listen are more
likely to enhance customers’ perceptions of service than those who are rude, inattentive, and
unapproachable. It is apparent that service quality is an integral component of the
management strategy.
The public sector can borrow a leaf from the major driving objectives of the private sector
(such as reducing costs and improving the responsiveness, quality and service aspects of their
operations in an effort to provide a more efficient and effective service) are increasingly
aligning with those of the public sector (Yasin , Wafa and Small, 2001). Public sector
management can therefore learn from the experiences of the private sector, specifically in
relation to customer orientation. Furthermore, the subsequent role and importance of the
service provider in delivering and maintaining quality standards.
In November 2004, URA embarked on a journey to transform herself into an efficient and
successful tax agency. From then URA has recorded significant success in achieving set
targets such as increasing revenue collection, improved customer service and a better
corporate image. Total transformation essentially through modernization of people,
processes, systems and procedures with a view to create a modern tax administration capable
of not only matching but also setting pace in international practices. (URA Corporate strategy

37
2009-2013). The organization also made a number of efforts to improve the general
appearance and ambience of the work place and general operating environment by instituting
what was termed the New Office Concept. This involved having all the offices country wide
with the same furniture and appearance to improve URA’s corporate image. The
transformation has seen URA introduce a number of reforms such as automation, business
process reengineering, corporate image reforms and structural changes. As such revenue
performance has steadily improved with net collections growing from 1923.52bn in 2004/05
to shs 3,662.32bn in 2008/09 (Revenues, 2009).
Like Dyk et al (2001) stated that South Africa is faced with challenges of developing its
people in order to allow them make meaningful contributions thus improved service quality.
URA faces the same challenge to ensure that employees demonstrate an image commiserate
to the desired corporate image they need to be trained and bench marker the best practices.
This is believed to contribute to service quality in organizations as a result of competent
workers; this therefore means that training is becoming a driving force for meeting the
demands for highly skilled workers needed to manage the Organisations. Organizational
success is made through endeavours of individual employee self development initiatives and
the skills that they bring to their work.
Nick and Thacker (2003) argued that many people think that training of any sort will benefit
the company; this assumption is not true. When a training program is developed without
using a training process, disaster usually follows. Such program is likely to be unrelated to
the needs of the company, employees being training or both. The questions are that if training
increases job satisfaction, employee morale, efficiency and reduces labour turnover, then why
trained employee leave organization in numbers. What is the effect of employee leaving their

38
jobs on quality of service delivery? Marrow (2000) establishes that employees who are highly
trained are effective and very committed to the values of the organization thus make
significant contributions to the quality of services offered. Armstrong (2008) contend that
training must have a purpose and that purpose can be defined only if the learning needs of the
organization , the group and individuals have been systematically identified and analysed.
2.7 Summary of the literature review
Majority of the literature has an international character in nature, the views expressed in the
literature offered useful insights into understanding the dynamics between reforms and
service quality. Although the literature reviewed was relevant to the study, there were
knowledge/information gaps identified for instance most of it did not focus on revenue
service therefore the need to undertake a study concerning reforms and their effect on service
quality in Uganda Revenue Authority.
The literature concurs that a number of reforms in various institutions affect service quality.
However the researcher wanted to find out the effect of the various reforms in Uganda
Revenue Authority on service quality. There are a number of limitations in the studies that
influence this current study the previous studies were mainly conducted in the private sector
organizations which influenced the researcher to conduct a study in the public sector of
Uganda. Furthermore most of the studies mainly looked at the perceptions of management
and customers; thereby exclude studies did not consider the views of frontline staff. It can be
argued that management perceptions of organizational service quality practices are likely to
be overstated when compared with frontline employees and customers. This study looked at
views of management and frontline employees as well as external customers

39
Furthermore, a single evaluation of customer satisfaction for each service counter is not
necessarily indicative of the often wide-ranging feedback generated from customer-
satisfaction surveys. In the current study various counters were considered. From the
literature the researcher came across, relationships between automation, retooling/training,
communication and quality of service.
However the results have mostly been established in the private sector/ profit oriented
organizations and most scholars have used mail questionnaire to collect data. This formed the
basis and need to carry out the study in a not for profit setting, in this case the Uganda
Revenue Authority.

40
CHAPTER THREE
METHODOLOGY
3.1 Introduction
This chapter focuses on how the study was conducted. It describes the research design that
was adopted for the study, study area, study population, methods and techniques used to
determine the sample size, sampling method and procedure, data collection methods,
instruments used to collect the data, test their validity and reliability, measure the variables of
the study and data analysis.
3.2 Research Design
The study adopted a cross- sectional, corelational case study which according to Amin
(2005:212) is perhaps the most commonly used research method in social sciences and is
used to gather data from a sample of the population at a particular time. A correlation design
enables a researcher to analyze the relationship between two or more variables (Orodho and
Kombo, 2002). The study also used both the quantitative and qualitative research approaches
since they are seen to supplement each other. The quantitative approach was used to provide
hard data while the qualitative approach provided the in-depth explanations needed to answer
the research objectives and to test the hypotheses (Mugenda and Mugenda, 2003). Punch
(2000) puts emphasis on the use of both qualitative and quantitative approaches noting that
none of the two can exhaustively answer all the research questions.
According to Mugenda and Mugenda (1999) the two designs supplement each other (hard
data and in depth explanation) the element of bias was reduced, as each validates the other.

41
The quantitative design involved the administration of structured; -questionnaires developed
in order to capture the feelings and attitudes of respondents. This was appropriate as it was
cheaper and time saving to administer. The questionnaires provide first hand information
from the selected respondents (Kakooza, 2002). While the qualitative data collection
involved use of semi-structured interview schedules that were administered to top and middle
managers. The design was appropriate because it provides exact words from the interviewees,
about their experiences and interaction in relation to the variables in the study (Mugenda,
2000).
3.3 Study Population
The study was conducted from URA Kampala based offices of Kampala East, Kampala
South, Kampala Central, Large Taxpayers Office, Medium Tax Payers’ Office Objections,
Appeals Management and Internal Audit Department. The study population consisted of
managers, supervisors, officers of URA and top 100 taxpayer representatives in the Domestic
Tax, Corporate Services, Internal Audit and Compliance departments as these are the people
who mainly interact with audit firms. Total population of study was three hundred twenty.
3.4 Sample size and selection
According to Sekaran (2003), sampling is a process of selecting a sufficient number of
elements from the population made to make it possible to generalize such properties to the
entire population. The researcher used a stratified sampling method because there were
various strata identified in the population of study. The strata were developed from available
staff registration list. Following the list the researcher used simple random. The method is
also easy and less costly as compared to other methods.
Using Krejcie and Morgan’s (1970) table of sample selection adopted from Amin (2005), 175

42
respondents were appropriate for this population.
The table1: Structure of the study population sample and categories
(Factor 175/320*)
Source of template: Krejcie and Morgan (1970) adopted from Amin 2005
Every category was proportionately represented from the total population. All respondents
were randomly chosen using simple random sampling. The names were written on pieces of
papers, which were folded and put in 4 separate boxes representing the categories above.
Thereafter the researcher picked one by one without returning them up to the sample needed
from each category.
The qualitative data was obtained from the top managers who were purposively selected.
These were the heads of sections, from which the researcher hoped to obtain information on
the quality of service. A total of 10 interviews were conducted.
3.5 Data collection Methods and tools
Data for the research was derived from both primary and secondary sources. Primary data
was obtained from self administered closed and semi structured questionnaires, observation
Population strata Study population Proportionate sampling
Sampling technique
Managers 13 7 Simple Random
Supervisors 37 20 Simple Random
Officers 170 93 Simple Random
Taxpayers 100 55 Simple Random
Total 320 175

43
and interviews. While secondary sources included internal and external documents like
circulars, URA magazines such as revenues, policy documents, media and websites.
3.5.1 Self-administered Questionnaire method
Quantitative data was collected using a self-administered questionnaire. The questionnaire is
an efficient data collection method which has advantages of high complete responses within a
short period. Use of questionnaire also allowed the respondents’ time to reflect on answers to
avoid hasty responses (Mugenda and Mugenda, 2003).
The questionnaire was administered on all the four variables of online boost, information
dissemination (communications), business processes and corporate image reforms.
The researcher administered 175 questionnaires which where personally administered
questionnaires; these were constructed basing on 5 point Likert scales. A few open ended
questions were also included in the questionnaire (Appendix 1) to ensure response clarity and
consistency (Hussey, 2002).
3.5.2 In-depth Interviews method
Qualitative data was collected using interviews. The method of interviewing is used to
collect information that cannot be directly observed. It also helps the researcher to gain
control over the line of questioning. Qualitative data was obtained through interviewing
purposively selected respondents to supplement the data gathered through quantitative
sources. After receiving respondents’ replies to the questionnaires, the researcher conducted
interviews with respondents with firsthand knowledge on institutional reforms. This was
face-to-face interaction between the researcher and interviewees/middle managers, using a
predesigned interview schedule. The interviews composed of open ended questions, this was
to allow free expression and establish original perceptions. The interviews lasted twenty

44
minutes each. Notes of interviews were taken following Ghauri and Gronhaug, (2002).
The interviewer also made account of non verbal communications such as the attitudes and
behaviours of the interviewee. Interviews were on business processes, communication and
corporate image reforms.
3.5.3 Observation method
To identify how services are offered, courteousness, overcrowding at the service centres, the
researcher physically inspected the various counters to ascertain the state of affairs as regards
service quality for instance courtesy of staff while serving, the office lay out, facilitation,
numbers of staff at service centres, how customers were attended to by the front desk
personnel.
3.5.4 Document Review Method
The researcher collected secondary data from documentary review from reading dissertations,
journals text, Newsletters and internal memos. The documentary review assisted the
researcher to reconstruct study variables and provided an in-depth understanding of the
variables under study in comparison to the study area.
3.6 Data collection instruments
The following research instruments were used to collect data.
3.6.1 Questionnaire
The data was collected using a self-administered questionnaire and interview guide.
Questionnaires are used to obtain information about the population and ensure a wide
coverage of the population in a short time (Kabanza, 2001). A closed-ended structured
questionnaire was used to capture data on URA reforms of online boost, information
dissemination (communication), business processes and corporate image. The structured

45
questionnaire was considered appropriate as it helps respondents make quick choices thereby
saving time as well as helping the researcher to code the information quickly for analysis
(Sekaran, 2003; Mugenda and Mugenda, 2003).This was also supported by Amin (2005) who
affirmed that a questionnaire offers greater assurance for anonymity especially when
handling sensitive issues in organizations like URA. The respondents were asked to respond
to how strongly they agreed or disagreed with a series of statements on a five-point Likert-
type scale (ranging from 1 = strongly disagree to 5 = strongly agree).
3.6.2 Interview guide
An interview guide consisting of unstructured questions was used for the case of the in-depth
interviews with key respondents to gain interviewees’ point of view. The unstructured
interview guide comprised of eleven (11) open ended questions that were posed during the
face – to- face interviews. The use of the interview guide allowed the collection of important
information.
3.6.3 Observation guide
To identify how services are offered, courteousness, overcrowding at the service centres, the
researcher used an interview guide to ascertain how the various counters to analyse the state
of affairs as regards service quality for instance courtesy of staff while serving, the office lay
out, facilitation, numbers of staff at service centres, how customers were attended to by the
front desk personnel.
46
3.6.4 Document Check list
Secondary data from documentary review from reading dissertations, journals text,
Newsletters and internal memos. The documentary check list aided the researcher in
obtaining data from the URA news letter and electronic journal at the URA website.
3.7 Validity of the instrument
Validity of a data collection instrument refers to the appropriateness of the instrument to
measure a variable or construct and come up with the intended results (Amin, 2005). This
can be done using construct, face and content tests. For this study, content and face validity
was used to test the instruments. To establish content validity, the researcher employed four
(4) judges (in these case respondents) in pre-testing the instruments. The results of the
observations made after customers were analysed a few adjustments were made according to
the comments from the selected respondents.
Amin (2005) is of the view that the research instruments must be pre-tested to ascertain their
reliability and validity before actual research is carried out. He argues that validity refers to
the appropriateness of the instrument while reliability refers to the consistency in measuring
whatever the instrument is intended to measure. Sekaran (2003) emphasizes the measure of
variables by testing the reliability and validity of the research instrument.
3.8 Reliability
The questionnaires were tested for completeness and accuracy using an alpha cronbanch’s
test of more than 0.7. (See table 2).

47
Table 2: The Reliability coefficient variables computed were as follows:
SN VARIABLE RELIABILITY Number of items
1 Automation .878 11
2 Structural .930 12
3 Retooling .836 15
4 Service Quality .862 14
The researcher pre-tested the questions on ten purposively sampled members of staff of
selected organization outside the researcher’s place of work to ascertain the consistency in
measuring variables.
3.9 Data Analysis:
The raw data from the research instruments was organized, cleaned and edited to eliminate
errors. Data was then assembled and arranged with a systematically comparable data
according to research objectives. Data analysis was done through tabulation to generate
frequency tables used to summarise data in a more simplified and easily understandable
manner. The data was then analysed using statistical package for social science program
(SPSS) and tests of hypotheses generated were carried out.
3.9.1 Procedure of statistical analysis
3.9.2 Technique number one: Factor analysis technique
Factor and reliability analyses were first computed and emerging results examined. Factor
analysis as a generic term for a family of statistical techniques concerned with the reduction
of a set of observable variables in terms of a small number of latent factors is heavily relied
on in testing the various hypotheses postulated in the study, and using its output, the
researcher then used multiple regression analyses to assess the degree to which the

48
independent variables explained the variations in the dependent variable.
Researchers have given guidelines for the minimum sample size needed to conduct factor
analysis and this study met these guidelines. The recommendation for the ratio of sample size
to number of variable as a criterion: the recommendation range from 2:1 through 20:1. Others
have suggested a minimum sample size of 100 to 200 observations (Guadagnoli and Velicer
1988). Such authorities found that absolute sample size was more important than functions of
sample size in determining stable solutions as small sample sizes may affect the factor
analysis by making the solution unstable and the addition of more data may cause the
variables to switch from one factor to another. In this study, factor analysis was used
following a set of recommended steps:
Step 1: Preparing Data
This study used exploratory factor analysis to verify whether the above variables and their
respective indicators as elaborated in the conceptual framework in chapter one could be
confirmed by the collected data.
Exploratory factor analysis allowed the possibility to test very specific hypotheses regarding
the number of factors, factor loadings, and factors inter -correlations. The study considered
several important questions while preparing input data for factor analysis as recommended by
authorities on this technique. Firstly, what variables were to be included in the analysis.
Factor analysis was designed to explain why certain variables are correlated both in the
dependent and independent clusters. Moreover, common factor analysis is concerned only
with that portion of total variance shared by the variables.
Secondly, was the question of how many variables were to be included and retained? Factors

49
are grouped according to what they measure and variables that can be inferred from a set of
observed variables.
Step 2: Selecting a factor model and determining the number of factors
Once the data input was prepared for the analysis, it was necessary for the study to decide on
a factoring technique, that is, a method of extracting factors. The study opted for principal
component analysis because of its wide usage. Thus the researcher used the “Eigen values
greater than one” rule which has been most commonly used due to its simple nature and
availability in various computer packages. The rule states that the number of factors to be
extracted should be equal to the number of factors having an Eigen value (variance) greater
than 1.0. The rationale for choosing this particular value is that a factor must have variance at
least as large as that of a single standardised original variable. Another criterion that was used
in this study was related to the latent root criterion, and this was the percentage or proportion
of the common variance criterion (defined by the sum of commonality estimates) that is
explained by successive factors.
Additionally the scree plot criterion was used to determine the number of factors to retain.
This was used to compliment the above technique. Using SPSS programme, plotting the
Eigen values against the corresponding factor numbers gave us insight into the minimum
number of factors to extract. The Scree option in the SPSS produces a scree plot that
illustrates the rate of exchange in the magnitude of the Eigen values for the factor. Figure 2
below illustrates this approach.

50
Figure: 2 Scree plots of factors.
The study also used the interpretability criterion for determining the number of factors
extracted. Factor solutions were evaluated not only according to empirical criteria but also
according to the criteria of theoretical meaningfulness. The use of face validity is
recommended. Those factors that had a high correlation but were not theoretically fitting
were deleted. An appropriate mix would always be made to consider factor loadings that have
grave impact on the above three and some would be maintained until an acceptable level was
found. Using the varimax rotational method.
Once the factors had emerged, those with significant loadings were assigned some meaning
based on the patterns of the factor loadings. To do this it was necessary to examine the

51
significant loadings for each factor. The larger the loading the more important.
Table 3: Factor and Reliability Analysis Results for the Institutional reforms (IV) and
Quality of Service (DV): Scale (N=116)
According to Mugenda and Mugenda (1999), in a research study, the reliability co-efficient
can be computed to indicate how reliable data are. A coefficient of .80 or more implies that
there is a high degree of reliability of the data the factors were renamed because these were
now different grouping from the original variables of automation, structural reforms and
retooling reforms. The new variables were renamed as online boost, information
dissemination (communication), business process and corporate image.
Statistical Technique number two: Regression analysis
In order to test the various hypotheses postulated in the study, using the output from the
factor analysis as described above, the researcher conducted multiple regression analyses.
Using this statistical approach, it was possible to test how institutional reforms contributed to
I tem Factor Number of items Cronbach’s Alpha
1 Internet facility 5 .873
2 Web portals 5 .839
3 External communication 6 .803
4 Internal communication 5 .757
5 Business processes 10 .965
6 Service Quality 8 .872
7 People reform 2 .859
8 Working Environment 2 .733

52
service quality in URA. Regression is a technique used to predict the value of a dependent
variable using one or more independent variables. In this case various reforms were tested
against each other.
Statistical Technique number three: Analysis of variance (ANOVA)
Analysis of variance (ANOVA) as a data analytic technique based on the idea of comparing
explained variance, by a comparison of the coefficient of determination with the coefficient
of alienation was also used.
3.10 Quantitative Data Analysis
Quantitative data presentation, analysis and interpretation were conducted on the data by
coding, sorting and interpretations drawn. The researcher carried out a scrutiny of the
captured data to ensure consistency and completeness of questionnaires. Quantitative data
generated from the questionnaire was edited with the view of checking for completeness and
accuracy during data collection and then entered into that statistical package for social
sciences (SPSS) program which was used to do that generated the descriptive, correlation and
regression analyses. Percentages were used for summaries and easy assessment. Percentages
for frequency distribution and proportions and descriptions were used to reflect frequency
applied. Pearson correlation coefficient was used to establish relationship between the
dependent and the independent variables (Mugenda and Mugenda, 2003).
In order to carry out statistical tests of significance, the level of confidence was pre-tests at
0.01(2-tailed).
Bruce (2004), states that statistical test is predicted to be accrued for a certain percentage of

53
the population. Thus a finding at 0.05 and 0.01 levels suggests that the researcher has
confidence that is 95 times and 99 times respectively out of 100, these same results will be
obtained with a similar population. The regression co-efficient analysis was used to examine
the relationship of dependent variable (response variable) to specified independent variable
(predictor variable).
3.11 Qualitative Data Analysis
The data collected using interview and guide and documentary reviews was edited and
systematically organized in a manner that facilitated further analysis (Mugenda and
Mugenda). It was summarized in categories according to main themes based on the variables.
This was helpful in further understanding the explanations for responses under quantitative
questionnaires and in drawing up conclusions for the study. Qualitative strategies usually
focus on identifying frequencies of phenomenon. This is usually subjective, rich and in-depth
descriptions presented in a thematic manner. The researcher carried out a thorough review of
the scripts looking for similarities and developed themes related to the variables of study. The
findings from the qualitative data were used to reinforce the quantitative data derived from
questionnaires.

54
CHAPTER FOUR
PRESENTATION, ANALYSIS AND INTERPRETATION OF FINDINGS
4.1 Introduction
This chapter presents the findings of the study in relation to the purpose of the study. The
study purpose was to examine reforms in URA conceptualised as on-line boost,
communication, business processes and corporate image and how they affect the quality of
service. The chapter presents the response rate, demographic characteristics of the
respondents and data according to objectives.
The data collected under the four objectives are presented in two sections where section one
presents information on the background characteristics of respondents, while section two
presents results on the objectives of the study. The findings are presented using descriptive
statistics to describe the basic features of data providing summaries, graphs of frequencies
and percentages, correlation analysis using the Pearson correlation coefficient, in order to
determine the relationships between the key variables of institutional reforms and service
quality. Regression analysis was used to ascertain the institutional reform factors that are
significant in predicting service quality. The chapter is arranged from response rate, socio
economic features of respondents’ information, factor analysis reliability of the factors, and
then, inferential statistics, that is correlation and regression analyses as well as interpretations
of the results.
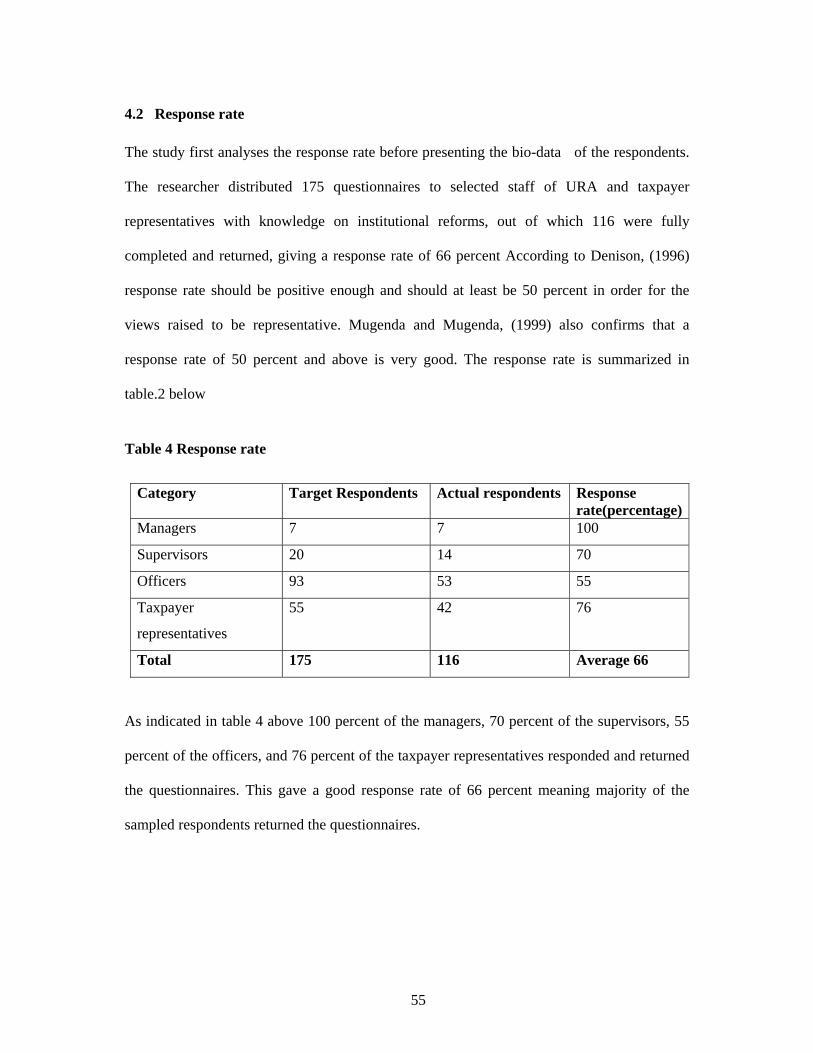
55
4.2 Response rate
The study first analyses the response rate before presenting the bio-data of the respondents.
The researcher distributed 175 questionnaires to selected staff of URA and taxpayer
representatives with knowledge on institutional reforms, out of which 116 were fully
completed and returned, giving a response rate of 66 percent According to Denison, (1996)
response rate should be positive enough and should at least be 50 percent in order for the
views raised to be representative. Mugenda and Mugenda, (1999) also confirms that a
response rate of 50 percent and above is very good. The response rate is summarized in
table.2 below
Table 4 Response rate
Category Target Respondents Actual respondents Response
rate(percentage)Managers 7 7 100
Supervisors 20 14 70
Officers 93 53 55
Taxpayer
representatives
55 42 76
Total 175 116 Average 66
As indicated in table 4 above 100 percent of the managers, 70 percent of the supervisors, 55
percent of the officers, and 76 percent of the taxpayer representatives responded and returned
the questionnaires. This gave a good response rate of 66 percent meaning majority of the
sampled respondents returned the questionnaires.

56
4.3 Background information of respondents
The study involved respondents of varying characteristics which enabled the researcher to
obtain the necessary background information on the respondents. The characteristics of the
respondents investigated included sex, age, experience in the organization and current job
title. The background variable about the respondents helped the researcher to know how
respondents were acquitted with the study area specifically the variables under investigation.
4.3.1 Length of stay with the organization
The study sought information on the number of years the internal customers have stayed with
URA. This was an important element to define the ability of the respondents to raise
appropriate responses on study variables. .
Table 5: Length of stay with URA Number of Years in service Frequency Percentage
1-5 36 48
6-10 13 18
11-15 19 26
16 and above 6 8
Total 74 100
The results indicate in table 5 show that the biggest number of the respondents thirty six (48
percent) have spent less than six (6) years in the organization, thirteen (13) that is (18)
percent between 6-10 years, nineteen (19) (26) percent have been in the organization for 11-
15 years and only six (6) that is eight (8) percent have been in the organization for more than
sixteen years.

57
Thus the biggest number of respondents was relatively new respondents to the organization,
this suggests that most of the staff seem to have joined the Authority after 2004 when the
restructuring took place and new staff had to be recruited to fill the gaps in order to enhance
service delivery. This could also indicate that there could be a high labour turns over in the
organisation. It also implies that as several staff members join the organisation, there is need
to train them on quality assurance. This may affect the quality of service, as new people come
into the organization they require some time to start performing hence quality being impinged
on, which may inevitably affect the image of the organisation.
4.3.2 Sex of the respondents
The study wished to find out the gender distribution of the respondents. The findings are
presented below as follows:
Figure 3: Gender of respondents
The figure 3 shows that, majority 59(51 percent) of the participants were male as compared to
females who were 57(49 percent) of the total participants of the study. The number of male

58
respondents was slightly more than female respondents but largely there was proportionate
participation of both men and women, thus the study represents views from both male and
female at different levels. This implies that the organization is an equal opportunity
employer. Therefore the research findings are not prejudiced by gender perspectives hence
balanced views were obtained.
4.3.3 Age of respondents
The age of an individual quite often has a bearing on his/her level of thinking and perception.
In this regard, the study sought to obtain information on the age distribution of the
respondents, with a view of establishing the differences in views and opinions as a result of
age differences, the results of which are presented in table 6 below.
Table 6: Age of respondents
Age category in years Frequency(f) Percentage (%)
Below 30 50 43
31-40 42 36
41-50 23 20
Above 50 1 1
Total 116 100
Majority of the respondents 50 (43 percent) were below 30 years thus the organization
employees quite young people as compared to only one respondent who was over 50 years,
42 that is 36 percent of the participants were between 31-40 years while 23 about 20 percent
of them being between 41-50. This could partly explain the improved quality of service
because young people tend to be faster and quick as compared to older people. The clients
were seen to be serviced with efficiency and courteousness.
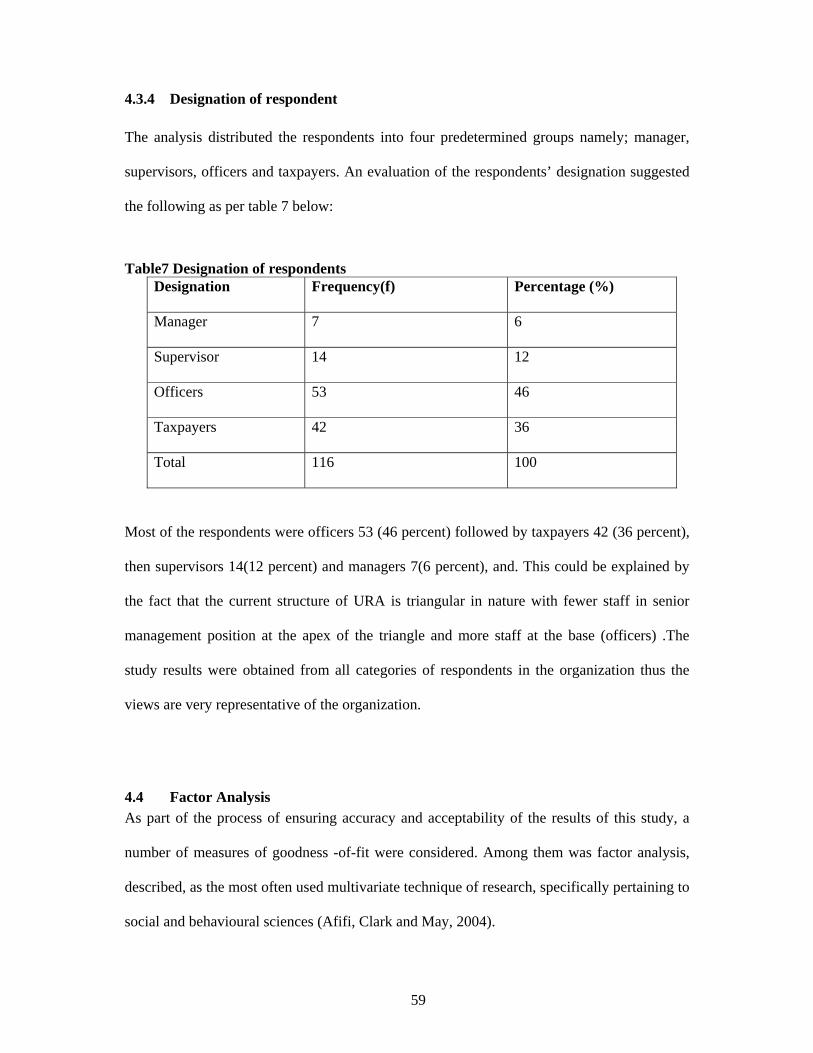
59
4.3.4 Designation of respondent
The analysis distributed the respondents into four predetermined groups namely; manager,
supervisors, officers and taxpayers. An evaluation of the respondents’ designation suggested
the following as per table 7 below:
Table7 Designation of respondents
Designation Frequency(f) Percentage (%)
Manager 7 6
Supervisor 14 12
Officers 53 46
Taxpayers 42 36
Total 116 100
Most of the respondents were officers 53 (46 percent) followed by taxpayers 42 (36 percent),
then supervisors 14(12 percent) and managers 7(6 percent), and. This could be explained by
the fact that the current structure of URA is triangular in nature with fewer staff in senior
management position at the apex of the triangle and more staff at the base (officers) .The
study results were obtained from all categories of respondents in the organization thus the
views are very representative of the organization.
4.4 Factor Analysis As part of the process of ensuring accuracy and acceptability of the results of this study, a
number of measures of goodness -of-fit were considered. Among them was factor analysis,
described, as the most often used multivariate technique of research, specifically pertaining to
social and behavioural sciences (Afifi, Clark and May, 2004).

60
It is a powerful statistical procedure, often used to validate hypothetical constructs and
attempts to cluster those indicators or characteristics that seem to correlate highly with each
other. It is used as a data reduction technique to identify a relatively small number of factors
(Constructs) from a set of many interrelated variables for confirming hypothesized construct
(Amin, 2005). The technique allows the researcher to group variables into factors based on
correlation between variables and factors so derived may be treated as new variables (often
termed as latent variables). The meaning and name of such variables is subjectively
determined by the researcher as suggested by Kothari (1999).
The findings suggested the use of factor analysis to investigate any separate underlying factor
and to reduce redundancy of certain questions. The Kaiser-Meyer-Olkin measure of sampling
adequacy (KMO) of 0.776 and the Bartlet’ Test of sphericity approximated chi-square of
3.186E3, P= 0.000 indicated that the data satisfied the assumptions of factorability. Principle
component factor analysis was chosen as the method of extraction in data using minimum
number of factors. A nine factor solution was extracted with Eigen values of 19.256, 18.152,
10.414, 5.797, 4.7, 3.73, 3.4, 3.333 and 2.5 all these factors account for 72 percent of the total
variance.
These are the core and peripheral attributes pointed out in the conceptual framework and
required by the research objectives and research questions in chapter one. All the 58
variables considered to be the institutional reforms were subjected to this technique, and the
results are presented in the table below;

61
Table 8: Summary of factor loadings for reforms and Service quality in URA
Items 1 2 3 4 5 6 7 8 There is an improved objections handling. .936 -.085 .075 .016 .096 .023 .066 .017 Appeals against assessments are handled on time. .933 -.036 .129 -.014 .096 .076 .001 .067 Refund of taxes is done on time .930 -.001 .032 .024 .072 .089 -.038 -.065 Recovery of un paid taxes is effective. .928 -.031 .057 .064 .063 .072 -.034 .013 Audit processes by URA are clear. .918 .032 .073 .022 -.069 -.009 -.009 .051 Communication process is transparent. .913 .006 .088 -.003 .045 -.010 .036 -.001 On-line payment process has improved on speed in payments of due taxes. .773 -.146 .141 -.022 -.011 -.076 .108 -.146 Training in taxpayer education has improved. .757 -.102 .105 -.070 .094 -.087 -.049 .136 Payments online reduced on congestions at the service counters. -.022 .825 .058 .132 .163 .129 -.058 -.125 Returns can now be submitted on line at taxpayer premises. -.009 .795 .067 .200 .017 .124 -.165 -.209 Customer accounts can now be accessed online without the taxpayer coming to URA offices. -.110 .718 .062 .199 .285 -.190 .095 -.104
Access channels to the web Portal are available 24 hours. -.067 .672 -.037 -.003 .023 -.101 .115 .206 Information about online facilities. -.097 .644 -.044 .096 .256 -.056 .179 .140 Internet has facilitated taxpayer’s business with URA running. -.123 .629 .026 .155 .061 -.378 .174 .171 Client engagements with URA have reduced due to automation. -.023 .598 -.163 -.036 .066 -.081 .021 .552 Customer movements to and from URA (turn around) has reduced. .057 .555 -.319 .261 .126 -.095 .110 .156 Tax information availability on the web has increased. -.047 .509 .108 .409 -.110 .233 -.164 .221 Service reliability in URA has improved. .147 -.034 .873 -.002 .022 .066 -.117 .058 Customer concerns are easily handled on line without any obstacle. .189 -.020 .859 -.066 -.087 .088 .129 .040 URA staffs entertainment of customers has improved as compared to the past. .200 -.081 .789 .090 -.014 .160 .147 .010The bringing together of services has been enhanced by the systems in place. .046 .138 .702 -.065 .081 -.002 .270 -.142

62
Taxpayer’s feedback to URA has greatly improved. .022 .234 -.054 .840 .055 -.053 -.081 .157 Information delivery to clients by URA has been facilitated. .003 .174 -.021 .734 .269 .002 -.135 -.104 Flow of information from URA to taxpayers is reliable. .112 .107 -.041 .663 .318 -.040 .048 .030 Information reaches the intended recipients on time. -.147 .340 -.077 .537 -.043 -.221 .391 .056 Materials are easily accessible on the web Portals. -.034 .399 .027 .447 .022 .003 .034 .230 Communication of tax amendments to taxpayers is adequately done. .069 .018 -.006 -.010 .832 .015 -.034 .135 Information flow from customers to URA is reliable. .100 .214 .015 .204 .699 .117 -.104 .245 There is Taxpayers ease of access to information by the various changes. .122 .266 .018 .263 .686 -.079 .117 -.148 Information flow from URA to taxpayers is adequate. .103 .260 -.048 .079 .543 -.067 .162 .052 Ambience of URA offices has greatly improved the public Image of the Organization. .065 -.091 .112 -.041 -.012 .761 .321 .051 There is always Network availability at the service points. .008 .069 .444 .068 .055 .623 -.031 -.224 Returns submission process in URA is possible electronically. .384 .175 -.203 .240 -.086 -.422 .144 -.218 Staff courteousness has greatly improved. .065 .088 .453 -.120 .050 .172 .692 .003 Staff loyalty to service is evident in the way of serving customers. .082 .056 .537 -.053 .039 .185 .678 -.096 Customer expectations are met by URA. .114 .047 -.009 .349 .262 -.083 -.207 .623 Web portal materials are simplified to be understood by clients. .088 -.004 .092 .410 .376 .159 .087 .445 On line/internets facilitates customers business. -.060 .318 -.335 .211 .234 -.339 .247 .400 Extraction Method: Principal Component Analysis. Rotation Method: Varimax with Kaiser Normalization. a. Rotation converged in 13 iterations.

63
As can be seen from table above, the survey instrument had a list of thirty eight (38) items
that measured as a predictor variables and service as the predicted variable. The initial
conceptualization of quality as had three (3) variables. The four (4) dimensions were
generated after carefully assessing the measures of institutional reforms. Using the
knowledge and conceptualization from the above four dimensions were named as online
boost, information dissemination (communication), business process and corporate image
improvement. The instrument was subjected to exploratory factor analysis. The factor
analysis computation using varimax rotation of all items constituting the different dimensions
returned a total of nine principle components which were subjected to reliability test.
Considering the distribution of the factors above, URANET is loaded with the highest
number of loadings (09) followed with business processes (08), communication (05),
External information flow, staff competence, and web facility and working environment in
the order.
Generally the loadings were quite strong for each of the attribute measures and, as such,
indicate good internal consistency among the items within each dimension and indeed within
the instrument as a whole. As outlined in table 7 above they range from 0.554 to 0.907 across
groupings. This means that the factors loading ratings varied in the various ways and
numbers of items distributed in a similar category measuring the same thing.
Factor analysis was carried out on data collected from 74 staff and 42 taxpayers. The method
of extraction was principal components analysis. Forty one items, encompassing the main
themes from the data, were extracted accounting for 72 percent of the variance in quality
service. The factors were: business processes with eight (8) items, URANET with nine
(9)items, external information flow with five (5) items, communication with four(4) items,

64
working environment with two (2) items , staff competence with two (2) items, web Portal
with three(3) items all contributing to quality service with four (4) items. This implies that
URANET and business processes had the highest number of items and the relationship to
service quality was based on these items.

65
Figure 4: The Modified conceptual frame work
I.V Institutional Reforms D.V Service Quality
Source: Factor analysis by the researcher
The four Hypotheses of study were reformulated after factor analysis from as follows:
H1 = There is significant positive relationship between Online Boost and Service Quality in
Uganda Revenue Authority.
H2 =There is significant positive relationship between information dissemination
(Communication) and Service Quality in Uganda Revenue Authority.
H3 = Business processes reforms significantly affect service quality in Uganda Revenue
On- line Boost • URA wide area network( URANET) • Web portal facility
Business Processes • Customs Business processes • Internal Business processes
Information Dissemination (Communication) • Internal Communication • External Communication
Service Quality
• Reliability
• Accessibility
• Efficiency
• Effectiveness
Corporate Image. • Working Environment
• People transformation

66
Authority.
H4 = There is a significant positive relationship between Corporate Image and service quality
in Uganda Revenue Authority.
4.5 Empirical findings
Each objective was twofold; on the one hand the study investigated the perceptions of the
respondent about the independent variables of online boost, information dissemination,
business processes and corporate image reforms and the dependent variable of service
quality. On the other hand it investigated the relationship that exists between these variables
and service quality. This part of study presents results in line with the research objectives that
guided the study. The presentation indicates the verification of the research objectives and
presents views of the respondents as from the face to face interviews along with the
descriptive statistics of percentages and frequency distribution.
4.5.1 Online Boost and service quality in URA
Under objective one of the study, the researcher aimed at establishing the extent to which on
line boost conceptualized as wide area network (URANET) and web portals contributes
service quality in URA. Findings were obtained from the close ended questionnaires to the
selected sample that provided quantitative data and face to face interviews of key informants
(seniors like assistant commissioners and managers) that provided qualitative data.
In order to gauge the effect of online boost on service quality, the researcher endeavoured to
analyse the descriptive statistics on online boost and service quality. The researcher further

67
ascertained the relationships between online boost and service quality using the Pearson’s
moment correlation. In addition a regression analysis was used to predict which of the
elements of institutional reforms affect service quality. The table 9 below shows the results of
the study in regard to online boost and service quality a URA.
Table 9: Summary of the effect of online boost on service quality Agree
(percentages) Disagree
(percentages) SN Items SA A NS D SD
1 URANET has greatly improved the quality of service
40 45 4 6 5
2 URANET has facilitated inquiry handling by URA to customers.
21 32 19 22 7
3 URANET facilitation of networking among customers.
23 37 14 14 7
4 Customer engagements on the Web Portals have reduced on movements to and from URA.
16 27 24 22 10
5 Web Portal Usage Has Led To reduction in Turnaround time
21 32 28 16 3
6 URA has sufficient computer in place to facilitate serving customer.
24 37 13 20 20
7 I haves adequate Knowledge of online usage.
33 42 8 11 7
8 An online submission has eased by the systems in place.
44 39 10 10 3
9 Online payments being possible. 40 37 11 7 5 10 Online facilities are simplified to
me being enabled electronically. 37 39 10 10 5
MEAN 30 37 13 14 7 MEAN 70 21
Key: SD = Strongly Disagree; DA = Disagree; NS = Not Sure; A = Agree; SA =
Strongly Agree.
The researcher ascertained views on whether URANET has facilitated handling of customer
complaints, 53 percent of the respondents agreed, 29 percent disagreed and 19 percent were
not sure. When the views were obtained on how internet facilitate networking internally and
externally, majority of the respondents 60 percent agreed, 21 percent and 19 percent were not
sure. Thus majority of the respondents acknowledged that URANET has facilitated

68
networking, with a likelihood of increasing the number of customers being served hence
efficiency and effectiveness.
A number of equipment were sited at various premises for instance mobile scanning
machines which were said to greatly reduce on physical verification of goods, cases of
smuggling and false declaration of goods at customs stations. This was believed to improve
on service quality. In an interview with one staff it was discovered that mobile scanners can
scan 18 containers per hour, has digital display for details of scanned image space for four
officers, can detect illicit and contraband goods, fully equipped with flat screen modern
computers, air conditioned interior rooms and sound proof rooms This implies that there is
timely and efficient service to customers. From the participant observations it was found out
that all the offices visited were quite computerised with visibly new computers installed and
almost the computer staff proportion was 1:1. Every staff had a computer at the desk in
addition to some having two sets of computer sets a laptop and a desk top. This suggests that
more customers can be served as compared to service using manual means, thus leading to
less time spent on a customer thus improved service quality and this is an improvement in the
area of availing staff with tools to serve customers better.
Physical engagements between URA officials and the taxpaying community assumed to
result from having no alternative effective communication. On whether physical engagements
have reduced as the result of usage of internet facility, the majority of the respondents 43
percent agreed, 33 percent disagreed and 24 percent were not sure. This implies that majority
of the respondents that is 57 percent did not see any improvement in service quality at URA
resulting from online boost. A bigger percentage of respondents still engage with URA staff
physically. Interviews with clients suggested that online transactions are helpful to some

69
customers. As noted by one of the clients;
.... I can now transact business any where any time without visiting URA service centre, this
is quite possible due to the online facility available 24 hours service with service centres
open this is a big improved registered by URA.. Asserted one client.
The web portal facility was assumed to be reducing turnaround by way of movements to and
from URA. Indeed the majority of the respondents (53 percent) agreed that there is reduced
turnaround, 19 percent disagreed and 28 percent were not sure if it is the case. Web portals
are usually used by external clients to transact business or obtain information. Although
customers seem to interact with URA staff physically, the times with which they interact with
staff are few. This is because the channels of obtaining information about URA services are
increasingly getting clear. On whether the access channels are clear, 61 percent answered in
affirmation, 26 percent disagreed and 13 percent were not sure of the situation prevalent. This
means that URA staff members spend less time interacting with a customer with a likelihood
of serving several customers than before. This may suggest that there is more time for staff
spends. The interviews further indicated that web portal services are already being utilised
by the customers especially for electronic filing and payment. This has led to reduced turn
around by the clients hence an improved service quality. This is because the system can
verify every transaction, accuracy, correctness before the system accepting receipt of a
transaction thus leading to efficiency and timely service delivery.
Regarding the knowledge on various services available on line, findings were 75 percent
agreements, 18 percent disagreements and 8 percent not sure. These findings indicate that the
majority of the respondents are knowledgeable about online boost. In addition data about
online submissions resulting from on line boost indicated majority 83 percent agreements, 8
percent disagreements and 10 percent not sure. The results show that the majority are able to

70
perceive that the facility is user friendly. This means online boost has made the service
quality very effective and efficient at URA. More so trade facilitation in customs has further
been boosted by the initiation of a working relationship between customs of Kenya and
Uganda in what has been termed as Radex systems (Simba + Asycuda); this has enabled
traders to clear goods much faster.
The researcher solicited views on some transactions on line. For instance on payments online
and how effective and user friendly it is, the findings show that 77 percent agreed that these
are effective and user friendly, 12 percent disagreed and 11 percent not sure. User-
friendliness of the online facilities is vital to the external customers in order to reduce delays
in service delivery. The views from the respondents on whether they are able to obtain their
account balances online without visiting URA show that, 76 percent (majority) agreed that
they easily obtained their tax balances online,15 percent disagreed and 10 percent not sure.
Interviews with clients further revealed, that on line boost improves efficiency in service
delivery. There are no longer delays and crowding at the counters as most of the clients now
transact business from their premises online. This has led to improvement in the speed of
serving customers as compared to the time when clients had to crowd at the counters waiting
to be served. More so, the researcher tested on line services by applying on line for a tax
identification number which she was able to obtain online without moving to and fro which
was the case before the online boost by efficiency and accessibility to service has increased
due to implementation of the e-tax at most of the Kampala based offices. This implies that the
quality of service has to a great extent improved.
Various respondents highlighted these achievements as a transformation move as the
URANET has been critical key in registered improvement as noted by one of the

71
respondents,
.......”There is always online dialogue on various challenges faced at individual level
and the Uganda Revenue Authority staff avail practical solutions and possible interventions
that usually work....as such the staffs are able to share and inquire amongst themselves online
through the use of the URANET”
The visible improvement in the area of online boost can be attributed to its strategic
importance in the corporate plan with the goal of modernising URA’s systems and processes
through its people aims at transforming URA into a modern and client focused tax
administration.
The descriptive distribution of results showed that the relationship between URANET and
quality of service is based on comparison of the respondent’s perception towards a number of
variables. That the implementation of the URANET has greatly led to improvement in the
quality of service. The above statistics indicate that on average from, 69 percent of
respondents agree that online boost facilitates service quality, 21 percent disagrees and 13
percent were not sure. This suggests that the use of URANET reduces on the number of
times the clients would visit URA counters hence the staff can now concentrate on their work
thus serving more clients leading to efficiency and reliability of services at URA. The above
findings are in line with the documentary review findings stipulated in an internal
memorandum (March, 2010) the Assistant Commissioner Returns Processing and Payment in
Domestic Taxes Department emphasizes that
“....following the launch of the e-tax returns module, the e-payments functionality has
been activated, under the e-tax payments process, a taxpayer does not need a Tax
Identification number to pay tax. This implies that any taxpayer located anywhere can pay tax
using the web portal, irrespective of whether the office of jurisdiction has e-tax. He continued

72
to assert that the e-payment has been formally rolled out to Kampala East, Medium Tax
Office and Large Tax Office. Clients can register the payment either at any Domestic Taxes
office irrespective of the office of jurisdiction, or directly through an internet access
anywhere outside URA premises.....”
This was further confirmed during the interview when internal customers (staff), had a
general consensus that the organization has implemented a number of automation reforms
specifically boosting the online facility since 2004, a number of computers have been
installed leading to quick and timely service to customers and this has enhanced the service
quality.
Relationship between Online Boost and Service Quality
In order to ascertain the effect of online boost on service quality, the researcher further used
the Pearson Product Moment correlation coefficient and the results are presented in table 10
below;
Table 10: The relationship between online boost and service quality
Online Boost Quality Service Online
boost
Pearson Correlation 1 .420**
Sig. (2-tailed) .000
Sum of Squares and Cross-products 74.010 33.845
Covariance .644 .294
Service
quality
Pearson Correlation .420** 1
Sig. (2-tailed) .000
Sum of Squares and Cross-products 33.845 87.870
Covariance .294 .764
**. Correlation is significant at the 0.01 level (2-tailed).
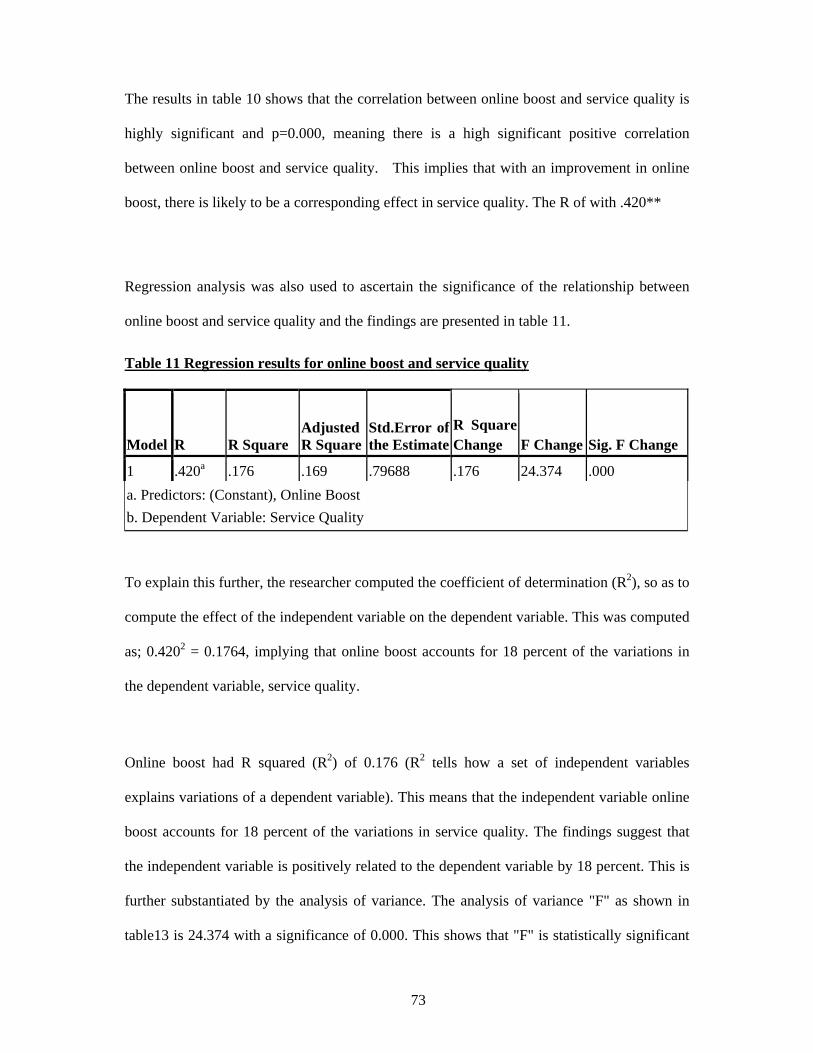
73
The results in table 10 shows that the correlation between online boost and service quality is
highly significant and p=0.000, meaning there is a high significant positive correlation
between online boost and service quality. This implies that with an improvement in online
boost, there is likely to be a corresponding effect in service quality. The R of with .420**
Regression analysis was also used to ascertain the significance of the relationship between
online boost and service quality and the findings are presented in table 11.
Table 11 Regression results for online boost and service quality
Model R R Square Adjusted R Square
Std.Error of the Estimate
R Square Change F Change Sig. F Change
1 .420a .176 .169 .79688 .176 24.374 .000 a. Predictors: (Constant), Online Boost b. Dependent Variable: Service Quality
To explain this further, the researcher computed the coefficient of determination (R2), so as to
compute the effect of the independent variable on the dependent variable. This was computed
as; 0.4202 = 0.1764, implying that online boost accounts for 18 percent of the variations in
the dependent variable, service quality.
Online boost had R squared (R2) of 0.176 (R2 tells how a set of independent variables
explains variations of a dependent variable). This means that the independent variable online
boost accounts for 18 percent of the variations in service quality. The findings suggest that
the independent variable is positively related to the dependent variable by 18 percent. This is
further substantiated by the analysis of variance. The analysis of variance "F" as shown in
table13 is 24.374 with a significance of 0.000. This shows that "F" is statistically significant

74
and implies that online boost has a statistically significant effect on service quality.
TABLE 12: Analysis of variance (ANOVA) Distribution
Model Sum of Squares Df
Mean Square F Sig.
1 Regression 15.478 1 15.478 24.374 .000a
Residual 72.392 114 .635
Total 87.870 115
a. Predictors: (Constant), Online Boost
b. Dependent Variable: Service Quality
The ANOVA results obtained in table 12 above regarding online boost and dependent
variable service quality showed a probability of 0.000 as was earlier on indicated in the
Pearson’s Product Moment Correlation Coefficient. Using the Probability approach a
probability lower than 0.01 shows a strong significance. Therefore the results in table 14
above showed a probability of 0.000 which indicates that the relationship is strong and highly
significant when compared with 0.01 level of significance. The multiple regression results
confirmed a positive effect of online boost on service quality thus, the hypothesis that there is
significant positive relationship between online boost and service quality in URA has been
substantiated
4.9.2 Information dissemination (communication) and service quality
The researcher sought views of respondents on the effects of information dissemination
(communication) on service quality of URA. The findings regarding this element of the study
are reported in table 13

75
Table 13: Summary Information dissemination (communication) and service quality
Agree ( percentages)
percentages
Disagree (percentages)
SN Items SA A NS D SD 1 There is continuous flow of information from URA to taxpayers 26 45 8 16 6
2 Information required by the taxpayers is availability on the net. 27 39 17 11 6
3 Tax payers give feedback to URA about the communication they receive. 29 45 10 13 3
4 Tax payers can obtaining tax information on the web portals 35 45 12 4 4
5 Materials displayed on the web portal are understandable by taxpayers. 16 28 22 23 10
6 Tax materials can be easily accessible on the web portal. 28 40 14 12 6
7 Tax information is easily availed to the taxpayers. 19 36 22 18 5
8 Flow of information to taxpayers from URA is common. 17 41 16 21 4
9 URA communicates to taxpayers any changes that have taken place. 15 33 30 18 4
10 Taxpayers are able to access tax information very easily. 29 45 16 10 3
MEAN 21 40 17 14 5
MEAN 61 19
Key: SD = Strongly Disagree; DA = Disagree; NS = Not Sure; A = Agree; SA = Strongly Agree.

76
Regarding whether the information reaches the intended audience in time, 85 percent agreed,
11 percent strongly disagreed and (4 percent) were not sure; the results hence indicate there is
an improvement in service quality at URA. The findings further indicated that 73 percent of
the respondents agree that as a result of automation information is easily obtainable.
The researcher cross tabulated the views of internal (staff) customers in comparison with the
external (taxpayers) customers to ascertain convergence or divergence of views between the
two groups and the results are presented in table 14 below.

77
Table 14: Cross tabulation of responses of internal and external customer in relation to communication.
Item Internal customers( Staff) External Customers(Taxpayers)
Agree (percent) Not sure
Disagree (percent)
Agree (percent)
Disagree (percent)
SA A N D SD SA A NS D SD
There is continuous flow of information from URA to taxpayers 24 29 3 4 3 16 15 2 2 2
Information required by the taxpayers is availability on the net. 16 31 4 9 4 10 14 3 7 2
Tax payers give feedback to URA about the communication they receive.
17 32 13 8 3 9 20 4 3 3
Tax payers can obtaining tax information on the web portals 7 33 7 7 2 14 12 3 6 1
Materials displayed on the web portal are understandable by taxpayers. 22 31 6 2 3 12 14 6 3 2
Tax materials can be easily accessible on the web portal. 17 26 6 9 5 11 14 8 3 1
Tax information is easily availed to the taxpayers. 17 28 12 6 1 12 18 3 1 2
Mean 17 30 7 6 3 12 15 4 3 2
Mean 47 9 27 5

78
The results in table 14 above indicate that Forty seven (47) percent of the respondents who
agreed that information dissemination improved the service quality were internal customer as
compared to twenty seven (27) percent agreement by external customer. Those who
disagreed were nine (9) percent internal compared to five (5) percent external customers.
Seven (7) percent of the internal customers were not sure as compared to four (4) percent of
the external customers who were not sure. This indicates that the internal communication has
improved more compared to external communication. Does it mean then that the available
communication channels are more appropriate to internal customers than external customers?
Results from the interviews insisted that there exist clear and designated communication
channels both internally and externally. In addition to this there exists a communication
policy to guide the standards expected to be exhibited by the internal customers. A number of
respondents expressed the view that information dissemination by the corporate services,
which is headed by the Assistant commissioner corporate services. The section also conducts
taxpayer education to ensure that the clients get the information they require. This has
enhanced customer care and improved the relationship between URA and her clients. One
client asserted that;
“... Various tax information is distributed to the clients at their premises and information can
easily be obtained at the website any time. There is availability of useful taxpayer guidelines
and procedures both in print and electronically accessible...This has led to limited fines and
penalties due to lack of information regarding tax matters...”

79
Relationship between information dissemination and service quality
After establishing the views on information dissemination the researcher proceeded to
establish whether there was significant positive relationship between information
dissemination and service quality. In order to ascertain the effect of online boost on service
quality, the researcher used the Pearson product moment correlation coefficient and the
results are presented in table 15

80
Table 15: Relationship between information dissemination and Service Quality
Information Dissemination Service Quality Information
dissemination
Service quality
Pearson Correlation 1 .417**
Sig. (2-tailed) .000
Sum of Squares 79.674 33.012
Covariance
.693 .287
**. Correlation is significant at the 0.01 level (2-tailed).
Regression analysis was also used to ascertain the significance of the relationship between
information dissemination and service quality. The findings are reported
Table 16 Regression results for information Dissemination and Service Quality
Model R R Squareb
Adjusted R Square
Std. Error of the Estimate R Square Change
F Change
1 .417c .174 .167 .75967 .174 24.059
a. Predictors:(Constant),Information dissemination( Communication) b. Dependent Variable : Service Quality
From the model summary, communication had R squared (R2) of 0.174. This means that the
independent variables; communication reforms account for 17 percent of the variations in
service quality. The findings suggest that the independent variable is positively related to the
dependent variable by 17 percent. This is further substantiated by the analysis of variance
whose "F" as shown in table 17 is 24.059 with a significance of 0.000. This shows that "F" is
statistically significant and implies that communication has a statistically significant effect on
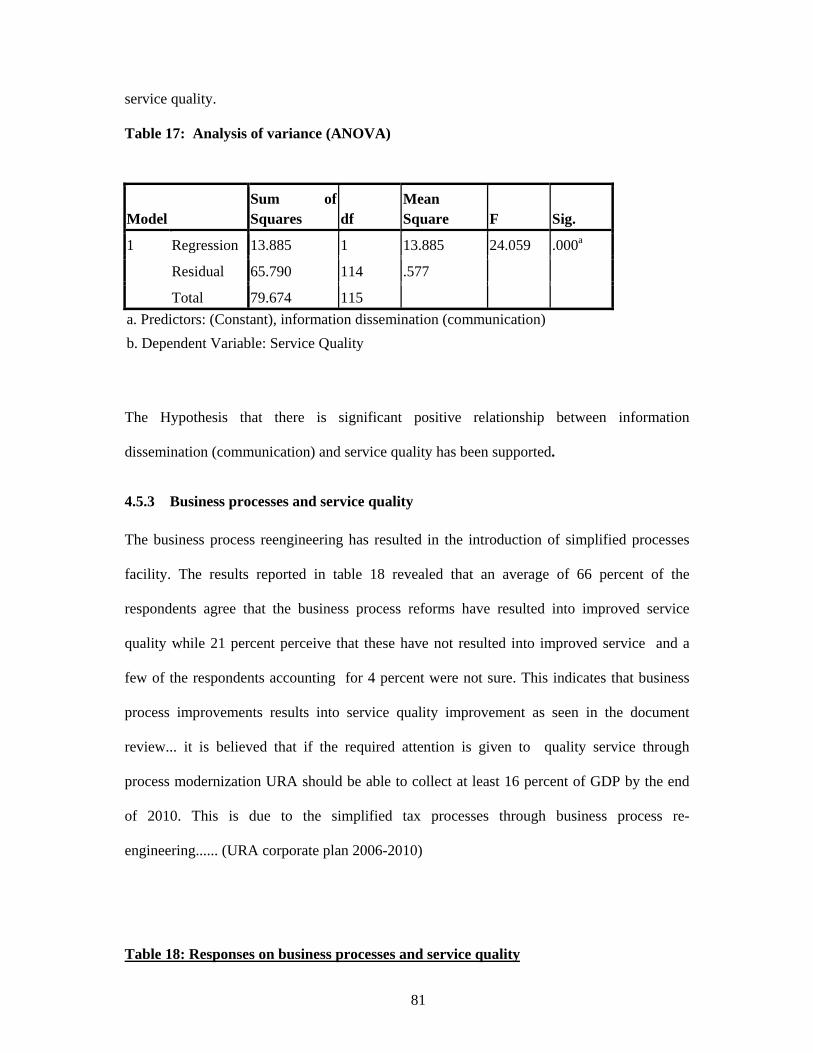
81
service quality.
Table 17: Analysis of variance (ANOVA)
Model Sum of Squares df
Mean Square F Sig.
1 Regression 13.885 1 13.885 24.059 .000a
Residual 65.790 114 .577
Total 79.674 115 a. Predictors: (Constant), information dissemination (communication) b. Dependent Variable: Service Quality
The Hypothesis that there is significant positive relationship between information
dissemination (communication) and service quality has been supported.
4.5.3 Business processes and service quality
The business process reengineering has resulted in the introduction of simplified processes
facility. The results reported in table 18 revealed that an average of 66 percent of the
respondents agree that the business process reforms have resulted into improved service
quality while 21 percent perceive that these have not resulted into improved service and a
few of the respondents accounting for 4 percent were not sure. This indicates that business
process improvements results into service quality improvement as seen in the document
review... it is believed that if the required attention is given to quality service through
process modernization URA should be able to collect at least 16 percent of GDP by the end
of 2010. This is due to the simplified tax processes through business process re-
engineering...... (URA corporate plan 2006-2010)
Table 18: Responses on business processes and service quality

82
Percentage distribution Agree Disagree S/N Items SA A NS DA SD 1 The payment process supports
service quality 42 21 23 10 3
2 The audit processes by URA is simplified
37 25 16 17 4
3 Recovery of un paid taxes is friendly to customers.
38 26 11 17 8
4 Refund of taxes is done on time 35 28 10 22 4 5 Objection processes is handled
promptly. 42 25 10 19 3
6 Appeals processes has been rectified by URA to suit customer requests
40 26 14 16 4
7 The processes are integrated at one point.
51 22 12 11 3
Mean 41 25 14 16 5 Mean 66 21 Key: SD = Strongly Disagree; DA = Disagree; NS = Not Sure; A = Agree; SA = Strongly Agree.
When the researcher inquired from the staff during the interviews, most of them revealed that
all the business processes which did not add value to customers were revamped and new and
simplified processes have been Instituted to enhance service quality in URA. As all the
interviewed management staff reflected that
“...service quality to both internal and external customers is now assured this standard
quality assurance is ensured through continuous reviews and realignment of processes to suit
customer requests and demands. The main strategies used are staff engagements through
departmental trainings, use of senior and competent staff to train new ones and exchanging
ideas through e-mails.
In the interview held it was generally enumerated that a phase wise approach to integrated
Tax Administration System (ITAS) implementation was progressing satisfactorily according
to plan. The interactive website output under the public and taxpayer education project
implemented under domestic taxes Modernisation project had yielded good results. A number

83
of processes were developed, tested and accepted by test committee and management. These
were implemented successfully in various stations in Kampala ...”
Relationship between Business Processes and Service Quality
After establishing the views on business processes and service quality, the researcher
proceeded to establish whether there was significant relationship between business processes
and service quality
Table 19: Relationship between Business Processes and Service Quality
Business processes Quality Service
Business processes Pearson
Correlation 1 .260**
Sig. (2-tailed) .005
N 116 116
Quality Service Pearson
Correlation .260** 1
Sig. (2-tailed) .005
N 116 116
**. Correlation is significant at the 0.01 level (2-tailed).
The results showed in Table 19 indicate that there was significant relationship between
Business Process and Service Quality. The correlation coefficient between business process
and service quality is small (.260**) though highly significant meaning there is a positive
correlation between business process and service quality. This means that business process
has a moderate and significant positive relationship with service quality. This implies that with
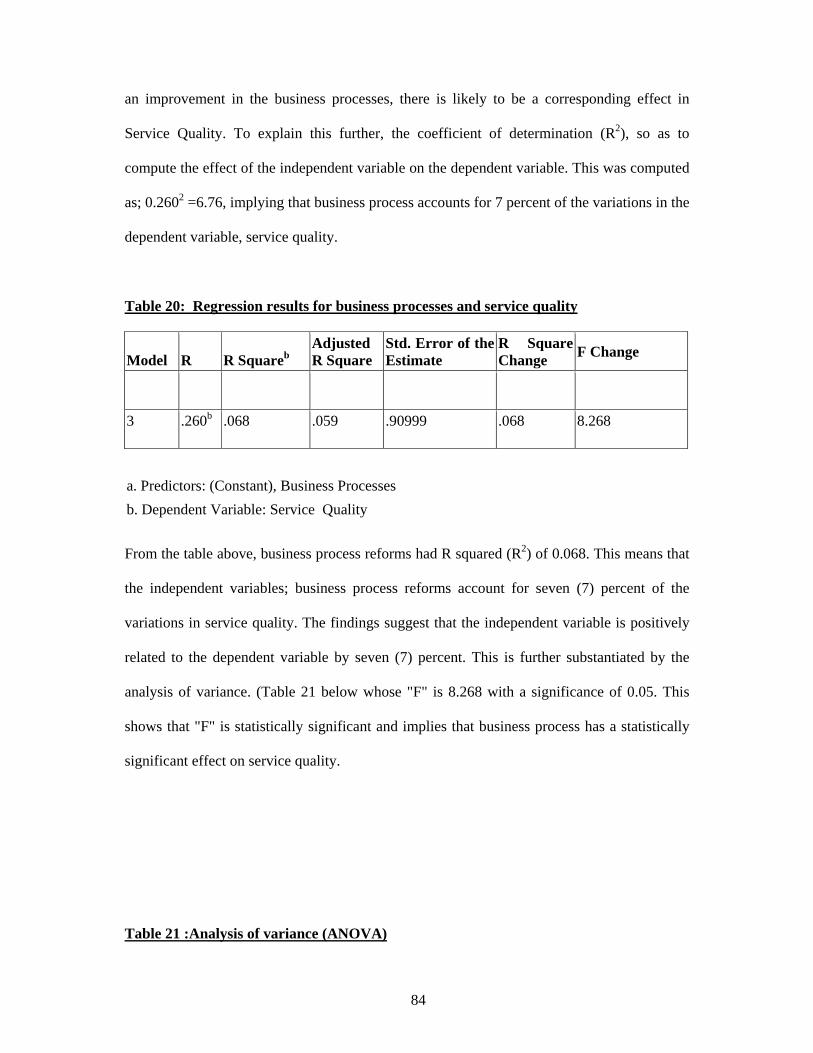
84
an improvement in the business processes, there is likely to be a corresponding effect in
Service Quality. To explain this further, the coefficient of determination (R2), so as to
compute the effect of the independent variable on the dependent variable. This was computed
as; 0.2602 =6.76, implying that business process accounts for 7 percent of the variations in the
dependent variable, service quality.
Table 20: Regression results for business processes and service quality
Model R R Squareb Adjusted R Square
Std. Error of the Estimate
R Square Change F Change
3 .260b .068 .059 .90999 .068 8.268
a. Predictors: (Constant), Business Processes
b. Dependent Variable: Service Quality
From the table above, business process reforms had R squared (R2) of 0.068. This means that
the independent variables; business process reforms account for seven (7) percent of the
variations in service quality. The findings suggest that the independent variable is positively
related to the dependent variable by seven (7) percent. This is further substantiated by the
analysis of variance. (Table 21 below whose "F" is 8.268 with a significance of 0.05. This
shows that "F" is statistically significant and implies that business process has a statistically
significant effect on service quality.
Table 21 :Analysis of variance (ANOVA)

85
Model Sum of Squares df
Mean Square F Sig.
1 Regression 6.846 1 6.846 8.268 .005a
Residual 94.401 114 .828
Total 101.247 115
a. Predictors: (Constant), Business Processes
b. Dependent Variable: Service Quality
Pearson’s product moment correlation coefficient. Using the probability approach a
probability higher than 0.01 shows a mild significance. Therefore the results in table 21
above showed a probability of 0.05 which indicates that the relationship is significant when
compared with 0.01 level of significance. Thus, the Hypothesis that business processes
significantly service quality in URA has been substantiated.
4.5.4 Corporate image and service quality
To understand the effect of corporate image on service quality, the study focused on the
perception of the respondents on the representation of the organization by the way staff serve
customers, compliance to customer care standards, professionalism and the ambience of the
premises and whether this affects service quality. This is a pertinent issue because the way
the external clients view an organization can lead to its failure or success given the negative
or positive publicity of clients. From table 22 the majority of the respondents (that is 92
percent) agree that the corporate image of URA has greatly improved. This change of attitude
towards the organization may be attributed to the improved customer care accorded by the
staff, the courteousness of staff and the improved ambience which has greatly changed from
negative to positive this may have emerged from improved quality of service. The minority

86
of the respondents seven (7) percent disagreed with this conclusion, however two (2) percent
not sure.
Table 22 showing summary results of corporate image and service quality
Percentage distribution
Agree Not sure
Disagree
SN Items SA A NS D SD 1 Staff loyalty to service 47 41 2 7 4
2 Staff exhibit courteousness
48 40 1 3 8
3 staff are consistent in offering service
54 39 3 1 3
4 The ambience of the offices has been improved upon.
49 49 3 1 3
MEAN 50 42 2 3 4 MEAN 92 7
Key: SD = Strongly Disagree; DA = Disagree; NS = Not Sure; A = Agree; SA = Strongly Agree.
The researcher observed that the offices have been renovated and the working environment is
conducive with the implementation of what is called the new office concept which is to
support service quality improvement. There is generally the same kind of furniture in all the
offices visited and there is expressed net working both internally in station to improve on
service quality to clients. The new offices are quite customer friendly with drinking water
available at various points. There are television facilities to entertain clients as they wait to be
served.
Majority of the clients interviewed were of the view that the working environment has been
improved upon in the last five years and is now conducive. This was echoed by all the
respondents

87
....Effort and resources geared to improve the working environment has been directed in the
aspect of ensuring that all the premises are according the prescribed new office concept
standards...hence all the offices are expected to have a similar setting and furniture in all the
premises occupied by Uganda Revenue Authority.
Relationship between corporate image and service quality
After establishing the views on corporate image and service quality, the researcher proceeded
to establish whether there was significant relationship between the two variables.
The results are presented in table 23.
Table 23: Relationship between corporate image and service quality
Service quality
Corporate image
Service quality Corporate image
Pearson Correlation 1 .612**
Sig. (2-tailed) .000
Sum of Squares and Cross-products
101.247 50.671
Covariance .880 .441 **. Correlation is significant at the 0.01 level (2-tailed).
The above results show that there was significant relationship between corporate image
improvement and service quality.
The correlation coefficient between corporate image and service quality is .612** meaning
there is a strong positive correlation between corporate image and service quality. The
significance is .000 (2-tailed), P-value corresponding to this is 0.000 since it is less than 0.01,
and then the correction between the two variables is statistically significant. From the results,

88
it is important to strengthen corporate image in terms of working environment and client
customer relations.
Furthermore, established that corporate images were significantly related to service quality,
we proceeded to test if Corporate Image affects Service Quality. The R2 =37.45, implying
that Corporate Image accounts for 37 percent of the variations in Service Quality this means
that proportionate changes in corporate image will result in a proportionate change in service
quality.
Table 24: Regression results for Corporate Image and Service Quality
Model R R Square
Adjusted R Square
Std. Error of the Estimate
R Square Change
Sig. F Change
1 .612a .374 .369 .74554 .374 .000 a. Predictors: (Constant), Corporate Image
b. Dependent Variable: Service Quality
From the model summary, corporate image reforms had an R squared (R2) of 0.374. This
means that the independent variables capturing corporate image reforms account for 37
percent of the variation in service quality. This means that when URA focuses on corporate
image enhancement it will lead to similar changes in the improvement of the service quality.
The findings suggest that the independent variable (corporate image reform) is positively
related to the dependent variable (service quality) by 37 percent. There is need to focus more
on this variable as it ranked highest among the four variables. More effort and resources
should be put in enhancing the corporate image. The modal used can be generalised to the
population is good since the shrinkage is small. This is further substantiated by the analysis of
variance. The analysis of variance "F" as shown in table 22 is 68.154 with a significance of

89
0.000. This shows that "F" is statistically significant and implies that corporate image have a
statistically significant effect on service quality. This therefore implies that there is a strong
positive relationship between corporate image and service quality and thus, the hypothesis
that Corporate Image significantly affects Service Quality in URA has been substantiated
The table below shows the results on variance analysis on corporate image and service
quality at URA.
Table 25 :Analysis of variance (ANOVA )
Model Sum of Squares df
Mean Square F Sig.
1 Regression 37.882 1 37.882 68.154 .000a
Residual 63.365 114 .556
Total 101.247 115
predictors: (constant), corporate image
dependent variable: service quality
In table 26 below a summary results of the findings during the testing of hypotheses done in
this chapter is presented:

90
The table 26: Summary of hypotheses results
Hypotheses Supported or not supported
There is a statistical significant effect between
Online Boost and Service Quality
Supported
Information Communication significantly affect Service Quality
Supported
There is a statistical significant effect Business
processes and Service Quality
Supported
Corporate Image significantly affect Service Quality Supported
It can be concluded that institutional reform and service quality in Uganda Revenue
Authority is positively correlated. With corporate image reforms rating highest followed by
online boost, information dissemination, business process in this order.

91
CHAPTER FIVE
SUMMARY, DISCUSSIONS, CONCLUSIONS AND RECOMMENDATIONS
5.1 Introduction
This chapter gives the summary of the findings, discussions, conclusions and
recommendations based on the findings. The discussion is arranged objective by objective
from which conclusions and recommendations are formulated.
5.2 SUMMARY OF THE MAIN FINDINGS OF THE STUDY
The study set out to examine how institutional reforms measured by online boost;
communications, business processes, and corporate image reforms affect service quality. The
study was guided by the four objectives which were.
i. To establish the effect of online boost on service quality in Uganda Revenue
Authority.
ii. To examine the effect of communication reforms on service quality of Uganda
Revenue Authority.
iii. To explore the effect of business process reforms on service quality of Uganda
Revenue Authority.
iv. To examine the effect of corporate image on the service quality of Uganda Revenue
Authority.
From the study, it was revealed that there was a relationship between institutional reforms
and service quality at URA. The results indicated three variables (corporate image reforms,
online boost, and information dissemination (communication) having a strong positive
relationship with service quality.

92
The study also revealed that business process reforms have a positive significant
relationship with service quality. Comparing the two variables (corporate image and business
process reforms), corporate image reforms is rated more important in predicting service
quality. This therefore means that much attention and resources should be directed towards
improvement of the corporate image of URA rather than improving the business processes.
However, this does not mean that business processes should be completely ignored. Business
process reforms in the long run contribute to service quality improvement because the
processes will result in efficient and effective service delivery hence enhancing service
quality.
5.3 Discussion of findings regarding hypotheses
5.3.1 Hypothesis One (I): Online boost significantly affects service quality in URA
The study hypothesised that on line boost affects service quality in Uganda Revenue
Authority. This hypothesis was verified by establishing a strong correlation of online boost
and service quality in Uganda Revenue Authority. The results were verified using Pearson’s
product moment coefficient. Online boost had R squared (R2) of 0.176 Indicating that the
independent variable; online boost account for 18 percent of the variation in service quality.
This finding suggests that the independent variable is positively related to the dependent
variable by 18 percent. This was further substantiated by the analysis of variance. Whose "F"
as shown in table13 was 24.374 with a significance of 0.000. This shows that "F" is
statistically significant and implies that online boost has a statistically significant effect on
service.
93
The significance of the impact of online boost on service quality was further assessed using
regression model and the result indicated that online boost was a predictor of service quality.
These findings are in line with (Parasuraman 2000), who observed that, “the increasing use of
website technology is altering the expectations of customers on the availability of services
and the nature of services”
This is supported by Kim and Lee (2006) who found that ICT application was significant to
Service Quality. This is further supported by Li-Hu (2009) who argues that information com
According to Lin (2007), ICT can be used to facilitate the rapid search, access and retrieval of
information and support communication and collaboration among individuals in the firm.
This was also supported by Egbu (2004) who contended that ICT is an important enabler as
“it enables the process, people and the knowledge content”. Communication technology has
been a subject of considerable interest to many groups, such as government policy makers,
international funding agencies, and business executives because of the close relationship
between ICT and service quality.
Julia et al. (2004) recognised in the organisations they studied recognised that future
developments in network communications will increase the opportunities for remote work,
and that this would increase the reach and speed of customer communication, increase
flexibility in service operations. This is comparable to the findings of this study in URA as
the online boost has led to effectiveness and reliability of service.
From the current study it was revealed that clients are now able to transact business away
from the premises of URA which is in line with the literature above. In conclusion therefore

94
as noted from the literature and the study online boost is very vital in service quality and
meeting the expectations of clients. Therefore management should not under look the
continuous improvement needed in this area. The results highlight the important role played
by online boost (in terms of responsiveness, effectiveness, and credibility) in improving
service quality. This finding supports previous research in suggesting that an online boost has
significant short-term and long-term implications for URA’s effectiveness and
responsiveness of service quality.
5.3.2 Hypothesis two (2): Information Dissemination (Communication) significantly
affects service quality in URA.
The study showed a positive relationship between information dissemination
(communication) and service quality. The results imply that investment in the right resources
in terms of information dissemination (communication) to subsequent accessibility to
information is to occur. Information dissemination (communication) accounting for 17
percent of the variations.
The results indicate that in the presence of a well developed information dissemination
system it would be easy to quickly store and retrieve knowledge so that it can quickly be
accessed and used by everybody in the organization.
Furthermore, in public institutions, the use of information is likely to make the internal and
external collaboration faster and more efficient in terms of information dissemination
(communication) thus improved service quality. Hence the study revealed that information
dissemination has an important role in the area of service quality

95
The second objective aimed at examining the relationship between communication reforms
and service quality of Uganda Revenue Authority. The study showed a positive relationship
between Information dissemination (communication) and service quality results imply that
investment in the right resources in terms of information dissemination (communication) to
subsequent accessibility to information is to occur. Information dissemination
(communication) accounting for 17 percent of the variations in service quality.
The results indicate that in the presence of a well developed Information dissemination
system it would be easy to quickly store and retrieve knowledge so that it can quickly be
accessed and used by everybody in the organization.
Furthermore, in public sector the use of Information is likely to make the internal and
external collaboration faster and more efficient service delivery. The study is in agreement
with various studies conducted indicating a relationship between communication and service
quality (Julia et ...al, 2004).
There was general agreement that customer service professional (CSPs) will need to be
efficient in the use of new communication modes, including e-mail. This aspect of future
service was especially a matter of concern to companies in financial services,
telecommunications, public utilities and distribution. The dominant modes of communication
at the present are telephone and e-mail messages. CSPs need to handle both modes of
communication competently and sometimes simultaneously. It was anticipated that in future
the variety of communication modes will expand and this will require quick adaptability. This
has been widely undertaken in URA which has led to timely service delivery.
Cheeseman and Wood, (2003/2004) says internal communication is about working together

96
with colleagues, providing good services so that as a team, the organisation can achieve its
goals. In addition, Milkovich and Boudreau (2003:36) established that the variety of
communication approaches range from annual written reports to abstracts and seminars
whereby employees design programs to inform employees about their benefits.
Communication is seen as a check point and a sign of personal assessment among employees
towards service quality. The study established how communication with external customers
improves the quality of service.
5.3.3 Hypothesis three (3): There is significant positive relationship between business
processes and service quality in URA
The study indicated a moderate relationship between business process and service quality.
Business processes have a mild relationship predicting 7 percent in service quality variations.
This implies that the processes are not much of an issue as regards customer expectations.
What the customer requires in timely service irrespective of the process. According to
available literature, reforms in URA were embarked upon in all the departments, this was by
revamping and re-engineering all business processes, (URA Modernization, Newsletter,
2007). But from the findings of the study processes the processes. The re-engineered
processes provide coherent and transparent systems across the organization (Modernization,
2009)
5.3.4 Hypothesis Four (4): There is significant positive relationship between corporate
image and service quality in URA
The study indicated a significant positive relationship between corporate image and Service
Quality. Corporate image predicts 37 percent of the variations in service quality. This is in
agreement with the observations by the researcher regarding the tremendous improvement in

97
the general appearance, the staff courteousness and the general working conditions,
The fourth objective was to find out how corporate image reform contributes to the service
quality of Uganda Revenue Authority. This was the best predictor of service quality
accounting for 37 percent in the variations in service quality. The image of URA has been
enhanced through people and the ambience of the premises where the offices are operating.
The corporate image reforms were geared towards total transformation of the organization
using the people and the new office concept. This is in conformity with Chandan (2003)
argues that training is a short term process of utilizing systematic and organized procedure by
which non managerial personnel learn technical knowledge and skills for a definite purpose.
It is a planned effort to facilitate learning job related behaviours in order to improve
employee performance.
Employees in Malaysia feel a greater sense of obligation to remain in their organisations and
supportive to training (Ahmad and Backer (2003), Dyk et al (2001) stated that South Africa is
faced with challenges of developing its people in order to allow them make meaningful
contributions.
Organizational success is made through endeavours of individual employee and if the skills
that they bring to their work do not keep pace with changes required within and without
Organisation. The results highlight the important role played by employees (in terms of
responsiveness, courtesy, and credibility) in improving customer satisfaction and service
Performance. This finding supports previous research in suggesting that an employee’s
attitude to customers has significant short-term and long-term implications for the
organisation concerned. The literature indicates that employee courtesy generates more

98
favourable perceptions of service quality and satisfaction among customers (Dabholkar et al.,
2000). Employees who are attentive, courteous, cooperative, and keen to listen are more
likely to enhance customers’ perceptions of service than those who are rude, inattentive, and
unapproachable. It is apparent that service quality should be an integral component of the
management strategy of the URA service.
The objectives of the private sector (such as reducing costs and improving the
responsiveness, quality and service aspects of their operations in an effort to provide a more
efficient and effective service) are increasingly aligning with those of the public sector (Yasin
et al., 2001). Public sector management can therefore learn from the experiences of the
private sector, specifically in relation to customer orientation and the subsequent role and
importance of the service provider in delivering and maintaining quality standards. A
customer-oriented approach to public service management is essential given that the public
compares public service performance with that
5.4 Conclusions
The following conclusions are drawn from the findings of the study.
The study has shown that there is significant positive relationship between on line boosts and
service quality in URA. As indicated by the responses on internet facility and web portals
making service reliable and efficient which indicate marked improvement in service
effectiveness and timeliness. Furthermore, from these results many lessons have been learnt,
notably that it’s important to use a participatory approach in organizations as this facilitates
service quality.

99
The study indicated a significant positive relationship between Information Dissemination
(Communication) and service quality. The results indicate that in the presence of a well
developed Information Dissemination (Communication) system it would be easy to quickly
store and retrieve information so that it can quickly be accessed and used by everybody in the
organization. Furthermore, in URA, the use of ICT is likely to make the internal and external
collaboration faster and more efficient in terms of information sharing. Hence the study
revealed that Information Dissemination (Communication) has an important role in the area
of service quality.
The study showed a weak positive relationship between business process reforms and service
quality. These results imply that investment in the right resources in terms of business
process reengineering is essential to subsequent service improvement
The study showed a strong positive relationship between corporate image reforms and service
quality. These results imply that investment in the right resources in terms of improvement
of the corporate image should be emphasised in order to enhance the corporate image of the
organization is required to enable the customers view the services in the same line
5.5 Recommendations to address the service quality in URA.
The recommendations are given according to the study objectives.
From the findings of the study, the following recommendations are made to the authorities
Management.
In order to ensure that quality services are provided to staff and clients, individual
departments have to make sure that they have mechanisms in place to acquire on line
services. This is because revenue service is a crucial component of the economy it is the
100
blood line of all government services as efforts have to be ensured to win the public approval
hence enabling revenue collection.
Information is a powerful tool in affecting organizational goals and objectives. Therefore, it
is hereby recommended that organizational designs which enhance horizontal communication
and has few hierarchical barriers to communication are in place. However from the findings
in cross tabulated results between internal clients and external clients it was found out that
internal communication has improved more than external communication. Therefore, the
organization has to ensure that external communication is improved to enable a balanced
approach to encouraging the sharing of information both internally and externally in the
organization. And convey of information through structured processes such as sharing best
revenue practices, having quality circles in place to enable dialogue between internal and
external stakeholders.
The business processes in an organization are major factors; this implies that for an
organization to perform more effectively the Business processes should be simple and easily
understandable by the clients. There should always be continuous evaluation of the various
Key Processes to ensure that non- value adding Processes are eliminated to ensure
effectiveness and efficiency service.
Image of organizations contributes a great deal to the success or failure of corporate bodies. It
is therefore paramount to address issues to facilitate service quality. Great organizations in
good to great by Jimmy Collins in what he calls the fry wheel continued doing the same thing
over and over again through which continuous improvement was achieved after some time
and thus moving from good to great.

101
The importance of operating environment should be expressed, with both internal and
external customers as an aspect of revenue administration. A cumulative effort to the modal
and emphasise appropriate operational environment characteristics can best influence
customers to embrace compliance, which is a critical factor to the authority. Through
deliberate efforts to have dialogue about the phenomenon staff and clients, with the context
of all subject matter addressed in policy formulation excellent revenue service can be
achieved. The approach here should be of continuous improvement drawing from the
Japanese kaizen approach.
5.6 Contribution of study
The study has contributed to establishing factors that affect service quality arising from the
exploratory factor analysis conducted giving rise to the renamed factors of online boost,
information dissemination, business processes and corporate image improvement. Thus
coming up with a modified conceptual frame-work arising from factor analysis is one of the
major contributions of this study.
The study has contributed to the general body of knowledge concerning institutional reforms
and service quality by establishing that corporate image reforms significantly affected service
quality at URA. It was also ascertained that the internal customer’s views concerning
information dissemination varied from the views of the external clients, which is an area of
priority in order to improve on the quality of service to the external clients.
5.7 Likely areas of further research
The research findings and research limitations have also contributed to the identification of

102
several areas for future research. First, the perceptions of multiple sources of feedback on the
services quality would provide a more holistic view of the extent to which service quality
permeates the organisation.
Secondly, the study covered Kampala stations a survey would be conducted to compare
Kampala based stations with up country.

103
REFERENCES
Abdelmonem, A. Virginia A. Clark and Susanne May, (2004) Texts in Statistical Science Computer-Aided Multivariate Analysis, Fourth Edition. Chapman and Hall/CRC
Ahmad, B. O. (2004), “The Influence of Leadership on Organizational Culture And Its
Effects On Knowledge Management Initiative”, Journal of Management, 12 (8), PP56-8
Ahmed, P.K., Lim, K.K. and Loh, A.Y.E. (2000), Learning Through Knowledge
Management, Butterworth-Heinemann, Oxford.
Alavi, M. and Leidner, D.E. (2001), “Review; Knowledge Management& Knowledge
Management Systems”, MIS Quarterly,25(1), 1o7-136.
Allee, V. (2000), Knowledge Networks and Communities of Practice, OD Practitioner 32 (4).
Amin, M.E (2005), Social Sciences Research; Conception, Methodology and Analysis,
Kampala: Makerere University Press.
Armstrong. M, (2001) Hand book of Human resource Management Practice. The bath press
Argote, L and Ingram, P. (2000), “Knowledge transfer; a basis for competitive advantage in
firm”, Organizational Behaviour and Human Decision Process, 82(1), pp 150-69.
Argote, L. And Ophir, R. (2000), “learning writing organizations: Factors affecting the
creation, retention, and transfer of knowledge”, in Baum J. Ed, Blackwell Companion to
organization, Blackwell, Oxford.
Babbie, E. (2007), the Practice of Social Research, 11th Ed, Thomson Wadsworth.
Baker, J.H & Baker, G.A. (2001), “Leadership, Culture & Knowledge Management”, we
LEAD online Magazine, Leader today, org.

104
Bartlett, C.A. and Ghoshal, S. (1998), “Beyond strategic planning to organization learning:
lifeblood of the individualized corporation”, Planning Review, 26(1), pp.34-9.
Bender, S. and Fish, A. (2000), “The transfer of knowledge and the retention of expertise: the
continuing need for global assignments”, Journal of Knowledge Management.4 (2), pp, 125-
137.
Bezes, P. and Lodge, M. (2006), “Historical legacies and dynamics of institutional change in
Administrative systems”, paper presented at the international Political Science
Association (IPSA) In World Congress in Fukuoka, Japan, July 9-13.
Bhatta, G. D. (2001), “Corporate governance and public management in post-crises Asia”,
Asian Journal of Public Administration, Vol.23 No.1, pp.1-32.
Bhatt, G. D. (2000), “International Dynamics, Learning and knowledge creation in
organizations”, The Learning Organization. 7(2), pp, 89-98.
Birkinshaw, J. (2001), Why is knowledge Management so difficult. Business Strategy.
Review 12(1), pp. 11-18.
Bloodgood, J.M, and Salisbury, W.D. (2001), “Understanding the influence of organizational
change strategies on information technology and knowledge management strategies”,
Decision Support Systems, vol, 31, pp, 55-69.
Bollinger, A.S, and Smith, R. D (2001), “Managing organizational Knowledge as a strategic
asset”, Journal of Knowledge Management 5(1), pp, 8-18.
Buckley, J. (2003),”E-service quality and the public sector, “Managing Service Quality,
Vol.13No. 6pp.453-62.
Brown, J. and Duguid, P. (2000), “Balancing act: how to capture knowledge without killing
it”, Harward Business Review, 78(3), pp.73-80.

105
Bruce, L.B. (2004), Qualitative Research Methodologies for social Sciences. International
Student. Edition (5th Ed), Pearson Education Incorporated, USA.
Carneiro, A (2001), “The role of intelligent Resources in Knowledge Management”, Journal
of Knowledge Management, 5(4), pp, 358-65.
Carrillo, P and Chinonsky, P (2006), “Exploiting Knowledge Management: The Engineering
and Construction Perspective”, Journal of the Management in engineering ASCE.
Chen, C.K., Yu, C.H., Yang, S.J. and Chang, H.C. (2004). “A customer-oriented service-
Enhancement system for the public sector”, Managing service quality, Vol 14 No 5,
pp 414-425.
Chessman, A and Wood, G, (2003). Customer Marketing, Butterworth, Heinemann, Oxford,
United Kingdom
Chin-Loy, C. (2003), “Assessing the Influence of organizational Culture on Knowledge
Management Success”, Wayne Huizeng School of Business and Entrepreneurship. Nova
South-eastern University.
Common Market for Eastern and Southern Africa (COMESA), (2009) Business Survey,
October 2009, Kampala, Uganda.
Cooper, D. (2004). “Organisational change: from public to private sector-a U.K based
Reflective case study”, Journal of American Academy of Business, Vol.5 No1/2,
pp 474-80.
Cross, R. & Baird, L. (2000), “Technology is not enough: improving performance by
building organizational memory”, Management Review, 41(3), pp.69-78.
Darvasula. S, Lysonski. S and Metha. C.S (2000). Business-to-business marketing services
Recovery and customer satisfaction. Journal of marketing vol.34 issues3/4. Emerald
Publishers

106
Decenzo, D.A., and Robbins, S.P., (2002). Personnel/ Human Resource Management, 3r.d
Edition, Prentice Hall of India Private Limited, New Delhi.
DeTienne, K.B, Dyer, G., Hoops, C. And Harris, S.(2004), “Toward a model of effective
knowledge management and directions for future research: culture, leadership and CKOs”,
Journal of leadership and organizational studies, 10(4), pp 26-43.
.
Economic Commission for Africa (ECA, 2004) Public Sector Management Reforms in
Africa, Addis Ababa, Ethiopia.
Egbu, C., (2000), “Knowledge Management in Construction SMEs: Coping with the Issues of
Structure, Culture, Commitment and Motivation”, Proceedings of the Sixteenth Annual
Conference of association of Researcher in Construction Management (ARCOM), Glasgow
Caledonian University, September 6-8 2000.
Encyclopaedia of Management (2000), HELMS, M.M.(Ed), Encyclopaedia of Management.
Gale Group, Famington Halls, M.
Fruchter, B (1968), Introduction to factor analysis. Princeton Van Nostron Company
Ghauri P, and Grouhang K. (2002) Research Methods in Business Studies, A practical guide,
2nd edition, Prentice Hall, UK.
Glatthorn, A. and Joyner, L.R,(2005), Writing the winning Thesis or Dissertation: A step-by-
step guide.
Gomez-Mejia, L.R., Balkin. (2003) Managing Human Resources, 3rd Ed, Prentice Hall Inc. Guadagnoli, E., & Velicer,W.F. (1988). Relation of sample size to stability of component
Patterns. Psychological Bulletin, 103.
Hall, B.P. (2001), “Values development and learning organization”, Journal of knowledge
management, 5(1), pp. 19-32.

107
Hall, H.T (2002), Organizations: Structures, Processes, and Outcomes. 8th Ed; Upper Saddle
River: Prentice hall.
Hoon, H.T (2003), Knowledge management: An Exploratory Study on Malaysian
Organization. Dissertation for the masters of business administration, Pusat Pengajian
Pengurusan University Sains Malaysia.
Hussey J and Hussey R (2002) Business Research, Palgrave, N.Y, USA.
Kadir, S.L.S.A., Abdullah, M. and Agus, A. (2000), “On service improvement capacity
Index: a case study of the republic service sector in Malaysia”, Total Quality
Management, Vol.11 No 4-6, pp.837-43.
Kakatura, O.M.(2010), Effects of Leadership behaviours on employees performance in
nongovernmental organisations in Uganda : A case study of Heifer International Uganda
.MMS Dissertation, Uganda Management Institute.
Kakooza, T (2002) Research-An introduction to Research Methodology 2nd Edition. Kakooza, T (2003), Sampling techniques, Makerere University, February, 2003
Kane, A.A., L. Argote, J. Levine (2005, “Knowledge transfer between groups via personnel
rotation: Effects of social identify and knowledge quality”, Organizational Behaviour and
Human Decision Processes. 96 (1), pp.56-71.
Kim, S. and Lee, H.(2006), The Impact of Organizational context and Information
Technology On Employee Knowledge Sharing Capabilities.
Kithing J and Blackburn R (2002), small business research centres Kingston University.
Journal of European Industrial training, University Press
Kothari, C.R. (1990), Research Methodology –Methods and Techniques, 2nd Ed, New Delhi:
Wishwa Prakaskan.

108
Krejcie R. V & Morgan D.W (1970), Determining Sample Size for research activities,
Educational and Psychological Measurements, 30, 608. Sage Publications.
Lancaster Geoff (2005) Research Methods in Management, Elsevier, Butterworth,
Heinemann, 64-77.
Lehmann, S. (2004), Learning in Global Networks – Industrial Restructuring of Thain
Manufacturers in the Automotive and Garment Commodity chains, PhD Dissertation.
International Development Studies. Roskilde University.
Li-Hua, R. (2009), From Technology Transfer to Knowledge Transfer - A study of
International Joint Venture Project in China. Newcastle Business School, University of
Northumbria at Newcastle upon Tyne, NEI 8th street UK.
Lin, C.H., Tseng, S.M (2005), “The Implementation Gaps for the knowledge management
system”, Industrial Management and Data Systems, Vol. 105 No. 2, PP 208-22.
Lin, M & Wei, C.C (2005), “Establishing the key performance indicators of knowledge
management”, International Journal of the Computer, the internet and management, Vol 13
PP 67-87.
Lin, H.F. (2007), “Knowledge Sharing and Firm Innovation Capability: an Empirical Study”,
International Journal of Manpower. 28(4), pp.315-332.
Mathew, J. and Shulman, A.D. (2005), “Competitive advantage in the public sector
Organisations: explaining the public good/sustainable competitive advantage paradox”,
Journal of Business Research, Vol. 58 No.2, pp.232-40.
McDermott, R. (1999), “Why Information Technology inspired but cannot deliver knowledge
management”, Califonia Management Review, 41(4), pp. 103-17

109
Milkorich, G and Boudreau, J. (2003), Personnel Human Resource Management, 5th Edition,
Virender Kumar Arya, New Delhi, India
Minbaeva, D.B. Michailova, S. (2004), “Knowledge transfer and expatriation in multinational
corporations”, Employee Relations, 26(6), pp.663-679.
Mugenda, M.O. and Mugenda G.A. (1999) Research methods: Quantitative and qualitative
Methods, African Centre for Technology Studies Press, Nairobi.
Mugenda, .M.O. & Mugenda, G.A. (2003), Research Methods, Quantitative and Qualitative
Approaches. 2nd Ed. Nairobi: African Centre for Technology Studies (ACTS)
Muhenda, M.B. and Lwanga, E, K. (2008), “Intra-Knowledge Transfer Success among
Information workers in Higher Public Institutions of learning in Uganda: The role of
Information Technology”, Journal for Higher Education.
Muhenda, M.B., Lwanga, E.K, and Wandarage, A.(2008), “Knowledge Management
strategies and performance Improvement In Management development Institutes : Empirical
Findings from the Uganda and Tanzanian context”, Paper presented at the International
conference of the Association of Administrative Sciences’, 14-18 July, Kampala.
Mullin J.L (2004) Management and Organizational Behaviour, 7th Edition, Prentice Hall.
Narteh, B. (2006), “Knowledge transfer and Learning: the case of Danish-Ghanaian
corporation”, unpublished doctoral dissertation, Aalborg University, Aalborg.
Nazareno, N.L, (2003) the Asian Manager- An Asian Institute of Management Publication
Vol.16. No.1 Life in camp smart, p.30-32
Neef, D. (1999), “Making the case for knowledge management the bigger”, Management
Decision. (37), pp.72-8.

110
Newell, S. (1999), “The transfer of management knowledge to China: building learning
communities rather than translating western textbooks”, Education and Training, 41(6/7), pp
286-93.
Nielson, B. (2000), Strategic Knowledge Management: A Research Agenda, working paper
2 [On-line] Available http://www.cbs.dk/departments/int/publications/wp 2000/wp2-
20000bo.pdf.
Norman, P.M. (2002), “Protecting knowledge in strategic corporation: resources relational
characteristics”, Journal High Technology Management Research, 33(2) pp 177-202.
Nonaka, I. & Takenchi, H. (1995), The Knowledge-creating Company: How Japanese
Companies create the dynamics of innovation. New York: Oxford University Press.
. O’neil.M.A (2000) Diving into service quality-the dive tour operator perspective. Managing
Service quality. Vol.10. No.3.pp.131-40.
Orodho, A.J and Kombo, D.K.(2002), Research Methods, Nairobi: Kenyatta University,
Institute of open learning.
Parasuraman, A., Zeithaml, V.A. and Berry, L.L. (1988), SERVQUAL: a multiple item scale
for measuring consumer perceptions of service quality”, Journal of Retailing,
Vol. 64 No.1 pp.240.
Pattanayak. B, and Gupta V., (2002), Creating performing Organizations, Public Sector
Management Reforms in Africa, Lessons Learned, Development Policy, Tejesh, Singh Ltd
Punch, F. K. (2000). Introduction to Social Research. Quantitative and Qualitative
Approaches, London: Saga Publications Ltd.
Riley M., Wood Roy c., Clark M.A, Wilki E. and Szivas E. (200), Research and Writing
Dissertations in Business Management, Thomas.

111
Roberts, Joanne (2000), “From Know-how to show-how: Questioning the Role Information
and Communication Technologies in knowledge transfer”, Technology Analysis and
Strategic Management 12(4), pp 429-443.
Robinson, L. (2003), “Committed to quality: the use of quality schemes in U.K public leisure
Services”, Managing Service Quality, Vol.13 No. 3, pp 247-55.
Saito, A., Umemoto, E. and Ikeda, P. (2007), “A Strategy-based ontology of Knowledge
Management Technologies”, Journal of Knowledge. 11(1), pp, 97-114.
Sarantakos, S (2005) Social Research, Pelgrave Macmillan, New York, 3rd Edition.
Saunders, M; Lewis, P. and Thornhill, A. (2003), Research Methods for Business Students.
Harlow: Prentice Hall, Pp, 100-106.
Sekaran, UMA. (2003), Research Methods for Business, 4th Ed. New York: John Wiley and
Sons. Inc.
Skyrme, D (2001), Capitalizing on Knowledge from E-Business to K-Business, Delhi India
Oxford, Replika Press Ltd.
Statsoft Inc (2003), Reliability and Item Analysis. Retrieved on August 20, 2009 from the
Worldwide Web://www.statspft.com/textbook/streliab.html
Stephen, P. R. & Docenzo, D. A. (2002), Fundamentals of Management, 3rd, Ed, Pearson
Education.
Stoner, G.H and Pemberton, J.D (1999), “Learning and Knowledge Management in the
intelligent organization”, participation & empowerment: An International Journal, 7(5): PP
131 – 144.
Stroh, L.K. and Caligiuri, P.M. (1998), “Increasing global competitiveness through effective
people management”, Journal of world Business, 33(1), pp 1-16.

112
Stuhlman management Consultants (2005), helping you turn data into knowledge.
Syed-Ikhsan, S.O.S. and Rowland, F.(2008), “ Knowledge management in a public
organization: a study on the relationship between organizational elements and the
performance of knowledge transfer”, Journal of knowledge, 8(2), pp95-111.
Sveiby, K (2001), Knowledge Management – Lessons from the pioneers, November. [On-
line] Available http://www.sveiby.com/KM-Lessons.doc.
Swee, C.G. (2002), “Managing effective knowledge transfer: an integrative framework and
some practice implication”, Journal of Knowledge Management, 6(1): pp 1-6.
Szulanski, G. (2000), “The process of knowledge transfer: a diachronic analysis of
stickiness”, Organizational Behaviour and Herman decision Processes, 82(1), pp. 9-27.
Scott, G (2002), Assuring Quality for online learning (online)
Available at www.qdu.uts.educ.au
Talja, S. (2002); “Information sharing in academic communities: Types and levels of
collaboration in information seeking and use”, New Review of Information Behaviour
Research. 3, 143-159.
Thompson and Strickland, 2001 Strategic Management, concepts and cases, McGraw hill
Publishers, London.
Trochin, W.M.K (2002) Reliability and validity: What is the difference? Retrieved 30th Nov
2009, available at http://trochin.human.cornell.educ/tutorial/colosi/1colosi2.htm.
Uganda Revenue Authority: The Taxman (2008), the annual edition, Vol 1 issue 7, 2008
113
Uganda Revue Authority, News letter (2007) Uganda Revenue Authority Modernization
Newsletter, issue 1, January 2007
Uganda Revenue Authority: URA corporate Governance: September 2004.
Uganda Revenue Authority: Taxpayer Charter, December 2006
Uganda Revenue Authority: Revenues, Aug- Dec, 2000, “Retirement benefits”, Vol.2 No.1,
Uganda Revenue Authority: Revenues, July-Dec 2003, “Non-tax revenue programme”, Vol.4
No.1 p 18&19
Uganda Revenue Authority Report 2002 Revenues, Restructuring, modernization finally
Takes off. Revenues, staff magazine, Vol.3 No3 July – Sept 2002
Uganda Revenue Authority: Bravo progress in URA, Revenues, staff magazine, Vol 4, No1
July – Dec
Uganda Revenue Authority Statute, 1991
Uganda Revenue Authority Strategic Corporate Plan 2002/2007

114
Yasin, M.M., Wafa, M.A. and Small, M.H. (2001), “Just in time implementation in the public
Sector: an empirical examination”, International Journal of operation and
Production Management, Vol. 21 No 9/10, pp 1195-204.
Young, H. W (2003), “Practicing New Economic Geographies: A Methodological
Examination”. In Annuals of the Association of American Geographers. 93(2).
Zaharias, P., Samiotis, K. and Poulymenakou, A. (2001), “Learning in knowledge-incentive
organisations: methods and tools for enabling organizational learning processes”, 7th
International Conference on Concurrent Enterprising, Bremen, available at:
www.knowldgeboard. Com/library/organizational-learning.pdf, accessed: 18 February 2010.

115
APPENDIX A: QUESTIONNAIRE Dear Respondent I am a Master of Management Studies Project Planning and Management student at Uganda
Management Institute, as part of the programme am conducting a study: Topic: Institutional
Reforms and Service Quality in the Public sector of Uganda. A case study of the Uganda
Revenue Authority Modernization Programme. The study seeks to examine the effects of
institutional reforms on the quality of service. As one of the target respondents your opinions
are very important to this study. The information provided will only be used for academic
purpose and will therefore be treated with ultimate confidentiality.
Kindly spare sometime and answer the questions by writing in the space provided or ticking
in your answer of your appropriate choice.
Section A; Demographic Characteristics 1. Gender: 1. Male ( ) 2. Female ( ) (Please tick the right sex) 2. Age 1. Below 30 years ( ) 2. 31-40 ( ) 3. 41-50 ( ) 4. Above 50 ( ) 3. Designation 1. . Manager ( ) 2. Supervisor ( ) 3. Officers ( ) 4. Taxpayer ( ) 4. Number of years served in the organization 1. 1- 5 ( ) 2. 6 -10 ( ) 3. 11- 15 ( ) 4. 16 and above ( ) Using the scale of 1-5, 1 being strongly disagree 2, disagree, 3 not sure, 4, agree and
5strongly agree
Please circle as most appropriate
Section B: Online Boost and service quality
ScaleSN Items 1 2 3 4 5
1 URANET has greatly improved the quality of service 1 2 3 4 52 URANET facilitates inquiry by customers handling. 1 2 3 4 5
3 URANET facilitation of networking among customers. 1 2 3 4 5
4 Customer engagements on the Web Portals have reduced on movements to and from URA.
1 2 3 4 5
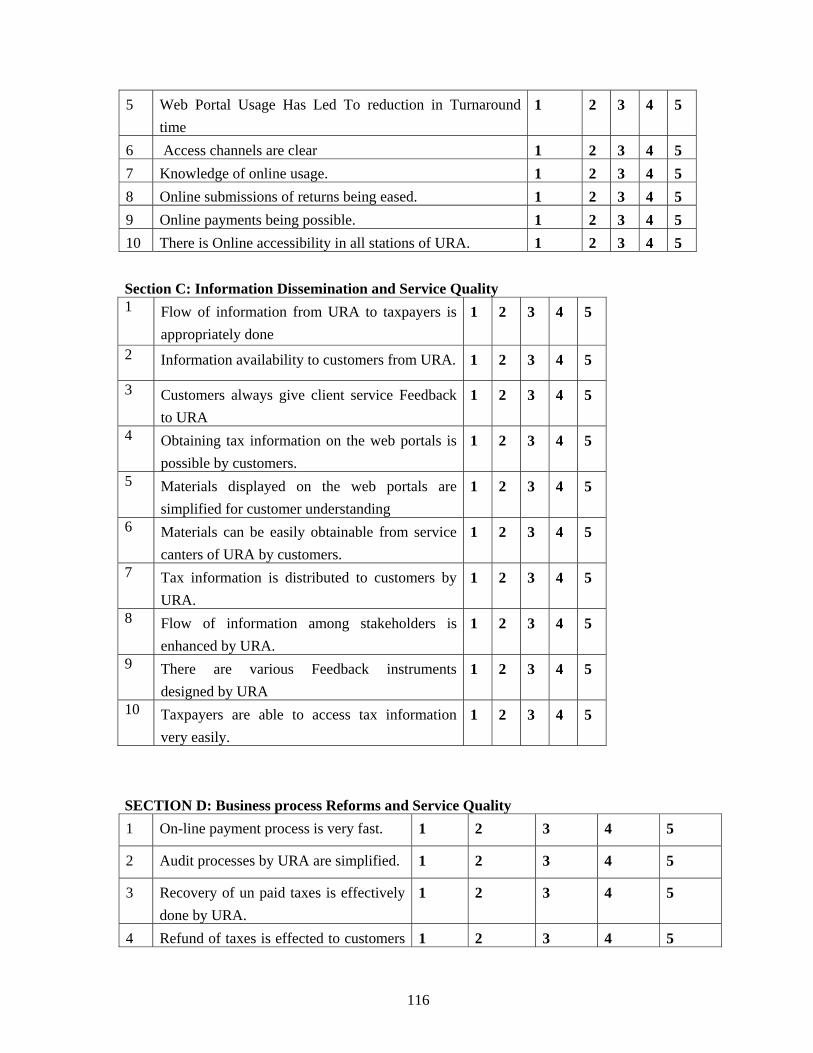
116
5 Web Portal Usage Has Led To reduction in Turnaround time
1 2 3 4 5
6 Access channels are clear 1 2 3 4 57 Knowledge of online usage. 1 2 3 4 58 Online submissions of returns being eased. 1 2 3 4 59 Online payments being possible. 1 2 3 4 510 There is Online accessibility in all stations of URA. 1 2 3 4 5 Section C: Information Dissemination and Service Quality 1 Flow of information from URA to taxpayers is
appropriately done 1 2 3 4 5
2 Information availability to customers from URA. 1 2 3 4 5
3 Customers always give client service Feedback to URA
1 2 3 4 5
4 Obtaining tax information on the web portals is possible by customers.
1 2 3 4 5
5 Materials displayed on the web portals are simplified for customer understanding
1 2 3 4 5
6 Materials can be easily obtainable from service canters of URA by customers.
1 2 3 4 5
7 Tax information is distributed to customers by URA.
1 2 3 4 5
8 Flow of information among stakeholders is enhanced by URA.
1 2 3 4 5
9 There are various Feedback instruments designed by URA
1 2 3 4 5
10 Taxpayers are able to access tax information very easily.
1 2 3 4 5
SECTION D: Business process Reforms and Service Quality 1 On-line payment process is very fast. 1 2 3 4 5
2 Audit processes by URA are simplified. 1 2 3 4 5
3 Recovery of un paid taxes is effectively done by URA.
1 2 3 4 5
4 Refund of taxes is effected to customers 1 2 3 4 5
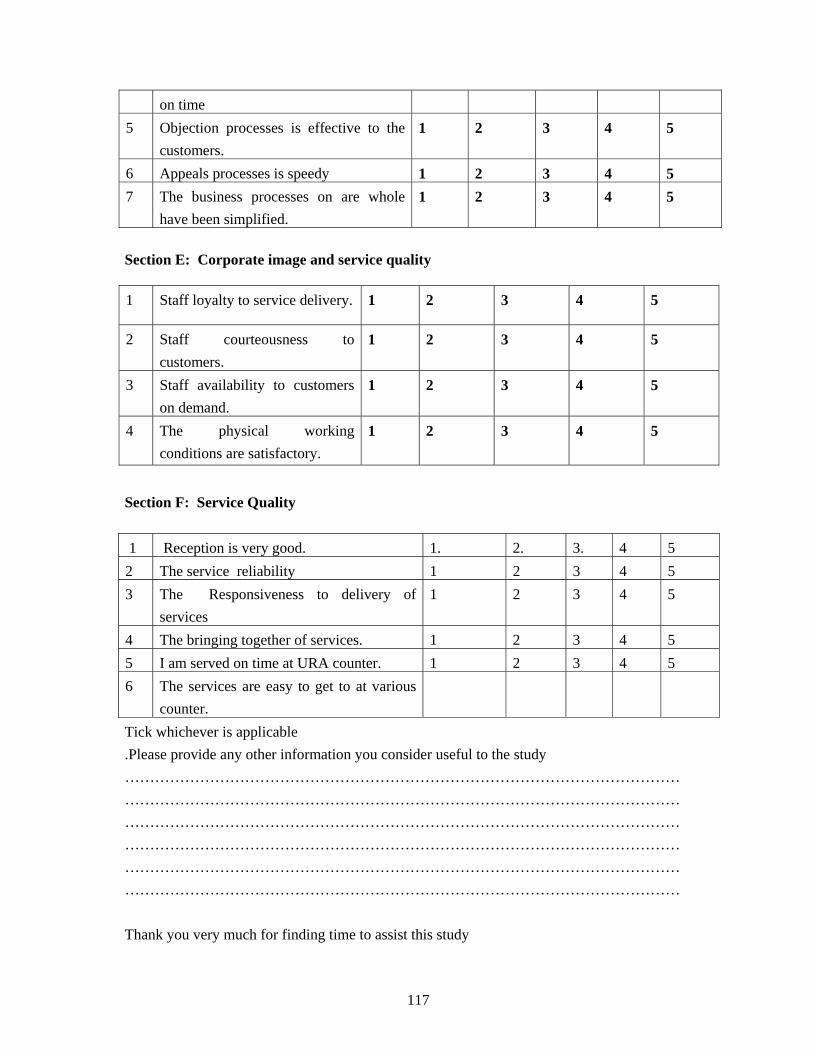
117
on time 5 Objection processes is effective to the
customers. 1 2 3 4 5
6 Appeals processes is speedy 1 2 3 4 57 The business processes on are whole
have been simplified. 1 2 3 4 5
Section E: Corporate image and service quality
1 Staff loyalty to service delivery. 1 2 3 4 5
2 Staff courteousness to customers.
1 2 3 4 5
3 Staff availability to customers on demand.
1 2 3 4 5
4 The physical working conditions are satisfactory.
1 2 3 4 5
Section F: Service Quality 1 Reception is very good. 1. 2. 3. 4 5 2 The service reliability 1 2 3 4 5 3 The Responsiveness to delivery of
services 1 2 3 4 5
4 The bringing together of services. 1 2 3 4 5 5 I am served on time at URA counter. 1 2 3 4 5 6 The services are easy to get to at various
counter.
Tick whichever is applicable .Please provide any other information you consider useful to the study ……………………………………………………………………………………………………………………………………………………………………………………………………………………………………………………………………………………………………………………………………………………………………………………………………………………………………………………………………………………………………………………………………………………………………………………………………………… Thank you very much for finding time to assist this study

118
Appendix B Interview guide
Service Responsiveness 1. Do you think the organisation keeps its promises to the customers? Yes( ) No ( )
If your answer is no, explain (Interviewer probes further)
2. Do you think the organisation provides adequate explanations whenever there is network disconnections/failures. Yes ( ) No ( )
If your answer is no explain (Probes further)
3. Are the staffs prompt in delivering services within the agreed time? Yes ( ) No ( )
If no explain (interviewer probes further)
4. Does this organisation communicate effectively when there is a problem? Yes ( ) No ( ) Explain your answer.
Service Reliability 1. Are the queries answered right the first time? Yes ( ) No ( ). Explain further
2. Does this organisation consistently meet customer expectations? Yes ( ) No (). Give more explanation
3. Are the services easily accessible?
Customer satisfaction
1. Computer accessibility is has led to customers satisfaction.
2. The communications channels have increased on customer satisfaction.
3. Do you think the structural reforms have let to customers satisfaction of quality of your service?
Management quality
4. What controls are in place to ensure conformity to the services?
5. How have these led to management quality?

119
Appendix C: Observation guide
The service centres how crowded.
Appearance of the offices.
Courtesy of staff
Computerization.
Appendix D: Document checklist
Automation Reforms vs. service quality in URA
Effect of structural reforms on service quality
Retooling reforms in URA and their effects on service quality