Embed Size (px)
Citation preview
Institutional PresentationDec. 2007
1
Safe Harbor
The material that follows is a presentation of general background information about TOTVS activities as of the date of the presentation in December 2007activities as of the date of the presentation in December 2007.It is information given in summary form and does not purport to be complete. It is not intended to be relied upon as advice to potential investors.This presentation may contain statements that express management’s expectations and/or p y p g pforecasts about future events.These expectations and/or forecasts involve risks and uncertainties that could cause actual results to differ materially from those projected in such forward-looking statements. y p j gTherefore, the future results of the company may differ from current expectations and readers must not base their expectations exclusively on the information presented herein.No representation or warranty, express or implied, is made concerning, and no reliance should be placed on, the accuracy, fairness, or completeness of the information presented herein.This document does not constitute an offer, or invitation, or solicitation of an offer, to
b ib f h i i N i h hi d hi i dsubscribe for or purchase any securities. Neither this document nor anything contained herein shall form the basis of any contract or commitment whatsoever
2
Topics
FundamentalsBusiness ModelMarket Position
Financial & Operational Performance
3
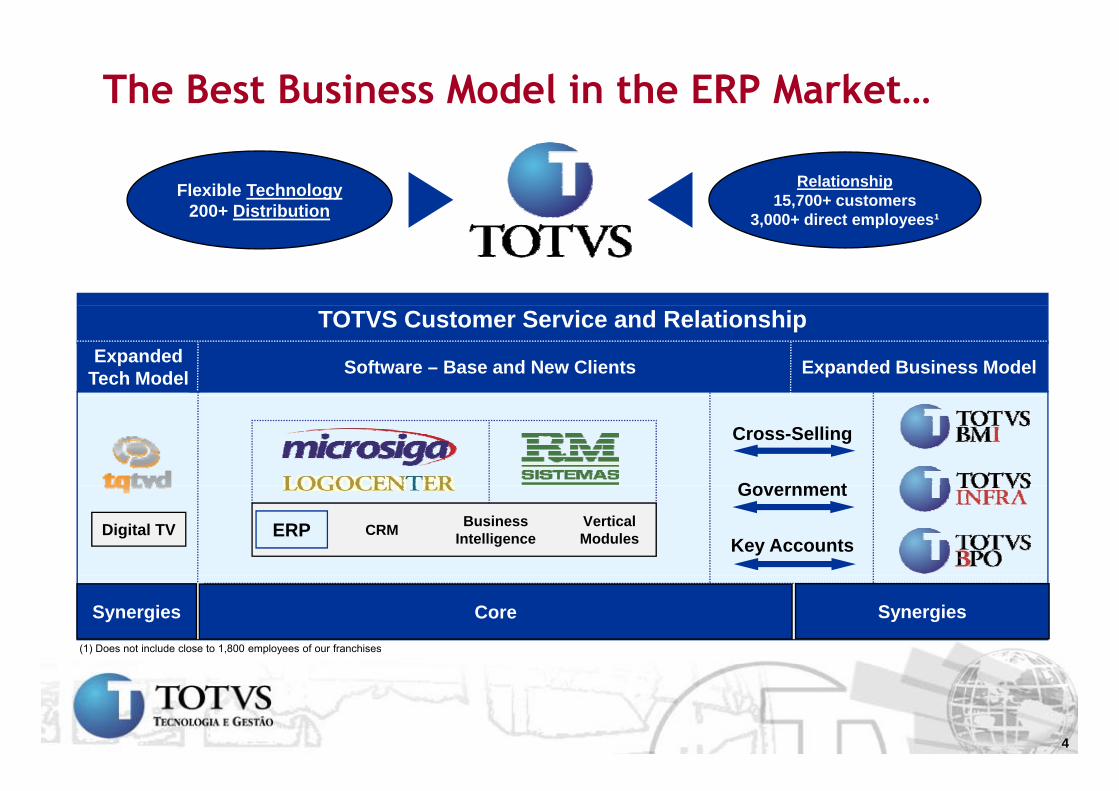
The Best Business Model in the ERP Market…
Flexible Technology200+ Distribution
Relationship15,700+ customers
3 000+ di t l ¹200 Distribution 3,000+ direct employees¹
TOTVS Customer Service and Relationship
Software – Base and New Clients Expanded Business ModelExpanded Tech Model
Cross-Selling
G t
ERP CRM BusinessIntelligence
VerticalModules
Government
Key AccountsDigital TV
(1) Does not include close to 1,800 employees of our franchises
Core SynergiesSynergies
4
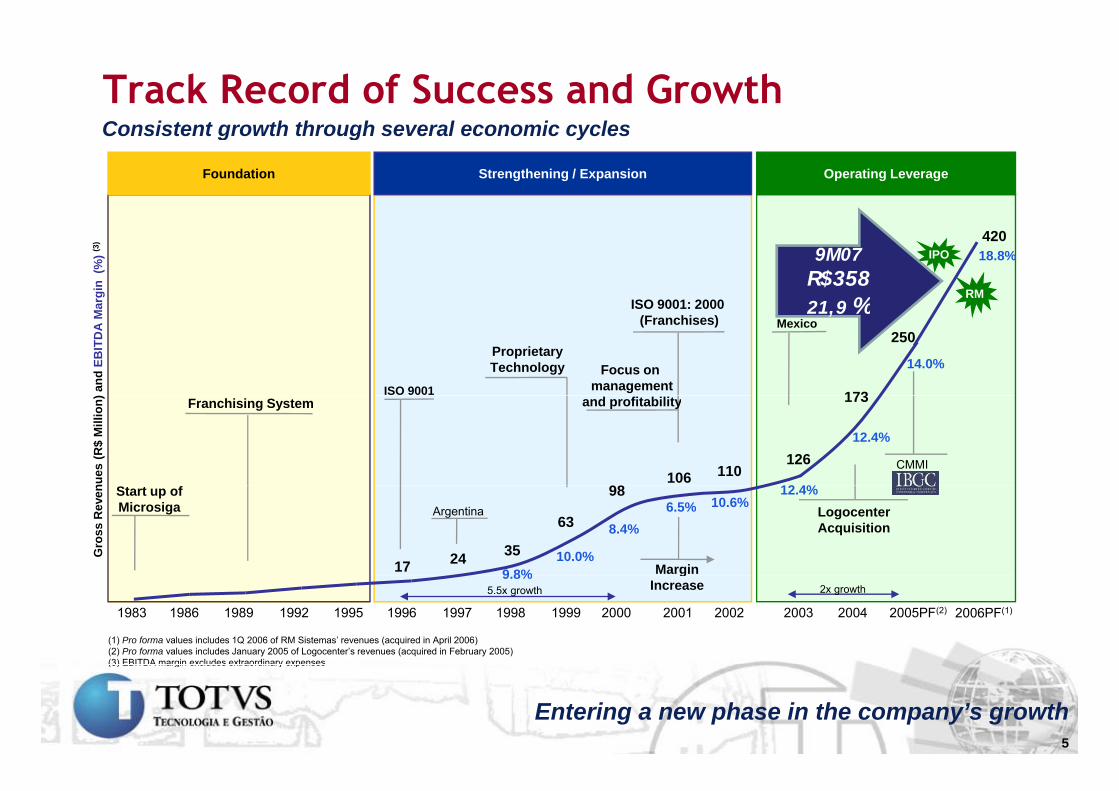
Track Record of Success and GrowthConsistent growth through several economic cyclesConsistent growth through several economic cycles
Foundation Strengthening / Expansion Operating Leverage
ISO 9001: 2000
IPO
RM
42018.8%
argi
n (%
) (3)
9M07R$35821 9 %
ProprietaryTechnology
ISO 9001
ISO 9001: 2000(Franchises) Mexico
Focus on management
14.0%
250
173 and
EB
ITD
A M
a 21,9 %
12 4%
Franchising System
CMMI
and profitability
12.4%
173
110126
10698nu
es (R
$ M
illio
n)
12.4%10.6%
Start up of Microsiga Argentina Logocenter
Acquisition
9 8%10.0%
8.4%6.5%
Margin
98
63
352417
Gro
ss R
even
1983 1986 1989 1992 1995 1996 1997 1998 1999 2000 2001 2002 2003 2004 2005PF(2)
9.8% gIncrease5.5x growth 2x growth
2006PF(1)
(1) Pro forma values includes 1Q 2006 of RM Sistemas’ revenues (acquired in April 2006)(2) Pro forma values includes January 2005 of Logocenter’s revenues (acquired in February 2005)(3) EBITDA margin excludes extraordinary expenses
5
Entering a new phase in the company’s growth
(3) EBITDA margin excludes extraordinary expenses
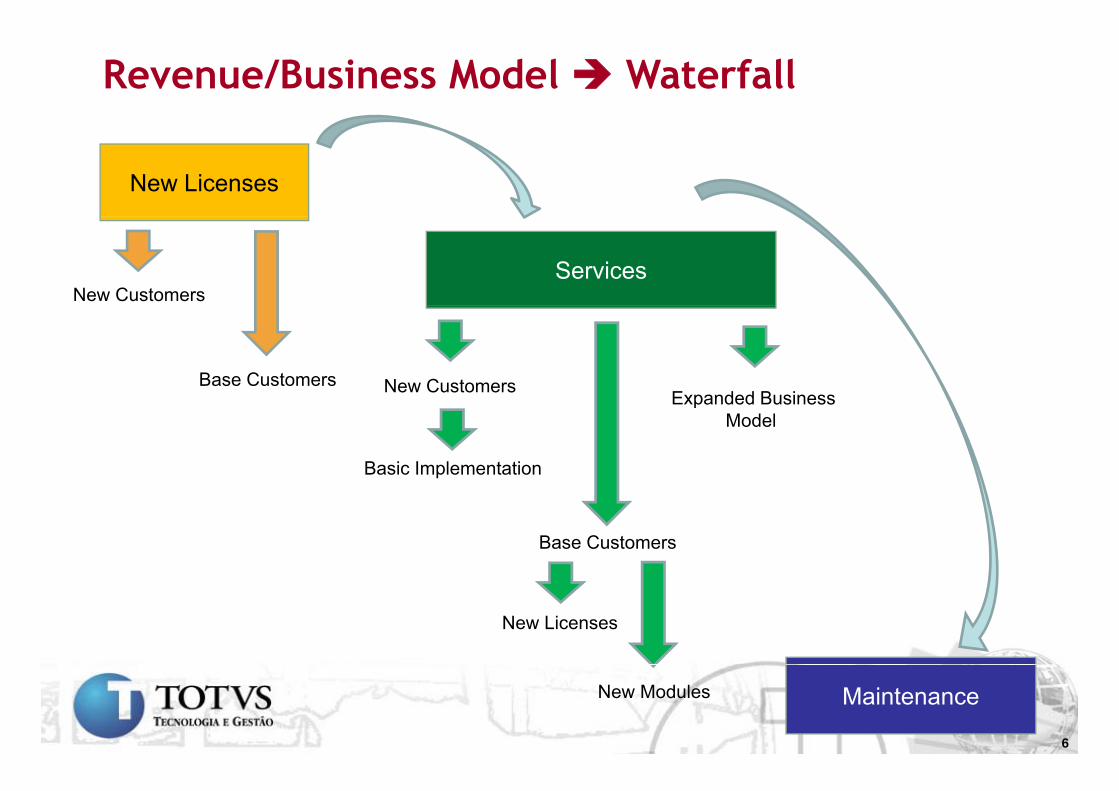
Revenue/Business Model Waterfall
New Licenses
New CustomersServices
Base Customers New Customers Expanded Business
Basic Implementation
Expanded BusinessModel
Base Customers
New Licenses
New Modules Maintenance
6
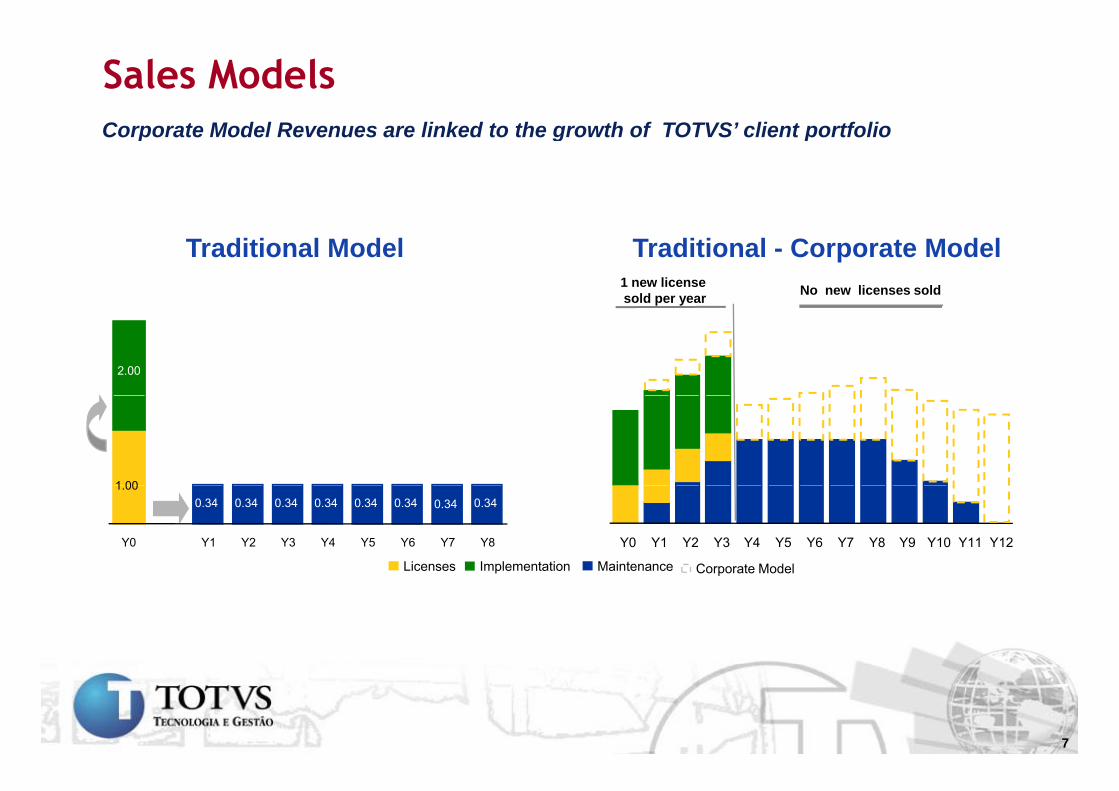
Corporate Model Revenues are linked to the growth of TOTVS’ client portfolio
Sales ModelsCorporate Model Revenues are linked to the growth of TOTVS’ client portfolio
Traditional Model Traditional - Corporate ModelNo new licenses sold1 new license
sold per year
2.00
1 00
MaintenanceLicenses Implementation
Y0 Y1 Y2 Y3 Y4 Y5 Y6 Y7 Y8 Y9 Y10 Y11 Y12
Corporate Model
0.34 0.34 0.34 0.34 0.34 0.34 0.341.00
0.34
Y0 Y1 Y2 Y3 Y4 Y5 Y6 Y7 Y8
p
7
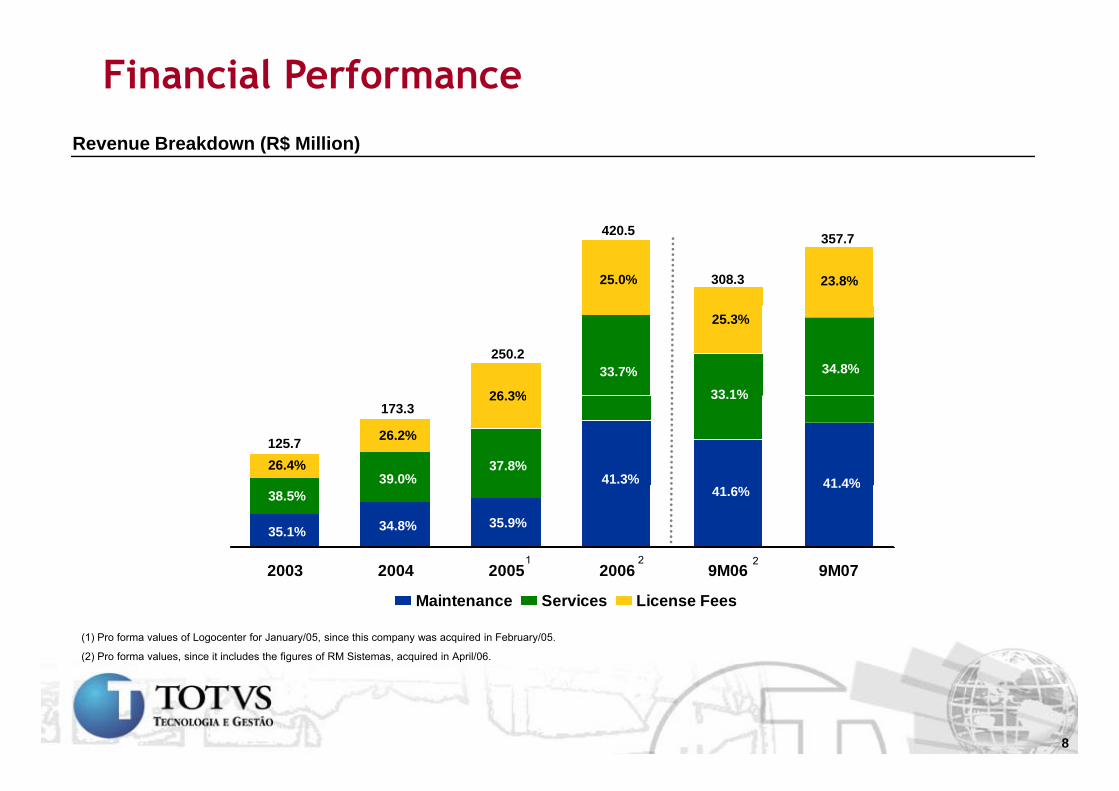
Financial PerformanceRevenue Breakdown (R$ Million)
25.0%
420.5
308.3 23.8%
357.7
33.7%
26 3%
250.2
33 1%
25.3%
34.8%
41.3%39.0%26.4%
26.2%125.7
173.3
37.8%
26.3% 33.1%
41 4%
2003 2004 2005 2006 9M06 9M07
35.1% 34.8%
38.5%
35.9%
41.6%
1 2
41.4%
22003 2004 2005 2006 9M06 9M07
Maintenance Services License Fees
(1) Pro forma values of Logocenter for January/05, since this company was acquired in February/05.
(2) Pro forma values, since it includes the figures of RM Sistemas, acquired in April/06.
8
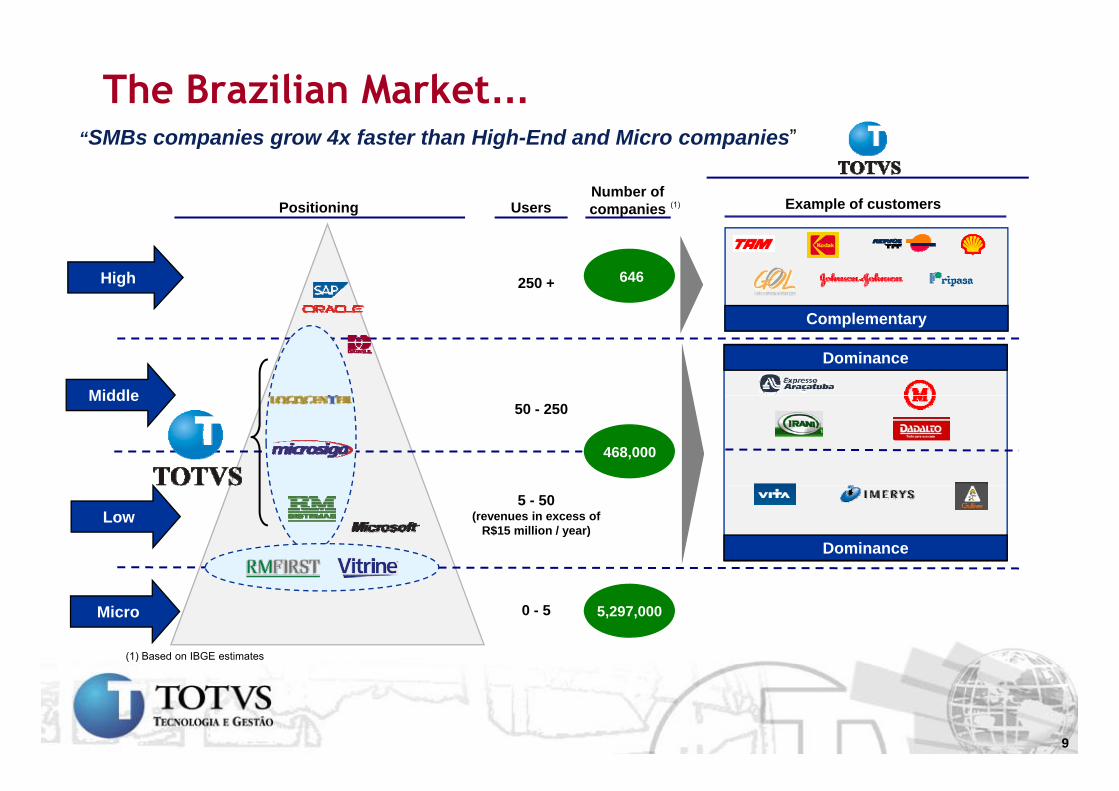
The Brazilian Market…
UsersNumber ofcompanies Example of customers(1)Positioning
“SMBs companies grow 4x faster than High-End and Micro companies”
p
646High 250 +
Complementary
Middle
Dominance
468,000
Middle50 - 250
Dominance
Low5 - 50
(revenues in excess of R$15 million / year)
(1) Based on IBGE estimates
5,297,000Micro 0 - 5
9
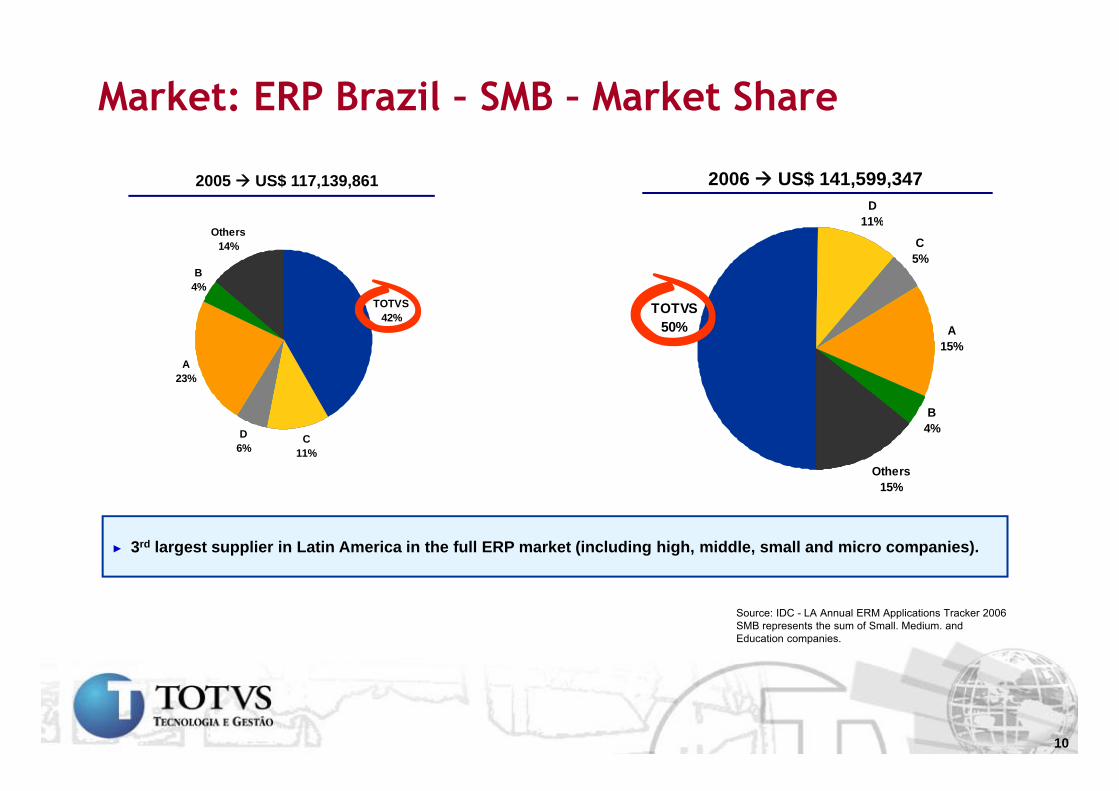
Market: ERP Brazil – SMB – Market Share
D
2005 US$ 117,139,861 2006 US$ 141,599,347
11%
C5%
TOTVSTOTVS
B4%
Others14%
A15%
TOTVS50%
TOTVS42%
A23%
B4%
Others15%
C11%
D6%
► 3rd largest supplier in Latin America in the full ERP market (including high, middle, small and micro companies).
15%
Source: IDC - LA Annual ERM Applications Tracker 2006SMB represents the sum of Small. Medium. and Education companies.
10
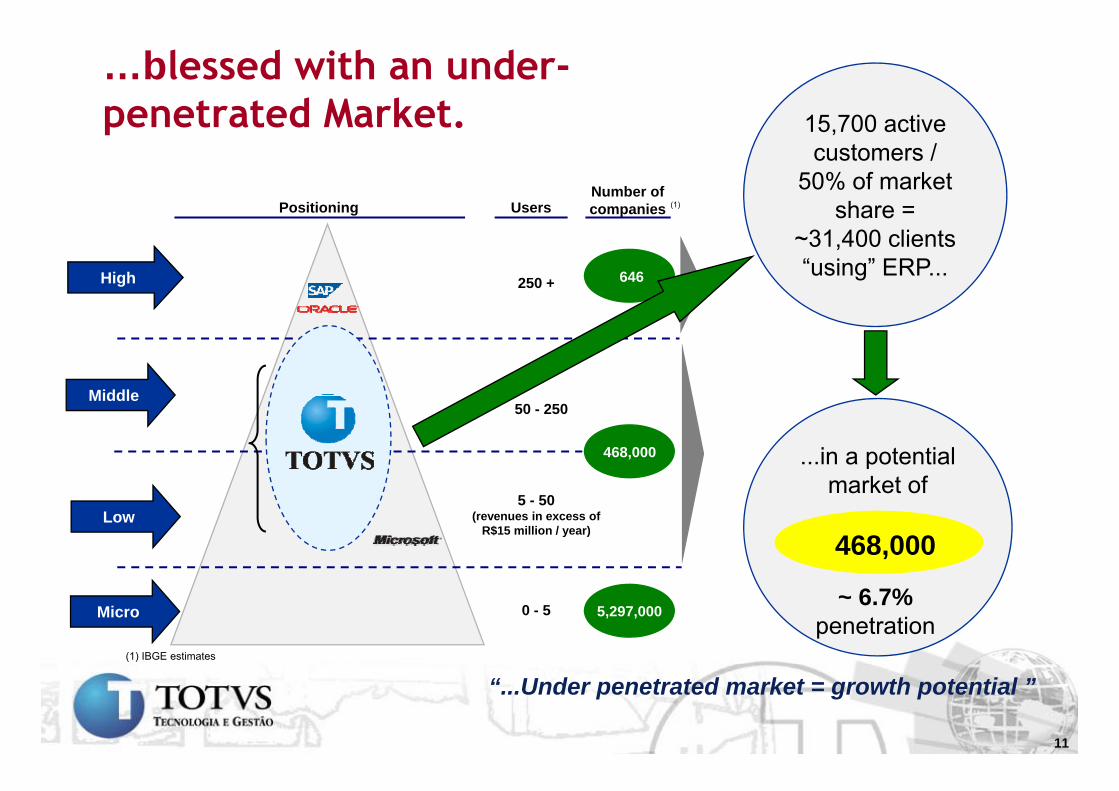
…blessed with an under-penetrated Market. 15 700 activepenetrated Market.
UsersNumber ofcompanies (1)Positioning
15,700 active customers /
50% of market share =p
250 +
share ~31,400 clients “using” ERP...High 646
Middle50 - 250
...in a potential market of
Middle
468,000
5 - 50(revenues in excess of
R$15 million / year)
market of
468,000Low
(1) IBGE estimates
0 - 5 ~ 6.7%penetration
Micro 5,297,000
11
“...Under penetrated market = growth potential ”
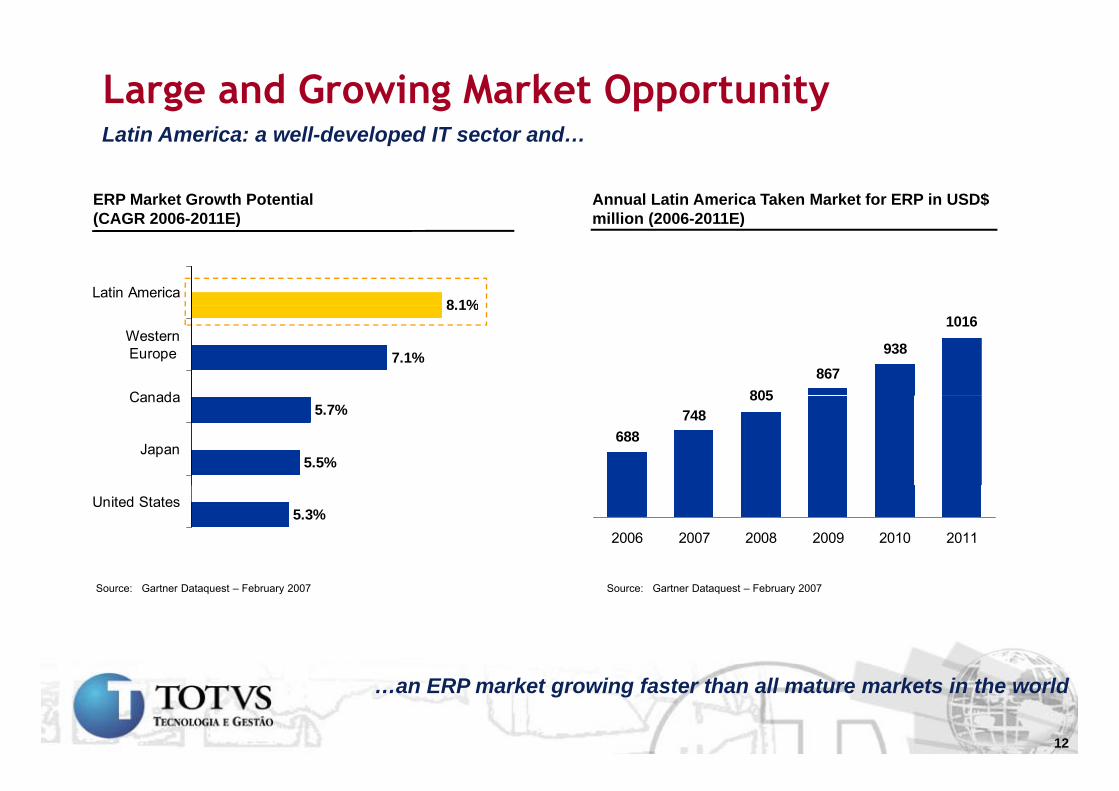
Large and Growing Market Opportunity
ERP Market Growth Potential(CAGR 2006 2011E)
Latin America: a well-developed IT sector and…
Annual Latin America Taken Market for ERP in USD$ million (2006 2011E)(CAGR 2006-2011E) million (2006-2011E)
8 1%Latin America
7.1%
8.1%
Canada
WesternEurope
805867
938
1016
5.5%
5.7%
Japan
Canada
688748
805
5.3%United States
2006 2007 2008 2009 2010 2011
Source: Gartner Dataquest – February 2007 Source: Gartner Dataquest – February 2007
12
…an ERP market growing faster than all mature markets in the world
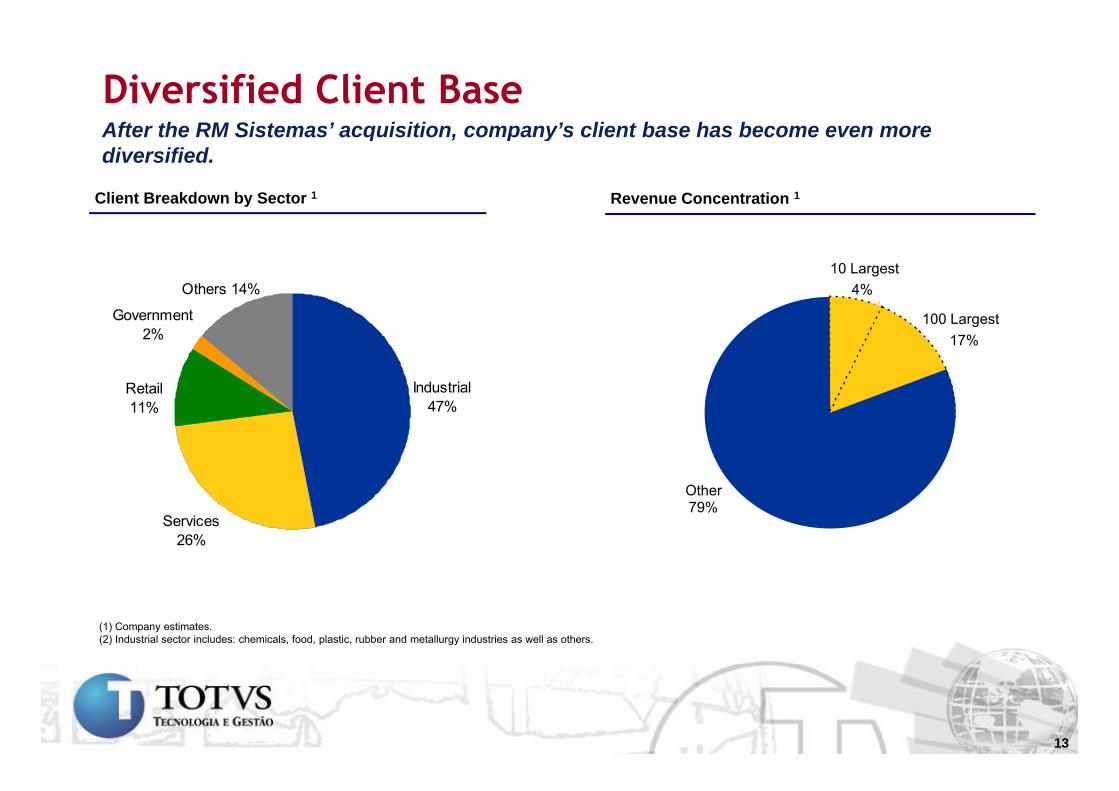
After the RM Sistemas’ acquisition company’s client base has become even moreDiversified Client BaseAfter the RM Sistemas’ acquisition, company’s client base has become even more diversified.
Revenue Concentration 1Client Breakdown by Sector 1
4%10 Largest
Others 14%
100 Largest17%
Industrial
Government 2%
Retail
Oth
47%11%
Other79%
Services 26%
(1) Company estimates.(2) Industrial sector includes: chemicals, food, plastic, rubber and metallurgy industries as well as others.
13
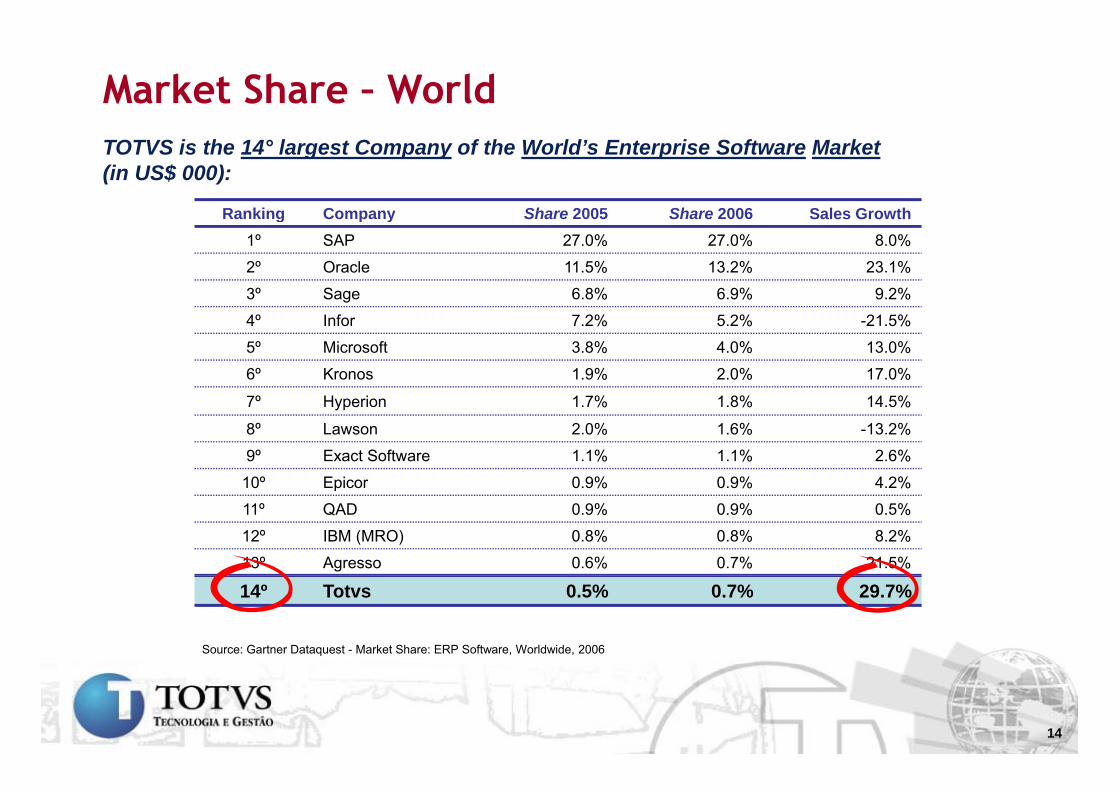
Market Share – World
Ranking Company Share 2005 Share 2006 Sales Growth
TOTVS is the 14° largest Company of the World’s Enterprise Software Market(in US$ 000):
Ranking Company Share 2005 Share 2006 Sales Growth1º SAP 27.0% 27.0% 8.0%
2º Oracle 11.5% 13.2% 23.1%
3º Sage 6.8% 6.9% 9.2%
4º Infor 7.2% 5.2% -21.5%
5º Microsoft 3.8% 4.0% 13.0%
6º Kronos 1.9% 2.0% 17.0%
º H i 1 % 1 8% 14 %7º Hyperion 1.7% 1.8% 14.5%
8º Lawson 2.0% 1.6% -13.2%
9º Exact Software 1.1% 1.1% 2.6%
10º Epicor 0 9% 0 9% 4 2%10 Epicor 0.9% 0.9% 4.2%
11º QAD 0.9% 0.9% 0.5%
12º IBM (MRO) 0.8% 0.8% 8.2%
13º Agresso 0.6% 0.7% 21.5%
14º Totvs 0.5% 0.7% 29.7%
Source: Gartner Dataquest - Market Share: ERP Software, Worldwide, 2006
14
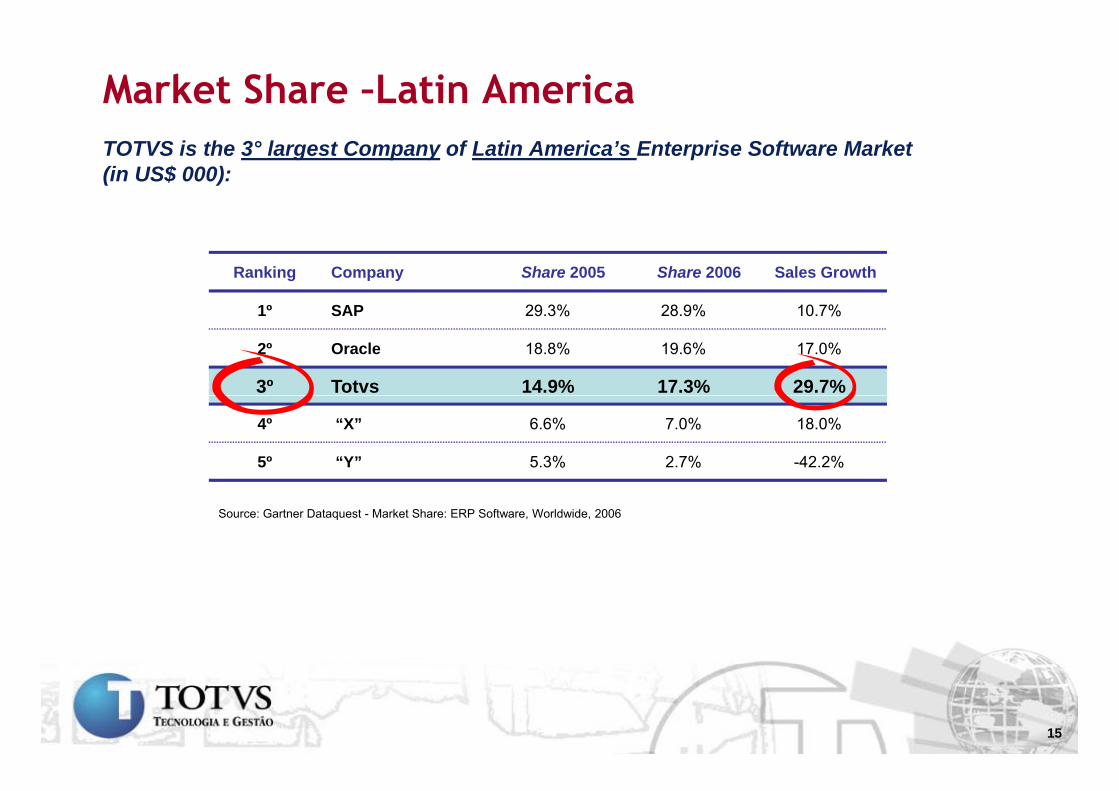
Market Share –Latin AmericaTOTVS is the 3° largest Company of Latin America’s Enterprise Software Market (in US$ 000):
Ranking Company Share 2005 Share 2006 Sales Growth
1º SAP 29 3% 28 9% 10 7%1º SAP 29.3% 28.9% 10.7%
2º Oracle 18.8% 19.6% 17.0%
3º Totvs 14.9% 17.3% 29.7%
4º “X” 6.6% 7.0% 18.0%
5º “Y” 5.3% 2.7% -42.2%
Source: Gartner Dataquest - Market Share: ERP Software, Worldwide, 2006
15
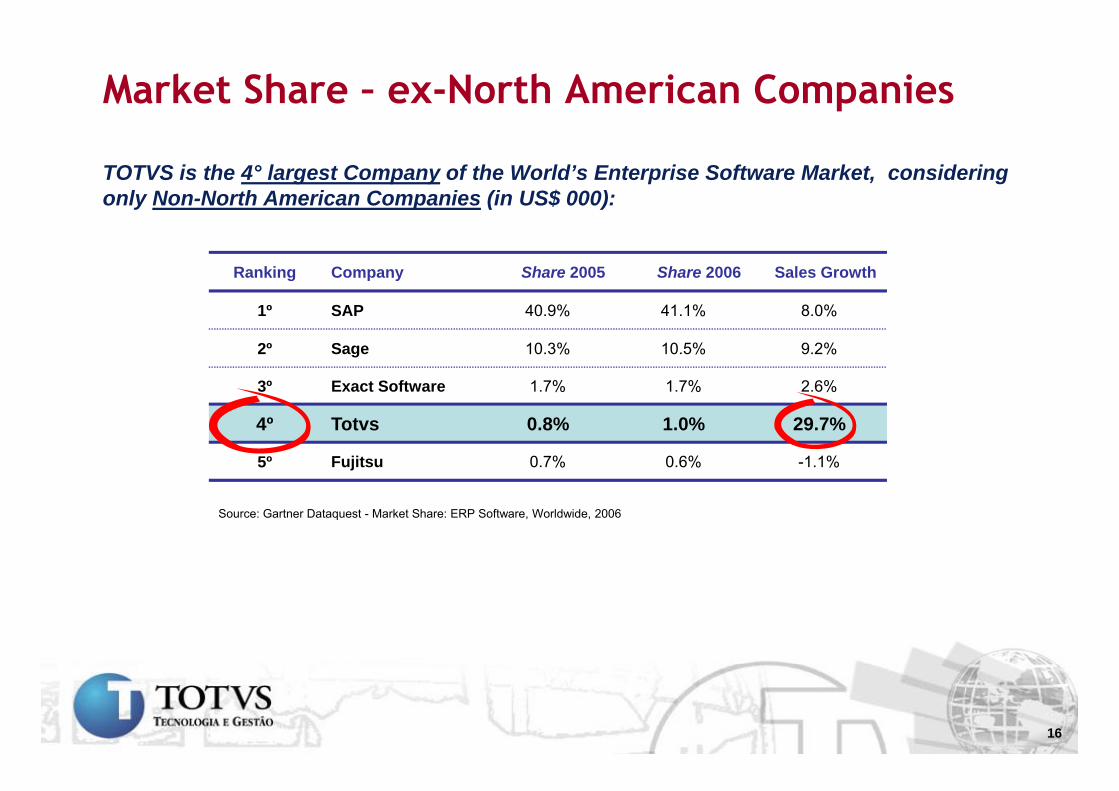
Market Share – ex-North American Companies
TOTVS is the 4° largest Company of the World’s Enterprise Software Market, considering only Non-North American Companies (in US$ 000):
Ranking Company Share 2005 Share 2006 Sales Growth
1º SAP 40 9% 41 1% 8 0%1º SAP 40.9% 41.1% 8.0%
2º Sage 10.3% 10.5% 9.2%
3º Exact Software 1.7% 1.7% 2.6%
4º Totvs 0.8% 1.0% 29.7%
5º Fujitsu 0.7% 0.6% -1.1%
Source: Gartner Dataquest - Market Share: ERP Software, Worldwide, 2006
16
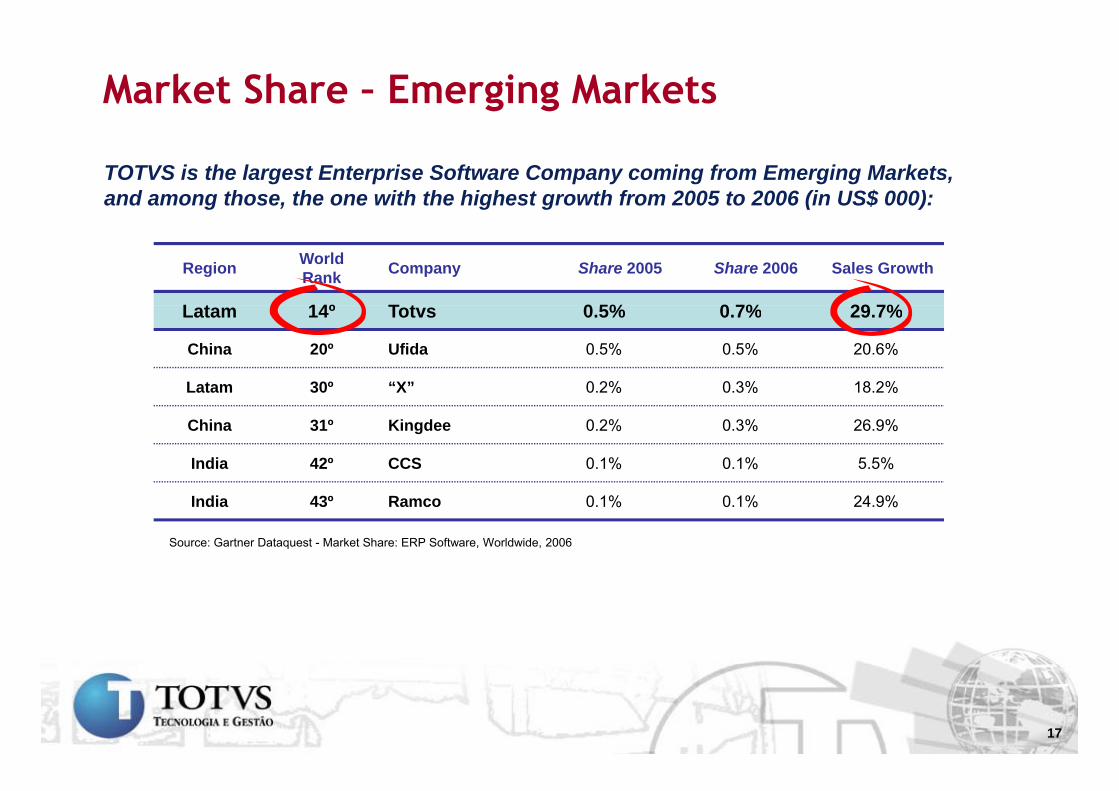
Market Share – Emerging Markets
TOTVS is the largest Enterprise Software Company coming from Emerging Markets, and among those, the one with the highest growth from 2005 to 2006 (in US$ 000):
Region World Rank Company Share 2005 Share 2006 Sales Growth
L t 14º T t 0 5% 0 7% 29 7%Latam 14º Totvs 0.5% 0.7% 29.7%
China 20º Ufida 0.5% 0.5% 20.6%
Latam 30º “X” 0.2% 0.3% 18.2%
China 31º Kingdee 0.2% 0.3% 26.9%
India 42º CCS 0.1% 0.1% 5.5%
Source: Gartner Dataquest - Market Share: ERP Software, Worldwide, 2006
India 43º Ramco 0.1% 0.1% 24.9%
17

Flexible Middleware…
User View.
The language is responsible for communicatingapplication commands, as ERP, to the next
technological layer, the middleware.
The middleware acts as an interpreter and facilitator, “translating” and connecting the language commands with the framework. TOTVS Tec, the
middleware developed by TOTVS, translates and communicates the ADVPL d 4GL l t id f ti t kiADVPL and 4GL languages to a wide range of operating systems, working
with any hardware. It provides platform independence and access to the most advanced resources, such as SOA and Web Services.
The middlewares available in the market work based on a framework. TOTVS Tec’s framework is developed in C++ and is able to operate on
any operating system, giving the customer flexibility in the choice of the technology platform.
18
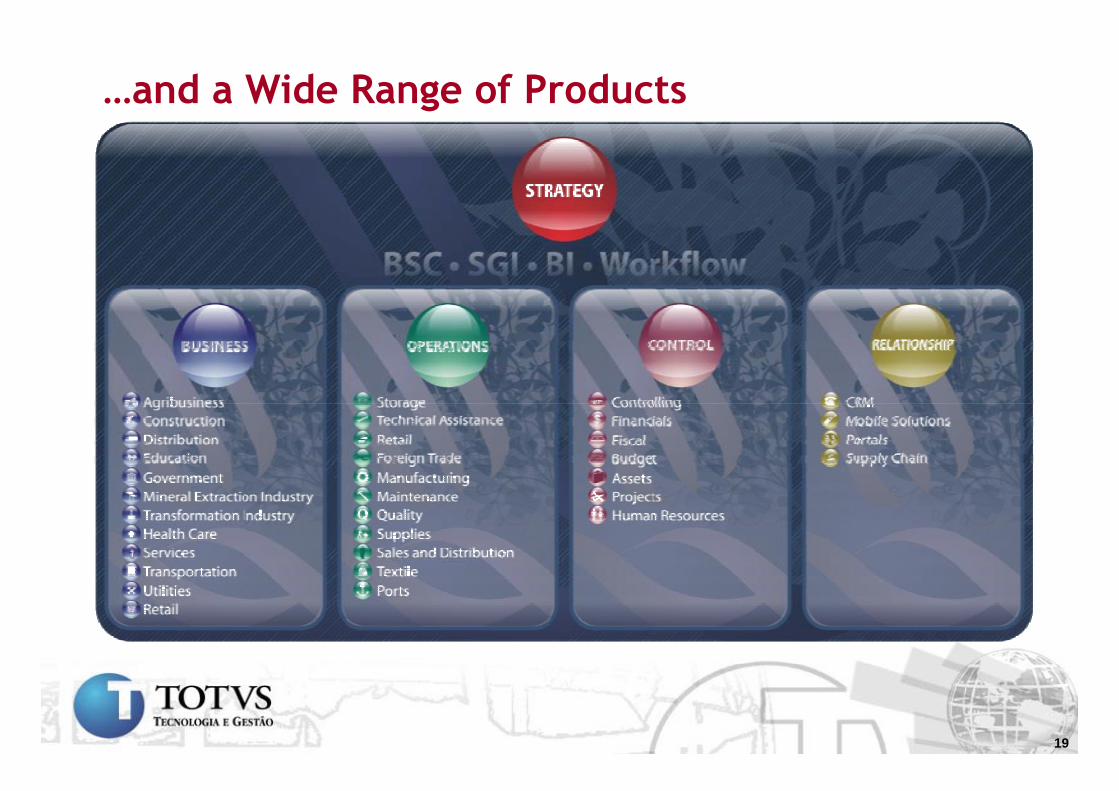
…and a Wide Range of Products
19
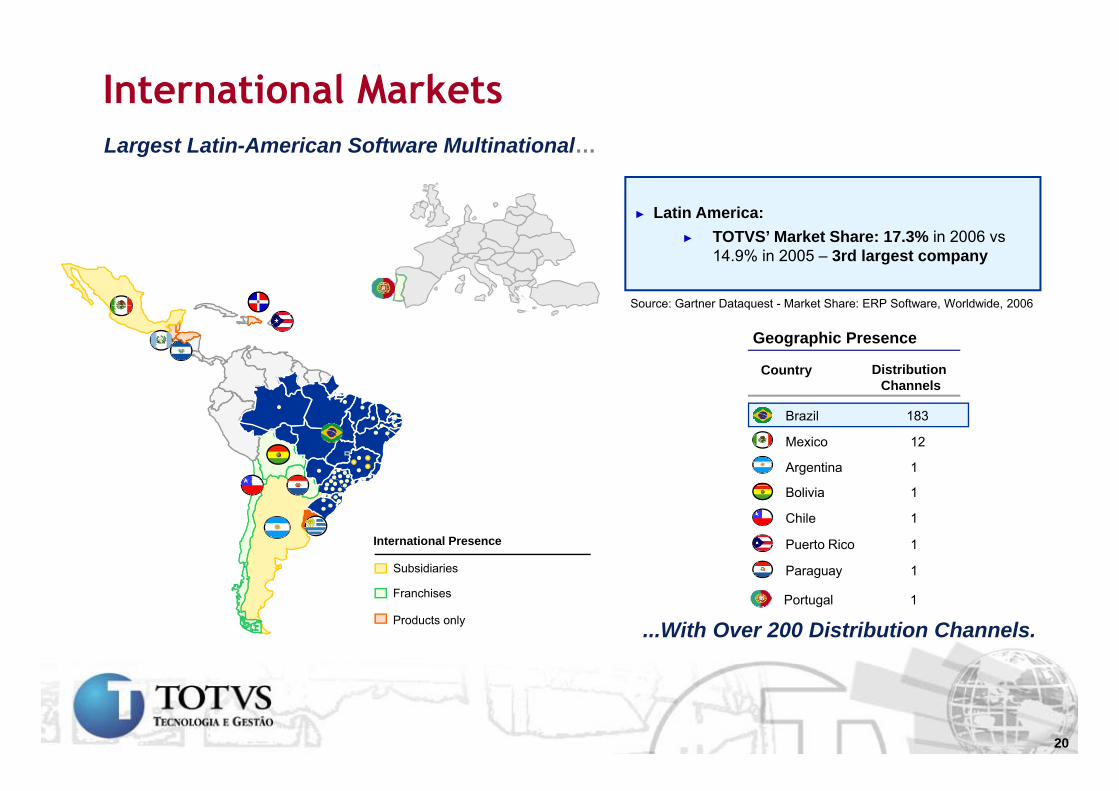
International MarketsLargest Latin-American Software Multinational…
► Latin America:► Latin America:► TOTVS’ Market Share: 17.3% in 2006 vs
14.9% in 2005 – 3rd largest company
Source: Gartner Dataquest - Market Share: ERP Software Worldwide 2006
Country Distribution Channels
Geographic Presence
Source: Gartner Dataquest Market Share: ERP Software, Worldwide, 2006
Argentina 1
Mexico 12
Brazil 183
Subsidiaries
International Presence
Chile 1
Puerto Rico 1
Paraguay 1
Bolivia 1
Franchises
Products only
Paraguay 1
Portugal 1
...With Over 200 Distribution Channels.
20
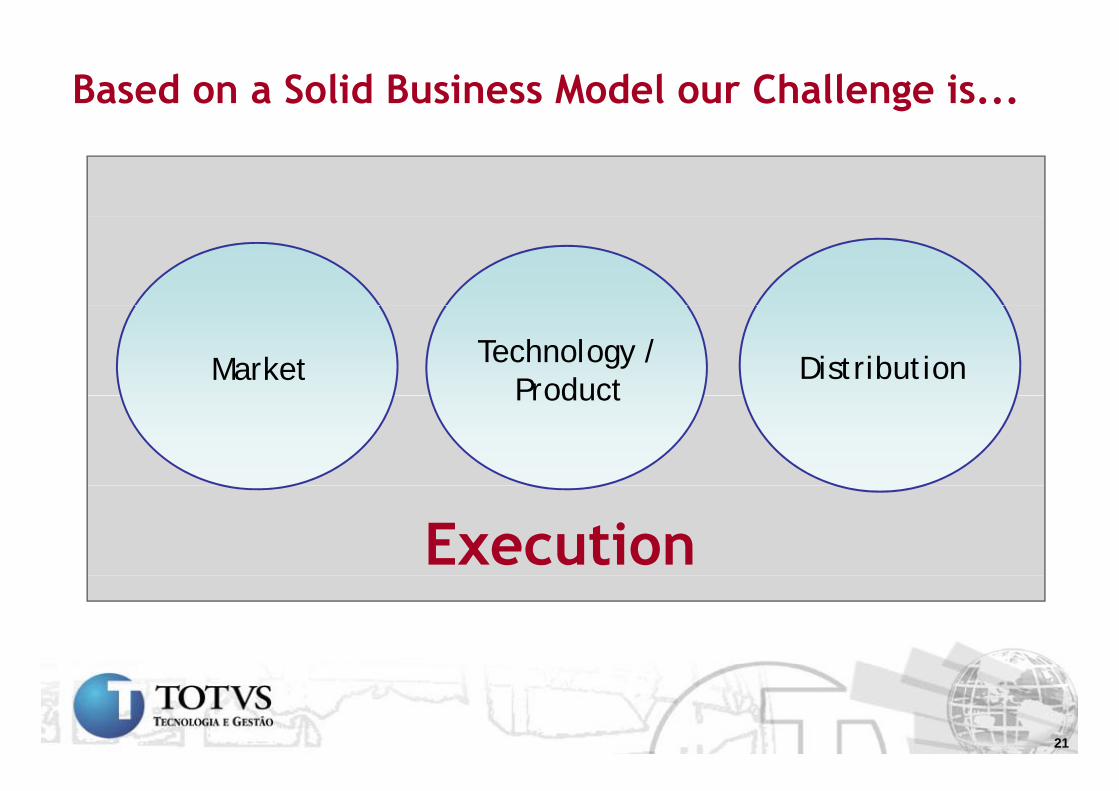
Based on a Solid Business Model our Challenge is...
Market DistributionTechnology / ProductProduct
Execution
21
Fi i l d O ti l Financial and Operational Performance
2222
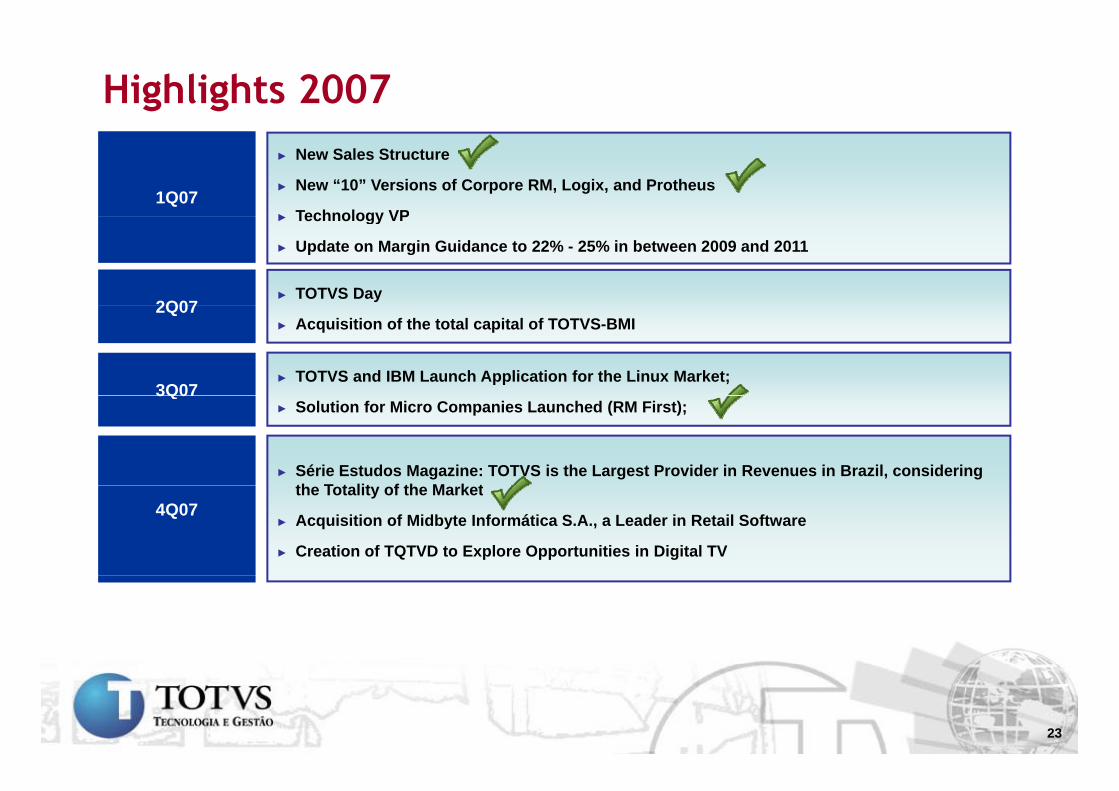
Highlights 2007
1Q07
► New Sales Structure
► New “10” Versions of Corpore RM, Logix, and Protheus
► Technology VP► Technology VP
► Update on Margin Guidance to 22% - 25% in between 2009 and 2011
2Q07► TOTVS Day
2Q07► Acquisition of the total capital of TOTVS-BMI
3Q07► TOTVS and IBM Launch Application for the Linux Market;
3Q07► Solution for Micro Companies Launched (RM First);
► Série Estudos Magazine: TOTVS is the Largest Provider in Revenues in Brazil, considering th T t lit f th M k t
4Q07the Totality of the Market
► Acquisition of Midbyte Informática S.A., a Leader in Retail Software
► Creation of TQTVD to Explore Opportunities in Digital TV
23
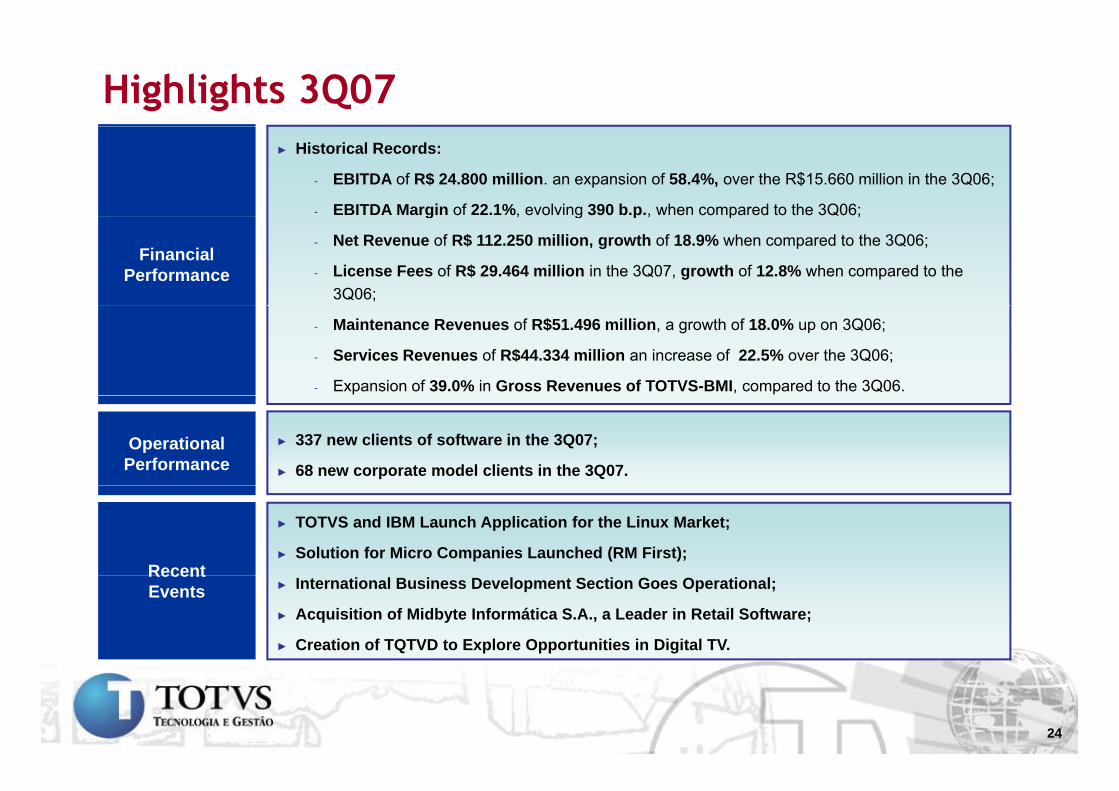
Highlights 3Q07 ► Historical Records:
- EBITDA of R$ 24.800 million. an expansion of 58.4%, over the R$15.660 million in the 3Q06;
- EBITDA Margin of 22.1%, evolving 390 b.p., when compared to the 3Q06;
Financial Performance
g , g p , p ;
- Net Revenue of R$ 112.250 million, growth of 18.9% when compared to the 3Q06;
- License Fees of R$ 29.464 million in the 3Q07, growth of 12.8% when compared to the 3Q06;
- Maintenance Revenues of R$51.496 million, a growth of 18.0% up on 3Q06;
- Services Revenues of R$44.334 million an increase of 22.5% over the 3Q06;
- Expansion of 39.0% in Gross Revenues of TOTVS-BMI, compared to the 3Q06.
Operational Performance
► 337 new clients of software in the 3Q07;
► 68 new corporate model clients in the 3Q07.
Recent
► TOTVS and IBM Launch Application for the Linux Market;
► Solution for Micro Companies Launched (RM First);Recent Events ► International Business Development Section Goes Operational;
► Acquisition of Midbyte Informática S.A., a Leader in Retail Software;
► Creation of TQTVD to Explore Opportunities in Digital TV.
24
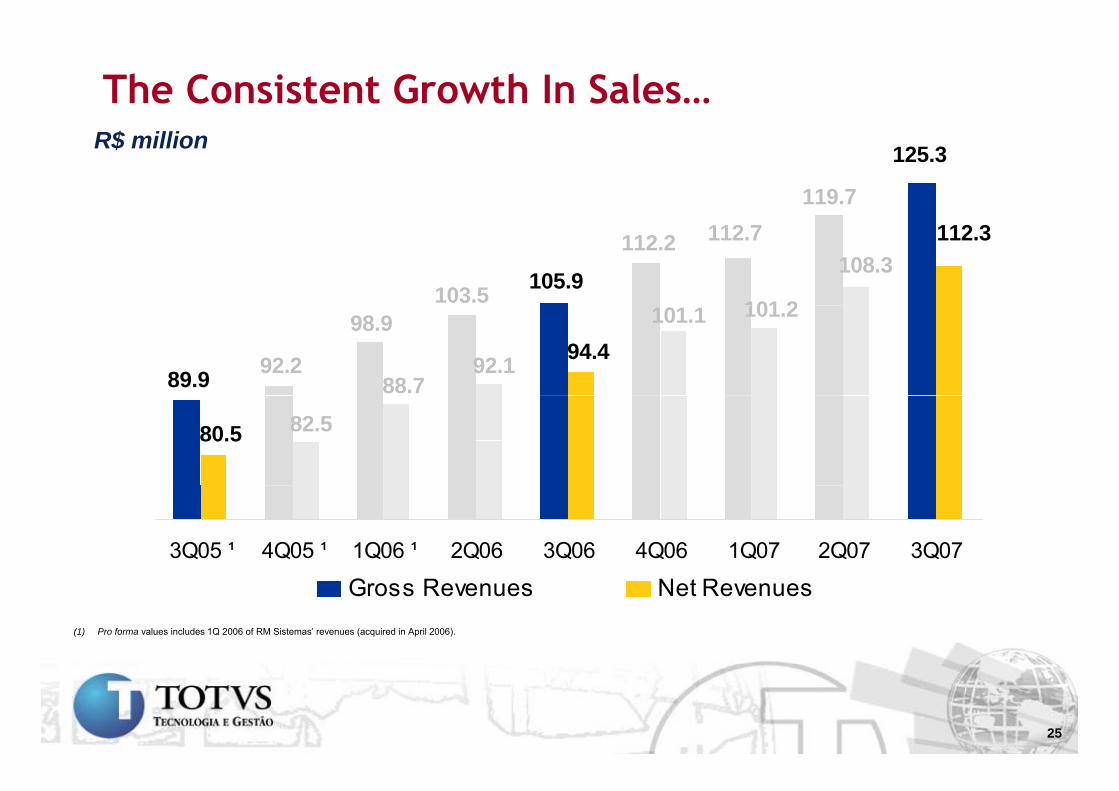
The Consistent Growth In Sales…
119.7
125.3R$ million
112.7112.2105.9103.5 101 2
108.3112.3
98.9
92.289.9 88.792.1 94.4
101.1 101.2
80.5 82.5
3Q05 ¹ 4Q05 ¹ 1Q06 ¹ 2Q06 3Q06 4Q06 1Q07 2Q07 3Q07
Gross Revenues Net Revenues(1) Pro forma values includes 1Q 2006 of RM Sistemas’ revenues (acquired in April 2006).
25
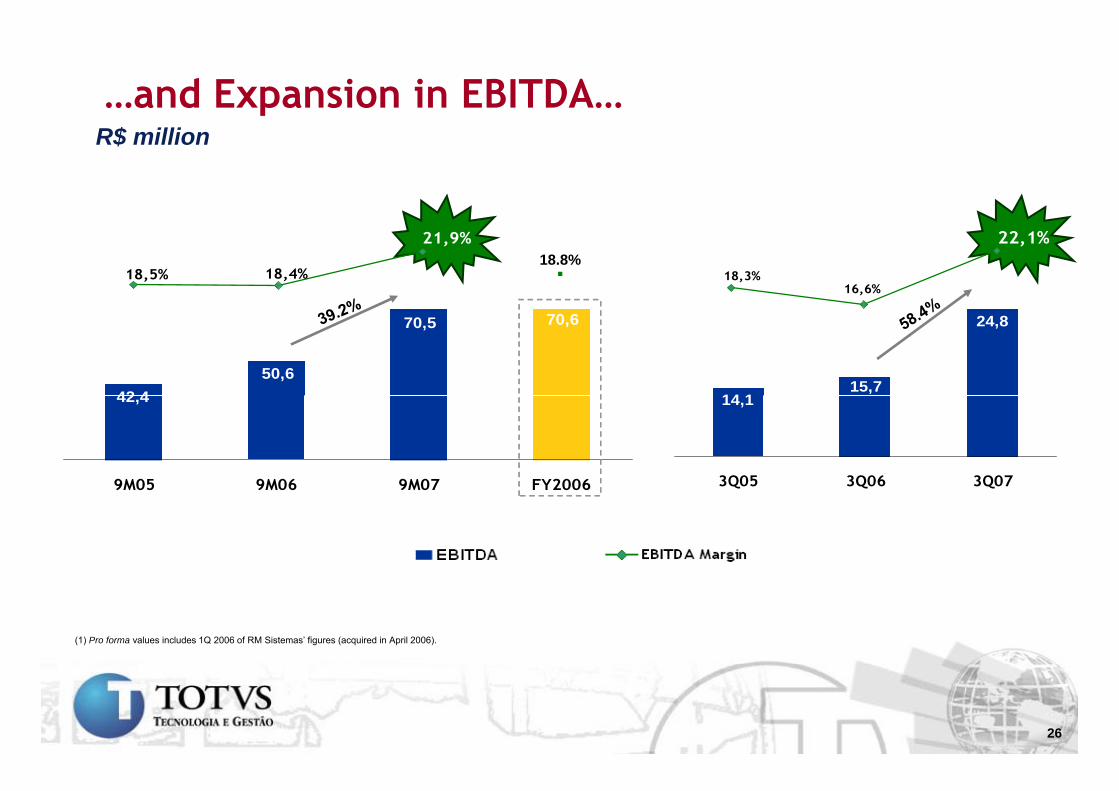
…and Expansion in EBITDA…$R$ million
18,4%18,5%
21,9%
16,6%18,3%
22,1%
.18.8%
24,8
15,714 1
70,5
50,642 4
70,6
14,1
3Q05 3Q06 3Q07
42,4
9M05 9M06 9M07 FY2006 3Q05 3Q06 3Q079M05 9M06 9M07 FY2006
(1) Pro forma values includes 1Q 2006 of RM Sistemas’ figures (acquired in April 2006).
26
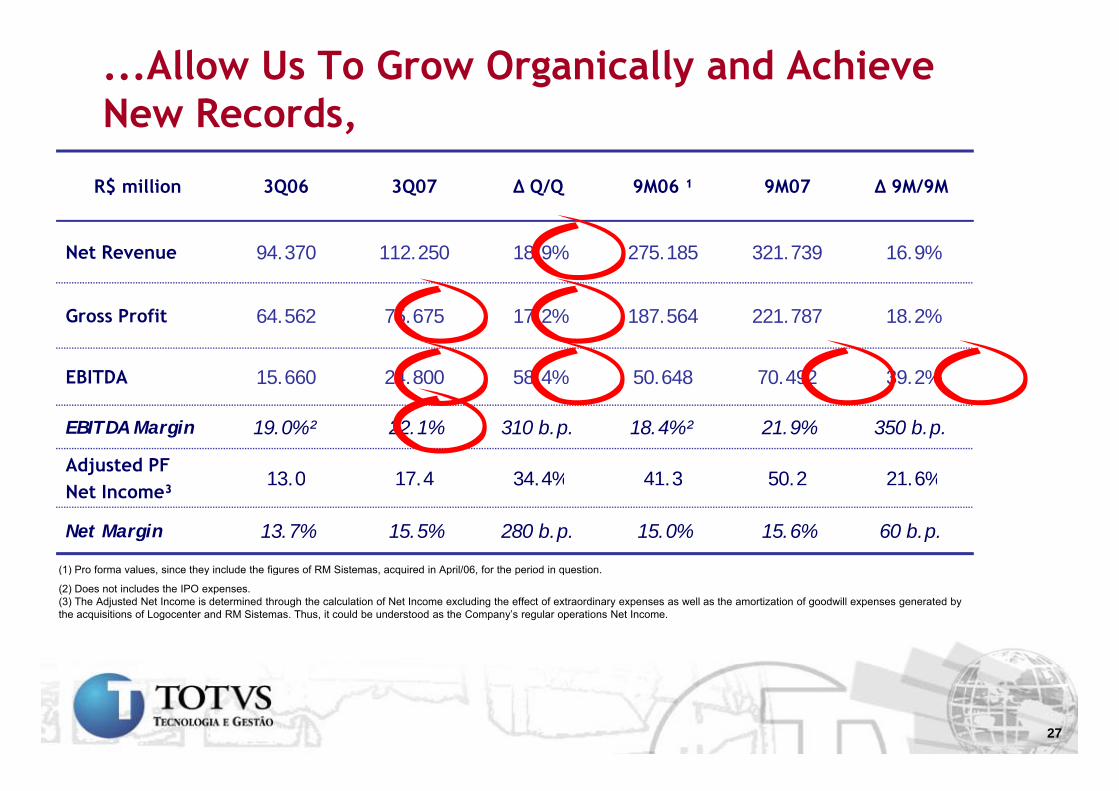
...Allow Us To Grow Organically and Achieve New Records,
R$ million 3Q06 3Q07 Δ Q/Q 9M06 ¹ 9M07 Δ 9M/9M
New Records,
Net Revenue 94.370 112.250 18.9% 275.185 321.739 16.9%
Gross Profit 64.562 75.675 17.2% 187.564 221.787 18.2%
EBITDA 15.660 24.800 58.4% 50.648 70.492 39.2%
EBITDA Margin 19.0% ² 22.1% 310 b.p. 18.4% ² 21.9% 350 b.p.
Adjusted PF N I ³
13.0 17.4 34.4% 41.3 50.2 21.6%Net Income³
3.0 . 3 . % .3 50. .6%
Net Margin 13.7% 15.5% 280 b.p. 15.0% 15.6% 60 b.p.
(1) Pro forma values, since they include the figures of RM Sistemas, acquired in April/06, for the period in question.( ) y g q p p q
(2) Does not includes the IPO expenses.(3) The Adjusted Net Income is determined through the calculation of Net Income excluding the effect of extraordinary expenses as well as the amortization of goodwill expenses generated by the acquisitions of Logocenter and RM Sistemas. Thus, it could be understood as the Company’s regular operations Net Income.
27
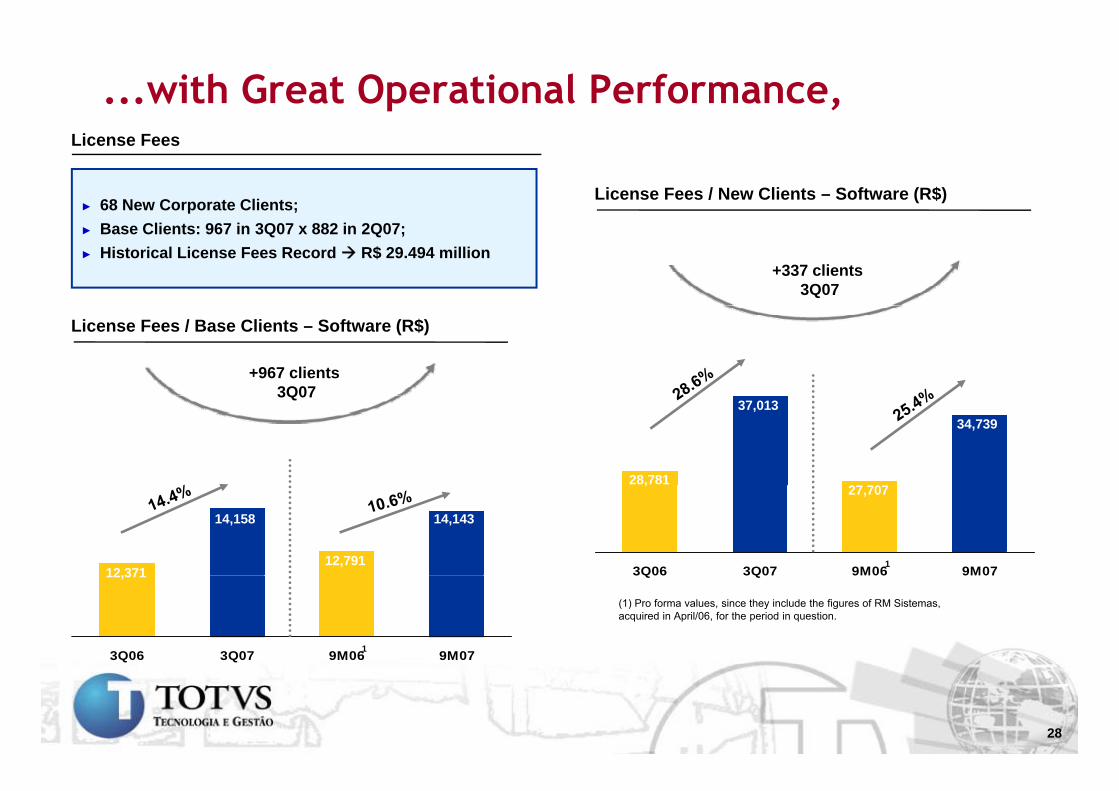
...with Great Operational Performance,
License Fees / New Clients – Software (R$)
License Fees
► 68 New Corporate Clients;
+337 clients 3Q07
► Base Clients: 967 in 3Q07 x 882 in 2Q07;► Historical License Fees Record R$ 29.494 million
License Fees / Base Clients – Software (R$)
+967 clients 3Q07
37,013
28,78127 707
34,739
3Q07
3Q06 3Q07 9M06 9M071
,27,707
14,158
12 37112,791
14,143
3Q06 3Q07 9M06 9M07
3Q06 3Q07 9M06 9M071
12,371
(1) Pro forma values, since they include the figures of RM Sistemas, acquired in April/06, for the period in question.
28
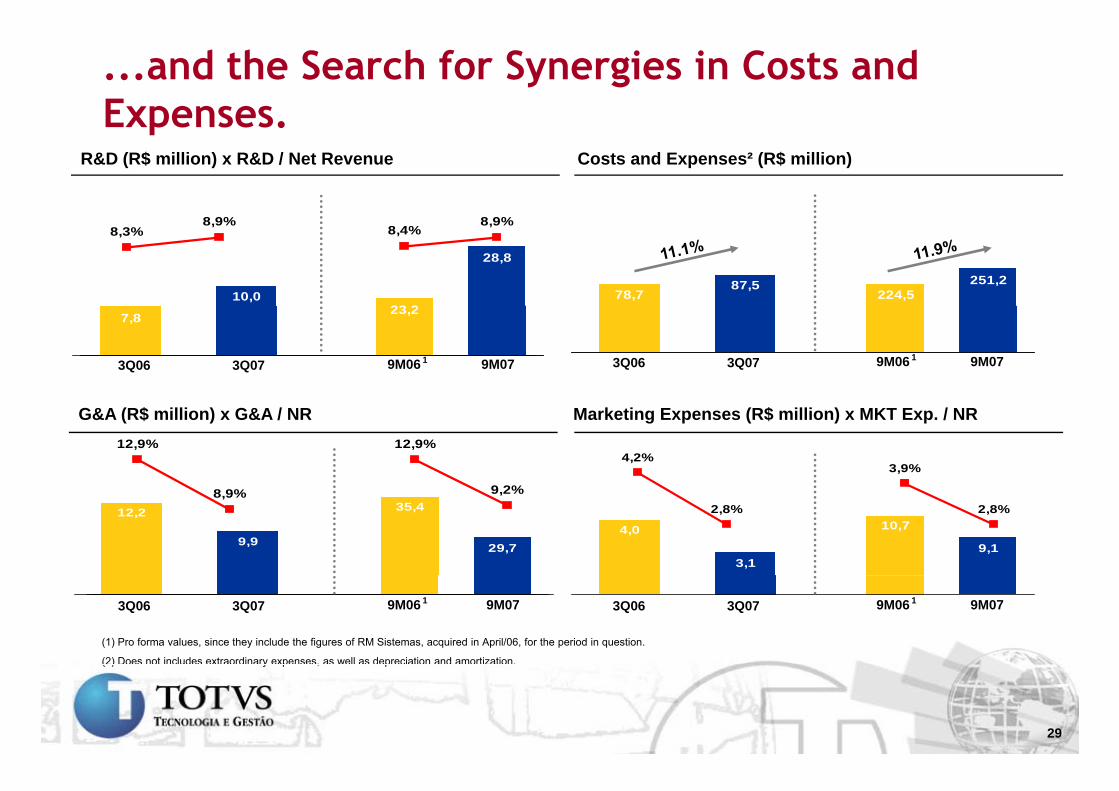
...and the Search for Synergies in Costs and Expenses.Expenses.
R&D (R$ million) x R&D / Net Revenue Costs and Expenses² (R$ million)
23 2
28,8
8,9%8,4%
8,9%8,3%
78,787,5
10,0 224,5251,2
23,27,8
3Q06 3Q07 9M06 9M071 3Q06 3Q07 9M06 9M071
3,9%4,2%
9 2%
12,9%12,9%
Marketing Expenses (R$ million) x MKT Exp. / NRG&A (R$ million) x G&A / NR
2,8%2,8%10,7
9,1
12,2
9,9
9,2%8,9%
4,0
3,1
35,4
29,7
3Q06 3Q07 9M06 9M071 3Q06 3Q07 9M06 9M071
(1) Pro forma values, since they include the figures of RM Sistemas, acquired in April/06, for the period in question.
(2) Does not includes extraordinary expenses, as well as depreciation and amortization.( ) y p , p
29