Embed Size (px)
Citation preview
INSTITUTIONAL EQUITY RESEARCH
Page | 1 | PHILLIPCAPITAL INDIA RESEARCH Please see penultimate page for additional important disclosures. PhillipCapital (India) Private Limited. (“PHILLIPCAP”) is a foreign broker-dealer unregistered in the USA. PHILLIPCAP research is prepared by research analysts who are not registered in the USA. PHILLIPCAP research is distributed in the USA pursuant to Rule 15a-6 of the Securities Exchange Act of 1934 solely by Rosenblatt Securities Inc, an SEC registered and FINRA-member broker-dealer.
Bharat Electronics (BHE IN) Answers to the future lie in the past
INDIA | CAPITAL GOODS | Company Update
3 September 2019
Lack of clarity on BEL’s margin trajectory in the medium term has been a key investor concern for the past 12 months, leading to a sharp de-rating and underperformance of the stock, despite strong outperformance vs. estimates in the near term. In this view-changing report, we highlight BEL’s ability to more effectively migrate to new business models than its peers in the industrials sector, and have higher confidence on its margins. New margin norms should not materially impact BEL’s margins We reduce our earlier scepticism on BEL’s margins, as we now identify projects that would be awarded to BEL over the next three years under the new margin regime. Based on this, we have estimated revenue contribution from these projects over FY20-23, and concluded that their impact on BEL’s EBITDA margins would be 60-100bps and back-ended to FY23-24. While our revised estimates still bake in a 240bps contraction, it is lower than our earlier assumptions of a 470bps decline. BEL has withstood three changes in its business model in the past 30 years To further justify our argument – that BEL should be able to mitigate the impact of change in margin norms – we went back 30 years and analysed how BEL has coped with changes in its business model. For this, we relied on management commentary since FY1996, financials from FY1988, and insights from current management. Key findings from this case study are: (1) BEL has undergone three changes in its business model in the past three decades and (2) with a short-learning curve impact, it has managed to retain its long-term profitability. Higher raw material localisation and AMC revenues to support margins further With a profitable execution of IACCS (ongoing) and EVM/VVPAT (completed) projects, which were earlier perceived to be low-margin due to lower value addition, BEL has demonstrated that it is able to localise raw material faster and gain lower prices from vendors, as large project sizes allow bulk procurement. In addition, structural tailwinds of elongating asset life-cycle and reduced bandwidth of clients should help it to grow its high-margin services business (incl. spares) to 20-25% of revenues in the next 5-6 years from 10% currently. Large projects reaching maturity should aid a 40% increase in BEL’s FY19-23 orderbook Based on our checks, we gather that c.Rs 400bn of projects such as Akash 1S, CIWS, MRSAM, and QRSAM are expected to achieve maturity in the next 12-18 months, and should be awarded over FY20-23. This, along with BEL’s focus on new segments (Homeland Security / Smart Cities) and proposed entry into missile seekers, software-defined radios, and unmanned systems, offers a US$ 12bn order pipeline over the next three years. We see its orderbook growing by 40% in FY19-23 and sustained revenue visibility of c.4x B-t-B. However, valuations contrast strong outlook and recent performance BEL beat consensus FY19 earnings estimates by 14% and has now surprised the street in four out of five years. Additionally, its near-term earnings estimates have only been upped. Despite this, the stock trades at its long term average, underperforming its peer-set (BSE Cap Goods) by 37% in the past two years. Upgrade to BUY with a target of Rs 145 Our confidence about BEL’s ability to manage margin risks posed by the new regulations has increased. We upgrade our rating to BUY (from Neutral) and our target to Rs 145 (from Rs 115 earlier). We base our target on a higher 18x FY21 PE vs. 15x earlier; although our current estimates bake in flat earnings over FY19-21, we believe there are upside risks to our estimates. We expect BEL’s valuations to re-rate as our view progressively becomes the consensus view, and investors regain confidence about BEL’s prospects. Key risks: Continued fund constraints at the Ministry of Defence (MOD) on front-ended payments for imports, and risk of further stake dilution by the government.
BUY (Upgrade) CMP RS 103 TARGET RS 145 (+41%)
COMPANY DATA
O/S SHARES (MN) : 2437
MARKET CAP (RSBN) : 241
MARKET CAP (USDBN) : 3.5
52 - WK HI/LO (RS) : 124 / 73
LIQUIDITY 3M (USDMN) : 17.9
PAR VALUE (RS) : 1
SHARE HOLDING PATTERN, %
Jun 19 Mar 19 Dec 18
PROMOTERS : 58.8 58.8 61.9
FII / NRI : 8.9 7.5 7.1
FI / MF : 21.8 22.9 20.8
NON PRO : 1.2 1.2 1.2
PUBLIC & OTHERS : 9.2 9.6 9.0
PRICE PERFORMANCE, %
1MTH 3MTH 1YR
ABS -11.5 11.8 -3.8
REL TO BSE -8.4 13.3 -7.3
PRICE VS. SENSEX
Source: Phillip Capital India Research
KEY FINANCIALS
Rs bn FY19 FY20E FY21E
Net Sales 120.85 136.47 152.57 EBIDTA 28.62 29.90 32.08 Net Profit 18.62 19.11 19.74 EPS, Rs 7.6 7.8 8.1 PER, x 13.5 13.1 12.7 EV/EBIDTA, x 8.5 8.1 7.5 P/BV, x 2.0 1.8 1.6 ROE, % 22.2 20.2 19.1
Source: Phillip Capital India Research Jonas Bhutta, Research Analyst (+ 9122 6246 4119) [email protected] Vikram Rawat, Research Associate (+ 9122 6246 4120) [email protected] Sandesh Shetty, Research Associate (+ 9122 6246 4139) [email protected]
50
70
90
110
130
150
170
190
Apr-16 Jan-17 Oct-17 Jul-18 Apr-19
BEL BSE Sensex
Page | 2 | PHILLIPCAPITAL INDIA RESEARCH
BHARAT ELECTRONICS COMPANY UPDATE
Thesis in charts and tables
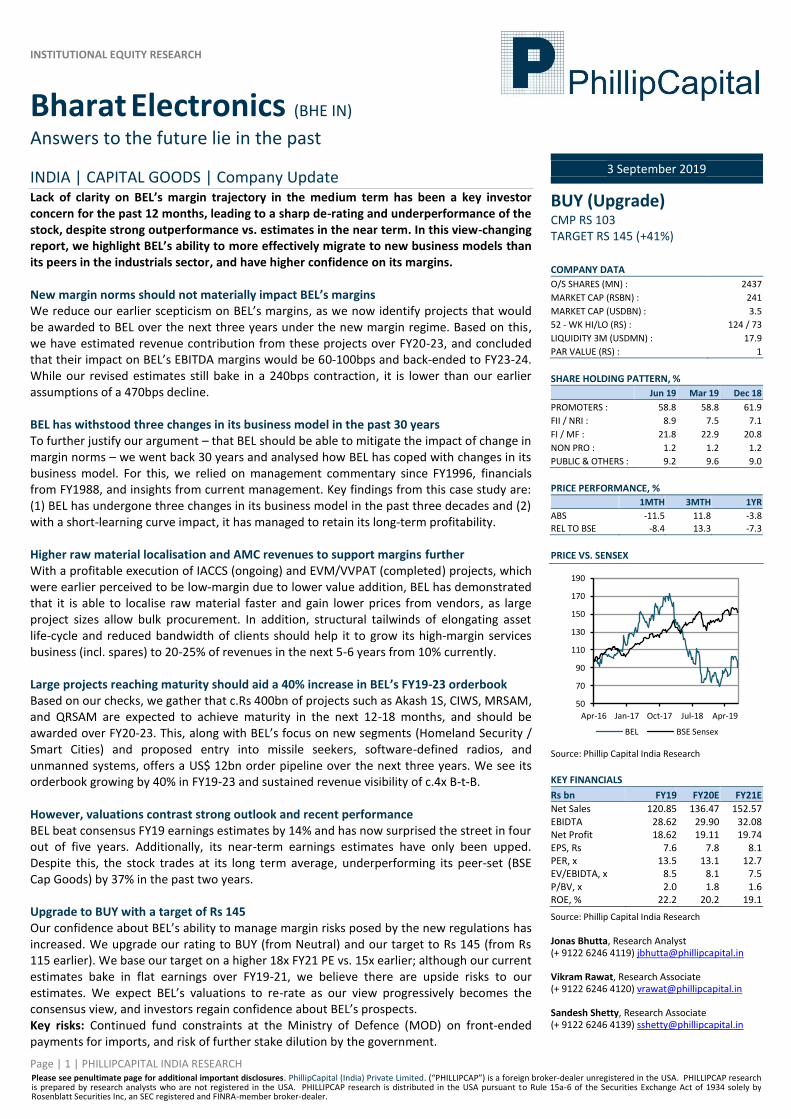
BEL has consistently evolved its product portfolio…
...while it has also seen three major changes in its business model in past 30 years, but always regained its margins...
Source: PhillipCapital India Research, Company
…so we do not foresee a major risk to margins from new norms (Rs bn) FY20E FY21E FY22E FY23E
Order Inflows of projects under new norms 107 90 208 200
Order book - projects under new norms 104 179 351 476
% of total order book 19% 29% 48% 65%
Total Order book 560 617 726 729
Revenue from projects under new norms 3 15 36 76
% of Total revenue 2% 10% 21% 38%
Total Revenues 136 153 173 200
Assuming 300bps lower margins (300) (300) (300) (300)
Impact on BEL's overall margins (bps) (6) (30) (62) (113)
Significantly large projects are achieving maturity; are due to be awarded over FY20-23...
Source: PhillipCapital India Research, Bloomberg, Company
...which, coupled with other projects, should help grow BEL’s order book by 40% (FY19-23); maintain revenue visibility
BEL has beaten consensus estimates in four out of past five years
Source: PhillipCapital India Research, Bloomberg, Company
418
53
105
40
120
100
0
50
100
150
200
250
300
350
400
450
FY20E FY21E FY22E FY23E Total
(Rs bn)
Akash 7sqd CIWS Akash 1S
MRSAM - IAF QRSAM - Army
2.0
2.5
3.0
3.5
4.0
4.5
5.0
-
100
200
300
400
500
600
700
800
FY04 FY09 FY14 FY19 FY23E
(Rs bn) Order book (Rs bn) B-t-B (x)
-40%
-30%
-20%
-10%
0%
10%
20%
30%
40%
FY15 FY16 FY17 FY18 FY19
BEL ABB SIEM* Cummins TMX
Page | 3 | PHILLIPCAPITAL INDIA RESEARCH
BHARAT ELECTRONICS COMPANY UPDATE
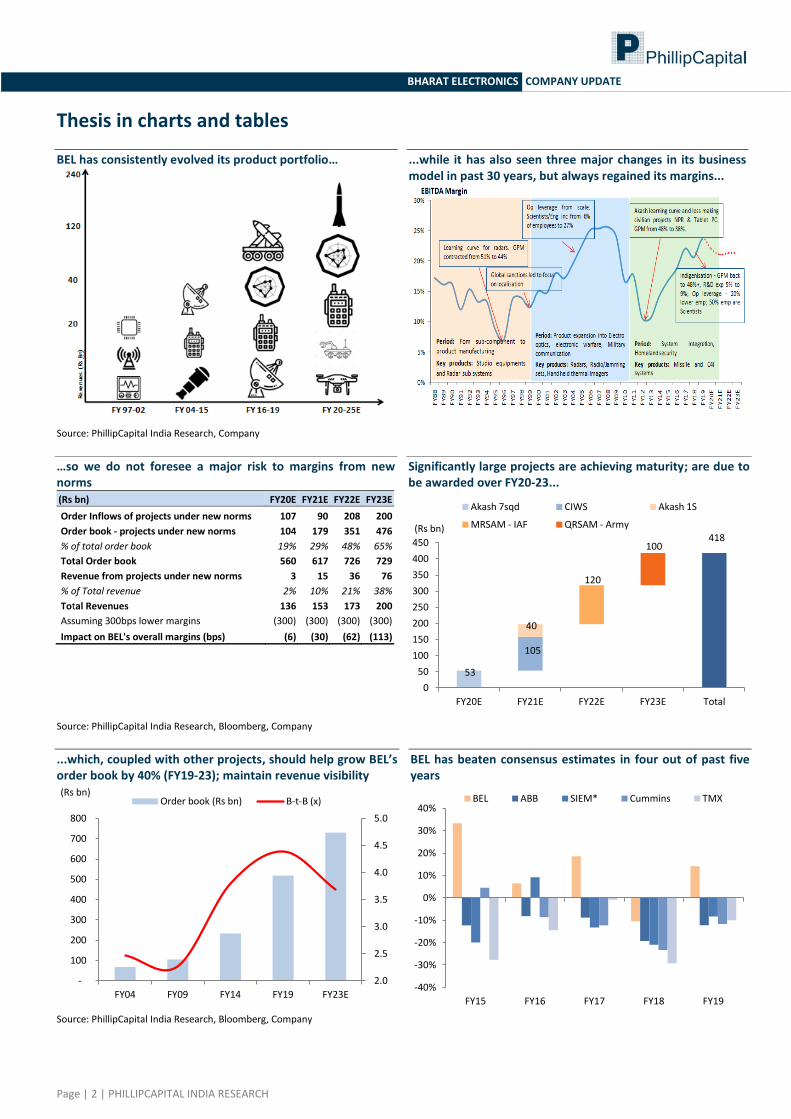
Its near-term earnings (FY20) have only seen upgrades...
...but still its valuations have sharply de-rated
Source: Bloomberg, PhillipCapital India Research
BEL currently trades at its long-term average PE despite having a strong outlook
We raise our estimates by 3-6%
_Revised Est_ _% Revision_ _Consensus_ _vs Consensus__
(Rs bn) FY20E FY21E FY20E FY21E FY20E FY21E FY20E FY21E
Sales 136.5 152.6 1% 1% 136.1 154.1 0% -1%
EBITDA 29.9 32.1 2% 3% 28.0 31.6 7% 2%
Rec. PAT 19.1 19.7 3% 6% 18.7 20.4 2% -3%
Source: PhillipCapital India Research
BEL’s FY19-23 ROEs and ROICs should sustain above 20%
Even with a higher than historical level of working capital, it should remain FCF positive
Source: PhillipCapital India Research, Company
0
5
10
15
20
25
30
35
40
BEL ABB* SIEM** Cummins TMX
Aug-18 Nov-18 Feb-19 May-19 Aug-19
100
125
150
175
200
225
250
FY14 FY15 FY16 FY17 FY18 FY19 FY20
ABB SIEM Cummins
Thermax BEL
0
5
10
15
20
25
30
Ap
r-9
7
Ap
r-9
9
Ap
r-0
1
Ap
r-0
3
Ap
r-0
5
Ap
r-0
7
Ap
r-0
9
Ap
r-1
1
Ap
r-1
3
Ap
r-1
5
Ap
r-1
7
Ap
r-1
9
BEL 1yr fwd PE (x) Avg PE +1SD -1SD
10%
20%
30%
40%
50%
60%
70%
80%
10%
12%
14%
16%
18%
20%
22%
24%
FY1
5
FY1
6
FY1
7
FY1
8
FY1
9
FY2
0E
FY2
1E
FY2
2E
FY2
3E
RoE (%) RoIC (%)
-10%
0%
10%
20%
30%
40%
-20
-15
-10
-5
0
5
10
15
20
25
FY1
5
FY1
6
FY1
7
FY1
8
FY1
9
FY2
0E
FY2
1E
FY2
2E
FY2
3E
(Rs bn) FCF (Rs bn) NWC % of sales (RHS)
Page | 4 | PHILLIPCAPITAL INDIA RESEARCH
BHARAT ELECTRONICS COMPANY UPDATE
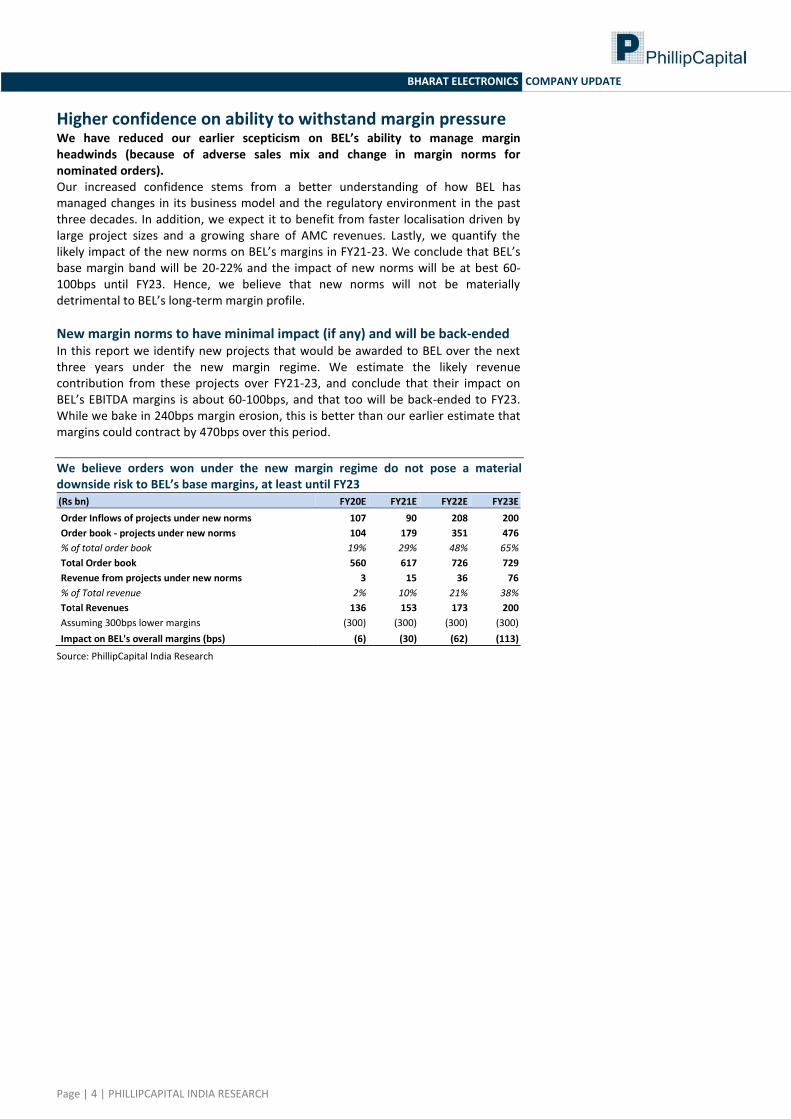
Higher confidence on ability to withstand margin pressure We have reduced our earlier scepticism on BEL’s ability to manage margin headwinds (because of adverse sales mix and change in margin norms for nominated orders). Our increased confidence stems from a better understanding of how BEL has managed changes in its business model and the regulatory environment in the past three decades. In addition, we expect it to benefit from faster localisation driven by large project sizes and a growing share of AMC revenues. Lastly, we quantify the likely impact of the new norms on BEL’s margins in FY21-23. We conclude that BEL’s base margin band will be 20-22% and the impact of new norms will be at best 60-100bps until FY23. Hence, we believe that new norms will not be materially detrimental to BEL’s long-term margin profile.
New margin norms to have minimal impact (if any) and will be back-ended In this report we identify new projects that would be awarded to BEL over the next three years under the new margin regime. We estimate the likely revenue contribution from these projects over FY21-23, and conclude that their impact on BEL’s EBITDA margins is about 60-100bps, and that too will be back-ended to FY23. While we bake in 240bps margin erosion, this is better than our earlier estimate that margins could contract by 470bps over this period.
We believe orders won under the new margin regime do not pose a material downside risk to BEL’s base margins, at least until FY23 (Rs bn) FY20E FY21E FY22E FY23E
Order Inflows of projects under new norms 107 90 208 200
Order book - projects under new norms 104 179 351 476
% of total order book 19% 29% 48% 65%
Total Order book 560 617 726 729
Revenue from projects under new norms 3 15 36 76
% of Total revenue 2% 10% 21% 38%
Total Revenues 136 153 173 200
Assuming 300bps lower margins (300) (300) (300) (300)
Impact on BEL's overall margins (bps) (6) (30) (62) (113)
Source: PhillipCapital India Research

Page | 5 | PHILLIPCAPITAL INDIA RESEARCH
BHARAT ELECTRONICS COMPANY UPDATE
Faster indigenisation on growing project sizes In the past four years, BEL has won about ten projects which are individually greater than Rs 15bn and cumulatively worth c.Rs 375bn (equivalent to 75% of current order book of Rs 517bn). This allows the company to localise technologies and benefit from bulk purchases from vendors. As a result, BEL’s gross margins have expanded 150bps over FY16-19, offsetting the impact of higher employee costs due to wage revision. Earlier, we believed that projects such as IACCS (Rs 80bn) and EVM/VVPAT (Rs 30bn) would be margin decretive due to a high share of outsourced procurement. However, BEL demonstrated its ability to manage this in the past two years by reporting >16% residual EBITDA margins on manufacturing revenues, despite a 20-30% contribution from these two projects, and higher provisions for contingencies, particularly in FY19 when one-off provisions were c.1% of FY19 sales. Over the next three years, we believe BEL is on track to win some large projects with an average size of Rs 50bn. This should help it to reduce import content further, and achieve better terms with vendors based on higher scale and operating leverage.
BEL earned a 20% margin on IACCS in FY18, even as the project has >50% contribution from civil construction
(Rs mn) FY17 FY18
Construction revenue 1,734 15,462
Profit recognised 177 3,257
Margin (%) 10.2% 21.1%
Derived margins on manufacturing revenues indicate robust profitability, even in years when low-margin orders were executed (Rs mn) FY17 FY18 FY19
Manufacturing revenue incl. Other Op. income (ex-provision w/back)
81,175 91,858 1,06,973
% of Total revenue 91% 90% 90%
Service revenue 8,241 10,112 12,235
% of Total revenue 9% 10% 10%
Total Revenue 89,415 1,01,969 1,19,208
EBITDA (excl. Provision w/back) - (A) 16,998 19,261 25,183
Recurring EBITDA margin 19.0% 18.9% 21.1%
Services EBITDA margin (assumed) 45% 45% 45%
Services EBITDA (assumed) - (B) 3,708 4,550 5,506
Implied Manufacturing EBITDA - (A-B) 13,290 14,710 19,677
Implied Manufacturing EBITDA margin 16.4% 16.0% 18.4%
Source: PhillipCapital India Research, Company
We expect BEL to win Rs 460bn of large orders in the next four years, giving it the benefit of high-volume procurements
Programs (Rs bn)
MRSAM (6 squadron) 120
QRSAM (2 regiments) 100
Closed in Weapon System (CIWS)-IAF 98
Akash Airforce (7 Squadrons) 53
QRSAM (4 squadron) 50
Akash Army 1S (2 regiments) 40
Total 461
Source: PhillipCapital India Research
Page | 6 | PHILLIPCAPITAL INDIA RESEARCH
BHARAT ELECTRONICS COMPANY UPDATE
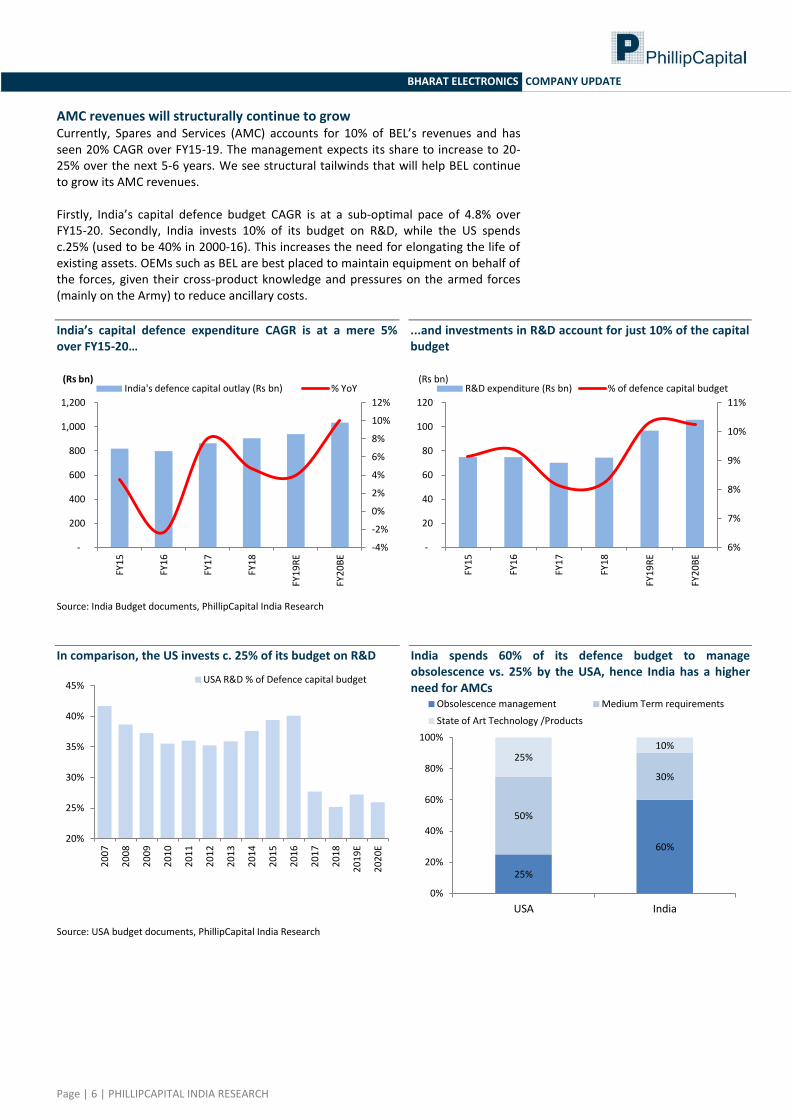
AMC revenues will structurally continue to grow Currently, Spares and Services (AMC) accounts for 10% of BEL’s revenues and has seen 20% CAGR over FY15-19. The management expects its share to increase to 20-25% over the next 5-6 years. We see structural tailwinds that will help BEL continue to grow its AMC revenues. Firstly, India’s capital defence budget CAGR is at a sub-optimal pace of 4.8% over FY15-20. Secondly, India invests 10% of its budget on R&D, while the US spends c.25% (used to be 40% in 2000-16). This increases the need for elongating the life of existing assets. OEMs such as BEL are best placed to maintain equipment on behalf of the forces, given their cross-product knowledge and pressures on the armed forces (mainly on the Army) to reduce ancillary costs.
India’s capital defence expenditure CAGR is at a mere 5% over FY15-20…
...and investments in R&D account for just 10% of the capital budget
Source: India Budget documents, PhillipCapital India Research
In comparison, the US invests c. 25% of its budget on R&D
India spends 60% of its defence budget to manage obsolescence vs. 25% by the USA, hence India has a higher need for AMCs
Source: USA budget documents, PhillipCapital India Research
-4%
-2%
0%
2%
4%
6%
8%
10%
12%
-
200
400
600
800
1,000
1,200
FY1
5
FY1
6
FY1
7
FY1
8
FY1
9R
E
FY2
0B
E
(Rs bn) India's defence capital outlay (Rs bn) % YoY
6%
7%
8%
9%
10%
11%
-
20
40
60
80
100
120
FY1
5
FY1
6
FY1
7
FY1
8
FY1
9R
E
FY2
0B
E
(Rs bn) R&D expenditure (Rs bn) % of defence capital budget
20%
25%
30%
35%
40%
45%
20
07
20
08
20
09
20
10
20
11
20
12
20
13
20
14
20
15
20
16
20
17
20
18
20
19
E
20
20
E
USA R&D % of Defence capital budget
25%
60%
50%
30%
25% 10%
0%
20%
40%
60%
80%
100%
USA India
Obsolescence management Medium Term requirements
State of Art Technology /Products

Page | 7 | PHILLIPCAPITAL INDIA RESEARCH
BHARAT ELECTRONICS COMPANY UPDATE
BEL has increased its focus on its AMC business in the past three years. It already has in-house expertise, as 52% of its workforce comprises of engineers and scientists. It is also increasing its delivery capabilities by setting up 10 product support groups across India by investing Rs 2.5bn. This should help it improve the scope of orders further. The key parameter for it to win orders is guaranteeing uptime – as such, among its recently won projects are AMCs for Rohini Radar (Rs 9bn) and SRE Radar (Rs 6.5bn).
BEL has supplied multiple radars to the armed forces; these offer a near-term AMC opportunity Air force Army Navy
Rohini Bharani Mk-II 3D-TCR
Surveillance Radar Element WLR MPR-Arudhra Indra-I LLTR BFSR-SR Aslesha Rajendra Indra PC
Rajendra
Spares and Services accounts for 10% of BEL’s revenues; management expects it to increase to 20-25% in 5-6 years
Source: PhillipCapital India Research, LRDE, Company
8%
9%
10%
11%
12%
13%
0
5
10
15
20
25
FY1
5
FY1
6
FY1
7
FY1
8
FY1
9
FY2
0E
FY2
1E
FY2
2E
Services revenue Services (% share)
Page | 8 | PHILLIPCAPITAL INDIA RESEARCH
BHARAT ELECTRONICS COMPANY UPDATE
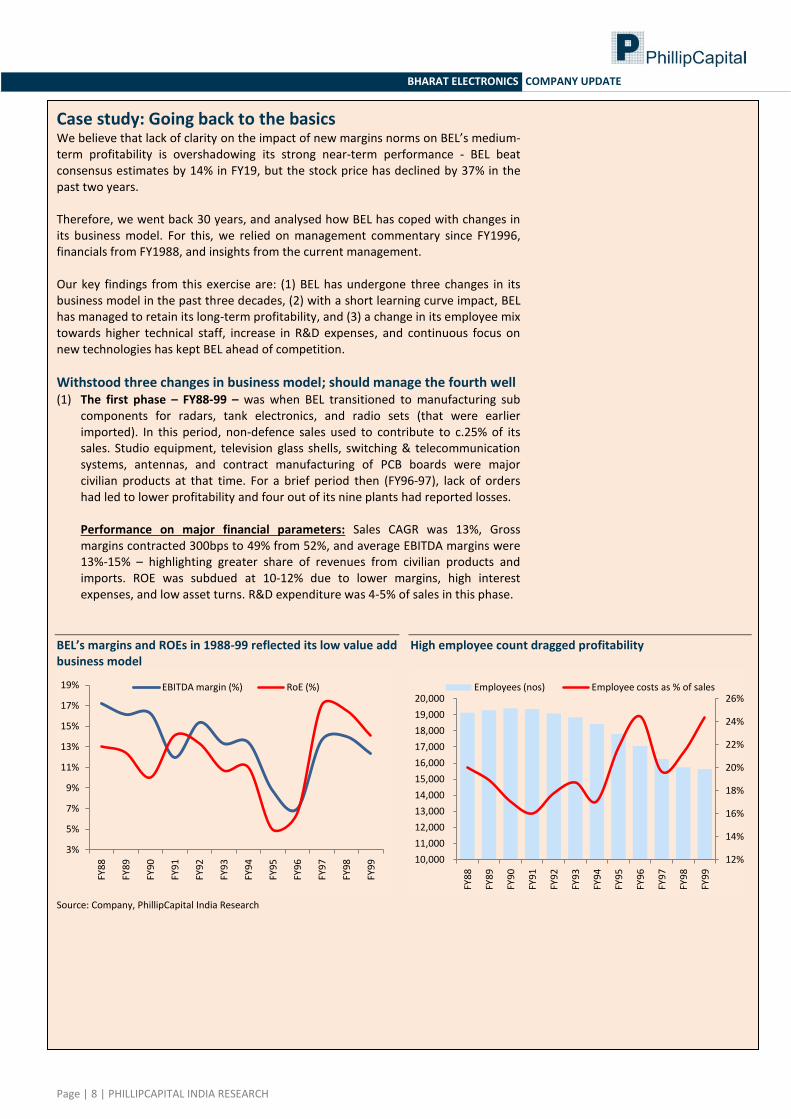
Case study: Going back to the basics We believe that lack of clarity on the impact of new margins norms on BEL’s medium-term profitability is overshadowing its strong near-term performance - BEL beat consensus estimates by 14% in FY19, but the stock price has declined by 37% in the past two years. Therefore, we went back 30 years, and analysed how BEL has coped with changes in its business model. For this, we relied on management commentary since FY1996, financials from FY1988, and insights from the current management. Our key findings from this exercise are: (1) BEL has undergone three changes in its business model in the past three decades, (2) with a short learning curve impact, BEL has managed to retain its long-term profitability, and (3) a change in its employee mix towards higher technical staff, increase in R&D expenses, and continuous focus on new technologies has kept BEL ahead of competition.
Withstood three changes in business model; should manage the fourth well (1) The first phase – FY88-99 – was when BEL transitioned to manufacturing sub
components for radars, tank electronics, and radio sets (that were earlier imported). In this period, non-defence sales used to contribute to c.25% of its sales. Studio equipment, television glass shells, switching & telecommunication systems, antennas, and contract manufacturing of PCB boards were major civilian products at that time. For a brief period then (FY96-97), lack of orders had led to lower profitability and four out of its nine plants had reported losses. Performance on major financial parameters: Sales CAGR was 13%, Gross margins contracted 300bps to 49% from 52%, and average EBITDA margins were 13%-15% – highlighting greater share of revenues from civilian products and imports. ROE was subdued at 10-12% due to lower margins, high interest expenses, and low asset turns. R&D expenditure was 4-5% of sales in this phase.
BEL’s margins and ROEs in 1988-99 reflected its low value add business model
High employee count dragged profitability
Source: Company, PhillipCapital India Research
3%
5%
7%
9%
11%
13%
15%
17%
19%
FY8
8
FY8
9
FY9
0
FY9
1
FY9
2
FY9
3
FY9
4
FY9
5
FY9
6
FY9
7
FY9
8
FY9
9
EBITDA margin (%) RoE (%)
12%
14%
16%
18%
20%
22%
24%
26%
10,000
11,000
12,000
13,000
14,000
15,000
16,000
17,000
18,000
19,000
20,000
FY8
8
FY8
9
FY9
0
FY9
1
FY9
2
FY9
3
FY9
4
FY9
5
FY9
6
FY9
7
FY9
8
FY9
9
Employees (nos) Employee costs as % of sales
Page | 9 | PHILLIPCAPITAL INDIA RESEARCH
BHARAT ELECTRONICS COMPANY UPDATE
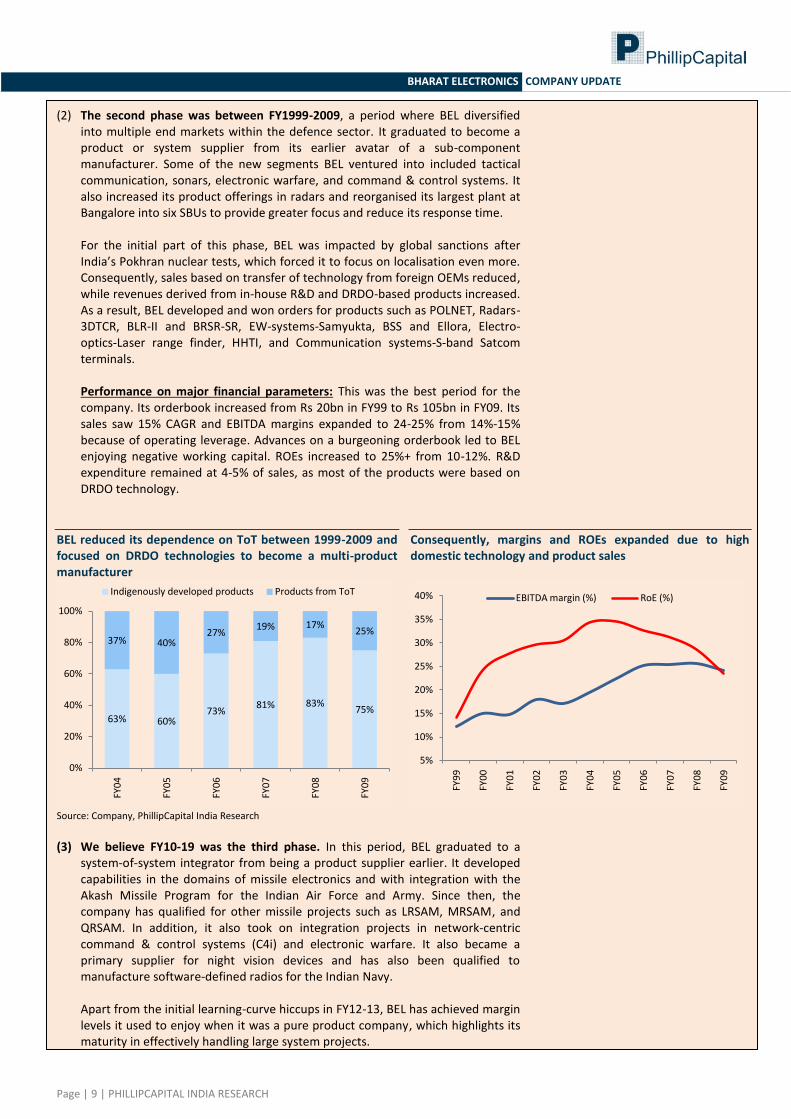
(2) The second phase was between FY1999-2009, a period where BEL diversified into multiple end markets within the defence sector. It graduated to become a product or system supplier from its earlier avatar of a sub-component manufacturer. Some of the new segments BEL ventured into included tactical communication, sonars, electronic warfare, and command & control systems. It also increased its product offerings in radars and reorganised its largest plant at Bangalore into six SBUs to provide greater focus and reduce its response time. For the initial part of this phase, BEL was impacted by global sanctions after India’s Pokhran nuclear tests, which forced it to focus on localisation even more. Consequently, sales based on transfer of technology from foreign OEMs reduced, while revenues derived from in-house R&D and DRDO-based products increased. As a result, BEL developed and won orders for products such as POLNET, Radars- 3DTCR, BLR-II and BRSR-SR, EW-systems-Samyukta, BSS and Ellora, Electro-optics-Laser range finder, HHTI, and Communication systems-S-band Satcom terminals. Performance on major financial parameters: This was the best period for the company. Its orderbook increased from Rs 20bn in FY99 to Rs 105bn in FY09. Its sales saw 15% CAGR and EBITDA margins expanded to 24-25% from 14%-15% because of operating leverage. Advances on a burgeoning orderbook led to BEL enjoying negative working capital. ROEs increased to 25%+ from 10-12%. R&D expenditure remained at 4-5% of sales, as most of the products were based on DRDO technology.
BEL reduced its dependence on ToT between 1999-2009 and focused on DRDO technologies to become a multi-product manufacturer
Consequently, margins and ROEs expanded due to high domestic technology and product sales
Source: Company, PhillipCapital India Research
(3) We believe FY10-19 was the third phase. In this period, BEL graduated to a
system-of-system integrator from being a product supplier earlier. It developed capabilities in the domains of missile electronics and with integration with the Akash Missile Program for the Indian Air Force and Army. Since then, the company has qualified for other missile projects such as LRSAM, MRSAM, and QRSAM. In addition, it also took on integration projects in network-centric command & control systems (C4i) and electronic warfare. It also became a primary supplier for night vision devices and has also been qualified to manufacture software-defined radios for the Indian Navy. Apart from the initial learning-curve hiccups in FY12-13, BEL has achieved margin levels it used to enjoy when it was a pure product company, which highlights its maturity in effectively handling large system projects.
63% 60% 73%
81% 83% 75%
37% 40% 27%
19% 17% 25%
0%
20%
40%
60%
80%
100%
FY0
4
FY0
5
FY0
6
FY0
7
FY0
8
FY0
9
Indigenously developed products Products from ToT
5%
10%
15%
20%
25%
30%
35%
40%
FY9
9
FY0
0
FY0
1
FY0
2
FY0
3
FY0
4
FY0
5
FY0
6
FY0
7
FY0
8
FY0
9
EBITDA margin (%) RoE (%)
Page | 10 | PHILLIPCAPITAL INDIA RESEARCH
BHARAT ELECTRONICS COMPANY UPDATE
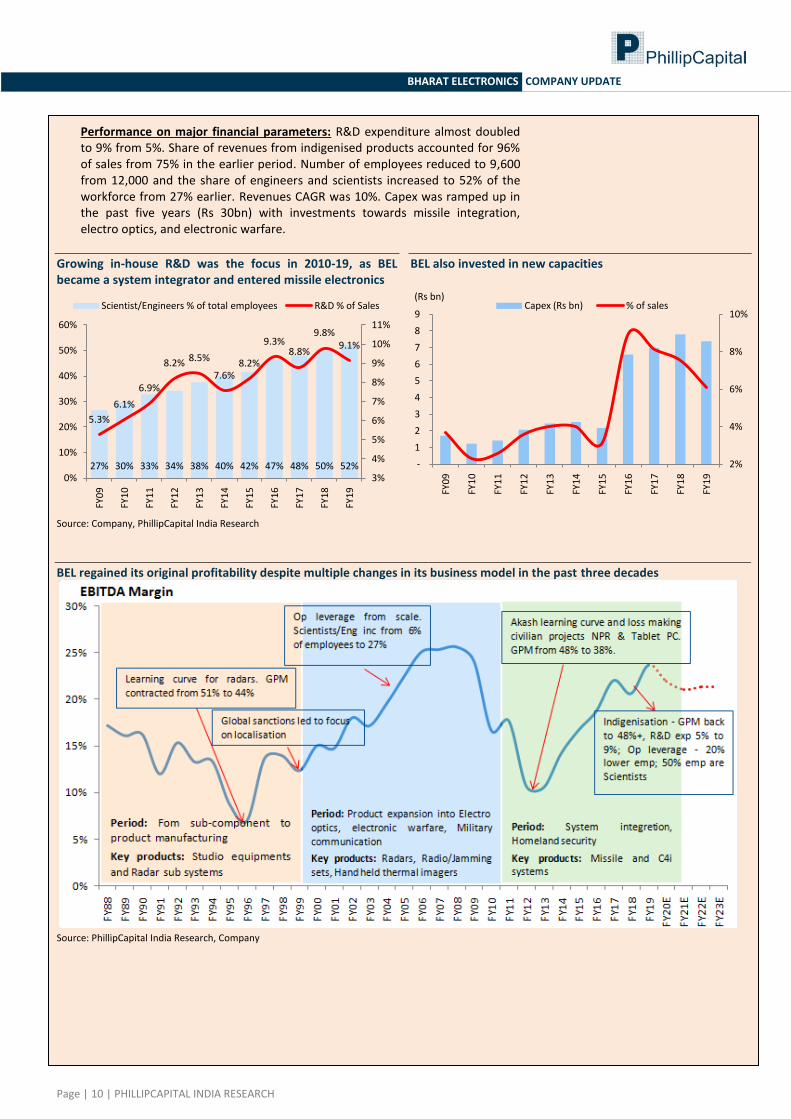
Performance on major financial parameters: R&D expenditure almost doubled to 9% from 5%. Share of revenues from indigenised products accounted for 96% of sales from 75% in the earlier period. Number of employees reduced to 9,600 from 12,000 and the share of engineers and scientists increased to 52% of the workforce from 27% earlier. Revenues CAGR was 10%. Capex was ramped up in the past five years (Rs 30bn) with investments towards missile integration, electro optics, and electronic warfare.
Growing in-house R&D was the focus in 2010-19, as BEL became a system integrator and entered missile electronics
BEL also invested in new capacities
Source: Company, PhillipCapital India Research
BEL regained its original profitability despite multiple changes in its business model in the past three decades
Source: PhillipCapital India Research, Company
27% 30% 33% 34% 38% 40% 42% 47% 48% 50% 52%
5.3%
6.1%
6.9%
8.2% 8.5%
7.6% 8.2%
9.3% 8.8%
9.8% 9.1%
3%
4%
5%
6%
7%
8%
9%
10%
11%
0%
10%
20%
30%
40%
50%
60%
FY0
9
FY1
0
FY1
1
FY1
2
FY1
3
FY1
4
FY1
5
FY1
6
FY1
7
FY1
8
FY1
9
Scientist/Engineers % of total employees R&D % of Sales
2%
4%
6%
8%
10%
-
1
2
3
4
5
6
7
8
9
FY0
9
FY1
0
FY1
1
FY1
2
FY1
3
FY1
4
FY1
5
FY1
6
FY1
7
FY1
8
FY1
9
(Rs bn) Capex (Rs bn) % of sales
Page | 11 | PHILLIPCAPITAL INDIA RESEARCH
BHARAT ELECTRONICS COMPANY UPDATE
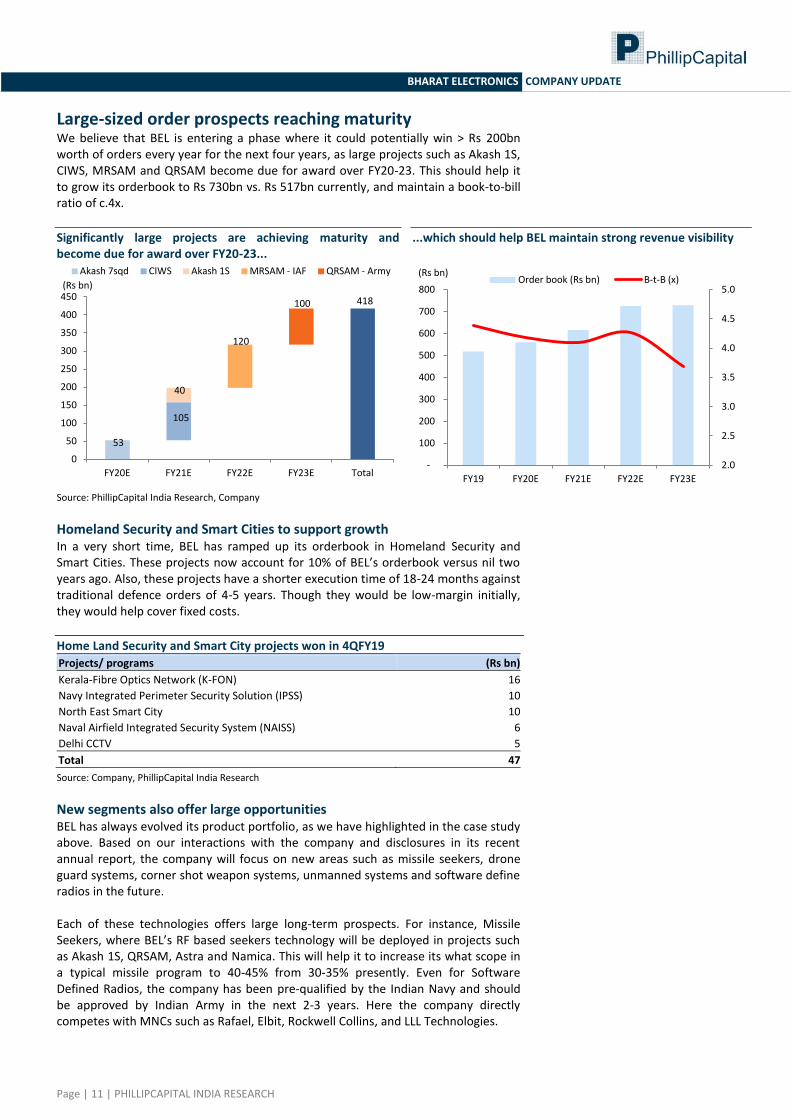
Large-sized order prospects reaching maturity We believe that BEL is entering a phase where it could potentially win > Rs 200bn worth of orders every year for the next four years, as large projects such as Akash 1S, CIWS, MRSAM and QRSAM become due for award over FY20-23. This should help it to grow its orderbook to Rs 730bn vs. Rs 517bn currently, and maintain a book-to-bill ratio of c.4x.
Significantly large projects are achieving maturity and become due for award over FY20-23...
...which should help BEL maintain strong revenue visibility
Source: PhillipCapital India Research, Company
Homeland Security and Smart Cities to support growth
In a very short time, BEL has ramped up its orderbook in Homeland Security and Smart Cities. These projects now account for 10% of BEL’s orderbook versus nil two years ago. Also, these projects have a shorter execution time of 18-24 months against traditional defence orders of 4-5 years. Though they would be low-margin initially, they would help cover fixed costs.
Home Land Security and Smart City projects won in 4QFY19
Projects/ programs (Rs bn)
Kerala-Fibre Optics Network (K-FON) 16
Navy Integrated Perimeter Security Solution (IPSS) 10
North East Smart City 10
Naval Airfield Integrated Security System (NAISS) 6
Delhi CCTV 5
Total 47
Source: Company, PhillipCapital India Research
New segments also offer large opportunities BEL has always evolved its product portfolio, as we have highlighted in the case study above. Based on our interactions with the company and disclosures in its recent annual report, the company will focus on new areas such as missile seekers, drone guard systems, corner shot weapon systems, unmanned systems and software define radios in the future. Each of these technologies offers large long-term prospects. For instance, Missile Seekers, where BEL’s RF based seekers technology will be deployed in projects such as Akash 1S, QRSAM, Astra and Namica. This will help it to increase its what scope in a typical missile program to 40-45% from 30-35% presently. Even for Software Defined Radios, the company has been pre-qualified by the Indian Navy and should be approved by Indian Army in the next 2-3 years. Here the company directly competes with MNCs such as Rafael, Elbit, Rockwell Collins, and LLL Technologies.
418
53
105
40
120
100
0
50
100
150
200
250
300
350
400
450
FY20E FY21E FY22E FY23E Total
(Rs bn)
Akash 7sqd CIWS Akash 1S MRSAM - IAF QRSAM - Army
2.0
2.5
3.0
3.5
4.0
4.5
5.0
-
100
200
300
400
500
600
700
800
FY19 FY20E FY21E FY22E FY23E
(Rs bn) Order book (Rs bn) B-t-B (x)
Page | 12 | PHILLIPCAPITAL INDIA RESEARCH
BHARAT ELECTRONICS COMPANY UPDATE
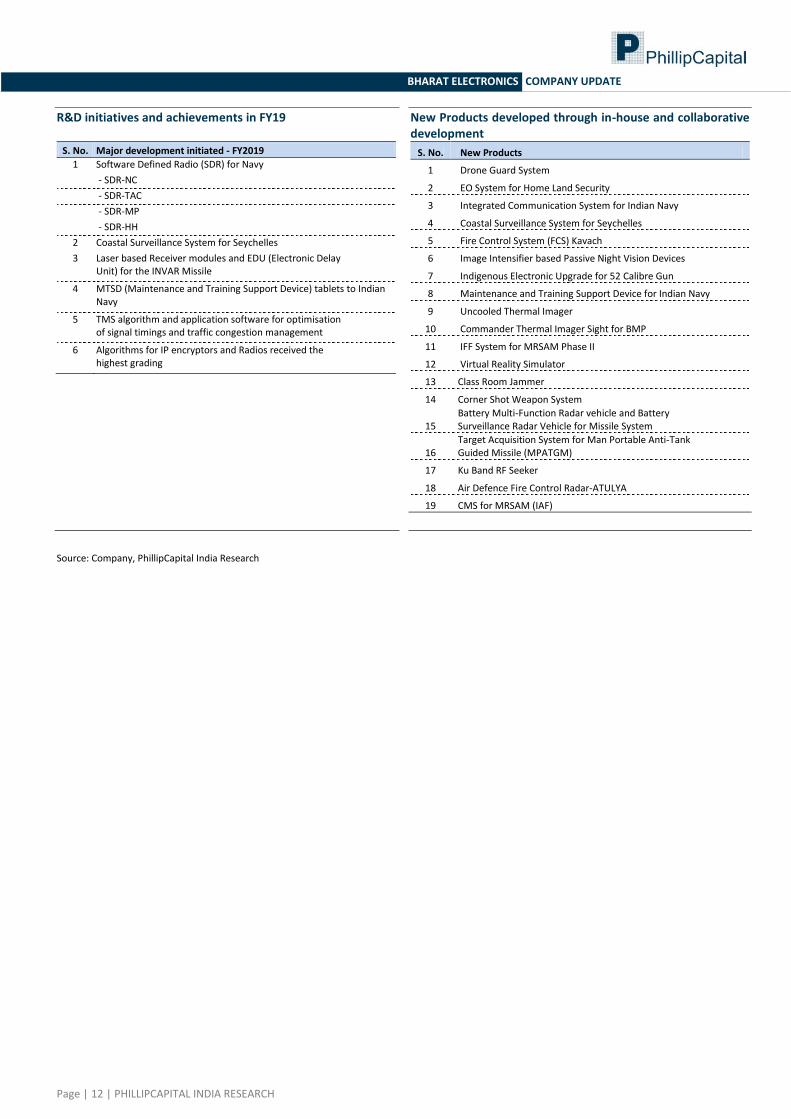
R&D initiatives and achievements in FY19
S. No. Major development initiated - FY2019
1 Software Defined Radio (SDR) for Navy
- SDR-NC
- SDR-TAC
- SDR-MP
- SDR-HH
2 Coastal Surveillance System for Seychelles
3 Laser based Receiver modules and EDU (Electronic Delay Unit) for the INVAR Missile
4 MTSD (Maintenance and Training Support Device) tablets to Indian Navy
5 TMS algorithm and application software for optimisation of signal timings and traffic congestion management
6 Algorithms for IP encryptors and Radios received the highest grading
New Products developed through in-house and collaborative development
S. No. New Products
1 Drone Guard System
2 EO System for Home Land Security
3 Integrated Communication System for Indian Navy
4 Coastal Surveillance System for Seychelles
5 Fire Control System (FCS) Kavach
6 Image Intensifier based Passive Night Vision Devices
7 Indigenous Electronic Upgrade for 52 Calibre Gun
8 Maintenance and Training Support Device for Indian Navy
9 Uncooled Thermal Imager
10 Commander Thermal Imager Sight for BMP
11 IFF System for MRSAM Phase II
12 Virtual Reality Simulator
13 Class Room Jammer
14 Corner Shot Weapon System
15 Battery Multi-Function Radar vehicle and Battery Surveillance Radar Vehicle for Missile System
16 Target Acquisition System for Man Portable Anti-Tank Guided Missile (MPATGM)
17 Ku Band RF Seeker
18 Air Defence Fire Control Radar-ATULYA
19 CMS for MRSAM (IAF)
Source: Company, PhillipCapital India Research
Page | 13 | PHILLIPCAPITAL INDIA RESEARCH
BHARAT ELECTRONICS COMPANY UPDATE
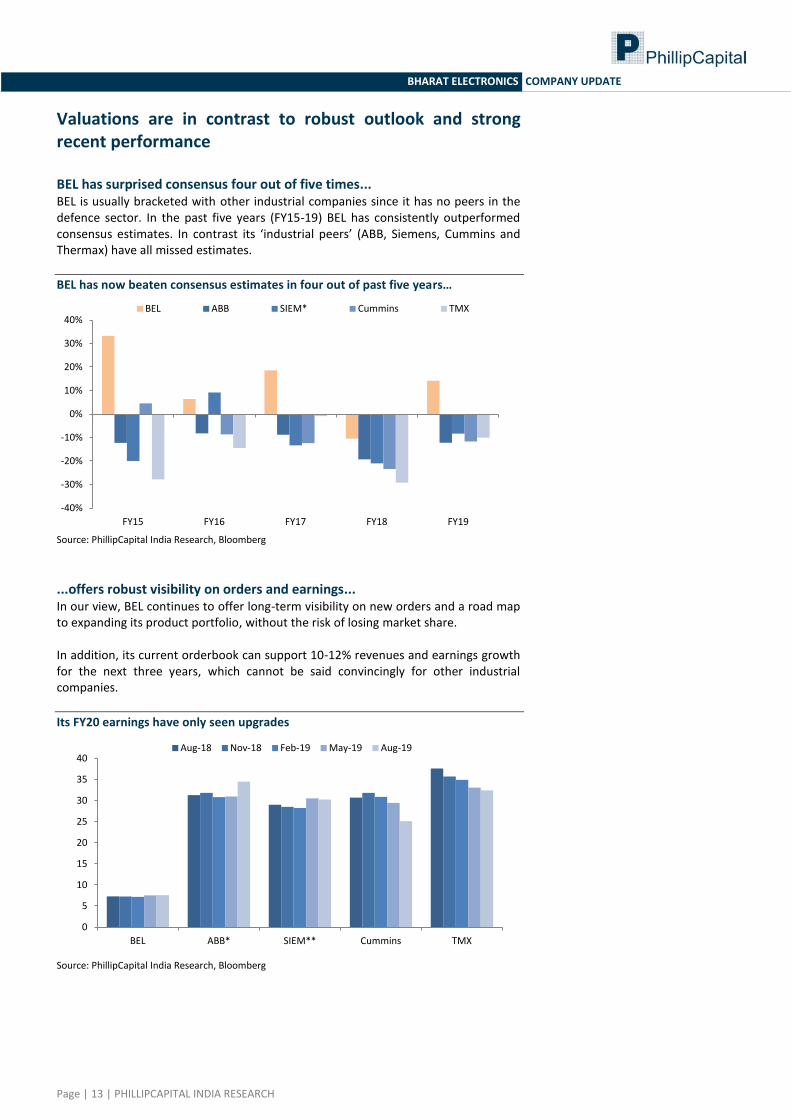
Valuations are in contrast to robust outlook and strong recent performance BEL has surprised consensus four out of five times... BEL is usually bracketed with other industrial companies since it has no peers in the defence sector. In the past five years (FY15-19) BEL has consistently outperformed consensus estimates. In contrast its ‘industrial peers’ (ABB, Siemens, Cummins and Thermax) have all missed estimates.
BEL has now beaten consensus estimates in four out of past five years…
Source: PhillipCapital India Research, Bloomberg
...offers robust visibility on orders and earnings... In our view, BEL continues to offer long-term visibility on new orders and a road map to expanding its product portfolio, without the risk of losing market share. In addition, its current orderbook can support 10-12% revenues and earnings growth for the next three years, which cannot be said convincingly for other industrial companies.
Its FY20 earnings have only seen upgrades
Source: PhillipCapital India Research, Bloomberg
-40%
-30%
-20%
-10%
0%
10%
20%
30%
40%
FY15 FY16 FY17 FY18 FY19
BEL ABB SIEM* Cummins TMX
0
5
10
15
20
25
30
35
40
BEL ABB* SIEM** Cummins TMX
Aug-18 Nov-18 Feb-19 May-19 Aug-19
Page | 14 | PHILLIPCAPITAL INDIA RESEARCH
BHARAT ELECTRONICS COMPANY UPDATE
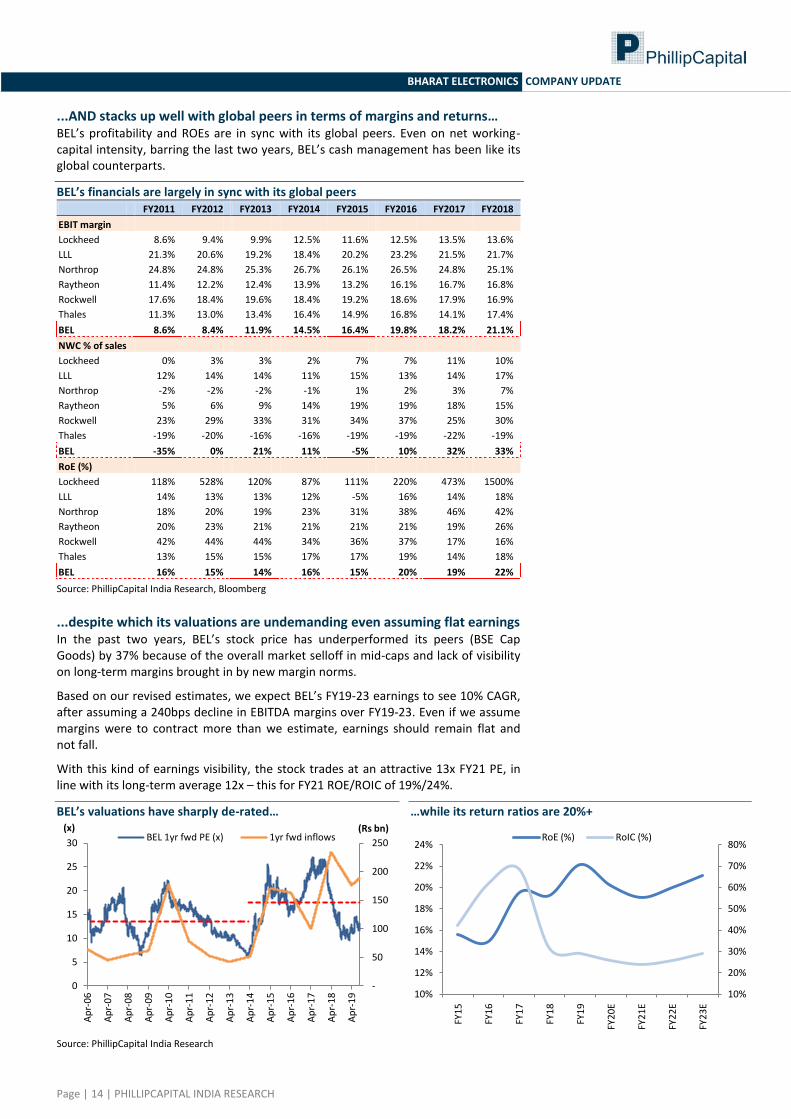
...AND stacks up well with global peers in terms of margins and returns… BEL’s profitability and ROEs are in sync with its global peers. Even on net working-capital intensity, barring the last two years, BEL’s cash management has been like its global counterparts.
BEL’s financials are largely in sync with its global peers FY2011 FY2012 FY2013 FY2014 FY2015 FY2016 FY2017 FY2018
EBIT margin
Lockheed 8.6% 9.4% 9.9% 12.5% 11.6% 12.5% 13.5% 13.6%
LLL 21.3% 20.6% 19.2% 18.4% 20.2% 23.2% 21.5% 21.7%
Northrop 24.8% 24.8% 25.3% 26.7% 26.1% 26.5% 24.8% 25.1%
Raytheon 11.4% 12.2% 12.4% 13.9% 13.2% 16.1% 16.7% 16.8%
Rockwell 17.6% 18.4% 19.6% 18.4% 19.2% 18.6% 17.9% 16.9%
Thales 11.3% 13.0% 13.4% 16.4% 14.9% 16.8% 14.1% 17.4%
BEL 8.6% 8.4% 11.9% 14.5% 16.4% 19.8% 18.2% 21.1%
NWC % of sales
Lockheed 0% 3% 3% 2% 7% 7% 11% 10%
LLL 12% 14% 14% 11% 15% 13% 14% 17%
Northrop -2% -2% -2% -1% 1% 2% 3% 7%
Raytheon 5% 6% 9% 14% 19% 19% 18% 15%
Rockwell 23% 29% 33% 31% 34% 37% 25% 30%
Thales -19% -20% -16% -16% -19% -19% -22% -19%
BEL -35% 0% 21% 11% -5% 10% 32% 33%
RoE (%)
Lockheed 118% 528% 120% 87% 111% 220% 473% 1500%
LLL 14% 13% 13% 12% -5% 16% 14% 18%
Northrop 18% 20% 19% 23% 31% 38% 46% 42%
Raytheon 20% 23% 21% 21% 21% 21% 19% 26%
Rockwell 42% 44% 44% 34% 36% 37% 17% 16%
Thales 13% 15% 15% 17% 17% 19% 14% 18%
BEL 16% 15% 14% 16% 15% 20% 19% 22%
Source: PhillipCapital India Research, Bloomberg
...despite which its valuations are undemanding even assuming flat earnings In the past two years, BEL’s stock price has underperformed its peers (BSE Cap Goods) by 37% because of the overall market selloff in mid-caps and lack of visibility on long-term margins brought in by new margin norms.
Based on our revised estimates, we expect BEL’s FY19-23 earnings to see 10% CAGR, after assuming a 240bps decline in EBITDA margins over FY19-23. Even if we assume margins were to contract more than we estimate, earnings should remain flat and not fall.
With this kind of earnings visibility, the stock trades at an attractive 13x FY21 PE, in line with its long-term average 12x – this for FY21 ROE/ROIC of 19%/24%.
BEL’s valuations have sharply de-rated…
…while its return ratios are 20%+
Source: PhillipCapital India Research
-
50
100
150
200
250
0
5
10
15
20
25
30
Ap
r-0
6
Ap
r-0
7
Ap
r-0
8
Ap
r-0
9
Ap
r-1
0
Ap
r-1
1
Ap
r-1
2
Ap
r-1
3
Ap
r-1
4
Ap
r-1
5
Ap
r-1
6
Ap
r-1
7
Ap
r-1
8
Ap
r-1
9
(Rs bn) (x) BEL 1yr fwd PE (x) 1yr fwd inflows
10%
20%
30%
40%
50%
60%
70%
80%
10%
12%
14%
16%
18%
20%
22%
24%
FY1
5
FY1
6
FY1
7
FY1
8
FY1
9
FY2
0E
FY2
1E
FY2
2E
FY2
3E
RoE (%) RoIC (%)

Page | 15 | PHILLIPCAPITAL INDIA RESEARCH
BHARAT ELECTRONICS COMPANY UPDATE
Domestic peer comparison with industrial companies Revenue (Rs bn) EBITDA margin (%) Rec PAT (Rs bn) RoE (%) CAGR FY19-21E PE (x)
FY19 FY20E FY21E FY19 FY20E FY21E FY19 FY20E FY21E FY19 FY20E FY21E Sales EBITDA Rec PAT FY20E FY21E
BEL 120.8 136.5 152.6 23.7% 21.9% 21.0% 18.6 19.1 19.7 22.2% 20.2% 19.1% 12% 6% 3% 13.1 12.7
BDL 30.7 38.5 31.8 20.3% 21.0% 18.6% 4.2 5.4 3.8 20.0% 22.0% 14.1% 2% -3% -5% 9.6 13.4
CSL 29.6 32.6 35.1 19.3% 19.4% 20.4% 4.8 4.7 4.8 14.6% 13.6% 12.9% 9% 12% 0% 9.6 9.4
L&T 1,410.1 1,582.7 1,824.1 12.1% 12.3% 12.3% 93.0 96.3 103.7 15.9% 15.8% 16.5% 14% 15% 6% 19.4 18.0
ABB India* 66.9 74.6 85.3 6.8% 8.7% 9.8% 2.3 4.0 5.3 6.0% 10.3% 13.1% 13% 35% 52% 45.6 39.3
BHEL 303.5 311.6 368.2 6.8% 7.7% 8.9% 9.7 14.0 19.7 3.0% 4.4% 6.0% 10% 26% 42% 12.6 9.0
Cummins 56.6 59.1 65.3 15.3% 13.4% 14.8% 6.9 6.7 7.8 17.1% 16.1% 17.9% 7% 6% 6% 23.6 20.5
EIL 24.4 31.3 34.4 15.7% 13.4% 14.7% 3.8 4.0 4.6 16.6% 17.0% 18.0% 19% 15% 10% 16.0 14.2
GE T&D 42.2 38.3 44.4 11.5% 9.0% 9.6% 2.3 1.5 2.1 17.9% 9.8% 12.9% 3% -6% -6% 26.7 18.6
KEC (C) 110.0 124.1 142.5 9.0% 10.4% 10.5% 3.7 5.7 6.8 16.7% 21.2% 21.0% 14% 23% 35% 11.1 9.3
KPP (C) 108.4 124.8 142.0 12.4% 12.2% 12.4% 4.7 4.8 6.2 16.1% 14.1% 15.6% 14% 14% 15% 14.4 11.0
Siemens** 138.5 137.3 145.5 11.9% 11.4% 11.2% 11.5 11.0 11.6 13.2% 11.5% 11.4% 3% -1% 0% 39.1 36.9
Thermax 59.7 62.9 66.8 7.7% 8.2% 8.6% 3.2 3.6 3.9 11.3% 11.3% 11.3% 6% 12% 9% 33.4 30.7
Va Tech 27.8 33.4 38.2 7.7% 9.2% 9.5% 1.2 1.4 1.7 10.8% 12.2% 13.8% 17% 30% 20% 11.1 8.8
Total / Avg 2,389.8 2,619.2 2,991.6 11.1% 11.3% 11.6% 145.0 155.1 175.3 13.2% 13.1% 14.3% 12% 15% 10% 23.0 19.7
Source: PhillipCapital India Research
Upgrade to BUY; revised target of Rs 145
We downgraded BEL in September 2018 (Click here) after the new margin norms were announced. However, even at that point, we had no doubt about BEL’s opportunity pipeline (US$ 12bn over next three years) and its ability to grow new businesses. In this report, we build in our confidence about its EBITDA margins and state that BEL will effectively mitigate any potential risk to its EBITDA margins posed by the new regulations, and that the impact of these regulations will not be visible until FY23-24. We upgrade our rating to BUY (from Neutral) and our target to Rs 145 (from Rs 115). We base our target on a higher 18x PE FY21 vs. 15x earlier – while we see flat earnings over FY19-21, we believe there are upside risks to our estimates, which build in a 240bps margins contraction over FY19-22 and interest cost on likely capex debt. We expect BEL’s valuations to re-rate as our thesis progressively becomes consensus and investors regain confidence in BEL’s prospects.
Page | 16 | PHILLIPCAPITAL INDIA RESEARCH
BHARAT ELECTRONICS COMPANY UPDATE
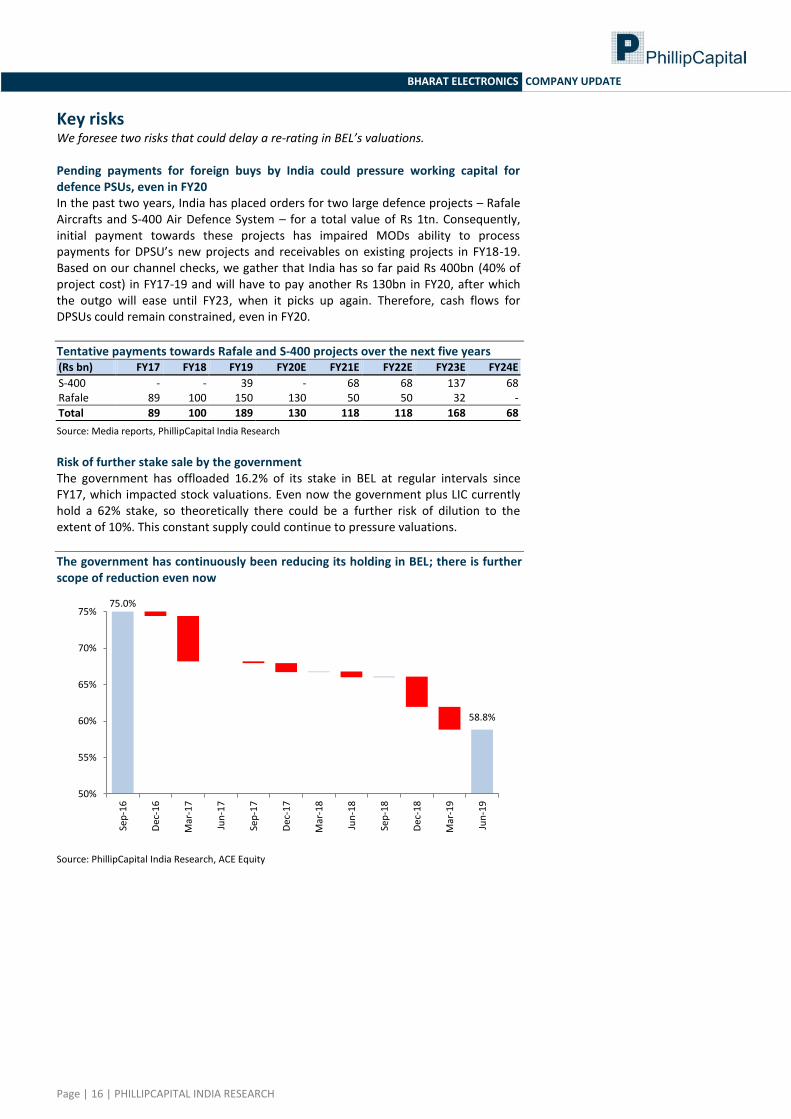
Key risks
We foresee two risks that could delay a re-rating in BEL’s valuations. Pending payments for foreign buys by India could pressure working capital for defence PSUs, even in FY20 In the past two years, India has placed orders for two large defence projects – Rafale Aircrafts and S-400 Air Defence System – for a total value of Rs 1tn. Consequently, initial payment towards these projects has impaired MODs ability to process payments for DPSU’s new projects and receivables on existing projects in FY18-19. Based on our channel checks, we gather that India has so far paid Rs 400bn (40% of project cost) in FY17-19 and will have to pay another Rs 130bn in FY20, after which the outgo will ease until FY23, when it picks up again. Therefore, cash flows for DPSUs could remain constrained, even in FY20.
Tentative payments towards Rafale and S-400 projects over the next five years (Rs bn) FY17 FY18 FY19 FY20E FY21E FY22E FY23E FY24E
S-400 - - 39 - 68 68 137 68 Rafale 89 100 150 130 50 50 32 -
Total 89 100 189 130 118 118 168 68
Source: Media reports, PhillipCapital India Research
Risk of further stake sale by the government The government has offloaded 16.2% of its stake in BEL at regular intervals since FY17, which impacted stock valuations. Even now the government plus LIC currently hold a 62% stake, so theoretically there could be a further risk of dilution to the extent of 10%. This constant supply could continue to pressure valuations.
The government has continuously been reducing its holding in BEL; there is further scope of reduction even now
Source: PhillipCapital India Research, ACE Equity
75.0%
58.8%
50%
55%
60%
65%
70%
75%
Sep
-16
Dec
-16
Mar
-17
Jun
-17
Sep
-17
Dec
-17
Mar
-18
Jun
-18
Sep
-18
Dec
-18
Mar
-19
Jun
-19
Page | 17 | PHILLIPCAPITAL INDIA RESEARCH
BHARAT ELECTRONICS COMPANY UPDATE
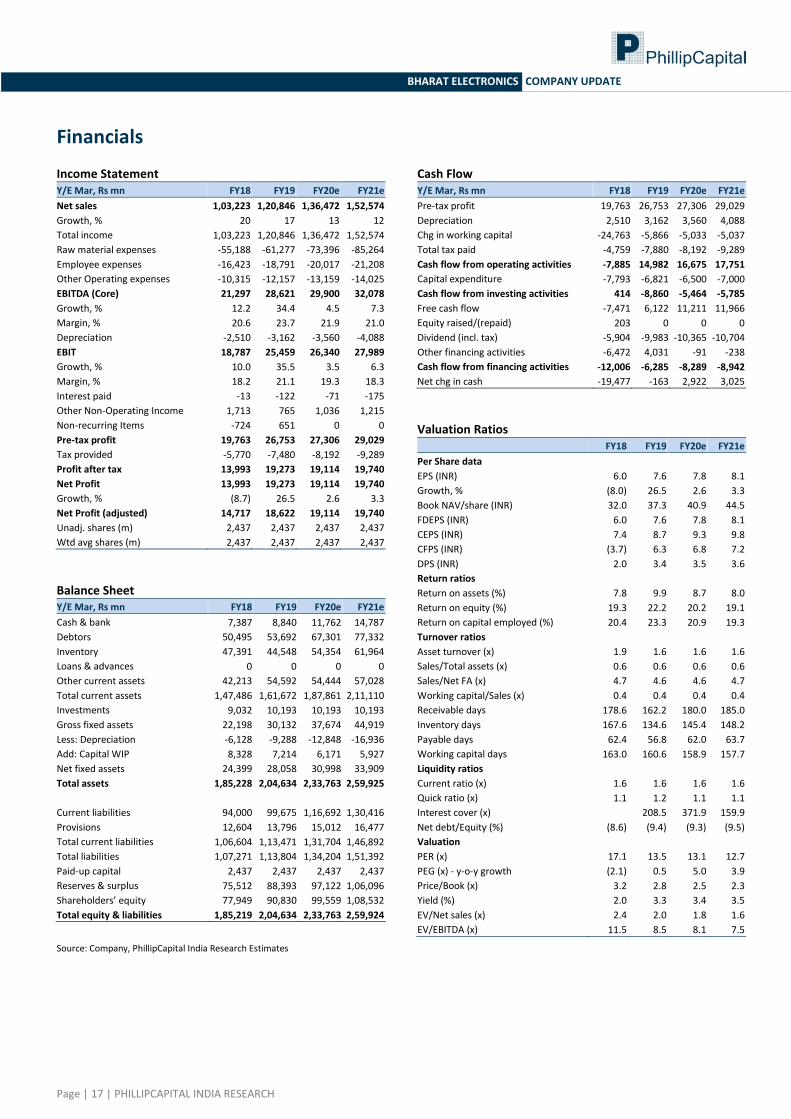
Financials Income Statement Y/E Mar, Rs mn FY18 FY19 FY20e FY21e
Net sales 1,03,223 1,20,846 1,36,472 1,52,574
Growth, % 20 17 13 12
Total income 1,03,223 1,20,846 1,36,472 1,52,574
Raw material expenses -55,188 -61,277 -73,396 -85,264
Employee expenses -16,423 -18,791 -20,017 -21,208
Other Operating expenses -10,315 -12,157 -13,159 -14,025
EBITDA (Core) 21,297 28,621 29,900 32,078
Growth, % 12.2 34.4 4.5 7.3
Margin, % 20.6 23.7 21.9 21.0
Depreciation -2,510 -3,162 -3,560 -4,088
EBIT 18,787 25,459 26,340 27,989
Growth, % 10.0 35.5 3.5 6.3
Margin, % 18.2 21.1 19.3 18.3
Interest paid -13 -122 -71 -175
Other Non-Operating Income 1,713 765 1,036 1,215
Non-recurring Items -724 651 0 0
Pre-tax profit 19,763 26,753 27,306 29,029
Tax provided -5,770 -7,480 -8,192 -9,289
Profit after tax 13,993 19,273 19,114 19,740
Net Profit 13,993 19,273 19,114 19,740
Growth, % (8.7) 26.5 2.6 3.3
Net Profit (adjusted) 14,717 18,622 19,114 19,740
Unadj. shares (m) 2,437 2,437 2,437 2,437
Wtd avg shares (m) 2,437 2,437 2,437 2,437
Balance Sheet Y/E Mar, Rs mn FY18 FY19 FY20e FY21e
Cash & bank 7,387 8,840 11,762 14,787
Debtors 50,495 53,692 67,301 77,332
Inventory 47,391 44,548 54,354 61,964
Loans & advances 0 0 0 0
Other current assets 42,213 54,592 54,444 57,028
Total current assets 1,47,486 1,61,672 1,87,861 2,11,110
Investments 9,032 10,193 10,193 10,193
Gross fixed assets 22,198 30,132 37,674 44,919
Less: Depreciation -6,128 -9,288 -12,848 -16,936
Add: Capital WIP 8,328 7,214 6,171 5,927
Net fixed assets 24,399 28,058 30,998 33,909
Total assets 1,85,228 2,04,634 2,33,763 2,59,925
Current liabilities 94,000 99,675 1,16,692 1,30,416
Provisions 12,604 13,796 15,012 16,477
Total current liabilities 1,06,604 1,13,471 1,31,704 1,46,892
Total liabilities 1,07,271 1,13,804 1,34,204 1,51,392
Paid-up capital 2,437 2,437 2,437 2,437
Reserves & surplus 75,512 88,393 97,122 1,06,096
Shareholders’ equity 77,949 90,830 99,559 1,08,532
Total equity & liabilities 1,85,219 2,04,634 2,33,763 2,59,924
Source: Company, PhillipCapital India Research Estimates
Cash Flow Y/E Mar, Rs mn FY18 FY19 FY20e FY21e
Pre-tax profit 19,763 26,753 27,306 29,029
Depreciation 2,510 3,162 3,560 4,088
Chg in working capital -24,763 -5,866 -5,033 -5,037
Total tax paid -4,759 -7,880 -8,192 -9,289
Cash flow from operating activities -7,885 14,982 16,675 17,751
Capital expenditure -7,793 -6,821 -6,500 -7,000
Cash flow from investing activities 414 -8,860 -5,464 -5,785
Free cash flow -7,471 6,122 11,211 11,966
Equity raised/(repaid) 203 0 0 0
Dividend (incl. tax) -5,904 -9,983 -10,365 -10,704
Other financing activities -6,472 4,031 -91 -238
Cash flow from financing activities -12,006 -6,285 -8,289 -8,942
Net chg in cash -19,477 -163 2,922 3,025
Valuation Ratios
FY18 FY19 FY20e FY21e
Per Share data EPS (INR) 6.0 7.6 7.8 8.1
Growth, % (8.0) 26.5 2.6 3.3
Book NAV/share (INR) 32.0 37.3 40.9 44.5
FDEPS (INR) 6.0 7.6 7.8 8.1
CEPS (INR) 7.4 8.7 9.3 9.8
CFPS (INR) (3.7) 6.3 6.8 7.2
DPS (INR) 2.0 3.4 3.5 3.6
Return ratios Return on assets (%) 7.8 9.9 8.7 8.0
Return on equity (%) 19.3 22.2 20.2 19.1
Return on capital employed (%) 20.4 23.3 20.9 19.3
Turnover ratios Asset turnover (x) 1.9 1.6 1.6 1.6
Sales/Total assets (x) 0.6 0.6 0.6 0.6
Sales/Net FA (x) 4.7 4.6 4.6 4.7
Working capital/Sales (x) 0.4 0.4 0.4 0.4
Receivable days 178.6 162.2 180.0 185.0
Inventory days 167.6 134.6 145.4 148.2
Payable days 62.4 56.8 62.0 63.7
Working capital days 163.0 160.6 158.9 157.7
Liquidity ratios
Current ratio (x) 1.6 1.6 1.6 1.6
Quick ratio (x) 1.1 1.2 1.1 1.1
Interest cover (x) 208.5 371.9 159.9
Net debt/Equity (%) (8.6) (9.4) (9.3) (9.5)
Valuation
PER (x) 17.1 13.5 13.1 12.7
PEG (x) - y-o-y growth (2.1) 0.5 5.0 3.9
Price/Book (x) 3.2 2.8 2.5 2.3
Yield (%) 2.0 3.3 3.4 3.5
EV/Net sales (x) 2.4 2.0 1.8 1.6
EV/EBITDA (x) 11.5 8.5 8.1 7.5

Page | 18 | PHILLIPCAPITAL INDIA RESEARCH
BHARAT ELECTRONICS COMPANY UPDATE
Stock Price, Price Target and Rating History
Rating Methodology We rate stock on absolute return basis. Our target price for the stocks has an investment horizon of one year.
Rating Criteria Definition
BUY >= +15% Target price is equal to or more than 15% of current market price
NEUTRAL -15% > to < +15% Target price is less than +15% but more than -15%
SELL <= -15% Target price is less than or equal to -15%.
Disclosures and Disclaimers PhillipCapital (India) Pvt. Ltd. has three independent equity research groups: Institutional Equities, Institutional Equity Derivatives, and Private Client Group. This report has been prepared by Institutional Equities Group. The views and opinions expressed in this document may, may not match, or may be contrary at times with the views, estimates, rating, and target price of the other equity research groups of PhillipCapital (India) Pvt. Ltd.
This report is issued by PhillipCapital (India) Pvt. Ltd., which is regulated by the SEBI. PhillipCapital (India) Pvt. Ltd. is a subsidiary of Phillip (Mauritius) Pvt. Ltd. References to "PCIPL" in this report shall mean PhillipCapital (India) Pvt. Ltd unless otherwise stated. This report is prepared and distributed by PCIPL for information purposes only, and neither the information contained herein, nor any opinion expressed should be construed or deemed to be construed as solicitation or as offering advice for the purposes of the purchase or sale of any security, investment, or derivatives. The information and opinions contained in the report were considered by PCIPL to be valid when published. The report also contains information provided to PCIPL by third parties. The source of such information will usually be disclosed in the report. Whilst PCIPL has taken all reasonable steps to ensure that this information is correct, PCIPL does not offer any warranty as to the accuracy or completeness of such information. Any person placing reliance on the report to undertake trading does so entirely at his or her own risk and PCIPL does not accept any liability as a result. Securities and Derivatives markets may be subject to rapid and unexpected price movements and past performance is not necessarily an indication of future performance.
This report does not regard the specific investment objectives, financial situation, and the particular needs of any specific person who may receive this report. Investors must undertake independent analysis with their own legal, tax, and financial advisors and reach their own conclusions regarding the appropriateness of investing in any securities or investment strategies discussed or recommended in this report and should understand that statements regarding future prospects may not be realised. Under no circumstances can it be used or considered as an offer to sell or as a solicitation of any offer to buy or sell the securities mentioned within it. The information contained in the research reports may have been taken from trade and statistical services and other sources, which PCIL believe is reliable. PhillipCapital (India) Pvt. Ltd. or any of its group/associate/affiliate companies do not guarantee that such information is accurate or complete and it should not be relied upon as such. Any opinions expressed reflect judgments at this date and are subject to change without notice.
Important: These disclosures and disclaimers must be read in conjunction with the research report of which it forms part. Receipt and use of the research report is subject to all aspects of these disclosures and disclaimers. Additional information about the issuers and securities discussed in this research report is available on request.
Certifications: The research analyst(s) who prepared this research report hereby certifies that the views expressed in this research report accurately reflect the research analyst’s personal views about all of the subject issuers and/or securities, that the analyst(s) have no known conflict of interest and no part of the research analyst’s compensation was, is, or will be, directly or indirectly, related to the specific views or recommendations contained in this research report.
B (TP 220)
B (TP 200)
B (TP 200)
B (TP 180) B (TP 175)
N (TP 108)
N (TP 105) N (TP 100)
N (TP 115)
50
70
90
110
130
150
170
190
210
J-17 S-17 O-17 D-17 J-18 M-18 A-18 J-18 J-18 S-18 O-18 D-18 J-19 M-19 A-19 J-19

Page | 19 | PHILLIPCAPITAL INDIA RESEARCH
BHARAT ELECTRONICS COMPANY UPDATE
Additional Disclosures of Interest: Unless specifically mentioned in Point No. 9 below: 1. The Research Analyst(s), PCIL, or its associates or relatives of the Research Analyst does not have any financial interest in the company(ies) covered in
this report. 2. The Research Analyst, PCIL or its associates or relatives of the Research Analyst affiliates collectively do not hold more than 1% of the securities of the
company (ies)covered in this report as of the end of the month immediately preceding the distribution of the research report. 3. The Research Analyst, his/her associate, his/her relative, and PCIL, do not have any other material conflict of interest at the time of publication of this
research report. 4. The Research Analyst, PCIL, and its associates have not received compensation for investment banking or merchant banking or brokerage services or for
any other products or services from the company(ies) covered in this report, in the past twelve months. 5. The Research Analyst, PCIL or its associates have not managed or co-managed in the previous twelve months, a private or public offering of securities for
the company (ies) covered in this report. 6. PCIL or its associates have not received compensation or other benefits from the company(ies) covered in this report or from any third party, in
connection with the research report. 7. The Research Analyst has not served as an Officer, Director, or employee of the company (ies) covered in the Research report. 8. The Research Analyst and PCIL has not been engaged in market making activity for the company(ies) covered in the Research report. 9. Details of PCIL, Research Analyst and its associates pertaining to the companies covered in the Research report:
Sr. no. Particulars Yes/No
1 Whether compensation has been received from the company(ies) covered in the Research report in the past 12 months for investment banking transaction by PCIL
No
2 Whether Research Analyst, PCIL or its associates or relatives of the Research Analyst affiliates collectively hold more than 1% of the company(ies) covered in the Research report
No
3 Whether compensation has been received by PCIL or its associates from the company(ies) covered in the Research report No
4 PCIL or its affiliates have managed or co-managed in the previous twelve months a private or public offering of securities for the company(ies) covered in the Research report
No
5 Research Analyst, his associate, PCIL or its associates have received compensation for investment banking or merchant banking or brokerage services or for any other products or services from the company(ies) covered in the Research report, in the last twelve months
No
Independence: PhillipCapital (India) Pvt. Ltd. has not had an investment banking relationship with, and has not received any compensation for investment banking services from, the subject issuers in the past twelve (12) months, and PhillipCapital (India) Pvt. Ltd does not anticipate receiving or intend to seek compensation for investment banking services from the subject issuers in the next three (3) months. PhillipCapital (India) Pvt. Ltd is not a market maker in the securities mentioned in this research report, although it, or its affiliates/employees, may have positions in, purchase or sell, or be materially interested in any of the securities covered in the report.
Suitability and Risks: This research report is for informational purposes only and is not tailored to the specific investment objectives, financial situation or particular requirements of any individual recipient hereof. Certain securities may give rise to substantial risks and may not be suitable for certain investors. Each investor must make its own determination as to the appropriateness of any securities referred to in this research report based upon the legal, tax and accounting considerations applicable to such investor and its own investment objectives or strategy, its financial situation and its investing experience. The value of any security may be positively or adversely affected by changes in foreign exchange or interest rates, as well as by other financial, economic, or political factors. Past performance is not necessarily indicative of future performance or results.
Sources, Completeness and Accuracy: The material herein is based upon information obtained from sources that PCIPL and the research analyst believe to be reliable, but neither PCIPL nor the research analyst represents or guarantees that the information contained herein is accurate or complete and it should not be relied upon as such. Opinions expressed herein are current opinions as of the date appearing on this material, and are subject to change without notice. Furthermore, PCIPL is under no obligation to update or keep the information current. Without limiting any of the foregoing, in no event shall PCIL, any of its affiliates/employees or any third party involved in, or related to computing or compiling the information have any liability for any damages of any kind including but not limited to any direct or consequential loss or damage, however arising, from the use of this document.
Copyright: The copyright in this research report belongs exclusively to PCIPL. All rights are reserved. Any unauthorised use or disclosure is prohibited. No reprinting or reproduction, in whole or in part, is permitted without the PCIPL’s prior consent, except that a recipient may reprint it for internal circulation only and only if it is reprinted in its entirety.
Caution: Risk of loss in trading/investment can be substantial and even more than the amount / margin given by you. Investment in securities market are subject to market risks, you are requested to read all the related documents carefully before investing. You should carefully consider whether trading/investment is appropriate for you in light of your experience, objectives, financial resources and other relevant circumstances. PhillipCapital and any of its employees, directors, associates, group entities, or affiliates shall not be liable for losses, if any, incurred by you. You are further cautioned that trading/investments in financial markets are subject to market risks and are advised to seek independent third party trading/investment advice outside PhillipCapital/group/associates/affiliates/directors/employees before and during your trading/investment. There is no guarantee/assurance as to returns or profits or capital protection or appreciation. PhillipCapital and any of its employees, directors, associates, and/or employees, directors, associates of
Page | 20 | PHILLIPCAPITAL INDIA RESEARCH
BHARAT ELECTRONICS COMPANY UPDATE
PhillipCapital’s group entities or affiliates is not inducing you for trading/investing in the financial market(s). Trading/Investment decision is your sole responsibility. You must also read the Risk Disclosure Document and Do’s and Don’ts before investing.
Kindly note that past performance is not necessarily a guide to future performance.
For Detailed Disclaimer: Please visit our website www.phillipcapital.in IMPORTANT DISCLOSURES FOR U.S. PERSONS This research report is a product of PhillipCapital (India) Pvt. Ltd. which is the employer of the research analyst(s) who has prepared the research report. PhillipCapital (India) Pvt Ltd. is authorized to engage in securities activities in India. PHILLIPCAP is not a registered broker-dealer in the United States and, therefore, is not subject to U.S. rules regarding the preparation of research reports and the independence of research analysts. This research report is provided for distribution to “major U.S. institutional investors” in reliance on the exemption from registration provided by Rule 15a-6 of the U.S. Securities Exchange Act of 1934, as amended (the “Exchange Act”). If the recipient of this report is not a Major Institutional Investor as specified above, then it should not act upon this report and return the same to the sender. Further, this report may not be copied, duplicated and/or transmitted onward to any U.S. person, which is not a Major Institutional Investor.
Any U.S. recipient of this research report wishing to effect any transaction to buy or sell securities or related financial instruments based on the information provided in this research report should do so only through Rosenblatt Securities Inc, 40 Wall Street 59th Floor, New York NY 10005, a registered broker dealer in the United States. Under no circumstances should any recipient of this research report effect any transaction to buy or sell securities or related financial instruments through PHILLIPCAP. Rosenblatt Securities Inc. accepts responsibility for the contents of this research report, subject to the terms set out below, to the extent that it is delivered to a U.S. person other than a major U.S. institutional investor.
The analyst whose name appears in this research report is not registered or qualified as a research analyst with the Financial Industry Regulatory Authority (“FINRA”) and may not be an associated person of Rosenblatt Securities Inc. and, therefore, may not be subject to applicable restrictions under FINRA Rules on communications with a subject company, public appearances and trading securities held by a research analyst account. Ownership and Material Conflicts of Interest Rosenblatt Securities Inc. or its affiliates does not ‘beneficially own,’ as determined in accordance with Section 13(d) of the Exchange Act, 1% or more of any of the equity securities mentioned in the report. Rosenblatt Securities Inc, its affiliates and/or their respective officers, directors or employees may have interests, or long or short positions, and may at any time make purchases or sales as a principal or agent of the securities referred to herein. Rosenblatt Securities Inc. is not aware of any material conflict of interest as of the date of this publication Compensation and Investment Banking Activities Rosenblatt Securities Inc. or any affiliate has not managed or co-managed a public offering of securities for the subject company in the past 12 months, nor received compensation for investment banking services from the subject company in the past 12 months, neither does it or any affiliate expect to receive, or intends to seek compensation for investment banking services from the subject company in the next 3 months. Additional Disclosures This research report is for distribution only under such circumstances as may be permitted by applicable law. This research report has no regard to the specific investment objectives, financial situation or particular needs of any specific recipient, even if sent only to a single recipient. This research report is not guaranteed to be a complete statement or summary of any securities, markets, reports or developments referred to in this research report. Neither PHILLIPCAP nor any of its directors, officers, employees or agents shall have any liability, however arising, for any error, inaccuracy or incompleteness of fact or opinion in this research report or lack of care in this research report’s preparation or publication, or any losses or damages which may arise from the use of this research report.
PHILLIPCAP may rely on information barriers, such as “Chinese Walls” to control the flow of information within the areas, units, divisions, groups, or affiliates of PHILLIPCAP.
Investing in any non-U.S. securities or related financial instruments (including ADRs) discussed in this research report may present certain risks. The securities of non-U.S. issuers may not be registered with, or be subject to the regulations of, the U.S. Securities and Exchange Commission. Information on such non-U.S. securities or related financial instruments may be limited. Foreign companies may not be subject to audit and reporting standards and regulatory requirements comparable to those in effect within the United States.
The value of any investment or income from any securities or related financial instruments discussed in this research report denominated in a currency other than U.S. dollars is subject to exchange rate fluctuations that may have a positive or adverse effect on the value of or income from such securities or related financial instruments.
Past performance is not necessarily a guide to future performance and no representation or warranty, express or implied, is made by PHILLIPCAP with respect to future performance. Income from investments may fluctuate. The price or value of the investments to which this research report relates, either directly or indirectly, may fall or rise against the interest of investors. Any recommendation or opinion contained in this research report may become outdated as a consequence of changes in the environment in which the issuer of the securities under analysis operates, in addition to changes in the estimates and forecasts, assumptions and valuation methodology used herein.
No part of the content of this research report may be copied, forwarded or duplicated in any form or by any means without the prior written consent of PHILLIPCAP and PHILLIPCAP accepts no liability whatsoever for the actions of third parties in this respect.
PhillipCapital (India) Pvt. Ltd. Registered office: 18th floor, Urmi Estate, Ganpatrao Kadam Marg, Lower Parel (West), Mumbai – 400013, India.


![MARINE PUMPS, FILTRATION AND ACCESSORIES€¦ · 4139-131-A87 (4139-131-B87) Intermittent Duty Multi-Fixture Application 24 VDC 8.2" x 4.9" x 4.1" [208 x 124 x104mm] 3.0 GPM [11.35](https://img.pdfslide.us/doc/110x75/5fadbd305fc91474de62ed69/marine-pumps-filtration-and-accessories-4139-131-a87-4139-131-b87-intermittent.jpg)