Embed Size (px)
Citation preview
1
Institutional change, happiness
and fertility
Arnstein Aassve1
Bocconi University and Dondena Centre for Research on Social Dynamics. Email:
Letizia Mencarini2
University of Turin and Collegio Carlo Alberto. Email: [email protected]
Maria Sironi
Department of Sociology and Nuffield College, University of Oxford. Email:
Abstract
Building on existing theories of fertility dynamics, this paper provides a theoretical perspective that
connects two recent strands of the literature. The first concerns the idea that subjective wellbeing
plays a critical role in explaining childbearing behaviour (and vice versa). The second concerns
gender equity and equality, in which the role of institutions plays an important role. The key
argument put forward here is that subjective wellbeing is a direct function of the discrepancy
between aspirations and opportunity structure. As aspirations change over time, discrepancy arises
in so far institutions are unable to follow suit. This lowers subjective wellbeing associated with
childbearing, and hence leads to lower levels of fertility. Our empirical analysis based on the
European Social Survey, although taking an indirect approach, give support to this idea. Fertility
and happiness are higher where institutions appear to have adapted to women’s new preferences and
aspirations. This is further supported by strong gender differences in happiness associated with
parenthood. Fathers are always happier than non-fathers – no matter the circumstances of the
country where they reside – whereas mothers are happier only when relevant institutions are in
place.
1 Arnstein Aassve gratefully acknowledges financial support from the European Research Council under the European
ERC Grant Agreement no StG-201194 (CODEC: Consequences of Demographic Change). 2 Letizia Mencarini gratefully acknowledges financial support from the European Research Council under the European
ERC Grant Agreement no StG-313617 (SWELL-FER: Subjective Well-being and Fertility).
2
1. Introduction
For decades now the majority of advanced countries have experienced below-replacement
fertility levels. Among these countries, however, there is an astounding heterogeneity ranging from
a total fertility rate (TFR) of 2 children per woman in France and close to 1.2 in Hungary (Eurostat
data for 2011; Kohler, Billari and Ortega 2002). These more recent fertility differentials have
become an unsolved puzzle for existing theories of fertility dynamics. Traditional theories of
fertility behaviour do not explain “why people still have children in contemporary advances
societies and also why in some societies fertility is indeed increasing” (Billari and Kohler 2009;
Billari et al. 2007; Goldstein et al 2009). The two most prominent theoretical views of post-
transitional fertility, i.e. the Becker “new home economics” (Becker 1981) and the “second
demographic transition” (Lesthaeghe and Van de Kaa 1986), both predict lower fertility as women
obtain higher education and higher wages. However, recent fertility trends show the opposite. Those
countries which appear to have progressed farthest on the path of the second demographic
transition, also show to have higher fertility (Aassve, Billari, and Pessin 2012; Sobotka 2008). As
highlighted by Myrskyla et al. (2009), among developed countries, fertility now appears to be
rebounding in those countries where development is very high, indicating that there is no simple
linear relationship underlying fertility trends (Luci and Thévenon 2011).
Looking back four to five decades, it is also true that the institutional context of childbearing
has changed in dramatic ways. Whereas the male bread winner model was the dominant way of
organizing family life in the 1960 and 1970s, and hence childbearing, today one would be hard
pressed to find a European country where it still dictates. Instead egalitarian societies are emerging,
where dual earner couples are becoming the norm. Starting from the fact that during the sixties and
the seventies the male bread winner model was dominant across all OECD countries – and with it
3
high fertility rates – a key challenge for demographers has been to explain why societies have taken
such very different fertility paths.
There are two recent theoretical perspectives which consider explicitly the institutional
context of childbearing and the role of women: McDonald's theory of “gender equity vs gender
equality” (McDonald 2000; 2013) and the idea of “incomplete revolution” of Esping-Andersen
(Esping-Andersen 2009). McDonald, observing that the countries with a very low fertility are the
ones with a less equal gender system compared with countries where fertility is relatively higher
(counterpoising the countries of the South with those of Northern Europe), argues that the very low
fertility may be the result of a hiatus that has developed in some developed countries between “high
levels of gender equality in individual-oriented social institutions – i.e. education systems – and
sustained gender inequity in family-oriented social institutions – i.e. couples’ role set” (McDonald
2000). In other words, the gender inequality leads to low fertility only when there is no
correspondence with gender equity, i.e. what it is considered fair for women and men, according to
their respective needs (Mencarini 2013; Neyer et al 2013). Esping-Andersen, moreover, puts focus
on the new role of women in society and the incapability of some societies to adapt to it. Few
children is one of the two “evils” – together with few workers, and therefore too little family
income – originating from a welfare state not able to reconcile motherhood and employment
(Esping-Andersen 2009).
Another recent addition to the literature on low fertility concerns the relationship between
happiness and childbearing (Aassve, Goisis, and Sironi 2012; Billari and Kohler 2009; Baranowska
and Matysiak 2011); Kohler, Behrman, and Skytthe 2005; Margolis and Myrskylä 2011). Linking
subjective wellbeing with fertility is important in that it provides a measure of the way individuals
associate childbearing with something positive, the idea being that fertility is higher in those areas
where couples derive high subjective wellbeing from childbearing. What is less emphasised in the
4
recent contributions in the demography literature is that subjective well being is necessarily a
function of aspirations and attainment, and in particular, the consistency between the two. Lewin
(1944) argues for instance, that subjective wellbeing must be lower in so far aspirations are higher
than what is attained. In contrast, if individuals sense that their aspirations are fulfilled by their
attainment, then subjective wellbeing will also be higher. This argument finds broad support in
psychology (e.g. Campell 1972; 1981) and is followed up by Easterlin and colleagues (Easterlin
1976; Plagnol and Easterlin 2008). What matters for our understanding of fertility change and its
link with subjective wellbeing, is that over time, starting from the male bread winner model of the
sixties and the seventies to present day, women's aspirations changed dramatically, the chief driver
being massive expansion in education among both men and women. It explains why both the male
breadwinner model and the egalitarian may both give rise to high fertility: in both settings there is
consistency between aspirations and attainment. For instance, childbearing in the new emerging
gender egalitarian societies is hypothesised to give higher level of subjective wellbeing for women
because the institutional setting enables them to have working careers and children at the same time,
which consequently should enable higher fertility. The same argument holds for the male
breadwinner model of the sixties and the seventies, where presumably lack of education among
women would not lead to lower happiness if couples specialised between market and household
production. Following this argument, happiness associated with childbearing becomes lower in
those situations where institutions do not correspond to or do not adapt sufficiently quickly to new
preferences. According to both McDonald (McDonald 2000) and Esping-Andersen (2009) this may
happen when societies are making the transition from the male breadwinner model to the egalitarian
one – and where institutions are slow in adapting to new preferences.
We provide some empirical support for these arguments by using data from the European
Social Survey (ESS). In particular, we present a country comparison of happiness and parenthood,
5
held against institutional characteristics of the societies in which individuals and couples reside,
potentially important for the way societies are able to adapt their institutions to women’s new and
emerging aspirations, and make an assessment of how these relate to European fertility levels.
2. Theoretical perspective
It is useful to take what is known as the Second Demographic Transition (SDT) as a starting
point to our analysis. Inspired by the rise of Post-Materialism (Inglehart 1971), its key argument is
that the importance of the family has been waning and instead it is replaced by more liberal
attitudes towards demographic behaviours (Van de Kaa 1987). It is essentially a story of gradual
value change in which individuals put stronger weight to their own realization as opposed to their
family and children. They assign stronger importance to their psychological wellbeing and freedom
of expression (Van de Kaa 1987). These changes are then taken as an explanation for the emergence
of new demographic behaviour, which would include divorce, cohabitation and out-of-wedlock
childbearing - and importantly - fertility decline. The idea that SDT is accompanied by a stronger
emphasis on personal wellbeing brings an immediate link to the literature on subjective wellbeing.
Individuals are in a continuous quest for improving their subjective wellbeing - or happiness - but in
doing so, obtaining a fulfilling family life with many children is not necessarily the only parameter
of interest. Even the early literature on subjective wellbeing recognized that the way individuals
derive wellbeing will necessarily stem from different domains, and though admittedly being one of
the most central ones, family life was only one out of several (Lewin 1944). The part in which there
is an important difference between the psychology perspective and that of the SDT, is that in the
former, subjective wellbeing depends directly on the way aspirations are matched with attainment.
In particular, Campbell (1981) argues that satisfaction in a given domain depends on the net balance
between aspirations and attainments. For example, subjective wellbeing is high if in case of strong
6
educational aspirations, one is also able to attain those aspirations through entering and completing
a degree at a prestigious university. Subjective wellbeing in this domain is instead low if
educational aspirations were high and one ended up dropping out of university. Easterlin (1976)
follows up on these ideas and argues that behaviour is not driven by income and resources per se,
but rather by the relative affluence. Easterlin argued in addition that couples are freer to have
children if their resources were abundant - but only because if this was so, couples would be better
able to realize their material aspirations. This idea is critically important, not least because the
formation of aspirations is complex, and the extent in which there is a match between aspiration and
attainment very much depends on the way individuals compare themselves to their peer group. He
also argued that "in assessing resources, the earnings outlook for young adult males is critical,
because the more the primary breadwinner can support the couple's desired lifestyle, the easier it
will be for the couple to have children and the less pressure for the wife to work". This argument
bear close resemblance to the idea of the traditional Becker (1981) model of household
specialisation, and made a lot of sense given the dominance of the male breadwinner model of the
time. But in order to explain fertility decline and its dynamics in recent times one needs to take a
closer look to the pattern lying behind the formation of new aspirations. Whereas aspiration
formation is clearly complex and there is necessarily large individual heterogeneity, one key
catalyser comes from the expansion of education among women. Although its onset differs,
women’s entering the arena of higher education is one of the most profound and consistent
structural change our societies have witnessed in recent decades, and today women equal that of
men in enrolment in tertiary education. Educational expansion among women, other than
empirically being the key driver behind fertility decline, also changed women's preferences and
aspirations on a broad scale - and in contrast to the male breadwinner societies, women now also
aspire to successful working careers. Interestingly, fertility desires have not changed much over
7
time (Sleebos 2003), meaning that women still want to have children, and more importantly, more
than before they have preference for combining family and work.
Whereas Easterlin used the example of relative affluence to explain how those well-
resourced may have higher fertility because they are better able to fulfil their aspirations, the onset
of mass education among women complicates the picture. The key is that aspirations are no longer
limited to income: to a greater extent women aspire to have children and successful working
careers. It is at this point the role of institutions become paramount to the understanding of
subjective wellbeing associated with childbearing. With such a change in women’s preference
towards work, institutions relating to childbearing and childrearing also have to change. The key
change we observe in the emerging egalitarian societies is a diffusion of new institutions which
facilitate outsourcing of traditional family activities, key examples being childcare and care for the
elderly. As a result it is often argued that fertility is higher in egalitarian societies, where dual earner
couples tend to share household and childrearing tasks, and where outsourcing of traditional family
activities is common (Aassve et al 2012; Feichtinger et al 2013; Esping-Andersen and Billari 2012).
Thus, in these societies, institutional adaptation has ensured a close link with aspirations and
attainment, which would predict both higher fertility and subjective wellbeing.
When thinking of women’s education, or using Esping-Andersen's terminology (Esping-
Andersen 2009), of “women’s revolution”, it is important to keep in mind that in the sixties and the
seventies, the male breadwinner model was also very much dominant in Nordic countries and very
few women entered higher education. The move towards a gender egalitarian society where men
and women gain higher education in equal manner changed first the gender equity (i.e. the
perceptions of fairness and opportunity of couples’ gender role set in housework, care and external
work), then the gender equality (i.e. the dynamics of couple-relations), and – as pointed out by
Kalwij (Kalwij 2010) – as consequence, the opportunity cost of children. But in view of individual
8
happiness, the key lies in the compatibility between individual aspirations and opportunity structure.
In the new egalitarian societies, where women aspire both to parenthood and the pursuit of a
successful working career, policies supportive of gender equality would increase women’s
satisfaction – simply because aspirations and preferences become fulfilled, therefore leading to
higher subjective wellbeing. But the same argument holds for the male breadwinner model: here
women did not attend higher education in large numbers, thereby lowering aspirations for having
successful working careers. Thus, the household specialization so well exemplified by Becker's
analysis, would also in this case suggest a close match between aspirations and opportunity
structure. As consequence, subjective wellbeing from parenthood would be high also in the pure
male-breadwinner society.
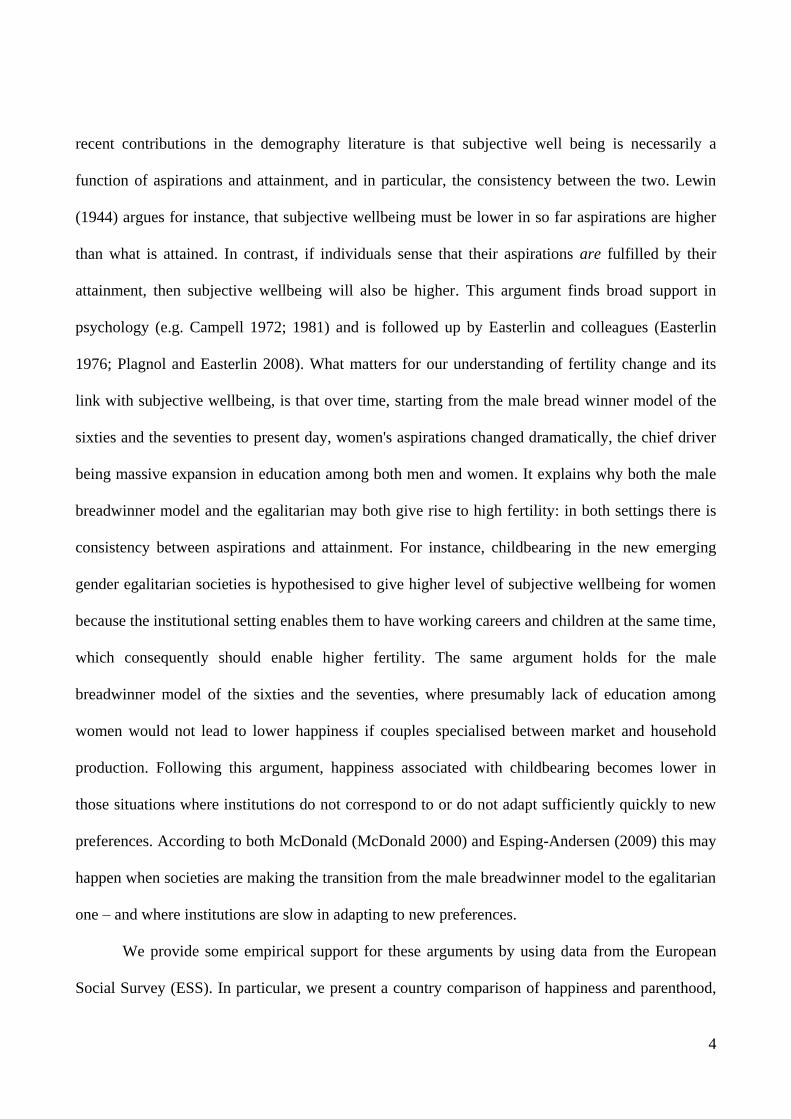
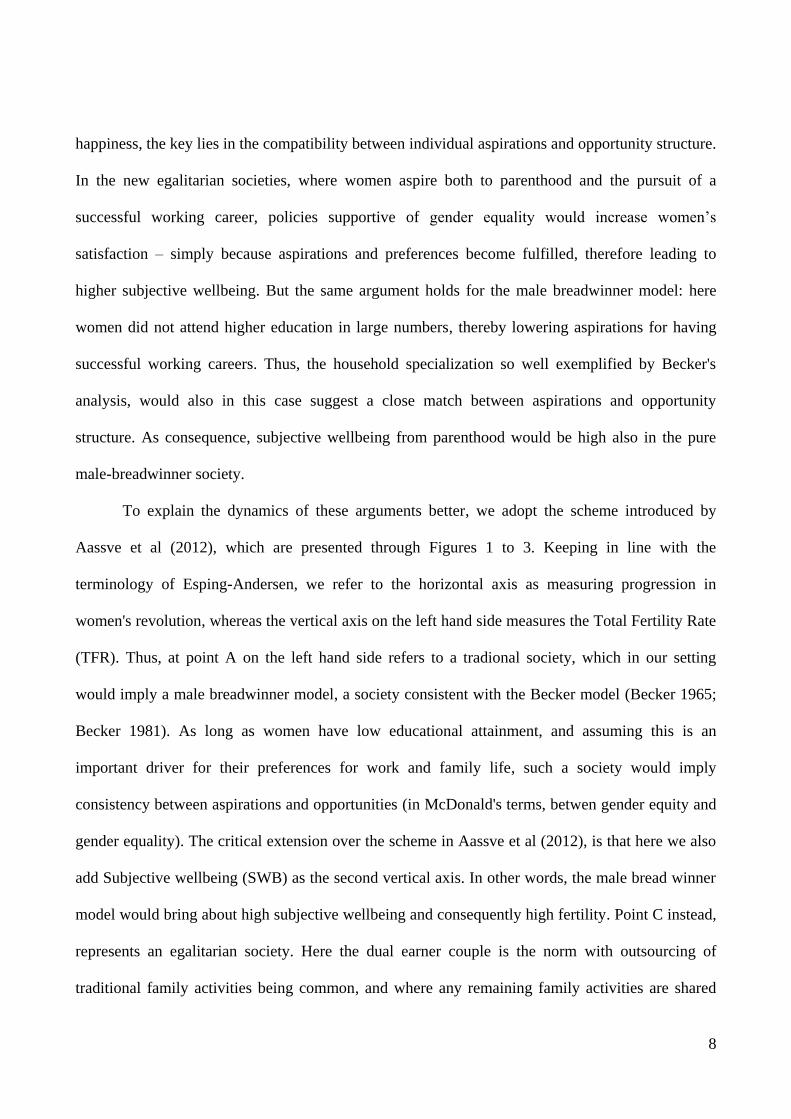
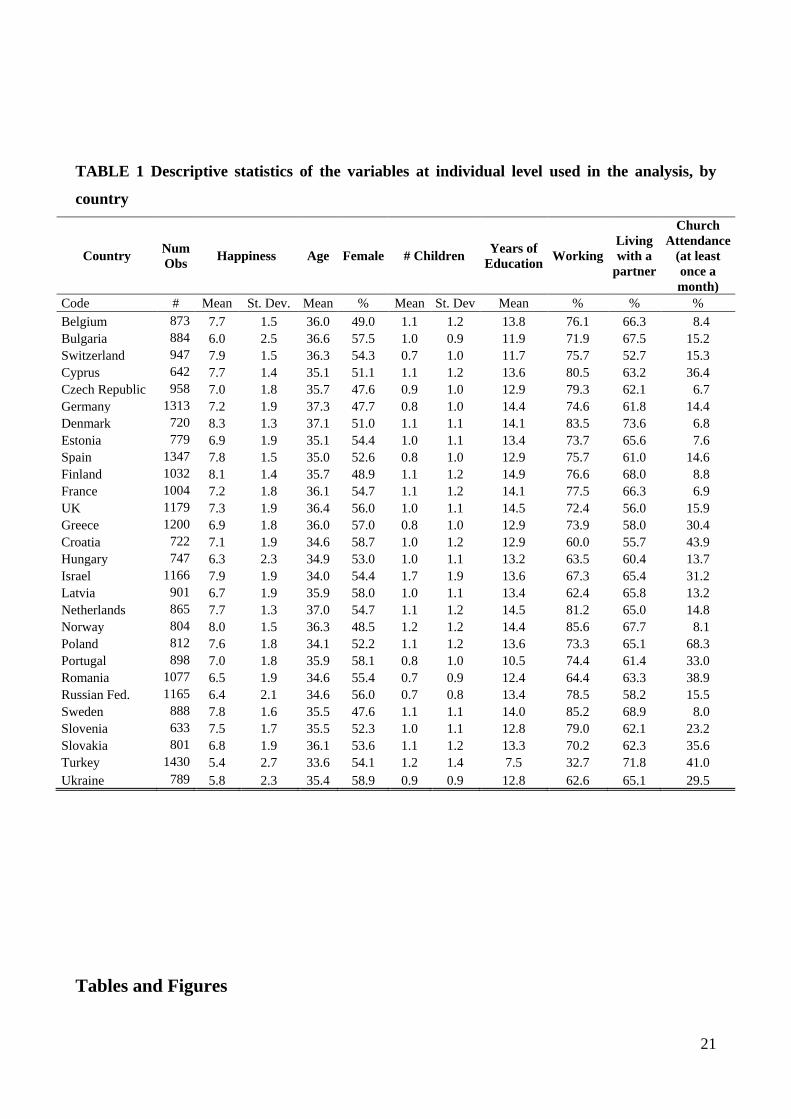
To explain the dynamics of these arguments better, we adopt the scheme introduced by
Aassve et al (2012), which are presented through Figures 1 to 3. Keeping in line with the
terminology of Esping-Andersen, we refer to the horizontal axis as measuring progression in
women's revolution, whereas the vertical axis on the left hand side measures the Total Fertility Rate
(TFR). Thus, at point A on the left hand side refers to a tradional society, which in our setting
would imply a male breadwinner model, a society consistent with the Becker model (Becker 1965;
Becker 1981). As long as women have low educational attainment, and assuming this is an
important driver for their preferences for work and family life, such a society would imply
consistency between aspirations and opportunities (in McDonald's terms, betwen gender equity and
gender equality). The critical extension over the scheme in Aassve et al (2012), is that here we also
add Subjective wellbeing (SWB) as the second vertical axis. In other words, the male bread winner
model would bring about high subjective wellbeing and consequently high fertility. Point C instead,
represents an egalitarian society. Here the dual earner couple is the norm with outsourcing of
traditional family activities being common, and where any remaining family activities are shared
9
between husband and wives. Institutions are in place so that women are able to combine working
careers with childbearing. Again there will be consistency between individuals’ preferences and
opportuntities, which bring about higher SWB and hence fertility. These arguments, again, are
perfectly consistent with the ideas of McDonald (McDonald 2000 and 2013). Perceptions of
consistency between gender equity and equality are compatible both in the traditional male
breadwinner model (with a low level of both) as well as in the new egalitarian society (with a high
level of both), giving rise to high satisfaction and high fertility simply because aspirations are in
line with opportunity structures.
Whereas aspirations and opportunity structure are compatible both in the traditional male
breadwinner model and the new egalitarian society, they will not be during the transition between
the two societies in so far institutions do not adapt in line. In particular, if there is little change in
“family-oriented institutions”, despite changes in gender equity, the burden of housework and care
remain mainly on women’s shoulders, with high gender inequality, generating a “dual-burden”
which most likely affect negatively on women’s subjective assessment of wellbeing from
childbearing (McDonald 2000; Mencarini and Sironi 2012). In Figure 1, such an outcome is found
in point B, where both fertility and SWB are low.
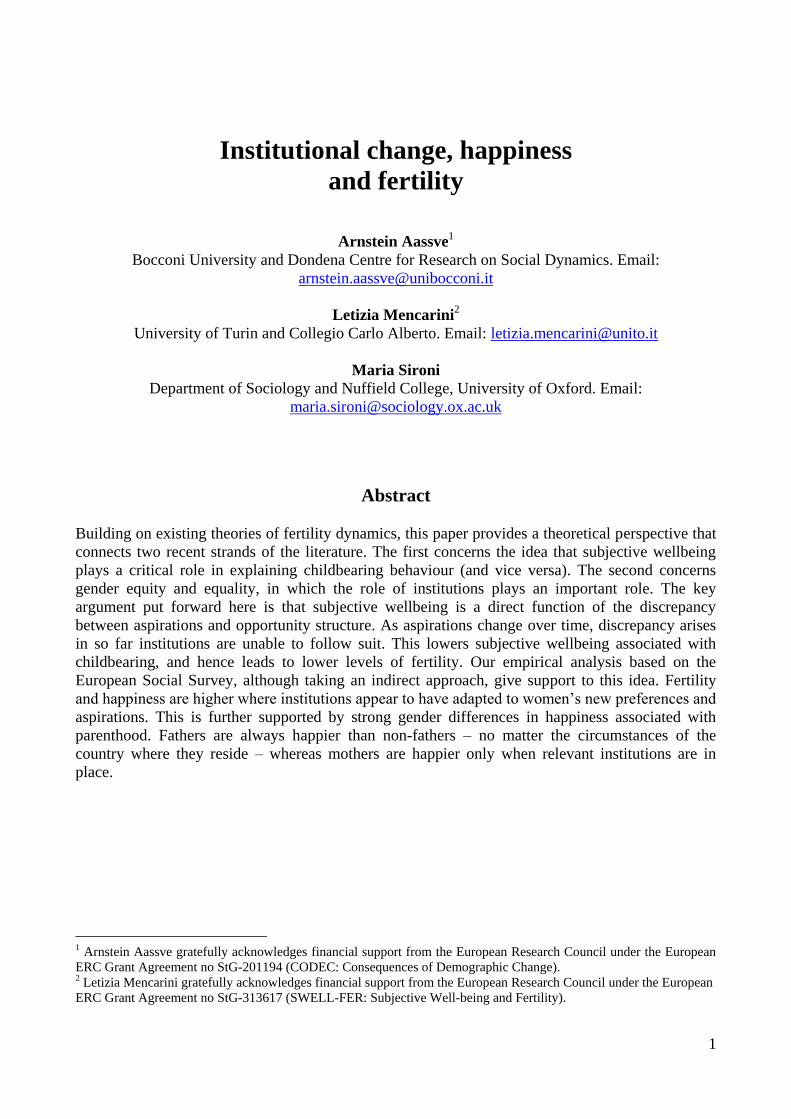
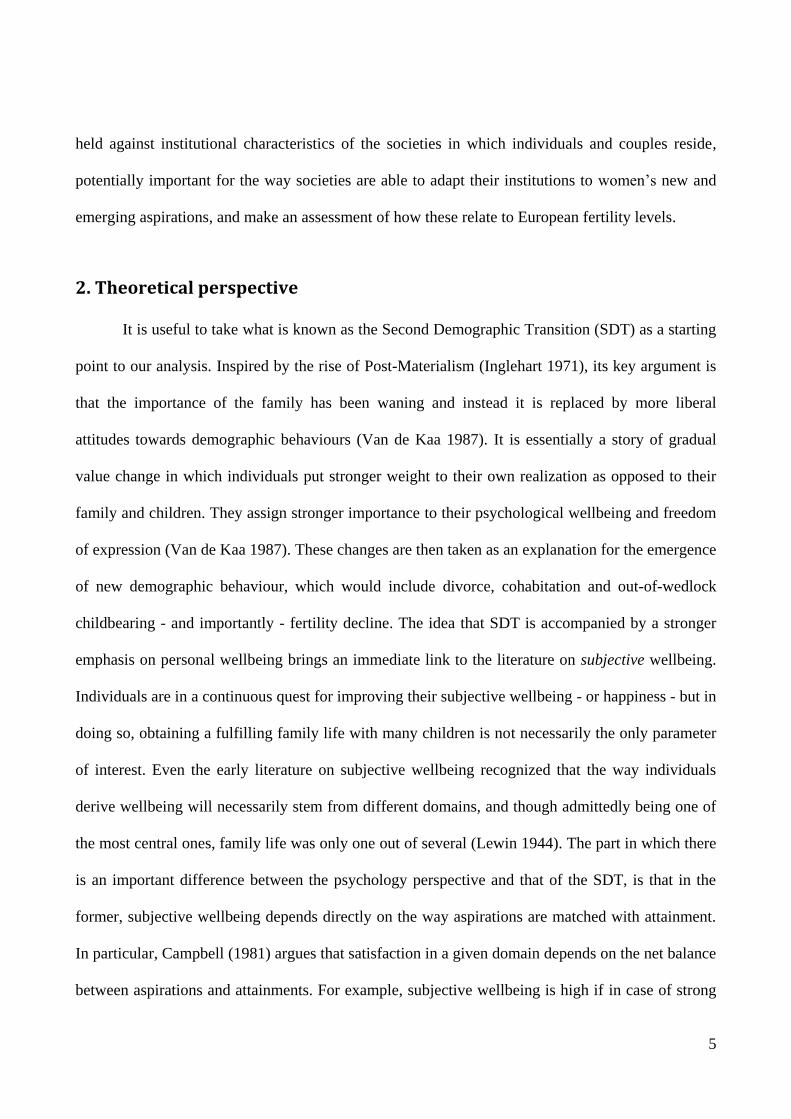
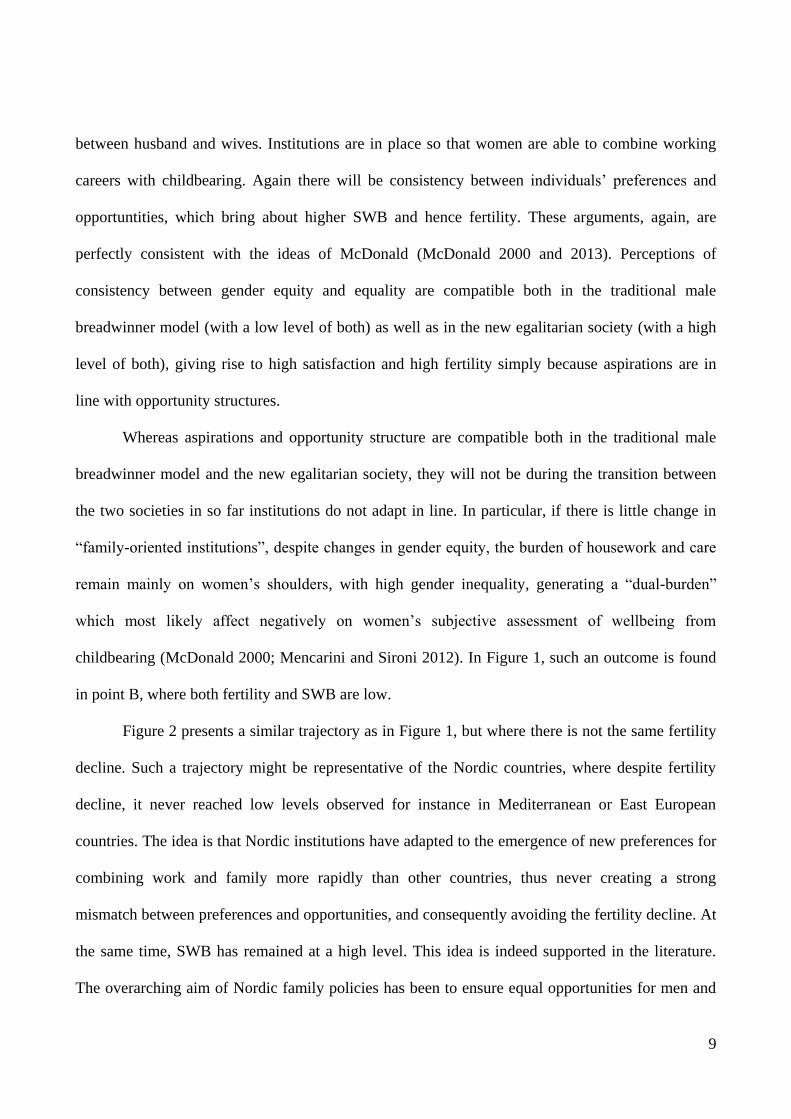
Figure 2 presents a similar trajectory as in Figure 1, but where there is not the same fertility
decline. Such a trajectory might be representative of the Nordic countries, where despite fertility
decline, it never reached low levels observed for instance in Mediterranean or East European
countries. The idea is that Nordic institutions have adapted to the emergence of new preferences for
combining work and family more rapidly than other countries, thus never creating a strong
mismatch between preferences and opportunities, and consequently avoiding the fertility decline. At
the same time, SWB has remained at a high level. This idea is indeed supported in the literature.
The overarching aim of Nordic family policies has been to ensure equal opportunities for men and
10
women, and they have been introduced in direct response to the new role played by women (Aassve
and Lappegård 2009). In fact, Nordic policies seldom had the aim of increasing fertility per se.
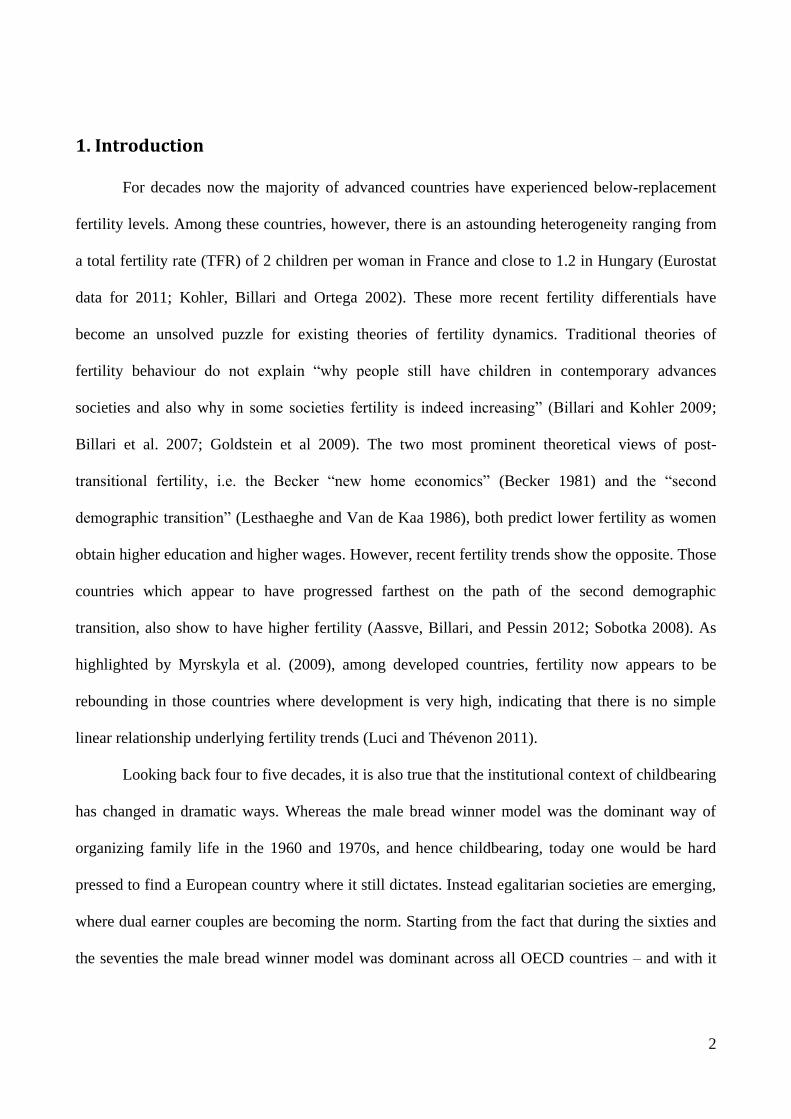
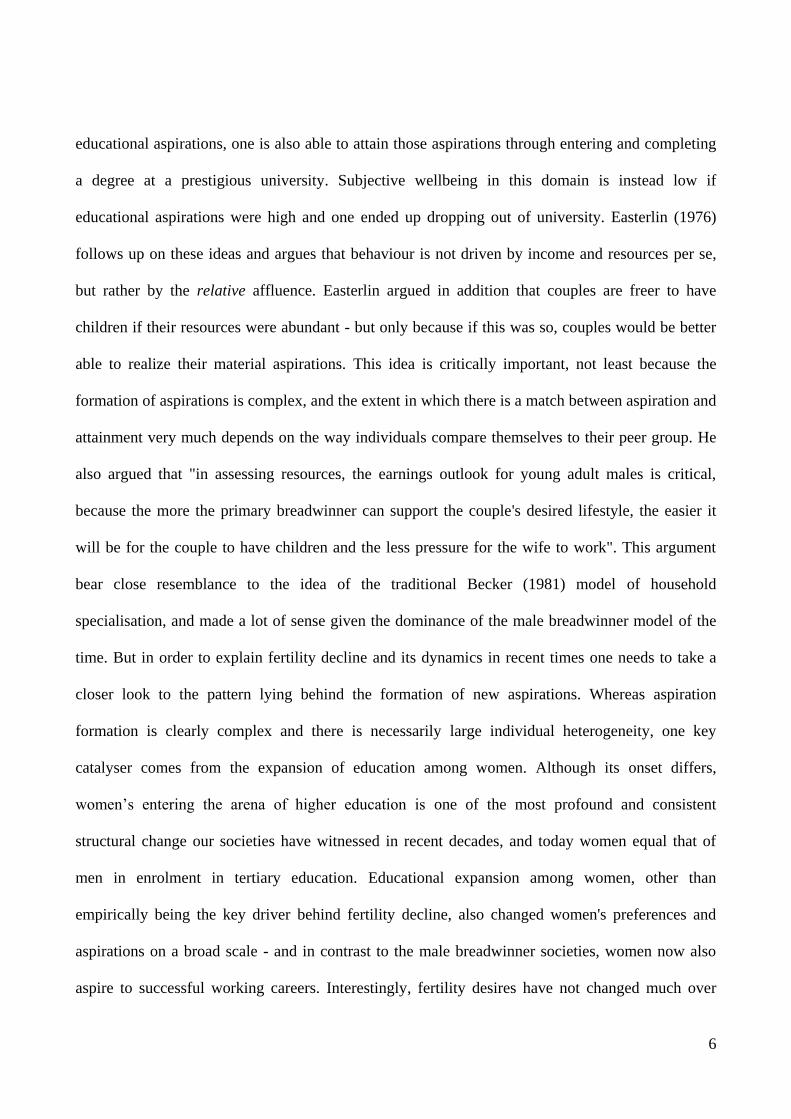
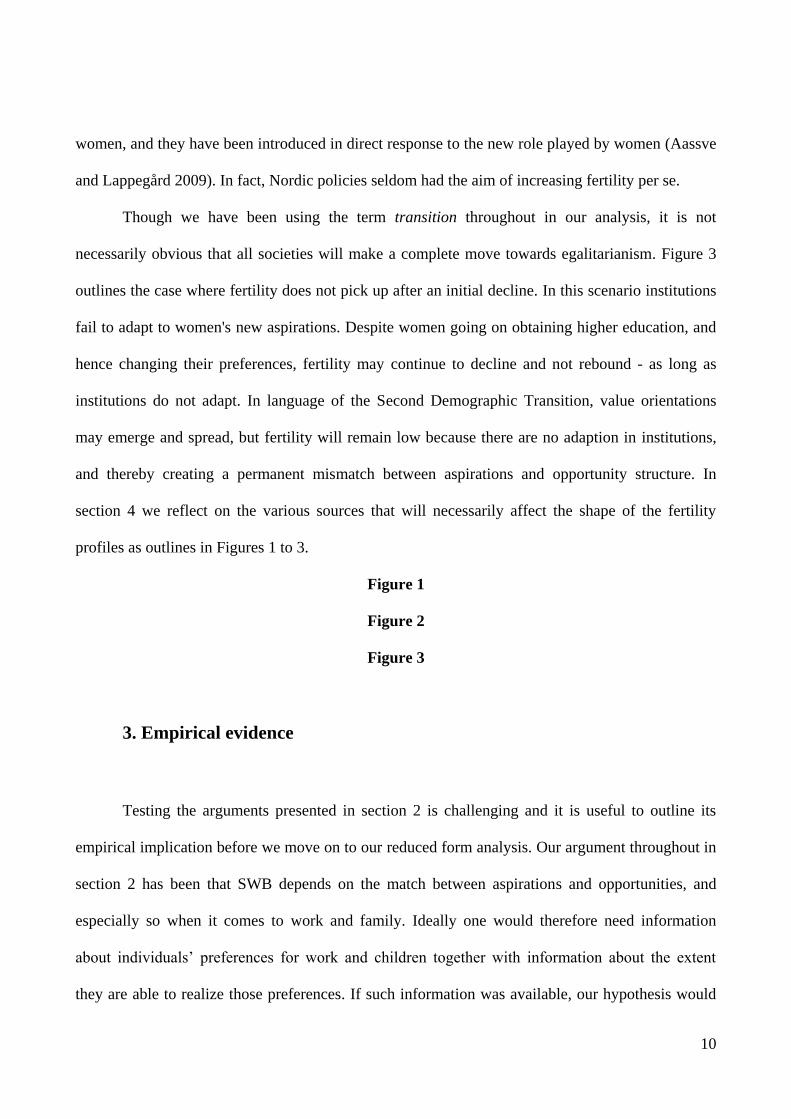
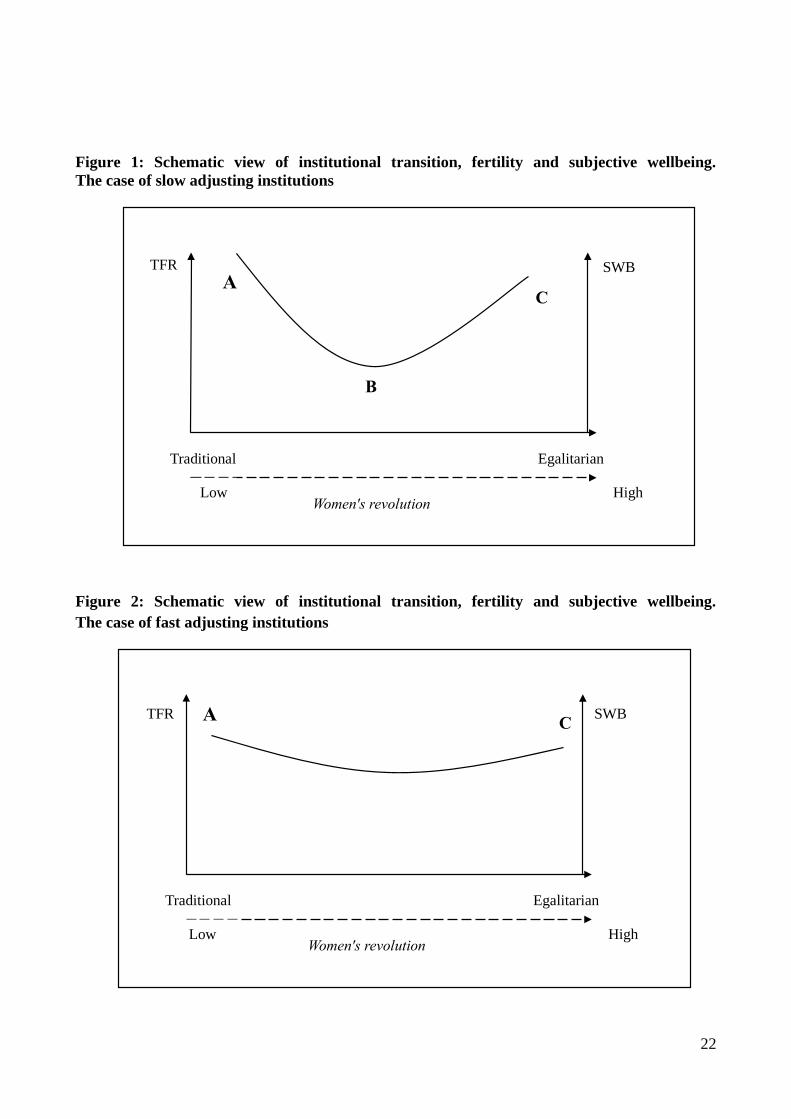
Though we have been using the term transition throughout in our analysis, it is not
necessarily obvious that all societies will make a complete move towards egalitarianism. Figure 3
outlines the case where fertility does not pick up after an initial decline. In this scenario institutions
fail to adapt to women's new aspirations. Despite women going on obtaining higher education, and
hence changing their preferences, fertility may continue to decline and not rebound - as long as
institutions do not adapt. In language of the Second Demographic Transition, value orientations
may emerge and spread, but fertility will remain low because there are no adaption in institutions,
and thereby creating a permanent mismatch between aspirations and opportunity structure. In
section 4 we reflect on the various sources that will necessarily affect the shape of the fertility
profiles as outlines in Figures 1 to 3.
Figure 1
Figure 2
Figure 3
3. Empirical evidence
Testing the arguments presented in section 2 is challenging and it is useful to outline its
empirical implication before we move on to our reduced form analysis. Our argument throughout in
section 2 has been that SWB depends on the match between aspirations and opportunities, and
especially so when it comes to work and family. Ideally one would therefore need information
about individuals’ preferences for work and children together with information about the extent
they are able to realize those preferences. If such information was available, our hypothesis would
11
be that a low discrepancy between the two should give higher subjective wellbeing and higher
fertility - both consistent with the male breadwinner model and that of the egalitarian dual earner-
couple societies associated with childbearing. But an appropriate implementation would also mean
that the measures are available repeatedly over time in order to assess the impact on childbearing
events. Making the appropriate links to the macro level (and hence the nature of the institutional
settings), would in addition mean that such information should be available for several countries.
Even if such micro-level data was available, one would also face important econometric problems
since the preference-opportunity gap would be endogenous with respect to observed behaviour.
Given data limitations, our approach is a reduced form version where the aim is to explore
empirical support for the idea put forward. We take a cross section of the European Social Survey
and estimate a multilevel regression model where the dependent variable is a measure of subjective
wellbeing. The key explanatory variables are the number of children (i.e. our measure of individual
level fertility), country characteristics, and critically important, the cross-level interaction between
the number of children an individual has and those country characteristics. We then compare
reported happiness for men and women who reside in countries with different institutional
characteristics and, in order to make inference about the role of these institutions, individuals with
no children are taken as a baseline case and compared with those who have children. Whether
subjective wellbeing is higher for those women with children compared to those without is not
given a priori. However, given the theoretical considerations, we would expect that in egalitarian
societies, where we assume a closer match between aspirations and opportunity structure, men and
women would be more similar in the way they report subjective wellbeing when having children. In
gender unequal societies, where the mismatch is stronger, the reported subjective wellbeing from
parenthood would be lower, but more importantly, the discrepancy between mothers and fathers
would be larger.
12
3.1 Descriptive analysis
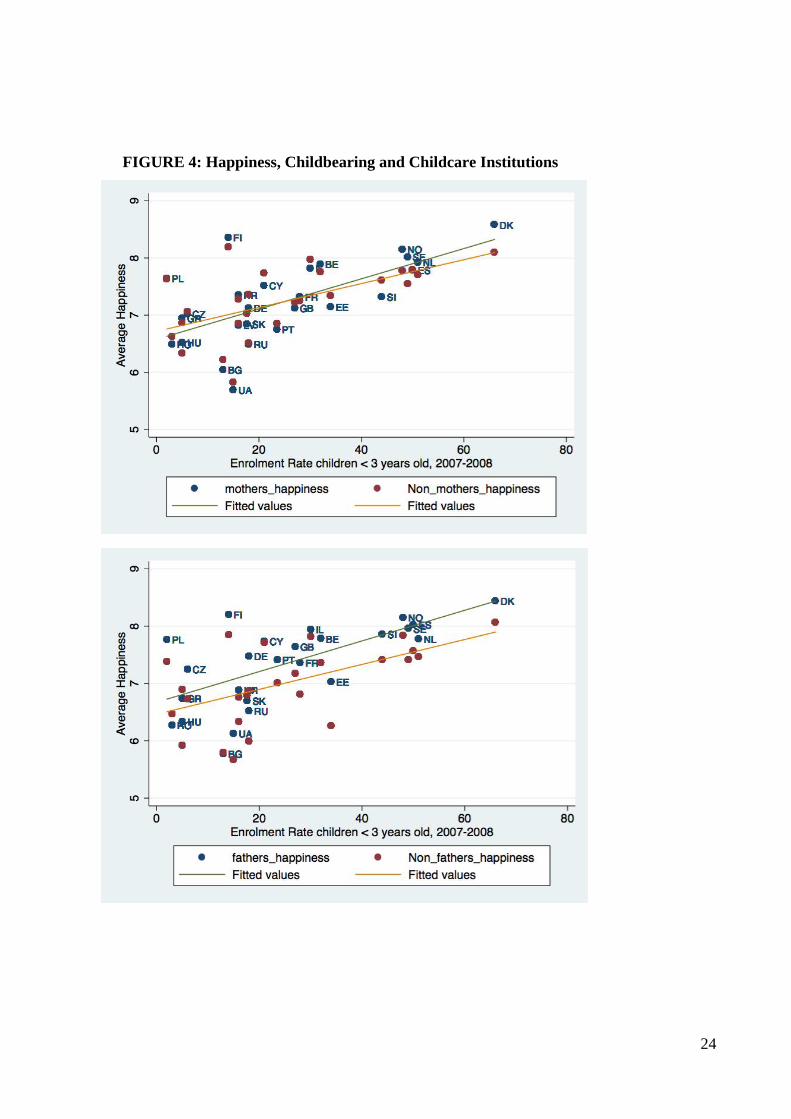
In Figures 4 to 7 we have made a bivariate plot that underlines the idea. These plots are
derived from the 2008 round of the European Social Survey3 (ESS), which is representative of the
European population aged 15 and over. The selected sample is made up of 26,576 individuals (of
which 53% are women) between 20 and 50 years of age so to have a more homogeneous sample
with regard to fertility choices. Happiness4 (which is our dependent variable) is measured through
the question “Taking all things together, how happy would you say you are?” and the answer is
given on an ordinal scale, ranging from 0 (extremely unhappy) to 10 (extremely happy). The choice
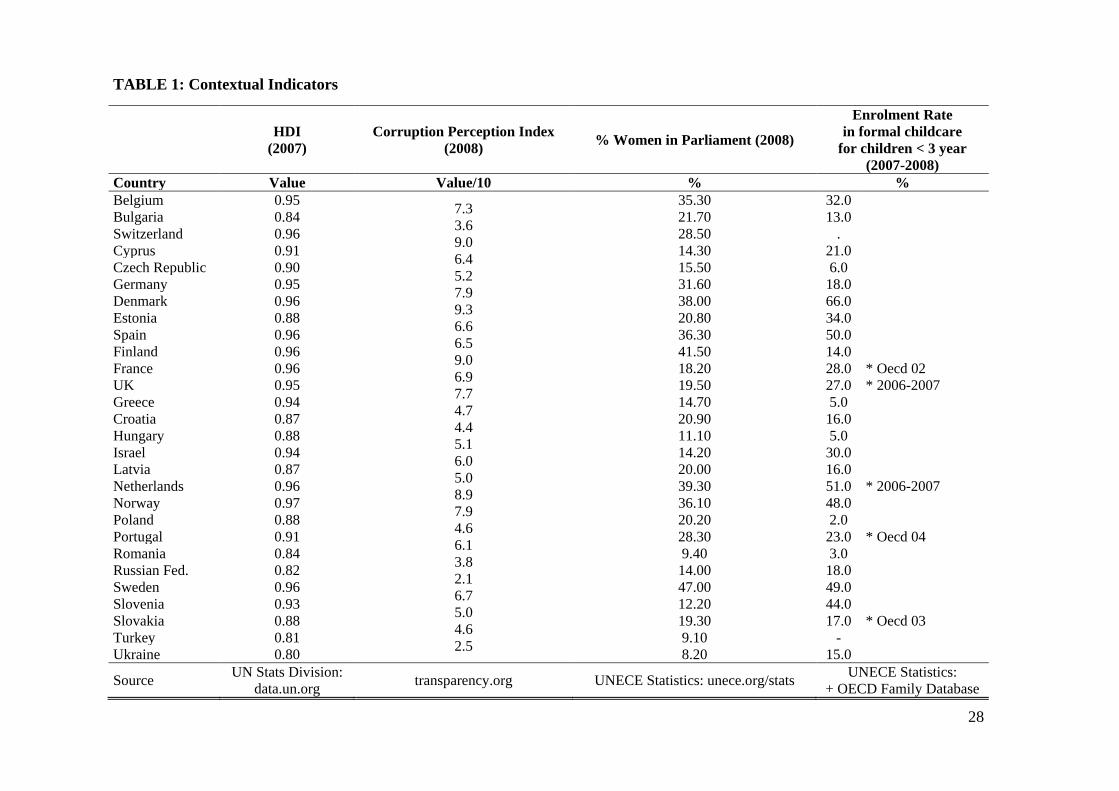
of contextual variables are motivated from our theoretical arguments as outlined in section 2. We
first include an overall measure of development. This is given by the Human Development Index, a
composite scale made up of average educational levels, GDP per capita and life expectancy. The
second is a measure formal child care services for children below three years old (measured by the
number of children aged below 3 enrolled in formal child-care centres per 100 children in 2007-
2008). The third is a measure of gender empowerment and is given by the percentage of women
members of the national parliaments. The last measure is the Corruption Perception Index (CPI). It
is collected from Transparency International for the year 2008, and taken as an approximation for
the governance quality of the country. It is also serves as an approximation of trust in the sense that
corruption and country levels of generalized trust has a strong negative correlation (Uslaner 2002)5.
3 We use the 2008 round of the ESS for several reasons. First of all, this is the most recent round collected before the
Economic crisis, and we want to rule out the possibility that atypical economic conditions bias the results of our
analysis. Also, the 2008 round is the one for which we could collect almost complete macro-level information used in
the multilevel analysis. Robustness checks using other rounds of the ESS and the cumulative data set have been
performed and confirm our results. 4 We take happiness as an approximation for subjective wellbeing, though it should be emphasized that our results are
virtually identical to the case when we use instead overall life satisfaction. 5 CPI is equal to 0 if the country is highly corrupted and equal to 100 if the country is very clean.
13
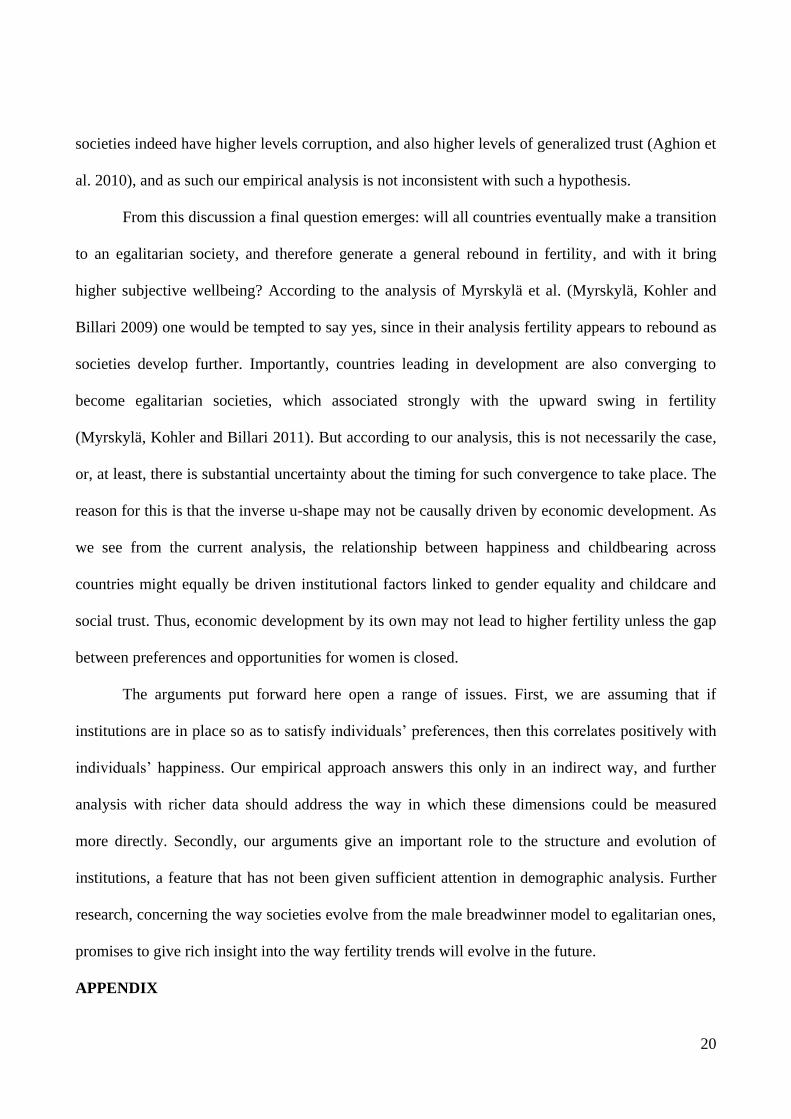
Table 1 provides descriptive statistics of the key variables. Simple eyeballing of Table 1
reveals systematic differences across countries. Starting with socioeconomic development, we find
the Scandinavian countries, together with Netherlands, France and Switzerland at the top. Eastern
European countries are lagging behind, with the remaining Continental European countries located
in between. Countries with the highest percentage of women working in the national parliament are
again Nordic countries (Sweden, Finland, Denmark and Netherlands), as opposed to Eastern
European ones (Hungary, Romania, Turkey and Ukraine). As for childcare provision, the picture is
somewhat more mixed. Scandinavian countries are still in top positions, but there are some Eastern
and continental European countries, which seem to have good childcare provision (e.g. Estonia).
Table 1
In Figure 4 happiness is held up against availability of childcare, and we do so by parents
(blue coloured dots) and for non-parents (red coloured dots). We then fit a regression line for each
sets of dots. The association is clearly positive, meaning that happiness is higher when childcare
infrastructure is well developed, and again by eyeballing the graph, we see that there is a positive
relationship with fertility. That is, fertility is highest in the Nordic countries, all of which are located
in the upper right hand corner of the graph, whereas the low fertility countries are found at the other
end of the spectrum with low levels of happiness and lower provision of childcare, examples being
those of East Europe and the Mediterranean countries. However an important point is that the fitted
lines for parents and non-parents are not parallel. In fact, for women, it turns out that in those
countries where childcare is well developed, mothers are happier than non-mothers, whereas the
opposite is the case in those countries with poor childcare provision. Fathers, on the other hand, are
always happier non-fathers, but also here we see that the lines are not parallel. In other words, in
14
societies where childcare is extensive, fathers are happier than those fathers who experience poorer
childcare, and again the difference to non-fathers are larger in the former. It is worthwhile reflecting
on these patterns. First, without looking at the difference between parents and non-parents, one
could be tempted to suggest that the positive slope by itself reflects the way there is a mismatch
between preferences and opportunities, as we have outlined in the theoretical framework. However,
the positive slope may also reflect simply that happiness tend to be higher in high income countries,
and perhaps because of an income effect, fertility is higher (provision of childcare correlates
strongly with economic development – see below). The more convincing evidence derives from the
fact that the fitted lines for parents and non-parents are not parallel and that there is such
discrepancy between mothers and fathers in the low fertility countries. The discrepancy between the
slopes of the fitted lines, together with the differences across gender, suggests that the gap between
aspirations and opportunity structure does matter, and gives at least tentative support to the
theoretical arguments.
Figure 4
As we look across these countries, it is clear that they differ in their path towards a gender
egalitarian equilibrium - to use Esping-Andersen's terminology (Esping-Andersen 2009). None of
them can be said to be pure male breadwinner types, since in all countries, there is a high
percentage of women having tertiary education and in no countries is there a total lack of childcare
facilities. The Nordic countries, where fertility and happiness is high, are close to the egalitarian
societies - in Figure 1 represented by point C, whereas the countries located in the lower left hand
side corner of Figure 4 would resemble countries located in point B in Figure 1.
15
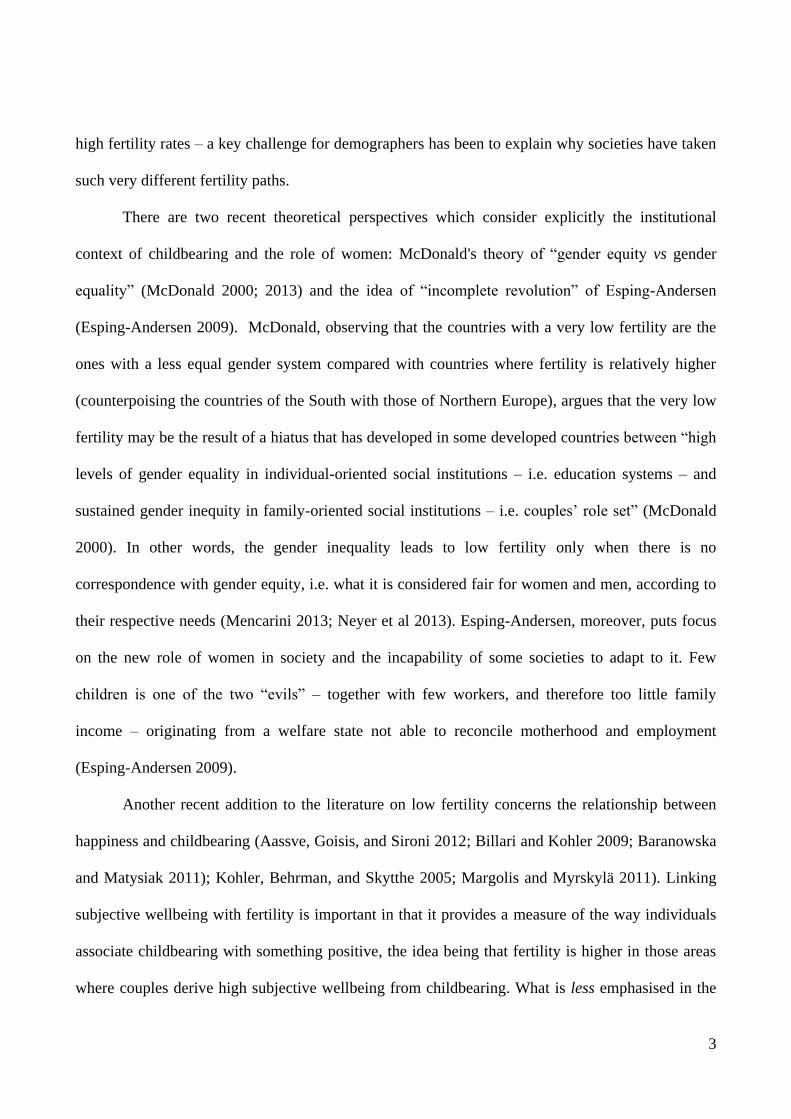
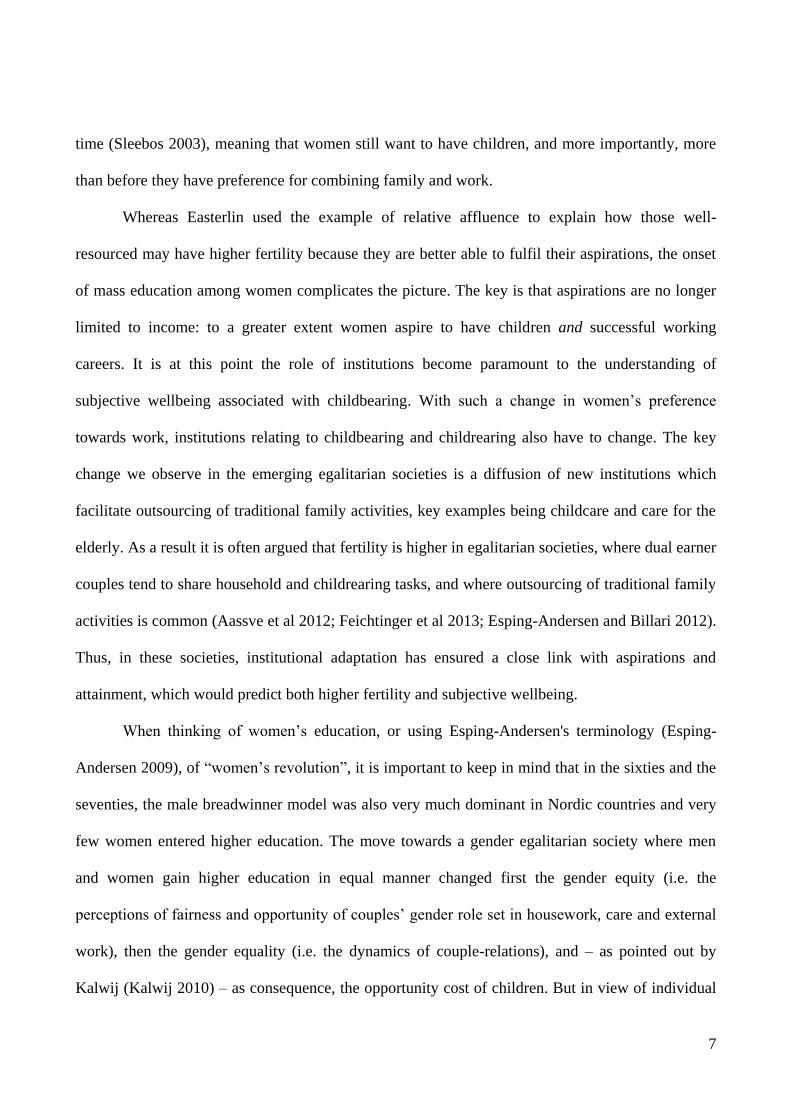
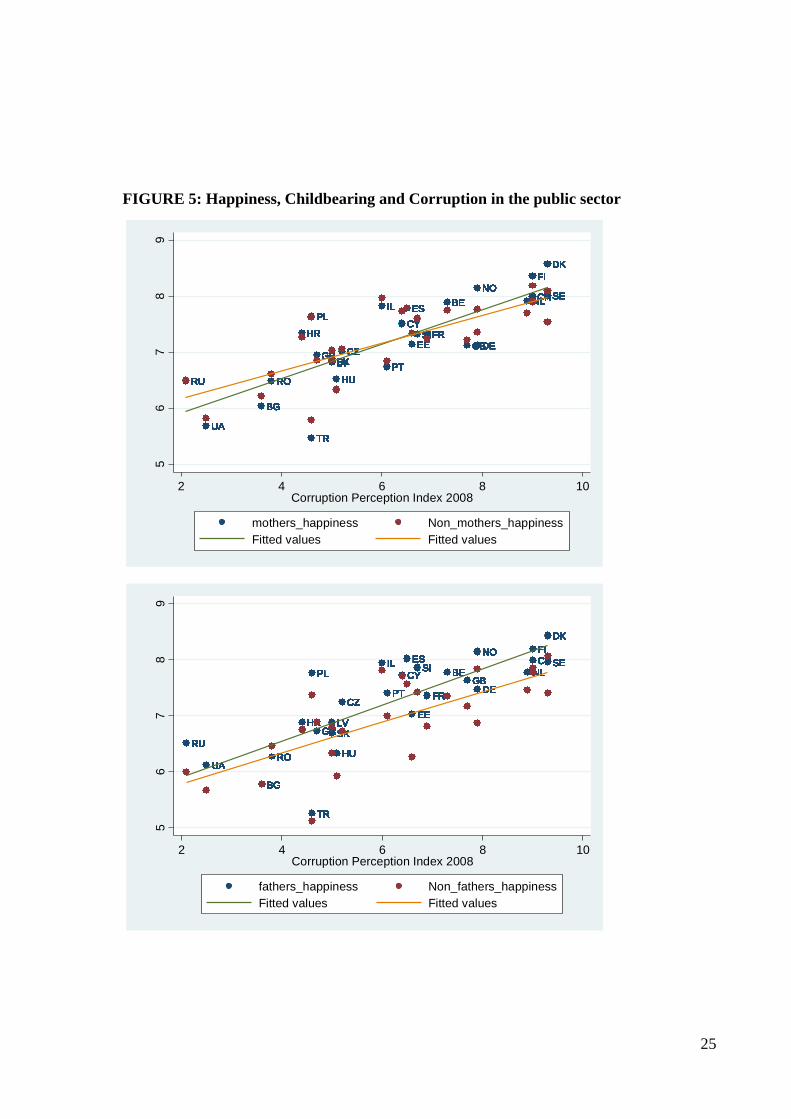
Figure 5 plots the Corruption Perception Index (CPI) against happiness for parents and non-
parents, separately for men and women. When the index is high (indicating a “cleaner” public
sector), average happiness of mothers is higher than that reported by non-mothers, while the
opposite is true when CPI is low. Again, fathers are always happier than non-fathers independent of
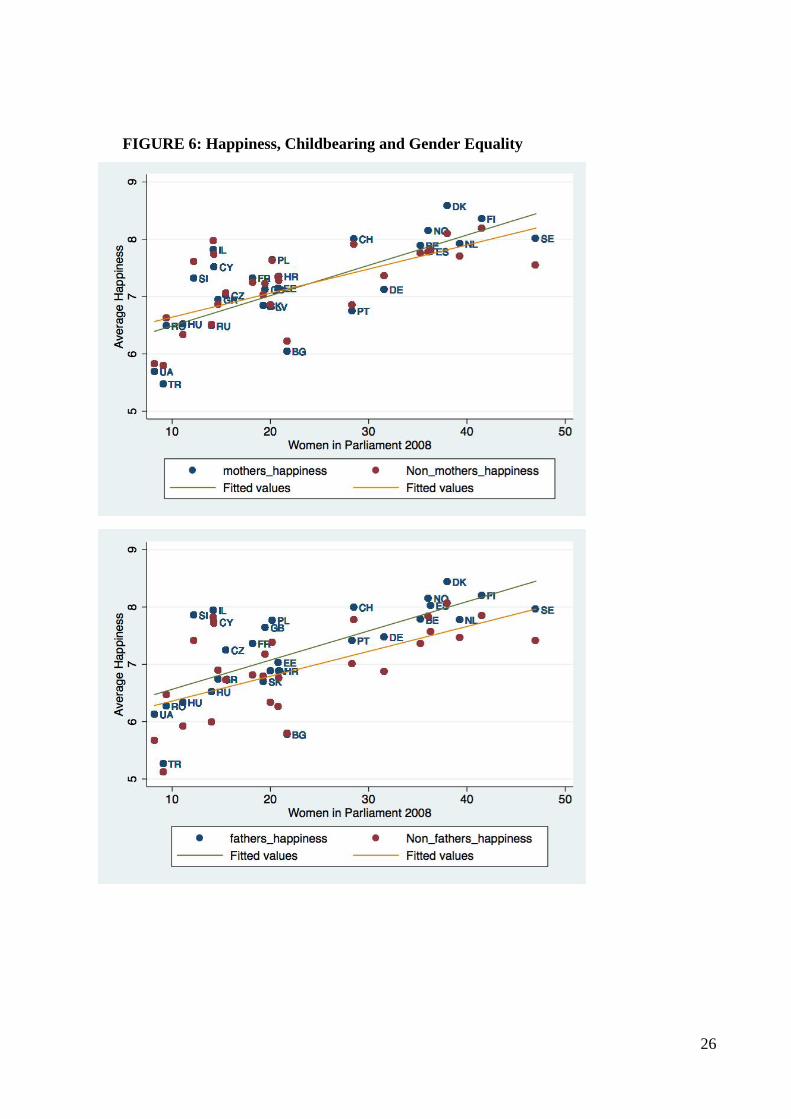
the level of corruption in public institutions. The same holds true when we consider the percentage
of women in the national parliament, as depicted in Figure 6. Again the fitted line for women
crosses, meaning that in countries where a larger number of women take part in the parliament,
mothers tend to be happier than non-mothers, and the opposite being the case when participation of
women in parliaments is low. In the top right corner we find the Scandinavian countries where
fertility is high, whereas in the bottom left corner we find East-European and Mediterranean
countries, where fertility is much lower. The outlier is Turkey, which we find in the bottom left
corner, but where we know fertility is higher than any of the other countries.
Figure 5
Figure 6
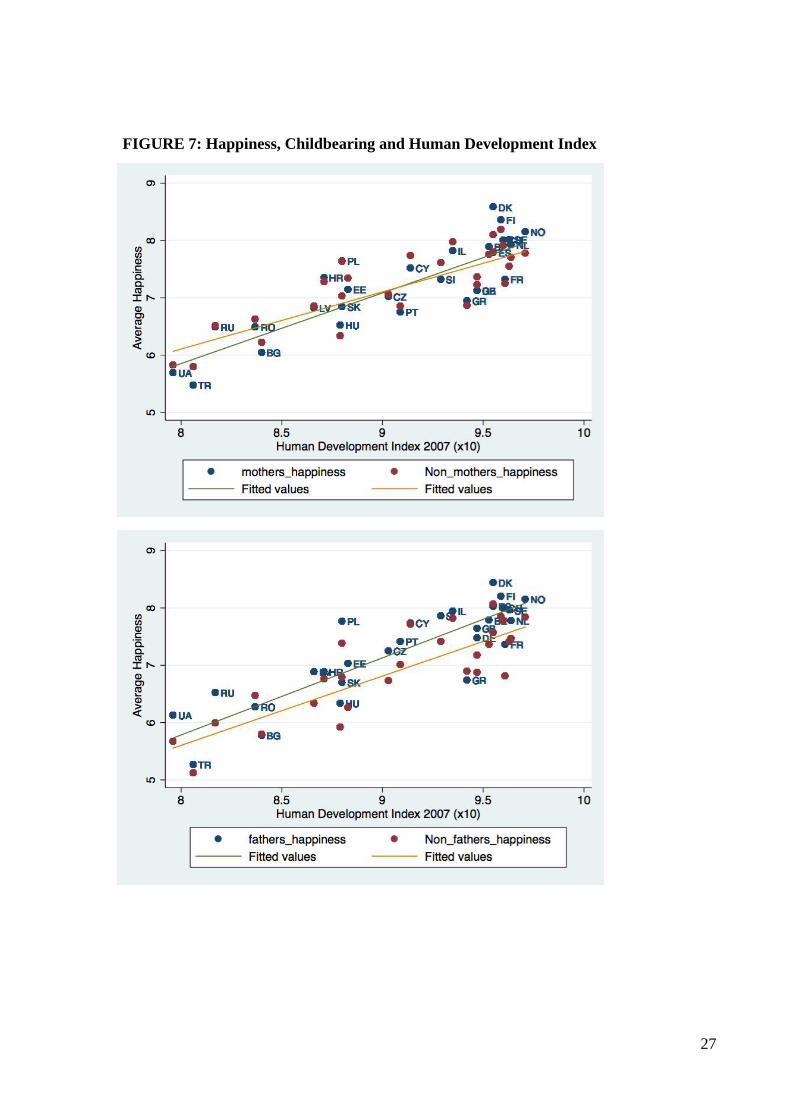
Finally, Figure 7 confirms all the results found so far. Here we plot the average country
happiness against the Human Development Index. This more general indicator of socio-economic
development is the same as the one used by Myrskala et al (2009), where they report the U-shape
relationship between the level of development and fertility, with highly developed countries
showing rebounding trend in fertility (Myrskylä, Kohler and Billari 2011). The plot of average
happiness and the HDI shows that in those countries where socio-economic development is high –
and also fertility levels are high – mothers are happier than non-mothers, while the opposite is true
for low levels of HDI. As before, fathers are happier than non-fathers at any level of development,
16
but as we can see from the diverging fitted lines, the average happiness of fathers is growing more
than that of non-fathers as the HDI increases.
Figure 7
3.2. Multilevel regression analysis
The insights from these descriptive findings are corroborated through a more rigorous
multilevel and multivariate regression analysis where several explanatory variables and country-
level characteristics are controlled for. The model is expressed as follows:
iccciccicicic uXChildrenXXChildrenHappiness 43210
where Happinessic is measured on an ordinal scale ranging from 0 (extremely low level of
happiness) to 10 (extremely high level of happiness) reported by individual i in country c. is
a vector of individual characteristics including age, education, religiosity, employment and
partnership status (see Appendix Table 1). Importantly it also includes the number of children.
Xc represents the country level variables as outlined in the previous section. These macro
variables are not included in the analysis all together, given the high correlation among them. To
avoid collinearity problems, they are instead included in the regressions one by one, whereas
their relative importance is assessed through the intra-class correlation. uc is the country specific
error term, while εic is individual specific. The intra-class correlation coefficient ρ, is defined as:
where Var(uc) is the variance across countries and among individuals in country c.
icX
)()(
)(
0
0
icc
c
VaruVar
uVar
)( icVar
17
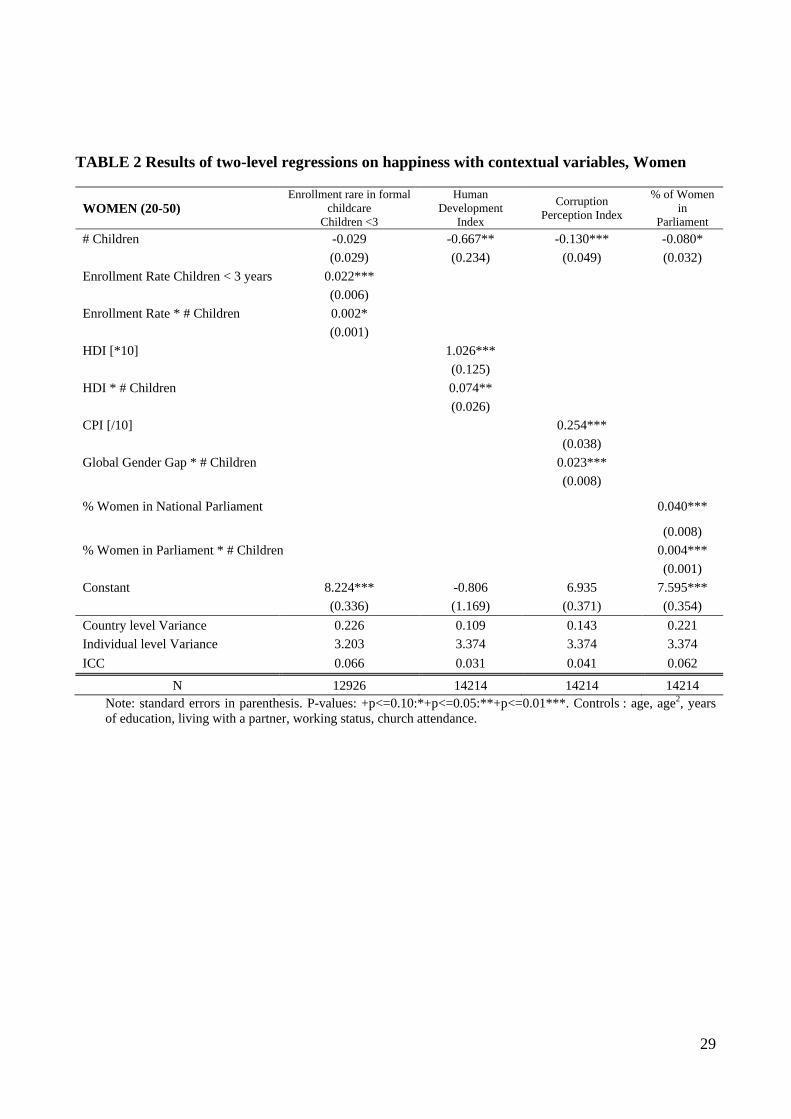
The regression results are reported in Tables 2 and 3, for women and men respectively.
Controlling for country characteristics, we see that the effect of the number of children is either
insignificant or negative, depending on the model specification. However, happiness is increasing
with larger values of the institutional country characteristics. For instance, for the variable
measuring enrolment rate in formal childcare of children below three years of age, the coefficient is
positive and significant. More importantly, the cross-level interaction between the enrolment rate of
children and the number of children is positive and significant for women. This indicates that the
crossing of the two fitted regression lines as shown in Figures 4 to 7 is indeed statistically
significant. Moreover, it is significant for all of the country characteristics included here. Looking at
Table 3, which shows the same regressions for men, the interaction term is not significant or very
close to zero, which means that the fitted regression lines never cross, consistently with the
bivariate analysis conducted previously.
Table 2
Table 3
4. Discussion
The paper has developed a framework for the way subjective wellbeing links with countries’
institutional features and fertility trends. It does so by explaining the role of subjective wellbeing
and childbearing in light of key theoretical ideas of institutional transition moving from the male-
breadwinner model to the egalitarian one. We observe that fertility is high in those countries where
the average happiness is high, the prime example being the Nordic ones. At the other end, we find
East-European countries, where happiness is low but also fertility is low. This feature is crystallised
when we differentiate parents against non-parents in our analysis, but in particular when we do so
for mothers and non-mothers. In societies where institutional development is highly advanced,
18
individuals are not only happier, but it turns out that mothers are significantly happier than non-
mothers, whereas the opposite is the case in those countries where development is low. The fact that
fathers are always happier than non-father – independent of the level of development – suggests
very clearly that the gender perspective matters in critical ways. In essence, it means that in highly
developed countries, happiness associated with childbearing is consistent across gender, whereas it
is not in countries where appropriate institutions are less developed. Our analysis gives therefore
support to McDonald’s hypothesis that low level of fertility is in part generated by the mismatch
between gender equity and gender equality (McDonald 2000), or more generally, as we have argued
here, a mismatch between aspirations and opportunities. Likewise, it gives support to the idea of
Esping-Andersen (2009), where he argues that fertility is lower in the transitional phase because
institutions are not necessarily able to adjust to the new role of women.
Implicit in our analysis lies the presumption that societies are evolving differently (or at
least at different speed) to the new role of women and motherhood. Consequently, diffusion of
appropriate infrastructures also affects the fertility - happiness nexus (Mencarini and Sironi 2012).
It is not the task for this paper to make a detailed assessment of the cultural differences that may
have created the different flavours of the modern welfare states that we see today (and hence
contributing to differences in fertility), but some hints are nevertheless in place. One idea proposed
by Aassve et al (2012) is that an underlying willingness to outsource traditional family activities is a
key driver for the evolution of the welfare state. They put a particular focus on generalized trust,
which differ widely across societies but remains very stable over time, hence resembling a cultural
trait (Mishler and Rose 2001). Moreover, there is evidence to suggest that generalized trust has an
important impact on the willingness to use external childcare (Carl 2014; El-Attas (2013). In other
words, during the male-breadwinner model of the sixties and the seventies, generalized trust may
not have played an important role - since there was little need for outsourcing. But as women
19
entered education in great numbers and their labour force participation increased - together with
their earnings, they needed to put trust in others to take care of their children, which Aassve et al
(2012) argue, spurred the diffusion of childcare and other policies that more broadly ensured gender
equality (also see Bjornskov 2006; 2010).
Another argument is that the willingness to outsource traditional family activities is
necessarily related to pervasive social norms and political pressure - not least the kind exercised by
the church, and here there are clearly distinct historical differences across European countries. The
predominant view of the Catholic Church in Italy for instance, was that society was clearly
secondary to the family, and the role of the state was more than anything to protect the family from
external control, as Ginsborg (1990) so eloquently points out. Given its dominance and influence on
Italian politics, these views became deeply rooted, and the with the onset of the male bread winner
model after the World War II, outsourcing of childcare duties may not have been given much
encouragement, also when women started to enter the sphere of higher education. Whilst the male
breadwinner model was also dominant in Nordic countries at the time, the Church was not in a
position to cement the role of the family in the same way as it did in the Catholic countries. As such
the male breadwinner model of the Nordic countries may have represented a much looser
foundation, and consequently much more open for change once mass education set in.
The latter argument leads to the idea that rather than institutional change being demand
driven from those women gaining higher education, it is instead the underlying structure of the
institutions that holds back outsourcing. A hierarchical society where also institutions follow clear
hierarchical command lines through extensive bureaucracy, will also be more rigid and inept in the
face of structural change. A more horizontal organizational structure, in contrast, might be better
able and quicker in adapting to new sweeping preference structures (Adler 2001; Mintzberg 1979).
Whereas we do not have direct measure of hierarchical structure here, we know that less dynamic
20
societies indeed have higher levels corruption, and also higher levels of generalized trust (Aghion et
al. 2010), and as such our empirical analysis is not inconsistent with such a hypothesis.
From this discussion a final question emerges: will all countries eventually make a transition
to an egalitarian society, and therefore generate a general rebound in fertility, and with it bring
higher subjective wellbeing? According to the analysis of Myrskylä et al. (Myrskylä, Kohler and
Billari 2009) one would be tempted to say yes, since in their analysis fertility appears to rebound as
societies develop further. Importantly, countries leading in development are also converging to
become egalitarian societies, which associated strongly with the upward swing in fertility
(Myrskylä, Kohler and Billari 2011). But according to our analysis, this is not necessarily the case,
or, at least, there is substantial uncertainty about the timing for such convergence to take place. The
reason for this is that the inverse u-shape may not be causally driven by economic development. As
we see from the current analysis, the relationship between happiness and childbearing across
countries might equally be driven institutional factors linked to gender equality and childcare and
social trust. Thus, economic development by its own may not lead to higher fertility unless the gap
between preferences and opportunities for women is closed.
The arguments put forward here open a range of issues. First, we are assuming that if
institutions are in place so as to satisfy individuals’ preferences, then this correlates positively with
individuals’ happiness. Our empirical approach answers this only in an indirect way, and further
analysis with richer data should address the way in which these dimensions could be measured
more directly. Secondly, our arguments give an important role to the structure and evolution of
institutions, a feature that has not been given sufficient attention in demographic analysis. Further
research, concerning the way societies evolve from the male breadwinner model to egalitarian ones,
promises to give rich insight into the way fertility trends will evolve in the future.
APPENDIX
21
TABLE 1 Descriptive statistics of the variables at individual level used in the analysis, by
country
Country Num
Obs Happiness Age Female # Children
Years of
Education Working
Living
with a
partner
Church
Attendance
(at least
once a
month)
Code # Mean St. Dev. Mean % Mean St. Dev Mean % % %
Belgium 873 7.7 1.5 36.0 49.0 1.1 1.2 13.8 76.1 66.3 8.4
Bulgaria 884 6.0 2.5 36.6 57.5 1.0 0.9 11.9 71.9 67.5 15.2
Switzerland 947 7.9 1.5 36.3 54.3 0.7 1.0 11.7 75.7 52.7 15.3
Cyprus 642 7.7 1.4 35.1 51.1 1.1 1.2 13.6 80.5 63.2 36.4
Czech Republic 958 7.0 1.8 35.7 47.6 0.9 1.0 12.9 79.3 62.1 6.7
Germany 1313 7.2 1.9 37.3 47.7 0.8 1.0 14.4 74.6 61.8 14.4
Denmark 720 8.3 1.3 37.1 51.0 1.1 1.1 14.1 83.5 73.6 6.8
Estonia 779 6.9 1.9 35.1 54.4 1.0 1.1 13.4 73.7 65.6 7.6
Spain 1347 7.8 1.5 35.0 52.6 0.8 1.0 12.9 75.7 61.0 14.6
Finland 1032 8.1 1.4 35.7 48.9 1.1 1.2 14.9 76.6 68.0 8.8
France 1004 7.2 1.8 36.1 54.7 1.1 1.2 14.1 77.5 66.3 6.9
UK 1179 7.3 1.9 36.4 56.0 1.0 1.1 14.5 72.4 56.0 15.9
Greece 1200 6.9 1.8 36.0 57.0 0.8 1.0 12.9 73.9 58.0 30.4
Croatia 722 7.1 1.9 34.6 58.7 1.0 1.2 12.9 60.0 55.7 43.9
Hungary 747 6.3 2.3 34.9 53.0 1.0 1.1 13.2 63.5 60.4 13.7
Israel 1166 7.9 1.9 34.0 54.4 1.7 1.9 13.6 67.3 65.4 31.2
Latvia 901 6.7 1.9 35.9 58.0 1.0 1.1 13.4 62.4 65.8 13.2
Netherlands 865 7.7 1.3 37.0 54.7 1.1 1.2 14.5 81.2 65.0 14.8
Norway 804 8.0 1.5 36.3 48.5 1.2 1.2 14.4 85.6 67.7 8.1
Poland 812 7.6 1.8 34.1 52.2 1.1 1.2 13.6 73.3 65.1 68.3
Portugal 898 7.0 1.8 35.9 58.1 0.8 1.0 10.5 74.4 61.4 33.0
Romania 1077 6.5 1.9 34.6 55.4 0.7 0.9 12.4 64.4 63.3 38.9
Russian Fed. 1165 6.4 2.1 34.6 56.0 0.7 0.8 13.4 78.5 58.2 15.5
Sweden 888 7.8 1.6 35.5 47.6 1.1 1.1 14.0 85.2 68.9 8.0
Slovenia 633 7.5 1.7 35.5 52.3 1.0 1.1 12.8 79.0 62.1 23.2
Slovakia 801 6.8 1.9 36.1 53.6 1.1 1.2 13.3 70.2 62.3 35.6
Turkey 1430 5.4 2.7 33.6 54.1 1.2 1.4 7.5 32.7 71.8 41.0
Ukraine 789 5.8 2.3 35.4 58.9 0.9 0.9 12.8 62.6 65.1 29.5
Tables and Figures
22
TFR
Egalitarian
Women's revolution Low High Traditional
SWB A C
Figure 1: Schematic view of institutional transition, fertility and subjective wellbeing.
The case of slow adjusting institutions
Figure 2: Schematic view of institutional transition, fertility and subjective wellbeing.
The case of fast adjusting institutions
TFR
Egalitarian
Women's revolution Low
High
A
B
C
Traditional
SWB
23
Figure 3: Schematic view of institutional transition, fertility and subjective wellbeing.
The case of immutable institutions
TFR
Egalitarian
Women's revolution Low High Traditional
SWB A
B
A
B
24
FIGURE 4: Happiness, Childbearing and Childcare Institutions
25
BEBEBEBEBEBEBEBEBEBEBEBEBEBEBEBEBEBEBEBEBEBEBEBEBEBEBEBEBEBEBEBEBEBEBEBEBEBEBEBEBEBEBEBEBEBEBEBEBEBEBEBEBEBEBEBEBEBEBEBEBEBEBEBEBEBEBEBEBEBEBEBEBEBEBEBEBEBEBEBEBEBEBEBEBEBEBEBEBEBEBEBEBEBEBEBEBEBEBEBEBEBEBEBEBEBEBEBEBEBEBEBEBEBEBEBEBEBEBEBEBEBEBEBEBEBEBEBEBEBEBEBEBEBEBEBEBEBEBEBEBEBEBEBEBEBEBEBEBEBEBEBEBEBEBEBEBEBEBEBEBEBEBEBEBEBEBEBEBEBEBEBEBEBEBEBEBEBEBEBEBEBEBEBEBEBEBEBEBEBEBEBEBEBEBEBEBEBEBEBEBEBEBEBEBEBEBEBEBEBEBEBEBEBEBEBEBEBEBEBEBEBEBEBEBEBEBEBEBEBEBEBE
BGBGBGBGBGBGBGBGBGBGBGBGBGBGBGBGBGBGBGBGBGBGBGBGBGBGBGBGBGBGBGBGBGBGBGBGBGBGBGBGBGBGBGBGBGBGBGBGBGBGBGBGBGBGBGBGBGBGBGBGBGBGBGBGBGBGBGBGBGBGBGBGBGBGBGBGBGBGBGBGBGBGBGBGBGBGBGBGBGBGBGBGBGBGBGBGBGBGBGBGBGBGBGBGBGBGBGBGBGBGBGBGBGBGBGBGBGBGBGBGBGBGBGBGBGBGBGBGBGBGBGBGBGBGBGBGBGBGBGBGBGBGBGBGBGBGBGBGBGBGBGBGBGBGBGBGBGBGBGBGBGBGBGBGBGBGBGBGBGBGBGBGBGBGBGBGBGBGBGBGBGBGBGBGBGBGBGBGBG
CHCHCHCHCHCHCHCHCHCHCHCHCHCHCHCHCHCHCHCHCHCHCHCHCHCHCHCHCHCHCHCHCHCHCHCHCHCHCHCHCHCHCHCHCHCHCHCHCHCHCHCHCHCHCHCHCHCHCHCHCHCHCHCHCHCHCHCHCHCHCHCHCHCHCHCHCHCHCHCHCHCHCHCHCHCHCHCHCHCHCHCHCHCHCHCHCHCHCHCHCHCHCHCHCHCHCHCHCHCHCHCHCHCHCHCHCHCHCHCHCHCHCHCHCHCHCHCHCHCHCHCHCHCHCHCHCHCHCHCHCHCHCHCH
CYCYCYCYCYCYCYCYCYCYCYCYCYCYCYCYCYCYCYCYCYCYCYCYCYCYCYCYCYCYCYCYCYCYCYCYCYCYCYCYCYCYCYCYCYCYCYCYCYCYCYCYCYCYCYCYCYCYCYCYCYCYCYCYCYCYCYCYCYCYCYCYCYCYCYCYCYCYCYCYCYCYCYCYCYCYCYCYCYCYCYCYCYCYCYCYCYCYCYCYCYCYCYCYCYCYCYCYCYCYCYCYCYCYCYCYCYCYCYCYCYCYCYCYCYCYCYCYCYCYCYCYCYCYCYCYCYCYCYCYCYCYCYCYCY
CZCZCZCZCZCZCZCZCZCZCZCZCZCZCZCZCZCZCZCZCZCZCZCZCZCZCZCZCZCZCZCZCZCZCZCZCZCZCZCZCZCZCZCZCZCZCZCZCZCZCZCZCZCZCZCZCZCZCZCZCZCZCZCZCZCZCZCZCZCZCZCZCZCZCZCZCZCZCZCZCZCZCZCZCZCZCZCZCZCZCZCZCZCZCZCZCZCZCZCZCZCZCZCZCZCZCZCZCZCZCZCZCZCZCZCZCZCZCZCZCZCZCZCZCZCZCZCZCZCZCZCZCZCZCZCZCZCZCZCZCZCZCZCZCZCZCZCZCZCZCZCZCZCZCZCZCZCZCZCZCZCZCZCZCZCZCZCZCZCZCZCZCZCZCZCZCZCZCZCZCZCZCZCZCZCZCZCZCZCZCZCZCZCZCZCZCZCZCZCZCZCZCZCZCZCZCZCZCZCZCZCZCZCZCZCZ
DEDEDEDEDEDEDEDEDEDEDEDEDEDEDEDEDEDEDEDEDEDEDEDEDEDEDEDEDEDEDEDEDEDEDEDEDEDEDEDEDEDEDEDEDEDEDEDEDEDEDEDEDEDEDEDEDEDEDEDEDEDEDEDEDEDEDEDEDEDEDEDEDEDEDEDEDEDEDEDEDEDEDEDEDEDEDEDEDEDEDEDEDEDEDEDEDEDEDEDEDEDEDEDEDEDEDEDEDEDEDEDEDEDEDEDEDEDEDEDEDEDEDEDEDEDEDEDEDEDEDEDEDEDEDEDEDEDEDEDEDEDEDEDEDEDEDEDEDEDEDEDEDEDEDEDEDEDEDEDEDEDEDEDEDEDEDEDEDEDEDEDEDEDEDEDEDEDEDEDEDEDEDEDEDEDEDEDEDEDEDEDEDEDEDEDEDEDEDEDEDEDEDEDEDEDEDEDEDEDEDEDEDEDEDEDEDEDEDEDEDEDEDEDEDEDEDEDEDEDEDEDEDEDEDEDEDEDEDEDEDEDEDEDEDEDEDEDEDEDEDEDEDEDEDEDEDEDEDEDEDEDEDEDEDEDEDEDEDEDEDEDEDEDEDEDEDEDEDEDEDEDEDE
DKDKDKDKDKDKDKDKDKDKDKDKDKDKDKDKDKDKDKDKDKDKDKDKDKDKDKDKDKDKDKDKDKDKDKDKDKDKDKDKDKDKDKDKDKDKDKDKDKDKDKDKDKDKDKDKDKDKDKDKDKDKDKDKDKDKDKDKDKDKDKDKDKDKDKDKDKDKDKDKDKDKDKDKDKDKDKDKDKDKDKDKDKDKDKDKDKDKDKDKDKDKDKDKDKDKDKDKDKDKDKDKDKDKDKDKDKDKDKDKDKDKDKDKDKDKDKDKDKDKDKDKDKDKDKDKDKDKDKDKDKDKDKDKDKDKDKDKDKDKDKDKDKDKDKDKDKDKDKDKDKDKDKDKDKDKDKDKDKDKDKDKDKDKDKDKDKDKDKDKDKDK
EEEEEEEEEEEEEEEEEEEEEEEEEEEEEEEEEEEEEEEEEEEEEEEEEEEEEEEEEEEEEEEEEEEEEEEEEEEEEEEEEEEEEEEEEEEEEEEEEEEEEEEEEEEEEEEEEEEEEEEEEEEEEEEEEEEEEEEEEEEEEEEEEEEEEEEEEEEEEEEEEEEEEEEEEEEEEEEEEEEEEEEEEEEEEEEEEEEEEEEEEEEEEEEEEEEEEEEEEEEEEEEEEEEEEEEEEEEEEEEEEEEEEEEEEEEEEEEEEEEEEEEEEEEEEEEEEEEEEEEEEEEEEEEEEEEEEEEEEEEEEEEEEEEEEEEEEEEEEEEEEEEEEEEEEEEEEEEEEEEE
ESESESESESESESESESESESESESESESESESESESESESESESESESESESESESESESESESESESESESESESESESESESESESESESESESESESESESESESESESESESESESESESESESESESESESESESESESESESESESESESESESESESESESESESESESESESESESESESESESESESESESESESESESESESESESESESESESESESESESESESESESESESESESESESESESESESESESESESESESESESESESESESESESESESESESESESESESESESESESESESESESESESESESESESESESESESESESESESESESESESESESESESESESESESESESESESESESESESESESESESESESESESESESESESESESESESESESESESESESESESESESESESESESESESESESESESESESESESESESESESESESESESESESESESESESESESESESESESESESESESESESESESESESESESESESESESESESESESESESESESESFIFIFIFIFIFIFIFIFIFIFIFIFIFIFIFIFIFIFIFIFIFIFIFIFIFIFIFIFIFIFIFIFIFIFIFIFIFIFIFIFIFIFIFIFIFIFIFIFIFIFIFIFIFIFIFIFIFIFIFIFIFIFIFIFIFIFIFIFIFIFIFIFIFIFIFIFIFIFIFIFIFIFIFIFIFIFIFIFIFIFIFIFIFIFIFIFIFIFIFIFIFIFIFIFIFIFIFIFIFIFIFIFIFIFIFIFIFIFIFIFIFIFIFIFIFIFIFIFIFIFIFIFIFIFIFIFIFIFIFIFIFIFIFIFIFIFIFIFIFIFIFIFIFIFIFIFIFIFIFIFIFIFIFIFIFIFIFIFIFIFIFIFIFIFIFIFIFIFIFIFIFIFIFIFIFIFIFIFIFIFIFIFIFIFIFIFIFIFIFIFIFIFIFIFIFIFIFIFIFIFIFIFIFIFIFIFIFIFIFIFIFIFIFIFIFIFIFIFIFIFIFIFIFIFIFI
FRFRFRFRFRFRFRFRFRFRFRFRFRFRFRFRFRFRFRFRFRFRFRFRFRFRFRFRFRFRFRFRFRFRFRFRFRFRFRFRFRFRFRFRFRFRFRFRFRFRFRFRFRFRFRFRFRFRFRFRFRFRFRFRFRFRFRFRFRFRFRFRFRFRFRFRFRFRFRFRFRFRFRFRFRFRFRFRFRFRFRFRFRFRFRFRFRFRFRFRFRFRFRFRFRFRFRFRFRFRFRFRFRFRFRFRFRFRFRFRFRFRFRFRFRFRFRFRFRFRFRFRFRFRFRFRFRFRFRFRFRFRFRFRFRFRFRFRFRFRFRFRFRFRFRFRFRFRFRFRFRFRFRFRFRFRFRFRFRFRFRFRFRFRFRFRFRFRFRFRFRFRFRFRFRFRFRFRFRFRFRFRFRFRFRFRFRFRFRFRFRFRFRFRFRFRFRFRFRFRFRFRFRFRFRFRFRFRFRFRFRFRFRFRFRFRFRFRFRFRFRFRFRFRFRFRFRFRFRFRFRFRFRFRFRFRFRFRFRFRFRFRFR
GBGBGBGBGBGBGBGBGBGBGBGBGBGBGBGBGBGBGBGBGBGBGBGBGBGBGBGBGBGBGBGBGBGBGBGBGBGBGBGBGBGBGBGBGBGBGBGBGBGBGBGBGBGBGBGBGBGBGBGBGBGBGBGBGBGBGBGBGBGBGBGBGBGBGBGBGBGBGBGBGBGBGBGBGBGBGBGBGBGBGBGBGBGBGBGBGBGBGBGBGBGBGBGBGBGBGBGBGBGBGBGBGBGBGBGBGBGBGBGBGBGBGBGBGBGBGBGBGBGBGBGBGBGBGBGBGBGBGBGBGBGBGBGBGBGBGBGBGBGBGBGBGBGBGBGBGBGBGBGBGBGBGBGBGBGBGBGBGBGBGBGBGBGBGBGBGBGBGBGBGBGBGBGBGBGBGBGBGBGBGBGBGBGBGBGBGBGBGBGBGBGBGBGBGBGBGBGBGBGBGBGBGBGBGBGB
GRGRGRGRGRGRGRGRGRGRGRGRGRGRGRGRGRGRGRGRGRGRGRGRGRGRGRGRGRGRGRGRGRGRGRGRGRGRGRGRGRGRGRGRGRGRGRGRGRGRGRGRGRGRGRGRGRGRGRGRGRGRGRGRGRGRGRGRGRGRGRGRGRGRGRGRGRGRGRGRGRGRGRGRGRGRGRGRGRGRGRGRGRGRGRGRGRGRGRGRGRGRGRGRGRGRGRGRGRGRGRGRGRGRGRGRGRGRGRGRGRGRGRGRGRGRGRGRGRGRGRGRGRGRGRGRGRGRGRGRGRGRGRGRGRGRGRGRGRGRGRGRGRGRGRGRGRGRGRGRGRGRGRGRGRGRGRGRGRGRGRGRGRGRGRGRGRGRGRGRGRGRGRGRGRGRGRGRGRGRGRHRHRHRHRHRHRHRHRHRHRHRHRHRHRHRHRHRHRHRHRHRHRHRHRHRHRHRHRHRHRHRHRHRHRHRHRHRHRHRHRHRHRHRHRHRHRHRHRHRHRHRHRHRHRHRHRHRHRHRHRHRHRHRHRHRHRHRHRHRHRHRHRHRHRHRHRHRHRHRHRHRHRHRHRHRHRHRHRHRHRHRHRHRHRHRHRHRHRHRHRHRHRHRHRHRHRHRHRHRHRHRHRHRHRHRHRHRHRHRHRHRHRHRHRHRHRHRHRHR
HUHUHUHUHUHUHUHUHUHUHUHUHUHUHUHUHUHUHUHUHUHUHUHUHUHUHUHUHUHUHUHUHUHUHUHUHUHUHUHUHUHUHUHUHUHUHUHUHUHUHUHUHUHUHUHUHUHUHUHUHUHUHUHUHUHUHUHUHUHUHUHUHUHUHUHUHUHUHUHUHUHUHUHUHUHUHUHUHUHUHUHUHUHUHUHUHUHUHUHUHUHUHUHUHUHUHUHUHUHUHUHUHUHUHUHUHUHUHUHUHUHUHUHUHUHUHUHUHUHUHUHUHUHUHUHUHUHUHUHUHUHUHUHUHUHUHUHUHUHUHUHUHUHUHUHUHUHUHUHUHU
ILILILILILILILILILILILILILILILILILILILILILILILILILILILILILILILILILILILILILILILILILILILILILILILILILILILILILILILILILILILILILILILILILILILILILILILILILILILILILILILILILILILILILILILILILILILILILILILILILILILILILILILILILILILILILILILILILILILILILILILILILILILILILILILILILILILILILILILILILILILILILILILILILILILILILILILILILILILILILILILILILILILILILILILILILILILILILILILILILILILILILILILILILILILILILILILILILILILILILILILILILILILILILILILILILILILILILILILILILILILILILILILILILILILILILILILILILILILILILILILILILILILILILILILILILILILILILILILILILILILILILILILILILILILILILILILIL
LVLVLVLVLVLVLVLVLVLVLVLVLVLVLVLVLVLVLVLVLVLVLVLVLVLVLVLVLVLVLVLVLVLVLVLVLVLVLVLVLVLVLVLVLVLVLVLVLVLVLVLVLVLVLVLVLVLVLVLVLVLVLVLVLVLVLVLVLVLVLVLVLVLVLVLVLVLVLVLVLVLVLVLVLVLVLVLVLVLVLVLVLVLVLVLVLVLVLVLVLVLVLVLVLVLVLVLVLVLVLVLVLVLVLVLVLVLVLVLVLVLVLVLVLVLVLVLVLVLVLVLVLVLVLVLVLVLVLVLVLVLVLVLVLVLVLVLVLVLVLVLVLVLVLVLVLVLVLVLVLVLVLVLVLVLVLVLVLVLVLVLVLVLVLVLVLVLVLVLVLV
NLNLNLNLNLNLNLNLNLNLNLNLNLNLNLNLNLNLNLNLNLNLNLNLNLNLNLNLNLNLNLNLNLNLNLNLNLNLNLNLNLNLNLNLNLNLNLNLNLNLNLNLNLNLNLNLNLNLNLNLNLNLNLNLNLNLNLNLNLNLNLNLNLNLNLNLNLNLNLNLNLNLNLNLNLNLNLNLNLNLNLNLNLNLNLNLNLNLNLNLNLNLNLNLNLNLNLNLNLNLNLNLNLNLNLNLNLNLNLNLNLNLNLNLNLNLNLNLNLNLNLNLNLNLNLNLNLNLNLNLNLNLNLNLNLNLNLNLNLNLNLNLNLNLNLNLNLNLNLNLNLNLNLNLNLNLNLNLNLNLNLNLNLNLNLNLNL
NONONONONONONONONONONONONONONONONONONONONONONONONONONONONONONONONONONONONONONONONONONONONONONONONONONONONONONONONONONONONONONONONONONONONONONONONONONONONONONONONONONONONONONONONONONONONONONONONONONONONONONONONONONONONONONONONONONONONONONONONONONONONONONONONONONONONONONONONONONONONONONONONONONONONONONONONONONONONONONONONONONONONONONONONONONONONONONONONONONONONONONONONONONONONONONONONONONONONONONONONONONONONONONONONONONO
PLPLPLPLPLPLPLPLPLPLPLPLPLPLPLPLPLPLPLPLPLPLPLPLPLPLPLPLPLPLPLPLPLPLPLPLPLPLPLPLPLPLPLPLPLPLPLPLPLPLPLPLPLPLPLPLPLPLPLPLPLPLPLPLPLPLPLPLPLPLPLPLPLPLPLPLPLPLPLPLPLPLPLPLPLPLPLPLPLPLPLPLPLPLPLPLPLPLPLPLPLPLPLPLPLPLPLPLPLPLPLPLPLPLPLPLPLPLPLPLPLPLPLPLPLPLPLPLPLPLPLPLPLPLPLPLPLPLPLPLPLPLPLPLPLPLPLPLPLPLPLPLPLPLPLPLPLPLPLPLPLPLPLPLPLPLPLPLPLPLPLPLPLPLPLPLPLPLPLPLPLPLPLPLPLPLPLPLPLPLPLPLPLPLPLPLPLPLPLPLPL
PTPTPTPTPTPTPTPTPTPTPTPTPTPTPTPTPTPTPTPTPTPTPTPTPTPTPTPTPTPTPTPTPTPTPTPTPTPTPTPTPTPTPTPTPTPTPTPTPTPTPTPTPTPTPTPTPTPTPTPTPTPTPTPTPTPTPTPTPTPTPTPTPTPTPTPTPTPTPTPTPTPTPTPTPTPTPTPTPTPTPTPTPTPTPTPTPTPTPTPTPTPTPTPTPTPTPTPTPTPTPTPTPTPTPTPTPTPTPTPTPTPTPTPTPTPTPTPTPTPTPTPTPTPTPTPTPTPTPTPTPTPTPTPTPTPTPTPTPTPTPTPTPTPTPTPTPTPT
RORORORORORORORORORORORORORORORORORORORORORORORORORORORORORORORORORORORORORORORORORORORORORORORORORORORORORORORORORORORORORORORORORORORORORORORORORORORORORORORORORORORORORORORORORORORORORORORORORORORORORORORORORORORORORORORORORORORORORORORORORORORORORORORORORORORORORORORORORORORORORORORORORORORORORORORORORORORORORORORORORORORORORORORORORORORORORORORORORORORORORORORORORORORORORORORORORORORORO
RURURURURURURURURURURURURURURURURURURURURURURURURURURURURURURURURURURURURURURURURURURURURURURURURURURURURURURURURURURURURURURURURURURURURURURURURURURURURURURURURURURURURURURURURURURURURURURURURURURURURURURURURURURURURURURURURURURURURURURURURURURURURURURURURURURURURURURURURURURURURURURURURURURURURURURURURURURURURURURURURURURURURURURURURURURURURURURURURURURURURURURURURURURURURURURURURURURURURURURURURURURURURURURURURURURURURURURURURURURURURURURURURU
SESESESESESESESESESESESESESESESESESESESESESESESESESESESESESESESESESESESESESESESESESESESESESESESESESESESESESESESESESESESESESESESESESESESESESESESESESESESESESESESESESESESESESESESESESESESESESESESESESESESESESESESESESESESESESESESESESESESESESESESESESESESESESESESESESESESESESESESESESESESESESESESESESESESESESESESESESESESESESESESESESESESESESESESESESESESESESESESESESESESESESESESESESESESESESESESESESESESESESESESESESESESESESESESESESESESESESESESESESESESESESESESESESESESESESESESESESESESESESESESESESESESESESESESESESESESESISISISISISISISISISISISISISISISISISISISISISISISISISISISISISISISISISISISISISISISISISISISISISISISISISISISISISISISISISISISISISISISISISISISISISISISISISISISISISISISISISISISISISISISISISISISISISISISISISISISISISISISISISISISISISISISISISISISISISISISISISISISISISISISISISISISISISISISISISISISISISISISISI
SKSKSKSKSKSKSKSKSKSKSKSKSKSKSKSKSKSKSKSKSKSKSKSKSKSKSKSKSKSKSKSKSKSKSKSKSKSKSKSKSKSKSKSKSKSKSKSKSKSKSKSKSKSKSKSKSKSKSKSKSKSKSKSKSKSKSKSKSKSKSKSKSKSKSKSKSKSKSKSKSKSKSKSKSKSKSKSKSKSKSKSKSKSKSKSKSKSKSKSKSKSKSKSKSKSKSKSKSKSKSKSKSKSKSKSKSKSKSKSKSKSKSKSKSKSKSKSKSKSKSKSKSKSKSKSKSKSKSKSKSKSKSKSKSKSKSKSKSKSKSKSKSKSKSKSKSKSKSKSKSKSKSKSKSKSKSKSKSKSKSKSKSKSKSKSKSKSKSKSKSKSKSKSKSK
TRTRTRTRTRTRTRTRTRTRTRTRTRTRTRTRTRTRTRTRTRTRTRTRTRTRTRTRTRTRTRTRTRTRTRTRTRTRTRTRTRTRTRTRTRTRTRTRTRTRTRTRTRTRTRTRTRTRTRTRTRTRTRTRTRTRTRTRTRTRTRTRTRTRTRTRTRTRTRTRTRTRTRTRTRTRTRTRTRTRTRTRTRTRTRTRTRTRTRTRTRTRTRTRTRTRTRTRTRTRTRTRTRTRTRTRTRTRTRTRTRTRTRTRTRTRTRTRTRTRTRTRTRTRTRTRTRTRTRTRTRTRTRTRTRTRTRTRTRTRTRTRTRTRTRTRTRTRTRTRTRTRTRTRTRTRTRTRTRTRTRTRTRTRTRTRTRTRTRTRTRTRTRTRTRTRTRTRTRTRTRTRTRTRTRTRTRTRTRTRTRTRTRTRTRTRTRTRTRTRTRTRTRTRTRTRTRTRTRTRTRTRTRTRTRTRTRTRTRTRTRTRTRTRTRTRTRTRTRTRTRTRTRTRTRTRTRTRTRTRTRTRTRTRTRTRTRTRTRTRTRTRTRTRTRTRTRTRTRTRTRTRTRTRTRTRTRTRTRTRTRTRTRTRTRTRTRTRTRTRTRTRTRTRTRTRTRTRTRTRTRTRTRTRTRTRTRTRTRTRTRTRTRTRTRTRTRTRTRTRTRTRTRTRTRTRTRTRTRTRTRTRTRTRTRTRTRTRTRTRTRTR
UAUAUAUAUAUAUAUAUAUAUAUAUAUAUAUAUAUAUAUAUAUAUAUAUAUAUAUAUAUAUAUAUAUAUAUAUAUAUAUAUAUAUAUAUAUAUAUAUAUAUAUAUAUAUAUAUAUAUAUAUAUAUAUAUAUAUAUAUAUAUAUAUAUAUAUAUAUAUAUAUAUAUAUAUAUAUAUAUAUAUAUAUAUAUAUAUAUAUAUAUAUAUAUAUAUAUAUAUAUAUAUAUAUAUAUAUAUAUAUAUAUAUAUAUAUAUAUAUAUAUAUAUAUAUAUAUAUAUAUAUAUAUAUAUAUAUAUAUAUAUAUAUAUAUAUAUAUAUAUAUAUAUAUAUAUAUA
56
78
9
Avera
ge
Hap
pin
ess
2 4 6 8 10Corruption Perception Index 2008
fathers_happiness Non_fathers_happiness
Fitted values Fitted values
BEBEBEBEBEBEBEBEBEBEBEBEBEBEBEBEBEBEBEBEBEBEBEBEBEBEBEBEBEBEBEBEBEBEBEBEBEBEBEBEBEBEBEBEBEBEBEBEBEBEBEBEBEBEBEBEBEBEBEBEBEBEBEBEBEBEBEBEBEBEBEBEBEBEBEBEBEBEBEBEBEBEBEBEBEBEBEBEBEBEBEBEBEBEBEBEBEBEBEBEBEBEBEBEBEBEBEBEBEBEBEBEBEBEBEBEBEBEBEBEBEBEBEBEBEBEBEBEBEBEBEBEBEBEBEBEBEBEBEBEBEBEBEBEBEBEBEBEBEBEBEBEBEBEBEBEBEBEBEBEBEBEBEBEBEBEBEBEBEBEBEBEBEBEBEBEBEBEBEBEBEBEBEBEBEBEBEBEBEBEBEBEBEBEBEBEBEBEBEBEBEBEBEBEBEBEBEBEBEBEBEBEBEBEBEBEBEBEBEBEBEBEBEBEBEBEBEBEBEBEBEBEBEBEBEBEBEBEBEBEBEBEBEBEBEBEBEBEBEBEBEBE
BGBGBGBGBGBGBGBGBGBGBGBGBGBGBGBGBGBGBGBGBGBGBGBGBGBGBGBGBGBGBGBGBGBGBGBGBGBGBGBGBGBGBGBGBGBGBGBGBGBGBGBGBGBGBGBGBGBGBGBGBGBGBGBGBGBGBGBGBGBGBGBGBGBGBGBGBGBGBGBGBGBGBGBGBGBGBGBGBGBGBGBGBGBGBGBGBGBGBGBGBGBGBGBGBGBGBGBGBGBGBGBGBGBGBGBGBGBGBGBGBGBGBGBGBGBGBGBGBGBGBGBGBGBGBGBGBGBGBGBGBGBGBGBGBGBGBGBGBGBGBGBGBGBGBGBGBGBGBGBGBGBGBGBGBGBGBGBGBGBGBGBGBGBGBGBGBGBGBGBGBGBGBGBGBGBGBGBGBGBGBGBGBGBGBGBGBGBGBGBGBGBGBGBGBGBGBGBGBGBGBGBGBGBGBGBGBGBGBGBGBGBGBGBGBGBGBGBGBGBGBGBGBGBGBGBGBGBGBGBGBGBGBGBGBGBGBGBGBGBGBGBGBGBGBGBGBGBGBGBGBGBGBGBGBGBGBGBGBGBGBGBGBGBGBGBGBGBGBGBGBGBGBGBGBGBGBGBGBGBGBGBGBGBGBGBGBGBGBGBGBGBGBGBGBGBGBGBGBGBGBGBGBGBGBGBGBGBGBGBGBGBGBGBGBGBGBGBGBGBGBGBGBGBGBGBGBGBGBGBG
CHCHCHCHCHCHCHCHCHCHCHCHCHCHCHCHCHCHCHCHCHCHCHCHCHCHCHCHCHCHCHCHCHCHCHCHCHCHCHCHCHCHCHCHCHCHCHCHCHCHCHCHCHCHCHCHCHCHCHCHCHCHCHCHCHCHCHCHCHCHCHCHCHCHCHCHCHCHCHCHCHCHCHCHCHCHCHCHCHCHCHCHCHCHCHCHCHCHCHCHCHCHCHCHCHCHCHCHCHCHCHCHCHCHCHCHCHCHCHCHCHCHCHCHCHCHCHCHCHCHCHCHCHCHCHCHCHCHCHCHCHCHCHCHCHCHCHCHCHCHCHCHCHCHCHCHCHCHCHCHCHCHCHCHCHCHCHCHCHCHCHCHCHCHCHCHCHCHCHCHCHCHCHCHCHCHCHCHCHCHCHCHCHCHCHCHCHCHCHCHCHCHCHCHCHCHCHCHCHCHCHCHCHCHCHCHCHCHCHCHCH
CYCYCYCYCYCYCYCYCYCYCYCYCYCYCYCYCYCYCYCYCYCYCYCYCYCYCYCYCYCYCYCYCYCYCYCYCYCYCYCYCYCYCYCYCYCYCYCYCYCYCYCYCYCYCYCYCYCYCYCYCYCYCYCYCYCYCYCYCYCYCYCYCYCYCYCYCYCYCYCYCYCYCYCYCYCYCYCYCYCYCYCYCYCYCYCYCYCYCYCYCYCYCYCYCYCYCYCYCYCYCYCYCYCYCYCYCYCYCYCYCYCYCYCYCYCYCYCYCYCYCYCYCYCYCYCYCYCYCYCYCYCYCYCYCYCYCYCYCYCYCYCYCYCYCYCYCYCYCYCYCYCYCYCYCYCYCYCYCYCYCYCYCYCYCYCYCYCYCYCYCYCYCYCYCYCYCYCYCYCYCYCYCYCYCYCYCY
CZCZCZCZCZCZCZCZCZCZCZCZCZCZCZCZCZCZCZCZCZCZCZCZCZCZCZCZCZCZCZCZCZCZCZCZCZCZCZCZCZCZCZCZCZCZCZCZCZCZCZCZCZCZCZCZCZCZCZCZCZCZCZCZCZCZCZCZCZCZCZCZCZCZCZCZCZCZCZCZCZCZCZCZCZCZCZCZCZCZCZCZCZCZCZCZCZCZCZCZCZCZCZCZCZCZCZCZCZCZCZCZCZCZCZCZCZCZCZCZCZCZCZCZCZCZCZCZCZCZCZCZCZCZCZCZCZCZCZCZCZCZCZCZCZCZCZCZCZCZCZCZCZCZCZCZCZCZCZCZCZCZCZCZCZCZCZCZCZCZCZCZCZCZCZCZCZCZCZCZCZCZCZCZCZCZCZCZCZCZCZCZCZCZCZCZCZCZCZCZCZCZCZCZCZCZCZCZCZCZCZCZCZCZCZCZCZCZCZCZCZCZCZCZCZCZCZCZCZCZCZCZCZCZCZCZCZCZCZCZCZCZCZCZCZCZCZCZCZCZCZCZCZCZCZCZCZCZCZCZCZCZCZCZCZCZCZCZCZCZCZCZCZCZCZCZCZCZCZCZCZCZCZCZCZCZCZCZCZCZCZCZCZCZDEDEDEDEDEDEDEDEDEDEDEDEDEDEDEDEDEDEDEDEDEDEDEDEDEDEDEDEDEDEDEDEDEDEDEDEDEDEDEDEDEDEDEDEDEDEDEDEDEDEDEDEDEDEDEDEDEDEDEDEDEDEDEDEDEDEDEDEDEDEDEDEDEDEDEDEDEDEDEDEDEDEDEDEDEDEDEDEDEDEDEDEDEDEDEDEDEDEDEDEDEDEDEDEDEDEDEDEDEDEDEDEDEDEDEDEDEDEDEDEDEDEDEDEDEDEDEDEDEDEDEDEDEDEDEDEDEDEDEDEDEDEDEDEDEDEDEDEDEDEDEDEDEDEDEDEDEDEDEDEDEDEDEDEDEDEDEDEDEDEDEDEDEDEDEDEDEDEDEDEDEDEDEDEDEDEDEDEDEDEDEDEDEDEDEDEDEDEDEDEDEDEDEDEDEDEDEDEDEDEDEDEDEDEDEDEDEDEDEDEDEDEDEDEDEDEDEDEDEDEDEDEDEDEDEDEDEDEDEDEDEDEDEDEDEDEDEDEDEDEDEDEDEDEDEDEDEDEDEDEDEDEDEDEDEDEDEDEDEDEDEDEDEDEDEDEDEDEDEDEDEDEDEDEDEDEDEDEDEDEDEDEDEDEDEDEDEDEDEDEDEDEDEDEDEDEDEDEDEDEDEDEDEDEDEDEDEDEDEDEDEDEDEDEDEDEDEDEDEDEDEDEDEDEDEDEDEDEDEDEDEDEDEDEDEDEDEDEDEDEDEDEDEDEDEDEDEDEDEDEDEDEDEDEDEDEDEDEDE
DKDKDKDKDKDKDKDKDKDKDKDKDKDKDKDKDKDKDKDKDKDKDKDKDKDKDKDKDKDKDKDKDKDKDKDKDKDKDKDKDKDKDKDKDKDKDKDKDKDKDKDKDKDKDKDKDKDKDKDKDKDKDKDKDKDKDKDKDKDKDKDKDKDKDKDKDKDKDKDKDKDKDKDKDKDKDKDKDKDKDKDKDKDKDKDKDKDKDKDKDKDKDKDKDKDKDKDKDKDKDKDKDKDKDKDKDKDKDKDKDKDKDKDKDKDKDKDKDKDKDKDKDKDKDKDKDKDKDKDKDKDKDKDKDKDKDKDKDKDKDKDKDKDKDKDKDKDKDKDKDKDKDKDKDKDKDKDKDKDKDKDKDKDKDKDKDKDKDKDKDKDKDKDKDKDKDKDKDKDKDKDKDKDKDKDKDKDKDKDKDKDKDKDKDKDKDKDKDKDKDKDKDKDKDKDKDKDKDKDKDKDKDKDKDKDKDKDKDKDKDKDKDKDKDKDKDKDKDKDKDKDKDKDKDKDKDKDKDKDKDKDKDKDKDKDKDKDKDK
EEEEEEEEEEEEEEEEEEEEEEEEEEEEEEEEEEEEEEEEEEEEEEEEEEEEEEEEEEEEEEEEEEEEEEEEEEEEEEEEEEEEEEEEEEEEEEEEEEEEEEEEEEEEEEEEEEEEEEEEEEEEEEEEEEEEEEEEEEEEEEEEEEEEEEEEEEEEEEEEEEEEEEEEEEEEEEEEEEEEEEEEEEEEEEEEEEEEEEEEEEEEEEEEEEEEEEEEEEEEEEEEEEEEEEEEEEEEEEEEEEEEEEEEEEEEEEEEEEEEEEEEEEEEEEEEEEEEEEEEEEEEEEEEEEEEEEEEEEEEEEEEEEEEEEEEEEEEEEEEEEEEEEEEEEEEEEEEEEEEEEEEEEEEEEEEEEEEEEEEEEEEEEEEEEEEEEEEEEEEEEEEEEEEEEEEEEEEEEEEEEEEEEEEEEEEEEEEEEEEEEEEEEEEEEEEEEEEEEEEEEEEEEEEEEEEEEEEEEEEEEEEEEEEEEEEEEEEEEEEEEEEEEEEEEEEEEEEEEEEEEEEEEEEEEEEEEEEEEEEEEEEEEEEEEEEEEEEEEEEEEEEEEEEEE
ESESESESESESESESESESESESESESESESESESESESESESESESESESESESESESESESESESESESESESESESESESESESESESESESESESESESESESESESESESESESESESESESESESESESESESESESESESESESESESESESESESESESESESESESESESESESESESESESESESESESESESESESESESESESESESESESESESESESESESESESESESESESESESESESESESESESESESESESESESESESESESESESESESESESESESESESESESESESESESESESESESESESESESESESESESESESESESESESESESESESESESESESESESESESESESESESESESESESESESESESESESESESESESESESESESESESESESESESESESESESESESESESESESESESESESESESESESESESESESESESESESESESESESESESESESESESESESESESESESESESESESESESESESESESESESESESESESESESESESESESESESESESESESESESESESESESESESESESESESESESESESESESESESESESESESESESESESESESESESESESESESESESESESESESESESESESESESESESESESESESESESESESESESESESESESESESESESESESESESESESESESESESESESESESESESESESESESESESESESESESESESESESESESESESESESESESESES
FIFIFIFIFIFIFIFIFIFIFIFIFIFIFIFIFIFIFIFIFIFIFIFIFIFIFIFIFIFIFIFIFIFIFIFIFIFIFIFIFIFIFIFIFIFIFIFIFIFIFIFIFIFIFIFIFIFIFIFIFIFIFIFIFIFIFIFIFIFIFIFIFIFIFIFIFIFIFIFIFIFIFIFIFIFIFIFIFIFIFIFIFIFIFIFIFIFIFIFIFIFIFIFIFIFIFIFIFIFIFIFIFIFIFIFIFIFIFIFIFIFIFIFIFIFIFIFIFIFIFIFIFIFIFIFIFIFIFIFIFIFIFIFIFIFIFIFIFIFIFIFIFIFIFIFIFIFIFIFIFIFIFIFIFIFIFIFIFIFIFIFIFIFIFIFIFIFIFIFIFIFIFIFIFIFIFIFIFIFIFIFIFIFIFIFIFIFIFIFIFIFIFIFIFIFIFIFIFIFIFIFIFIFIFIFIFIFIFIFIFIFIFIFIFIFIFIFIFIFIFIFIFIFIFIFIFIFIFIFIFIFIFIFIFIFIFIFIFIFIFIFIFIFIFIFIFIFIFIFIFIFIFIFIFIFIFIFIFIFIFIFIFIFIFIFIFIFIFIFIFIFIFIFIFIFIFIFIFIFIFIFIFIFIFIFIFIFIFIFIFIFIFIFIFIFIFIFIFIFIFI
FRFRFRFRFRFRFRFRFRFRFRFRFRFRFRFRFRFRFRFRFRFRFRFRFRFRFRFRFRFRFRFRFRFRFRFRFRFRFRFRFRFRFRFRFRFRFRFRFRFRFRFRFRFRFRFRFRFRFRFRFRFRFRFRFRFRFRFRFRFRFRFRFRFRFRFRFRFRFRFRFRFRFRFRFRFRFRFRFRFRFRFRFRFRFRFRFRFRFRFRFRFRFRFRFRFRFRFRFRFRFRFRFRFRFRFRFRFRFRFRFRFRFRFRFRFRFRFRFRFRFRFRFRFRFRFRFRFRFRFRFRFRFRFRFRFRFRFRFRFRFRFRFRFRFRFRFRFRFRFRFRFRFRFRFRFRFRFRFRFRFRFRFRFRFRFRFRFRFRFRFRFRFRFRFRFRFRFRFRFRFRFRFRFRFRFRFRFRFRFRFRFRFRFRFRFRFRFRFRFRFRFRFRFRFRFRFRFRFRFRFRFRFRFRFRFRFRFRFRFRFRFRFRFRFRFRFRFRFRFRFRFRFRFRFRFRFRFRFRFRFRFRFRFRFRFRFRFRFRFRFRFRFRFRFRFRFRFRFRFRFRFRFRFRFRFRFRFRFRFRFRFRFRFRFRFRFRFRFRFRFRFRFRFRFRFRFRFRFRFRFRFRFRFRFRFRFRFRFRFRFRFRFRFRFRFRFRFRFRFRFRFRFRFRFRFRFRFRFRFRFRFRFRFRFRFRFRFRFRFRFRFRFRFRFRFR
GBGBGBGBGBGBGBGBGBGBGBGBGBGBGBGBGBGBGBGBGBGBGBGBGBGBGBGBGBGBGBGBGBGBGBGBGBGBGBGBGBGBGBGBGBGBGBGBGBGBGBGBGBGBGBGBGBGBGBGBGBGBGBGBGBGBGBGBGBGBGBGBGBGBGBGBGBGBGBGBGBGBGBGBGBGBGBGBGBGBGBGBGBGBGBGBGBGBGBGBGBGBGBGBGBGBGBGBGBGBGBGBGBGBGBGBGBGBGBGBGBGBGBGBGBGBGBGBGBGBGBGBGBGBGBGBGBGBGBGBGBGBGBGBGBGBGBGBGBGBGBGBGBGBGBGBGBGBGBGBGBGBGBGBGBGBGBGBGBGBGBGBGBGBGBGBGBGBGBGBGBGBGBGBGBGBGBGBGBGBGBGBGBGBGBGBGBGBGBGBGBGBGBGBGBGBGBGBGBGBGBGBGBGBGBGBGBGBGBGBGBGBGBGBGBGBGBGBGBGBGBGBGBGBGBGBGBGBGBGBGBGBGBGBGBGBGBGBGBGBGBGBGBGBGBGBGBGBGBGBGBGBGBGBGBGBGBGBGBGBGBGBGBGBGBGBGBGBGBGBGBGBGBGBGBGBGBGBGBGBGBGBGBGBGBGBGBGBGBGBGBGBGBGBGBGBGBGBGBGBGBGBGBGBGBGBGBGBGBGBGBGBGBGBGBGBGBGBGBGBGBGBGBGBGBGBGBGBGBGBGBGBGBGBGBGBGBGBGBGBGBGBGBGBGBGBGBGBGBGBGBGBGBGBGBGBGBGBGBGBGBGBGBGBGBGBGBGBGBGBGBGBGBGBGBGBGBGBGBGBGBGBGBGBGBGBGBGBGBGBGBGBGBGBGBGRGRGRGRGRGRGRGRGRGRGRGRGRGRGRGRGRGRGRGRGRGRGRGRGRGRGRGRGRGRGRGRGRGRGRGRGRGRGRGRGRGRGRGRGRGRGRGRGRGRGRGRGRGRGRGRGRGRGRGRGRGRGRGRGRGRGRGRGRGRGRGRGRGRGRGRGRGRGRGRGRGRGRGRGRGRGRGRGRGRGRGRGRGRGRGRGRGRGRGRGRGRGRGRGRGRGRGRGRGRGRGRGRGRGRGRGRGRGRGRGRGRGRGRGRGRGRGRGRGRGRGRGRGRGRGRGRGRGRGRGRGRGRGRGRGRGRGRGRGRGRGRGRGRGRGRGRGRGRGRGRGRGRGRGRGRGRGRGRGRGRGRGRGRGRGRGRGRGRGRGRGRGRGRGRGRGRGRGRGRGRGRGRGRGRGRGRGRGRGRGRGRGRGRGRGRGRGRGRGRGRGRGRGRGRGRGRGRGRGRGRGRGRGRGRGRGRGRGRGRGRGRGRGRGRGRGRGRGRGRGRGRGRGRGRGRGRGRGRGRGRGRGRGRGRGRGRGRGRGRGRGRGRGRGRGRGRGRGRGRGRGRGRGRGRGRGRGRGRGRGRGRGRGRGRGRGRGRGRGRGRGRGRGRGRGRGRGRGRGRGRGRGRGRGRGRGRGRGRGRGRGRGRGRGRGRGRGRGRGRGRGRGRGRGRGRGRGRGRGRGRGRGRGRGRGRGRGRGRGRGRGRGRGRGRGRGRGRGRGRGRGRGRGRGRGRGRGRGRGRGRGRGRGRGRGRGR
HRHRHRHRHRHRHRHRHRHRHRHRHRHRHRHRHRHRHRHRHRHRHRHRHRHRHRHRHRHRHRHRHRHRHRHRHRHRHRHRHRHRHRHRHRHRHRHRHRHRHRHRHRHRHRHRHRHRHRHRHRHRHRHRHRHRHRHRHRHRHRHRHRHRHRHRHRHRHRHRHRHRHRHRHRHRHRHRHRHRHRHRHRHRHRHRHRHRHRHRHRHRHRHRHRHRHRHRHRHRHRHRHRHRHRHRHRHRHRHRHRHRHRHRHRHRHRHRHRHRHRHRHRHRHRHRHRHRHRHRHRHRHRHRHRHRHRHRHRHRHRHRHRHRHRHRHRHRHRHRHRHRHRHRHRHRHRHRHRHRHRHRHRHRHRHRHRHRHRHRHRHRHRHRHRHRHRHRHRHRHRHRHRHRHRHRHRHRHRHRHRHRHRHRHRHRHRHRHRHRHRHRHRHRHRHRHRHRHRHRHRHRHRHRHRHRHRHRHRHRHRHRHRHRHRHRHRHRHRHRHR
HUHUHUHUHUHUHUHUHUHUHUHUHUHUHUHUHUHUHUHUHUHUHUHUHUHUHUHUHUHUHUHUHUHUHUHUHUHUHUHUHUHUHUHUHUHUHUHUHUHUHUHUHUHUHUHUHUHUHUHUHUHUHUHUHUHUHUHUHUHUHUHUHUHUHUHUHUHUHUHUHUHUHUHUHUHUHUHUHUHUHUHUHUHUHUHUHUHUHUHUHUHUHUHUHUHUHUHUHUHUHUHUHUHUHUHUHUHUHUHUHUHUHUHUHUHUHUHUHUHUHUHUHUHUHUHUHUHUHUHUHUHUHUHUHUHUHUHUHUHUHUHUHUHUHUHUHUHUHUHUHUHUHUHUHUHUHUHUHUHUHUHUHUHUHUHUHUHUHUHUHUHUHUHUHUHUHUHUHUHUHUHUHUHUHUHUHUHUHUHUHUHUHUHUHUHUHUHUHUHUHUHUHUHUHUHUHUHUHUHUHUHUHUHUHUHUHUHUHUHUHUHUHUHUHUHUHUHU
ILILILILILILILILILILILILILILILILILILILILILILILILILILILILILILILILILILILILILILILILILILILILILILILILILILILILILILILILILILILILILILILILILILILILILILILILILILILILILILILILILILILILILILILILILILILILILILILILILILILILILILILILILILILILILILILILILILILILILILILILILILILILILILILILILILILILILILILILILILILILILILILILILILILILILILILILILILILILILILILILILILILILILILILILILILILILILILILILILILILILILILILILILILILILILILILILILILILILILILILILILILILILILILILILILILILILILILILILILILILILILILILILILILILILILILILILILILILILILILILILILILILILILILILILILILILILILILILILILILILILILILILILILILILILILILILILILILILILILILILILILILILILILILILILILILILILILILILILILILILILILILILILILILILILILILILILILILILILILILILILILILILILILILILILILILILILILILILILILILILILILILILILILILILILILILILILILILILILILILILILILILILILILILILILILILILILILILILILILILILILILILILILILILILILILILILILILILILILILILILILILILILILILILILILILILILILILILILILILILILILILILILILILILILILILILILILILILILILILILILIL
LVLVLVLVLVLVLVLVLVLVLVLVLVLVLVLVLVLVLVLVLVLVLVLVLVLVLVLVLVLVLVLVLVLVLVLVLVLVLVLVLVLVLVLVLVLVLVLVLVLVLVLVLVLVLVLVLVLVLVLVLVLVLVLVLVLVLVLVLVLVLVLVLVLVLVLVLVLVLVLVLVLVLVLVLVLVLVLVLVLVLVLVLVLVLVLVLVLVLVLVLVLVLVLVLVLVLVLVLVLVLVLVLVLVLVLVLVLVLVLVLVLVLVLVLVLVLVLVLVLVLVLVLVLVLVLVLVLVLVLVLVLVLVLVLVLVLVLVLVLVLVLVLVLVLVLVLVLVLVLVLVLVLVLVLVLVLVLVLVLVLVLVLVLVLVLVLVLVLVLVLVLVLVLVLVLVLVLVLVLVLVLVLVLVLVLVLVLVLVLVLVLVLVLVLVLVLVLVLVLVLVLVLVLVLVLVLVLVLVLVLVLVLVLVLVLVLVLVLVLVLVLVLVLVLVLVLVLVLVLVLVLVLVLVLVLVLVLVLVLVLVLVLVLVLVLVLVLVLVLVLVLVLVLVLVLVLVLVLVLVLVLVLVLVLVLVLVLVLVLVLVLVLVLVLVLVLVLVLVLVLVLVLVLVLVLVLVLVLVLVLVLVLVLVLVLVLVLVLVLVLVLVLVLVLVLVLVLVLVLVLVLVLVLVLVLVLVLVLVLVLVLVLVLVLVLVLVLVLV
NLNLNLNLNLNLNLNLNLNLNLNLNLNLNLNLNLNLNLNLNLNLNLNLNLNLNLNLNLNLNLNLNLNLNLNLNLNLNLNLNLNLNLNLNLNLNLNLNLNLNLNLNLNLNLNLNLNLNLNLNLNLNLNLNLNLNLNLNLNLNLNLNLNLNLNLNLNLNLNLNLNLNLNLNLNLNLNLNLNLNLNLNLNLNLNLNLNLNLNLNLNLNLNLNLNLNLNLNLNLNLNLNLNLNLNLNLNLNLNLNLNLNLNLNLNLNLNLNLNLNLNLNLNLNLNLNLNLNLNLNLNLNLNLNLNLNLNLNLNLNLNLNLNLNLNLNLNLNLNLNLNLNLNLNLNLNLNLNLNLNLNLNLNLNLNLNLNLNLNLNLNLNLNLNLNLNLNLNLNLNLNLNLNLNLNLNLNLNLNLNLNLNLNLNLNLNLNLNLNLNLNLNLNLNLNLNLNLNLNLNLNLNLNLNLNLNLNLNLNLNLNLNLNLNLNLNLNLNLNLNLNLNLNLNLNLNLNLNLNLNLNLNLNLNLNLNLNLNLNLNLNLNLNLNLNLNLNLNLNLNLNLNLNLNLNLNLNLNLNLNLNLNLNLNLNLNLNLNLNLNLNLNLNL
NONONONONONONONONONONONONONONONONONONONONONONONONONONONONONONONONONONONONONONONONONONONONONONONONONONONONONONONONONONONONONONONONONONONONONONONONONONONONONONONONONONONONONONONONONONONONONONONONONONONONONONONONONONONONONONONONONONONONONONONONONONONONONONONONONONONONONONONONONONONONONONONONONONONONONONONONONONONONONONONONONONONONONONONONONONONONONONONONONONONONONONONONONONONONONONONONONONONONONONONONONONONONONONONONONONONONONONONONONONONONONONONONONONONONONONONONONONONONONONONONONONONONONONONONONONONONONONONONONONO
PLPLPLPLPLPLPLPLPLPLPLPLPLPLPLPLPLPLPLPLPLPLPLPLPLPLPLPLPLPLPLPLPLPLPLPLPLPLPLPLPLPLPLPLPLPLPLPLPLPLPLPLPLPLPLPLPLPLPLPLPLPLPLPLPLPLPLPLPLPLPLPLPLPLPLPLPLPLPLPLPLPLPLPLPLPLPLPLPLPLPLPLPLPLPLPLPLPLPLPLPLPLPLPLPLPLPLPLPLPLPLPLPLPLPLPLPLPLPLPLPLPLPLPLPLPLPLPLPLPLPLPLPLPLPLPLPLPLPLPLPLPLPLPLPLPLPLPLPLPLPLPLPLPLPLPLPLPLPLPLPLPLPLPLPLPLPLPLPLPLPLPLPLPLPLPLPLPLPLPLPLPLPLPLPLPLPLPLPLPLPLPLPLPLPLPLPLPLPLPLPLPLPLPLPLPLPLPLPLPLPLPLPLPLPLPLPLPLPLPLPLPLPLPLPLPLPLPLPLPLPLPLPLPLPLPLPLPLPLPLPLPLPLPLPLPLPLPLPLPLPLPLPLPLPLPLPLPLPLPLPLPLPLPLPLPLPLPLPLPLPL
PTPTPTPTPTPTPTPTPTPTPTPTPTPTPTPTPTPTPTPTPTPTPTPTPTPTPTPTPTPTPTPTPTPTPTPTPTPTPTPTPTPTPTPTPTPTPTPTPTPTPTPTPTPTPTPTPTPTPTPTPTPTPTPTPTPTPTPTPTPTPTPTPTPTPTPTPTPTPTPTPTPTPTPTPTPTPTPTPTPTPTPTPTPTPTPTPTPTPTPTPTPTPTPTPTPTPTPTPTPTPTPTPTPTPTPTPTPTPTPTPTPTPTPTPTPTPTPTPTPTPTPTPTPTPTPTPTPTPTPTPTPTPTPTPTPTPTPTPTPTPTPTPTPTPTPTPTPTPTPTPTPTPTPTPTPTPTPTPTPTPTPTPTPTPTPTPTPTPTPTPTPTPTPTPTPTPTPTPTPTPTPTPTPTPTPTPTPTPTPTPTPTPTPTPTPTPTPTPTPTPTPTPTPTPTPTPTPTPTPTPTPTPTPTPTPTPTPTPTPTPTPTPTPTPTPTPTPTPTPTPTPTPTPTPTPTPTPTPTPTPTPTPTPTPTPTPTPTPTPTPTPTPTPTPTPTPTPTPTPTPTPTPTPTPTPTPTPTPTPTPTPTPTPTPTPTPTPTPTPTPTPTPTPTPTPTPTPTPTPTPTPTPTPTPTPT
RORORORORORORORORORORORORORORORORORORORORORORORORORORORORORORORORORORORORORORORORORORORORORORORORORORORORORORORORORORORORORORORORORORORORORORORORORORORORORORORORORORORORORORORORORORORORORORORORORORORORORORORORORORORORORORORORORORORORORORORORORORORORORORORORORORORORORORORORORORORORORORORORORORORORORORORORORORORORORORORORORORORORORORORORORORORORORORORORORORORORORORORORORORORORORORORORORORORORORORORORORORORORORORORORORORORORORORORORORORORORORORORORORORORORORORORORORORORORORORORORORORORORORORORORORORORORORORORORORORORORORORORORORORORORORORORORORORORORORORORORORORORORORORORORORORORORORORORORORORORORORORORORORORURURURURURURURURURURURURURURURURURURURURURURURURURURURURURURURURURURURURURURURURURURURURURURURURURURURURURURURURURURURURURURURURURURURURURURURURURURURURURURURURURURURURURURURURURURURURURURURURURURURURURURURURURURURURURURURURURURURURURURURURURURURURURURURURURURURURURURURURURURURURURURURURURURURURURURURURURURURURURURURURURURURURURURURURURURURURURURURURURURURURURURURURURURURURURURURURURURURURURURURURURURURURURURURURURURURURURURURURURURURURURURURURURURURURURURURURURURURURURURURURURURURURURURURURURURURURURURURURURURURURURURURURURURURURURURURURURURURURURURURURURURURURURURURURURURURURURURURURURURURURURURURURURURURURURURURURURURURURURURURURURURURURURURURURURURURURURURURURURURURURURURURURURURURURURURURURURURURURURURURURURURURURURURURURURURURURU
SESESESESESESESESESESESESESESESESESESESESESESESESESESESESESESESESESESESESESESESESESESESESESESESESESESESESESESESESESESESESESESESESESESESESESESESESESESESESESESESESESESESESESESESESESESESESESESESESESESESESESESESESESESESESESESESESESESESESESESESESESESESESESESESESESESESESESESESESESESESESESESESESESESESESESESESESESESESESESESESESESESESESESESESESESESESESESESESESESESESESESESESESESESESESESESESESESESESESESESESESESESESESESESESESESESESESESESESESESESESESESESESESESESESESESESESESESESESESESESESESESESESESESESESESESESESESESESESESESESESESESESESESESESESESESESESE
SISISISISISISISISISISISISISISISISISISISISISISISISISISISISISISISISISISISISISISISISISISISISISISISISISISISISISISISISISISISISISISISISISISISISISISISISISISISISISISISISISISISISISISISISISISISISISISISISISISISISISISISISISISISISISISISISISISISISISISISISISISISISISISISISISISISISISISISISISISISISISISISISISISISISISISISISISISISISISISISISISISISISISISISISISISISISISISISISISISISISISISISISISISISISISISISISISISISISISISISISISISISISISISISISISISISISISISISISISISISI
SKSKSKSKSKSKSKSKSKSKSKSKSKSKSKSKSKSKSKSKSKSKSKSKSKSKSKSKSKSKSKSKSKSKSKSKSKSKSKSKSKSKSKSKSKSKSKSKSKSKSKSKSKSKSKSKSKSKSKSKSKSKSKSKSKSKSKSKSKSKSKSKSKSKSKSKSKSKSKSKSKSKSKSKSKSKSKSKSKSKSKSKSKSKSKSKSKSKSKSKSKSKSKSKSKSKSKSKSKSKSKSKSKSKSKSKSKSKSKSKSKSKSKSKSKSKSKSKSKSKSKSKSKSKSKSKSKSKSKSKSKSKSKSKSKSKSKSKSKSKSKSKSKSKSKSKSKSKSKSKSKSKSKSKSKSKSKSKSKSKSKSKSKSKSKSKSKSKSKSKSKSKSKSKSKSKSKSKSKSKSKSKSKSKSKSKSKSKSKSKSKSKSKSKSKSKSKSKSKSKSKSKSKSKSKSKSKSKSKSKSKSKSKSKSKSKSKSKSKSKSKSKSKSKSKSKSKSKSKSKSKSKSKSKSKSKSKSKSKSKSKSKSKSKSKSKSKSKSKSKSKSK
TRTRTRTRTRTRTRTRTRTRTRTRTRTRTRTRTRTRTRTRTRTRTRTRTRTRTRTRTRTRTRTRTRTRTRTRTRTRTRTRTRTRTRTRTRTRTRTRTRTRTRTRTRTRTRTRTRTRTRTRTRTRTRTRTRTRTRTRTRTRTRTRTRTRTRTRTRTRTRTRTRTRTRTRTRTRTRTRTRTRTRTRTRTRTRTRTRTRTRTRTRTRTRTRTRTRTRTRTRTRTRTRTRTRTRTRTRTRTRTRTRTRTRTRTRTRTRTRTRTRTRTRTRTRTRTRTRTRTRTRTRTRTRTRTRTRTRTRTRTRTRTRTRTRTRTRTRTRTRTRTRTRTRTRTRTRTRTRTRTRTRTRTRTRTRTRTRTRTRTRTRTRTRTRTRTRTRTRTRTRTRTRTRTRTRTRTRTRTRTRTRTRTRTRTRTRTRTRTRTRTRTRTRTRTRTRTRTRTRTRTRTRTRTRTRTRTRTRTRTRTRTRTRTRTRTRTRTRTRTRTRTRTRTRTRTRTRTRTRTRTRTRTRTRTRTRTRTRTRTRTRTRTRTRTRTRTRTRTRTRTRTRTRTRTRTRTRTRTRTRTRTRTRTRTRTRTRTRTRTRTRTRTRTRTRTRTRTRTRTRTRTRTRTRTRTRTRTRTRTRTRTRTRTRTRTRTRTRTRTRTRTRTRTRTRTRTRTRTRTRTRTRTRTRTRTRTRTRTRTRTRTRTRTRTRTRTRTRTRTRTRTRTRTRTRTRTRTRTRTRTRTRTRTRTRTRTRTRTRTRTRTRTRTRTRTRTRTRTRTRTRTRTRTRTRTRTRTRTRTRTRTRTRTRTRTRTRTRTRTRTRTRTRTRTRTRTRTRTRTRTRTRTRTRTRTRTRTRTRTRTRTRTRTRTRTRTRTRTRTRTRTRTRTRTRTRTRTRTRTRTRTRTRTRTRTRTRTRTRTRTRTRTRTRTRTRTRTRTRTRTRTRTRTRTRTRTRTRTRTRTRTRTRTRTRTRTRTRTR
UAUAUAUAUAUAUAUAUAUAUAUAUAUAUAUAUAUAUAUAUAUAUAUAUAUAUAUAUAUAUAUAUAUAUAUAUAUAUAUAUAUAUAUAUAUAUAUAUAUAUAUAUAUAUAUAUAUAUAUAUAUAUAUAUAUAUAUAUAUAUAUAUAUAUAUAUAUAUAUAUAUAUAUAUAUAUAUAUAUAUAUAUAUAUAUAUAUAUAUAUAUAUAUAUAUAUAUAUAUAUAUAUAUAUAUAUAUAUAUAUAUAUAUAUAUAUAUAUAUAUAUAUAUAUAUAUAUAUAUAUAUAUAUAUAUAUAUAUAUAUAUAUAUAUAUAUAUAUAUAUAUAUAUAUAUAUAUAUAUAUAUAUAUAUAUAUAUAUAUAUAUAUAUAUAUAUAUAUAUAUAUAUAUAUAUAUAUAUAUAUAUAUAUAUAUAUAUAUAUAUAUAUAUAUAUAUAUAUAUAUAUAUAUAUAUAUAUAUAUAUAUAUAUAUAUAUAUAUAUAUAUAUAUAUAUAUAUAUAUAUAUAUAUAUAUAUAUAUAUAUAUAUAUAUAUAUAUAUAUAUAUAUAUAUAUAUAUAUAUAUAUAUAUAUAUAUAUAUAUAUAUAUAUAUAUAUAUAUAUAUAUAUAUAUAUAUAUAUAUAUAUAUAUAUAUAUAUAUA
56
78
9
Avera
ge
Hap
pin
ess
2 4 6 8 10Corruption Perception Index 2008
mothers_happiness Non_mothers_happiness
Fitted values Fitted values
FIGURE 5: Happiness, Childbearing and Corruption in the public sector
26
FIGURE 6: Happiness, Childbearing and Gender Equality
27
FIGURE 7: Happiness, Childbearing and Human Development Index
28
TABLE 1: Contextual Indicators
HDI
(2007)
Corruption Perception Index
(2008) % Women in Parliament (2008)
Enrolment Rate
in formal childcare
for children < 3 year
(2007-2008)
Country Value Value/10 % %
Belgium 0.95 7.3
3.6
9.0
6.4
5.2
7.9
9.3
6.6
6.5
9.0
6.9
7.7
4.7
4.4
5.1
6.0
5.0
8.9
7.9
4.6
6.1
3.8
2.1
6.7
5.0
4.6
2.5
35.30 32.0
Bulgaria 0.84 21.70 13.0
Switzerland 0.96 28.50 .
Cyprus 0.91 14.30 21.0
Czech Republic 0.90 15.50 6.0
Germany 0.95 31.60 18.0
Denmark 0.96 38.00 66.0
Estonia 0.88 20.80 34.0
Spain 0.96 36.30 50.0
Finland 0.96 41.50 14.0
France 0.96 18.20 28.0 * Oecd 02
UK 0.95 19.50 27.0 * 2006-2007
Greece 0.94 14.70 5.0
Croatia 0.87 20.90 16.0
Hungary 0.88 11.10 5.0
Israel 0.94 14.20 30.0
Latvia 0.87 20.00 16.0
Netherlands 0.96 39.30 51.0 * 2006-2007
Norway 0.97 36.10 48.0
Poland 0.88 20.20 2.0
Portugal 0.91 28.30 23.0 * Oecd 04
Romania 0.84 9.40 3.0
Russian Fed. 0.82 14.00 18.0
Sweden 0.96 47.00 49.0
Slovenia 0.93 12.20 44.0
Slovakia 0.88 19.30 17.0 * Oecd 03
Turkey 0.81 9.10 -
Ukraine 0.80 8.20 15.0
Source UN Stats Division:
data.un.org transparency.org UNECE Statistics: unece.org/stats
UNECE Statistics:
+ OECD Family Database
29
TABLE 2 Results of two-level regressions on happiness with contextual variables, Women
WOMEN (20-50) Enrollment rare in formal
childcare
Children <3
Human
Development
Index
Corruption
Perception Index
% of Women
in
Parliament
# Children -0.029 -0.667** -0.130*** -0.080*
(0.029) (0.234) (0.049) (0.032)
Enrollment Rate Children < 3 years 0.022***
(0.006)
Enrollment Rate * # Children 0.002*
(0.001)
HDI [*10] 1.026***
(0.125)
HDI * # Children 0.074**
(0.026)
CPI [/10] 0.254***
(0.038)
Global Gender Gap * # Children 0.023***
(0.008)
% Women in National Parliament 0.040***
(0.008)
% Women in Parliament * # Children 0.004***
(0.001)
Constant 8.224*** -0.806 6.935 7.595***
(0.336) (1.169) (0.371) (0.354)
Country level Variance 0.226 0.109 0.143 0.221
Individual level Variance 3.203 3.374 3.374 3.374
ICC 0.066 0.031 0.041 0.062
N 12926 14214 14214 14214
Note: standard errors in parenthesis. P-values: +p<=0.10:*+p<=0.05:**+p<=0.01***. Controls : age, age2, years
of education, living with a partner, working status, church attendance.
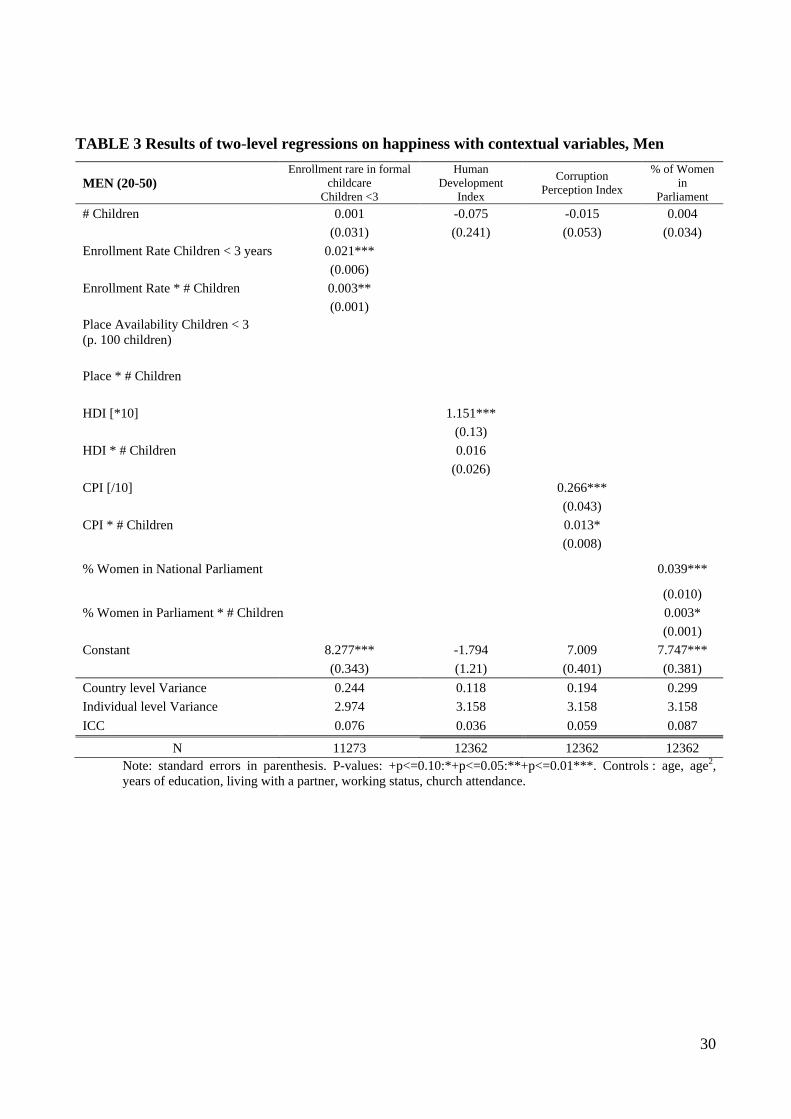
30
TABLE 3 Results of two-level regressions on happiness with contextual variables, Men
MEN (20-50) Enrollment rare in formal
childcare
Children <3
Human
Development
Index
Corruption
Perception Index
% of Women
in
Parliament
# Children 0.001 -0.075 -0.015 0.004
(0.031) (0.241) (0.053) (0.034)
Enrollment Rate Children < 3 years 0.021***
(0.006)
Enrollment Rate * # Children 0.003**
(0.001)
Place Availability Children < 3
(p. 100 children)
Place * # Children
HDI [*10] 1.151***
(0.13)
HDI * # Children 0.016
(0.026)
CPI [/10] 0.266***
(0.043)
CPI * # Children 0.013*
(0.008)
% Women in National Parliament 0.039***
(0.010)
% Women in Parliament * # Children 0.003*
(0.001)
Constant 8.277*** -1.794 7.009 7.747***
(0.343) (1.21) (0.401) (0.381)
Country level Variance 0.244 0.118 0.194 0.299
Individual level Variance 2.974 3.158 3.158 3.158
ICC 0.076 0.036 0.059 0.087
N 11273 12362 12362 12362
Note: standard errors in parenthesis. P-values: +p<=0.10:*+p<=0.05:**+p<=0.01***. Controls : age, age2,
years of education, living with a partner, working status, church attendance.
31
References
Aassve, Arnstein, Francesco C. Billari, and Lea Pessin. 2012. "Trust and Fertility Dynamics."
Dondena Working Paper No 56
Aassve, Arnstein, Alice Goisis, and Maria Sironi. 2012. "Happiness and Childbearing Across
Europe." Social Indicators Research 108:65-86.
Aassve, Arnstein, Sironi, Maria and Vittorio Bassi. 2013. "Explaining Attitudes Towards
Demographic Behaviour." European Sociological Review, 29(2): 316-333.
Aghion, Philippe, Algan, Yann, Cahuc, Pierre and Andrei Shleifer. 2010. “Regulation and distrust,”
The Quarterly Journal of Economics 125(3): 1015–1049.
Adler, Paul S. 2001. "Market, Hierarchy, and Trust: The Knowledge Economy and Future of
Capitalism", Organization Science, 12(2): 215-234.
Baranowska, Anna and Anna Matysiak. 2011. "Does parenthood increase happiness? Evidence for
Poland." Vienna Yearbook of Population Research 2011 9:307-325.
Becker, Gary S. 1965. "A Theory of the Allocation of Time." The Economic Journal 75:493-517.
—. 1981. A Treatise on the Family: National Bureau of Economic Research, Inc.
Bjørnskov, C. (2007). Determinants of generalized trust: A cross-country comparison, Public
Choice, 10.1007/s11127-006-9069-1
Bjørnskov, C. (2010). How does social trust lead to better governance? An attempt to separate
electoral and bureaucratic mechanisms, Public Choice, 10.1007/s11127-009-9522-z
Billari, Francesco C., Philipov, Dimiter, and Pau Baizán. 2001. "Leaving Home in Europe: The
Experience of Cohorts Born Around 1960." International Journal of Population Geography
7:339-356.
32
Billari, Francesco C. and Hans-Peter Kohler. 2009. "Fertility and Happiness in the XXI century:
institutions, preferences, and their interactions." in XXVI IUSSP International Population
Conference. Marrakesh.
Billari, Francesco C., Hans-Peter Kohler, Gunnar Andersson, and Hans Lundström. 2007.
"Approaching the Limit: Long-Term Trends in Late and Very Late Fertility." Population
and Development Review 33:149-170.
Campbell, A. (1972). Aspirations, satisfaction, and fulfillment. In A. Campbell & P. E. Converse
(Eds.), The human meaning of social change (pp. 441–466). New York: Russell Sage
Campbell, A. (1981). The sense of well-being in America. New York: McGraw-Hill.
Carl, N. (2014). Culture, Work and Childcare in Europe. 18th Annual Aage Sorensen Memorial
Conference, 9-12 April, Oxford.
Easterlin, Richard A. (1976) The Conflict between Aspirations and Resources, Population and
Development Review, 2: (3/4), pp. 417-425
El-Attar, M. (2013), Trust, child care technology choice and female labor force participation,
Review of Economics of the Household, 11(4), 507 - 544
Esping-Andersen, Gøsta and Francesco C. Billari (2012), "Re-theorizing Family Demographics,
Universitat Pompeu Fabra, mimeo
Esping-Andersen, Gøsta. 2009. The Incomplete Revolution: Adapting to Women's New Roles.
Cambridge: Polity Press.
Feichinger, Gustav, Alexia Prskawetz, Andrea Seidl, Christa Simon and Stefan Wrzaczek, 2012,
"Do Egalitarian Societies Boost Fertility?", Vienna Institute of Demography, mimeo.
Goldstein, Joshua R., Tomá Sobotka, and Aiva Jasilioniene. 2009. "The End of "Lowest-Low"
Fertility?" Population and Development Review 35:663-699.
Ginsborg, Paul (1990) A History of Contemporary Italy 1943 - 1980, Penguin Books Ltd, London,
England.
33
Inglehart, R. (1971).The Silent Revolution in Europe: Intergenerational Change in Post-Industrial
Societies’, American Political Science Review,65:4,991–1017.
Inglehart, R. and W. E. Baker. (2000). Modernization, cultural change and the persistence of
traditional values, American Sociological Review, 65(1), 19–51.
Kalwij, Adriaan. 2010. "The Impact of Family Policy Expenditure on Fertility in Western Europe."
Demography 47:16.
Kohler, Hans-Peter, Jere R. Behrman, and Axel Skytthe. 2005. "Partner + Children = Happiness?
The Effects of Partnerships and Fertility on Well-Being." Population and Development
Review 31:407-445.
Kohler, Hans-Peter, Francesco C. Billari, and José Antonio Ortega. 2002. "The Emergence of
Lowest-Low Fertility in Europe During the 1990s." Population and Development Review
28:641-680.
Lesthaeghe, Ronald. and Dirk. J. Van de Kaa. 1986. "Twee Demografische Transities." in
Bevolking: Groei en Krim. Deventer: Van Loghum Slaterus.
Lewin, K., Dembo, T., Festinger, L., & Sears, P. S. (1944). Level of aspiration. In J. Mc. V. Hunt
(Ed.), Personality and the behavior disorders. New York: Ronald Press
Luci, Angela and Olivier Thévenon. 2011. "La fécondité remonte dans les pays de l'OCDE: est-ce
dû au progrès économique?" Population et sociétés 481.
Margolis, Rachel and Mikko Myrskylä. 2011. "A Global Perspective on Happiness and Fertility."
Population and Development Review 37:29-56.
McDonald, Peter. 2000. "Gender equity, social institutions and the future of fertility." Journal of
Population Research 17:1-16.
—. 2006. "Low Fertility and the State: The Efficacy of Policy." Population and Development
Review 32:485-510.
34
—. 2013. "Societal foundations for explaining fertility: Gender equity." Demographic Research 28,
34: 981-994.
Mencarini, Letizia and Maria Sironi. 2012. "Happiness, Housework and Gender Inequality in
Europe." European Sociological Review 28:203-219.
Mencarini, Letizia (2013), “Gender equity” and “Gender-role beliefs”, entries in the Encyclopedia
of Quality of Life Research, Springer.
Mishler, William and Richard Rose. 2001. "What Are the Origins of Political Trust?: Testing
Institutional and Cultural Theories in Post-communist Societies." Comparative Political
Studies 34:30-62.
Mintzberg, Henry. 1979. The Structuring of Organizations. Prentice-Hall, Englewood Cliffs, NJ.
Myrskylä, Mikko, Hans-Peter Kohler, and Francesco C. Billari. 2009. "Advances in development
reverse fertility declines." Nature 460:741-743.
Myrskylä, Mikko, Hans-Peter Kohler and Francesco C Billari. 2011. High Development and
Fertility: Fertility at Older-reproductive ages and gender equality explain the positive link,
Dondena Working Paper No 49 , Dondena Centre for Research on Social Dynamics
Neyer, Gerda, Lappegård Trude and Daniele Vignoli (2013), Gender Equality and Fertility: Which
Equality Matters?, European Journal of Population, on-line first 7 June 2013.
Plagnol, Anke C. and Richard .A. Easterlin, (2008) Aspirations, Attainments, and Satisfaction: Life
Cycle Differences Between American Women and Men, Journal of Happiness Studies
9:601–619
Sleebos, Joëlle. 2003. “Low fertility rates in the OECD countries,” OECD Social, Employment,
and Migration Working Paper 15.
Sobotka, Tomas. 2008. "Overview Chapter 6: The diverse faces of the Second Demographic
Transition in Europe." Demographic Research 19:171-224.
35
Van de Kaa, D. J.. (1987). Europe’s Second Demographic Transition. Population Bulletin, 42 (1),
Washington, The Population Reference Bureau.
Uslaner, E. M. (2002). The moral foundations of trust. Cambridge University Press.