Embed Size (px)
Citation preview
IFPRI Discussion Paper 01020
August 2010
Institutional and Public Expenditure Review of Ghana’s Ministry of Food and Agriculture
Shashidhara Kolavalli
Regina Birner
Samuel Benin
Leah Horowitz
Suresh Babu
Kwadwo Asenso-Okyere
Nii Moi Thompson
John Poku
Development Strategy and Governance Division
brought to you by COREView metadata, citation and similar papers at core.ac.uk
provided by Research Papers in Economics
INTERNATIONAL FOOD POLICY RESEARCH INSTITUTE
The International Food Policy Research Institute (IFPRI) was established in 1975. IFPRI is one of 15
agricultural research centers that receive principal funding from governments, private foundations, and
international and regional organizations, most of which are members of the Consultative Group on
International Agricultural Research (CGIAR).
PARTNERS AND CONTRIBUTORS
IFPRI gratefully acknowledges the generous unrestricted funding from Australia, Canada, China,
Denmark, Finland, France, Germany, India, Ireland, Italy, Japan, the Netherlands, Norway, the
Philippines, South Africa, Sweden, Switzerland, the United Kingdom, the United States, and the World
Bank.
AUTHORS
Shashidhara Kolavalli, International Food Policy Research Institute
Senior Research Fellow, Development Strategy and Governance Division
Regina Birner, International Food Policy Research Institute
Senior Research Fellow, Development Strategy and Governance Division
Samuel Benin, International Food Policy Research Institute
Research Fellow, Development Strategy and Governance Division
Leah Horowitz, International Food Policy Research Institute
Prgram Coordinator, Development Strategy and Governance Division
Suresh Babu, International Food Policy Research Institute
Senior Research Fellow, Director General Office
Kwadwo Asenso-Okyere, International Food Policy Research Institute
Director, Eastern & Southern Africa Regional Office
Nii Moi Thompson, Development Policy Institute
John Poku, Consultant
Notices
1 Effective January 2007, the Discussion Paper series within each division and the Director General’s Office of IFPRI
were merged into one IFPRI–wide Discussion Paper series. The new series begins with number 00689, reflecting the prior publication of 688 discussion papers within the dispersed series. The earlier series are available on IFPRI’s website at http://www.ifpri.org/publications/results/taxonomy%3A468. 2 IFPRI Discussion Papers contain preliminary material and research results. They have been peer reviewed, but
have not been subject to a formal external review via IFPRI’s Publications Review Committee. They are circulated in order to stimulate discussion and critical comment; any opinions expressed are those of the author(s) and do not necessarily reflect the policies or opinions of IFPRI.
Copyright 2010 International Food Policy Research Institute. All rights reserved. Sections of this material may be reproduced for personal and not-for-profit use without the express written permission of but with acknowledgment to IFPRI. To reproduce the material contained herein for profit or commercial use requires express written permission. To obtain permission, contact the Communications Division at [email protected].
iii
Contents
Abstract v
Acknowledgments vi
Abbreviations and Acronyms vii
1. Introduction 1
2. Institutional Review 4
3. Agricultural Expenditure Review 32
4. Recommendations 56
References 64
iv
List of Tables
1. Hours worked per week for three seasons (% of interviewed agricultural extension agents) 28
2. Area covered and distances traveled by agricultural extension agents (AEAs) 29
3. Macroeconomic indicators associated with government agriculture expenditure 34
4. 2007 Budget of East Akim DADU (in Ghana cedis) 37
5. Donor pledges to the agricultural sector in 2008 (GH¢ million) 39
6. Donor resources to Ghana under multidonor budgetary support (MDBS) (US$ millions) 39
7. Trends in Ghana revenues (GH¢ million, 2006 prices) 40
8. HIPC/poverty funds spent on the agriculture sector, by functional unit, subsector, and function
(2000 GH¢ thousand) 40
9. Government spending on agriculture research, by research institute and center (% of total research
spending releases in 2006 and 2007) 41
10. Actual expenditures in case study district agricultural development units (DADUs) in 2006 46
11. Expenditures on services in case-study district agricultural development units (DADUs) in 2006 46
12. Budgeted and actual inflows to MoFA in 2004 and 2005 (GH¢) 49
13. Cost of providing extension services by MoFA in selected regions, 2006 51
List of Figures
1. Conceptual framework 6
2. Institutional landscape of the agricultural sector 10
3. Government expenditure on the agricultural sector 33
4. Government expenditure on agriculture and other sectors (percent) 33
5. Government expenditure on agriculture by ministries, departments, and agencies (% of total
agricultural expenditure) 34
6. Real government agriculture expenditure by ministries, departments, and agencies (2000
GH¢, million) 35
7. Government development and recurrent agriculture expenditure 36
8. Government agriculture development expenditure as percent of total expenditures in ministries,
departments, and agencies (% of agriculture expenditure) 36
9. Flow of funds in the Ministry of Food and Agriculture (MoFA) 38
10. AgSSIP expenditures by administrative units and functions (GH¢ million) 42
11. MoFA government expenditure by functional unit (GH¢ million) 43
12. MoFA government expenditure in regions: total spending per square kilometer and per capita,
2000 44
13. AgSSIP expenditures in regions and districts 45
14. Value of household agricultural production per capita (GH¢), by region, 1991/92–2005/06 53
15. Benefit-cost ratios of public agriculture expenditures in Ghana 54
v
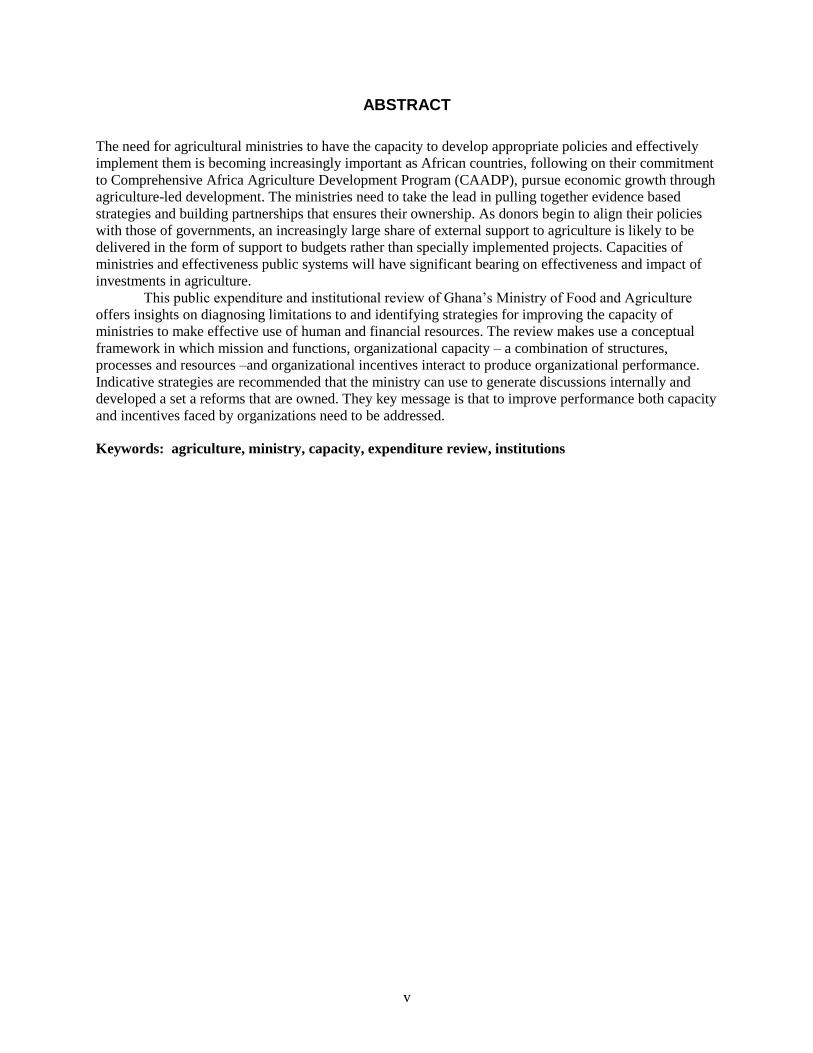
ABSTRACT
The need for agricultural ministries to have the capacity to develop appropriate policies and effectively
implement them is becoming increasingly important as African countries, following on their commitment
to Comprehensive Africa Agriculture Development Program (CAADP), pursue economic growth through
agriculture-led development. The ministries need to take the lead in pulling together evidence based
strategies and building partnerships that ensures their ownership. As donors begin to align their policies
with those of governments, an increasingly large share of external support to agriculture is likely to be
delivered in the form of support to budgets rather than specially implemented projects. Capacities of
ministries and effectiveness public systems will have significant bearing on effectiveness and impact of
investments in agriculture.
This public expenditure and institutional review of Ghana’s Ministry of Food and Agriculture
offers insights on diagnosing limitations to and identifying strategies for improving the capacity of
ministries to make effective use of human and financial resources. The review makes use a conceptual
framework in which mission and functions, organizational capacity – a combination of structures,
processes and resources –and organizational incentives interact to produce organizational performance.
Indicative strategies are recommended that the ministry can use to generate discussions internally and
developed a set a reforms that are owned. They key message is that to improve performance both capacity
and incentives faced by organizations need to be addressed.
Keywords: agriculture, ministry, capacity, expenditure review, institutions
vi
ACKNOWLEDGMENTS
We are grateful to the Policy Planning and Monitoring and Evaluation Directorate of the Ministry of Food
and Agriculture (MoFA) of Ghana for giving us the opportunity to conduct this research, and to numerous
MoFA staff who supplied the needed information and insights. We are also grateful to the minister and
the chief director for sharing their thoughts. We particularly appreciate the support we received from staff
in the five case study districts. We also benefited greatly from a discussion with a group of retired staff
who provided an understanding of previous attempts at reforms and the kinds of reforms that are now
needed and feasible in MoFA. Kipo Jimah provided invaluable research assistance to the team.
vii
ABBREVIATIONS AND ACRONYMS
AEA Agricultural Extension Agent
AggSSIP Agricultural Sector Support Investment Project
CAADP Comprehensive Africa Agricultural Development Programme
CAGD Controller and Accountant Generals Department
CSIR Council for Scientific and Industrial Research
COCOBOD Ghana Cocoa Board
DADU District Agricultural Development Unit
DAO District Agricultural Officer
DDA District Director of Food and Agriculture
FAO Food and Agriculture Organization of the United Nations
FASDEP Food and Agriculture Sector Development Policy
FBO Farmer-Based Organisation
GIDA Ghana Irrigation Development Authority
GLSS Ghana Living Standard Survey
HIPC Heavily Indebted Poor Country
ICOUR Integrated Company for Upper Region
IGF Internally generated fund
ISSER Institute of Statistical Social and Economic Research
MDAs Ministries, Departments, and Agencies
MDBS Multi Donor Budgetary Support
MIS Management Information System
MoFA Ministry of Food and Agriculture
MoFEP
MoLF
Ministry of Finance and Economic Planning
Ministry of Land and Forests
MTEF Medium-term Expenditure Framework
NAEP National Agricultural Extension Project
NDPC
NGO
National Development Planning Commission
Nongovernmental organization
PEIR Public expenditure and institutional review
PNDCL Provisional National Defence Council Law
RADU
RAO
Regional Agricultural Development Unit
Regional agricultural office
RELC Research-Extension Farmer Linkage Committees
WIAD Women in Agricultural Development

1
1. INTRODUCTION
Background
Ghana, a West African country with a population of 23 million people, has achieved a remarkable growth
record in the past two decades: it recorded positive per capita GDP growth in every year during this
period. Agriculture is the backbone of the Ghanaian economy. The agriculture sector has grown rapidly at
an average annual rate of 5.5 percent in recent years, benefiting from favorable weather conditions and
high world market prices for cocoa. However, growth patterns have been erratic over a longer period.
Agricultural performance has not been uniform within subsectors and regionally: forestry and cocoa
subsectors grew at double digit rates between 1991 and 2005, while crops other than cocoa grew at rates
ranging from 1.5 to 4.5 percent.
Land expansion contributed more than yield increases to the growth of various crops. As is
typical for many African countries, the yields of most crops have not increased significantly (World Bank
2007). However, the high rate of land expansion achieved in recent years may be difficult to sustain,
especially when taking environmental concerns into account. The level of adoption of agricultural
technologies is still low in the country. Reaching the productivity targets that the country has set for
different crops will require rates of growth in productivity that are far higher than what have been
achieved in the past (Breisinger et al. 2008).
In 2007, the Ministry of Food and Agriculture (MoFA), which leads the sector, revised its Food
and Agriculture Sector Development Policy (FASDEP) through broad consultation. The policies of the
Ministry, its financial management, and the organizational capabilities to implement FASDEP II have
become more important than ever, as the activities of the Ministry are increasingly financed through
budget support from development partners, rather than through projects. Whether the Ministry has the
capacity to effectively implement the policies and strategies that it has developed recently is an important
issue, which needed to be assessed and reviewed in light of the increase in funding it is likely to receive
following the Comprehensive Africa Agriculture Development Programme (CAADP) roundtable, as
several donors are scaling up support to countries that are committed to develop agriculture.
A thorough understanding of public expenditure management in the Ministry is required to
develop effective strategies to strengthen its capacity, effectiveness, and impact. Past studies of the
Ministry have focused on either expenditure management or organizational issues, dealing largely with
management of and adjustment to structural changes such as decentralization (see, for example, Okorley,
Gray, and Reid 2009). Past studies have not considered whether linking expenditures, processes, and
outcomes could improve effectiveness. Hence, there is a need to examine the internal processes relating
public expenditure management with institutional capacity and outcomes. Hence, the Ministry initiated
the institutional and public expenditure review described in this report.
Objectives of the Institutional and Public Expenditure Review
The overall objective of this review is to generate policy-relevant insights to improve the capacity of the
Ministry regarding public expenditure management, manpower, and organizational processes to
effectively implement the agricultural sector strategy that it recently developed.
More specifically, the review seeks to answer the following two broad questions:
1. Are there institutional and managerial reforms that can be implemented to make MoFA more
effective in leading the agricultural transformation process?
2. Are investments in the sector adequate, and are funds being spent effectively in the sector and
by the Ministry?
The review has two distinct but related components: an institutional review that examines the first
question and an expenditure review that largely deals with the second question. The report integrates the
expenditure and institutional reviews to offer common recommendations.
2
The purpose of the institutional review is to analyze the institutional arrangements in MoFA,
including its organizational structure and its human resource management systems, in order to identify
areas for improvement in the short and medium terms. The specific objectives are
to identify critical factors that the Ministry can influence to improve its performance by
developing an understanding of
staff workload through examination of core processes within a unit,
organizational capacities and major deficiencies through examination of skills and
processes, and
structural factors, both internal and external, that influence performance;
to examine accountability of various units to the organization and of the Ministry to
stakeholders outside, including donors, and to identify how accountability may be
strengthened;
to examine opportunities and challenges in performance assessment of individuals, units, and
the organization and to explore how recent efforts to initiate monitoring and evaluation and to
establish performance indicators for budget support can be utilized in order to improve
performance assessment and accountability at various levels;
to examine capacity levels, in particular skills, to identify options for more effective
expenditure management in the Ministry; and
to examine the implications of decentralization for organizational capacity and to identify
measures to strengthen capacity through greater accountability to clients.
The key objectives of the expenditure review are
to assess the amount and composition of public expenditure in the agricultural sector;
to identify indicators for measuring outcomes of spending in the agricultural sector
to examine budget processes and coordination in the agricultural sector to bring about
consistency between policies and expenditures to improve the provision of public goods and
services; and
to assess the implications of decentralization for the provision of public goods and services in
the sector.
Methodology
The institutional review was based on the collection of data through interviews and case studies in
selected districts, complemented by two organized consultations with senior management and
consultations with a group of retired staff. The expenditure review primarily involved collection and
analysis of statistical data. The review was undertaken between January and July 2008.
Institutional Review
The study focused on the workings of selected district offices, as organizational strengths and weakness
are likely to be most noticeable at the points of service delivery, and on discussions with division
directors at the head office. After a preliminary document review, the team conducted a study at the East
Akim District Agricultural Development Unit (DADU) to understand in how the district offices function
and to identify suitable approaches to capturing relevant aspects of the functioning of the DADUs.
Following the East Akim study, the team presented the research plan to regional and national
directors in a meeting organized in Accra. They recommended four districts for case studies, one in each
of the agroecological zones (coastal, forest, transition, and savannah) to capture any differences in
challenges faced by the districts in delivering services. The team based its selection of districts on the
recommendations of the Ministry, even though the Ministry’s choices might be biased toward better-
3
performing districts. We reasoned that it is likely that problems identified in better-performing districts
are also likely to be prevalent in districts that perform less well, and it is those widespread problems that
require priority attention. To ensure the anonymity of the respondents, the districts are referred to as C1
(Coastal Zone), F1 (Forest Zone ), T1 (Transition Zone ), and S1 (Savannah Zone ).
The DADUs in the selected districts were requested to compile specific information before the
team’s visits.. During the first three weeks of February 2008, a team of consultants visited the districts to
interact with staff and collect the necessary information.
In the districts, senior officers were interviewed individually and group discussions were held
with the field staff. In addition, the following data were collected from the district offices: (1) details of
performance assessment for one year; (2) details of dates of recruitment, promotions, and current
positions of all staff; (3) annual work plans, progress, and financial reports. Each staff member was asked
to provide the following information: (1) a list of activities carried out in the previous five days, including
distances traveled, time spent interacting with farmers, and number of farmers contacted, and (2) a history
of training and promotions received during their employment with the Ministry. In addition, staff
members were asked to respond to a survey instrument that included questions relating to their ―world
view‖ or mental frame relating to various issues relevant to their work, their perceived work environment,
and perceptions regarding accountability mechanisms. The survey was completed by 67 staff members—
more than three-quarters of the staff in these offices.
The study also utilized data collected through a survey by the Institute for Statistical Social and
Economic Research (ISSER) and the International Food Policy Research Institute (IFPRI) as part of the
project ―Making Rural Service Provision Work for the Poor,‖ which focuses on rural water supply and
agricultural extension. The survey covered households, elected and appointed District Assembly
members, District Assembly staff, farmer-based organizations, agricultural extension agents (AEAs), and
organizations involved in rural water supply. The data presented in this report were collected in six
districts, two each in the Forest, Transition, and Savannah zones. To ensure the anonymity of the
respondents, the names of the districts are not disclosed here. One district, F1, was included in both the
survey and the review.
Public Expenditure Review
The data on public agriculture expenditure were primarily obtained from the Controller and Accountant
General’s Department (CAGD), MoFA, the Council for Scientific and Agricultural Research (CSIR), the
Ghana Cocoa Board (COCOBOD), the Ministry of Road Transport, the Ghana Statistical Service, and
many other institutions. Published data were also used. The information obtained from these agencies and
from the case study interviews was used to analyze a number of factors relating to institutional
performance.
In examining expenditures, the following analyses were undertaken: trend analysis to assess the
size and composition of public (mainly government) expenditure in the agricultural sector, unit cost
analysis to assess the efficiency of providing public goods and services in the sector, benefit incidence
analysis to assess the effectiveness of delivery and utilization of public goods and services in the sector,
case studies to identify the binding constraints for improving public agriculture expenditure management
and delivery, and analysis of utilization of public goods and services in the sector.
Organization of the Report
The report is organized as follows: The institutional review is presented in section 2, which begins with a
conceptual framework followed by diagnostics. Section 3 presents a review of expenditures. Section 4
offers a set of recommendations.
4
2. INSTITUTIONAL REVIEW
This section examines the institutional factors that influence the performance of MoFA. First, it presents a
conceptual framework to identify the factors and interactions that influence the performance of a complex
public organization such as MoFA. Second, it uses the framework to diagnose the situation in MoFA.
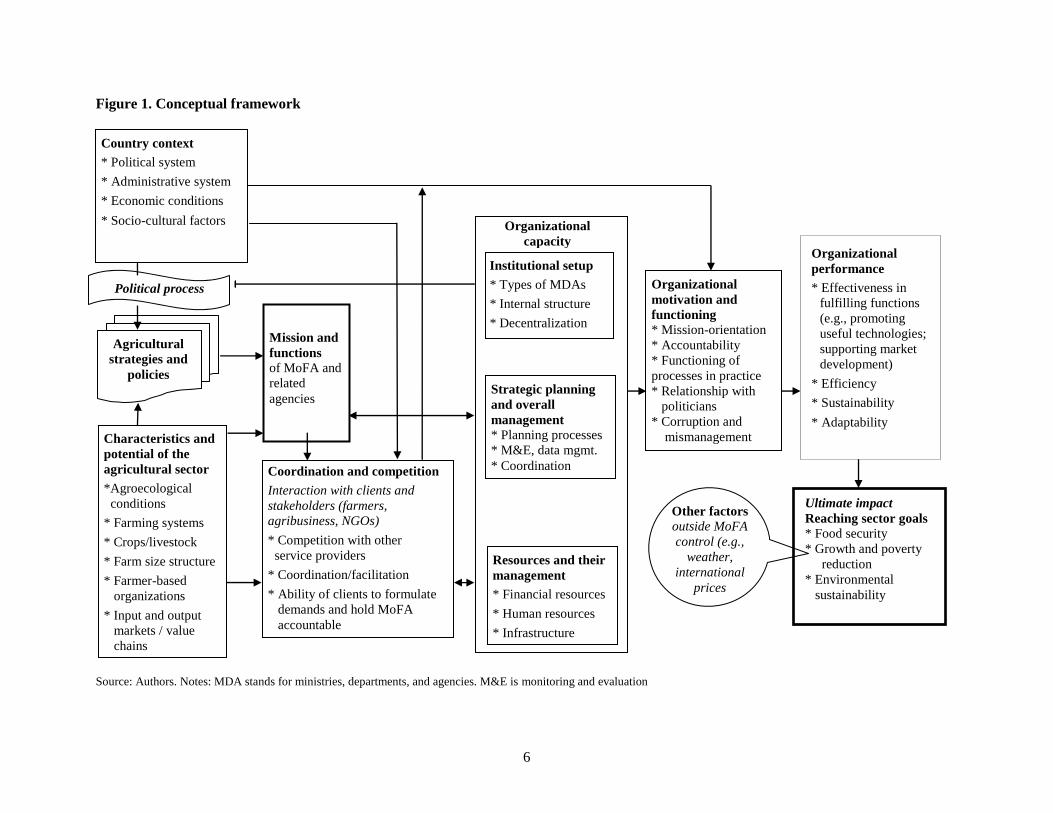
Conceptual Framework
Figure 1 presents the conceptual framework used for the review, which was adapted from standard and
agriculture-specific approaches to organizational assessment (see, for example, Lusthaus et al. 2002;
Birner and Witmer 2006). The boxes and arrows in Figure 1 indicate how context and organizational
factors affect the ability of an organization to improve its performance and achieve its ultimate impact.
Mission and Functions
The mission and functions of an organization emerge from the context in which it operates. Ideally, the
mission and functions of agriculture-related ministries, departments, and agencies (MDAs) should be
derived from the agricultural development strategy of a country, which is part of its broader development
strategy. The conceptual framework posits that these strategies and policies are influenced by (1) the
characteristics of the agricultural sector, which determine the market failures that are inherent in
agricultural development and that require public-sector intervention, and (2) the political and
administrative context in which policies are made. Ultimately, how much state involvement a country
chooses to pursue in its agricultural sector is a political choice, even though this choice has to be made in
view of economic and administrative constraints and opportunities. The MDAs themselves also influence
the process of formulating the agricultural strategy and identifying their mission and functions, as
indicated by the double arrow in Figure 1.
Organizational Capacity
The organizational capacity to perform is determined by the fit of the institutional structure to the
functions it is expected to perform (what we call the ―hardware‖), the planning and management
processes within the institution (the ―software‖), and the resources available to the organization. The
institutional structure of the sector is constituted by the types of MDAs that exist in it, their roles, and
their coordination mechanisms as well as the internal structure of individual MDAs such as MoFA. The
institutional setup of the MDAs is typically embedded in the general system of public administration, and
changes typically require a political process and change in legislation. The management processes, in
contrast, are softer and include aspects such as leadership roles and styles of managers; coordination of
multilevel planning processes, including stakeholder consultations; effective costing of budgets; use of
monitoring and evaluation systems; and information flows and coordination mechanisms within and
between MoFA and other actors. The resources available to the organization include the people that work
in the organization, the financial resources available to compensate the staff and provide them with
complementary inputs to perform their functions, and the infrastructure with which they work.
Organizational capacity also influences and is influenced by coordination and competition of the various
stakeholders within the sector, including other MDAs, donors, the private sector, alternate service
providers, and clients/farmers.
Organizational Incentives and Functioning
Whether capacity translates into performance depends on the incentives facing the organization.
Institutional reforms often neglect issues of incentives and motivation, assuming that changes to
institutional structures, management processes, resources and methods, or capacity directly lead to better
performance. It is, however, not feasible to effectively strengthen capacity without suitable incentives or
5
sanctions for good or poor performance. Organizational motivation depends on the pressure on the
organization’s leadership or staff to perform, which may come from the political realm. Likewise,
organizational culture, including its tolerance of corruption or mismanagement is an important factor that
influences how processes function in practice.
Organizational Performance
The goal of public-sector reform in agriculture is to improve the organizational performance of MDAs.
Important dimensions of organizational performance include effectiveness, efficiency, sustainability, and
adaptability.
The Ultimate Impact: Reaching Sector Goals
The performance of the MDAs influences the achievement of the agricultural sector goals, such as food
security, increased agricultural production, improved livelihoods of farm families, contribution to
economic growth, and environmental sustainability. To assess organizational performance, it is essential
to collect indicators on these ultimate outcomes. However, one needs to take into account that these
outcomes are also influenced by factors that lie outside the control of agricultural MDAs, such as weather
events and international prices.
6
Figure 1. Conceptual framework
Source: Authors. Notes: MDA stands for ministries, departments, and agencies. M&E is monitoring and evaluation
Agricultural
strategies and
policies
Characteristics and
potential of the
agricultural sector
*Agroecological
conditions
* Farming systems
* Crops/livestock
* Farm size structure
* Farmer-based
organizations
* Input and output
markets / value
chains
Country context
* Political system
* Administrative system
* Economic conditions
* Socio-cultural factors
Mission and
functions of MoFA and
related
agencies
Organizational
motivation and
functioning
* Mission-orientation
* Accountability
* Functioning of
processes in practice
* Relationship with
politicians
* Corruption and
mismanagement
Organizational
performance
* Effectiveness in
fulfilling functions
(e.g., promoting
useful technologies;
supporting market
development)
* Efficiency
* Sustainability
* Adaptability
Institutional setup
* Types of MDAs
* Internal structure
* Decentralization
Strategic planning
and overall
management
* Planning processes
* M&E, data mgmt.
* Coordination
Other factors
outside MoFA
control (e.g.,
weather,
international
prices
Organizational
capacity
Political process
Ultimate impact
Reaching sector goals
* Food security
* Growth and poverty
reduction
* Environmental
sustainability
Coordination and competition
Interaction with clients and
stakeholders (farmers,
agribusiness, NGOs)
* Competition with other
service providers
* Coordination/facilitation
* Ability of clients to formulate
demands and hold MoFA
accountable
Resources and their
management
* Financial resources
* Human resources
* Infrastructure
7
Country Context
Past Performance of Ghana’s Agriculture1
Agriculture continues to be the backbone of the economy that has recorded positive per capita GDP
growth over the last 20 years. Agriculture accounts for 40 percent of GDP and about 75 percent of export
earnings, and it employs 55 percent of the labor force (not including upstream and downstream activities
of agricultural production). As mentioned in the introduction, the agriculture sector has grown more
rapidly (at an average annual rate of 5.5 percent) than the rest of the economy, which has expanded by 5.2
percent per year in recent years (Bogotec et al. 2007). Growth in food production has outpaced growth in
population between 1995 and 2003: the Food and Agriculture Organization of the United Nations (FAO)
estimates that food production in Ghana increased by 3.6 percent, while population grew at 2.2 percent
(FAOSTAT 2006). Although food security is not determined by availability or domestic production
alone, it is encouraging to note that food deprivation has declined during this period: The number of
malnourished fell from 5.8 million in 1990–92 to 2.4 million in 2001–03; the proportion of the population
that is malnourished fell from 37 to 12 percent during the same period.
Recent agricultural growth has benefited from favorable weather conditions and world market
prices for cocoa. Although Ghana has experienced accelerated growth in the last five years, over a longer
period growth has been more erratic: between 2000 and 2005, agricultural growth rates ranged from 2.1 to
7.5 percent; between 1990 and 2006, growth rates were negative for two years and less than 4 percent for
six more years. Given these fluctuations and dependence on climatic conditions and land expansion, the
sector is expected to grow about 4.2 percent in the next decade (Breisinger et al. 2008). Agricultural
performance has not been uniform within subsectors and regionally. Forestry and cocoa subsectors grew
at double digit rates, while crops other than cocoa grew at rates ranging from 1.5 to 4.5 percent between
1991 and 2005. Regional growth has varied as well: the Northern Savannah is the main producer of
cereals and livestock, and more than 70 percent of the country’s sorghum, millet, cowpeas, groundnuts,
beef, and soybeans comes from the northern zone.
The rate of growth achieved in recent years may be difficult to sustain, as growth has mainly been
achieved through land expansion. The contribution to agricultural growth from land expansion and yield
increases varied between 1992 and 2005, but in general, land expansion contributed more than yield
increases. The yields of most crops have not increased significantly. In some cases, yield growth has even
been negative over the last 13 years, as is the case for maize, sorghum, and yam in the Northern Savannah
Zone. The yield decline is attributed to continuous cropping without adequate application of nutrients.
These conditions also limit the potential for area expansion-led growth of production. In cocoa, too, some
of the increase in production has come at the expense of destruction of valuable forests. The inability to
obtain reliable supplies of raw material of acceptable quality at globally competitive prices appears to
limit development of competitive agro-industries.
The level of adoption of technologies is still low in the country. An analysis of the Ghana Living
Standard Survey (GLSS) data for the expenditures component of this study suggests that only about 20
percent of the households had adopted various improved practices. In general, the adoption of improved
seed was highest (about 25 percent of all households), followed by chemical fertilizers (21 percent), and
pesticides—herbicides and insecticides— (18 percent). Between 5 and 10 percent used organic fertilizers
and purchased feed and veterinary services, while less than 1 percent of all households used irrigation.
If the productivity gaps are any indication, the potential for increasing productivity is
considerable. Yield gaps, the proportion of potential yields not achieved, are particularly significant for
cereals and tubers: 42 percent for maize, 38–40 percent for rice, 46 percent for millet, 56 percent for
cassava, and 67 percent for yams (Ghana, Government of 2010). Closing the yield gaps is likely to be far
more challenging in the northern region where conditions are less favorable. The productivity targets that
the country has set for different crops to achieve by 2015 are consistent with productivity levels that
1 This section draws heavily from Breisinger et al. 2008.
8
require 6 percent growth. But the rates of growth in productivity that are required are much higher than
the growth rates achieved in the past.
Ghana’s Strategy for Food and Agricultural Development (FASDEP)
A well-developed policy framework is important for setting priorities and guiding the activities of a
ministry. The policy framework also provides the reference against which the institutional performance of
a ministry can be assessed. In the last 10 years, MoFA has developed three policies: (1) the Accelerated
Agricultural Growth and Development Strategy in 1996 and (2) the Food and Agriculture Sector
Development Policy (FASDEP) in 2002, which supported implementation of (3) the Ghana Poverty
Reduction Strategy (GPRS I) 2003-2005. After four years of broader sector participation, FASDEP was
revised in 2007. The revised policy, FASDEP II, identifies the following approach as a new direction:
―The Government of Ghana now wants to have a focus in its efforts for greater effectiveness,
sustainability and equity in impacts. In particular, a few commodities will be targeted for support. A value
chain approach to agricultural development will be adopted with value addition and market access given
more attention.‖
FASDEP II explicitly recognizes the role of several ministries and organizations in transforming
agriculture, and it assigns the coordination role to MoFA. Additionally, the country’s commitment to
pursue the CAADP agenda offers an opportunity for MoFA to strengthen its leadership role.
In the draft sector plan, there is considerable emphasis on effective transfer of available
technologies and additional investments in research primarily to develop new varieties that thrive under
harsh conditions. Other frequently cited interventions include irrigation development, development of
mechanization services, value chain development, and intensification of farmer-based organizations and
outgrower schemes.
MoFA’s Mission and Functions
The vision, mission, and objectives that MoFA has articulated for itself appear broadly in line with the
emphasis on growth and value chain development in FASDEP II. The one FASDEP II objective that does
not feature strongly in MoFA’s organizational presentation relates to equity and poverty reduction. Still,
in line with the conceptual framework, one can assume that the organization’s mission is derived from
sectoral policies.
MoFA’s vision statement reads: ―The vision of the Ministry is to accelerate growth in agricultural
productivity through modernization of the sector to enhance rural development.‖ 2
The Ministry’s mission is ―to promote sustainable agriculture and thriving agribusiness through
research and technology development, effective extension and other support services to farmers,
processors, and traders for improved livelihood.‖
MoFA defined six major objectives for itself:
1. Food security and emergency preparedness
2. Increased growth in incomes
3. Sustainable management of land and environment
4. Increased competitiveness and enhanced integration into domestic and international markets
5. Application of science and technology in food and agricultural development
6. Effective institutional coordination
Considering the overall importance of the mission statement in generating a buy-in for an
organization, both internally and externally, the statement could be formulated in more detail. The
objectives are clear, but they are a mix of ultimate goals (such as food security), intermediate goals
(competitiveness), and means to achieve these goals (application of science and technology, institutional
2 The mission statement is cited on MoFA’s official website at http://mofa.gov.gh/ (accessed August 24, 2008).
9
coordination). Moreover, how the organization would go about achieving some of the objectives is not
articulated adequately. The ambiguity may lead to the Ministry taking up activities that may be better left
to the private sector.
Organizational Capacity
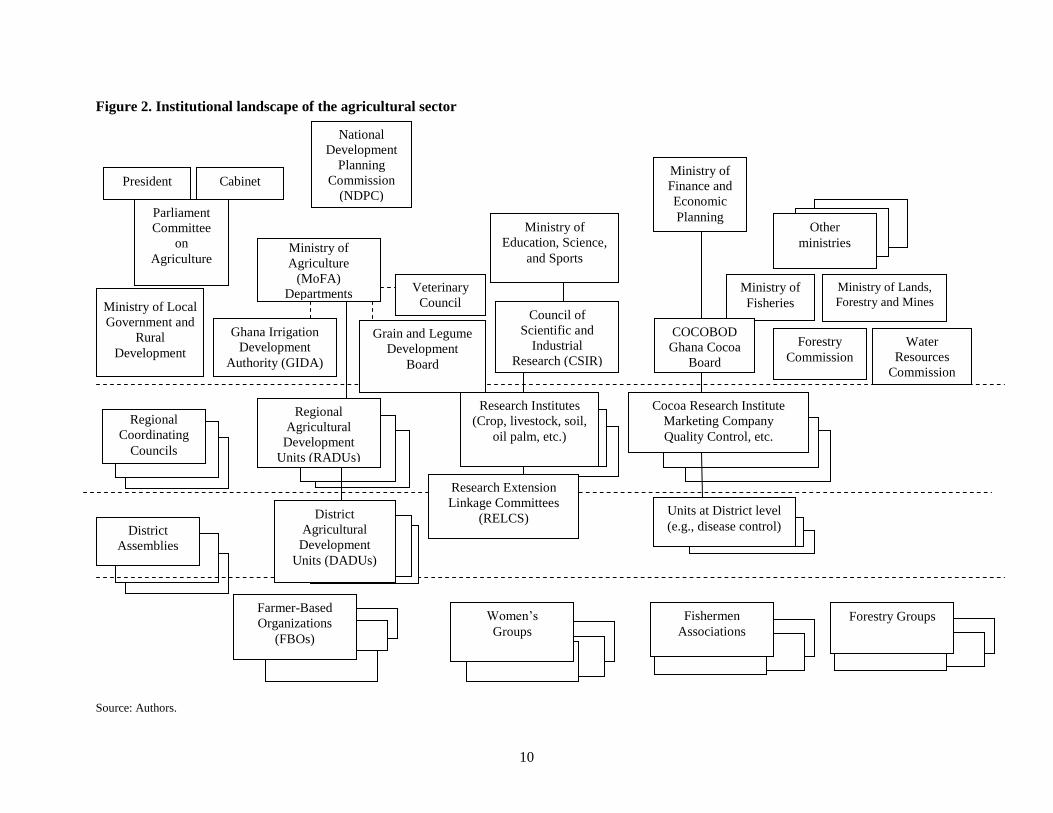
Institutional Setup: Need for Sector Coordination
As shown in Figure 2, the institutional landscape of the agricultural sector is rather complex. MoFA is the
lead agency for the agricultural sector. However, the complexity of the institutional environment in which
MoFA operates creates significant demand for horizontal coordination with numerous other
organizations:
The Ghana Cocoa Board (COCOBOD) holds the major responsibility for cocoa production
and is itself a complex organization with eight directorates and seven units, including the
Cocoa Marketing Company (Ghana), Ltd., the Cocoa Research Institute of Ghana, and the
Seed Production Unit. COCOBOD was responsible for advisory services to cocoa farmers
before this function was transferred to MoFA in 2001.
Agricultural research is organized under the Council for Scientific and Agricultural Research
(CSIR), which falls under the Ministry of Education, Science, and Sports. CSIR operates nine
research institutes related to food and agriculture.
A separate Ministry of Fisheries was created from MoFA’s domain in 2005 but reemerged
after the 2009 change of government.
The Forestry Commission, under the Ministry of Land and Forestry manages Ghana’s
forestry resources.
The Ministry for Local Government, Rural Development, and Environment is in charge of the
District Assemblies, which—in principle—subsume the DADUs, as discussed below.
The National Development Planning Commission (NDPC) is in charge of overall
development planning, including planning at the district level.
Other ministries relevant for agricultural development include the Ministry of Trade and
Industry, Private Sector, and the Presidential Special Initiative; the Ministry of Roads
Transport, especially the development of feeder roads; the Ministry of Women and Children
Affairs regarding, for example, agroprocessing support and child labor issues; and the
Ministry of Manpower, Youth, and Development, which is also involved in agricultural-
based development projects.
MoFA, in which 7,000 of the nearly 650,000 public-sector workers are employed, also has a
complicated internal structure as discussed below. In addition to seven technical directorates, it manages
four semiautonomous agencies, which are referred to as ―subvented‖ agencies in Ghana: the Ghana
Irrigation Development Authority (GIDA), the Grain and Legume Development Board, the Irrigation
Company of Upper Region, and the Veterinary Council. At the regional level, MoFA is represented by
the Regional Agricultural Development Units (RADUs) and at the district level by the DADUs.
10
Figure 2. Institutional landscape of the agricultural sector
Source: Authors.
District
Assemblies
Regional
Coordinating
Councils
Cabinet President
Parliament
Committee
on
Agriculture
Farmer-Based
Organizations
(FBOs)
Ministry of Local
Government and
Rural
Development
National
Development
Planning
Commission
(NDPC)
Women’s
Groups Fishermen
Associations
Ministry of
Fisheries
Ministry of Lands,
Forestry and Mines
Water
Resources
Commission
Forestry
Commission
Ministry of
Education, Science,
and Sports
Council of
Scientific and
Industrial
Research (CSIR)
CSIR
Research Institutes
(Crop, livestock, soil,
oil palm, etc.)
Grain and Legume
Development
Board
Veterinary
Council
Ministry of
Agriculture
(MoFA)
Departments
Regional
Agricultural
Development
Units (RADUs)
Ghana Irrigation
Development
Authority (GIDA)
District
Agricultural
Development
Units (DADUs)
Research Extension
Linkage Committees
(RELCS)
Forestry Groups
Cocoa Research Institute
Marketing Company
Quality Control, etc.
Units at District level
(e.g., disease control)
Ministry of
Finance and
Economic
Planning
COCOBOD
Ghana Cocoa
Board
Other
ministries
20
According to the information collected for the review, the Ministry makes a significant effort to
involve various organizations in its planning activities and to identify the linkages that are required to
effectively implement different activities. Ensuring coordination in the implementation, of programs,
however, seems to be a challenge. For example, MoFA had little or no input in the implementation of
crop-based Presidential Special Initiatives (cassava and oil palm) formulated and implemented under the
Ministry of Trade and Industry, Private Sector, and Presidential Special Initiative, according to a retired
director of the relevant directorate in the Ministry. Likewise, there was very little collaboration between
MoFA and the Ministry of Lands, Forestry in implementing the country’s agroforestry programs. Under
FASDEP I, MoFA proposed to create an interagency committee to include representatives of the private
sector to act as a national agricultural advisory committee for the sector that would oversee resource
allocations, but the committee was not established.
Challenges of Decentralization
Along with a complex external institutional environment, MoFA’s internal structure has become
increasingly complex due to pressures to decentralize.
MoFA’s current structure is partially dictated by Ghana’s public-sector reforms. Like other
ministries, MoFA has four line directorates as stipulated in the civil service law, the 1993 Provisional
National Defence Council Law (PNDCL) 327, sec. 12 (1): Finance and Administration; Policy Planning,
Monitoring, and Evaluation Directorate; Human Resource Development and Management; and Statistics,
Research, Information, and Public Relations. MoFA has seven agriculture-specific technical directorates:
(1) Crop Services, (2) Agriculture Extension Services, (3) Plant Protection and Regulatory Services, (4)
Agricultural Engineering Services, (5) Animal Production, (6) Veterinary Services, and (7) Women in
Food and Agricultural Development. MoFA is also in charge of the four subvented organizations
mentioned above.
In addition, MoFA has embarked on a significant effort to decentralize its administration,
following national efforts to decentralize the civil service that began with the promulgation of PNDCL
327. MoFA’s decentralized structure now comprises 10 RADUs and 138 DADUs. While
decentralization has met with considerable resistance from the bureaucracy in many sectors (G-JAS
2007), MoFA is in fact one of the ministries that has actively pursued decentralization.
A detailed Handbook on the Roles and Responsibilities of MoFA Staff under Decentralization
(MoFA 2005) was written to clearly outline the assignment of functions to different levels in an effort to
deal with the tension between national-level coordination and local adaptability inherent in
decentralization of the agricultural sector. The division of responsibilities is laid out as follows:
The national directorates are assigned the roles of policy formulation, program planning,
facilitation, technology sourcing, promotion of market accessibility, exercise of oversight
responsibility over the regions, and coordination and evaluation of outcomes.
The RADUs are responsible for coordination and monitoring of agricultural programs and
projects in the regions and districts and also for backstopping the DADUs. The 10 RADUs
are headed by regional directors, who manage a staff of regional agricultural officers.34
The DADUs are the service delivery units and are assigned the role of managing projects and
programs, decentralizing planning, and implementing national agricultural policies and
decisions at the district level. The districts report to the regions but receive funds directly
from the center, thus diminishing the regional oversight function. They are headed by district
directors, a position created by decentralization, who manage a staff of district development
officers (holders of at least a diploma certificate), andAEAs.
3 The position of the Subject Matter Specialist was abolished due to unclear responsibilities.
21
Before decentralization in 1997, MoFA was organized hierarchically along departmental lines as
follows: (1) head office, (2) technical departments, (3) regional offices (officers had allegiance to
technical departments), and (4) district offices (officers reported to regional technical heads). Decisions
regarding planning and implementation were made at the head office. All the technical departments were
replicated in regions and districts; in all the districts there were officers of the various technical
departments. Regional directorates functioned as intermediaries, transferring information in both
directions: they offered technical backstopping and supervision and controlled the flow of funds to some
extent. Each technical department planned its activities more or less independently with little
coordination with other departments. While the Ministry had a tendency under this structure to
implement disjointed interventions--each of the technical departments had autonomy to design and
implement their projects without cross-departmental coordination–members of senior management
perceived that accountability within the organization was high. Accountability to the directors based in
Accra was clearer and communication flowed easier when instructions could be handed down a clear
vertical chain of command that encompassed a group of people that shared the same technical
specialization.
Restructuring diminished the role of the technical departments, as project and program
implementation is now assigned to the RADUs and DADUs. Under the new structure, the functional units
of the technical departments do not exist at the regional and district levels. The technical directorates are
now independent cost centers that are accountable for tasks that are quite different from services delivered
through districts and regions (except that they may implement projects housed in them).5 Under the new
system, the accountability of district and regional offices to the Office of the Chief Director has increased,
while their accountability to the technical directorates has decreased, since the technical directorates that
were ―line‖ organizations before have become ―staff‖ organizations. The wider range of responsibilities
held by district staff has also made their objectives less clear.
The distinctions between the old and new structures are important because our discussions with
the staff suggest that they continue to believe that the previous structure was far superior, and therefore,
they are not fully committed to making the new structure work. The new structure has two advantages:
the organization is potentially more accountable to local governments, and decentralized planning that is
responsive to local needs becomes more feasible. But the structure is managerially challenging as
institutions need to be crafted to facilitate the required interaction between technical and implementation
units.
Strategic Planning and Overall Management
Structural changes need to be associated with corresponding changes in management processes to
produce results, especially considering that much of MoFA’s institutional structure is fixed by broader
public-sector reform processes. Those units, such as the technical directorates, that have been moved to
the periphery of the structure could nevertheless be strongly tied into the accountability flows of the
organization through appropriate management processes. This section looks at MoFA’s ―software‖— the
processes and practices that govern the flow of directions, knowledge, information, and accountability
throughout the organization. The study finds that, overall, process changes have not accompanied the
dramatic structural changes described above, to the detriment of organizational performance.
Implications of Decentralization for MoFA’s Management Processes
The decentralized structure of MoFA results in a number of management challenges:
The decentralized units now have greater control over planning and delivery of services in
their units. But they are challenged to reconcile these local priorities, which may have been
identified through extensive participatory processes, with national priorities and strategies
5 Veterinary services where specific functions are performed by district-level officers are an exception. Such services are
directly related to objectives of service provision in veterinary and animal production technical directorates.
22
such as FASDEPII. What complex iterative planning processes are required to develop
higher-level strategies that adequately reflect local priorities, particularly concerning budget
processes?
The technical capacity required for finding solutions to certain agroecological or marketing
problems may exist only in the technical directorates. What mechanisms are required to
ensure that the decentralized units bring the technical capabilities in the organization to bear
in solving those problems?
As the technical directorates take on a supporting role in technology transfer, how can they
ensure that their activities are effectively addressing the problems faced by decentralized
units? How can they be kept relevant and responsive?
The district units may not have much interest in national ―public goods‖ such as disease
surveillance or data collection. How can MoFA ensure that decentralization does not affect
the performance of tasks that are in the national interest?
Prior to decentralization, staff members in districts and regions had control over funds or had
funds allocated to them. This control is now concentrated among district and regional
directors, apart from project directors. Not all district and regional agriculture officers are
guaranteed what they consider their fair share of allocations. Lopsided allocations may reflect
local priorities. How can rational allocations be ensured? What should be done if local
priorities deviate from staff specializations?
MoFA has made important efforts to meet these challenges, especially in response to the last
MoFA review, which focused on decentralization and recommended that to improve overall efficiency in
service delivery and increase the morale of its staff, MoFA needs to (1) improve its organizational
structure and review job descriptions, (2) adopt a more consultative and transparent management and
leadership style, and (3) improve resource allocation by shifting resources from the national level to
regions and districts. As indicated above, MoFA has developed a detailed handbook on the roles and
responsibilities of MoFA staff under decentralization (MoFA 2005), and the reporting system, which had
almost broken down, has improved considerably. However, the evidence collected for this study suggests
that considerable management challenges remain. Problems still exist in the following areas:
Technology assessment processes. The technical directorates, which do not themselves engage in
any research, are responsible for assessing technologies for promotion through the extension system.
They may select technologies available on the shelf for suitable applications, or they may commission
research organizations to develop technologies to address particular problems or opportunities. They are
also expected to test available technologies for suitability under different conditions, usually in
collaboration with research organizations.
The study did not find evidence of periodic assessment of the technologies that are promoted by
the extension staff. The maize production guide that was produced in the late 1990s, for example,
suggests that the cultivation of Obatampa, a popular variety of maize, yields about 18 bags per acre with
recommended practices. However, the baseline studies conducted for a Food Crop Development Project
suggest that Obatampa yields increased from an average of 4.5 bags per acre to only 9–10 bags in the
selected districts in which the program was implemented. Technology development and assessment needs
to be a continuous process that ensures a supply of productivity-enhancing technologies that are profitable
for farmers.
DADUs and the RADUs disseminate the technologies, with the regions coordinating and
monitoring the activities of DADUs. The RADUs also play a role in technology development through the
organization of Research Extension Linkage Committees (RELCs) that bring together farmers and other
stakeholders with the Ministry and the research community. The objective is to influence the priorities of
researchers by providing an opportunity for farmers and other stakeholders to articulate their needs.
Additional measures such as competitive grants are also used to create incentives for researchers to
develop technologies that are appropriate.
23
Relation of technical directorates to service delivery units (DADUs). As noted, the position of the
technical departments does not allow them to directly play the role they could in promoting MoFA’s
mission. They have been moved from line positions, in which they were directly involved in the delivery
of services, to staff positions in which they play a supportive role. Their staff feels largely sidelined, as a
consequence. In particular, the possibilities of the staff in the technical directorates to effectively interact
with district-level staff are limited since they are no longer able to instruct DADU staff to perform
specific tasks or reach specific goals. This sidelining has diluted the accountability of the technical
directorates for bringing about technical change in the sector. At the same time, it has diminished the
upward accountability of the field staff, without, however, replacing it with stronger accountability to
either the farmers or locally elected government members (see below). As a consequence, extension has
become technically weaker under this system.
The nature of technologies that are being demonstrated indicates this technical weakening. On
the basis of discussions with DADU staff and review of reports, the study team found that the
technologies demonstrated are usually simple practices that may not require farmers to buy additional
inputs, such as planting maize in rows. Other commonly demonstrated technologies are proper use of
agrochemicals, adoption of improved crop varieties, improved seed multiplication methods, pest and
disease control, and soil fertility improvement.
These are useful technologies that can help maintain productivity and improve natural resource
management, and training in them can provide needed information to farmers. However, there is limited
value in focusing on separate components of technologies —the use of certified seeds without fertilizers,
fertilizer application without the use of certified seed, or row planting without the use of fertilizers or
certified seeds may not lead to substantial increases in yield and profitability. In fact, this does not seem
to be the most effective way to transform agriculture. Significant technical changes are usually achieved
through the adoption of complementary inputs. While introducing components to farmers may be a useful
strategy to move them toward the adoption of total packages, inadequate demonstration of the benefits of
adopting the total package may not lead them to make that jump.
Apart from the absence of technological packages that are attractive, the situation may also be
caused by the absence of strategic direction to field staff or insufficient backstopping by technical
directorates.
The extension staff does not appear to receive adequate direction as to what crops to focus on and
what technologies to promote. Recent policy, however, does identify the crops to focus on, particularly
the staples to enhance food security. Beyond this, strategies are unclear on the kinds of technologies that
should be employed to increase productivity of these crops. Discussions with staff suggest that the kind of
guidance and clarity of purpose that was often present when National Agricultural Extension Projects
(NAEPs) were implemented is now absent in the day-to-day operations of the Ministry.
Apart from project activities, for which they get clear directions from project management, AEAs
seem to play a significant role in determining their day-to-day activities. They identify activities that they
perceive will meet the needs of farmers. About a third of the staff surveyed in the case-study districts
agree with the statement that the work plans that they develop may not have much to do with the work
plans that are drawn up at the beginning of the year. A significant portion of them also suggest that they
get clear directives from above. These two statements, however, are not contradictory, since they relate to
different aspects of their work. For example, such directives may relate to the targets to be achieved,
rather than to the content of the work that needs to be done. Quarterly fund disbursements may be delayed
two to three months in reaching the DADUs, which makes it difficult for the district staff to implement
whatever plans they may have had. Not having adequate resources to pass on to AEAs also makes it
difficult for supervisors to demand that certain activities be carried out. Under these circumstances, staff
does the best they can to keep themselves busy.
An example of an activity undertaken in a district without adequate backstopping is the
introduction of guinea corn in one of the districts visited. The staff decided to introduce guinea corn in the
district because the crop can perform well in conditions harsher than those required for maize cultivation.
This is a good example of an extension service finding a technical solution to a local problem, but the
24
DADU undertook this activity without involving either the regional office or the technical directorate. A
staff member who had traveled to the north obtained some seeds for distribution in the district. It is not
clear to what extent they made effective use of expertise in the organization or assessed the outcome,
feeding the results into larger strategies relating to the potential for introducing new crops under different
environments.
Relation of technical directorates to MoFA’s leadership. A problem related to the limited
interaction between technical departments and DADUs is that the Ministry’s leadership at the time of this
assessment appeared to bypass the technical directorates in implementing programs. In interviews, staff
of the technical directorates noted the decline in their interactions with the minister’s and chief director’s
offices. In particular, staff expressed serious concern that many programs were initiated and implemented
by the two offices without discussion with either the technical directorates or the planning unit in the
Ministry. Thus, they sensed that core functions of the Ministry were becoming ―nontechnical.‖ It may
well be that the difficulty of going through lengthy processes under pressure for results has led to a
tendency to bypass mid-level management. However, bypassing the technical staff leads to the
underutilization of one of MoFA’s most important assets--its technical expertise and experience.
Therefore, making the process of dealing with the technical directorates more effective is an important
area for improvement.
Internal communication and coordination. Effective internal communication, which is key for
any organization, is essential for an organization like MoFA that operates all over the country, including
the remotest areas. Nevertheless, the results of the review indicate that a culture of documenting and
sharing information is not predominant within MoFA. This may be linked to a broader management
culture in Ghana, which places more emphasis on personal relations and interactions than on institutional
procedures. In fact, meetings seem to substitute for routine processes that could achieve the same
objective. As a consequence, meetings and travel seem to take an inordinate share of the time of senior
managers. Information technologies, especially email, intranet, and internet, which could make
communication over space more effective and more inclusive, have not been introduced in a consistent
manner.
Relations between DADUs and District Assemblies. The thrust of the decentralization policy was
to make regional and district units much more autonomous, to make them accountable to respective local
governments, and ultimately, to integrate them with the local governments. A 2002 review of MoFA
found that these goals had not been achieved at that time. Rather the review characterized MoFA as a
deconcentrated organization because lines of accountability remained largely within the Ministry, rather
than with local authorities. The current study finds that in 2008, the situation remains essentially the
same. The official linkages between DADUs and the District Assemblies are mostly concentrated in the
person of the district director of agriculture and relations vary considerably between districts. The actual
relations depend not only on the initiative of the district directors, but also on the extent to which District
Assemblies are pro-active in involving sector departments in their planning and making use of the
respective institutional coordination bodies and procedures. AEAs interact frequently with District
Assembly members in their operational areas but mostly to gain their support in setting up meetings or
similar activities. This does not imply that extension staff is accountable to Assembly members.
At the same time, the lagging institutional integration of the DADUs with the District Assemblies
is not largely the fault of MoFA, even though the Ministry could do more from a management perspective
to foster a closer relationship. Rather, institutional integration has not happened because Ghana, in
general, has not moved ahead with regard to implementing decentralization. In particular, a Local
Government Service, which was mandated in the Local Government Act of 1993 to make the DADU staff
accountable to the District Assemblies, has not yet been implemented. Also, a composite budget, which
would reflect an aggregate budget for all line ministries and local government units operating within a
district, has only been implemented on a pilot basis.
That the Ministry apparently has not taken far-reaching steps to sensitize field staff about future
decentralization plans is of significant concern. Only half of the MoFA district staff interviewed for the
ISSER–IFPRI survey had ever heard about plans to make MoFA staff part of the Local Government
25
Service. Those who heard about it were mainly concerned about problems such as increased political
interference and deteriorating working conditions. Yet there seems to have been little discussion on how
such problems could be avoided. It might be useful if MoFA management would communicate internally
more comprehensively on these issues, in order to assuage the field staff’s concerns about what
decentralization will mean to their careers and performance of their functions. It is not clear whether
change management teams have been installed to help staff understand and cope with structural changes,
as recommended in an earlier review.
Planning, Data Management, Monitoring, and Evaluation Functions
In order to fulfill its mission and make sure that Ghana reaches its goals for the agricultural sector, MoFA
needs to be able to plan strategically, to collect adequate information about the development of the sector,
to evaluate the outcomes of its efforts and that of other agricultural MDAs on a regular basis, and to
adjust its operations accordingly. Reaching sectoral growth targets requires the ability to analyze what
MoFA actually can do to increase productivity in areas where farmers’ incentives to adopt new
technologies are low. The Ministry needs to be able to identify the most binding constraints and
concentrate strategically on removing them, while promoting the most promising options. With a Policy
Planning, Monitoring, and Evaluation Directorate and a Statistics, Research, Information and Public
Relations Directorate, MoFA has the institutional setup to fulfill these tasks.
The evidence collected for this review indicates substantial improvements but also important
remaining challenges regarding MoFA’s processes for strategic planning, data management, and
monitoring and evaluation. The 2002 review found that the reporting system had almost broken down. In
response, MoFa has made substantial efforts to improve its reporting system. This review found that
timely reporting has improved considerably, and a monitoring and evaluation culture in fact has taken
root. Thus controls are adequate in the Ministry down to the field staff level to get done the things in
which the Ministry is interested. However, the potential for monitoring and evaluation to contribute to
reaching sector goals is still not fully used for two reasons: first, there is little emphasis on linking
activities to outcomes. Second, the information collected is hardly used for management and control
purposes. The reports focus on the achievement of targets for activities/outputs without paying adequate
attention to the effectiveness with which the activities are carried out and their contribution to achieving
the objectives. For example, the number of contacts with farmers is reported but not adoption rates or
yield or income increases. The findings of the review suggest that the country’s political leadership holds
the Ministry as a whole accountable for avoiding food security crises, but accountability for reaching
other goals seems to be rather limited. Likewise, the findings of the review suggest that the lines of
accountability within MoFA are not geared toward reaching those goals. For example, there are planning
procedures that require districts to formulate goals for increases in production that are in line with
national planning figures. However, the study did not find evidence that the DADUs are held accountable
for meeting these goals. Hence, there is little incentive to translate them into goals for AEAs and to follow
up accordingly.
The review findings also indicate that the quality and reliability of the data collected are
questionable, and that there is a lack of quality checks in the system. For example, district development
officers (DDOs) are supposed to supervise AEAs and conduct verification checks on information
submitted by AEAs at the DADU level before submission to the district Management Information System
(MIS) officer. However, such supervision and data verification in the field seems very limited. The
reasons given for not carrying out these tasks include lack of funds to purchase fuel for motorbikes and
other travel expenses. Generally, use of information for management decisionmaking seems limited at all
levels. At the district level, for instance, the existing data management system is not optimally used by
the district directors of food and agriculture (DDAs), and there is very little evidence of information flow
back from the regional MIS officers to the District Directorate or from the District Directorate to the
AEAs.
26
Planning in an era of decentralization is also a challenge. In decentralization theory, planning is
seen as a politico–technical dialogue and process in which community participation and intersectoral and
interdisciplinary collaboration are integral parts of the process, involving monitoring and evaluation of
implementation to provide effective feedback. This mode of planning is at variance with traditional highly
centralized planning in Ghana which has been national in scope and sectoral in nature. Relatedly, how
can the Ministry make sure that decentralized planning helps meet the goals of the sector, as defined in
the policy framework?
Planning procedures can play an important role in this regard, and MoFA has in fact devised
planning processes that require districts to take national sector goals into account. The RADUs are
expected to play a major role in coordinating district-level planning and aligning it with national goals.
However, this review indicates that MoFA has not yet been able to gear its decentralized machinery
effectively toward reaching national goals. For example, the DADU staff members interviewed for the
ISSER–IFPRI survey listed targets for their work that had no clear connection to the agricultural sector
goals as specified in FASDEP. Only one interviewee mentioned increasing production as a target.
Another reason for the limited orientation to outcome and results of MoFA is the use of
monitoring and evaluation indicators. FASDEP II lists almost 60 indicators that the Ministry should
monitor. Collecting and managing information on such a broad range of indicators is challenging, and the
opportunity cost of collecting such an aggregate may not be efficient. The donor community, which has a
strong influence on these indicators, has contributed to problems in this regard. MoFA should instead
focus monitoring and evaluation reporting by strategically selecting a few key outcome-related indicators
in addition to selected key output-oriented indicators. Moreover, there is a need to ―mainstream‖
monitoring and evaluation indicators with other management processes by making them relevant for
managers as a source of information to perform their tasks more effectively. It would be useful to have
indicators that are relevant for managers in districts and regions to monitor the activities and outcomes.
Going beyond the traditional production focus in agricultural extension, the Ministry has adopted
value chain development as a strategy. But there isn’t a clear understanding of how value chain
development, particularly one that is led by the private sector, should be put into operation. There are
instances where activities have been coordinated that contribute to private-sector value chain
development. For example, East Dangme DADU, along with the representatives of a farmer organization,
assisted local tomato producers in negotiating contracts and prices with the local tomato-processing
company. Another example is the Ministry’s efforts to supply planting material that would facilitate
private-sector exports of pineapple from the country. On the basis of these experiences, protocols should
be developed to guide the Ministry in building on private-sector initiatives to improve its own
effectiveness.
Resources
MoFA has approximately 7,000 employees, of whom nearly 6,000 are located in regional and district
offices. Ghana’s farmers-to-extension agent ratio (1:1,500) is not unfavorable compared with other
African countries. However, districts report many vacancies. Each district office is expected to have
eight district agricultural officers (DAOs) and a number of AEAs proportional to district size. Two of the
four districts studied had five DAOs and one had only four. AEA vacancies were especially high in the
following districts: District S1 (9 out of 28), District T1 (10 out of 22), District W2 (16 out of 32). Due to
staff limitations, only about 56 percent of the operational areas have designated AEAs. DADUs
commonly deal with such staff shortages by neglecting services to more remote parts of the district,
which is problematic from an equity perspective.
If the vacancies in these districts are representative, filling all positions in the service delivery
units would require a near doubling of staff strength, which is a politically and economically untenable
demand. However, this review suggests that there is scope for MoFA to make better use of its current
staff through efficient management processes, especially those in supervisory positions. In addition, if
districts had access to more physical resources to supplement their human capital (as discussed further
27
below), they could make much more efficient use of the staff they currently employ. Most of the existing
employees have the technical qualifications required for their jobs and also they perceive that they have
the necessary knowledge and capabilities (according to the ISSER–IFPRI survey).
At the same time, the study found that there is scope for using training more effectively to
improve field-level service delivery. The bulk of training offered is concentrated among staff at higher
levels and closer to Accra, as noted in an earlier study (Babu et al. 2007). AEAs in the study districts
attended training sessions only once every 2 to 10 years, often for only a week or less. Furthermore,
MoFA does not seem to have well-established practices that enable others to learn from those who receive
training. Staff members complain that even the mentoring that was the practice in the past is no longer the
case; recruits are sent directly to villages without adequate orientation or training. With poor technical
backstopping, opportunities for learning on-the-job are also limited. Considering that knowledge
dissemination is one of the major tasks for which MoFA maintains a large workforce of AEAs, the failure
to provide adequate knowledge to this group indicates an inefficient use of existing capacity.
One method of supplementing public service providers—outsourcing extension services to NGOs
and private providers—has been tried, but this approach did not leverage additional human resources for
extension, since service providers used to pay existing MoFA staff to provide the services, thus topping
up their salaries.
MoFA has undertaken important steps to make better use of its human resources, within the
constraints posed by general civil service policies. However, there is still room to go beyond current
efforts
Management of Information on Human Resources
Recognizing the importance of having available adequate information on human resources, the Ministry
has set up a unit dedicated to this purpose. However, processes that enable this unit to manage effectively
have not been initiated and, therefore, basic information on the number and capabilities of staff in the
Ministry is not available immediately. This affects the ability of the Ministry to effectively target training
or capacity development funds. It also makes it difficult for the Ministry to predict the retirement of
senior staff and put into place succession plans using well-trained individuals that are not close to
retirement.
Staff Performance Assessments and Promotion
According to the staff survey, performance appraisals are largely perceived to be fair by MoFA staff.
However, the survey also suggests that MoFA is not making effective use of performance assessments to
ensure merit-based promotion and to bring sanctions and incentives for organizational performance.
Performance assessments are not made regularly in the Ministry; often they are done only when staff
members apply for promotions.
With respect to staff advancement, delayed promotions are identified as a significant performance
disincentive in the Ministry. The common expectation, however, that everyone with satisfactory
performance will be promoted every three years is unreasonable as there may not be adequate open
positions (see MoFA 2005b). Even so, our data suggest that promotions between grades often do occur
within three to four years, despite staff perceptions otherwise. There is some concern with regard to
gender equity in promotion. While 86 percent of the male respondents believe that male and female
MoFA employees have equal opportunities for promotion, only 46 percent of the interviewed female staff
believe that this is the case.
Salary and Pay Scales
Being part of the general public administration pay scale, MoFA has limited possibilities to use salary
incentives to motivate its staff. Yet a large majority of MoFA staff in our sample believe they are paid
too little to maintain a decent standard of living and paid less than staff in other departments who do
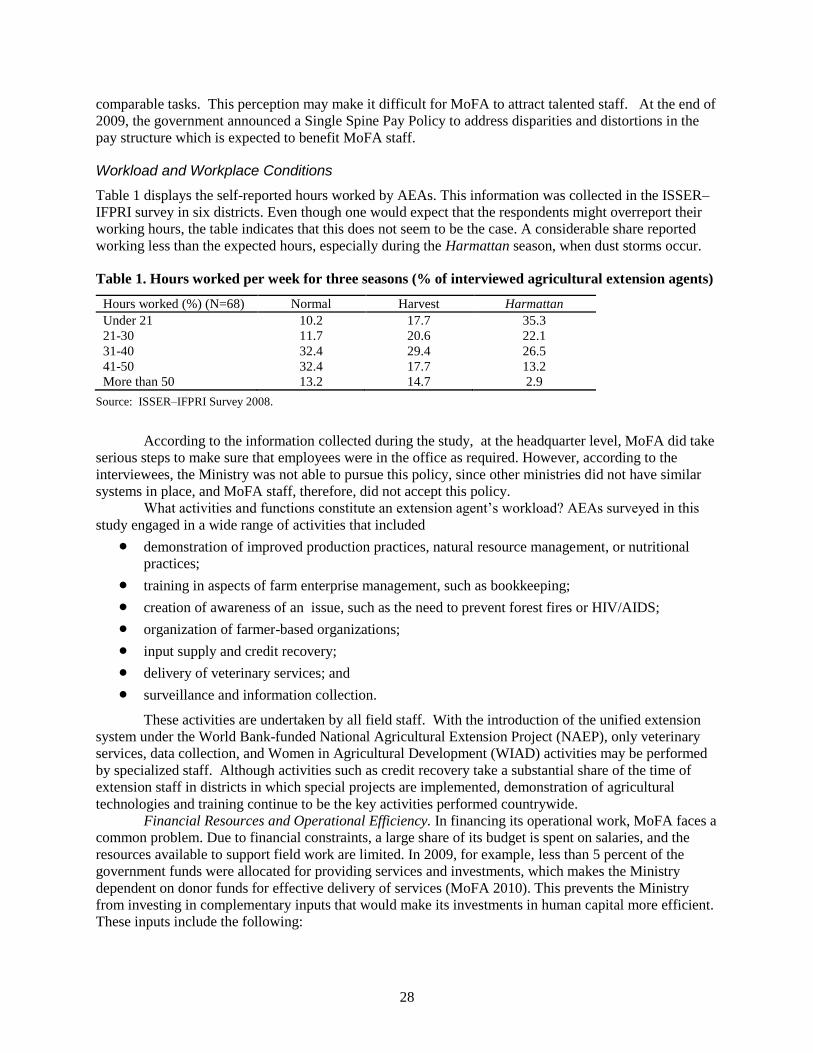
28
comparable tasks. This perception may make it difficult for MoFA to attract talented staff. At the end of
2009, the government announced a Single Spine Pay Policy to address disparities and distortions in the
pay structure which is expected to benefit MoFA staff.
Workload and Workplace Conditions
Table 1 displays the self-reported hours worked by AEAs. This information was collected in the ISSER–
IFPRI survey in six districts. Even though one would expect that the respondents might overreport their
working hours, the table indicates that this does not seem to be the case. A considerable share reported
working less than the expected hours, especially during the Harmattan season, when dust storms occur.
Table 1. Hours worked per week for three seasons (% of interviewed agricultural extension agents)
Hours worked (%) (N=68) Normal Harvest Harmattan
Under 21 10.2 17.7 35.3
21-30 11.7 20.6 22.1
31-40 32.4 29.4 26.5
41-50 32.4 17.7 13.2
More than 50 13.2 14.7 2.9
Source: ISSER–IFPRI Survey 2008.
According to the information collected during the study, at the headquarter level, MoFA did take
serious steps to make sure that employees were in the office as required. However, according to the
interviewees, the Ministry was not able to pursue this policy, since other ministries did not have similar
systems in place, and MoFA staff, therefore, did not accept this policy.
What activities and functions constitute an extension agent’s workload? AEAs surveyed in this
study engaged in a wide range of activities that included
demonstration of improved production practices, natural resource management, or nutritional
practices;
training in aspects of farm enterprise management, such as bookkeeping;
creation of awareness of an issue, such as the need to prevent forest fires or HIV/AIDS;
organization of farmer-based organizations;
input supply and credit recovery;
delivery of veterinary services; and
surveillance and information collection.
These activities are undertaken by all field staff. With the introduction of the unified extension
system under the World Bank-funded National Agricultural Extension Project (NAEP), only veterinary
services, data collection, and Women in Agricultural Development (WIAD) activities may be performed
by specialized staff. Although activities such as credit recovery take a substantial share of the time of
extension staff in districts in which special projects are implemented, demonstration of agricultural
technologies and training continue to be the key activities performed countrywide.
Financial Resources and Operational Efficiency. In financing its operational work, MoFA faces a
common problem. Due to financial constraints, a large share of its budget is spent on salaries, and the
resources available to support field work are limited. In 2009, for example, less than 5 percent of the
government funds were allocated for providing services and investments, which makes the Ministry
dependent on donor funds for effective delivery of services (MoFA 2010). This prevents the Ministry
from investing in complementary inputs that would make its investments in human capital more efficient.
These inputs include the following:
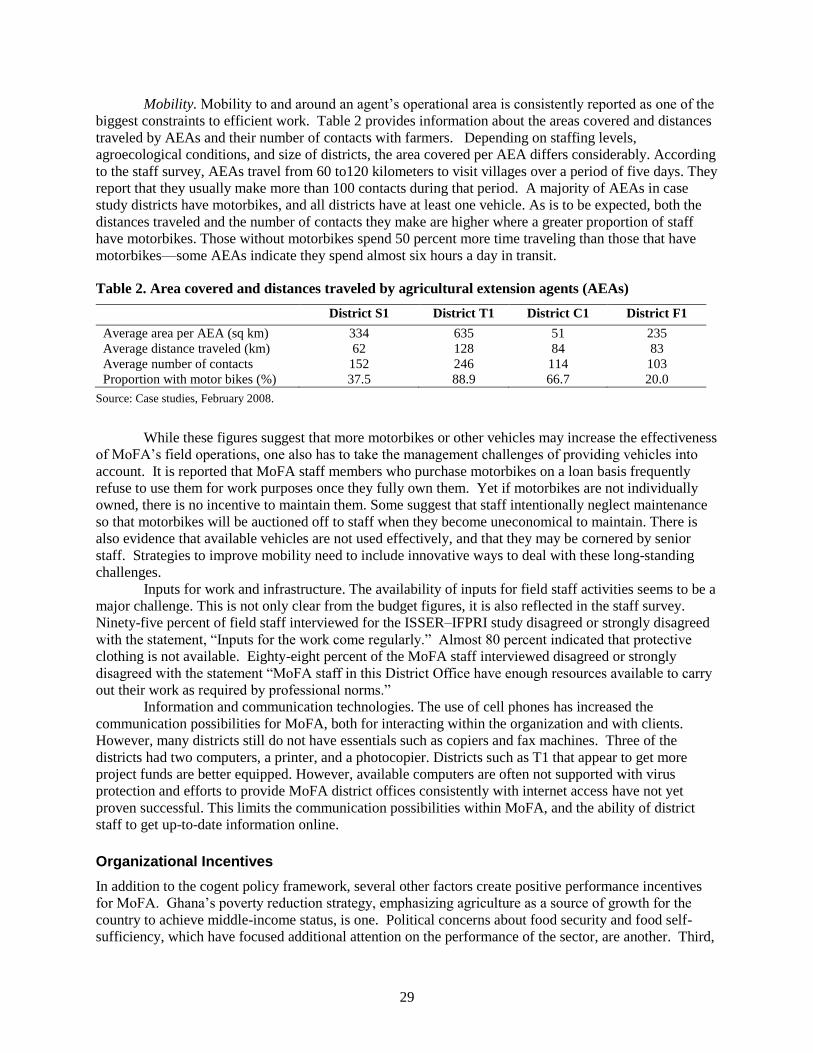
29
Mobility. Mobility to and around an agent’s operational area is consistently reported as one of the
biggest constraints to efficient work. Table 2 provides information about the areas covered and distances
traveled by AEAs and their number of contacts with farmers. Depending on staffing levels,
agroecological conditions, and size of districts, the area covered per AEA differs considerably. According
to the staff survey, AEAs travel from 60 to120 kilometers to visit villages over a period of five days. They
report that they usually make more than 100 contacts during that period. A majority of AEAs in case
study districts have motorbikes, and all districts have at least one vehicle. As is to be expected, both the
distances traveled and the number of contacts they make are higher where a greater proportion of staff
have motorbikes. Those without motorbikes spend 50 percent more time traveling than those that have
motorbikes—some AEAs indicate they spend almost six hours a day in transit.
Table 2. Area covered and distances traveled by agricultural extension agents (AEAs)
District S1 District T1 District C1 District F1
Average area per AEA (sq km) 334 635 51 235
Average distance traveled (km) 62 128 84 83
Average number of contacts 152 246 114 103
Proportion with motor bikes (%) 37.5 88.9 66.7 20.0
Source: Case studies, February 2008.
While these figures suggest that more motorbikes or other vehicles may increase the effectiveness
of MoFA’s field operations, one also has to take the management challenges of providing vehicles into
account. It is reported that MoFA staff members who purchase motorbikes on a loan basis frequently
refuse to use them for work purposes once they fully own them. Yet if motorbikes are not individually
owned, there is no incentive to maintain them. Some suggest that staff intentionally neglect maintenance
so that motorbikes will be auctioned off to staff when they become uneconomical to maintain. There is
also evidence that available vehicles are not used effectively, and that they may be cornered by senior
staff. Strategies to improve mobility need to include innovative ways to deal with these long-standing
challenges.
Inputs for work and infrastructure. The availability of inputs for field staff activities seems to be a
major challenge. This is not only clear from the budget figures, it is also reflected in the staff survey.
Ninety-five percent of field staff interviewed for the ISSER–IFPRI study disagreed or strongly disagreed
with the statement, ―Inputs for the work come regularly.‖ Almost 80 percent indicated that protective
clothing is not available. Eighty-eight percent of the MoFA staff interviewed disagreed or strongly
disagreed with the statement ―MoFA staff in this District Office have enough resources available to carry
out their work as required by professional norms.‖
Information and communication technologies. The use of cell phones has increased the
communication possibilities for MoFA, both for interacting within the organization and with clients.
However, many districts still do not have essentials such as copiers and fax machines. Three of the
districts had two computers, a printer, and a photocopier. Districts such as T1 that appear to get more
project funds are better equipped. However, available computers are often not supported with virus
protection and efforts to provide MoFA district offices consistently with internet access have not yet
proven successful. This limits the communication possibilities within MoFA, and the ability of district
staff to get up-to-date information online.
Organizational Incentives
In addition to the cogent policy framework, several other factors create positive performance incentives
for MoFA. Ghana’s poverty reduction strategy, emphasizing agriculture as a source of growth for the
country to achieve middle-income status, is one. Political concerns about food security and food self-
sufficiency, which have focused additional attention on the performance of the sector, are another. Third,

30
budgetary processes increasingly involve Parliament, which appears to use a ministry’s perceived
effectiveness in delivering growth and other benefits to determine budget share. Sector budget support
from donors is also contingent on meeting some performance triggers. Finally, further fiscal
decentralization, if implemented, can create competition for agricultural funding at the district level,
which may generate additional incentives for MoFA to produce tangible benefits in order to be able to
compete with other sectors, especially the social sectors, for District Assembly funds.
MoFA is making some efforts to increase accountability of various units in the organization. The
annual ―performance review‖ workshops that are held, to which donors and other stakeholders are also
invited, are examples of such efforts, but whether these workshops will compensate for processes that
need to be routine within the organization is an important question. The presentations made at the
performance reviews indicate that the Ministry has taken to heart the development of plans, setting up of
targets, and assessing performance in relation to targets.
Earlier reviews of MoFA, such as the 2002 decentralization review, found that staff morale was
generally low, especially at district and regional levels. In contrast, this assessment found that staff
morale, in spite of the problems discussed above, is not as low as earlier reviews suggest. Two-thirds of
district staff say that they are satisfied with their jobs. While salary can act as a disincentive, client
recognition can be an important incentive, as almost all interviewees felt recognized by farmers and co-
workers as hard workers. Consistent possibilities for job promotion may be another source of job
satisfaction. MoFA staff also identify with the mission of the organization at both the field level and
middle-level management. However, among managers, there is a widespread feeling of having been left
out and denied the opportunity to make a contribution, as discussed above. There is a perception that not
much effort is made to reward those who perform better.
The staff survey also aimed to find out what field staff see themselves as being held accountable
for. Staff in case study districts perceived that good performance includes ―meeting targets and
objectives,‖ ―carrying out duties to yield good results,‖ and ―performing well.‖ When asked what they do
to please their supervisors, a third and a firth of the respondents indicated that they demonstrate their
―dedication to work‖ and commitment to ―achieving the set objectives‖ respectively. One in two
interviewed indicated that the most important thing that they can do to keep the supervisor satisfied is to
submit reports regularly. While this points to the encouraging finding that a culture of setting targets and
reporting numbers has taken root, staff are being held accountable for outputs rather than outcomes
related to sector goals. As indicated above, specifying these outcomes at the district level is a task that
deserves more attention.
When asked who they feel accountable to, nearly 90 percent of the AEAs and supervisory staff
interviewed for the case studies thought that there are people in addition to their immediate supervisor
who they need to keep content. As expected, nearly two-thirds of the AEAs identified their director as the
person that they are most accountable to, but one in two also suggested that they are accountable to
farmers. Nearly 30 percent of the supervisory staff also mentioned the District Assembly and other
stakeholders. Asked how they would keep them satisfied, about 30 percent indicated by ―submitting
reports regularly‖ and ―working effectively.‖ Supervisory staff also emphasized ―interaction with them.‖
As for the actors who can sanction them, AEAs felt overwhelmingly accountable to their supervisors in
the districts, while district agricultural officers (DAOs) also felt accountable to regional directors and to a
lesser extent the District Assembly. District officials seem to have a greater influence on DAOs than
District Assembly members have on AEAs at community levels. District directors feel accountable to the
entire chain of command, including their Regional Director of Agriculture, Director of Extension,
Minister of Agriculture, District Chief Executive, and the District Assembly.
Routine processes that enhance accountability, however, still leave considerable room for
improvement. The study could not identify the extent to which individuals are actually assessed routinely.
Reporting has become routine due to a deliberate effort by the Ministry and due to the emphasis on
monitoring and evaluation, as indicated above. However, the managers reported that there is little
immediate feedback on reports so long as they supply the numbers. While reporting is emphasized,

31
particularly the quantification of various activities, the reports give little indication of the quality of work
or the outcomes.
Discussions with staff at various levels suggest that there are mechanisms to punish poor
performance. District directors deny allowances to staff who blatantly disregard their duties. The chief
director can remove district and regional directors who do not perform well. Staff can be moved to
different locations. While the organization may occasionally resort to punishments, the study finds that it
could improve its use of instruments to reward good performers. Many suggest that simple
acknowledgment of extra effort can be a motivator.
There is also room to improve the accountability of the DADUs for achieving their planned goals.
Obviously, there are limits to holding DADUs accountable for production or productivity outcomes, since
these also depend on factors outside their control. Still, finding ways to improve the outcome orientation
of DADUs would be a promising strategy. The Ministry is already adopting encouraging measures such
as annual performance reviews to bring peer pressure on division directors to improve their performance.
These can be further strengthened, but orientation to outcomes is a prerequisite to strengthening
accountability.
Accountability to elected political leaders is important to ensure that the organization responds to
broader societal goals and citizens’ needs. This review suggests that MoFA’s accountability to the top
political leadership, especially the President’s Office, is high. The budget processes also introduce
accountability to parliamentarians, particularly for the fulfillment of targets in the budget statement. As
indicated, accountability to the District Assembly has not yet been established in any formal sense, even
though field staff interact with elected District Assembly members. Budget support does bring in some
accountability to donors as well. For example, the improved timeliness of reporting noted earlier might be
partly a response to a trigger in the Food and Agriculture Budget Support. This accountability could be
strengthened by choosing triggers that are outcome oriented.
32
3. AGRICULTURAL EXPENDITURE REVIEW
Coverage of the Agricultural Expenditure Review
Agriculture is typically defined as comprising crops and livestock, fisheries, forestry, and natural resource
management. For reviewing public expenditures, this definition was deemed to be too narrow. Therefore,
a broader definition of agriculture, which covers all of these but also includes agricultural research,
agricultural extension services and training, agricultural marketing, agricultural inputs (such as seeds,
fertilizers, and chemicals), irrigation, and rural infrastructure (such as marketing information systems and
postharvest facilities), has been used. This definition is consistent with the guide developed by the Africa
Union/New Partnership for Africa’s Development for the CAADP initiative (AU/NEPAD 2005).
In addition, expenditures in many different sectors (for example, feeder roads, transport, power,
education, and health) can also contribute to agricultural growth. The implication of this definition for
Ghana is that the agriculture sector goes beyond MoFA to include several other MDAs, as has been
discussed in the previous chapter (Figure 2).
Trends in Sector Expenditures
Government expenditures in the sector, as defined above, have risen steadily by about 9.1 percent per
year on average in real terms, increasing from 30.4 million in Ghanaian cedi (GH¢) in 2000 to GH¢ 58.2
in 2005. As Figure 3 shows, government spending on the sector accounted for about 6 percent of total
government spending on average over the period 2000–05. In terms of its size relative to the economy,
which is a better measure by international standards, spending on the sector accounted for about 4.1
percent of agricultural gross domestic product (AgGDP) and 1.5 percent of GDP.
These shares are considerably higher than those reported in the 2008 World Development Report
(0.7 percent of AgGDP)(World Bank 2007). The difference may be because the World Bank only counts
expenditures by MoFA. In any case, our results show that the share of government spending in total
government expenditure or AgGDP is actually higher than reported in the World Development Report,
when agriculture-related expenditures in other MDAs, such as feeder roads, agricultural education under
the National Council for Tertiary Education, food imports and agricultural presidential special initiatives,
are accounted for.
Comparing agriculture to some other sectors, government spending on agriculture ranks third
after spending on the education and health sectors, although spending on the education sector, which
continues to rise rapidly, far outweighs the others (Figure 4). Although real expenditures are increasing,
the share spent on the agriculture sector has stagnated. Government spending on feeder roads and other
infrastructure (highways and urban roads, communications, works and housing, and ports, harbors, and
railways) accounts for only 3.1 percent of government spending and 0.8 percent of GDP, which is only
slightly higher than the share spent on defense—2.4 percent of government spending and 0.6 percent of
GDP.
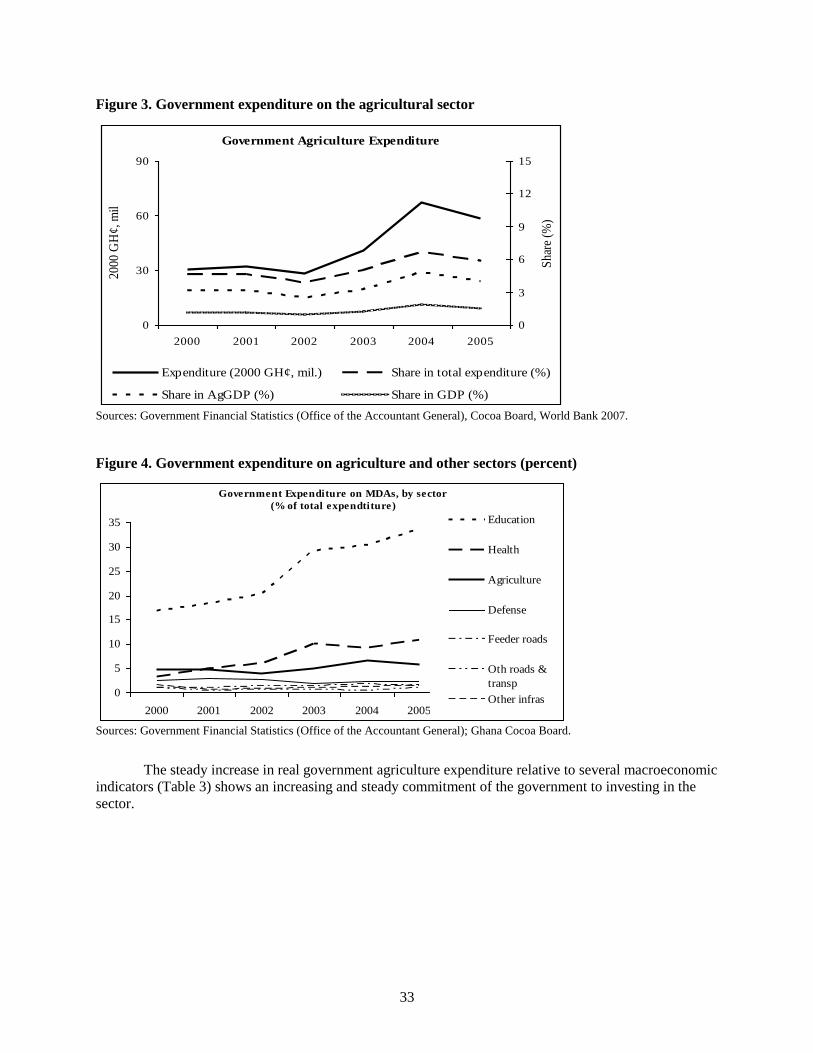
33
Figure 3. Government expenditure on the agricultural sector
Sources: Government Financial Statistics (Office of the Accountant General), Cocoa Board, World Bank 2007.
Figure 4. Government expenditure on agriculture and other sectors (percent)
Sources: Government Financial Statistics (Office of the Accountant General); Ghana Cocoa Board.
The steady increase in real government agriculture expenditure relative to several macroeconomic
indicators (Table 3) shows an increasing and steady commitment of the government to investing in the
sector.
Government Agriculture Expenditure
0
30
60
90
2000 2001 2002 2003 2004 2005
2000
GH
¢, m
il
0
3
6
9
12
15
Sha
re (
%)
Expenditure (2000 GH¢, mil.) Share in total expenditure (%)
Share in AgGDP (%) Share in GDP (%)
Government Expenditure on MDAs, by sector
(% of total expendtiture)
0
5
10
15
20
25
30
35
2000 2001 2002 2003 2004 2005
Education
Health
Agriculture
Defense
Feeder roads
Oth roads &
transp
Other infras
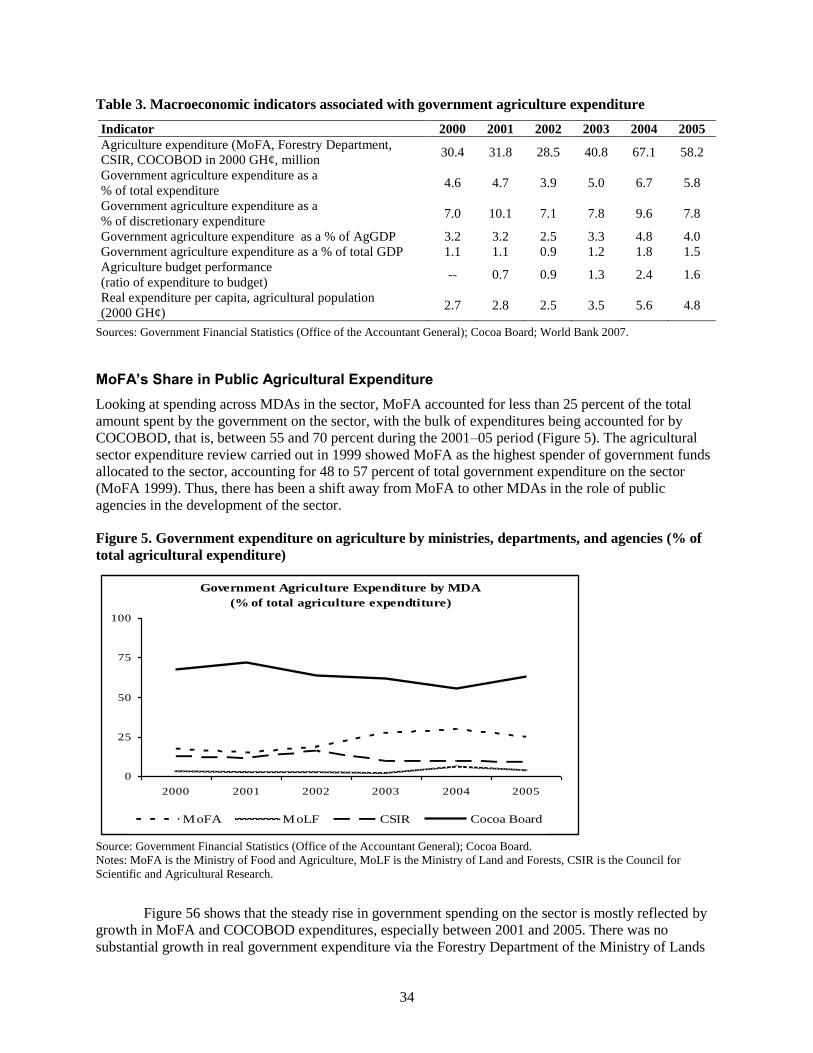
34
Table 3. Macroeconomic indicators associated with government agriculture expenditure
Indicator 2000 2001 2002 2003 2004 2005
Agriculture expenditure (MoFA, Forestry Department,
CSIR, COCOBOD in 2000 GH¢, million 30.4 31.8 28.5 40.8 67.1 58.2
Government agriculture expenditure as a
% of total expenditure 4.6 4.7 3.9 5.0 6.7 5.8
Government agriculture expenditure as a
% of discretionary expenditure 7.0 10.1 7.1 7.8 9.6 7.8
Government agriculture expenditure as a % of AgGDP 3.2 3.2 2.5 3.3 4.8 4.0
Government agriculture expenditure as a % of total GDP 1.1 1.1 0.9 1.2 1.8 1.5
Agriculture budget performance
(ratio of expenditure to budget) -- 0.7 0.9 1.3 2.4 1.6
Real expenditure per capita, agricultural population
(2000 GH¢) 2.7 2.8 2.5 3.5 5.6 4.8
Sources: Government Financial Statistics (Office of the Accountant General); Cocoa Board; World Bank 2007.
MoFA’s Share in Public Agricultural Expenditure
Looking at spending across MDAs in the sector, MoFA accounted for less than 25 percent of the total
amount spent by the government on the sector, with the bulk of expenditures being accounted for by
COCOBOD, that is, between 55 and 70 percent during the 2001–05 period (Figure 5). The agricultural
sector expenditure review carried out in 1999 showed MoFA as the highest spender of government funds
allocated to the sector, accounting for 48 to 57 percent of total government expenditure on the sector
(MoFA 1999). Thus, there has been a shift away from MoFA to other MDAs in the role of public
agencies in the development of the sector.
Figure 5. Government expenditure on agriculture by ministries, departments, and agencies (% of
total agricultural expenditure)
Source: Government Financial Statistics (Office of the Accountant General); Cocoa Board.
Notes: MoFA is the Ministry of Food and Agriculture, MoLF is the Ministry of Land and Forests, CSIR is the Council for
Scientific and Agricultural Research.
Figure 56 shows that the steady rise in government spending on the sector is mostly reflected by
growth in MoFA and COCOBOD expenditures, especially between 2001 and 2005. There was no
substantial growth in real government expenditure via the Forestry Department of the Ministry of Lands
Government Agriculture Expenditure by MDA
(% of total agriculture expendtiture)
0
25
50
75
100
2000 2001 2002 2003 2004 2005
MoFA MoLF CSIR Cocoa Board
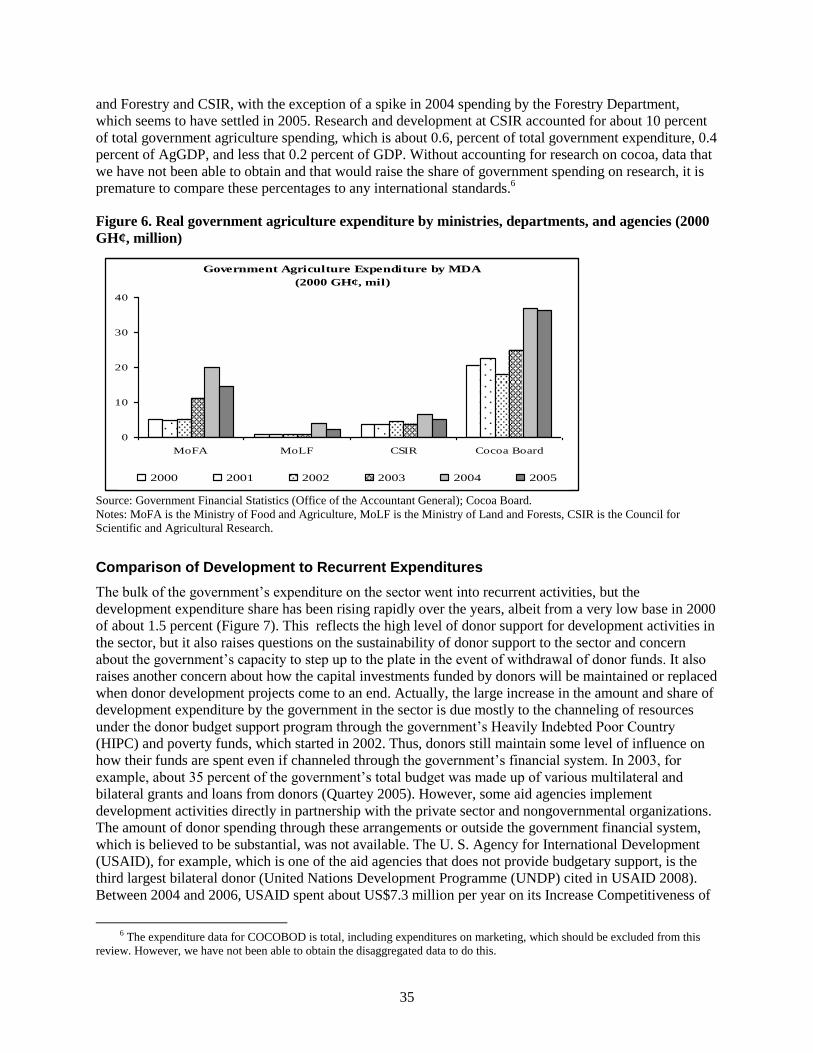
35
and Forestry and CSIR, with the exception of a spike in 2004 spending by the Forestry Department,
which seems to have settled in 2005. Research and development at CSIR accounted for about 10 percent
of total government agriculture spending, which is about 0.6, percent of total government expenditure, 0.4
percent of AgGDP, and less that 0.2 percent of GDP. Without accounting for research on cocoa, data that
we have not been able to obtain and that would raise the share of government spending on research, it is
premature to compare these percentages to any international standards.6
Figure 6. Real government agriculture expenditure by ministries, departments, and agencies (2000
GH¢, million)
Source: Government Financial Statistics (Office of the Accountant General); Cocoa Board.
Notes: MoFA is the Ministry of Food and Agriculture, MoLF is the Ministry of Land and Forests, CSIR is the Council for
Scientific and Agricultural Research.
Comparison of Development to Recurrent Expenditures
The bulk of the government’s expenditure on the sector went into recurrent activities, but the
development expenditure share has been rising rapidly over the years, albeit from a very low base in 2000
of about 1.5 percent (Figure 7). This reflects the high level of donor support for development activities in
the sector, but it also raises questions on the sustainability of donor support to the sector and concern
about the government’s capacity to step up to the plate in the event of withdrawal of donor funds. It also
raises another concern about how the capital investments funded by donors will be maintained or replaced
when donor development projects come to an end. Actually, the large increase in the amount and share of
development expenditure by the government in the sector is due mostly to the channeling of resources
under the donor budget support program through the government’s Heavily Indebted Poor Country
(HIPC) and poverty funds, which started in 2002. Thus, donors still maintain some level of influence on
how their funds are spent even if channeled through the government’s financial system. In 2003, for
example, about 35 percent of the government’s total budget was made up of various multilateral and
bilateral grants and loans from donors (Quartey 2005). However, some aid agencies implement
development activities directly in partnership with the private sector and nongovernmental organizations.
The amount of donor spending through these arrangements or outside the government financial system,
which is believed to be substantial, was not available. The U. S. Agency for International Development
(USAID), for example, which is one of the aid agencies that does not provide budgetary support, is the
third largest bilateral donor (United Nations Development Programme (UNDP) cited in USAID 2008).
Between 2004 and 2006, USAID spent about US$7.3 million per year on its Increase Competitiveness of
6 The expenditure data for COCOBOD is total, including expenditures on marketing, which should be excluded from this
review. However, we have not been able to obtain the disaggregated data to do this.
Government Agriculture Expenditure by MDA
(2000 GH¢, mil)
0
10
20
30
40
MoFA MoLF CSIR Cocoa Board
2000 2001 2002 2003 2004 2005
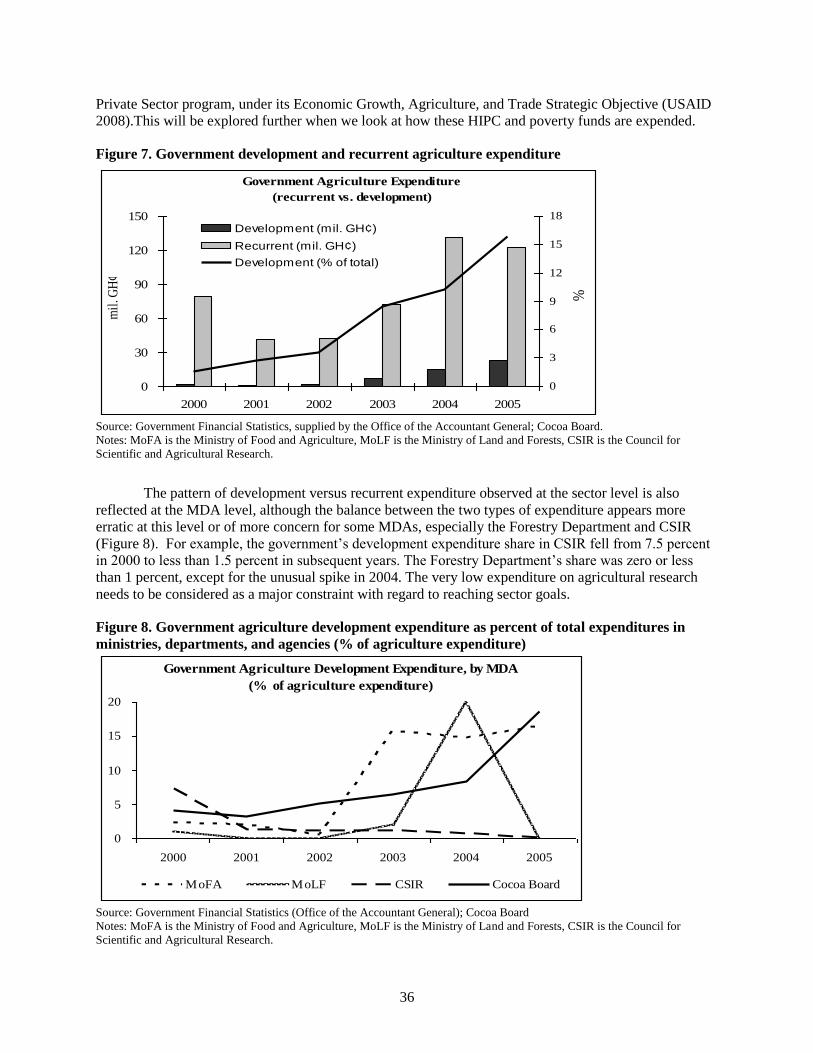
36
Private Sector program, under its Economic Growth, Agriculture, and Trade Strategic Objective (USAID
2008).This will be explored further when we look at how these HIPC and poverty funds are expended.
Figure 7. Government development and recurrent agriculture expenditure
Source: Government Financial Statistics, supplied by the Office of the Accountant General; Cocoa Board.
Notes: MoFA is the Ministry of Food and Agriculture, MoLF is the Ministry of Land and Forests, CSIR is the Council for
Scientific and Agricultural Research.
The pattern of development versus recurrent expenditure observed at the sector level is also
reflected at the MDA level, although the balance between the two types of expenditure appears more
erratic at this level or of more concern for some MDAs, especially the Forestry Department and CSIR
(Figure 8). For example, the government’s development expenditure share in CSIR fell from 7.5 percent
in 2000 to less than 1.5 percent in subsequent years. The Forestry Department’s share was zero or less
than 1 percent, except for the unusual spike in 2004. The very low expenditure on agricultural research
needs to be considered as a major constraint with regard to reaching sector goals.
Figure 8. Government agriculture development expenditure as percent of total expenditures in
ministries, departments, and agencies (% of agriculture expenditure)
Source: Government Financial Statistics (Office of the Accountant General); Cocoa Board
Notes: MoFA is the Ministry of Food and Agriculture, MoLF is the Ministry of Land and Forests, CSIR is the Council for
Scientific and Agricultural Research.
Government Agriculture Expenditure
(recurrent vs. development)
0
30
60
90
120
150
2000 2001 2002 2003 2004 2005
mil
. GH
¢
0
3
6
9
12
15
18
%
Development (mil. GH¢)
Recurrent (mil. GH¢)
Development (% of total)
Government Agriculture Development Expenditure, by MDA
(% of agriculture expenditure)
0
5
10
15
20
2000 2001 2002 2003 2004 2005
MoFA MoLF CSIR Cocoa Board
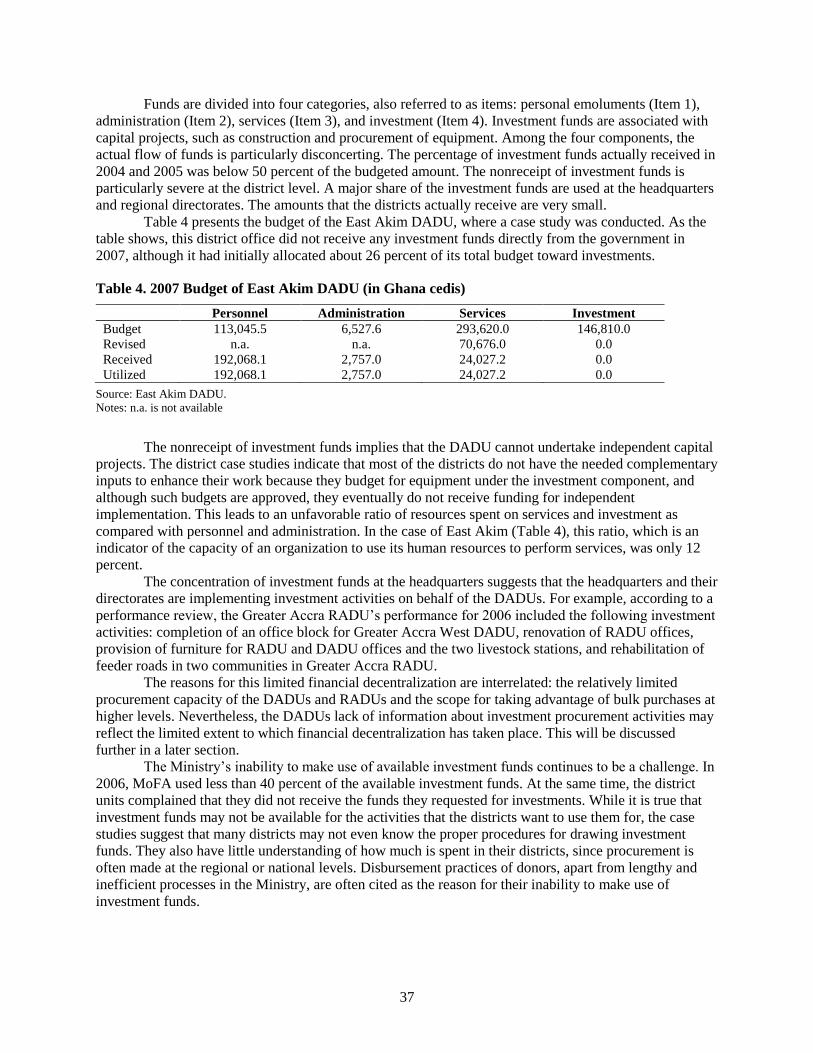
37
Funds are divided into four categories, also referred to as items: personal emoluments (Item 1),
administration (Item 2), services (Item 3), and investment (Item 4). Investment funds are associated with
capital projects, such as construction and procurement of equipment. Among the four components, the
actual flow of funds is particularly disconcerting. The percentage of investment funds actually received in
2004 and 2005 was below 50 percent of the budgeted amount. The nonreceipt of investment funds is
particularly severe at the district level. A major share of the investment funds are used at the headquarters
and regional directorates. The amounts that the districts actually receive are very small.
Table 4 presents the budget of the East Akim DADU, where a case study was conducted. As the
table shows, this district office did not receive any investment funds directly from the government in
2007, although it had initially allocated about 26 percent of its total budget toward investments.
Table 4. 2007 Budget of East Akim DADU (in Ghana cedis)
Personnel Administration Services Investment
Budget 113,045.5 6,527.6 293,620.0 146,810.0
Revised n.a. n.a. 70,676.0 0.0
Received 192,068.1 2,757.0 24,027.2 0.0
Utilized 192,068.1 2,757.0 24,027.2 0.0
Source: East Akim DADU.
Notes: n.a. is not available
The nonreceipt of investment funds implies that the DADU cannot undertake independent capital
projects. The district case studies indicate that most of the districts do not have the needed complementary
inputs to enhance their work because they budget for equipment under the investment component, and
although such budgets are approved, they eventually do not receive funding for independent
implementation. This leads to an unfavorable ratio of resources spent on services and investment as
compared with personnel and administration. In the case of East Akim (Table 4), this ratio, which is an
indicator of the capacity of an organization to use its human resources to perform services, was only 12
percent.
The concentration of investment funds at the headquarters suggests that the headquarters and their
directorates are implementing investment activities on behalf of the DADUs. For example, according to a
performance review, the Greater Accra RADU’s performance for 2006 included the following investment
activities: completion of an office block for Greater Accra West DADU, renovation of RADU offices,
provision of furniture for RADU and DADU offices and the two livestock stations, and rehabilitation of
feeder roads in two communities in Greater Accra RADU.
The reasons for this limited financial decentralization are interrelated: the relatively limited
procurement capacity of the DADUs and RADUs and the scope for taking advantage of bulk purchases at
higher levels. Nevertheless, the DADUs lack of information about investment procurement activities may
reflect the limited extent to which financial decentralization has taken place. This will be discussed
further in a later section.
The Ministry’s inability to make use of available investment funds continues to be a challenge. In
2006, MoFA used less than 40 percent of the available investment funds. At the same time, the district
units complained that they did not receive the funds they requested for investments. While it is true that
investment funds may not be available for the activities that the districts want to use them for, the case
studies suggest that many districts may not even know the proper procedures for drawing investment
funds. They also have little understanding of how much is spent in their districts, since procurement is
often made at the regional or national levels. Disbursement practices of donors, apart from lengthy and
inefficient processes in the Ministry, are often cited as the reason for their inability to make use of
investment funds.
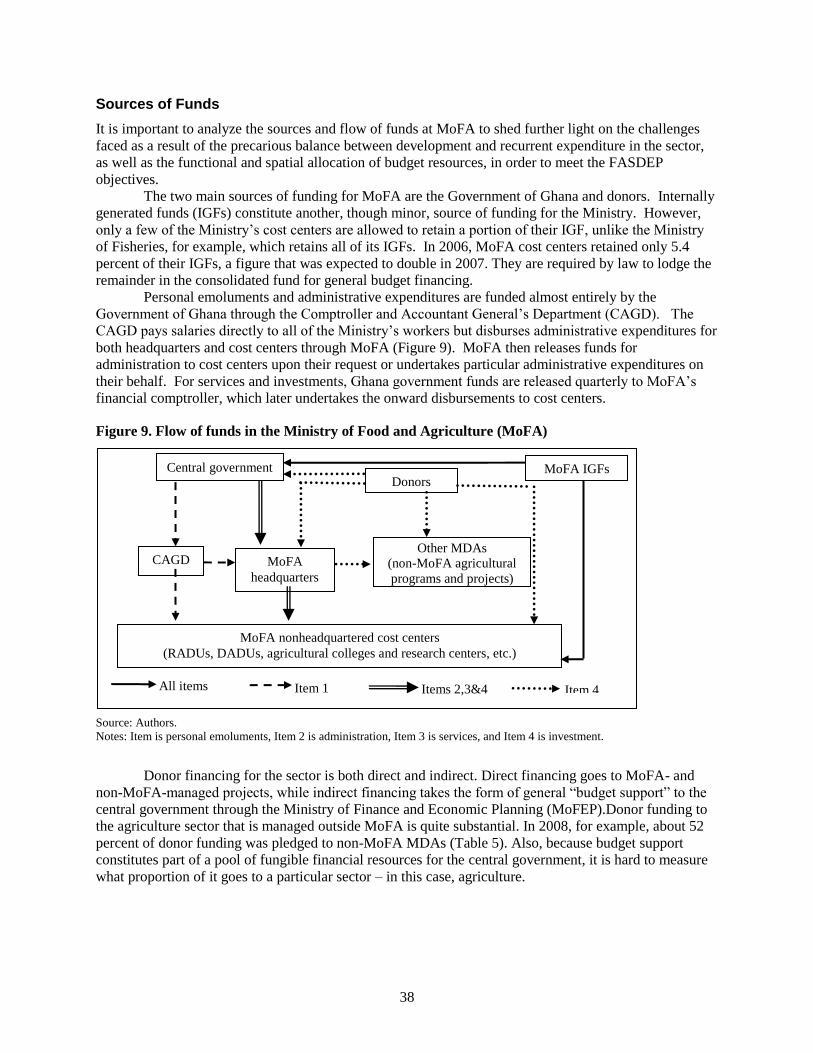
38
Sources of Funds
It is important to analyze the sources and flow of funds at MoFA to shed further light on the challenges
faced as a result of the precarious balance between development and recurrent expenditure in the sector,
as well as the functional and spatial allocation of budget resources, in order to meet the FASDEP
objectives.
The two main sources of funding for MoFA are the Government of Ghana and donors. Internally
generated funds (IGFs) constitute another, though minor, source of funding for the Ministry. However,
only a few of the Ministry’s cost centers are allowed to retain a portion of their IGF, unlike the Ministry
of Fisheries, for example, which retains all of its IGFs. In 2006, MoFA cost centers retained only 5.4
percent of their IGFs, a figure that was expected to double in 2007. They are required by law to lodge the
remainder in the consolidated fund for general budget financing.
Personal emoluments and administrative expenditures are funded almost entirely by the
Government of Ghana through the Comptroller and Accountant General’s Department (CAGD). The
CAGD pays salaries directly to all of the Ministry’s workers but disburses administrative expenditures for
both headquarters and cost centers through MoFA (Figure 9). MoFA then releases funds for
administration to cost centers upon their request or undertakes particular administrative expenditures on
their behalf. For services and investments, Ghana government funds are released quarterly to MoFA’s
financial comptroller, which later undertakes the onward disbursements to cost centers.
Figure 9. Flow of funds in the Ministry of Food and Agriculture (MoFA)
.
Source: Authors.
Notes: Item is personal emoluments, Item 2 is administration, Item 3 is services, and Item 4 is investment.
Donor financing for the sector is both direct and indirect. Direct financing goes to MoFA- and
non-MoFA-managed projects, while indirect financing takes the form of general ―budget support‖ to the
central government through the Ministry of Finance and Economic Planning (MoFEP).Donor funding to
the agriculture sector that is managed outside MoFA is quite substantial. In 2008, for example, about 52
percent of donor funding was pledged to non-MoFA MDAs (Table 5). Also, because budget support
constitutes part of a pool of fungible financial resources for the central government, it is hard to measure
what proportion of it goes to a particular sector – in this case, agriculture.
Central government Donors
CAGD MoFA
headquarters
Other MDAs
(non-MoFA agricultural
programs and projects)
MoFA nonheadquartered cost centers
(RADUs, DADUs, agricultural colleges and research centers, etc.)
MoFA IGFs
All items Item 1 Item 4 Items 2,3&4
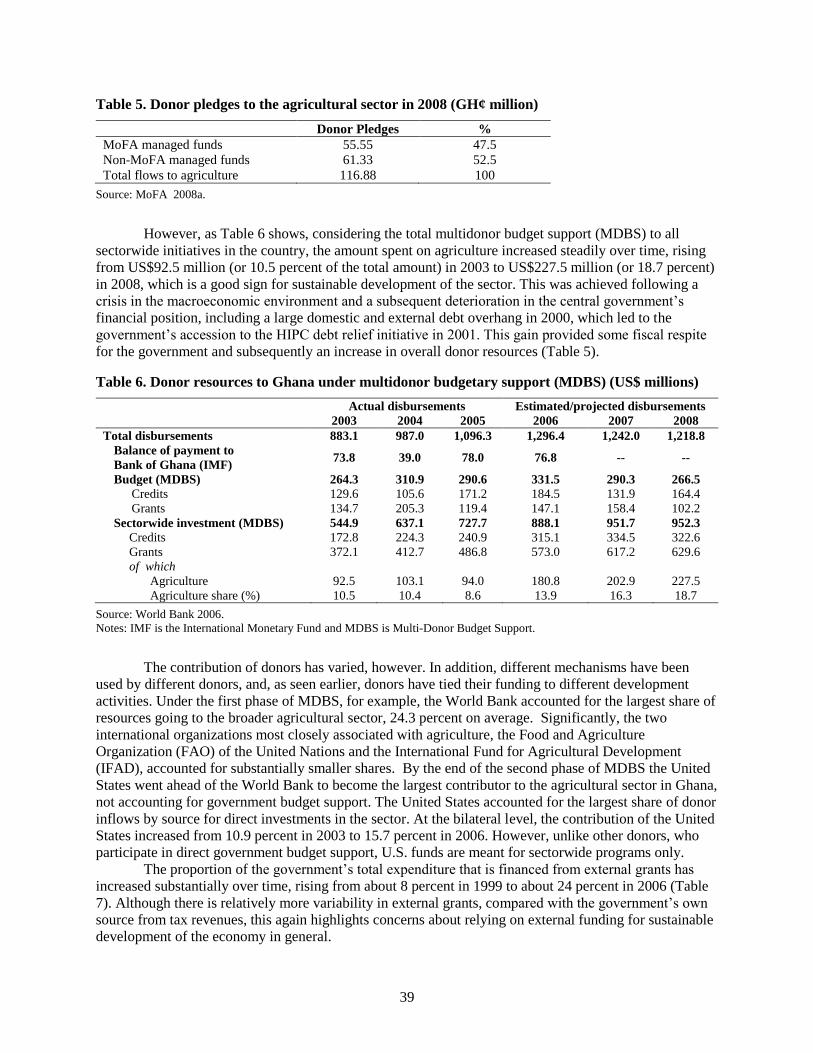
39
Table 5. Donor pledges to the agricultural sector in 2008 (GH¢ million)
Donor Pledges %
MoFA managed funds 55.55 47.5
Non-MoFA managed funds 61.33 52.5
Total flows to agriculture 116.88 100
Source: MoFA 2008a.
However, as Table 6 shows, considering the total multidonor budget support (MDBS) to all
sectorwide initiatives in the country, the amount spent on agriculture increased steadily over time, rising
from US$92.5 million (or 10.5 percent of the total amount) in 2003 to US$227.5 million (or 18.7 percent)
in 2008, which is a good sign for sustainable development of the sector. This was achieved following a
crisis in the macroeconomic environment and a subsequent deterioration in the central government’s
financial position, including a large domestic and external debt overhang in 2000, which led to the
government’s accession to the HIPC debt relief initiative in 2001. This gain provided some fiscal respite
for the government and subsequently an increase in overall donor resources (Table 5).
Table 6. Donor resources to Ghana under multidonor budgetary support (MDBS) (US$ millions)
Actual disbursements Estimated/projected disbursements
2003 2004 2005 2006 2007 2008
Total disbursements 883.1 987.0 1,096.3 1,296.4 1,242.0 1,218.8
Balance of payment to
Bank of Ghana (IMF) 73.8 39.0 78.0 76.8 -- --
Budget (MDBS) 264.3 310.9 290.6 331.5 290.3 266.5
Credits 129.6 105.6 171.2 184.5 131.9 164.4
Grants 134.7 205.3 119.4 147.1 158.4 102.2
Sectorwide investment (MDBS) 544.9 637.1 727.7 888.1 951.7 952.3
Credits 172.8 224.3 240.9 315.1 334.5 322.6
Grants 372.1 412.7 486.8 573.0 617.2 629.6
of which
Agriculture 92.5 103.1 94.0 180.8 202.9 227.5
Agriculture share (%) 10.5 10.4 8.6 13.9 16.3 18.7
Source: World Bank 2006.
Notes: IMF is the International Monetary Fund and MDBS is Multi-Donor Budget Support.
The contribution of donors has varied, however. In addition, different mechanisms have been
used by different donors, and, as seen earlier, donors have tied their funding to different development
activities. Under the first phase of MDBS, for example, the World Bank accounted for the largest share of
resources going to the broader agricultural sector, 24.3 percent on average. Significantly, the two
international organizations most closely associated with agriculture, the Food and Agriculture
Organization (FAO) of the United Nations and the International Fund for Agricultural Development
(IFAD), accounted for substantially smaller shares. By the end of the second phase of MDBS the United
States went ahead of the World Bank to become the largest contributor to the agricultural sector in Ghana,
not accounting for government budget support. The United States accounted for the largest share of donor
inflows by source for direct investments in the sector. At the bilateral level, the contribution of the United
States increased from 10.9 percent in 2003 to 15.7 percent in 2006. However, unlike other donors, who
participate in direct government budget support, U.S. funds are meant for sectorwide programs only.
The proportion of the government’s total expenditure that is financed from external grants has
increased substantially over time, rising from about 8 percent in 1999 to about 24 percent in 2006 (Table
7). Although there is relatively more variability in external grants, compared with the government’s own
source from tax revenues, this again highlights concerns about relying on external funding for sustainable
development of the economy in general.
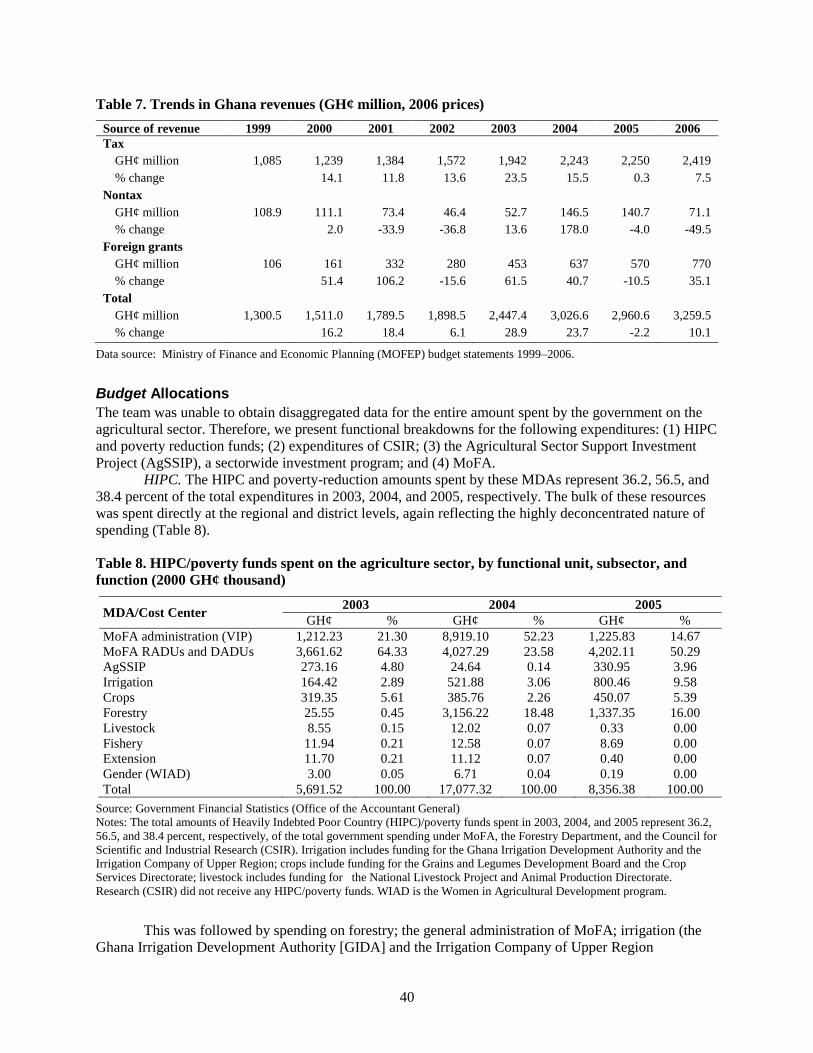
40
Table 7. Trends in Ghana revenues (GH¢ million, 2006 prices)
Source of revenue 1999 2000 2001 2002 2003 2004 2005 2006
Tax
GH¢ million 1,085 1,239 1,384 1,572 1,942 2,243 2,250 2,419
% change 14.1 11.8 13.6 23.5 15.5 0.3 7.5
Nontax
GH¢ million 108.9 111.1 73.4 46.4 52.7 146.5 140.7 71.1
% change 2.0 -33.9 -36.8 13.6 178.0 -4.0 -49.5
Foreign grants
GH¢ million 106 161 332 280 453 637 570 770
% change 51.4 106.2 -15.6 61.5 40.7 -10.5 35.1
Total
GH¢ million 1,300.5 1,511.0 1,789.5 1,898.5 2,447.4 3,026.6 2,960.6 3,259.5
% change 16.2 18.4 6.1 28.9 23.7 -2.2 10.1
Data source: Ministry of Finance and Economic Planning (MOFEP) budget statements 1999–2006.
Budget Allocations
The team was unable to obtain disaggregated data for the entire amount spent by the government on the
agricultural sector. Therefore, we present functional breakdowns for the following expenditures: (1) HIPC
and poverty reduction funds; (2) expenditures of CSIR; (3) the Agricultural Sector Support Investment
Project (AgSSIP), a sectorwide investment program; and (4) MoFA.
HIPC. The HIPC and poverty-reduction amounts spent by these MDAs represent 36.2, 56.5, and
38.4 percent of the total expenditures in 2003, 2004, and 2005, respectively. The bulk of these resources
was spent directly at the regional and district levels, again reflecting the highly deconcentrated nature of
spending (Table 8).
Table 8. HIPC/poverty funds spent on the agriculture sector, by functional unit, subsector, and
function (2000 GH¢ thousand)
MDA/Cost Center 2003 2004 2005
GH¢ % GH¢ % GH¢ %
MoFA administration (VIP) 1,212.23 21.30 8,919.10 52.23 1,225.83 14.67
MoFA RADUs and DADUs 3,661.62 64.33 4,027.29 23.58 4,202.11 50.29
AgSSIP 273.16 4.80 24.64 0.14 330.95 3.96
Irrigation 164.42 2.89 521.88 3.06 800.46 9.58
Crops 319.35 5.61 385.76 2.26 450.07 5.39
Forestry 25.55 0.45 3,156.22 18.48 1,337.35 16.00
Livestock 8.55 0.15 12.02 0.07 0.33 0.00
Fishery 11.94 0.21 12.58 0.07 8.69 0.00
Extension 11.70 0.21 11.12 0.07 0.40 0.00
Gender (WIAD) 3.00 0.05 6.71 0.04 0.19 0.00
Total 5,691.52 100.00 17,077.32 100.00 8,356.38 100.00
Source: Government Financial Statistics (Office of the Accountant General)
Notes: The total amounts of Heavily Indebted Poor Country (HIPC)/poverty funds spent in 2003, 2004, and 2005 represent 36.2,
56.5, and 38.4 percent, respectively, of the total government spending under MoFA, the Forestry Department, and the Council for
Scientific and Industrial Research (CSIR). Irrigation includes funding for the Ghana Irrigation Development Authority and the
Irrigation Company of Upper Region; crops include funding for the Grains and Legumes Development Board and the Crop
Services Directorate; livestock includes funding for the National Livestock Project and Animal Production Directorate.
Research (CSIR) did not receive any HIPC/poverty funds. WIAD is the Women in Agricultural Development program.
This was followed by spending on forestry; the general administration of MoFA; irrigation (the
Ghana Irrigation Development Authority [GIDA] and the Irrigation Company of Upper Region
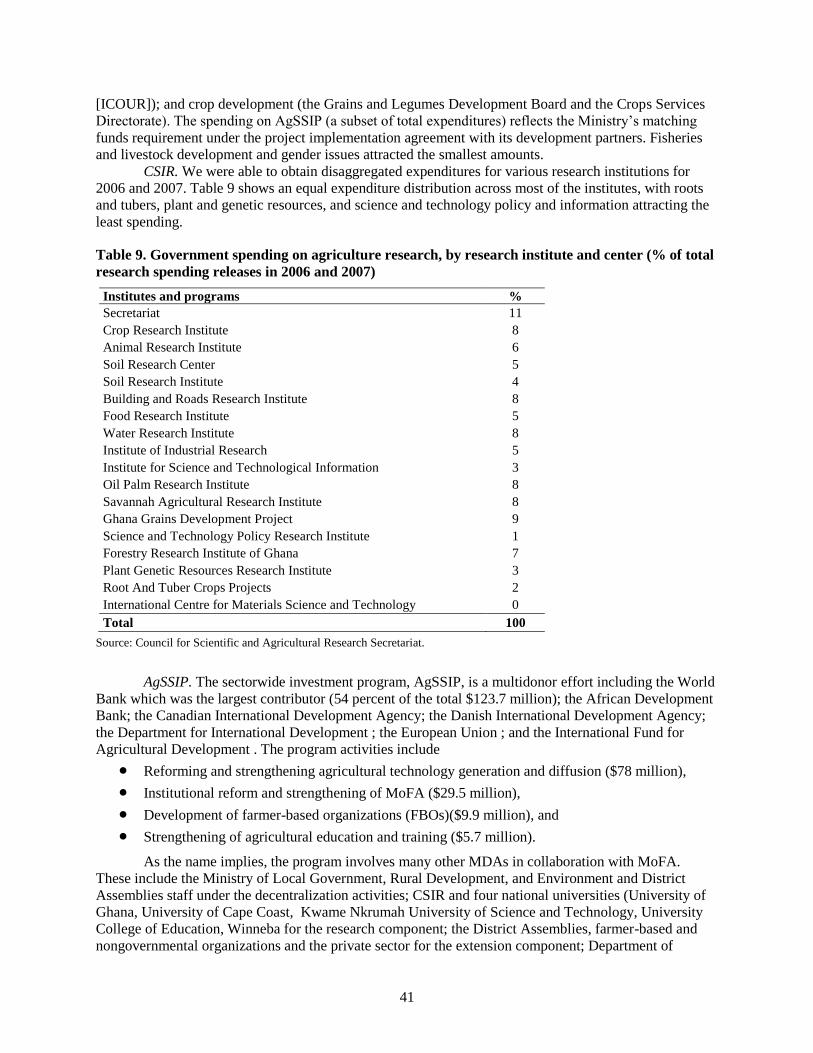
41
[ICOUR]); and crop development (the Grains and Legumes Development Board and the Crops Services
Directorate). The spending on AgSSIP (a subset of total expenditures) reflects the Ministry’s matching
funds requirement under the project implementation agreement with its development partners. Fisheries
and livestock development and gender issues attracted the smallest amounts.
CSIR. We were able to obtain disaggregated expenditures for various research institutions for
2006 and 2007. Table 9 shows an equal expenditure distribution across most of the institutes, with roots
and tubers, plant and genetic resources, and science and technology policy and information attracting the
least spending.
Table 9. Government spending on agriculture research, by research institute and center (% of total
research spending releases in 2006 and 2007)
Institutes and programs %
Secretariat 11
Crop Research Institute 8
Animal Research Institute 6
Soil Research Center 5
Soil Research Institute 4
Building and Roads Research Institute 8
Food Research Institute 5
Water Research Institute 8
Institute of Industrial Research 5
Institute for Science and Technological Information 3
Oil Palm Research Institute 8
Savannah Agricultural Research Institute 8
Ghana Grains Development Project 9
Science and Technology Policy Research Institute 1
Forestry Research Institute of Ghana 7
Plant Genetic Resources Research Institute 3
Root And Tuber Crops Projects 2
International Centre for Materials Science and Technology 0
Total 100
Source: Council for Scientific and Agricultural Research Secretariat.
AgSSIP. The sectorwide investment program, AgSSIP, is a multidonor effort including the World
Bank which was the largest contributor (54 percent of the total $123.7 million); the African Development
Bank; the Canadian International Development Agency; the Danish International Development Agency;
the Department for International Development ; the European Union ; and the International Fund for
Agricultural Development . The program activities include
Reforming and strengthening agricultural technology generation and diffusion ($78 million),
Institutional reform and strengthening of MoFA ($29.5 million),
Development of farmer-based organizations (FBOs)($9.9 million), and
Strengthening of agricultural education and training ($5.7 million).
As the name implies, the program involves many other MDAs in collaboration with MoFA.
These include the Ministry of Local Government, Rural Development, and Environment and District
Assemblies staff under the decentralization activities; CSIR and four national universities (University of
Ghana, University of Cape Coast, Kwame Nkrumah University of Science and Technology, University
College of Education, Winneba for the research component; the District Assemblies, farmer-based and
nongovernmental organizations and the private sector for the extension component; Department of
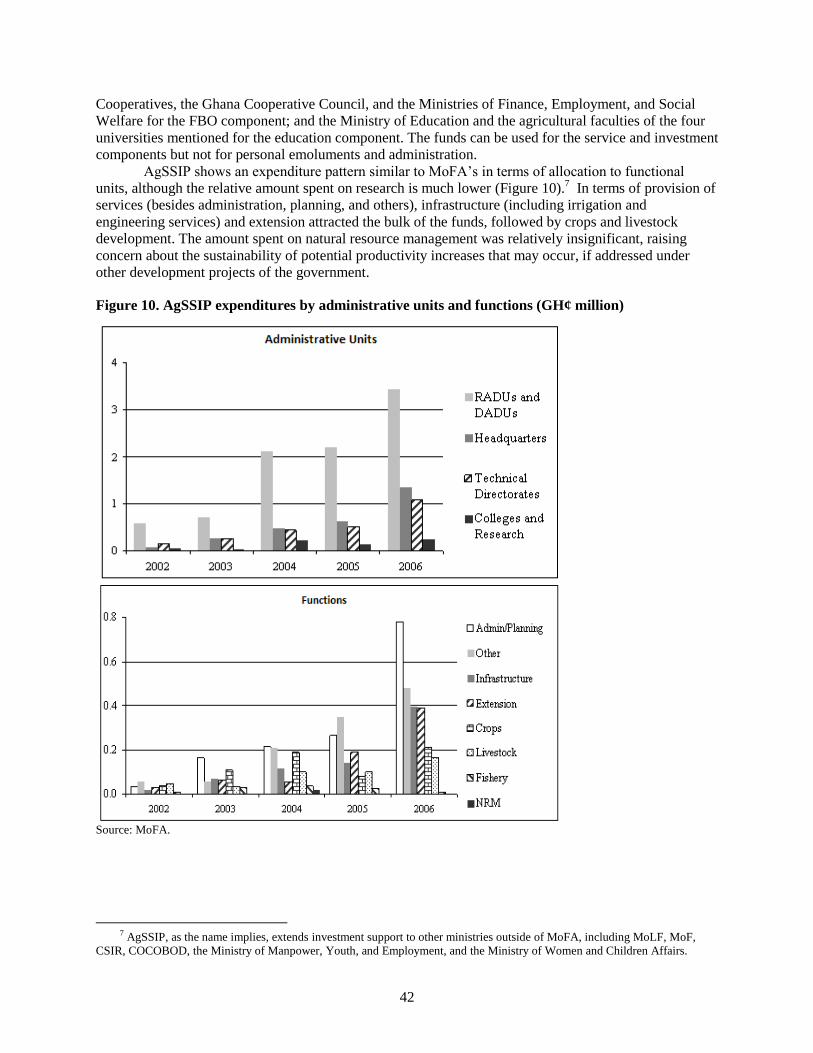
42
Cooperatives, the Ghana Cooperative Council, and the Ministries of Finance, Employment, and Social
Welfare for the FBO component; and the Ministry of Education and the agricultural faculties of the four
universities mentioned for the education component. The funds can be used for the service and investment
components but not for personal emoluments and administration.
AgSSIP shows an expenditure pattern similar to MoFA’s in terms of allocation to functional
units, although the relative amount spent on research is much lower (Figure 10).7 In terms of provision of
services (besides administration, planning, and others), infrastructure (including irrigation and
engineering services) and extension attracted the bulk of the funds, followed by crops and livestock
development. The amount spent on natural resource management was relatively insignificant, raising
concern about the sustainability of potential productivity increases that may occur, if addressed under
other development projects of the government.
Figure 10. AgSSIP expenditures by administrative units and functions (GH¢ million)
Source: MoFA.
7 AgSSIP, as the name implies, extends investment support to other ministries outside of MoFA, including MoLF, MoF,
CSIR, COCOBOD, the Ministry of Manpower, Youth, and Employment, and the Ministry of Women and Children Affairs.
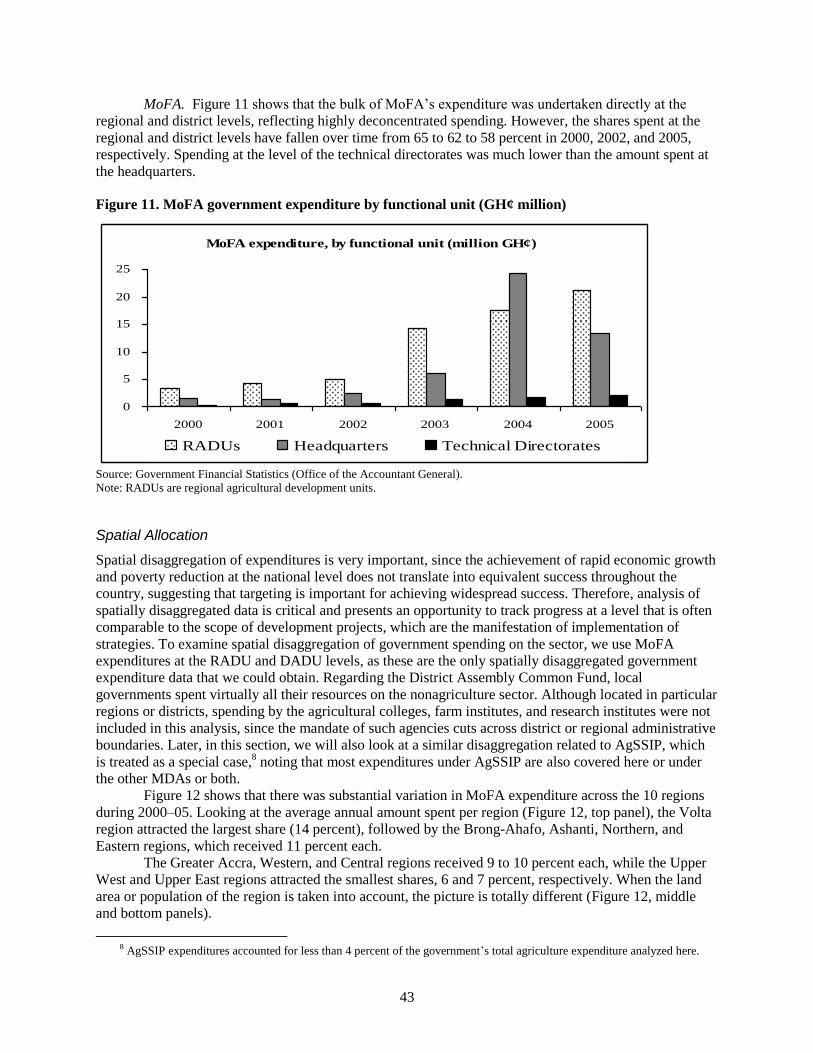
43
MoFA. Figure 11 shows that the bulk of MoFA’s expenditure was undertaken directly at the
regional and district levels, reflecting highly deconcentrated spending. However, the shares spent at the
regional and district levels have fallen over time from 65 to 62 to 58 percent in 2000, 2002, and 2005,
respectively. Spending at the level of the technical directorates was much lower than the amount spent at
the headquarters.
Figure 11. MoFA government expenditure by functional unit (GH¢ million)
Source: Government Financial Statistics (Office of the Accountant General).
Note: RADUs are regional agricultural development units.
Spatial Allocation
Spatial disaggregation of expenditures is very important, since the achievement of rapid economic growth
and poverty reduction at the national level does not translate into equivalent success throughout the
country, suggesting that targeting is important for achieving widespread success. Therefore, analysis of
spatially disaggregated data is critical and presents an opportunity to track progress at a level that is often
comparable to the scope of development projects, which are the manifestation of implementation of
strategies. To examine spatial disaggregation of government spending on the sector, we use MoFA
expenditures at the RADU and DADU levels, as these are the only spatially disaggregated government
expenditure data that we could obtain. Regarding the District Assembly Common Fund, local
governments spent virtually all their resources on the nonagriculture sector. Although located in particular
regions or districts, spending by the agricultural colleges, farm institutes, and research institutes were not
included in this analysis, since the mandate of such agencies cuts across district or regional administrative
boundaries. Later, in this section, we will also look at a similar disaggregation related to AgSSIP, which
is treated as a special case,8 noting that most expenditures under AgSSIP are also covered here or under
the other MDAs or both.
Figure 12 shows that there was substantial variation in MoFA expenditure across the 10 regions
during 2000–05. Looking at the average annual amount spent per region (Figure 12, top panel), the Volta
region attracted the largest share (14 percent), followed by the Brong-Ahafo, Ashanti, Northern, and
Eastern regions, which received 11 percent each.
The Greater Accra, Western, and Central regions received 9 to 10 percent each, while the Upper
West and Upper East regions attracted the smallest shares, 6 and 7 percent, respectively. When the land
area or population of the region is taken into account, the picture is totally different (Figure 12, middle
and bottom panels).
8 AgSSIP expenditures accounted for less than 4 percent of the government’s total agriculture expenditure analyzed here.
MoFA expenditure, by functional unit (million GH¢)
0
5
10
15
20
25
2000 2001 2002 2003 2004 2005
RADUs Headquarters Technical Directorates
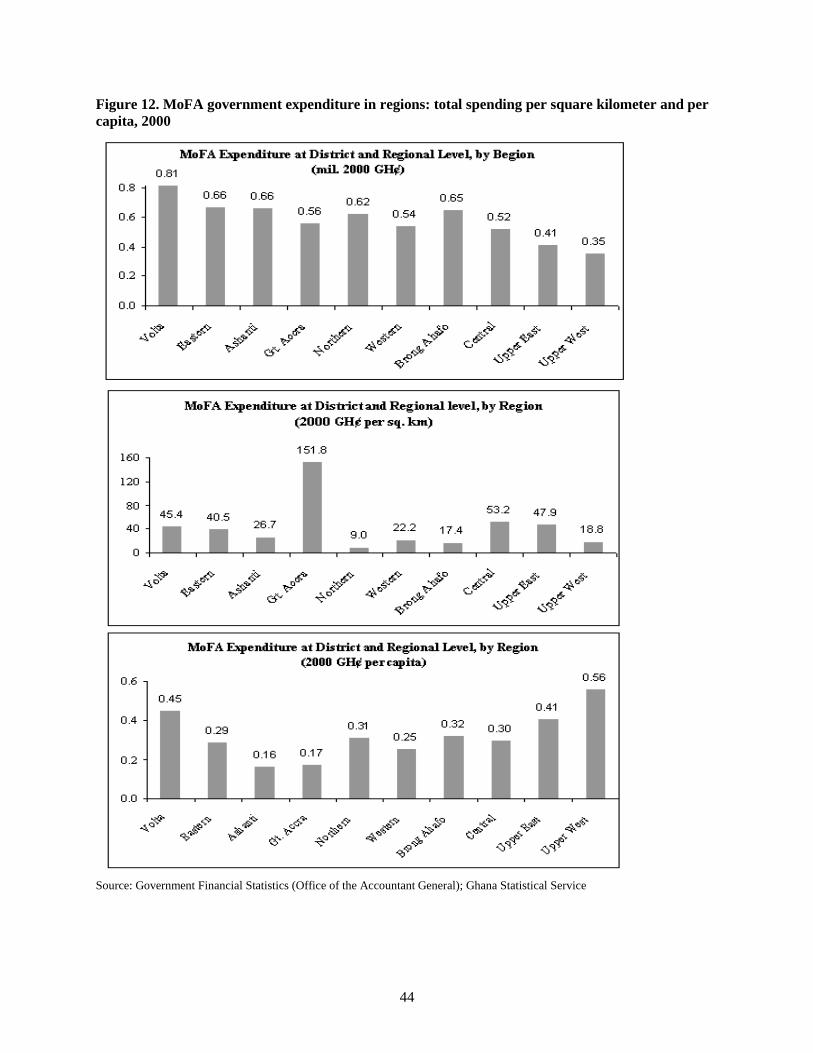
44
Figure 12. MoFA government expenditure in regions: total spending per square kilometer and per
capita, 2000
Source: Government Financial Statistics (Office of the Accountant General); Ghana Statistical Service
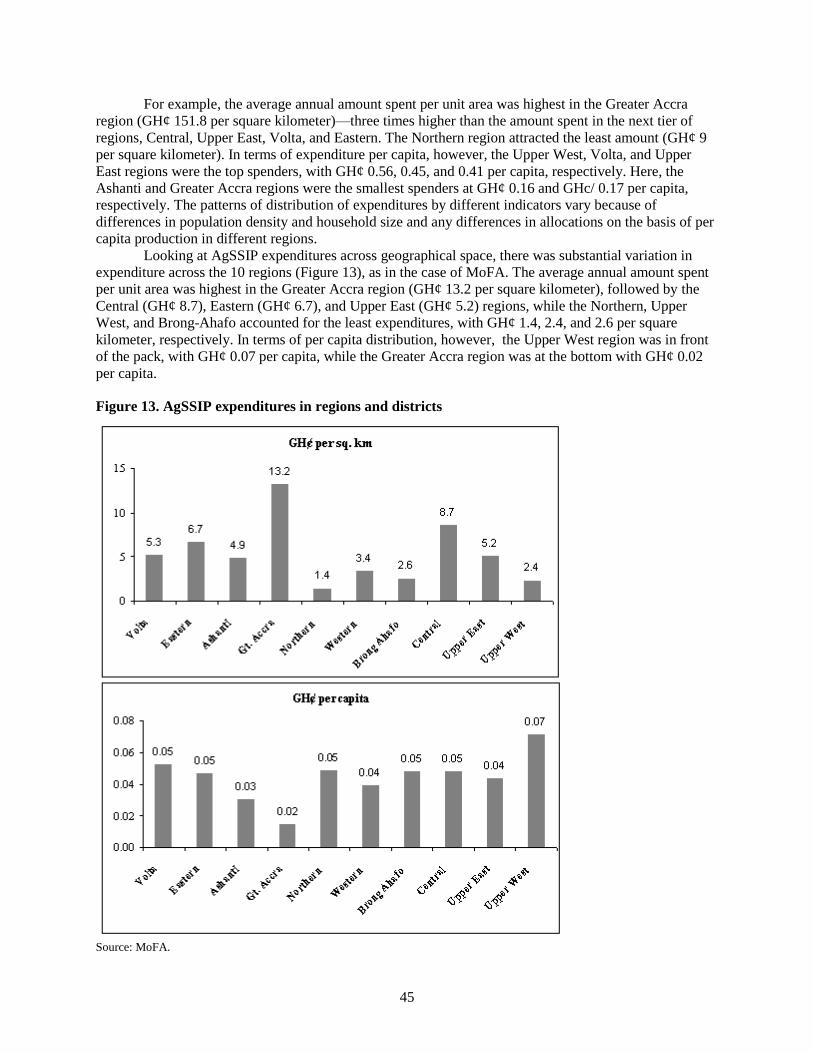
45
For example, the average annual amount spent per unit area was highest in the Greater Accra
region (GH¢ 151.8 per square kilometer)—three times higher than the amount spent in the next tier of
regions, Central, Upper East, Volta, and Eastern. The Northern region attracted the least amount (GH¢ 9
per square kilometer). In terms of expenditure per capita, however, the Upper West, Volta, and Upper
East regions were the top spenders, with GH¢ 0.56, 0.45, and 0.41 per capita, respectively. Here, the
Ashanti and Greater Accra regions were the smallest spenders at GH¢ 0.16 and GHc/ 0.17 per capita,
respectively. The patterns of distribution of expenditures by different indicators vary because of
differences in population density and household size and any differences in allocations on the basis of per
capita production in different regions.
Looking at AgSSIP expenditures across geographical space, there was substantial variation in
expenditure across the 10 regions (Figure 13), as in the case of MoFA. The average annual amount spent
per unit area was highest in the Greater Accra region (GH¢ 13.2 per square kilometer), followed by the
Central (GH¢ 8.7), Eastern (GH¢ 6.7), and Upper East (GH¢ 5.2) regions, while the Northern, Upper
West, and Brong-Ahafo accounted for the least expenditures, with GH¢ 1.4, 2.4, and 2.6 per square
kilometer, respectively. In terms of per capita distribution, however, the Upper West region was in front
of the pack, with GH¢ 0.07 per capita, while the Greater Accra region was at the bottom with GH¢ 0.02
per capita.
Figure 13. AgSSIP expenditures in regions and districts
Source: MoFA.
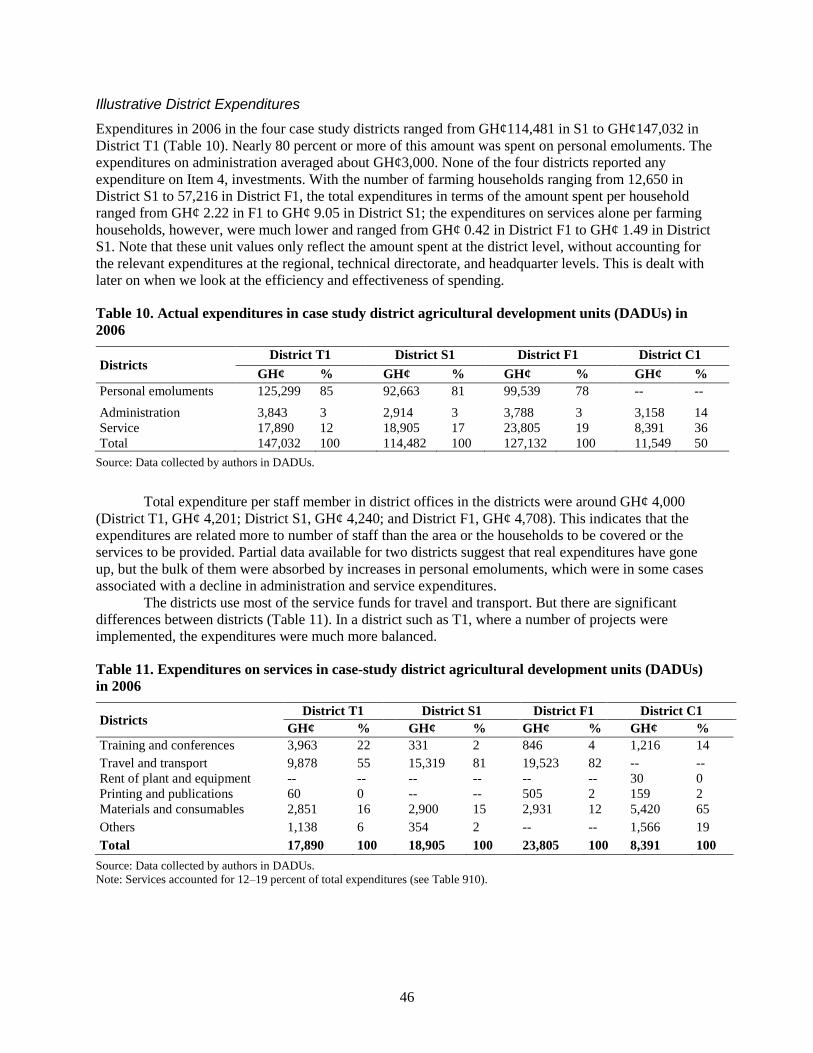
46
Illustrative District Expenditures
Expenditures in 2006 in the four case study districts ranged from GH¢114,481 in S1 to GH¢147,032 in
District T1 (Table 10). Nearly 80 percent or more of this amount was spent on personal emoluments. The
expenditures on administration averaged about GH¢3,000. None of the four districts reported any
expenditure on Item 4, investments. With the number of farming households ranging from 12,650 in
District S1 to 57,216 in District F1, the total expenditures in terms of the amount spent per household
ranged from GH¢ 2.22 in F1 to GH¢ 9.05 in District S1; the expenditures on services alone per farming
households, however, were much lower and ranged from GH¢ 0.42 in District F1 to GH¢ 1.49 in District
S1. Note that these unit values only reflect the amount spent at the district level, without accounting for
the relevant expenditures at the regional, technical directorate, and headquarter levels. This is dealt with
later on when we look at the efficiency and effectiveness of spending.
Table 10. Actual expenditures in case study district agricultural development units (DADUs) in
2006
Districts District T1 District S1 District F1 District C1
GH¢ % GH¢ % GH¢ % GH¢ %
Personal emoluments 125,299 85 92,663 81 99,539 78 -- --
Administration 3,843 3 2,914 3 3,788 3 3,158 14
Service 17,890 12 18,905 17 23,805 19 8,391 36
Total 147,032 100 114,482 100 127,132 100 11,549 50
Source: Data collected by authors in DADUs.
Total expenditure per staff member in district offices in the districts were around GH¢ 4,000
(District T1, GH¢ 4,201; District S1, GH¢ 4,240; and District F1, GH¢ 4,708). This indicates that the
expenditures are related more to number of staff than the area or the households to be covered or the
services to be provided. Partial data available for two districts suggest that real expenditures have gone
up, but the bulk of them were absorbed by increases in personal emoluments, which were in some cases
associated with a decline in administration and service expenditures.
The districts use most of the service funds for travel and transport. But there are significant
differences between districts (Table 11). In a district such as T1, where a number of projects were
implemented, the expenditures were much more balanced.
Table 11. Expenditures on services in case-study district agricultural development units (DADUs)
in 2006
Districts District T1 District S1 District F1 District C1
GH¢ % GH¢ % GH¢ % GH¢ %
Training and conferences 3,963 22 331 2 846 4 1,216 14
Travel and transport 9,878 55 15,319 81 19,523 82 -- --
Rent of plant and equipment -- -- -- -- -- -- 30 0
Printing and publications 60 0 -- -- 505 2 159 2
Materials and consumables 2,851 16 2,900 15 2,931 12 5,420 65
Others 1,138 6 354 2 -- -- 1,566 19
Total 17,890 100 18,905 100 23,805 100 8,391 100
Source: Data collected by authors in DADUs.
Note: Services accounted for 12–19 percent of total expenditures (see Table 910).
47
Financial Management: Budget Processes
The budget process for all MDAs is guided by the central government’s Medium-Term Expenditure
Framework (MTEF), following a budget cycle from January to December, with the exception of the
COCOBOD, which is an autonomous state agency with its own budget cycle from October to September.
The MTEF, which was introduced in 1999, is a major component of the government’s Public Financial
Management Reform Programme. The overall goal of MTEF is to help ―correct observed weaknesses in
the preparation and execution of the national budget‖… and to address ―the budgetary implications of the
capital budget on recurrent expenditure.‖9 In practice, MTEF is intended to accomplish the following:
Link budget expenditures more closely to national priorities through a national strategic
planning process;
Integrate aid-finance programs and policies into mainstream sector resource allocation
processes;
Elaborate on three-year sector expenditure proposals, based on anticipated resource
availability; and
Develop an activity- or performance-based budget system that enhances the ability of
government to monitor expenditure efficiency and effectiveness by linking expenditure
directly with outputs.
In preparing their budgets, MDAs are expected to develop a mission statement (situated within a
sector strategic plan), outlining sector aims, objectives, outputs, and activities, based on the government’s
development framework, the Growth and Poverty Reduction Strategy (GPRS-II). These objectives and
associated outputs are then arranged in order of priority by each MDA for approval by Parliament.
MTEF in Practice at MoFA
This section focuses on the budgeting process and the challenges it presents to MoFA, on the assumption
that the Ministry and its related departments and agencies are largely representative of others within the
national government and in the sector. Budget preparation for MoFA occurs in February and March of
every year. In February, the Ministry undertakes its annual review of sector performance, looking at
financial and program targets and performance. The ensuing report is then reviewed by the various heads
of the Ministry and used as the basis for preparation of the Ministry’s annual work plan, which in turn is
based on FASDEP.
During April and May, the annual work plan (as well as the guidelines for the preparation of the
budget estimates released by MoFEP), is disseminated to all the cost centers, including the RADUs and
DADUs, to guide them in the preparation of their own annual work plans and budgets. Because these
centers are expected to prepare their budgets according to their established needs and in line with the
priorities of the government’s GPRS, they are not provided with financial ceilings at this stage; this is
done later in the process.
The cost centers are expected to submit their plans and budgets to MoFA headquarters in June or
July. By that time the Ministry will have established the ceilings for the various cost centers. MoFA then
uses customized software to capture the data from the cost centers, which number about 240. On the
basis of MoFEP’s financial ceilings, MoFA then adjusts (invariably downward) the plans and budgets
submitted by the cost centers in line with the Ministry’s stipulated priorities. The cost centers are then
asked to revise their plans and budgets in accordance with the new ceilings proposed by MoFEP and to
resubmit them to MoFA.
Following revision and resubmission of budgets by the cost centers, MoFA prepares a Ministry-
wide draft budget for onward submission to MOFEP, which incorporates it into the national government’s
annual budget and policy statement. This is presented to Parliament in November—one month before the
end of the fiscal year. As part of the budget hearings that follow in Parliament, representatives of MoFA
9 Government of Ghana, Budget Statement, 1999, paragraph 4.
48
later appear before the Parliamentary Sub-committee on Food and Agriculture and Cocoa Affairs to
defend the budget and ask for its approval.
MTEF in Practice at the Local Level
At the local government (district) level, the budget process starts with the explicit statement of the overall
and associated objectives of agricultural policy (for example, the attainment of food security and reduced
variability in farm incomes), followed by the completion of Form 1 (the Planning Form), which
establishes output details based on policy and, ideally, the stated needs of the intended beneficiaries, such
as farmers. At this planning stage, a DADU may state, for example, that the production of staple crops,
such as maize and plantain, is to be increased by a certain percentage over a given period—usually three
years, in accordance with the medium-term orientation of MTEF. The output is then ranked in order of
priority (again according to policy-based criteria). The number of years required to attain the output is
also spelled out alongside the priority ranking of each output.
Once this is completed, a costing exercise for the personnel required (Form 2), administration
(Form 3), and activities (Form 4) is undertaken. The results serve as the basis for the district’s MTEF
budget proposal to the central government, covering the four items listed above. Typically, the proposal
is revised (downward) by the DADU to conform to the counterproposals from MoFEP that set spending
ceilings for MDAs. The revised figures, which form the district’s budget for a given fiscal year, are then
forwarded to headquarters for revision and reformulation.
It is apparent, both at the central and local government levels, that the initial budget figures are
revised without adjustments to the initial objectives and outputs. This raises concerns about achieving the
goals of the MTEF, particularly the first and fourth expected outcomes listed above linking expenditures
with national priorities and developing an activity or performance-based system. It reflects the lack of
capacity for planning and budgeting and the rigidity of the organizational structure for effectively
allocating limited resources, leading to the low capital-recurrent expenditure ratio in the sector. This in
turn points to the notion that simply paying staff salaries, administrative costs, and other overheads is
unlikely to yield any substantive growth and development outcomes.
Interviews with MoFA staff reveal a wide range of challenges in both budget preparation and
execution, despite the use of MTEF. They describe the collation of data and data capture in the budget
process as cumbersome, since it involves many cost centers and large volumes of data. The
recommendations of the previous Public Expenditure and Institutional Review to fund the MoFA budget
appear to have gone largely unheeded.
The financial ceilings set by MoFEP to guide the Ministry in its budget preparation were said to
arrive late most times, forcing staff to rush through document preparation. This creates problems because
the numerous cost centers are spread around the country, and communication between them and
headquarters is limited and difficult. Mobile phones and radio are the principal means of communication
between headquarters and these far-flung cost centers. Only headquarters have email facilities, which are
not always reliable.
Although projects and programs can in principle be carried over to subsequent years under
MTEF, this is seldom done. Instead, cost centers prefer to start afresh at the beginning of every budget
cycle, which has the tendency to slow the process and eventually weaken the quality of the budget.
While the previous system used ―capital‖ and ―recurrent‖ expenditure categories, MTEF requires
all MDAs to prepare their budgets according to the four categories mentioned in Table 12, which were
said to better reflect the implications of development activities for public expenditures and thus facilitate
more predictable budgets. However, as shown below, the putative benefits of MTEF for sector budgets
have yet to be realized; serious weaknesses remain even 10 years after the introduction of MTEF.
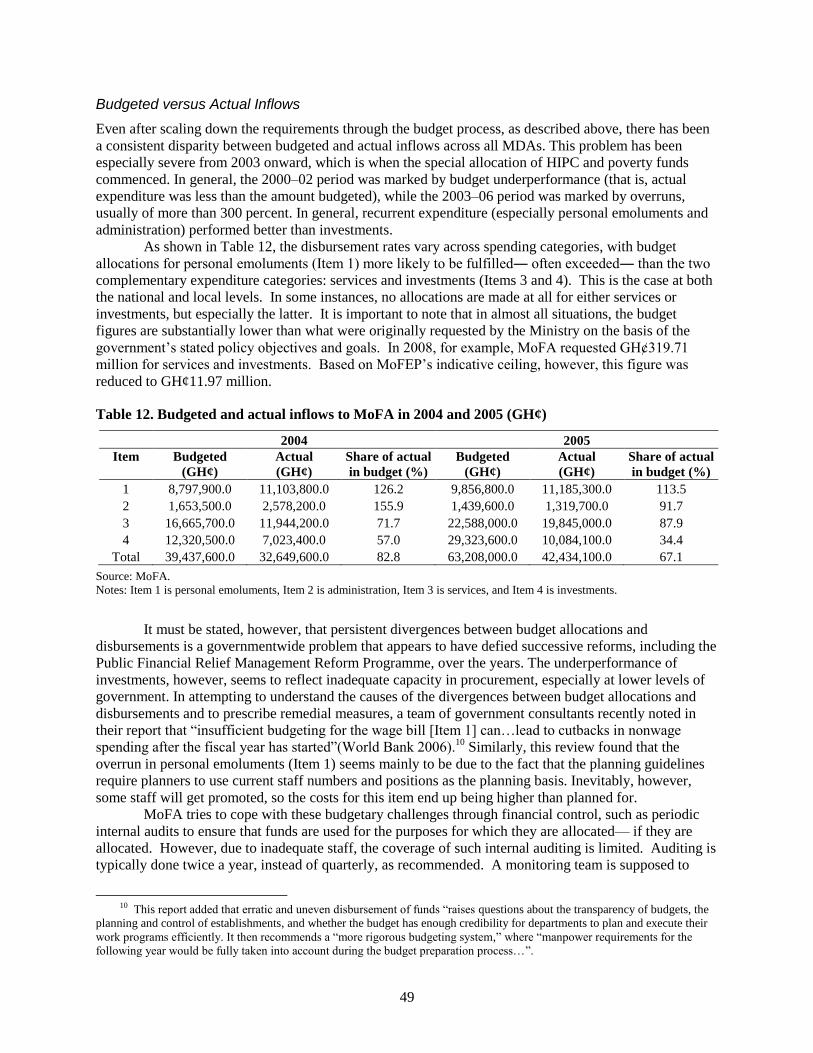
49
Budgeted versus Actual Inflows
Even after scaling down the requirements through the budget process, as described above, there has been
a consistent disparity between budgeted and actual inflows across all MDAs. This problem has been
especially severe from 2003 onward, which is when the special allocation of HIPC and poverty funds
commenced. In general, the 2000–02 period was marked by budget underperformance (that is, actual
expenditure was less than the amount budgeted), while the 2003–06 period was marked by overruns,
usually of more than 300 percent. In general, recurrent expenditure (especially personal emoluments and
administration) performed better than investments.
As shown in Table 12, the disbursement rates vary across spending categories, with budget
allocations for personal emoluments (Item 1) more likely to be fulfilled― often exceeded― than the two
complementary expenditure categories: services and investments (Items 3 and 4). This is the case at both
the national and local levels. In some instances, no allocations are made at all for either services or
investments, but especially the latter. It is important to note that in almost all situations, the budget
figures are substantially lower than what were originally requested by the Ministry on the basis of the
government’s stated policy objectives and goals. In 2008, for example, MoFA requested GH¢319.71
million for services and investments. Based on MoFEP’s indicative ceiling, however, this figure was
reduced to GH¢11.97 million.
Table 12. Budgeted and actual inflows to MoFA in 2004 and 2005 (GH¢)
2004 2005
Item Budgeted
(GH¢)
Actual
(GH¢)
Share of actual
in budget (%)
Budgeted
(GH¢)
Actual
(GH¢)
Share of actual
in budget (%)
1 8,797,900.0 11,103,800.0 126.2 9,856,800.0 11,185,300.0 113.5
2 1,653,500.0 2,578,200.0 155.9 1,439,600.0 1,319,700.0 91.7
3 16,665,700.0 11,944,200.0 71.7 22,588,000.0 19,845,000.0 87.9
4 12,320,500.0 7,023,400.0 57.0 29,323,600.0 10,084,100.0 34.4
Total 39,437,600.0 32,649,600.0 82.8 63,208,000.0 42,434,100.0 67.1
Source: MoFA.
Notes: Item 1 is personal emoluments, Item 2 is administration, Item 3 is services, and Item 4 is investments.
It must be stated, however, that persistent divergences between budget allocations and
disbursements is a governmentwide problem that appears to have defied successive reforms, including the
Public Financial Relief Management Reform Programme, over the years. The underperformance of
investments, however, seems to reflect inadequate capacity in procurement, especially at lower levels of
government. In attempting to understand the causes of the divergences between budget allocations and
disbursements and to prescribe remedial measures, a team of government consultants recently noted in
their report that ―insufficient budgeting for the wage bill [Item 1] can…lead to cutbacks in nonwage
spending after the fiscal year has started‖(World Bank 2006).10
Similarly, this review found that the
overrun in personal emoluments (Item 1) seems mainly to be due to the fact that the planning guidelines
require planners to use current staff numbers and positions as the planning basis. Inevitably, however,
some staff will get promoted, so the costs for this item end up being higher than planned for.
MoFA tries to cope with these budgetary challenges through financial control, such as periodic
internal audits to ensure that funds are used for the purposes for which they are allocated— if they are
allocated. However, due to inadequate staff, the coverage of such internal auditing is limited. Auditing is
typically done twice a year, instead of quarterly, as recommended. A monitoring team is supposed to
10 This report added that erratic and uneven disbursement of funds ―raises questions about the transparency of budgets, the
planning and control of establishments, and whether the budget has enough credibility for departments to plan and execute their
work programs efficiently. It then recommends a ―more rigorous budgeting system,‖ where ―manpower requirements for the
following year would be fully taken into account during the budget preparation process…‖.
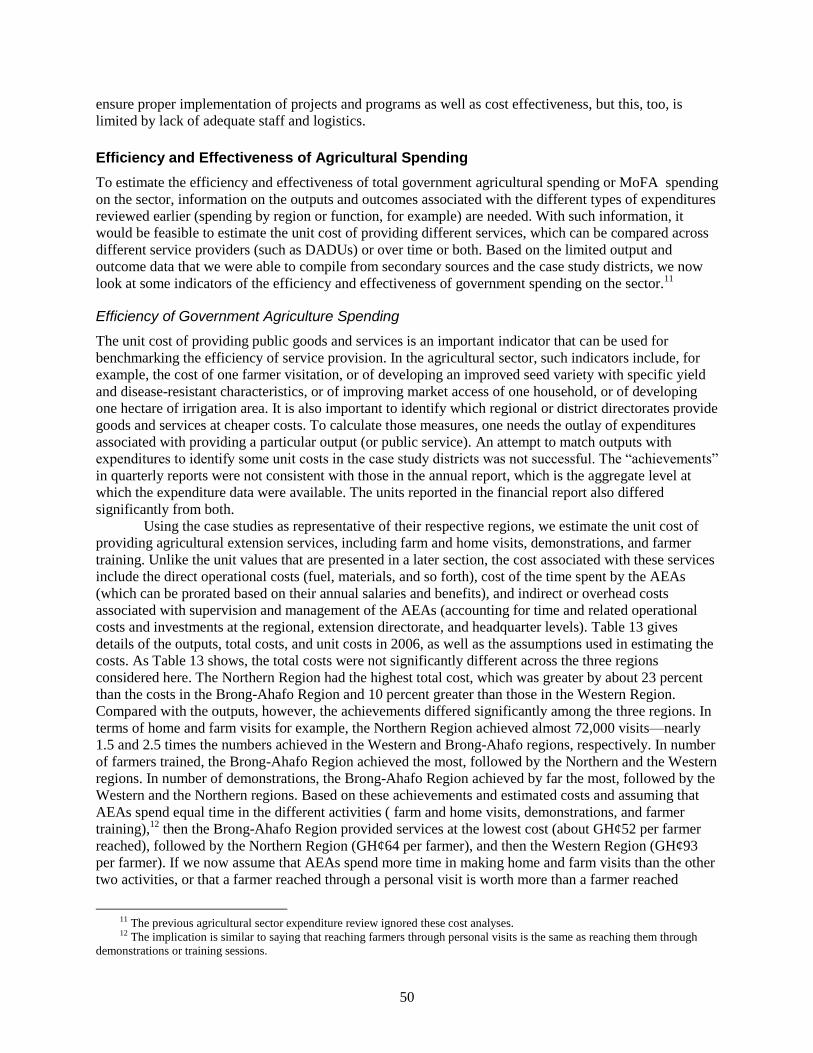
50
ensure proper implementation of projects and programs as well as cost effectiveness, but this, too, is
limited by lack of adequate staff and logistics.
Efficiency and Effectiveness of Agricultural Spending
To estimate the efficiency and effectiveness of total government agricultural spending or MoFA spending
on the sector, information on the outputs and outcomes associated with the different types of expenditures
reviewed earlier (spending by region or function, for example) are needed. With such information, it
would be feasible to estimate the unit cost of providing different services, which can be compared across
different service providers (such as DADUs) or over time or both. Based on the limited output and
outcome data that we were able to compile from secondary sources and the case study districts, we now
look at some indicators of the efficiency and effectiveness of government spending on the sector.11
Efficiency of Government Agriculture Spending
The unit cost of providing public goods and services is an important indicator that can be used for
benchmarking the efficiency of service provision. In the agricultural sector, such indicators include, for
example, the cost of one farmer visitation, or of developing an improved seed variety with specific yield
and disease-resistant characteristics, or of improving market access of one household, or of developing
one hectare of irrigation area. It is also important to identify which regional or district directorates provide
goods and services at cheaper costs. To calculate those measures, one needs the outlay of expenditures
associated with providing a particular output (or public service). An attempt to match outputs with
expenditures to identify some unit costs in the case study districts was not successful. The ―achievements‖
in quarterly reports were not consistent with those in the annual report, which is the aggregate level at
which the expenditure data were available. The units reported in the financial report also differed
significantly from both.
Using the case studies as representative of their respective regions, we estimate the unit cost of
providing agricultural extension services, including farm and home visits, demonstrations, and farmer
training. Unlike the unit values that are presented in a later section, the cost associated with these services
include the direct operational costs (fuel, materials, and so forth), cost of the time spent by the AEAs
(which can be prorated based on their annual salaries and benefits), and indirect or overhead costs
associated with supervision and management of the AEAs (accounting for time and related operational
costs and investments at the regional, extension directorate, and headquarter levels). Table 13 gives
details of the outputs, total costs, and unit costs in 2006, as well as the assumptions used in estimating the
costs. As Table 13 shows, the total costs were not significantly different across the three regions
considered here. The Northern Region had the highest total cost, which was greater by about 23 percent
than the costs in the Brong-Ahafo Region and 10 percent greater than those in the Western Region.
Compared with the outputs, however, the achievements differed significantly among the three regions. In
terms of home and farm visits for example, the Northern Region achieved almost 72,000 visits—nearly
1.5 and 2.5 times the numbers achieved in the Western and Brong-Ahafo regions, respectively. In number
of farmers trained, the Brong-Ahafo Region achieved the most, followed by the Northern and the Western
regions. In number of demonstrations, the Brong-Ahafo Region achieved by far the most, followed by the
Western and the Northern regions. Based on these achievements and estimated costs and assuming that
AEAs spend equal time in the different activities ( farm and home visits, demonstrations, and farmer
training),12
then the Brong-Ahafo Region provided services at the lowest cost (about GH¢52 per farmer
reached), followed by the Northern Region (GH¢64 per farmer), and then the Western Region (GH¢93
per farmer). If we now assume that AEAs spend more time in making home and farm visits than the other
two activities, or that a farmer reached through a personal visit is worth more than a farmer reached
11 The previous agricultural sector expenditure review ignored these cost analyses. 12 The implication is similar to saying that reaching farmers through personal visits is the same as reaching them through
demonstrations or training sessions.
51
through a demonstration or a training session, then the Northern Region was the provider with the least
cost per farmer (about GH¢51 per farmer reached), followed by the Brong-Ahafo Region (GH¢66 per
farmer), and then the Western Region (GH¢85 per farmer). Providing extension services was relatively
more expensive in the Western Region. Across the board, however, the amount spent on operations
constituted only about 8.5 percent of the total costs. This is quite low and raises concerns about the
quality of the services delivered. It also suggests that there is lots of room for improving the number of
farmers reached by raising the amount and share of resources spent on operations, especially services.
Basically, AEAs are spending too much time trying to reach farmers. As we will see later, AEAs in the F1
DADU (representing the Western Region) cover a relatively smaller area and so travel relatively shorter
distances; therefore, they also have fewer motorbikes and reach fewer farmers than the other two DADUs
considered here.
Table 13. Cost of providing extension services by MoFA in selected regions, 2006
Brong-Ahafo Region Northern Region Western Region
Costs (GH¢)
Salaries and benefits 2,061,752 2,264,505 1,841,860
Operations 203,744 223,780 182,014
Overhead a 124,959 137,247 111,631
Total 2,390,455 2,625,532 2,135,506
Achievements
Number of home and farm visits 20,871 71,934 29,076
Number of demonstrations 6,012 628 1,600
Number of farmers trained 58,175 45,526 23,750
Unit cost (GH¢ per farmer reached)b
Equally weighted c 52 64 93
Unequally weighted d 66 51 85
Sources: Authors’ calculations based on Government Financial Statistics (Office of the Accountant General), 2006; MoFA
releases to cost centers; and 2006 annual reports of MoFA cost centers.
a Based on expenditure allocations of 11 percent by total headquarters (including directorates) to the Extension Services
Directorate, and 9.5, 10.5, and 8.5 percent of total RADU and DADU expenditure allocations to the Brong-Ahafo, Northern, and
Western RADUs and DADUs, respectively.
b Assumes 10 farmers are reached in each demonstration.
c Assumes equal weights to home visits, demonstrations, and training in terms of time spent by AEAs in those activities.
d Assumes weights to home visits of 60 percent; demonstrations, 25 percent; and training, 15 percent.
These estimated unit costs may have some implications for improving the efficiency of service
delivery vis-à-vis the recently introduced practice of releasing funds for service activities with clear
proposed allocations to various staff members and activities, which reflects the Ministry’s estimation of
incremental costs of providing various services or their priorities in allocating limited funds to
performance of various functions. For the second quarter of 2008, for example, each AEA was allocated
GH¢ 200 for home/farm visits at the rate of GH¢50 per month and GH¢ 50 for organizing extension field
days. They were also allocated GH¢500 annually to conduct demonstrations on five acres. Their
supervisors, the DDOs, were allocated GH¢300 for monitoring demonstrations at the rate of GH¢100 per
month. The district veterinary officers, on the other hand, were allocated GH¢1,350 for disease
surveillance, clinical cause, and supervision. The DDA is obligated to make funds available to their staff
according to these guidelines and to retain GH¢1,000 for vehicle maintenance, GH¢ 300 for promotion of
local foods, GH¢ 1,200 for coordination, GH¢ 300 for field work supervision, and GH¢ 30 per AEA per
quarter for training. The regional officers and directors were allocated GH¢ 900, GH¢ 1,890, and GH¢
8,770, respectively. These can be combined with annual performance appraisals to establish an incentive
system that rewards units or individuals that achieve greater efficiency in terms of the number of farmers
reached per unit of allocation or the actual amount spent to reach a farmer.
52
Effectiveness of Government Agriculture Spending
In contrast to conducting unit cost analysis, assessing the effectiveness of government expenditure on
sector outcomes requires sophisticated quantitative methods, because there are several channels through
which different types of agriculture expenditure can have impacts, the effect of investments often occur
with a lag, and the effects of several factors outside the control of those in charge of implementing
programs need to be accounted for. The impacts can be direct or indirect and can be assessed at several
levels, beginning with the farm household through the district and region to the national level. National
budgets also tend to ignore the outcomes and impacts of their public spending, as well as the types of
linkage and related information that are needed for undertaking such an analysis. The MTEF document,
for example, only specifies the objective, the output to be produced, and the inputs or resources required.
In terms of outcome indicators that need to be monitored for MoFA to effectively track progress
in delivering on its mandate as stated in FASDEP II and to monitor and evaluate the sector’s contribution
toward achievement of the overall growth and development objectives of the country as stated in GPRS
II, the information presented in MoFA’s annual reports suggests that MoFA is already doing a good job in
tracking most of the main indicators. In the 2006 annual report, for example, indicators reported on
include agricultural production, trade (export), employment, prices, and income. Many of these are
reported by subsector, although the emphasis is more on the crop subsector due to acknowledged data
problems. The report also tries to show the sector’s contribution to overall GDP, growth, poverty
reduction, and food security. What is lacking is the story of the contribution of the government’s
agricultural investments and programs in general, or of MoFA’s investments and programs in particular.
The same 2006 annual report states that ―agro-climatic conditions were favorable for crop and livestock
production‖ and ―there was limited occurrence of pests, diseases, and epidemics‖, which suggests that the
achievements in the agricultural sector cannot be solely attributed to the government’s agricultural
investments and programs. To tell the MoFA story, quantitative methods (for example, correlation,
regression) are necessary, and the analysis should be founded on a sound theoretical framework of
causality (that is, inputsoutputsoutcomes) (see, for example, Benin et al. 2008a) that shows how the
outputs of the investments and programs are interacting with farmers’ (and other target populations’)
assets and activities to arrive at the outcomes of interest. Resources should be directed at improving such
quantitative and analytical skills of the policy analysis unit.
For this review, it is necessary to look at the effect of expenditures on the attainment (or
nonattainment) of stated goals and objectives, including increasing agricultural productivity, increasing
household agricultural incomes, and reducing poverty among agricultural households. These are directly
related to the performance of the agriculture sector. Due to data constraints, however, we have to look at
higher level or more inclusive outcomes without loss of causality. This is because agricultural
development has a widely known role of raising overall household incomes and reducing overall poverty,
since the majority of the population lives in rural areas (about 55 percent) and depends on agriculture for
their livelihoods. It is also in the agriculture sector that the poor are concentrated. Moreover, agricultural
growth generates resources and labor for the nonagricultural sector and provides markets for industrial
outputs. By reducing food prices too, agricultural growth raises real incomes of both rural and urban
residents, which leads to overall poverty reduction. Thus, assessing the impact of government agriculture
expenditure on income and poverty is the ultimate performance assessment or a measure of the
effectiveness of government expenditure on outcomes.
Continuing with the spatial perspective, GLSS 5 data show that most of the increase in household
incomes and reduction in poverty was concentrated in the south. Between 1991/92 and 2005/06, real
household income per capita increased only modestly in the Northern Region but declined in the two
Upper regions. Poverty, which has declined only marginally in these three regions, still remains very
high, deepening the inequality between the north and south. With the bulk of the population living in rural
areas and depending on agriculture for their livelihoods, Figure 14 shows how the low income and high
poverty rate in northern Ghana is reflected in the low agricultural productivity there, especially in the
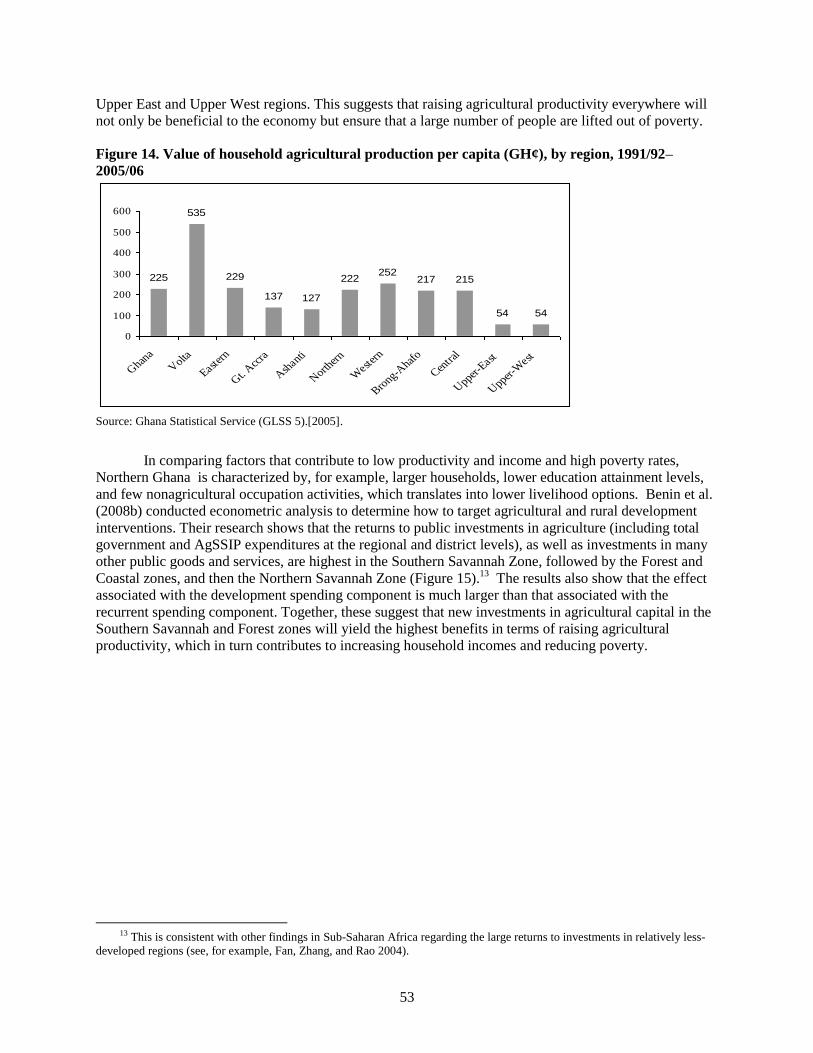
53
Upper East and Upper West regions. This suggests that raising agricultural productivity everywhere will
not only be beneficial to the economy but ensure that a large number of people are lifted out of poverty.
Figure 14. Value of household agricultural production per capita (GH¢), by region, 1991/92–
2005/06
Source: Ghana Statistical Service (GLSS 5).[2005].
In comparing factors that contribute to low productivity and income and high poverty rates,
Northern Ghana is characterized by, for example, larger households, lower education attainment levels,
and few nonagricultural occupation activities, which translates into lower livelihood options. Benin et al.
(2008b) conducted econometric analysis to determine how to target agricultural and rural development
interventions. Their research shows that the returns to public investments in agriculture (including total
government and AgSSIP expenditures at the regional and district levels), as well as investments in many
other public goods and services, are highest in the Southern Savannah Zone, followed by the Forest and
Coastal zones, and then the Northern Savannah Zone (Figure 15).13
The results also show that the effect
associated with the development spending component is much larger than that associated with the
recurrent spending component. Together, these suggest that new investments in agricultural capital in the
Southern Savannah and Forest zones will yield the highest benefits in terms of raising agricultural
productivity, which in turn contributes to increasing household incomes and reducing poverty.
13 This is consistent with other findings in Sub-Saharan Africa regarding the large returns to investments in relatively less-
developed regions (see, for example, Fan, Zhang, and Rao 2004).
225
535
229
137 127
222252
217 215
54 54
0
100
200
300
400
500
600
Ghan
a
Volta
E
astern
G
t. A
ccra
A
shan
ti
N
orther
n
Weste
rn
Bro
ng-Ahaf
o
C
entra
l
U
pper-E
ast
Upper
-West
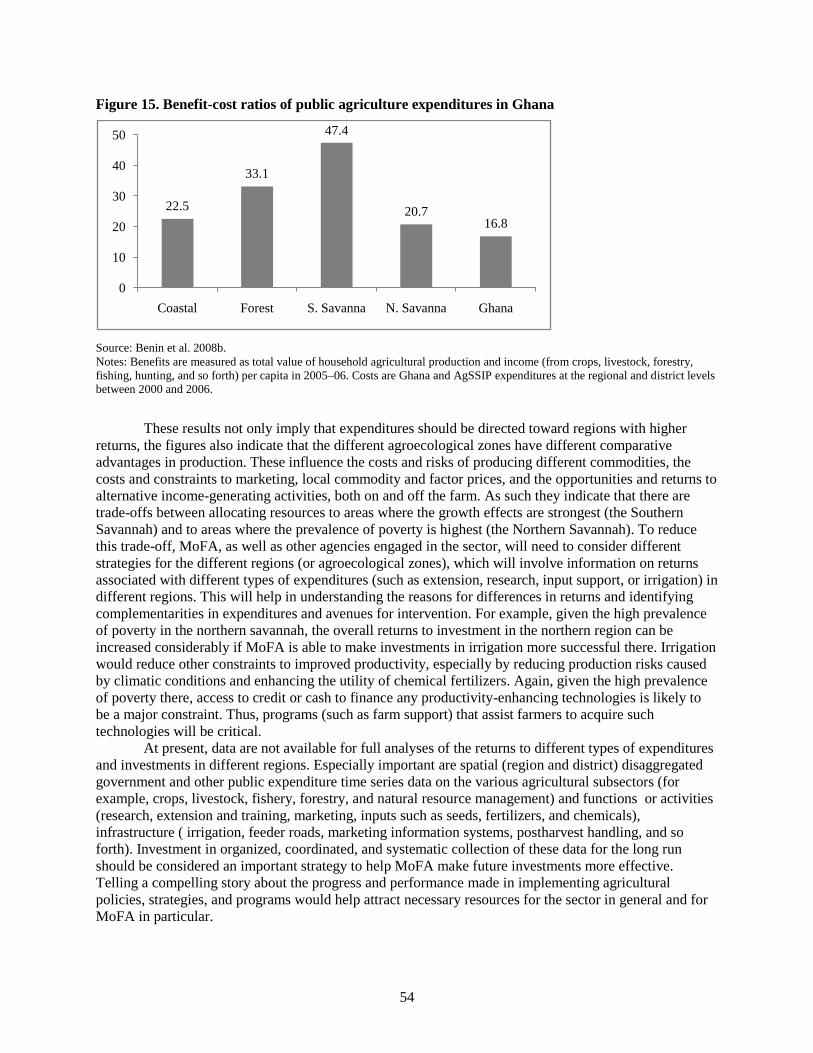
54
Figure 15. Benefit-cost ratios of public agriculture expenditures in Ghana
.
Source: Benin et al. 2008b.
Notes: Benefits are measured as total value of household agricultural production and income (from crops, livestock, forestry,
fishing, hunting, and so forth) per capita in 2005–06. Costs are Ghana and AgSSIP expenditures at the regional and district levels
between 2000 and 2006.
These results not only imply that expenditures should be directed toward regions with higher
returns, the figures also indicate that the different agroecological zones have different comparative
advantages in production. These influence the costs and risks of producing different commodities, the
costs and constraints to marketing, local commodity and factor prices, and the opportunities and returns to
alternative income-generating activities, both on and off the farm. As such they indicate that there are
trade-offs between allocating resources to areas where the growth effects are strongest (the Southern
Savannah) and to areas where the prevalence of poverty is highest (the Northern Savannah). To reduce
this trade-off, MoFA, as well as other agencies engaged in the sector, will need to consider different
strategies for the different regions (or agroecological zones), which will involve information on returns
associated with different types of expenditures (such as extension, research, input support, or irrigation) in
different regions. This will help in understanding the reasons for differences in returns and identifying
complementarities in expenditures and avenues for intervention. For example, given the high prevalence
of poverty in the northern savannah, the overall returns to investment in the northern region can be
increased considerably if MoFA is able to make investments in irrigation more successful there. Irrigation
would reduce other constraints to improved productivity, especially by reducing production risks caused
by climatic conditions and enhancing the utility of chemical fertilizers. Again, given the high prevalence
of poverty there, access to credit or cash to finance any productivity-enhancing technologies is likely to
be a major constraint. Thus, programs (such as farm support) that assist farmers to acquire such
technologies will be critical.
At present, data are not available for full analyses of the returns to different types of expenditures
and investments in different regions. Especially important are spatial (region and district) disaggregated
government and other public expenditure time series data on the various agricultural subsectors (for
example, crops, livestock, fishery, forestry, and natural resource management) and functions or activities
(research, extension and training, marketing, inputs such as seeds, fertilizers, and chemicals),
infrastructure ( irrigation, feeder roads, marketing information systems, postharvest handling, and so
forth). Investment in organized, coordinated, and systematic collection of these data for the long run
should be considered an important strategy to help MoFA make future investments more effective.
Telling a compelling story about the progress and performance made in implementing agricultural
policies, strategies, and programs would help attract necessary resources for the sector in general and for
MoFA in particular.
22.5
33.1
47.4
20.716.8
0
10
20
30
40
50
Coastal Forest S. Savanna N. Savanna Ghana
55
Effect of Expenditures on the Other Sectors
The study by Benin et al. (2008b) also shows that provision of other public goods and services, for
example in the rural roads and health sectors, also had a substantial effect on raising agricultural
productivity. Formal education, on the other hand, was found to be negatively associated with agricultural
productivity, because skilled labor was drawn away from the farm. These results highlight the importance
of complementary investments. Therefore, MoFA should increase resources and actively engage in the
strategic planning of other sectors to leverage or advocate for more resources in those sectors to be
allocated toward activities that contribute to raising agricultural productivity.
Effect of Decentralization of Government Agriculture Spending
It well known that decentralization is expected to lead to greater allocative efficiency of public resources,
as decentralized governments or units have better information about the need for and requirements of
public services in their jurisdictions. However, what we observe in the sector currently is deconcentration
of agricultural expenditures―that is, greater resources are being spent at the lower levels of government
(regions and districts), rather than decentralization of agricultural expenditures, which should come with
some autonomy in raising and spending resources, as in the case of the District Assemblies. Also, the
District Assemblies currently do not exercise any discretion over agricultural expenditures in their
jurisdictions. Therefore, it is premature to analyze ex post the effect of decentralization of government
agricultural expenditures. Should decentralization be accompanied by an incentive structure that promotes
greater accountability for budget decisions, including budget execution and monitoring and evaluation,
the difficulty of obtaining time-series, spatially disaggregated public expenditure data on the entire sector
is likely to ease, as has been the case with District Assemblies for the past 10 years (see Mogues, Benin,
and Cudjoe 2007).
56
4. RECOMMENDATIONS
This review has examined MoFA’s functioning using a conceptual framework that examines how various
aspects of organizational structure, processes, resources, and accountability interact with each other to
result in overall performance. The analysis based on this framework leads to two interlinked conclusions:
that capacity and incentives must both be improved.
Strengthening Capacity and Incentives
Organizational capacity cannot be translated into performance without suitable incentives.
Strengthening capacity at the individual or organizational levels without suitable incentives or
sanctions for good or poor performance will not be effective. A necessary condition therefore
is to make MoFA accountable for results. This is particularly necessary because there doesn’t
appear to be a discernable work culture that is strong enough to focus attention on outcomes
in the absence of pressures on the organization.
Prioritizing and sequencing reforms is also crucial. Organizational capacity development
requires coordinated reforms of processes, structures, relationships, and resources available to
the organization. In particular, the need to combine capacity development with incentives has
implications for prioritizing reforms. Merely increasing the resources available to the
Ministry may not improve performance in terms of engendering productivity changes in the
sector, for example, because of the limitations identified by the review. Resources to do more
of the same will thus not lead to improved outcomes. Moreover, it would be difficult to raise
additional resources without the Ministry being perceived to be effective in fostering
technical change in the sector. Similarly, investing in capacity building that focuses on
individual capacities would not lead to desired outcomes if individual capacities are not
harnessed with an outcome orientation. Therefore, reforms need to be sequenced so as to
establish incentives before easing the most binding constraints to improving organizational
capacity.
Creating Ownership for the Reform Process
What would be the most effective way to identify, prioritize, and introduce reforms? External agents can
be very effective in identifying the limitations to improving performance of an organization. However, for
the following two reasons, they are not usually effective in identifying the reforms needed to overcome
the limitations and designing their implementation. First, those in the organization itself are usually in a
better position to identify the most effective reforms. (To some extent this problem can be overcome
through consultations, and we had extensive consultations with current and retired staff.) Second and
more important, reforms identified by the organization will have greater ownership and a better chance of
being implemented.
An appropriate process therefore needs to begin with an internal review of the findings of the
study. We identity four key outcomes that the organization should seek to achieve in order to improve its
performance—the absence of these is a limitation to improving performance. We also offer a wide range
of specific reforms that are needed to achieve the key outcomes. Prioritizing them is best done internally.
The four key outcomes that the organization should seek to achieve to improve its performance
presented here are not in any order of priority because the achievement of any of them will require the
achievement of others as well, but it would be useful to begin with efforts to reorient the organization
toward results. The reforms to improve MoFA’s performance need to achieve the following four
outcomes:
57
1. Strategic direction and results orientation that focus on closing productivity gaps for key
crops in the sector to strengthen competitiveness and improve natural resource
management;
2. Improved intra- and interorganizational linkages and processes to strengthen
development, assessment, and dissemination of technologies to more effectively bring
science and technology to bear on the problems and opportunities in the sector;
3. Improved human resource management practices that effectively use existing capabilities,
enhance organizational learning, and offer opportunities for professional growth; and
4. Increased thrust on improving expenditure management, demonstrating returns to
investments, articulating needs, attracting investments, and leveraging resources in the
sector.
Next we present detailed recommendations to achieve these outcomes. These recommendations
cut across a number of issues that were identified in the original terms of reference such as accountability,
management processes, and human resources management.
Strategic Direction with Results Orientation
Clarity of purpose and a focus on outcomes are essential for the Ministry to become effective. A number
of conditions need to be in place to achieve results orientation: (1) clearly articulated and owned
strategies, with measurable outcomes identified;( 2) effective internal communication to develop a shared
vision and awareness of the progress being implemented; (3) collection and analysis of information on the
outcomes; and finally (4) accountability for outcomes.
MoFA can rely on an up-to-date policy and implementation framework, which has been
developed with broad stakeholder consultations. However, strategic direction is particularly difficult to
obtain and maintain in an organization in which its decentralized units are expected to be responsive to
local needs. As extension becomes more demand-driven and adaptable, field staff and their supervisors
may be under pressure to adopt piecemeal approaches to meeting farmer needs. Complex processes will
be required to ensure that local plans are consistent with national priorities and that national priorities
reflect local needs. Improved communication between various levels are key to achieving this, but the
culture of documenting and sharing information is not predominant within MoFA; the management
culture places more emphasis on personal relations and interactions than on institutional procedures, with
meetings and travel taking an inordinate share of the time of senior managers. Since disseminating
knowledge and practices is an essential task of MoFA, improving information culture and technologies
should receive high priority in the Ministry. The monitoring and evaluation system that is already in
place provides the basis for building outcome orientation by linking activities to outcomes and using the
system for effective management and control.
The recommendations to enhance outcome orientation are as follows:
1. Develop clear vision at all levels in the organization:
Communicate widely key aspects of the approved policy and the sector plan that is
being developed throughout the organization and the sector. In particular, emphasize
the outcomes that need to be achieved, such as closing the productivity gaps, to
develop a mission and outcome orientation in the organization and an appreciation
for the mission of the Ministry in the sector. As was done in the last policy revision, involve senior-level staff, the regional
directors, technical directorates, and the planning units, in developing new programs
and interventions so that they own them. Apart from building ownership, involving
staff in decisionmaking processes is essential for building capabilities and grooming
leaders. Strengthen processes to ensure that planning in decentralized units is consistent with
broader national strategies. The working of the budget committee is particularly
58
important here. As districts become accountable to local administrations through
continued decentralization, strengthen planning capabilities in the regions to maintain
strong links between the national office and the districts. The existing planning processes do a good job of linking activities to higher
objectives; introduce aspects into processes that require identification of
appropriate measurable outcomes for the planned activities.
One approach that may be considered for bringing about strategic and outcome
orientation is to focus extension efforts on a few crops and technologies that can
yield substantial productivity gains and continue with extensive coverage of
services such as veterinary.
Make DADUs accountable for results/outcomes, rather than just outputs. This
would also give them incentives to seek out effective technologies and methods.
2. Strengthen alternative modes of communication to develop a shared understanding of the
purpose and the progress the organization is making and to reduce dependence on
meetings as the primary means of communication.
Investments in infrastructure should place emphasis on communication technologies,
especially information and communication technology facilities. Particular attention
needs to be paid to offering maintenance and virus protection. Improve the internal communication culture through both technical solutions (such as
email) and culture change (such as sharing information). Share progress reports from districts, regions, and other units widely so that reports
are not treated as privileged information. 3. Make more effective use of the existing monitoring and evaluation system for
management and control.
Mainstream monitoring and evaluation into management processes by making the
system relevant to day-to-day management; managers at various levels may be asked
to identify a small set of output- and outcome-related indicators that are relevant to
their monitoring of progress in their activities. Utilize the annual Joint MoFA–Donor Partner review to strengthen orientation to
outcomes and to enhance organizational learning. Make use of expertise in the
Ministry and the donor community to examine not only the outcomes but how the
Ministry can become more effective, thus contributing to organizational learning. 4. Make various units in the organization and the organization as a whole more accountable
for outcomes.
Revise the reporting requirements to focus on outcomes, in line with the efforts to
mainstream monitoring and evaluation in the organization. Continue the tradition of annual performance reviews in which stakeholders
participate; focus on outcomes and alternative approaches to improve effectiveness. The donors may consider including outcome-oriented indicators to assess the
performance of budget support to the Ministry, as opposed to the current process-
related indicators used to evaluate sector budget support.
Strengthening Technology Development, Assessment, and Dissemination
Coordinating the development, assessment, and transfer of appropriate technologies to farmers to
facilitate agricultural transformation is the core function of an agricultural ministry that maintains a large
extension staff. MoFA is ineffective at fostering technical changes, and the absence of outcome
orientation makes MoFA’s ineffectiveness less obvious than it should be. Strengthening technology
development and transfer will require: (1) mechanisms to make the national research system more
responsive to meeting technological needs of the sector, (2) better utilization of technical capabilities in
the Ministry, (3) effective and regular assessment of technologies that are disseminated through the
59
extension system, and (4) effective technology dissemination processes with particular attention to
technical backstopping and methods of dissemination.
The effectiveness of MoFA’s links with research organizations remains an area that needs to be
better understood. The Ministry’s relationship with CSIR in particular is important. Research-Extension
Linkage Committees are one of several mechanisms that are in place to help make national research
accountable to farmers and other stakeholders. However, available evidence suggests that their
performance is rather mixed. More important, the technical capabilities in the organization are
underutilized.
1. Strengthen mechanisms to influence the working of research systems to make them more
responsive and relevant.
Use more effectively the linkages that the Ministry has with the national agricultural
research system at various levels. For example, use the Ministry’s representation on
the boards of CSIR and the Crops Research Institute; Craft arrangements with universities and research organizations that are more
effective in generating farmer-relevant technologies as the Ministry continues to be a
major source of funds for the research system and the leading implementer of many
donor-supported programs; Re-examine the role of Research Extension Farmer Linkage Committees on which a
great deal of emphasis is placed in the sector plan. 2. Strengthen the role of technical directorates and make them accountable for results as
well.
Assign responsibility for outcomes to technical directorates to incentivize them to
identify useful technologies, to backstop extension staff, and to train them in
effective dissemination methods. Make technical directorates responsible for all technical matters by requiring them to
prepare a synthesis report for the chief director. Require technical directorates to conduct an annual review of the effectiveness of
technologies and services delivered in the districts, based on reports by decentralized
units. Attention should be paid to (1) whether adoption offers farmers high enough
incremental returns, (2) whether they are used in the best environment, and (3)
whether complementary conditions exist. Assess all the technologies that are currently demonstrated for their effectiveness;
strengthen the assessment processes to routinely examine technology packages with
changes in market conditions, natural resources, and availability of new knowledge. 3. Strengthen technical backstopping:
Reduce communication barriers and increase incentives for DADUs to solicit
expertise from technical departments. Use the Ministry websites and electronic
newsletters to make information more accessible. Strengthening outcome orientation
is a necessary step to incentivize them to technical assistance. Utilize complementary communication methods to convey routine information to
farmers so that extension staff can devote more of their efforts to demonstration of
more complex technological packages. Instructional pamphlets, radio, and television
programs may be considered.
Effective Use of Human Resources
Capacity, in the sense of individual skills, is often seen as a limitation in organizations, but organizational
processes that effectively use existing capabilities and build capabilities by offering learning opportunities
may be a greater limitation. In the absence of such processes, capacity building through training may not
yield the expected benefits. In order to make more effective use of human resources, MoFA will need to
(1) improve its record keeping and develop an information system on its resources; (2) clarify the roles,
60
responsibilities, and career opportunities to be reinforced through performance assessments; (3) use the
available capacity development funds more effectively; (4) groom leadership for various directorates
through succession planning; (5) further strengthen annual performance assessments with a focus on
outcomes; and (6) effectively use available means to reward and punish staff within the limits of civil
service rules.
The inability to effectively harness existing capabilities in the Ministry lies at the core of its
performance challenges. While the Ministry is in fact endowed with reasonably well-trained and
motivated staff, the capacity of the available staff remains underutilized, particularly supervisory staff at
both district and regional levels. This does not deny the dearth of certain technical capabilities and
inadequacy of staff in certain positions. However, the Ministry does not have a database to quickly assess
the availability of skills and capabilities. One consequence of this is the inability to effectively use
training or capacity development funds earmarked for the sector. Weak manpower planning, succession
planning in particular, has resulted in many divisions in the Ministry being headed by staff in acting
positions who are close to retirement. Leadership and a suitable work culture are important to build in an
organization in which the flexibility to offer financial rewards is so limited. Additionally, adequate
communication and transport infrastructure are particularly relevant in fulfilling the tasks of the Ministry.
But the limited vehicles that are available are not used effectively and may be cornered by senior staff.
1. Allay the considerable anxieties that many staff have over questions such as how they will
function under fuller decentralization, to whom they will be accountable, whether they will
receive adequate resources to do their work, and whether their career opportunities will be
more limited.
Work with the Ministry of Local Government to better understand how the
Ministry’s units would be integrated into local governments. Inform the staff about the implications of decentralization for their work and career
opportunities. Revive the plans that were initiated several years ago to put together
change management groups. Implement assessment and promotion rules consistently, as some practices from the
old structure continue. 2. Invest in developing a Human Resources database.
Implement processes or introduce reporting requirements that would give the Human
Resources unit access to relevant information. Strengthen the coordinating role of Human Resources in evaluation, promotion, and
capacity- building decisions. 3. Initiate succession plans to identify and groom individuals to lead various units in the
Ministry.
4. Strengthen accountability of individuals by introducing reward and sanction mechanisms to
encourage good performance including using training as a reward.
Employ the instruments used currently to motivate or influence staff – resource
allocation, transfers, and so forth – to demonstrate the seriousness of evaluations. Motivate staff by recognizing good work; consider awards for performance at the
annual farmers’ day celebrations.
5. Provide the resources required to perform the work; investments in increased mobility should
be accompanied by management approaches that ensure efficient use of vehicles.
Improved Expenditure Management
Adequate and appropriate investment in the agriculture sector is central for MoFA to fulfill its mission.
Although real expenditures in the sector have been growing, the Ministry’s share in sectoral expenditures
has declined as the share going to the cocoa subsector has jumped significantly. Raising resources will be
an important aspect of improved expenditure management in the Ministry, as the staff needs to have
adequate resources in order to carry out its work and be effective. Shortfalls in communication and
61
transport infrastructure are particularly keenly felt, since they are the most relevant in fulfilling the tasks
of the Ministry. Effective use of resources, particularly with outcome orientation, will be critical to raising
additional resources. Improving expenditures management will involve (1) attracting additional resources
into the sector, (2) improving information systems and building analytical capacity that can inform
resource allocations, and (3) improving planning and expenditure practices. Better information is
becoming available, but, as the public expenditure review shows, further improvements are necessary to
make possible a meaningful assessment of expenditure effectiveness and trade-offs. Partly, these
problems are government-wide problems of financial management.
There is a tendency to see a lack of resources as limiting improvements in organizational
effectiveness. While MoFA’s resources are limited, there is scope to use the available resources more
effectively. For example, MoFA has introduced participatory planning and budgeting at the district level,
but budget planning is first done without taking any budgetary constraints into account and later ceilings
are introduced in a way that is not transparent at the district level, which essentially undermines the value
of the budgetary process at this level. Also, the recent tying of funds to various activities (tagging)
essentially divvies up resources among the staff without a clear understanding of the activities to which
they are directed. This constitutes recentralization and a reversal of efforts to make better use of resources
through decentralization. Delays in fund flows also cause serious problems at the district level, making it
difficult for staff to allocate resources to activities that they consider important.
The provision of public goods and services in other sectors (such as rural roads, health, and
education) substantially affects agricultural productivity, raising or reducing it. This reflects the
importance of complementary investments and suggests that strategic planning at MoFA cannot be
divorced from that in other sectors, and resource allocation cannot be treated as a zero-sum game across
different MDAs.
Recommendations include the following:
1. Work on increasing resources available to the Ministry. An important aspect of these
efforts would be to demonstrate that the resources that go into the sector benefit it by
contributing to its development.
2. Coordinate the activities of various organizations in the sector to leverage the resources
available for strategic interventions. The Ministry will have to clearly articulate what it is
doing to influence the working of other sectors to complement its efforts.
Build on the CAADP technical working group that has already been set up to
strengthen interministerial coordination.
Actively engage in the strategic planning of other sectors to leverage or advocate for
more resources in those sectors to be allocated toward activities that contribute to
raising agricultural productivity.
Use the commitment that the country has made to implement the CAADP agenda to
highlight the role of agriculture and build a stronger political base in the country.
Use improved statistics to highlight the Ministry’s achievements. Implement a
communication strategy that projects a positive public image, including tools such as
newsletters, annual reports, and publicly available documents.
3. Build expenditure information and analytical capabilities.
Increase resources for organized, coordinated, and systematic collection on spatial
(region and district) disaggregated time-series data on the various agricultural
subsectors, functions, and activities.
Strengthen agricultural statistics by working with Ghana Statistical Service on
implementing the national statistical development strategy.
Improve the impact of quantitative and policy analysis on resource allocation
decisions. Resource allocation decisions should take into account the comparative
62
advantages of different locations in terms of the costs and risks of producing different
commodities, the costs and constraints to marketing, local commodity and factor
prices, and the opportunities and returns to alternative income-generating activities,
both on and off the farm, noting that there are trade-offs between allocating resources
to areas where the growth effects are highest (Southern Savannah) and areas where
the prevalence of poverty is highest (Northern Savannah).
4. Improve effectiveness of expenditures
Increase the amount and share of resources spent on services and investments in
order to reduce the physical cost of reaching farmers and improve the quality of
service delivery.
Improve timeliness of resource disbursements.
Balance expenditures on administration and services by making more effective use of
existing manpower and attracting additional domestic and donor resources.
Introduce more effective planning with realistic ceilings that are likely to result in
greater correspondence between expenditures and priorities.
Improve procurement capacity to address underutilization of service and investment
funds.
Use accountability for results to obtain rational allocation of resources rather than
tagging of funds to various activities.
Concluding Remarks
These recommendations are only indications of strategies that MoFA could use to increase its
effectiveness. To be sustainable and effective, reforms have to come from the organization itself.
However, improving the effectiveness of an organization, particularly one that is embedded in a broader
culture of public service, is not an easy task. The range and nature of actions required indicate the need
for a strong commitment of the organizational leadership to change the ways in which the organization is
currently managed. In fact, this review strongly suggests that only management changes will foster the
organization’s ability to develop and harness individual capabilities that are available to it to effectively
pursue its objectives. How such a commitment can be built is an open question. One can expect that,
rather than pursuing management changes, organizations are tempted to adopt a piecemeal approach to
strengthening capacity through training to overcome deficiencies in technical skills.
To some extent, incentives for reform may come from the development community. Even though
managers in development organizations face strong incentives to disburse funds, most development
organizations are ultimately held accountable by the parliaments and the public of their respective
countries to prove their effectiveness. This pressure for accountability eventually translates into donor
efforts to measure the results of their investments. The emphasis on monitoring and evaluation is an
indication of this trend.
However, as an incentive for organizational change, this line of accountability is far-fetched, and
it involves its own trade-offs. In the past, specific organizational reforms have often been prescribed by
development partners, implicitly or explicitly, as conditions for funding. The introduction of the unified
agricultural extension service, which many extension agents perceive as undermining their
professionalism, is an example. Imposing reforms that donors consider appropriate, often in line with
some general global trend at a particular point in time, and then holding the Ministry accountable for lack
of results may well undermine genuine reform efforts in the Ministry.
Against this background, it appears useful to invest in strengthening the country’s own
accountability systems. Elected representatives could play a strong role in creating the incentives for the
agricultural administration to deliver. At the national level, Parliamentarians could hold the Ministry
accountable for its achievements. At the local level, District Assembly members could play a similar role.

63
To do so, they need access to information about MoFA’s performance. In this regard, the press could also
play a stronger role in creating incentives for performance, as could farmers’ organizations and NGOs.
Investing in the capacity of these actors to hold the agricultural administration accountable could play an
important complementary role to investing in the administration itself. In a functioning democracy, it is
ultimately the people and their representatives, not external agencies, who have to hold their public
administration institutions accountable.
64
REFERENCES
AU/NEPAD (Africa Union/New Partnership for Africa’s Development). 2005. Guidance note for agriculture
expenditure tracking system in African countries. NEPAD, Midrand, South Africa.
Babu, S., R. Mensah, and S. Kolavalli. 2007. Does training strengthen capacity? Lessons from capacity development
in Ghana, Ministry of Food and Agriculture. Ghana Strategy Support Programme background paper, Accra.
Benin, S., T. Mogues, G. Cudjoe, and J.Randriamamonjy. 2008a. Reaching middle-income status in Ghana by 2015:
Public expenditures and agricultural growth. Ghana Strategy Support Programme (GSSP) Working Paper.
International Food Policy Research Institute, Accra, Ghana.
Benin, S., A. Nin Pratt, S. Fan, C. Breisinger, T. Mogues, J. Thurlow, and X. Diao. 2008b. Measuring the growth
and poverty reduction impacts of public investments in agriculture and rural areas. Regional Strategic
Analysis and Knowledge Support Systems (RESAKSS) Working Paper 7. International Food Policy
Research Institute. Washington, D.C. (http://www.resakss.org/publications/DiscussionP7.pdf).
Birner, R., and H. Wittmer. 2006. Better public sector governance through partnership with private sector and civil
society: The case of Guatemala’s forest administration. International Review of Administration Sciences 72
(4): 459–472.
Bogotec, Y., M. Bussolo, X. Ye, D. Medvedev, Q. Wodon, and D. Boakye. 2007. Ghana’s growth story: How to
accelerate growth and achieve MDGs? Background paper for Ghana Country Economic Memorandum.
Washington, D.C.: World Bank.
Breisinger, C., X. Diao, J. Thurlow, and R. M. Al-Hassan. 2008. Agriculture for development in Ghana: New
opportunities and challenges. IFPRI Discussion Paper No. 784. Washington, D.C.: International Food
Policy Research Institute.
Fan, S., X. Zhang, and N. Rao. 2004. Public expenditure, growth, and poverty reduction in rural Uganda.
Development Strategy and Governance Division Discussion Paper 4, International Food Policy Research
Institute, Washington, D.C.
FAO (Food and Agriculture Organization of the United Nations). 2006. Food security statistics-Ghana, FAOSTAT,
accessed April 1, 2009 at http://www.fao.org/faostat/foodsecurity/Countries/EN/Ghana_e.pdf.
G-JAS (Ghana Joint Assistance Strategy). 2007. Ghana Joint Assistance Strategy (G-JAS): Commitments by
partners to work toward GPRS II goals and harmonization principles.
http://www.afdb.org/fileadmin/uploads/afdb/Documents/Project-and-Operations/14090262-EN-2007-02-27-GJAS-
FINAL-SIGNED.PDF Accessed April 1, 2009.
Ghana Statistical Service. 2009. Ghana living standards survey 5. Accra, Ghana.
Ghana, Government of. 1999. Budget statement, paragraph 4. Accra, Ghana.
Lusthaus, C., M. H. Adrien, G. Anderson, F. Carden, and G.P. Montalvan. 2002. Organizational assessment: A
framework for improving performance. Ottawa, Canada: International Development Research Centre.
MoFEP (Ministry of Finance and Economic Planning). 2009. Budget statements, 1999–2006.
http://www.mofep.gov.gh/budget.cfm. Accessed April 1, 2009.
MoFA (Ministry of Food and Agriculture). 1999. Agricultural sector expenditure review, 1995–1997. Accra, Ghana.
________. 2005. Handbook on roles and responsibilities of MoFA staff under decentralization. Accra, Ghana.
________. 2006. Annual report. Accra, Ghana.
________. 2008a. Budget submission. Accra, Ghana.
________. 2008b. Vision statement. Official website at http://mofa.gov.gh/. Accessed August 24,2008.
________. 2010. Annual progress report – Volume 1. Accra, Ghana. Photocopy.
65
Mogues, T., S. Benin, and G. Cudjoe. 2007. Do external grants to district governments leverage own-revenue
generation? A look at local public finance dynamics in Ghana. International Food Policy Research Institute,
Washington, D.C.. Photocopy.
Okorley, E. L., Gray, D., and J. Reid.2009. Key factors of success for decentralized public agricultural extension:
An expanded view from a Ghanaian case study. Journal of Sustainable Development in Africa 10: 233–
249.
Quartey, P. 2005. Innovative ways of making aid effective in Ghana: Tied aid versus direct budgetary support.
Journal of International Development 17: 1077–1092.
USAID (U. S. Agency for International Development. 2008. Budget, plans and performance: Ghana. Washington,
D.C. http://www.usaid.gov/policy/budget/cbj2006/afr/gh.html. Accessed April 1, 2009.
World Bank. 2006. External review of public financial management. Accra, Ghana.
________. 2007a. World development indicators. Washington, D.C.
________. 2007b. World development report 2008: Agriculture for development. Washington, D.C.


RECENT IFPRI DISCUSSION PAPERS
For earlier discussion papers, please go to http://www.ifpri.org/publications/results/taxonomy%3A468. All discussion papers can be downloaded free of charge.
1019. Building capacities for evidence and outcome-based food policy planning and implementation: The example of the
Comprehensive Africa Agriculture Development Programme. Ousmane Badiane, Sunday P. Odjo, and John M.
Ulimwengu, 2010.
1018. Modeling the global trade and environmental impacts of biofuel policies. Antoine Bouët, Betina V. Dimaranan, and Hugo
Valin, 2010.
1017. Analyzing nutritional impacts of policies: An empirical study for Malawi. Olivier Ecker and Matin Qaim, 2010.
1016. Optimal rainfall insurance contracts for maize producers in Ghana’s northern region: A mathematical programming
approach. Francis M. Muamba and John M. Ulimwengu, 2010.
1015. Impacts of climate change on agriculture and policy options for adaptation: The case of Vietnam. Bingxin Yu, Tingju
Zhu, Clemens Breisinger, and Nguyen Manh Hai, 2010.
1014. Spatial price transmission and market integration in Senegal’s groundnut market. Ousmane Badiane, John M.
Ulimwengu, and Fleur Wouterse, 2010.
1013. Strategies for adapting to climate change in rural Sub-Saharan Africa: A review of data sources, poverty reduction
strategy programs (PRSPs) and national adaptation plans for agriculture (NAPAs) in ASARECA member countries.
Jonathan Makau Nzuma, Michael Waithaka, Richard Mbithi Mulwa, Miriam Kyotalimye, and Gerald Nelson, 2010.
1012. Do health investments improve agricultural productivity?: Lessons from agricultural household and health research. Paul
E. McNamara, John M. Ulimwengu, and Kenneth L. Leonard, 2010.
1011. Investigating the role of poultry in livelihoods and the impact of avian flu on livelihoods outcomes in Africa: Evidence
from Ethiopia, Ghana, Kenya, and Nigeria. Ekin Birol, Dorene Asare-Marfo, Gezahegn Ayele, Akwasi Mensa-Bonsu,
Lydia Ndirangu, Benjamin Okpukpara, Devesh Roy, and Yorbol Yakhshilikov, 2010.
1010. Constraints to fertilizer use in Nigeria: Insights from agricultural extension service. Afua B. Banful, Ephraim Nkonya,
and Victor Oboh, 2010.
1009. Do household definitions matter in survey design? Results from a randomized survey experiment in Mali. Lori Beaman
and Andrew Dillon, 2010.
1008. Livestock development planning in Uganda: Identification of areas of opportunity and challenge. Todd Benson and
Samuel Mugarura. 2010.
1007. Migratory responses to agricultural risk in northern Nigeria. Andrew Dillion, Valerie Mueller, and Sheu Salau. 2010.
1006. Do comprehensive Africa agriculture development program (CAADP) processes make a difference to country
commitments to develop agriculture?: The case of Ghana. Shashidhara Kolavalli, Kathleen Flaherty, Ramatu Al-Hassan,
and Kwaku Owusu Baah, 2010.
1005. The new Nicaraguan water law in context: Institutions and challenges for water management and governance. Paula
Novo and Alberto Garrido, 2010.
1004. Potential of carbon markets for small farmers: A literature review. Alessandro De Pinto, Marilia Magalhaes, and Claudia
Ringler, 2010.
1003. Understanding gender differences in agricultural productivity in Uganda and Nigeria. Amber Peterman, Agnes
Quisumbing, Julia Behrman, and Ephraim Nkonya, 2010.
1002. Old problems in the new solutions? Politically motivated allocation of program benefits and the “new” fertilizer
subsidies. Afua Branoah Banful, 2010.
1001. The role of public–private partnerships in promoting smallholder access to livestock markets in developing countries:
methodology and case studies. Karl M. Rich and Clare A. Narrod, 2010.
1000. Mapping the policy process in Nigeria: Examining linkages between research and policy. Noora-Lisa Aberman, Eva
Schiffer, Michael Johnson, and Victor Oboh, 2010.
INTERNATIONAL FOOD POLICY RESEARCH INSTITUTE
www.ifpri.org
IFPRI HEADQUARTERS
2033 K Street, NW Washington, DC 20006-1002 USA Tel.: +1-202-862-5600 Fax: +1-202-467-4439 Email: [email protected]
IFPRI ADDIS ABABA
P. O. Box 5689 Addis Ababa, Ethiopia Tel.: +251 11 6463215 Fax: +251 11 6462927 Email: [email protected]
IFPRI NEW DELHI
CG Block, NASC Complex, PUSA New Delhi 110-012 India Tel.: 91 11 2584-6565 Fax: 91 11 2584-8008 / 2584-6572 Email: [email protected]