Embed Size (px)
Citation preview

2015
Institute of e-Government, Waseda University
Edited by: Prof. Dr. Toshio OBI
[2015 WASEDA – IAC INTERNATIONAL
E-GOVERNMENT RANKING SURVEY]
June 2015, Tokyo
[The Institute of e-Government at Waseda University, Tokyo in cooperation with the International
Academy of CIO (IAC) has released the results of its international e-Government rankings survey for
2015.]

ii
Executive Summary
The Institute of e-Government at Waseda University (Director: Prof. Toshio Obi),
Tokyo in cooperation with the International Academy of CIO (IAC) has released the
results of its international e-Government ranking survey for 2015. This research
presents the eleventh consecutive year of monitoring and surveying worldwide
e-Government development by the research team of Professor Toshio OBI, Director of
the Institute of e-Government and experts with IAC member universities. The result of
the survey is that Singapore ranked for the first place, followed by the United States in
2nd
, Denmark in 3rd
, the United Kingdom in 4th
and Korea in 5th
place. Japan was in 6th
,
Australia in 7th
, Estonia in 8th
, Canada in 9th
and Norway ranked 10th
.
During this one-year survey, research has been conducted through organizing the
workshops and forums and the team has arranged professional meetings and discussions
with a variety of international and national organizations to improve oversight and
objectivity. These groups include the Organization for Economic Co-operation and
Development (OECD), Asia Pacific Economic Cooperation (APEC), the International
Telecommunications Union (ITU), the World Bank (WB), United Nations DESA and
many other government agencies, think tanks and NGO/NPOs with e-Government
responsibilities in their respective countries.
The 2015 ranking is the eleventh year of the Waseda e-Government Ranking, and
second year of cooperation with International Academy of CIO
(http://cio-japan.waseda.ac.jp/). To assess and evaluate the details of e-Government
preparedness and to align with new trends in e-Government, 9 main indicators with 32
sub-indicators have been evaluated. The 2015 ranking, which marks the first year the
Waseda-IAC e-Government Ranking removed Cambodia, Iran and Uzbekistan from the
ranking. These countries were at the bottom of the ranking from 2012 to 2014. In
addition, in order to obtain comprehensive findings on the e-Government around the
world, this year, five countries are added as subjects of this research: Ireland, Bahrain,
Morocco, Costa Rica and Oman. This makes a total of sixty-three surveyed countries
compared to sixty-one last year. These selected 63 nations are regarded as the better ICT
countries among approx.200 nations in the world.
In order to obtain the latest and the most accurate information and to assess the
relevant data, the ranking was conducted by researchers around the world in cooperation
with partner universities. Comprehensive data assessment has been conducted by expert
groups from George Mason University (USA), United Nations University, Bocconi
University (Italy), Turku University (Finland), Peking University (China), Thammasat
University (Thailand), De La Salle University (Philippines), Bandung Institute of

iii
Technology (Indonesia), National University of Singapore, Federal Academy National
Economy (Russia) as well as main contributor, Waseda University (Japan).
This report contains Chapter 3 [e-Government Indicators], Chapters 4, 5, 6
[e-Government Ranking by Organizations, Populations and Regions] and Chapter 7
[Methodology]. The full text with all 63 countries assessment report [10 years of World
e-Government Rakings] will be published by IOS Press (www.iospress.nl), Amsterdam
in September, 2015.
An analysis of Waseda – IAC e-Government Ranking Survey 2015 indicates the
following eight interesting findings:
(1) There is lack of ICT human resources development in capacity building,
especially e-leaders such as CIO
(2) Enough finance/funding for e-Government projects is the key for success
(3) Citizen-engagement as digital inclusion in e-Government initiatives should be
more encouraged
(4) Various applications for online service over the world are progressing in
developed countries
(5) More attention must be paid to local e-Government issues as well as linkage
between central and local governments
(6) The best practices for M-government in developing countries may increase
active participation in developing countries with high usage of mobile devices
(7) Open Government/Open Data should be implemented and shared with big data
(8) Digital gap has become wider among developing countries in terms of
accessibility, usability and affordability
Contact: Institute of e-Government, Waseda University, Japan
Email: [email protected]

iv
TABLE OF CONTENTS
Executive Summary ........................................................................................................ ii
List of Tables ................................................................................................................... v
List of Figures ................................................................................................................. v
I. Total Ranking 2015 .............................................................................................. 2
II. e-Government Ranking by Indicators................................................................ 4
1. Network Preparedness/Digital Infrastructure......................................................... 6
2. Management Optimization ..................................................................................... 7
3. Online Services/ Applications ................................................................................ 7
4. National Portal/ Homepage .................................................................................... 8
5. Government Chief Information Officer (GCIO) .................................................... 9
6. e-Government Promotion ..................................................................................... 10
7. E-Participation/ Digital Inclusion ......................................................................... 11
8. Open Government Data ....................................................................................... 12
9. Cyber Security...................................................................................................... 12
III. e-Government Ranking by Organizations ....................................................... 13
1. Ranking of APEC Economies .............................................................................. 13
2. Ranking of OECD Countries ............................................................................... 14
IV. e-Government Ranking by the Size of Population and GDP ......................... 16
1. Ranking in Big Population Countries (higher than 100 million) ......................... 16
2. Ranking in Small Population Countries (Less than 10 million) .......................... 18
3. e-Government Ranking in Top 10 Countries with Highest GDP in World .......... 20
V. e-Government Ranking by Regions.................................................................. 22
1. Ranking in Asia-Pacific Countries ....................................................................... 22
2. Ranking in Americas Countries ........................................................................... 23
3. Ranking in European Countries ........................................................................... 24
4. Ranking in Africa, Middle East and CIS Countries ............................................. 26
VI. Methodology ....................................................................................................... 28
VII. Contributors List................................................................................................ 30
v
List of Tables
Table 1: Waseda – IAC e-Government Total Ranking 2015 ................................................................................ 2
Table 2: The Main Indicators and Sub-Indicators ................................................................................................ 5
Table 3: Top 10 Countries by 9 Individual Indicators .......................................................................................... 6
Table 4: e-Government Ranking in APEC Economies ...................................................................................... 13
Table 5: e-Government Ranking in OECD Countries ........................................................................................ 15
Table 6: e-Government Ranking in Big Population Countries ........................................................................... 16
Table 7: e-Government Ranking in Small Population Countries ....................................................................... 19
Table 8: e-Government Ranking with Highest GDP Group ............................................................................... 20
Table 9: e-Government Ranking in Asia-Pacific Countries ............................................................................... 22
Table 10: e-Government Ranking in Americas Countries ................................................................................. 23
Table 11: e-Government Ranking in European Countries ................................................................................. 25
Table 12: e-Government Ranking in Africa, Middle East and CIS Countries.................................................... 26
Table 13: Weighted Scores Method ................................................................................................................... 30
List of Figures
Figure 1: Waseda-IAC Top 10 e-Government Ranking ....................................................................................... 3
Figure 2: e-Government Development Matrix..................................................................................................... 4
Figure 3: Top 10 Management Optimization 2014-1015 ..................................................................................... 7
Figure 4: Top 10 Online Service 2014-2015 ........................................................................................................ 8
Figure 5: Top 10 National Portal 2014-2015 ....................................................................................................... 9
Figure 6: Top 10 Government CIO 2014 – 2015 ............................................................................................... 10
Figure 7: Top 10 e-Government Promotion 2014 – 2015 .................................................................................. 11
Figure 8: Top 10 E-Participation 2014 – 2015 ................................................................................................... 11
Figure 9: Top 10 Open Government Data 2014 - 2015 ...................................................................................... 12
Figure 10: Top 10 Cyber Security 2014 - 2015 .................................................................................................. 13
Figure 11: Top 10 APEC Economies ................................................................................................................. 14
Figure 12: Top 10 OECD Countries .................................................................................................................. 16
Figure 13: Top 10 Big Population Countries in e-Government ......................................................................... 18
Figure 14: e-Government Ranking in Small Population Countries ................................................................... 20
Figure 15: Top 10 e-Government Ranking in Highest GDP Countries .............................................................. 21
Figure 16: Top 10 e-Government Ranking in Asia-Pacific Countries ................................................................ 23
Figure 17: Top 10 e-Government Ranking in Americas Countries .................................................................... 24
Figure 18: Top 10 e-Government Ranking in European Countries .................................................................... 26
Figure 19: Top 10 e-Government Ranking in Africa, Middle-East and CIS Countries ...................................... 28
Figure 20: Processes Diagram ........................................................................................................................... 29

2
I. Total Ranking 2015
The 2015 ranking marks Singapore’s return to first place scoring 0.22 points higher than
the USA – the country ranked at second in the total ranking. Denmark ranked for 3rd
followed by the UK in 4th
, compared to last year, Korea downturned from 3rd
to 5th
place
this year. Japan ranked 6th
place. Australia jumped two places and ranked for 7th
place in
the ranking this year. Estonia and Canada also slipped out of their positions compared to
last year and ranked for 8th
and 9th
place respectively. There was no significant structural
change compared to last year in the top ten, except that Norway replaced Sweden and
ranked for 10th
place, which marks the first time Norway appeared in the top ten during
the eleven years of the ranking. This year, the ranking added five new countries: Bahrain,
Costa Rica, Iceland, Morocco, and Oman. In this group, only Iceland has a good position
ranked for 19th
place in the total ranking. Both Oman and Bahrain are in the middle of the
ranking and are ranked at 40th
and 44th
respectively, while Morocco and Costa Rica are
tied at the bottom group in the total ranking. In the middle group of the ranking marks a
big change in the position of China, compared to last year, China slipped ten steps and is
ranked at 49th
place.
No Total Rankings Score No Total Rankings Score No Total Rankings Score
1 Singapore 93.80 22 Thailand 67.31 43 Brunei 51.06 2 USA 93.58 23 Israel 65.80 44 Bahrain 50.50 3 Denmark 91.25 24 HK SAR 65.24 45 Brazil 50.37 4 UK 90.17 25 Malaysia 64.87 46 Argentina 50.32 5 Korea 89.39 26 Portugal 63.93 47 Colombia 49.36 6 Japan 87.77 27 Czech Republic 63.48 48 South Africa 49.30 7 Australia 86.30 28 Italy 61.30 49 China 48.36 8 Estonia 84.87 29 Indonesia 60.11 50 Kazakhstan 47.73 9 Canada 81.45 30 UAE 58.10 51 Saudi Arabia 47.48 10 Norway 79.63 31 Poland 57.30 52 Peru 46.21 11 Sweden 77.95 32 Spain 57.12 53 Tunisia 45.87 12 Austria 77.26 33 Vietnam 57.03 54 Venezuela 44.65 13 New Zealand 76.66 34 Russia 56.56 55 Uruguay 44.01 14 Finland 76.49 35 India 56.42 56 Morocco 43.13 15 Germany 76.46 36 Macau SAR 56.27 57 Pakistan 42.94 16 France 73.39 37 Chile 53.49 58 Costa Rica 42.06 17 Chinese Taipei 72.76 38 Mexico 53.41 59 Georgia 40.73 18 Belgium 71.69 39 Romania 53.11 60 Nigeria 38.37 19 Iceland 69.73 40 Oman 51.60 61 Fiji 37.54 20 Netherlands 69.53 41 Philippines 51.47 62 Egypt 37.19 21 Switzerland 69.17 42 Turkey 51.31 63 Kenya 32.91
Table 1: Waseda – IAC e-Government Total Ranking 2015

3
Indonesia had a big jump and is ranked for 29th
place compared to 32nd
last year.
For ASEAN countries (except Singapore which is consistently at the top group),
Thailand has a good position in the middle of the ranking, and leads this group in 22nd
place, followed by Malaysia ranked at 25th
place.
The bottom tier of this ranking still hosts familiar names from last year, such as
Nigeria, Fiji, Egypt and Kenya. In this group, Nigeria is the country that had the biggest
regression. It ranked for 60th
place compared with 45th
last year. Egypt also slipped
down from 56th
place last year to 62nd
place in the total ranking this year. Kenya ranked
at the bottom of the total ranking.
Figure 1: Waseda-IAC Top 10 e-Government Ranking
All top ten countries have held excellent achievement. But, as for GCIO, Norway as
the 10th post has poor score on it as well as e-Participation.
Figure 2 [e-Government Development Matrix] indicates the positive relationship
between network infrastructure and online public services. It is reported that the
countries with nice network infrastructure can extend to deploy online public services
easily.

4
Figure 2: e-Government Development Matrix
II. e-Government Ranking by Indicators
The Waseda – IAC e-Government Ranking contains comprehensive benchmarking
indicators in order to obtain an accurate and precise assessment of the latest
development of e-Government in the major countries in ICT section. In 2015 Waseda
team evaluated nine main indicators. This year’s ranking removed one sub-indicator in
Network Preparedness -PC users. Based on the new trends of ICT, citizens may use
smartphones, tablets or notebooks to connect with government and make transactions
by various tools. Therefore, PC users are not necessary for e-Government development
evaluation. Table 3 below shows all 9 indicators and their 32 sub-indicators.
Indicators Sub-indicators
1. Network Preparedness/Infrastructure 1-1 Internet Users 1-2 Broadband Subscribers 1-3 Mobile Cellular Subscribers
2. Management Optimization/ Efficiency 2-1 Optimization Awareness 2-2 Integrated Enterprise Architecture 2-3 Administrative and Budgetary Systems
3. Online Services / Functioning Applications
3-1 E-Procurement 3-2 E-Tax Systems 3-3 E-Custom Systems 3-4 E-Health System 3-5 One-stop service
4. National Portal/Homepage 4-1 Navigation 4-2 Interactivity 4-3 Interface 4-4 Technical Aspects

5
5. Government CIO 5-1 GCIO Presence 5-2 GCIO Mandate 5-3 CIO Organizations 5-4 CIO Development Programs
6. e-Government Promotion 6-1 Legal Mechanism 6-2 Enabling Mechanism 6-3 Support Mechanism 6-4 Assessment Mechanism
7. E-Participation/Digital Inclusion 7-1 E-Information Mechanisms 7-2 Consultation 7-3 Decision-Making
8. Open Government 8-1 Legal Framework 8-2 Society 8-3 Organization
9. Cyber Security 9-1 Legal Framework 9-2 Cyber Crime Countermeasure 9-3 Internet Security Organization
Table 2: The Main Indicators and Sub-Indicators
This ranking survey analyzes not only the development of national portal and ICT
deployment in governments, but also looks into real operations by participating the
conferences, workshops and forums, such as management optimization, internal
processes, online services, and new trends in e-Government development and the
relationship between governments and their stakeholders. The table 3 below shows the
top ten e-Government rankings by 9 indicators in 2015:
Network Preparedness
Management Optimization
Online Services National Portal
No Country No Country No Country No Country 1 Netherlands 1 Singapore 1 Denmark 1 Denmark 1 Denmark 2 Canada 1 Estonia 2 Estonia 3 Singapore 2 Denmark 1 Korea 2 Singapore 4 USA 2 Estonia 1 Singapore 2 USA 5 Iceland 2 Netherlands 5 Iceland 5 Australia 5 Norway 2 Switzerland 6 UK 5 Norway 5 Switzerland 2 UK 7 Finland 7 France 8 Finland 2 USA 8 Austria 8 UK 9 France 9 Australia 8 USA 9 Japan 10 Korea 10 France 10 Switzerland 10 Sweden
GCIO e-Government Promotion
E-Participation Open Government
No Country No Country No Country No Country 1 Singapore 1 Sweden 1 Australia 1 Australia 1 Korea 1 USA 1 Estonia 1 Canada

6
1 USA 3 Singapore 1 UK 3 USA 4 Japan 4 Korea 4 Canada 4 Denmark 5 Canada 5 Japan 4 Denmark 4 Germany 6 Denmark 6 Australia 4 France 4 Korea 6 New Zealand 6 UK 4 Singapore 4 UK 8 HK SAR 8 Denmark 8 USA 8 Singapore 9 UK 9 Chinese Taipei 9 Israel 9 Japan 10 Thailand 10 Italy 10 Japan 10 Austria
Cyber Security No Country No Country No Country 1 Denmark 5 UK 8 Germany 1 Estonia 6 Singapore 8 USA 1 New Zealand 6 Japan 11 Canada 4 Australia 8 Austria 11 Norway
Table 3: Top 10 Countries on 9 Individual Indicators
1. Network Preparedness/Digital Infrastructure
Network preparedness is the first indicator in Waseda-IAC ranking and it is the
basic infrastructural foundation for effective e-Government implementation. Different
stages of infrastructure have long been available in many countries and have become an
important tool to connect citizens and enterprises to government.
Infrastructure for e-Government development is no longer confined to Internet
users, mobile subscribers or the number of broadband connections. We recognize that
the foundation for the development of e-Government in a country depends on a
backbone Network system. It is capable of connecting all bureaus and departments
together via the core Government Backbone Network.
The ability to connect between local governments and the central government or
among local governments is also the trend in the deployment of ICT infrastructure for
e-Government development. The ability to share data and synchronize between agencies
and government departments is also common in most developed countries. As the new
trends in ICT and e-Government development, the platform moves to “cloud computing”
and the number of “smartphones” rises daily. Consequently, mobile broadband will
become one of the key network preparedness factors. Effective broadband access
stimulates citizens to use such services and encourages the deployment of new services.
In the first place of the 2015 ranking for network preparedness are Denmark and the
Netherlands. In Denmark, information infrastructure is very widely available, especially
Internet with a broadband connection. Since 2010, the Danish government introduced
digital signatures. With this digital signature, citizens use the same user ID and the same

7
password for online banking, government websites and a wide range of private services
online. They also launched e-procurement, e-authentication, e-passport and e-payment
in the very early stage. In the Netherlands, the backbone of the e-Government
architecture is the Netherlands Government Reference Architecture (NORA 3.0). All
government agencies have endorsed NORA. Through NORA, they can coordinate the
activities within their own organizations.
2. Management Optimization
Management optimization reflects the utilization of ICT for improving government
business processes and internal processes (back office in each organization). Based on
this survey, we found that most of top ten countries in this indicator ranking have full
scores. It means that management optimization is very important indicator on
e-Government development, because it is related to the optimization awareness,
enterprise architecture and also the administrative management system.
The Waseda – IAC e-Government Ranking considers “Management Optimization”
to be a critical business function that underpins the operational, financial, accounting
and strategic planning of business, social, health and administrative affairs within the
country. In this indicator, European countries are almost dominant with seven countries
on the list. Compared to last year, Singapore has a big jump and is ranked at 1st place,
followed by seven countries in second place.
Figure 3: Top 10 Management Optimization 2014-1015
3. Online Services/ Applications
There are many definitions on [e-services]; it is a wide concept which includes
services provided by organizations, companies or individuals using an Internet
connection. The e-service concept has been used by researchers from the beginning of
year 2000, and e-service operations mean that all or part of the interaction between the
11.50
12.00
12.50
13.00
13.50
14.00
14.50
15.00
15.50
2015
2014

8
service provider and the customer is conducted through the Internet, and e-service has a
“front-end” Web-based system and a “back-end” information system.
In Waseda-IAC e-Government Ranking survey, this indicator refers to the systems
of e-procurement, e-tax, e-custom, e-health and one-stop service. When evaluating
e-Government development, the most recent trends show that some governments in
developing countries have shifted to user-oriented strategies and have developed
one-stop service portals. They are also planning to gradually expand and enhance a
variety of integrated service delivery.
In general, there are no significant gaps in online service delivery between
countries in the top 10. This year witnessed the enhancement of most countries in the
top 10, except Estonia, Singapore and Korea which scored slightly lower than they did
in 2014. Iceland for the first year being monitored by the ranking system stands in 5th
position of the e-service delivery ranking.
Figure 4: Top 10 Online Service 2014-2015
4. National Portal/ Homepage
National portal or one-stop service is the foundation of e-Government and a basic
interface for stakeholders to access government in an electronic way. In public sector,
this means that the government makes all services via one portal; in e-Government
one-stop service is integrating all services and making them accessible via one gateway.
National portal offers many benefits to users for public services—from citizens and
businesses to the public administrators themselves—including faster, cheaper and
superior services. Throughout eleven years of ranking, we noted that the national portal
helps to reduce costs, improves perceptions of government efficiency on the part of
citizens and also delivering benefits for both customers and government.
Many nations around the world integrated all services into one portal (national
portal or one-stop service). In the public sector, one-stop service is one of the most
0.00
2.00
4.00
6.00
8.00
10.00
12.00
14.00
16.00
2015
2014

9
promising concepts of service delivery in public administration. Its implementation is
included in the e-Government strategies of most countries.
Figure 5: Top 10 National Portal 2014-2015
In this indicator, both Norway and Australia demonstrate a significant improvement
in comparison with the years before. Both Estonia and the UK have made a significant
improvement for their national portals this year gaining those 2 places in top 10
countries on national portal. Denmark found it in the first position of the national portal
ranking together with Estonia, Singapore and the United States. Other countries such as
the United States, Singapore, Australia, Norway, France and Sweden secured their
positions on the table with little change in comparison with the previous year.
5. Government Chief Information Officer (GCIO)
In the public sector, government CIO plays a very important role and has been
recognized worldwide. Since 2005, in the first International e-Government ranking of
Waseda institute of e-Government, the important role of CIO for e-Government
implementation was well recognized. The CIO is expected to align management
strategy with ICT investment in order to achieve the balance among business strategy,
organizational reform and management reform; hence, the Government CIO is
considered by many governments to be one of the key factors in the success of
e-Government implementation.
CIOs are now expected to achieve quantum-leap efficiencies, produce previously
unheard-of capabilities, create information out of disparate data sets, and provide citizen
services that are so fast, accurate, and user-friendly that the public’s trust in government
achieves record heights.
7.50
8.00
8.50
9.00
9.50
10.00
10.50
2015
2014

10
Figure 6: Top 10 Government CIO 2014 – 2015
Striving for improvement GCIO quality, both Denmark and HK SAR have been
rewarded for their efforts with the 6th and 9th positions in the top 10, respectively.
Despite scoring lower than the previous year, Singapore, Korea, USA, Canada and
Japan are still the leaders in this indicator and their positions remain unchanged
6. e-Government Promotion
The “e-Government Promotion” indicator measures the government’s activities
toward the promotion of e-Government and distribution of e-services to citizens,
businesses and other stakeholders. It includes activities involved in supporting the
implementation of e-Government such as legal framework and mechanism (laws,
legislations, plans, policies and strategies). In other words, the government carries out
these activities in order to support the development of e-Services as well as
e-Government as a whole. This indicator is one of main indicators in Waseda-IAC
e-Government ranking because it shows the main legal framework in each country.
There are not many changes in the position of top 10 countries regarding
e-Government promotion activities, except in the case of Denmark. The country has
made a significant improvement in promoting e-Government - 8.67 score for 2015 in
comparison with 5.33 as of the previous year - rewarding the country a place in the top
10 this year. By scoring full marks in this indicator, Sweden and the United States
secured their positions at 1st and 2
nd respectively.
0.00
2.00
4.00
6.00
8.00
10.00
12.00
14.00
2015
2014

11
Figure 7: Top 10 e-Government Promotion 2014 – 2015
7. E-Participation/ Digital Inclusion
In Waseda-IAC e-Government Ranking, e-participation refers to ICT-supported
participation in government and governance processes. Processes may be concerned
administration, service delivery, decision-making and policy-making. Throughout this
survey, we found that the participation from both government officers and citizens play
an important role in the success of e-Government.
An e-participation indicator is used to take into account the “demand” side of
e-Government as well as to see to what degree the people are using e-Government
platforms especially in the light of Government 2.0. In this indicator, the Waseda
e-Government ranking for digital inclusion uses e-information, interactive and
e-decision making process as sub-indicators.
Figure 8: Top 10 E-Participation 2014 – 2015
0.00
2.00
4.00
6.00
8.00
10.00
12.00
2015
2014
8.40
8.60
8.80
9.00
9.20
9.40
9.60
9.80
10.00
10.20
2015
2014

12
In figure 8: Australia, Estonia and the UK shared the top position and Estonia has
made a significant enhancement to e-participation by increasing its rank from 9th in
2014 to 2nd in 2015. The similar effort could be witnessed in the case of Denmark
where the country jumped from 9th position in 2014, surpassing the United States to
rank in 4th place for e-participation.
8. Open Government Data
Open Government/Data is one of the newest indicators in Waseda-IAC
e-Government Ranking. This indicator evaluates an open and transparent of government.
The top ranking countries on this indicator have provided the citizens with an
application programming interface (API) that could help developers and researchers to
create innovative citizen-centric applications. There are a number of small-scale
utilization cases and application for smartphone and tablet.
Figure 9: Top 10 Open Government Data 2014 - 2015
The evidence for the presence of Open Data is to review whether the e-Government
application provides an RSS Feed, Web API Service, or an equivalent option.
Australia jumped over 4 steps to acquire the top position in Open Government
while Singapore made a strike by increasing its position from 18th last year to 8th in
2015. Similar surprising found in the situation of Denmark which gained the 4th
place
from 14th
last year.
9. Cyber Security
The security measures associated with individual e-Government systems are
relatively similar to many e-commerce solutions. However, the span of control of
e-Government and its unique impact on its user base requires a network that is greater
than the sum of each individual system. E-Government faces the same challenges that
faced e-business in the private sector.
0.00
2.00
4.00
6.00
8.00
10.00
12.00
2015
2014

13
Figure 10: Top 10 Cyber Security 2014 - 2015
Both Denmark and Australia found themselves in the top 10 (1st and 4th
respectively) with a huge improvement in the national cyber security score compared
with last year. Both Estonia and New Zealand demonstrated their stability in cyber
security by sharing the 1st position with Denmark.
III. E-Government Ranking by Organizations
1. Ranking of APEC Economies
APEC Economies APEC Economies APEC Economies
No Economies Score No Economies Score No Economies Score 1 Singapore 93.80 8 Chinese
Taipei 72.76 15 Chile 53.49
2 USA 93.58 9 Thailand 67.31 16 Mexico 53.41 3 Korea 89.39 10 HK SAR 65.24 17 Philippines 51.47 4 Japan 87.77 11 Malaysia 64.87 18 Brunei 51.06 5 Australia 86.30 12 Indonesia 60.11 19 China 48.36 6 Canada 81.45 13 Vietnam 57.03 20 Peru 46.21 7 New Zealand 76.66 14 Russia 56.56
Table 4: e-Government Ranking in APEC Economies
This is the fourth consecutive year of monitoring and surveying the development of
e-Government by organizations, APEC Economies, OECD countries. APEC Economies
includes 21 economy members, Waseda-IAC e-Government ranking covers 20
members. The Institute of e-Government at Waseda University has been responsible
for the management of APEC e-Government Research Center since 2005. Leading this
7.00
7.50
8.00
8.50
9.00
9.50
10.00
2015
2014
14
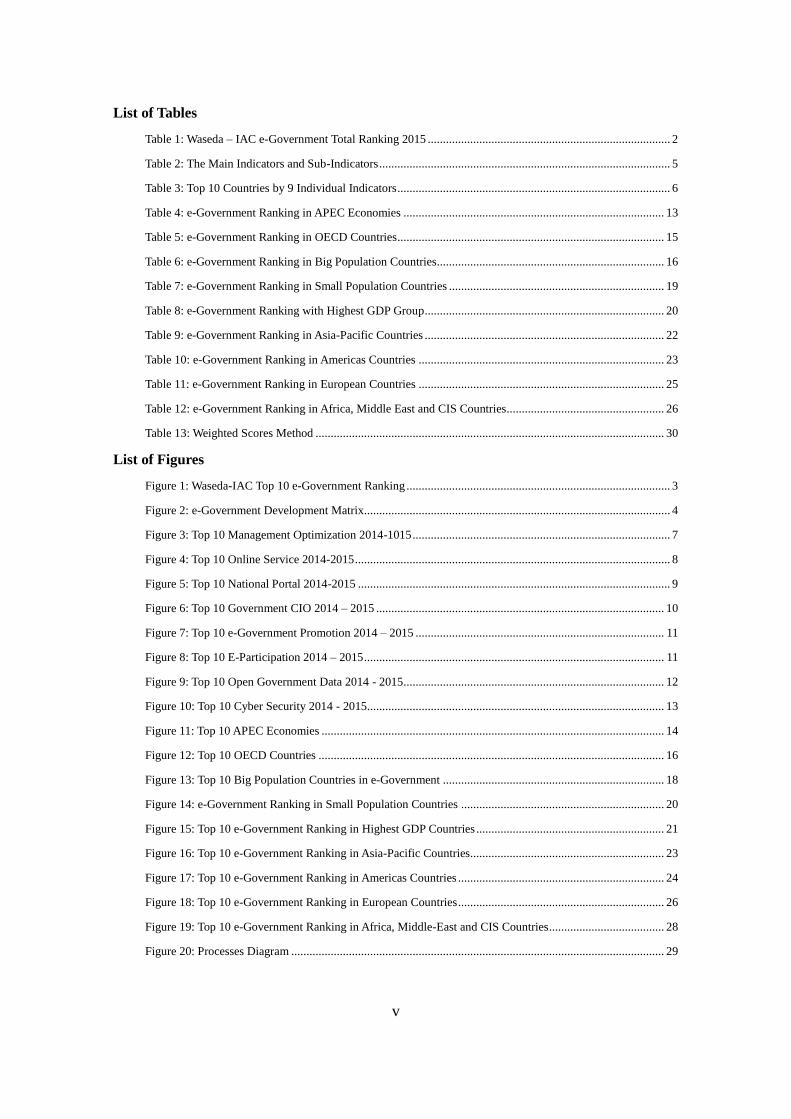
APEC group is Singapore, where government objectives are to fulfill the needs of their
users and achieve maximum value for money for the taxpayer in 2015 and focus to the
productivity and effectiveness improvement by using ICT. The top six countries in this
group are also in the top ten in the total ranking.
There is no significant structural change compared to last year, except that China
has slipped down from 16th
place to 19th
place in this year’s ranking while Chile jumped
from 19th
place in last year’s ranking to 15th
place. In the 2015 e-Government ranking,
Chile is in full swing and one of the top countries in Latin America in terms of Internet
access and the Chilean government aims to provide better services as a main goal of
e-Government.
Compared to last year, Peru is in the same situation ranked at 20th place, but the
total score this year is higher than last year. Peru is still at the early stages of having an
integrated e-Government, the Peruvian Government is working steadily to develop
e-Government in Peru, but its pace is still slow compared to last year ranking. Figure 11
below shows the top 10 APEC Economies for e-Government development ranking.
Figure 11: Top 10 APEC Economies
2. Ranking of OECD Countries

15
OECD Countries OECD Countries OECD Countries
No Country Score No Country Score No Country Score 1 USA 93.58 11 Austria 77.26 21 Portugal 63.93 2 Denmark 91.52 12 New Zealand 76.66 22 Czech Republic 63.48 3 UK 90.17 13 Finland 76.49 23 Italy 61.30 4 Korea 89.39 14 Germany 76.46 24 Poland 57.30 5 Japan 87.77 15 France 73.39 25 Spain 57.12 6 Australia 86.30 16 Belgium 71.69 26 Chile 53.49 7 Estonia 84.87 17 Iceland 69.73 27 Mexico 53.41 8 Canada 81.45 18 Netherlands 69.53 28 Turkey 51.31 9 Norway 79.63 19 Switzerland 69.17 10 Sweden 77.95 20 Israel 65.80
Table 5: e-Government Ranking in OECD Countries
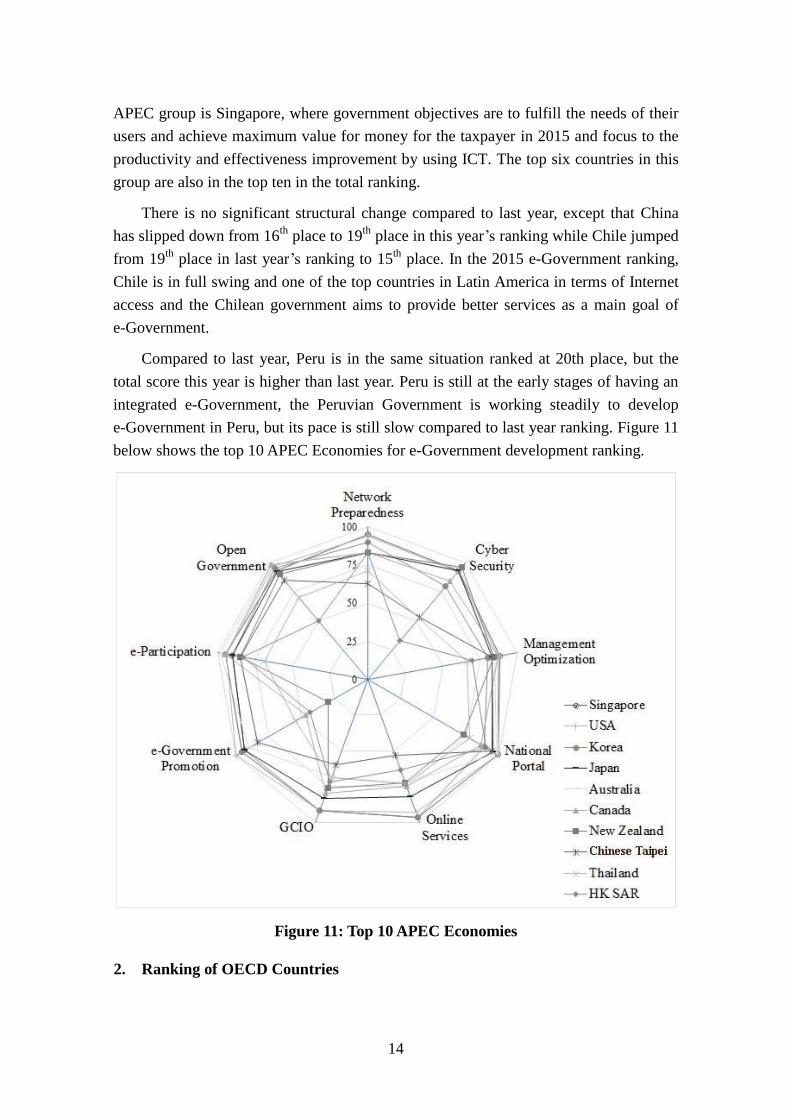
The 2015 ranking added Iceland as a new country and Iceland is also a member of
OECD. Most of the countries in the top ten of this group are also the top countries in the
overall world ranking, with the exception of Singapore as it is not an OECD member.
The leaders of group are the United States, Denmark, the UK, Korea and Japan. They
ranked for 1st, 2
nd, 3
rd 4
th, and 5
th place respectively, followed by Australia at 6
th, Estonia
at 7th
and Canada at 8th
. The two last countries in the top ten are Norway and Sweden,
both are Nordic countries.
Compared to last year Denmark jumped 9 steps from 10th
place to a rank for 2nd
place. Denmark has come a long way since it made the decision to establish a modern,
robust digital infrastructure for the public sector. As part of its efforts to counter the
digital divide, Denmark is promoting the enhanced accessibility of its public websites.
In the area of ICT and aging, Denmark has established drop-in centers for the elderly to
learn new ICT skills.
In the bottom of this group, Chile, Mexico and Turkey are developing countries.
Compared to last year, Chile ranked in a higher place and ranked for 26th while Mexico
downturn and ranked at 27th place. In Turkey, from the citizen point of view, despite
actions already taken, there is still a shortage of enabling services and a lack of
e-inclusion which is a barrier to achieving an information society. Therefore, for the
2015 ranking, Turkey ranked at the bottom in OECD countries group. Figure 12 shows
the top 10 countries with matrix of 9 indicators in this group.
16
Figure 12: Top 10 OECD Countries
IV. E-Government Ranking by the Size of Population and
GDP
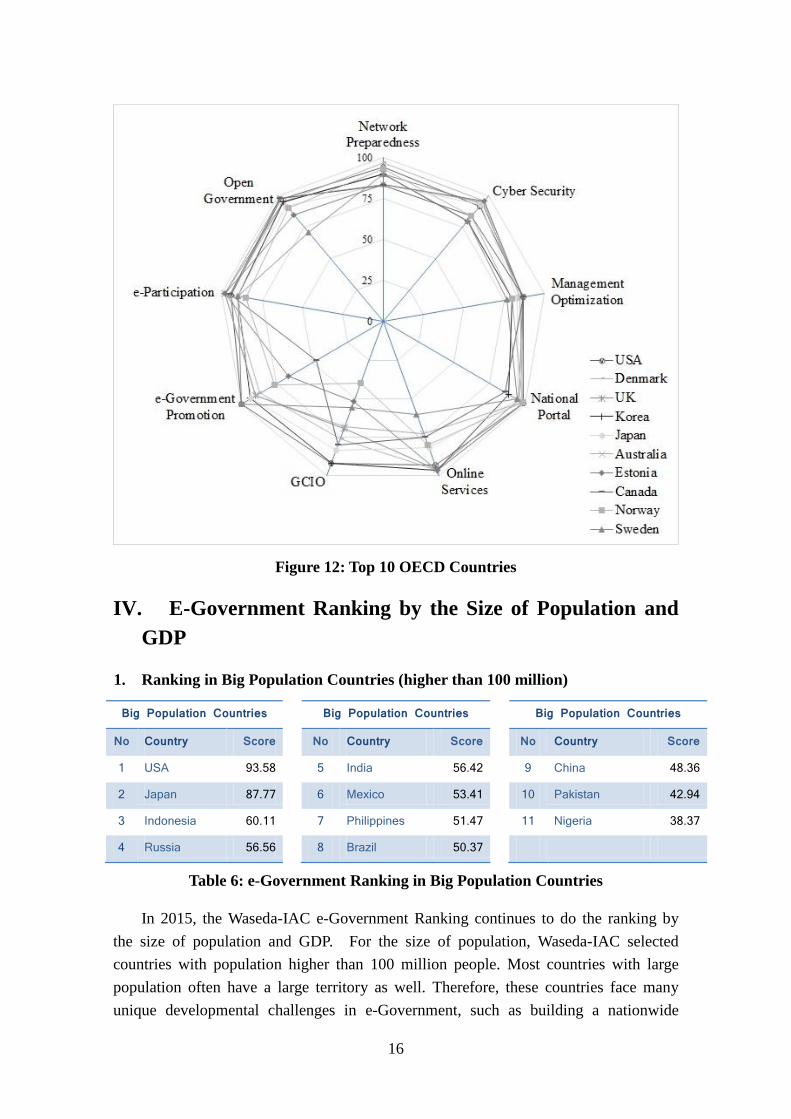
1. Ranking in Big Population Countries (higher than 100 million)
Big Population Countries Big Population Countries Big Population Countries
No Country Score No Country Score No Country Score 1 USA 93.58 5 India 56.42 9 China 48.36 2 Japan 87.77 6 Mexico 53.41 10 Pakistan 42.94 3 Indonesia 60.11 7 Philippines 51.47 11 Nigeria 38.37 4 Russia 56.56 8 Brazil 50.37
Table 6: e-Government Ranking in Big Population Countries
In 2015, the Waseda-IAC e-Government Ranking continues to do the ranking by
the size of population and GDP. For the size of population, Waseda-IAC selected
countries with population higher than 100 million people. Most countries with large
population often have a large territory as well. Therefore, these countries face many
unique developmental challenges in e-Government, such as building a nationwide

17
broadband network, and delivering e-services to all citizens. There are eleven countries
in this group.
The leaders of this group are the United States, Japan, and Indonesia. They are
ranked for 1st, 2
nd and 3
rd place respectively. The United States is very mature in keeping
up development in e-Government. And the Government is committed to delivering
public services. The United States’ objectives are to fulfill the needs of their users and
achieve maximum value for money for the taxpayer. Currently, the focus is shifted to
the improvement of productivity and effectiveness by using ICT.
The government has steadily made efforts to expand the utilization of online
services as a main part of the e-Government initiative since 1999. In 2005, online
applications at the national level covered 96% of all the administrative procedures. The
use of this online application was 70% in 2014. To enhance e-Government, the
government is making a new action plan to improve online applications for the further
promotion of their use.
China, Pakistan and Nigeria are ranked at the bottom of this group. They ranked at
9th
, 10th
and 11th
place. In China, several plans for the Information and Communication
Technology (ICT) development had been proposed and some have been implemented
already to improve service delivery through utilization of e-Government. Due to the big
population and great regional differences in this developing country, the lack of talented
government IT managers and integrated service system as well as transparency are still
the main factor that restricts the development of e-Government. However, it is obvious
that China has been devoting so much to improve e-Government services.
Pakistan is one of the emerging countries in the world which is trying to make a
difference by implementing e-Government at fast rate. The Pakistani government
believes that Information technology is a vital tool in order to accelerate economic
growth, efficient governance and human resources development. The Government of
Pakistan focuses on enhancing the government operation by implementing
e-Government Strategy. The Government has approved the e-Government Strategy and
Plan to implement across all organizations of the government. Pakistan has critical
issues in implementing the authentication scheme for full e-Government services,
rollout of broadband in Pakistan. Community and citizen engagement initiatives by
government, digital divide and digital inclusion projects being managed by government
creation and use of digital content data repositories. And the development of digital
strategies by government in Pakistan is delayed by the lack of ICT resources all over the
country.
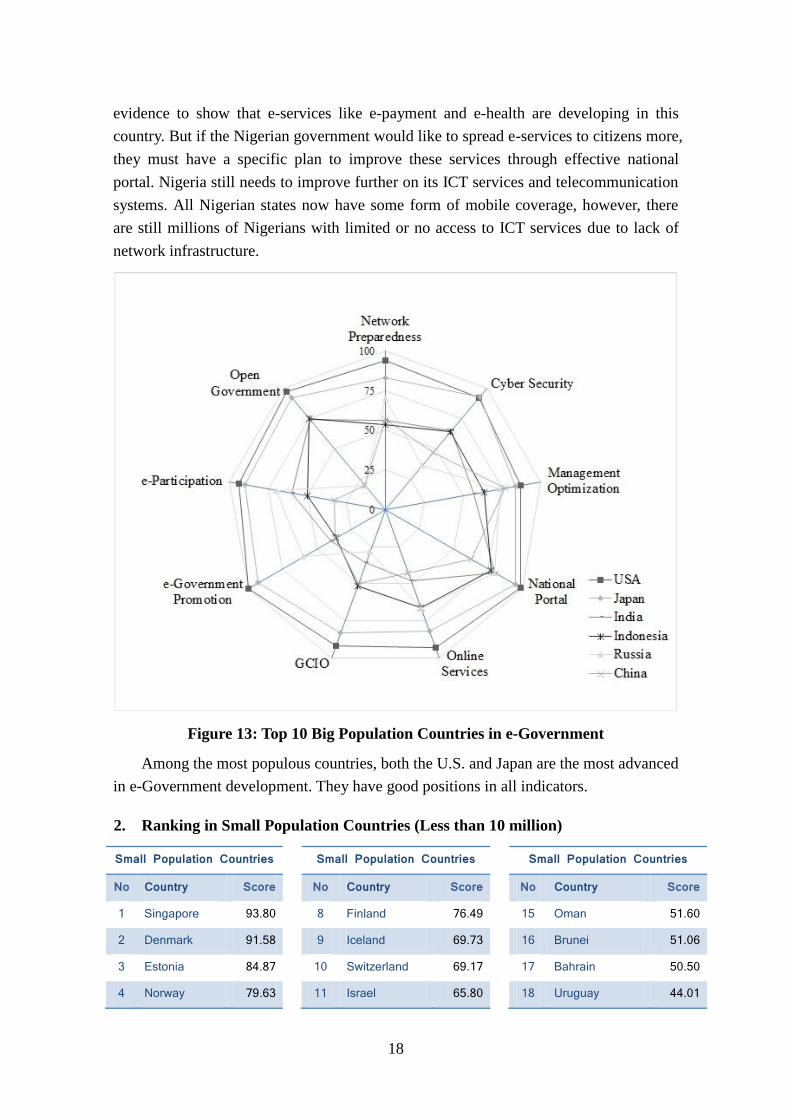
Nigeria is a developing country with a rapidly growing telecommunications market.
Both internet users and mobile users are increasing. The Government has many
strategies and plans to develop and improve e-services to citizens, and there is much
18
evidence to show that e-services like e-payment and e-health are developing in this
country. But if the Nigerian government would like to spread e-services to citizens more,
they must have a specific plan to improve these services through effective national
portal. Nigeria still needs to improve further on its ICT services and telecommunication
systems. All Nigerian states now have some form of mobile coverage, however, there
are still millions of Nigerians with limited or no access to ICT services due to lack of
network infrastructure.
Figure 13: Top 10 Big Population Countries in e-Government
Among the most populous countries, both the U.S. and Japan are the most advanced
in e-Government development. They have good positions in all indicators.
2. Ranking in Small Population Countries (Less than 10 million)
Small Population Countries Small Population Countries Small Population Countries
No Country Score No Country Score No Country Score 1 Singapore 93.80 8 Finland 76.49 15 Oman 51.60 2 Denmark 91.58 9 Iceland 69.73 16 Brunei 51.06 3 Estonia 84.87 10 Switzerland 69.17 17 Bahrain 50.50 4 Norway 79.63 11 Israel 65.80 18 Uruguay 44.01

19
5 Sweden 77.95 12 HK SAR 65.24 19 Costa Rica 42.06 6 Austria 77.26 13 UAE 58.10 20 Fiji 37.54 7 New Zealand 76.66 14 Macau 56.27
Table 7: e-Government Ranking in Small Population Countries
The 2015 ranking selected twenty countries in this group compared only ten
countries last year. This group consists of countries with a population fewer than 10
million citizens. Half of top ten countries are developed countries and other half of
countries are developing countries. Leading in this group is Singapore, followed by
Denmark in 2nd
and Estonia in 3rd
place. Nordic countries are major players in the top
ten of this group. In the bottom of this group are Uruguay, Costa Rica and Fiji. They
ranked for 18th
, 19th
and 20th
place respectively.
Singapore has implemented e-Government successful and effectively. This is an
excellent case study for the best practices for other countries to learn and apply.
Singapore, so called a city-state, has few local government divisions. In order to
monitor and manage its e-Government development better, the Singapore government
has chosen a centralized approach. The government also owns the entire central ICT
infrastructure, and manages all services and policies affecting the life and work of
citizens.
Fiji got low position in small population countries group and also near the bottom
of overall ranking. The e-Government program of Fiji is at implementing stage to
design the infrastructure and provide government services online.
In small population countries, Network preparedness is not a major issue. Also, the
indicators for GCIO and e-Government promotion have relatively low attention.

20
Figure 14: e-Government Ranking in Small Population Countries
3. e-Government Ranking in Top 10 Countries with Highest GDP in World
Highest GDP Group Highest GDP Group
No Country Score No Country Score 1 USA 93.58 6 France 73.39 2 UK 90.17 7 Italy 61.30 3 Japan 87.77 8 Russia 56.56 4 Canada 81.45 9 Brazil 50.37 5 Germany 76.46 10 China 48.36
Table 8: e-Government Ranking with Highest GDP Group
This year the United States, China and Japan are the biggest economic powers in
the world based on size of GDP. In terms of e-Government, the United States and Japan
are in first and third place, respectively, while China ranked at the bottom and ranked at
10th
place. Followed Japan is Canada ranked at 4th
place, the country replaced India
compared last year. There are three European countries Germany, France and Italy
followed Canada and ranked for 5th
, 6th
and 7th
place respectively. Compare to last year,
Russia stands in the same at 8th
place.

21
In Russia, maturity of services provided through one-stop portal is not yet
uniformed among the country regions and is expected to be steadily enhanced. The
government aims at least 70% of services to be available through the portal by 2018 and E-Health systems are expected to be optimized and integrated expanding the services
available through one-stop e-Government portal to include requests of sick-leave
certificates, electronic prescriptions and electronic inquiries.
Brazil is now still struggling to improve the efficiency of the public policy and
service for societies via e-Government, and tries to improve efficiency and transparency
of the management process through giving opportunity for its citizens to access
government information and to participate in some political administrative decisions.
Brazil is one of the biggest population and territory, therefore to provide the e-services
to all citizens are required to setup a good infrastructure, now the situation is low
awareness of e-Government services is a barrier preventing its effective use, therefore it
can be established that this is also an obstacle to the assessment of citizen demand. In
High GDP countries, management optimization has gained the good attention (figure
15)
Figure 15: Top 10 e-Government Ranking in Highest GDP Countries

22
V. e-Government Ranking by Regions
1. Ranking in Asia-Pacific Countries
Asia-Pacific Countries Asia-Pacific Countries Asia-Pacific Countries
No Country Score No Country Score No Country Score 1 Singapore 93.80 7 Thailand 67.31 13 Macau 56.27 2 Korea 89.39 8 HK SAR 65.24 14 Philippines 51.47 3 Japan 87.77 9 Malaysia 64.87 15 Brunei 51.06 4 Australia 86.30 10 Indonesia 60.11 16 China 48.36 5 New Zealand 76.66 11 Vietnam 57.03 17 Pakistan 42.94 6 Chinese
Taipei 72.76 12 India 56.42 18 Fiji 37.54
Table 9: e-Government Ranking in Asia-Pacific Countries
The Asia-Pacific region consists of fifty-two countries and territories, but this
survey covered only eighteen countries, due to Cambodia has been removed for this
year of the survey. Compared to last year, there has been no change in the top 9
countries. Both Indonesia and Vietnam got higher positions while India dropped and
ranked at 12th
place. The bottom of this group is Pakistan and Fiji, they have the same
positions compared with last year.
The Korean Government has been expanding the integration of e-Government
towards the Smart e-Government promoting the usage of public service and active
participation in anytime and anywhere. Currently, the Ministry of Public Administration
and Security (MOPAS) is responsible for affairs related to national administration,
government organizations, personnel management, and e-Government and disaster
safety. Under the slogan of “Moving toward a smaller and more efficient government”,
MOPAS actively supports the local government in terms of local administration, finance,
and regional development for the promotion of greater local autonomy. In order to
perform those strategies, Korean government needs to set up the agenda based on
prediction of social and technical changes, and analysis of future needs. Several
challenges could be identified along the development journey of Korea e-Government
are digital divide, internet addiction, and cyber ethic.

23
Figure 16: Top 10 e-Governments Ranking in Asia-Pacific Countries
2. Ranking in Americas Countries
Americas Countries Americas Countries Americas Countries
No Country Score No Country Score No Country Score 1 USA 93.58 5 Brazil 50.37 9 Venezuela 44.65 2 Canada 81.45 6 Argentina 50.32 10 Uruguay 44.01 3 Chile 53.49 7 Colombia 49.36 11 Costa Rica 42.06 4 Mexico 53.41 8 Peru 46.21
Table 10: e-Government Ranking in Americas Countries
The 2015 ranking marks the new comer-Costa Rica has been added into the ranking
survey, it makes the total of countries in Americas becomes eleven members. The US
ranked for 2nd
place in overall ranking but in this group, the US leads all countries and
ranked at 1st place, followed by Canada ranked for 2
nd, Chile, Mexico and Brazil ranked
for 3rd
, 4th
, and 5th
place respectively. Venezuela, Uruguay and Costa Rica stood at the
bottom of this group and ranked for 9th
, 10th
, and 11th
place.
In 2014, Canadian government has launched [Digital Canada 150]. The Digital
Canada 150 is aimed to take the full benefit of digital opportunity for Canadian. It is

24
expected that in 2017, in a 150th anniversary of Canada, Canada will thrive the digital
Canada which accentuates five pillars; connecting Canadians, protecting Canadians,
economic opportunities, digital government, and Canadian content. E-Government
implementation is quite advanced in Canada with most of its services being not just
informational but also transactional. With the continuation of support from the
government, Canada is likely to continue to be one of the top leaders of e-Government
in the world. By introducing the Digital Canada 150, Canada has shifted its
e-Government to the digital government.
Figure 17: Top 10 e-Government Ranking in Americas Countries
3. Ranking in European Countries
EU Countries EU Countries EU Countries
No Country Score No Country Score No Country Score 1 Denmark 91.52 8 Germany 76.46 15 Czech Republic 63.48 2 UK 90.17 9 France 73.39 16 Italy 61.30 3 Estonia 84.87 10 Belgium 71.69 17 Poland 57.30 4 Norway 79.63 11 Iceland 69.73 18 Spain 57.12 5 Sweden 77.95 12 Netherlands 69.53 19 Romania 53.11

25
6 Austria 77.26 13 Switzerland 69.17 7 Finland 76.49 14 Portugal 63.93
Table 11: e-Government Ranking in European Countries
EU countries are encouraged to deploy advanced technologies, institute better
governance and e-services while simultaneously pursuing greater transparency,
efficiency and inclusion.
This year, the new comer is Iceland, despite of the first time in the ranking. Iceland
got a high position and ranked in middle of this group. Compared to the last year,
Denmark replaced the UK to rank for first place, followed by the UK and Estonia
ranked in 2nd
, and 3rd
place. In this group Finland declined 4 steps and ranked at 7th
this
year, same with Finland, Italy also slipped 4 steps and ranked for 16th
place. In the
bottom is Romania, the country has not changed position compared last year survey.
The UK is very mature in keeping up development in e-Government. And the
government is committed to delivering public services. The UK’s objectives are to
fulfill the needs of their users and achieve maximum value for money for the taxpayer.
Currently, the focus is shifted to the productivity and effectiveness improvement by
using ICT. New strategy was already set up in 2011 to implement this idea.
Italy recently launched an advance mobile application for people with rheumatoid
arthritis, called the Rheumatoid Arthritis App. Electronic health records have been also
implemented in all of Italy's autonomous regions and provinces by December 2013,
with digital prescriptions introduced in the country subsequently. Furthermore, in a
country burdened by paperwork, the new decree opens up the possibility of registering
births and deaths, and payments to public administrations online, through a simplified
system.
Since the beginning of the decade, Romania has passed fundamental ICT-related
laws, planned and implemented the first steps towards an Informational Society but
there is still much that needs improvement. Romania has the advantage of good ICT
infrastructure in place and of the great availability of IT professionals. The e-Romania
project has yet to be implemented. Local e-Government initiatives are underway in
several regions but there are big differences among regions. A government oversight
board would be necessary. E-participation also needs to be enhanced.

26
Figure 18: Top 10 e-Governments Ranking in European Countries
4. Ranking in Africa, Middle East and CIS Countries
Africa, Middle East & CIS Africa, Middle East & CIS Africa, Middle East & CIS
No Country Score No Country Score No Country Score 1 Israel 65.80 6 Bahrain 50.50 11 Morocco 43.13 2 UAE 58.10 7 South Africa 49.30 12 Georgia 40.73 3 Russia 56.56 8 Kazakhstan 47.73 13 Nigeria 38.37 4 Oman 51.60 9 Saudi Arabia 47.48 14 Egypt 37.19 5 Turkey 51.31 10 Tunisia 45.87 15 Kenya 32.91
Table 12: e-Government Ranking in Africa, Middle East and CIS Countries
This group includes countries from Africa, Middle East and CIS, included new
countries – Bahrain, Oman, and Morocco, the 2015 ranking marks Uzbekistan and Iran
have been removed from ranking survey. In total this group ranking has fifteen countries.
Israel ranked in the 1st place, followed by UAE in 2
nd and Russia in 3
rd. The bottom of
this group is also the same countries in the overall ranking. They are Nigeria, Egypt and
Kenya.

27
In terms of e-Government, Israel is an advanced country within the region.
E-Government in Israel is well matured and widely used in administration implemented
using the five Layer model of e-Government. The overall e-Government strategy places
enhanced information access and integration. A strategic solution enabling the
government as a whole to perfectly harness information and knowledge resources in
order to achieve an order of magnitude improvements in effectiveness, efficiency and
service delivery.
The new trends of e-Government in UAE are interesting for the rest of the region.
The next phase for the UAE – which is seeking to establish itself as smart government
leader in the region – will be to win users over to the latest apps and building
m-government to help citizens have a better channel to apply for their services. The
future is going to be about interconnecting government to government, and more
collaboration on the government to citizen side.
The development of e-Government in Egypt has progressed hand in hand with
Egyptian efforts to establish public sector reforms and encourage the development of
the information society. These two trends constitute important existing drivers for
e-Government. Following the uprisings that culminated in the revolution led to the
ongoing transition process, a third e-Government driver has emerged, centered on the
needs of the citizens and the civil society.
Kenya as well as other developing countries is developing the e-Government
agenda with the assistance of other countries and international organizations. The
Kenyan e-Government master plan was developed by the Kenya ICT Authority, and is
anchored in the constitution of Kenya.

28
Figure 19: Top 10 e-Government Ranking in Africa, Middle-East and CIS
Countries
VI. Methodology
The Waseda – IAC e-Government Ranking survey is based on analyzing the
development of mainly 9 major indicators and 32 sub-indicators in the public sector, as
well as the relationship between governments and their stakeholders. They include: (1)
Network Preparedness; (2) Management Optimization; (3) Online Service; (4) National
Portal/ Homepage; (5) Government Chief Information Officer; (6) e-Government
Promotion; (7) E-Participation/ Digital Inclusion; (8) Open Government/ Data and (9)
Cyber Security. To evaluate data, this survey is based on the following flowchart:

29
Figure 20: Processes Diagram
In addition to the research team of Institute of e-Government, Waseda University.
There are 12 prominent academia from 12 world class universities in 12 countries under
the umbrella of IAC who have served as global experts group for advising and
monitoring the survey
For evaluating the framework of researches, to check and review the methodology,
indicators and targeted countries as well as monitoring 63 country reports for 2015
edition, two global Experts group meetings have been organized by Institute of
e-Government, Waseda University and IAC in Singapore in June and in Guimaraes City,
Portugal in October 2014. Also, Researchers have attended many international
meetings/workshops/forums in Bangkok, Jakarta, Brussels, Geneva, New York and
Paris as well as Tokyo as home ground in 2014/15.
Mathematically, Statistics of the Waseda – IAC e-Government Ranking is a
weighted average of the nine indicators scores. The scores are based on the table below:
Start
Search information/data by 9
indicators and 32 sub-indicators
Yes No Questionnaires
Draft scores
Experts group
Audit
Tabulate all scores
Ranking
Country Report

30
No Indicators Raw score Max raw score
Max weighted score
Scoring parameters
Final score
1 Network Preparedness
A 30 5%=W1 W1/30*100 =
X1 A*X1
2 Management Optimization
B 15 12%=W2 W2/15*100 =
X2 B*X2
3 Online Service C 40 15%=W3 W3/40*100 =
X3 C*X3
4 National Portal D 35 8%=W4 W4/35*100 =
X4 D*X4
5 Government CIO E 25 12%=W5 W5/25*100 =
X5 E*X5
6 e-Government Promotion
F 30 10%=W6 W6/30*100 =
X6 F*X6
7 E-Participation G 20 10%=W7 W7/20*100 =
X7 G*X7
8 Open Government H 20 10%=W8 W7/20*100 =
X8 H*X8
9 Cyber Security I 25 10%=W9 W7/20*100 =
X9 I*X9
Total score: ∑
Table 13: Weighted Scores Method
VII. Contributors List (● indicate group leader)
1. List of Global Experts Group
Prof. Dr. Toshio Obi, Director, Institute of e-Government, Waseda University, Japan,
President, International Academy of CIO, Director APEC e-Gov Research Center.
- Prof. Dr. J.P Auffret, Chair, MOT/CIO Program of George Mason University, USA.
- Prof. Dr. Lim Swee Cheang, Director, Institute of Systems Science, National
University of Singapore.
- Prof. Dr. Luca Buccoliero, Marketing Department Bocconi University, Italy.
- Dr. Elsa Estevez, Senior researcher, United National University, Portugal.
- Prof. Dr. Suhono Harso Supangkat, Bandung Institute of Technology, Indonesia.
- Prof. Dr. Francisco Magno, Director, Institute of Governance De La Salle
University, Philippines.

31
- Prof. Fang Chun Yang, Dean, Academy of e-Government, Peking University,
China.
- Associate Prof. Dr. Jirapon Sunkpho, Thammasat University, Thailand.
- Prof. Dr. Alexander Ryzhov, School of IT management, Federal Academy of
National Economy, Russia.
- Prof. Dr. Brabec Zdenek, Czech Technical University in Praha, Czech Republic.
- Prof. Dr. Tomi Dahlberg, Information System, University of Turku, Finland.
2. List of Professors and Experts at Institute of e-Government, Waseda
University
Prof. Dr. Naoko Iwasaki, Waseda
University
- Prof. Dr. Takashi Kobayashi, Tokai
University
- Prof. Dr. Tatsuyuki Negoro, Waseda
University
- Prof. Dr. Yoshio Tozawa, University of
Industrial and Science
- Prof. Dr. Kiyoshi Nakamura, Waseda
University
- Mr. Keiichi Iwata, Manager NTT Data
- Prof. Kiyohide Higuchi, Waseda
University
- LLC Naoko Mizukoshi, Lawyer
- Prof. Dr. Hiroko Kudo, Chuo
University
- Mr. Akira Watari, ex-Director of IT,
Toyota Motors
3. List of Researchers and Research Assistants at Institute of e-Government,
Waseda University
Mr. Nguyen Manh Hien - Mr. Pingky Dezar Zulkarnain
- Mr. Bandaxay Lovanxay - Mr. James Giguere
- Mr. Nguyen Ngoc Anh - Ms. Yang Yao
- Dr. Diana Ishmatova - Dr. Nguyen Thi Thanh Hai