Embed Size (px)
Citation preview
1
HIGH VOLTAGE ENGINEERING AND SOLAR LABORATORY
Course Code : AEE111
Regulation : R16
Class : IV Year I Semester
Branch : EEE
Year : 2019- 2020
Department of Electrical and Electronics Engineering
INSTITUTE OF AERONAUTICAL ENGINEERING
(Autonomous)
Dundigal – 500 043, Hyderabad
2
INSTITUTE OF AERONAUTICAL ENGINEERING (Autonomous)
Dundigal, Hyderabad - 500 043
ELECTRICAL AND ELECTRONICS ENGINEERING
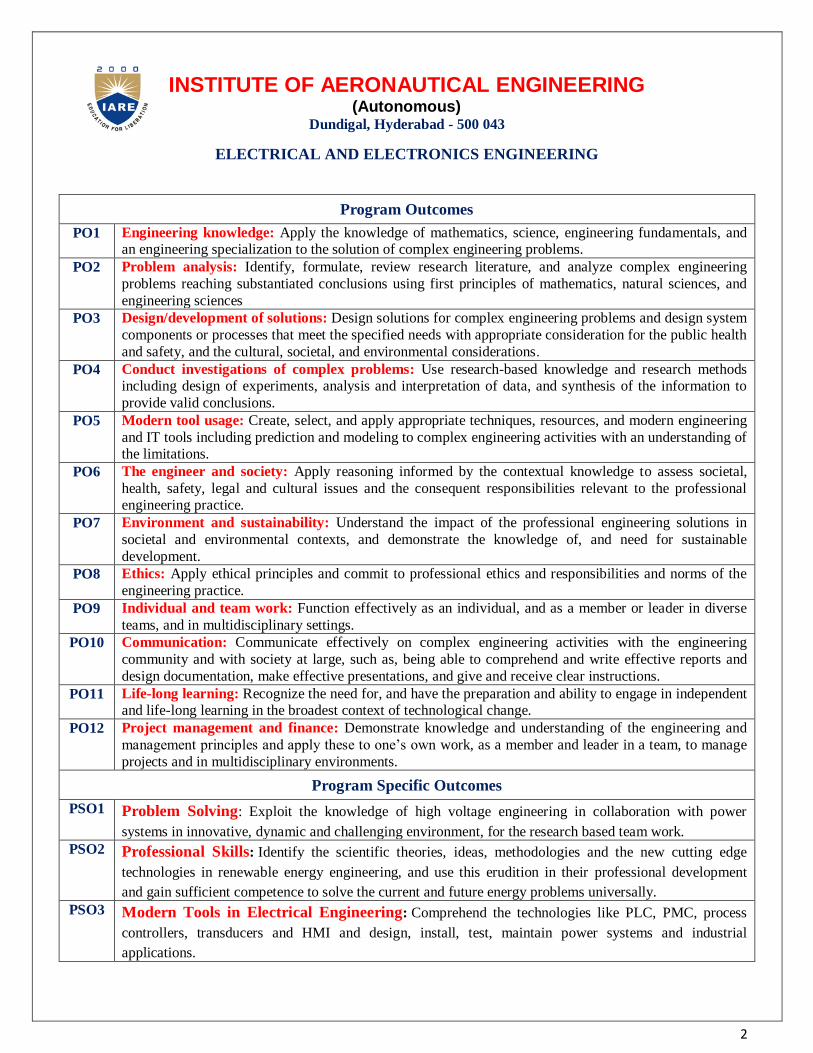
Program Outcomes
PO1 Engineering knowledge: Apply the knowledge of mathematics, science, engineering fundamentals, and an engineering specialization to the solution of complex engineering problems.
PO2 Problem analysis: Identify, formulate, review research literature, and analyze complex engineering
problems reaching substantiated conclusions using first principles of mathematics, natural sciences, and
engineering sciences
PO3 Design/development of solutions: Design solutions for complex engineering problems and design system
components or processes that meet the specified needs with appropriate consideration for the public health
and safety, and the cultural, societal, and environmental considerations.
PO4 Conduct investigations of complex problems: Use research-based knowledge and research methods including design of experiments, analysis and interpretation of data, and synthesis of the information to
provide valid conclusions.
PO5 Modern tool usage: Create, select, and apply appropriate techniques, resources, and modern engineering
and IT tools including prediction and modeling to complex engineering activities with an understanding of the limitations.
PO6 The engineer and society: Apply reasoning informed by the contextual knowledge to assess societal,
health, safety, legal and cultural issues and the consequent responsibilities relevant to the professional engineering practice.
PO7 Environment and sustainability: Understand the impact of the professional engineering solutions in
societal and environmental contexts, and demonstrate the knowledge of, and need for sustainable
development.
PO8 Ethics: Apply ethical principles and commit to professional ethics and responsibilities and norms of the
engineering practice.
PO9 Individual and team work: Function effectively as an individual, and as a member or leader in diverse
teams, and in multidisciplinary settings.
PO10 Communication: Communicate effectively on complex engineering activities with the engineering
community and with society at large, such as, being able to comprehend and write effective reports and
design documentation, make effective presentations, and give and receive clear instructions.
PO11 Life-long learning: Recognize the need for, and have the preparation and ability to engage in independent and life-long learning in the broadest context of technological change.
PO12 Project management and finance: Demonstrate knowledge and understanding of the engineering and
management principles and apply these to one‟s own work, as a member and leader in a team, to manage
projects and in multidisciplinary environments.
Program Specific Outcomes
PSO1 Problem Solving: Exploit the knowledge of high voltage engineering in collaboration with power
systems in innovative, dynamic and challenging environment, for the research based team work.
PSO2 Professional Skills: Identify the scientific theories, ideas, methodologies and the new cutting edge
technologies in renewable energy engineering, and use this erudition in their professional development
and gain sufficient competence to solve the current and future energy problems universally.
PSO3 Modern Tools in Electrical Engineering: Comprehend the technologies like PLC, PMC, process
controllers, transducers and HMI and design, install, test, maintain power systems and industrial
applications.
3
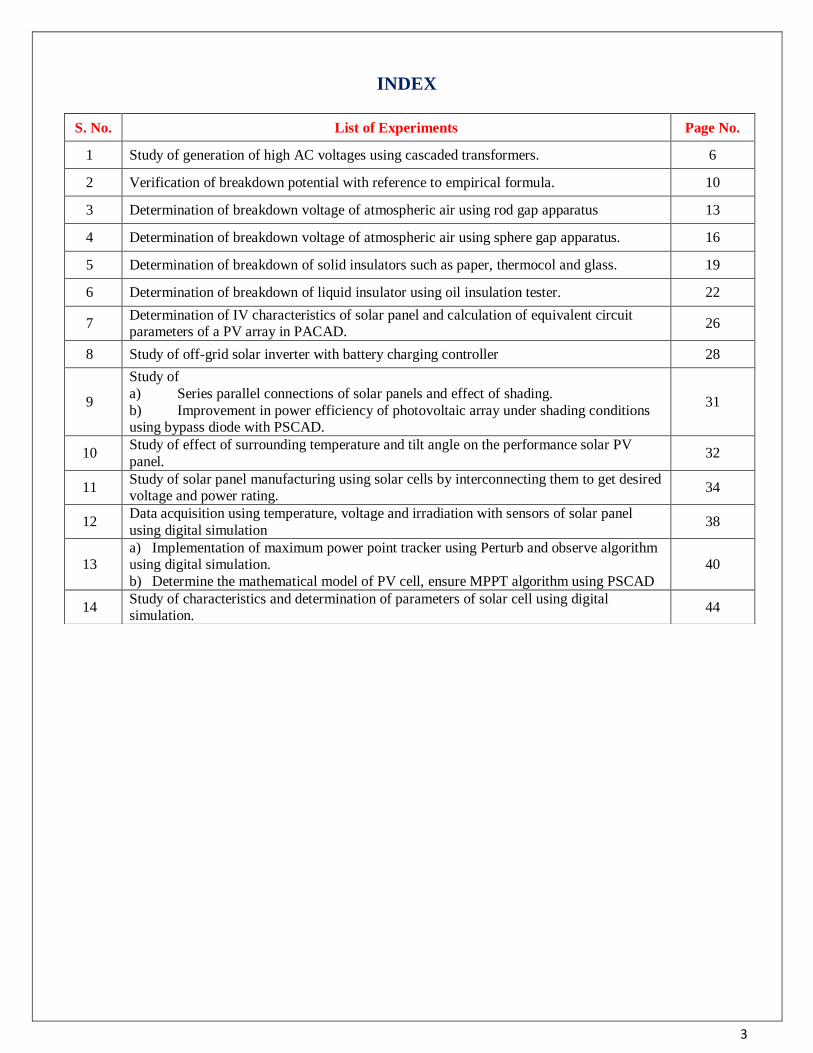
INDEX
S. No. List of Experiments Page No.
1 Study of generation of high AC voltages using cascaded transformers. 6
2 Verification of breakdown potential with reference to empirical formula. 10
3 Determination of breakdown voltage of atmospheric air using rod gap apparatus 13
4 Determination of breakdown voltage of atmospheric air using sphere gap apparatus. 16
5 Determination of breakdown of solid insulators such as paper, thermocol and glass. 19
6 Determination of breakdown of liquid insulator using oil insulation tester. 22
7 Determination of IV characteristics of solar panel and calculation of equivalent circuit parameters of a PV array in PACAD.
26
8 Study of off-grid solar inverter with battery charging controller 28
9
Study of
a) Series parallel connections of solar panels and effect of shading.
b) Improvement in power efficiency of photovoltaic array under shading conditions using bypass diode with PSCAD.
31
10 Study of effect of surrounding temperature and tilt angle on the performance solar PV
panel. 32
11 Study of solar panel manufacturing using solar cells by interconnecting them to get desired voltage and power rating.
34
12 Data acquisition using temperature, voltage and irradiation with sensors of solar panel
using digital simulation 38
13 a) Implementation of maximum power point tracker using Perturb and observe algorithm using digital simulation.
b) Determine the mathematical model of PV cell, ensure MPPT algorithm using PSCAD
40
14 Study of characteristics and determination of parameters of solar cell using digital simulation.
44
4
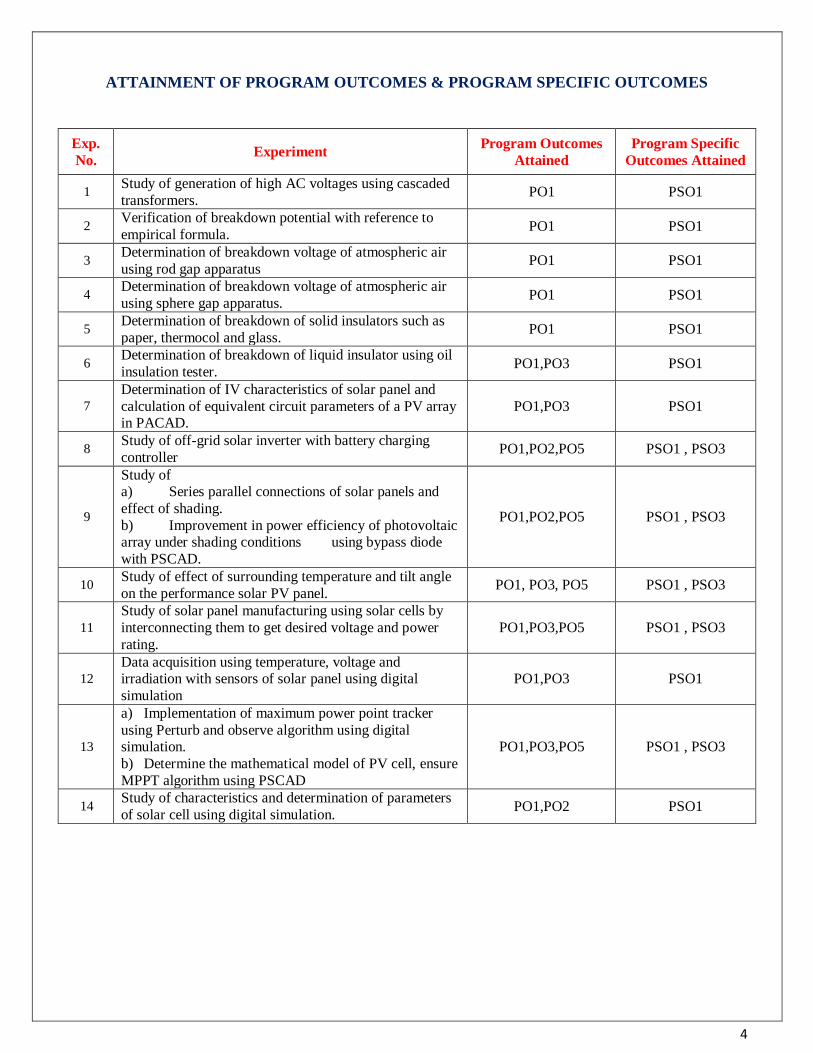
ATTAINMENT OF PROGRAM OUTCOMES & PROGRAM SPECIFIC OUTCOMES
Exp.
No. Experiment
Program Outcomes
Attained
Program Specific
Outcomes Attained
1 Study of generation of high AC voltages using cascaded
transformers. PO1 PSO1
2 Verification of breakdown potential with reference to
empirical formula. PO1 PSO1
3 Determination of breakdown voltage of atmospheric air
using rod gap apparatus PO1 PSO1
4 Determination of breakdown voltage of atmospheric air
using sphere gap apparatus. PO1 PSO1
5 Determination of breakdown of solid insulators such as
paper, thermocol and glass. PO1 PSO1
6 Determination of breakdown of liquid insulator using oil
insulation tester. PO1,PO3 PSO1
7
Determination of IV characteristics of solar panel and
calculation of equivalent circuit parameters of a PV array in PACAD.
PO1,PO3 PSO1
8 Study of off-grid solar inverter with battery charging
controller PO1,PO2,PO5 PSO1 , PSO3
9
Study of a) Series parallel connections of solar panels and
effect of shading.
b) Improvement in power efficiency of photovoltaic array under shading conditions using bypass diode
with PSCAD.
PO1,PO2,PO5 PSO1 , PSO3
10 Study of effect of surrounding temperature and tilt angle
on the performance solar PV panel. PO1, PO3, PO5 PSO1 , PSO3
11
Study of solar panel manufacturing using solar cells by
interconnecting them to get desired voltage and power
rating.
PO1,PO3,PO5 PSO1 , PSO3
12
Data acquisition using temperature, voltage and irradiation with sensors of solar panel using digital
simulation
PO1,PO3 PSO1
13
a) Implementation of maximum power point tracker
using Perturb and observe algorithm using digital simulation.
b) Determine the mathematical model of PV cell, ensure
MPPT algorithm using PSCAD
PO1,PO3,PO5 PSO1 , PSO3
14 Study of characteristics and determination of parameters
of solar cell using digital simulation. PO1,PO2 PSO1
5
HIGH VOLTAGE ENGINEERING AND SOLAR LABORATORY
OBJECTIVE:
The aim of this course is to conduct experiments deals with different mediums of insulation, break down of
insulation, understanding need of insulation technology in power system, generation of high direct current and
alternating current voltage, measurement of high alternating current and direct current voltages, testing of insulation
under all types of conditions using generated high direct current and alternating current voltages. This course
includes experiments deal with solar power generation and measurement technology.
OUTCOMES:
Upon the completion of high voltage engineering and solar laboratory practical course, the student will be able to
attain the following:
1
Measure the value of high direct current voltages , high alternating current voltages , impulse
voltage and Current after generation.
2
Examine the power system equipment like insulators, bushings, isolators and circuit breakers
for their breakdown strength 3
Explain the various methods which causes breakdown in liquid dielectric medium and their
importance in power system protection.
4 Illustrate the process which decreases the breakdown strength of solid insulating mediums and their application in power system.
5 Discuss different phenomenon which leads to break down of gas insulation medium and specify
the particular gas any power system apparatus. 6 Study of off-grid solar inverter with battery charging controller.
7
Understand the role of solar energy in the context of regional and global energy system, its
economic, social and environmental connotations, and the impact of technology on a local and
global context. 8 Understand the physical principles of the photovoltaic (PV) solar cell and what its sources of
losses are.
9 Draw and analysis of maximum power point tracker using Perturb and observe algorithm using digital simulation.
10 Study of characteristics and determination of parameters of solar cell using digital simulation.
6
EXPERIMENT - 1
Study of generation of high AC voltages using cascaded transformers
1.1.1 AIM
Alternating voltages are required for most high-voltage tests. The investigations are performed either
directly with this type of voltage, or used in circuits for the generation of high DC voltage and impulse
voltages. This experiment examines the generation of High AC Voltage using a Cascaded transformer.
1.1.2 APPARATUS:
S
No. Equipment Range Type Quantity
1. Cascaded transformer 100 kVA - 01
2. Control Pannel 01
3. Rectifier 01
4. Resistance Divider - - 01
5. Connecting Wires required
1.1.3 THEORY:
High Voltage Transformer:
High voltage transformer is the key part of the equipment. It is a step up, oil cooled mobile transformer. It
has primary winding as the low voltage winding & secondary as the high voltage winding. The high voltage
end of the winding is brought out through the bushing and starting lead of the secondary winding is taken to
the „A” point.
Control Panel:
Control panel which is a part of the equipment has all the necessary meters, switches indicators, etc., for
easy operation. The control panel is made of CR sheet duly galvanized and powder coated. The equipment
is a table top unit provided with handles for lifting. The equipment is a motorized control.
Meters
• Voltmeter: (0-300V AC)
It indicates the variable input voltage of the high voltage Transformer.
• A.C kV Meter: (0-100V AC – 100kV stamping)
This measures the A.C output and is fixed to the primary side.
• A.C Leakage current (I3):
This meter reads the A.C leakage current - 100mA AC rectified.
• Timer:
The timer is used to perform the withstand test. The Range of this timer is 1 second to 30 hours.
7
PUSH BUTTON SWITCHES (with illumination)
• MAINS OFF: It is used to put OFF the mains supply to the control panel.
• MAINS ON: It is used to put ON the mains supply of the control panel.
• SAMPLE FAIL/RESET: It is used to reset the complete equipment when the sample fails.
• HT INCREASE: It is used to increase the variable input voltage to the transformer. The voltage
gradually increases as long as it is pressed.
• HT DECREASE: It is used to decrease the voltage. The voltage gradually increases as long as it
is pressed.
PUSH BUTTON SWITCHES
EMERGENCY OFF: In case of any short circuit or problem with the equipment, press this to
turn off the equipment.
HT OFF: It is used to put OFF the HT supply.
HT ON: It is used to put ON the HT supply.
MEMORY: It is used to read the breakdown voltage.
INDICATORS
DOOR OPEN: This indicates whether the door to the HV room is open or not. Equipment can
be operated only if the door is closed.
UNIT READY: This indicates that dimmer is in the zero interlock position. H.T can be put on
only after zero interlocking.
HT OFF: It indicates that the HT supply is off.
HT ON: It indicates that the HT supply is off.
SAMPLE PASS: It indicates whether the sample withstands the test.
TOGGLE SWITCHES
TIMER BYPASS: This switch has two modes: ON and BYPASS. If it is put on BYPASS then
the timer is not operated. For withstand test it should always be put in ON position.
SELECTOR SWITCHES
LEAKAGE CURRENT SELECTOR: It is used to select the leakage current position. Ratings
provided are 8, 25 and 30mA respectively.
CONTROL SWITCH: It is used to lock the control panel.
8
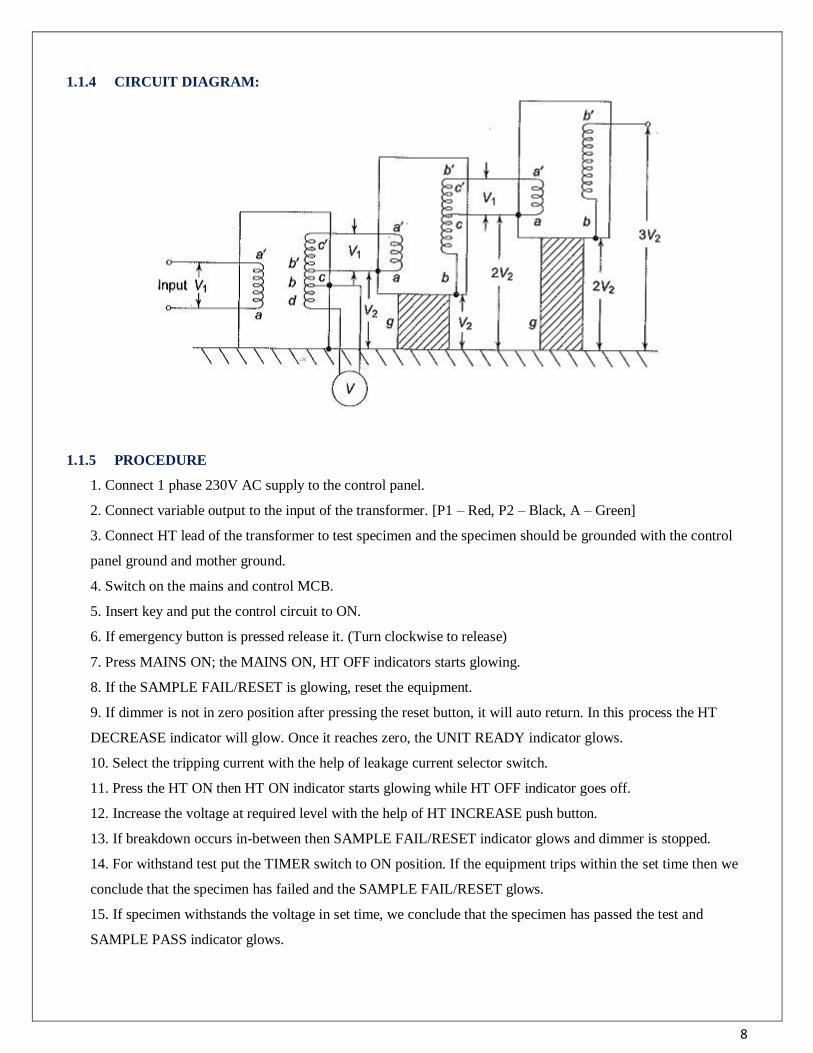
1.1.4 CIRCUIT DIAGRAM:
1.1.5 PROCEDURE
1. Connect 1 phase 230V AC supply to the control panel.
2. Connect variable output to the input of the transformer. [P1 – Red, P2 – Black, A – Green]
3. Connect HT lead of the transformer to test specimen and the specimen should be grounded with the control
panel ground and mother ground.
4. Switch on the mains and control MCB.
5. Insert key and put the control circuit to ON.
6. If emergency button is pressed release it. (Turn clockwise to release)
7. Press MAINS ON; the MAINS ON, HT OFF indicators starts glowing.
8. If the SAMPLE FAIL/RESET is glowing, reset the equipment.
9. If dimmer is not in zero position after pressing the reset button, it will auto return. In this process the HT
DECREASE indicator will glow. Once it reaches zero, the UNIT READY indicator glows.
10. Select the tripping current with the help of leakage current selector switch.
11. Press the HT ON then HT ON indicator starts glowing while HT OFF indicator goes off.
12. Increase the voltage at required level with the help of HT INCREASE push button.
13. If breakdown occurs in-between then SAMPLE FAIL/RESET indicator glows and dimmer is stopped.
14. For withstand test put the TIMER switch to ON position. If the equipment trips within the set time then we
conclude that the specimen has failed and the SAMPLE FAIL/RESET glows.
15. If specimen withstands the voltage in set time, we conclude that the specimen has passed the test and
SAMPLE PASS indicator glows.
9
1.1.7 PRECAUTIONS:
1. The ground points of the equipments must be grounded firmly with the mother ground.
2. H.T should not be put ON if grounding rod is in ground line close position.
3. Operator should not enter the test bay while the equipments are in operation.
4. Don‟t enter the test bay without grounding rod in your hand
5. Before touching the equipment ground it with the help of grounding rod.
1.1.8 RESULT:
1.1.8 PRE LABVIVA QUESTIONS:
1. How do you increase the voltage of an AC circuit?
2. What is Cascade transformer?
3. What is full wave voltage doubler?
4. How does a voltage multiplier circuit work?
5. How do you increase the voltage in a circuit?
1.1.9 POST LAB VIVA QUESTIONS:
1. What is a voltage booster?
2. What is voltage doubler and Tripler?
3. What is the function of voltage regulator?
4. How do you increase the voltage rating of a capacitor?
5. How do you convert low voltage to high?
10
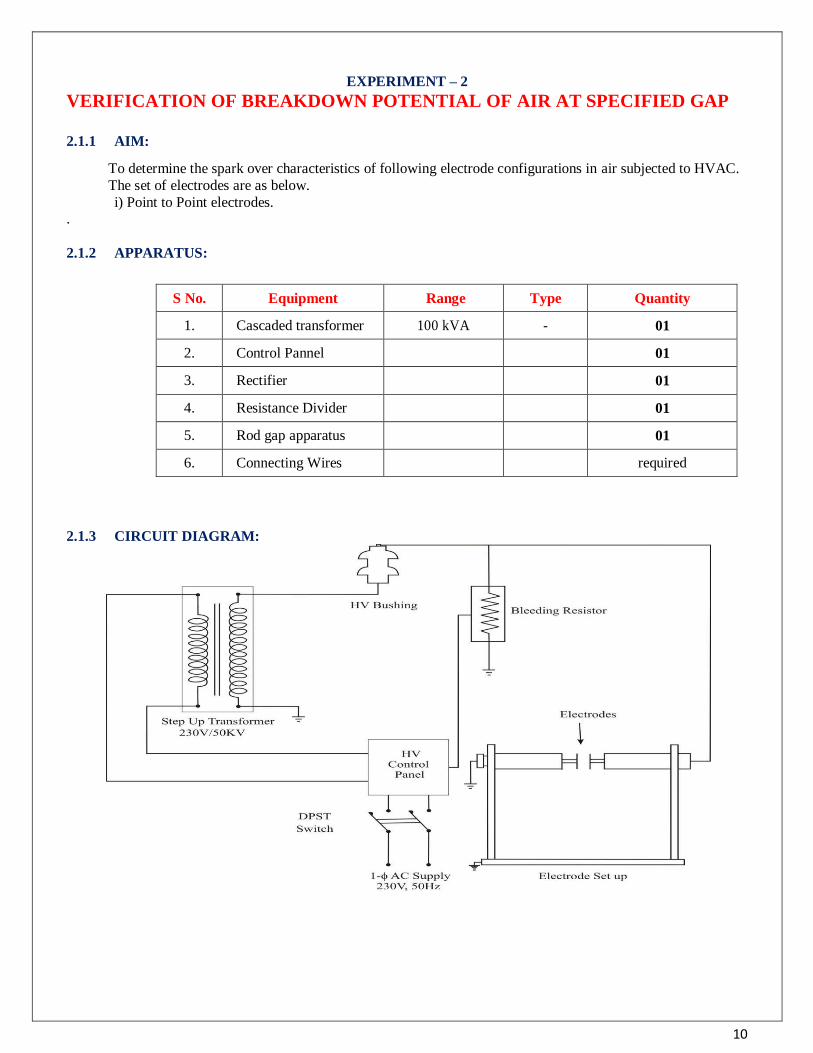
EXPERIMENT – 2
VERIFICATION OF BREAKDOWN POTENTIAL OF AIR AT SPECIFIED GAP
2.1.1 AIM:
To determine the spark over characteristics of following electrode configurations in air subjected to HVAC.
The set of electrodes are as below.
i) Point to Point electrodes. .
2.1.2 APPARATUS:
S No. Equipment Range Type Quantity
1. Cascaded transformer 100 kVA - 01
2. Control Pannel 01
3. Rectifier 01
4. Resistance Divider 01
5. Rod gap apparatus 01
6. Connecting Wires required
2.1.3 CIRCUIT DIAGRAM:
11
2.1.4 THEORY:
A gas in its normal state is almost a perfect insulator, however, when a high voltage is applied between the
two electrode immersed in a gaseous medium. The gas becomes a conductor and an electrical breakdown occurs.The processes that are primarily responsible for the breakdown of gas are ionized by collision, photo
ionization and the secondary ionization processes. The process of liberating an electron from a gas molecule
with the simultaneous production of a positive ion is called ionization. If the electric field is uniform, a gradual
increase in voltage across a gap produces a breakdown in voltage across the gap on the other hand, if the field
is non-uniform an increase in voltage will first cause a discharge in the gas to appear at points with highest
electric field intensity, namely at sharp points or where the electrodes are curved or on transmission lines. This
form of discharge is called a corona discharge and can be observed as bluish luminance. This phenomenon is
always accomplished by hissing noise and the air surrounding the corona region becomes converted into Ozone.
2.1.4 PROCEDURE:
1. Connections are made as per the circuit diagram.
2. Ensure all earth potentials are properly connected to the main earth point.
3. Keep the dimmer at zero position.
4. Place the electrode set, make zero adjustment and keep certain space between the electrodes configuration.
5. Switch „ON‟ the power supply to the control panel.
6. Slowly and gradually increase the voltage with the help of dimmer until the flash over occurs between the
two electrodes used in the set.
7. Note down the gap length and flash over voltage with the help of meter provided in the control panel.
8. Repeat the above procedure for different gap length between the electrodes and also for the different
electrode configuration with both positive and negative polarity.
9. Then plot the graph between flash over Voltage V/s the gap length.
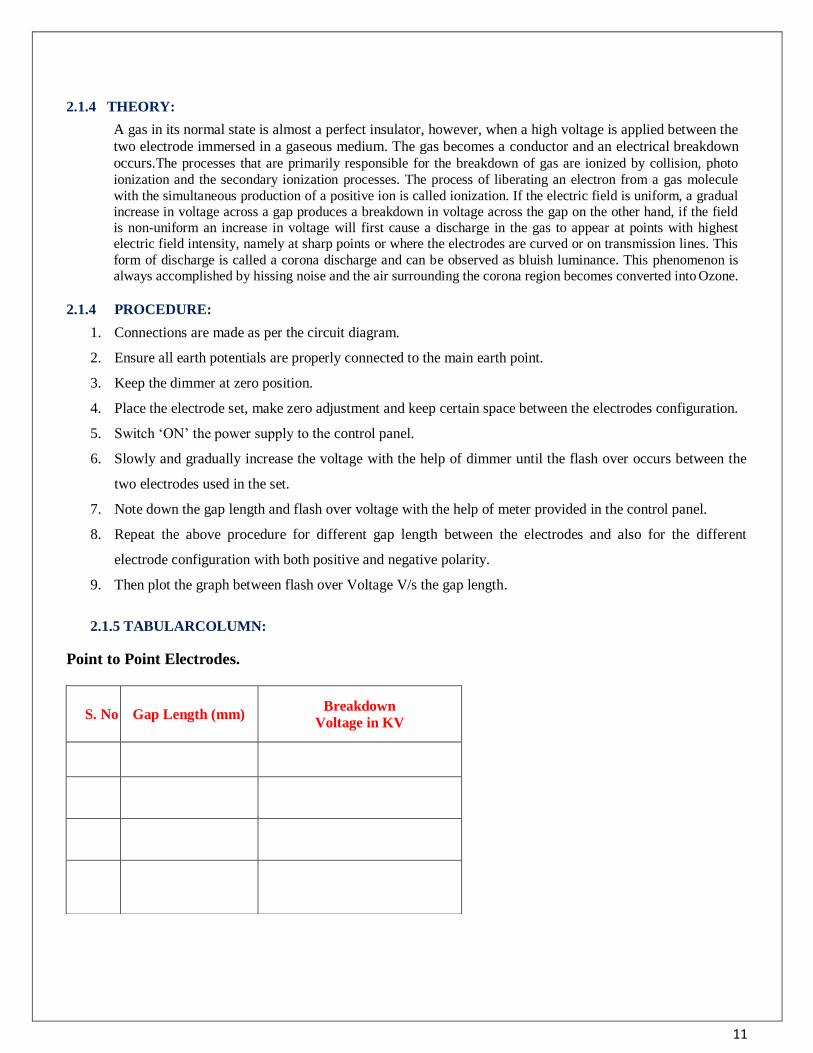
2.1.5 TABULARCOLUMN:
Point to Point Electrodes.
S. No Gap Length (mm) Breakdown
Voltage in KV
12
2.1.6 PRECAUTIONS:
1. Before starting the experiment note down the specifications of the test kit.
2. Completely study the Test equipment on which experiment is conducted
3. Use the instruction manual provided by the manufacturer to know about the equipment
4. Check all the earthing connections
5. Ignore the first two readings as the air between the electrodes may not be ionized.
6. Do not touch the equipment without grounding
7. Before starting the experiment, make sure that the electrodes are properly aligned and zero reading is
adjusted
8. The electrodes must be cleaned properly before and after use .
2.1.7 RESULT
2.1.8 PRE LAB VIVA QUESTIONS:
1. At what voltage does air break down?
2. What is treeing and tracking?
3. What is Townsend theory?
4. What is breakdown voltage of diode?
5. How do you calculate breakdown voltage?
2.1.9 POST LAB VIVA QUESTIONS:
1. What causes electrical tracking?
2. What is tracking in High Voltage?
3. What is Townsend breakdown criterion?
4. What is streamer theory?
5. What is plasma discharge?
13
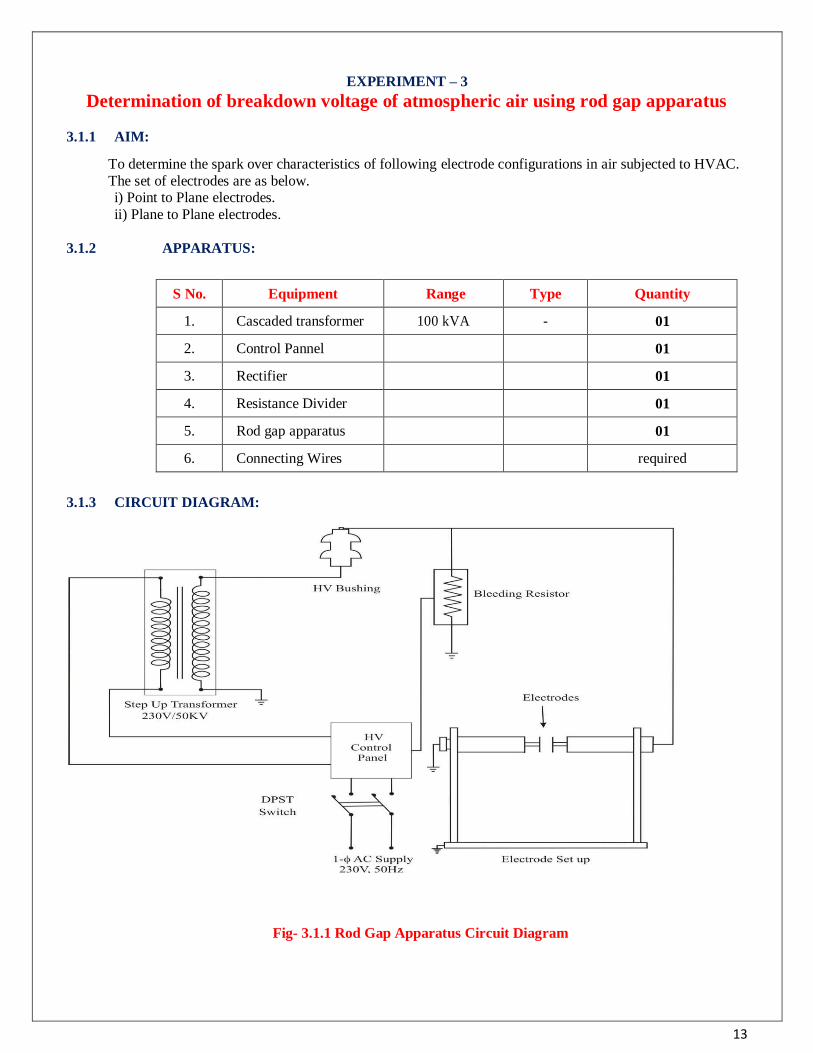
EXPERIMENT – 3
Determination of breakdown voltage of atmospheric air using rod gap apparatus
3.1.1 AIM:
To determine the spark over characteristics of following electrode configurations in air subjected to HVAC.
The set of electrodes are as below. i) Point to Plane electrodes.
ii) Plane to Plane electrodes.
3.1.2 APPARATUS:
S No. Equipment Range Type Quantity
1. Cascaded transformer 100 kVA - 01
2. Control Pannel 01
3. Rectifier 01
4. Resistance Divider 01
5. Rod gap apparatus 01
6. Connecting Wires required
3.1.3 CIRCUIT DIAGRAM:
Fig- 3.1.1 Rod Gap Apparatus Circuit Diagram
14
3.1.4 THEORY:
The most efficient method of generating high DC voltages is through the process of rectification employing
voltage multiplier circuits. However, more recent investigations have shown that these rods can be used for
dc measurement provided; certain regulations regarding the electrode configurations are observed. The
breakdown voltage of a rod gap increases more or less linearly with increasing relative air density over the
normal variation in atmospheric pressure, also the breakdown voltage increases with increasing relative
humidity. The earthed electrode must be long enough to initiate positive breakdown streamers. If the high
voltage rod is the cathode with this arrangement, the breakdown voltage will always be initiated by positive
streamer for both the polarities, thus giving a very small variation and being humidity dependent. High
voltage rectifier is used in this experiment, which is fabricated using high quality and high stability diodes.
These diodes are connected in series to withstand the required voltage. The entire assembly is put inside the
epoxy fiber glass tubes filled with oil, for cooling. The epoxy fiber glass tubes are painted with anti tracking
paints.
3.1.4 PROCEDURE:
1) Connections are made as per the circuit diagram.
2) Ensure all earth potentials are properly connected to the main earth point.
3) Keep the dimmer at zero position.
4) Place the electrode set, make zero adjustment and keep certain space between the electrodes
configuration.
5) Switch „ON‟ the power supply to the control panel.
6) Slowly and gradually increase the voltage with the help of dimmer until the flash over occurs between the
two electrodes used in the set.
7) Note down the gap length and flash over voltage with the help of meter provided in the control panel.
8) Repeat the above procedure for different gap length between the electrodes and also for the different
electrode configuration with both positive and negative polarity.
9) Then plot the graph between flash over Voltage V/s the gap length
3.1.5 TABULARCOLUMN:
i) Point to Plane Electrodes.
S. No Gap Length (mm) Breakdown
Voltage
in KV
15
ii) Plane to Plane electrodes
3.1.6 PRECAUTIONS:
9. Before starting the experiment note down the specifications of the test kit.
10. Completely study the Test equipment on which experiment is conducted
11. Use the instruction manual provided by the manufacturer to know about the equipment
12. Check all the earthing connections
13. Ignore the first two readings as the air between the electrodes may not be ionized.
14. Do not touch the equipment without grounding
15. Before starting the experiment, make sure that the electrodes are properly aligned and zero reading is
adjusted
16. The electrodes must be cleaned properly before and after use
3.1.7 RESULT
3.1.8 PRE LAB VIVA QUESTIONS:
1. What is the dielectric strength of air?
2. Which liquid has highest breakdown strength?
3. What is the difference between dielectric strength and breakdown voltage?
4. Which liquid is bad conductor of electricity?
5. Which liquid is used in transformer?
3.1.9 POST LAB VIVA QUESTIONS:
1. How do you calculate breakdown voltage?
2. What causes dielectric breakdown?
3. Which liquid is the best conductor of electricity?
4. What are examples of poor conductors?
5. How is dielectric strength calculated?
S. No Gap Length (mm) Breakdown
Voltage
in KV
16
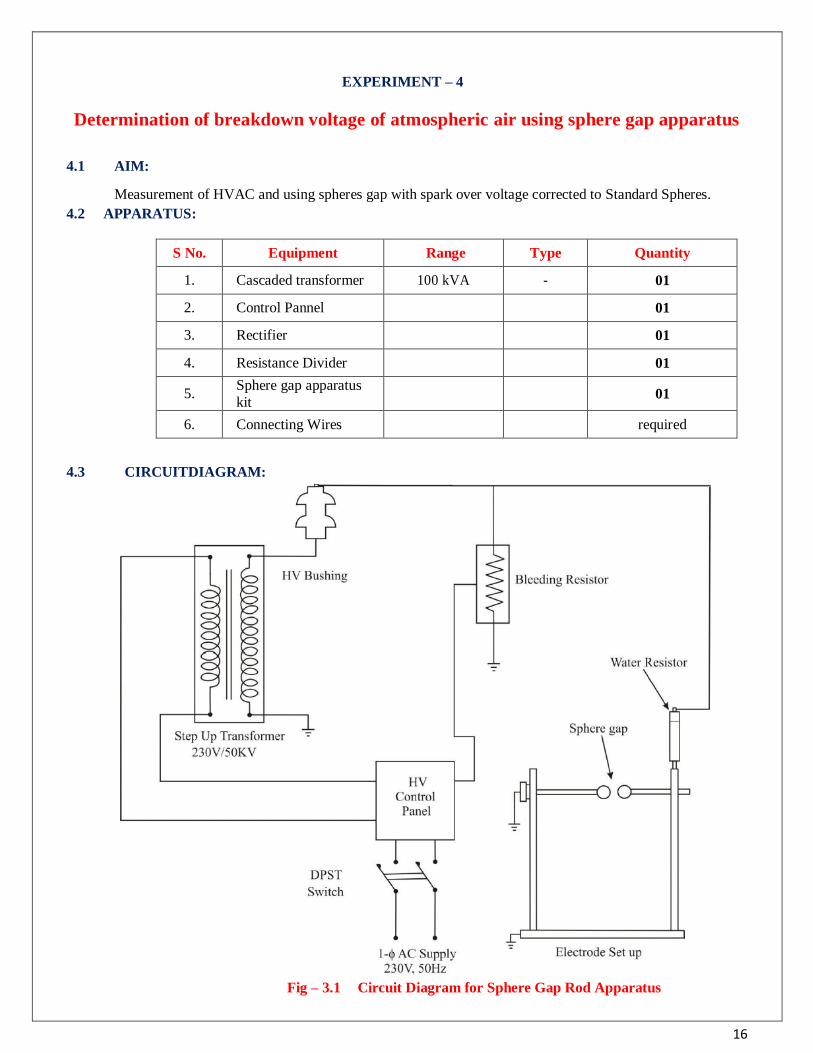
EXPERIMENT – 4
Determination of breakdown voltage of atmospheric air using sphere gap apparatus
4.1 AIM:
Measurement of HVAC and using spheres gap with spark over voltage corrected to Standard Spheres.
4.2 APPARATUS:
S No. Equipment Range Type Quantity
1. Cascaded transformer 100 kVA - 01
2. Control Pannel 01
3. Rectifier 01
4. Resistance Divider 01
5. Sphere gap apparatus
kit 01
6. Connecting Wires required
4.3 CIRCUITDIAGRAM:
Fig – 3.1 Circuit Diagram for Sphere Gap Rod Apparatus
17
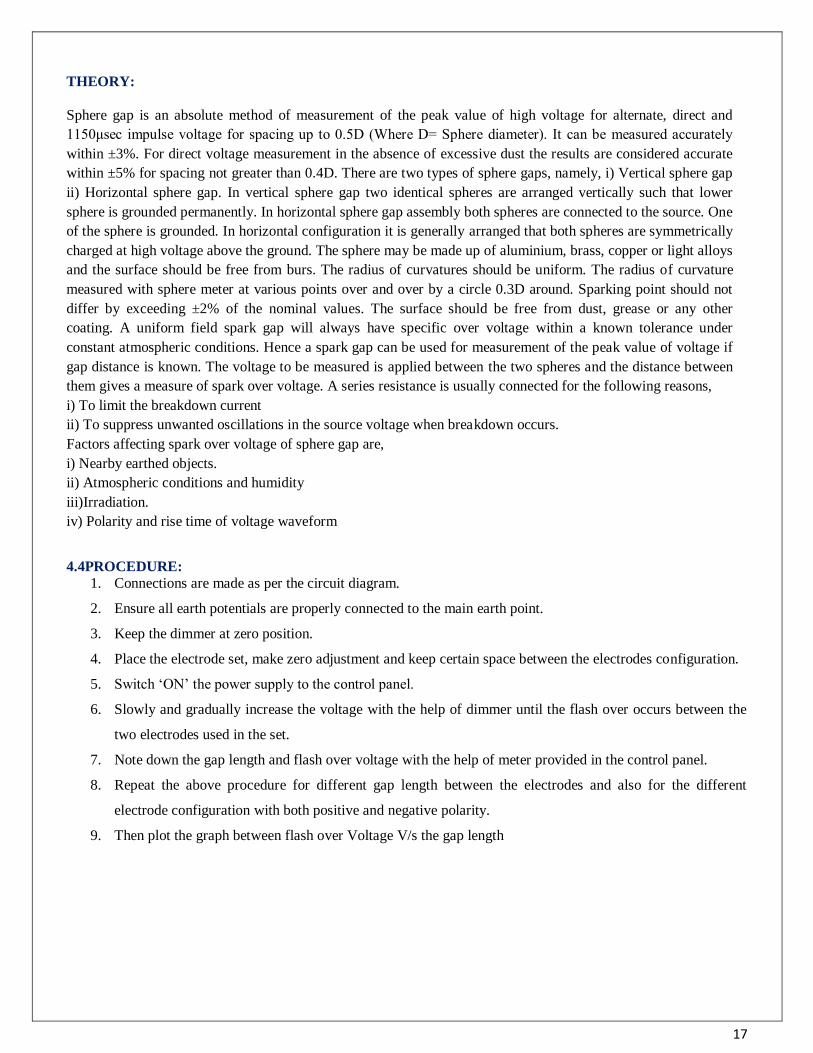
THEORY:
Sphere gap is an absolute method of measurement of the peak value of high voltage for alternate, direct and
1150μsec impulse voltage for spacing up to 0.5D (Where D= Sphere diameter). It can be measured accurately
within ±3%. For direct voltage measurement in the absence of excessive dust the results are considered accurate
within ±5% for spacing not greater than 0.4D. There are two types of sphere gaps, namely, i) Vertical sphere gap
ii) Horizontal sphere gap. In vertical sphere gap two identical spheres are arranged vertically such that lower
sphere is grounded permanently. In horizontal sphere gap assembly both spheres are connected to the source. One
of the sphere is grounded. In horizontal configuration it is generally arranged that both spheres are symmetrically
charged at high voltage above the ground. The sphere may be made up of aluminium, brass, copper or light alloys
and the surface should be free from burs. The radius of curvatures should be uniform. The radius of curvature
measured with sphere meter at various points over and over by a circle 0.3D around. Sparking point should not
differ by exceeding ±2% of the nominal values. The surface should be free from dust, grease or any other
coating. A uniform field spark gap will always have specific over voltage within a known tolerance under
constant atmospheric conditions. Hence a spark gap can be used for measurement of the peak value of voltage if
gap distance is known. The voltage to be measured is applied between the two spheres and the distance between
them gives a measure of spark over voltage. A series resistance is usually connected for the following reasons,
i) To limit the breakdown current
ii) To suppress unwanted oscillations in the source voltage when breakdown occurs.
Factors affecting spark over voltage of sphere gap are,
i) Nearby earthed objects.
ii) Atmospheric conditions and humidity
iii)Irradiation.
iv) Polarity and rise time of voltage waveform
4.4PROCEDURE:
1. Connections are made as per the circuit diagram.
2. Ensure all earth potentials are properly connected to the main earth point.
3. Keep the dimmer at zero position.
4. Place the electrode set, make zero adjustment and keep certain space between the electrodes configuration.
5. Switch „ON‟ the power supply to the control panel.
6. Slowly and gradually increase the voltage with the help of dimmer until the flash over occurs between the
two electrodes used in the set.
7. Note down the gap length and flash over voltage with the help of meter provided in the control panel.
8. Repeat the above procedure for different gap length between the electrodes and also for the different
electrode configuration with both positive and negative polarity.
9. Then plot the graph between flash over Voltage V/s the gap length
18
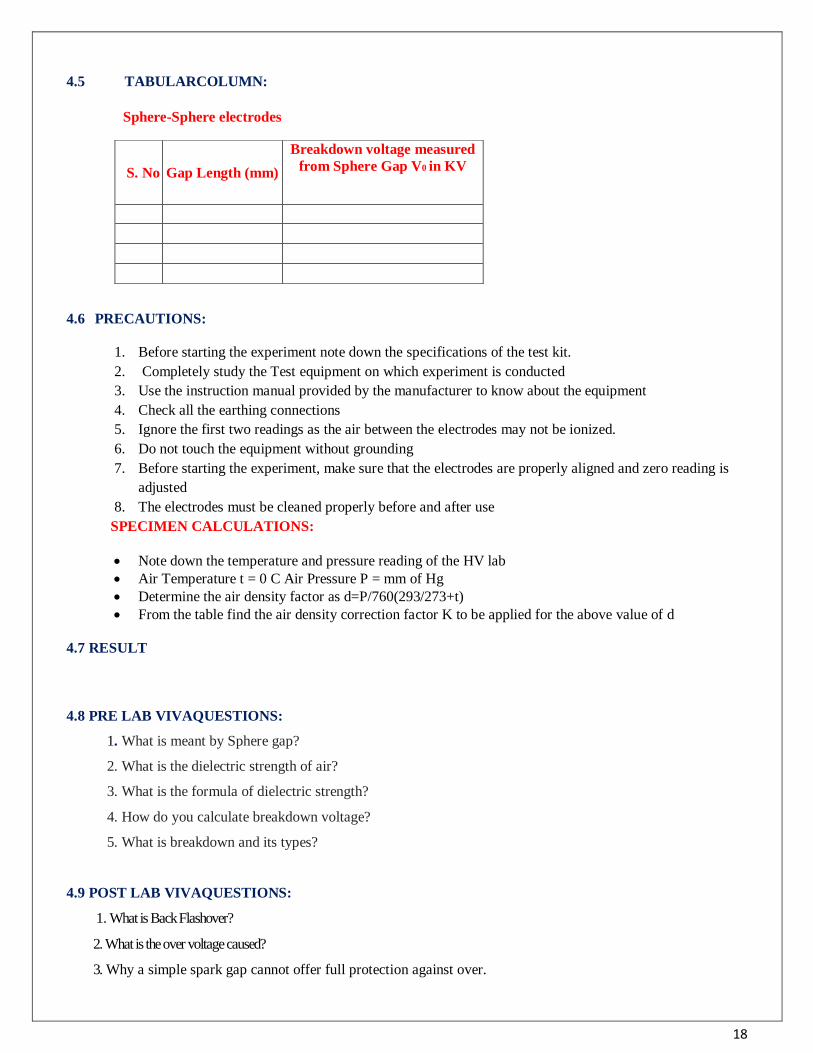
4.5 TABULARCOLUMN:
Sphere-Sphere electrodes
4.6 PRECAUTIONS:
1. Before starting the experiment note down the specifications of the test kit.
2. Completely study the Test equipment on which experiment is conducted
3. Use the instruction manual provided by the manufacturer to know about the equipment
4. Check all the earthing connections
5. Ignore the first two readings as the air between the electrodes may not be ionized.
6. Do not touch the equipment without grounding
7. Before starting the experiment, make sure that the electrodes are properly aligned and zero reading is
adjusted
8. The electrodes must be cleaned properly before and after use
SPECIMEN CALCULATIONS:
Note down the temperature and pressure reading of the HV lab
Air Temperature t = 0 C Air Pressure P = mm of Hg
Determine the air density factor as d=P/760(293/273+t)
From the table find the air density correction factor K to be applied for the above value of d
4.7 RESULT
4.8 PRE LAB VIVAQUESTIONS:
1. What is meant by Sphere gap?
2. What is the dielectric strength of air?
3. What is the formula of dielectric strength?
4. How do you calculate breakdown voltage?
5. What is breakdown and its types?
4.9 POST LAB VIVAQUESTIONS:
1. What is Back Flashover?
2. What is the over voltage caused?
3. Why a simple spark gap cannot offer full protection against over.
S. No Gap Length (mm)
Breakdown voltage measured
from Sphere Gap V0 in KV

19
4. Which insulation is used in high voltage circuit breakers of large power rating.
5. What is Time lag in the breakdown of dielectrics?
20
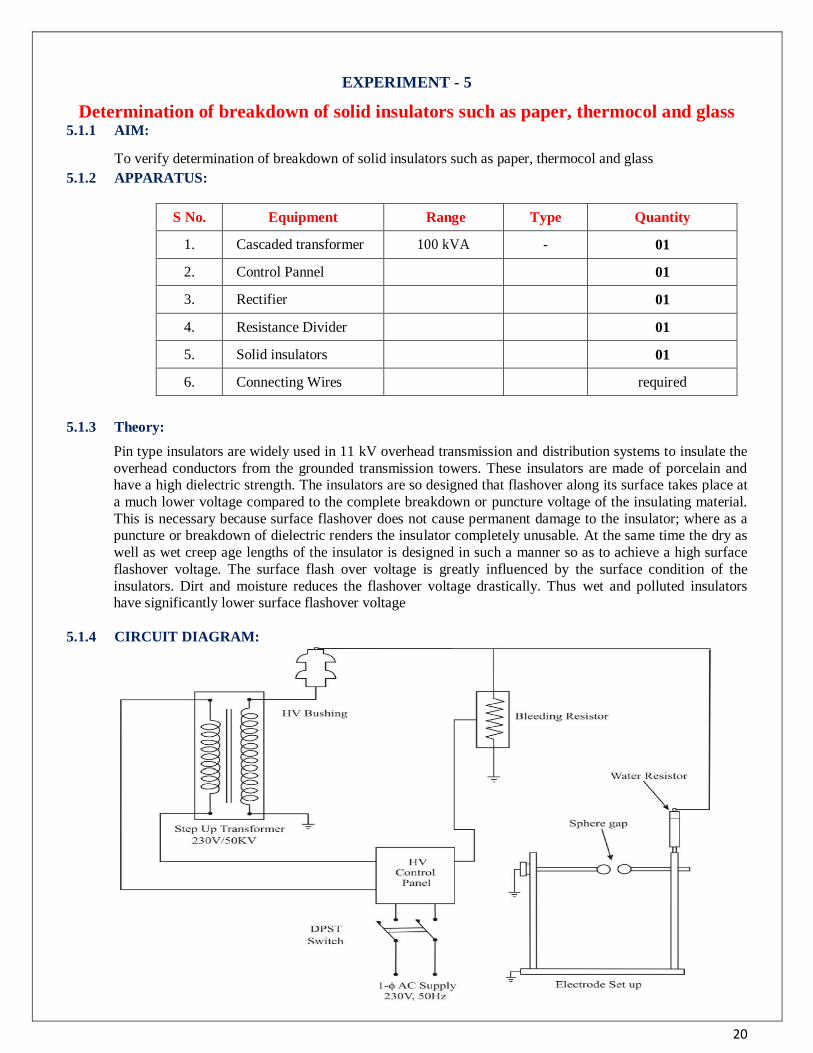
EXPERIMENT - 5
Determination of breakdown of solid insulators such as paper, thermocol and glass 5.1.1 AIM:
To verify determination of breakdown of solid insulators such as paper, thermocol and glass
5.1.2 APPARATUS:
S No. Equipment Range Type Quantity
1. Cascaded transformer 100 kVA - 01
2. Control Pannel 01
3. Rectifier 01
4. Resistance Divider 01
5. Solid insulators 01
6. Connecting Wires required
5.1.3 Theory:
Pin type insulators are widely used in 11 kV overhead transmission and distribution systems to insulate the
overhead conductors from the grounded transmission towers. These insulators are made of porcelain and have a high dielectric strength. The insulators are so designed that flashover along its surface takes place at
a much lower voltage compared to the complete breakdown or puncture voltage of the insulating material.
This is necessary because surface flashover does not cause permanent damage to the insulator; where as a puncture or breakdown of dielectric renders the insulator completely unusable. At the same time the dry as
well as wet creep age lengths of the insulator is designed in such a manner so as to achieve a high surface
flashover voltage. The surface flash over voltage is greatly influenced by the surface condition of the
insulators. Dirt and moisture reduces the flashover voltage drastically. Thus wet and polluted insulators have significantly lower surface flashover voltage
5.1.4 CIRCUIT DIAGRAM:
21
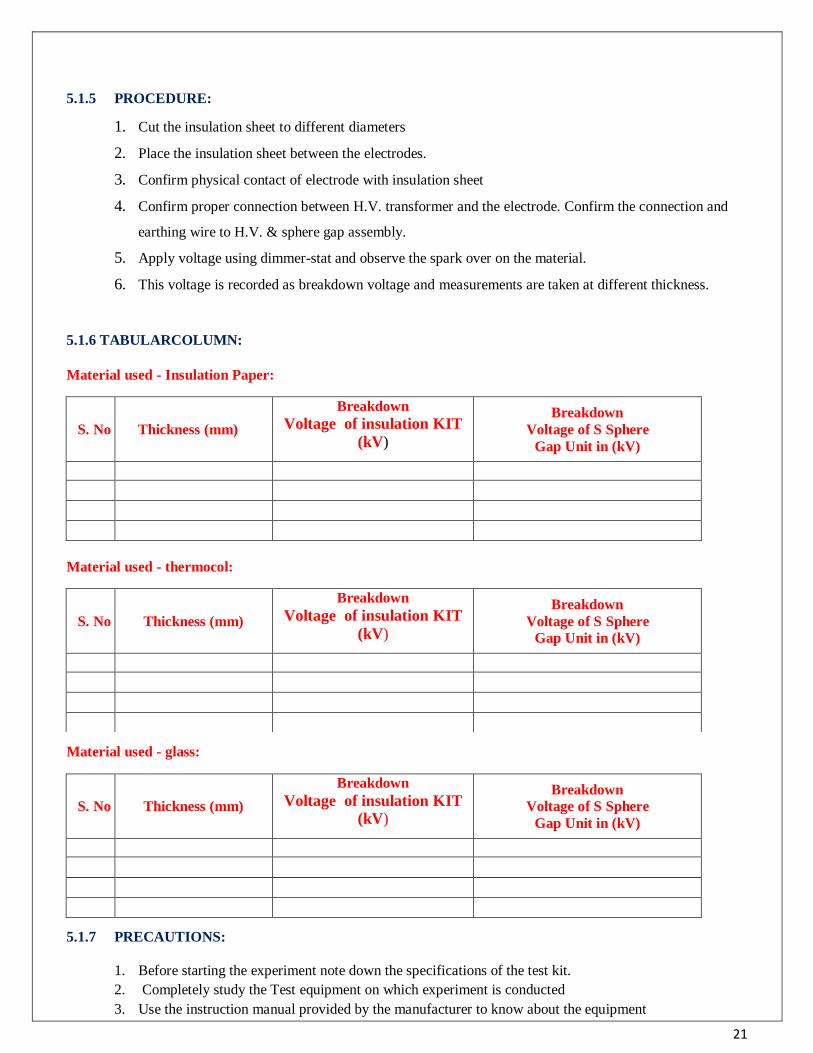
5.1.5 PROCEDURE:
1. Cut the insulation sheet to different diameters
2. Place the insulation sheet between the electrodes.
3. Confirm physical contact of electrode with insulation sheet
4. Confirm proper connection between H.V. transformer and the electrode. Confirm the connection and
earthing wire to H.V. & sphere gap assembly.
5. Apply voltage using dimmer-stat and observe the spark over on the material.
6. This voltage is recorded as breakdown voltage and measurements are taken at different thickness.
5.1.6 TABULARCOLUMN:
Material used - Insulation Paper:
Material used - thermocol:
Material used - glass:
5.1.7 PRECAUTIONS:
1. Before starting the experiment note down the specifications of the test kit.
2. Completely study the Test equipment on which experiment is conducted
3. Use the instruction manual provided by the manufacturer to know about the equipment
S. No Thickness (mm)
Breakdown
Voltage of insulation KIT
(kV)
Breakdown
Voltage of S Sphere
Gap Unit in (kV)
S. No Thickness (mm)
Breakdown
Voltage of insulation KIT
(kV)
Breakdown
Voltage of S Sphere
Gap Unit in (kV)
S. No Thickness (mm)
Breakdown
Voltage of insulation KIT
(kV)
Breakdown
Voltage of S Sphere
Gap Unit in (kV)
22
4. Check all the earthing connections
5. Ignore the first two readings as the air between the electrodes may not be ionized.
6. Do not touch the equipment without grounding
7. Before starting the experiment, make sure that the electrodes are properly aligned and zero reading is
adjusted
8. The electrodes must be cleaned properly before and after use
5.1.8 RESULT:
5.1.9 PRE LAB VIVA QUESTIONS:
1. What is thermal breakdown in solid dielectrics?
2. What is thermal breakdown?
3. At what temp does synthetic oil break down?
4. At what temp does motor oil breakdown?
5. What is the best motor oil for hot weather?
5.1.11 POST LAB VIVA QUESTIONS:
1. Does synthetic oil break down over time?
2. Can you use regular oil after synthetic?
3. Does synthetic oil cause leaks?
4. What is the best synthetic oil?
5. What happens if you use conventional oil instead of synthetic?
23
EXPERIMENT – 6
Determination of breakdown of liquid insulator using oil insulation tester 6.1.1 AIM:
To test oil transformer determines the dielectric strength of oil.
6.1.2 APPARATUS:
S. No. Name of the Equipment Range Type Quantity
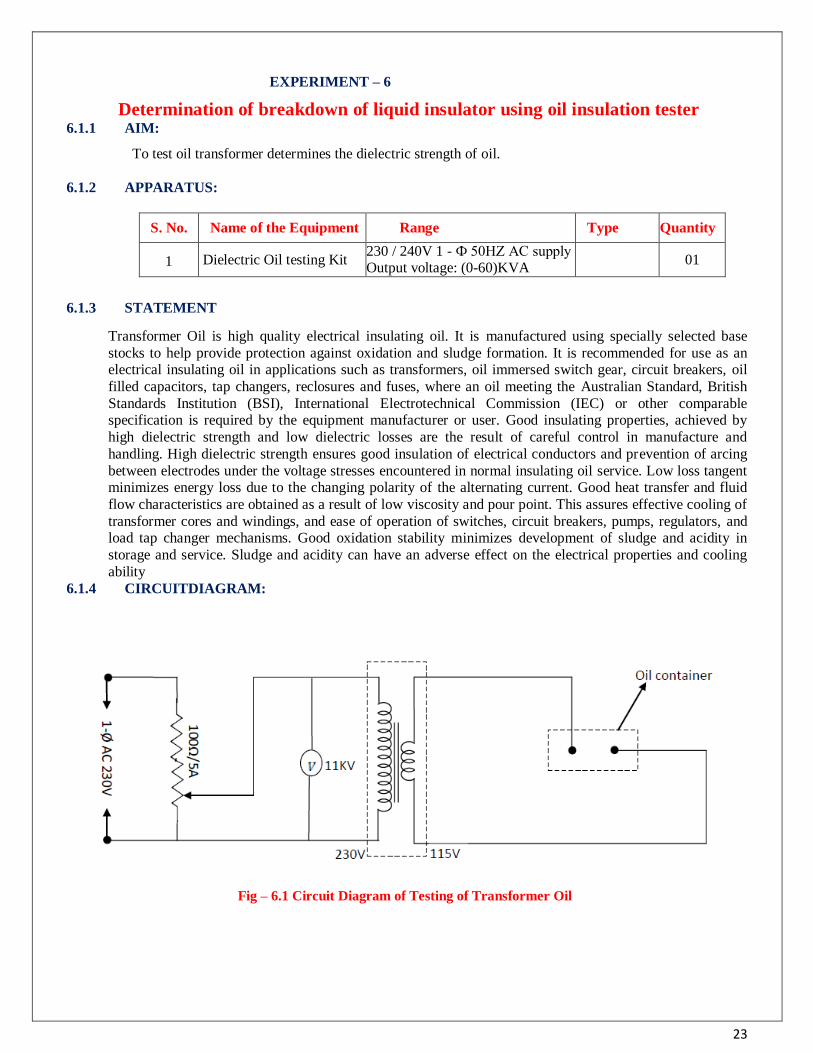
1 Dielectric Oil testing Kit 230 / 240V 1 - Ф 50HZ AC supply Output voltage: (0-60)KVA
01
6.1.3 STATEMENT
Transformer Oil is high quality electrical insulating oil. It is manufactured using specially selected base
stocks to help provide protection against oxidation and sludge formation. It is recommended for use as an electrical insulating oil in applications such as transformers, oil immersed switch gear, circuit breakers, oil
filled capacitors, tap changers, reclosures and fuses, where an oil meeting the Australian Standard, British
Standards Institution (BSI), International Electrotechnical Commission (IEC) or other comparable specification is required by the equipment manufacturer or user. Good insulating properties, achieved by
high dielectric strength and low dielectric losses are the result of careful control in manufacture and
handling. High dielectric strength ensures good insulation of electrical conductors and prevention of arcing
between electrodes under the voltage stresses encountered in normal insulating oil service. Low loss tangent minimizes energy loss due to the changing polarity of the alternating current. Good heat transfer and fluid
flow characteristics are obtained as a result of low viscosity and pour point. This assures effective cooling of
transformer cores and windings, and ease of operation of switches, circuit breakers, pumps, regulators, and load tap changer mechanisms. Good oxidation stability minimizes development of sludge and acidity in
storage and service. Sludge and acidity can have an adverse effect on the electrical properties and cooling
ability
6.1.4 CIRCUITDIAGRAM:
Fig – 6.1 Circuit Diagram of Testing of Transformer Oil
20 | P a g e
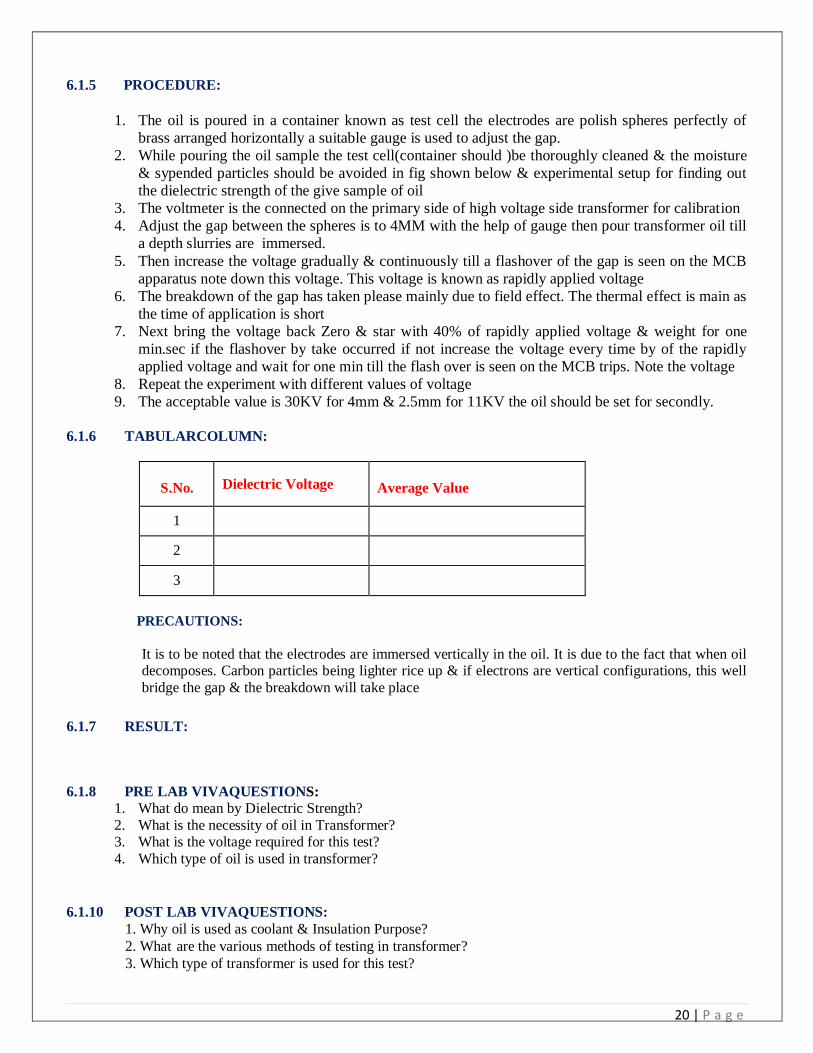
6.1.5 PROCEDURE:
1. The oil is poured in a container known as test cell the electrodes are polish spheres perfectly of
brass arranged horizontally a suitable gauge is used to adjust the gap.
2. While pouring the oil sample the test cell(container should )be thoroughly cleaned & the moisture
& sypended particles should be avoided in fig shown below & experimental setup for finding out
the dielectric strength of the give sample of oil
3. The voltmeter is the connected on the primary side of high voltage side transformer for calibration
4. Adjust the gap between the spheres is to 4MM with the help of gauge then pour transformer oil till
a depth slurries are immersed.
5. Then increase the voltage gradually & continuously till a flashover of the gap is seen on the MCB
apparatus note down this voltage. This voltage is known as rapidly applied voltage
6. The breakdown of the gap has taken please mainly due to field effect. The thermal effect is main as
the time of application is short
7. Next bring the voltage back Zero & star with 40% of rapidly applied voltage & weight for one
min.sec if the flashover by take occurred if not increase the voltage every time by of the rapidly
applied voltage and wait for one min till the flash over is seen on the MCB trips. Note the voltage
8. Repeat the experiment with different values of voltage
9. The acceptable value is 30KV for 4mm & 2.5mm for 11KV the oil should be set for secondly.
6.1.6 TABULARCOLUMN:
S.No. Dielectric Voltage
Average Value
1
2
3
PRECAUTIONS:
It is to be noted that the electrodes are immersed vertically in the oil. It is due to the fact that when oil decomposes. Carbon particles being lighter rice up & if electrons are vertical configurations, this well
bridge the gap & the breakdown will take place
6.1.7 RESULT:
6.1.8 PRE LAB VIVAQUESTIONS:
1. What do mean by Dielectric Strength?
2. What is the necessity of oil in Transformer? 3. What is the voltage required for this test?
4. Which type of oil is used in transformer?
6.1.10 POST LAB VIVAQUESTIONS:
1. Why oil is used as coolant & Insulation Purpose?
2. What are the various methods of testing in transformer?
3. Which type of transformer is used for this test?
20 | P a g e
EXPERIMENT– 7
CHARACTERSTICS OF SOLAR PANEL
7.1 AIM:
1. To determine the Current – Voltage (I-V) Characteristics of solar panel.
2. Calculation of equivalent circuit parameters of a Photovoltaic Array.
3. Identify the cells and technology used in PV module.
4. To measure the current‐voltage (I‐V) characteristics of a PV module.
5. Measuring or estimating various parameters including Short Circuit Current (ISC), Open Circuit Voltage
(VOC), Fill Factor (FF), Maximum power (PM), Series Resistance (RS), Shunt Resistance (RSh) and
efficiency (η) of a solar PV module.
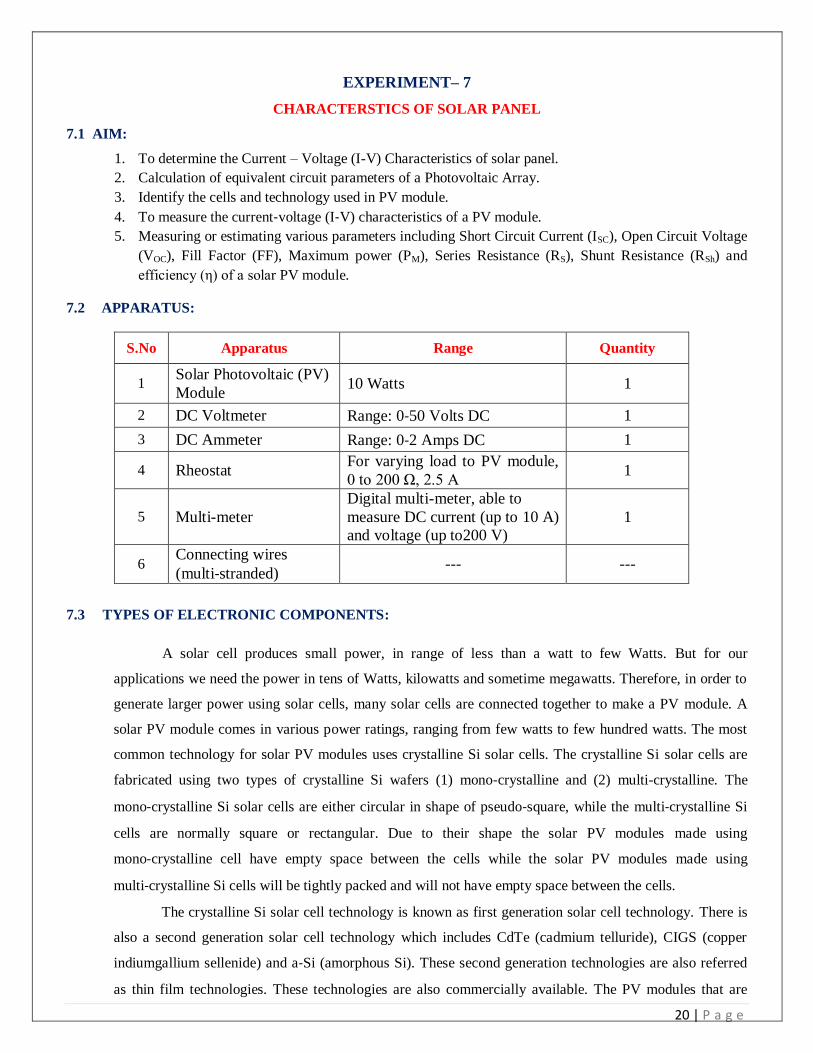
7.2 APPARATUS:
S.No Apparatus Range Quantity
1 Solar Photovoltaic (PV)
Module 10 Watts 1
2 DC Voltmeter Range: 0‐50 Volts DC 1
3 DC Ammeter Range: 0‐2 Amps DC 1
4 Rheostat For varying load to PV module,
0 to 200 Ω, 2.5 A 1
5 Multi-meter
Digital multi-meter, able to
measure DC current (up to 10 A)
and voltage (up to200 V)
1
6 Connecting wires
(multi‐stranded) --- ---
7.3 TYPES OF ELECTRONIC COMPONENTS:
A solar cell produces small power, in range of less than a watt to few Watts. But for our
applications we need the power in tens of Watts, kilowatts and sometime megawatts. Therefore, in order to
generate larger power using solar cells, many solar cells are connected together to make a PV module. A
solar PV module comes in various power ratings, ranging from few watts to few hundred watts. The most
common technology for solar PV modules uses crystalline Si solar cells. The crystalline Si solar cells are
fabricated using two types of crystalline Si wafers (1) mono‐crystalline and (2) multi-crystalline. The
mono‐crystalline Si solar cells are either circular in shape of pseudo‐square, while the multi‐crystalline Si
cells are normally square or rectangular. Due to their shape the solar PV modules made using
mono‐crystalline cell have empty space between the cells while the solar PV modules made using
multi‐crystalline Si cells will be tightly packed and will not have empty space between the cells.
The crystalline Si solar cell technology is known as first generation solar cell technology. There is
also a second generation solar cell technology which includes CdTe (cadmium telluride), CIGS (copper
indiumgallium sellenide) and a‐Si (amorphous Si). These second generation technologies are also referred
as thin film technologies. These technologies are also commercially available. The PV modules that are
20 | P a g e
made using crystalline Si appears bluish in color and also have thin metal contact lines (appear white) on
the top. These metal contact lines are separated by few mm. In case of thin film solar PV modules these
visible metal contacts are not there, because instead of metals, transparent oxides are used to make metal
contacts.
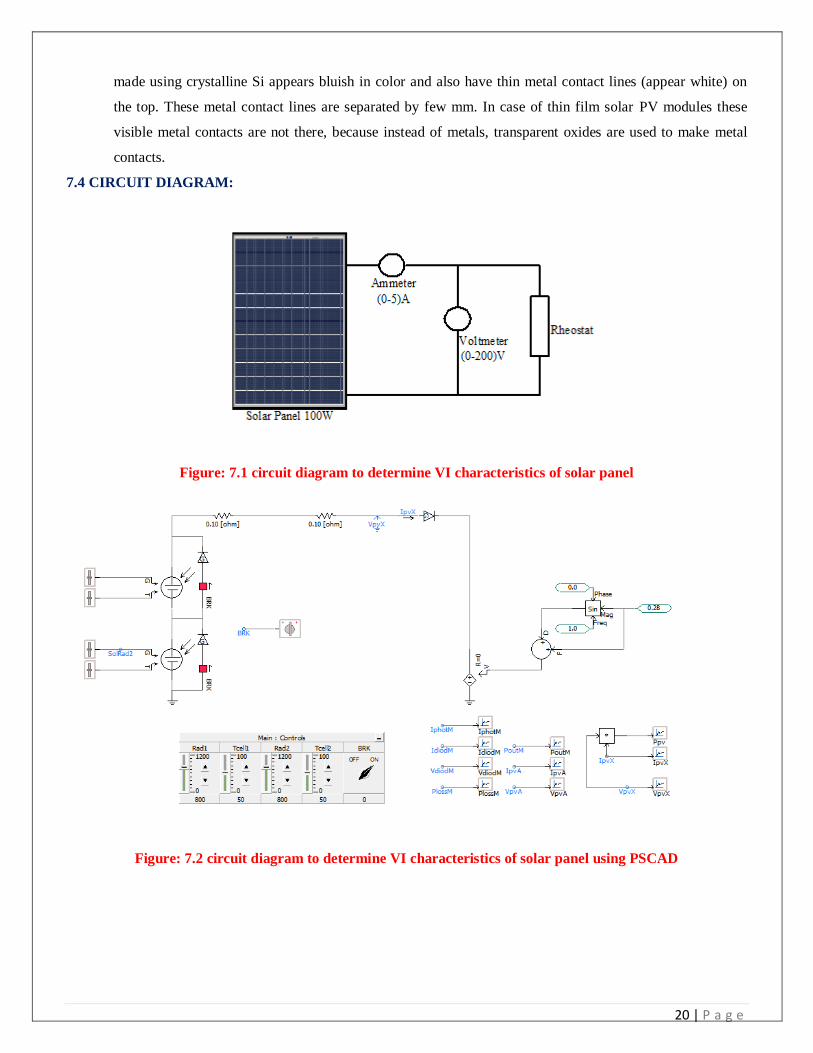
7.4 CIRCUIT DIAGRAM:
Figure: 7.1 circuit diagram to determine VI characteristics of solar panel
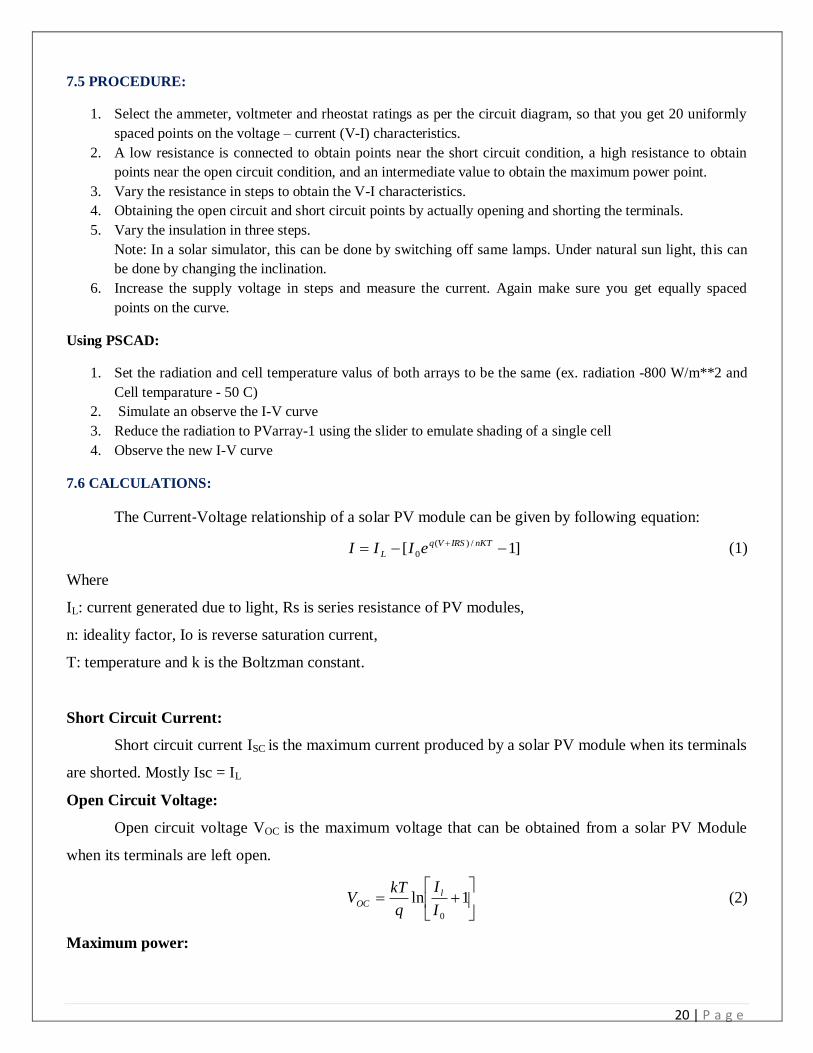
Figure: 7.2 circuit diagram to determine VI characteristics of solar panel using PSCAD
20 | P a g e
7.5 PROCEDURE:
1. Select the ammeter, voltmeter and rheostat ratings as per the circuit diagram, so that you get 20 uniformly
spaced points on the voltage – current (V-I) characteristics.
2. A low resistance is connected to obtain points near the short circuit condition, a high resistance to obtain
points near the open circuit condition, and an intermediate value to obtain the maximum power point.
3. Vary the resistance in steps to obtain the V-I characteristics.
4. Obtaining the open circuit and short circuit points by actually opening and shorting the terminals.
5. Vary the insulation in three steps.
Note: In a solar simulator, this can be done by switching off same lamps. Under natural sun light, this can
be done by changing the inclination.
6. Increase the supply voltage in steps and measure the current. Again make sure you get equally spaced
points on the curve.
Using PSCAD:
1. Set the radiation and cell temperature valus of both arrays to be the same (ex. radiation -800 W/m**2 and
Cell temparature - 50 C)
2. Simulate an observe the I-V curve
3. Reduce the radiation to PVarray-1 using the slider to emulate shading of a single cell
4. Observe the new I-V curve
7.6 CALCULATIONS:
The Current‐Voltage relationship of a solar PV module can be given by following equation:
]1[ /)(
0 nKTIRSVq
L eIII (1)
Where
IL: current generated due to light, Rs is series resistance of PV modules,
n: ideality factor, Io is reverse saturation current,
T: temperature and k is the Boltzman constant.
Short Circuit Current:
Short circuit current ISC is the maximum current produced by a solar PV module when its terminals
are shorted. Mostly Isc = IL
Open Circuit Voltage:
Open circuit voltage VOC is the maximum voltage that can be obtained from a solar PV Module
when its terminals are left open.
1ln
0I
I
q
kTV l
OC (2)
Maximum power:
20 | P a g e
This is defined as the maximum power (PMAX or PM) output of a PV module under standard test
condition (STC), which corresponds to 1000 W/m2 and 25
oC cell temperature in PV module. Under the
STC the power output of a PV module is maximum; therefore it is also referred as peak power or Watt.
This is given as product of VM and IM.
MMM IVP (3)
Fill Factor:
The Fill Factor (FF) is defined as the square of the I‐V curve and mainly related to the resistive
losses in a solar module. It can be defined as the ratio of actual maximum power output to the ideal
maximum power output. In ideal case, its value can be 100% corresponding to square I‐V curve. But it is
not feasible to have square I‐V. There are always some losses which reduces the value of FF. The best
value of FF that can be obtained for a solar module can empirically be written as a function of VOC.
1
)72.0ln(
OC
OCOC
V
VVFF (4)
The Fill Factor (FF) of a PV module can also be is actually the area under the I‐V curve. It is given
in percentage.
%SCOC
MM
IV
IVFF (5)
Efficiency:
The module efficiency is written as:
%IN
SCOC
IN
MM
IN
Max
P
FFIV
P
IV
P
P (6)
where,
Pin: the input power.
The efficiency is given in %. Normally efficiency of a PV module is specified at Standard Test Condition
(STC), which is corresponding to input power density of 1000 W/m2 and 25
oC cell temperature in PV
module
7 RESULT:
20 | P a g e
7.8 PRELAB VIVA QUESTIONS:
1. What is photovoltaic‟s (solar electricity) or "PV"?
2. What are the components of a photovoltaic (PV) system? 3. What's the difference between PV and other solar energy technologies?
4. What is the material used to design the solar panel?
7.9 POSTLAB VIVA QUESTIONS:
1. What is net metering? Is net metering available where I live and work?
2. What is maximum power point of solar cell?
3. Draw the VI characteristics of solar panel?
4. Can The Solar Panel Withstand Wind, Rain And Seismic Conditions?
20 | P a g e
EXPERIMENT– 8
SOLAR INVERTER
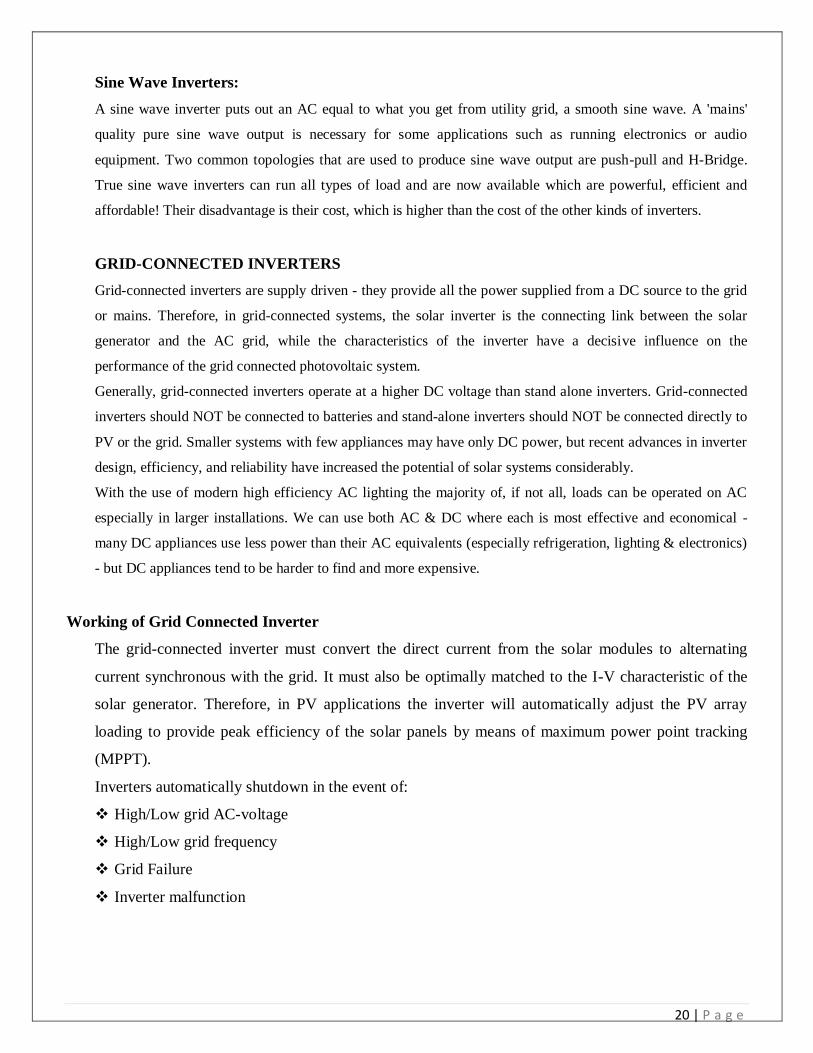
8.1 AIM:
To study about off-grid solar inverter with battery charging controller.
8.2 THEORY:
Inverters are power electronic devices, which convert DC (typically low voltage) into AC (at 230 V, 50 Hz) as
required for conventional appliances. There are generally two types of photovoltaic inverter available: stand-
alone and grid-connected.
Stand-alone, or battery supplied, inverters are demand driven - they provide any power or current up to the
rating of the inverter and assuming that there is enough energy in the battery. These inverters are being used
increasingly to operate household appliances and other “normal” 230 V equipment. The question as to the
maximum size for which a single central inverter for all electrical devices is still the best solution, is a matter
of philosophy. The central inverter must be in operation all the time. In this case, it is important that the
inverter itself has a very low internal consumption.
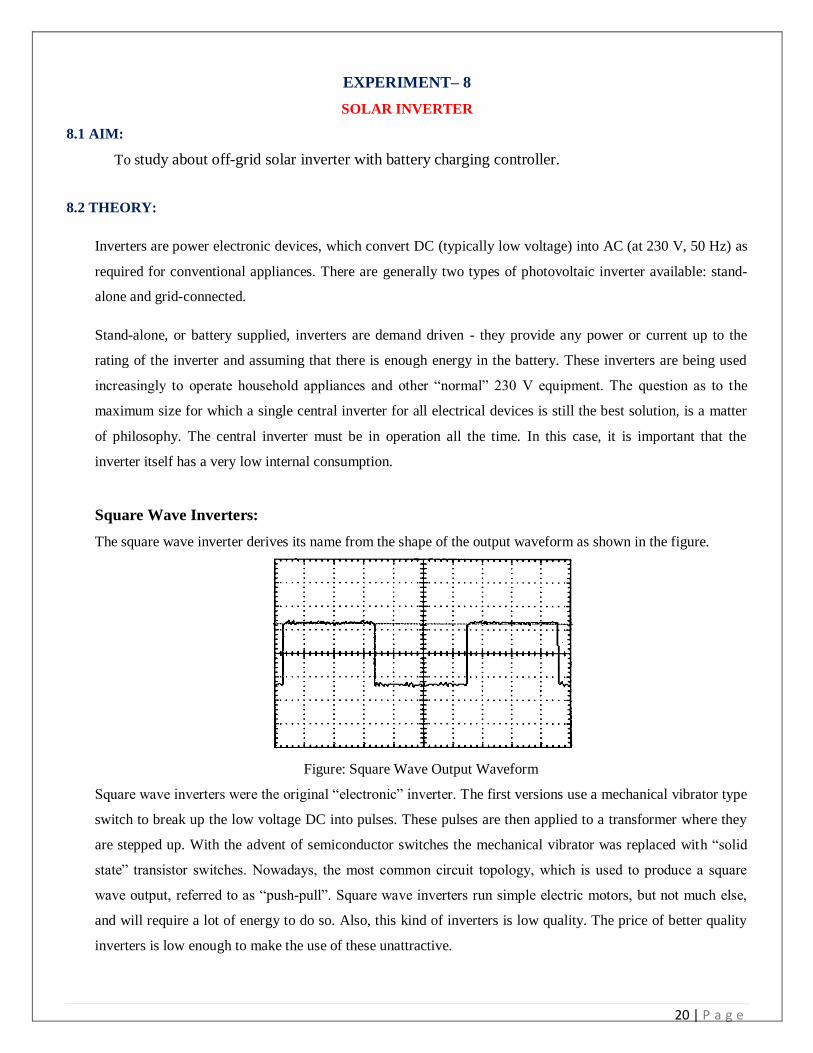
Square Wave Inverters:
The square wave inverter derives its name from the shape of the output waveform as shown in the figure.
Figure: Square Wave Output Waveform
Square wave inverters were the original “electronic” inverter. The first versions use a mechanical vibrator type
switch to break up the low voltage DC into pulses. These pulses are then applied to a transformer where they
are stepped up. With the advent of semiconductor switches the mechanical vibrator was replaced with “solid
state” transistor switches. Nowadays, the most common circuit topology, which is used to produce a square
wave output, referred to as “push-pull”. Square wave inverters run simple electric motors, but not much else,
and will require a lot of energy to do so. Also, this kind of inverters is low quality. The price of better quality
inverters is low enough to make the use of these unattractive.
20 | P a g e
Sine Wave Inverters:
A sine wave inverter puts out an AC equal to what you get from utility grid, a smooth sine wave. A 'mains'
quality pure sine wave output is necessary for some applications such as running electronics or audio
equipment. Two common topologies that are used to produce sine wave output are push-pull and H-Bridge.
True sine wave inverters can run all types of load and are now available which are powerful, efficient and
affordable! Their disadvantage is their cost, which is higher than the cost of the other kinds of inverters.
GRID-CONNECTED INVERTERS
Grid-connected inverters are supply driven - they provide all the power supplied from a DC source to the grid
or mains. Therefore, in grid-connected systems, the solar inverter is the connecting link between the solar
generator and the AC grid, while the characteristics of the inverter have a decisive influence on the
performance of the grid connected photovoltaic system.
Generally, grid-connected inverters operate at a higher DC voltage than stand alone inverters. Grid-connected
inverters should NOT be connected to batteries and stand-alone inverters should NOT be connected directly to
PV or the grid. Smaller systems with few appliances may have only DC power, but recent advances in inverter
design, efficiency, and reliability have increased the potential of solar systems considerably.
With the use of modern high efficiency AC lighting the majority of, if not all, loads can be operated on AC
especially in larger installations. We can use both AC & DC where each is most effective and economical -
many DC appliances use less power than their AC equivalents (especially refrigeration, lighting & electronics)
- but DC appliances tend to be harder to find and more expensive.
Working of Grid Connected Inverter
The grid-connected inverter must convert the direct current from the solar modules to alternating
current synchronous with the grid. It must also be optimally matched to the I-V characteristic of the
solar generator. Therefore, in PV applications the inverter will automatically adjust the PV array
loading to provide peak efficiency of the solar panels by means of maximum power point tracking
(MPPT).
Inverters automatically shutdown in the event of:
High/Low grid AC-voltage
High/Low grid frequency
Grid Failure
Inverter malfunction
20 | P a g e
Figure: 8.1 off grid solar system with battery charging control
8.3 RESULT:
8.4 PRELAB VIVA QUESTIONS:
1. What is the functioning of power inverter?
2. What is the difference between a solar inverter and power inverter?
3. What Capacity of Inverter is Good for Your Home?
4. What do we need inverter or UPS?
8.5 POSTLAB VIVA QUESTIONS:
1. Why do I need batteries for off grid solar system?
2. What are the specifications to be followed to select a right inverter for your home?
3. When does inverter automatically shut down?
4. What are major differences of standalone and grid connected inverters?
20 | P a g e
EXPERIMENT– 9
EFFECT OF SHADING ON SOLAR PANNEL PERFORMANCE
9.1 AIM:
Study of
a) Series parallel connections of solar panels and effect of shading.
b) Improvement in power efficiency of photovoltaic array under shading conditions using bypass diode with PSCAD.
9.2 APPARATUS:
S.No Apparatus Quantity
1 Flood Light 2
2 Card Board 2
3 Digital Multi Meter 2
4 Decade Resistance Box 1
9.2 CIRCUIT DIAGRAM:
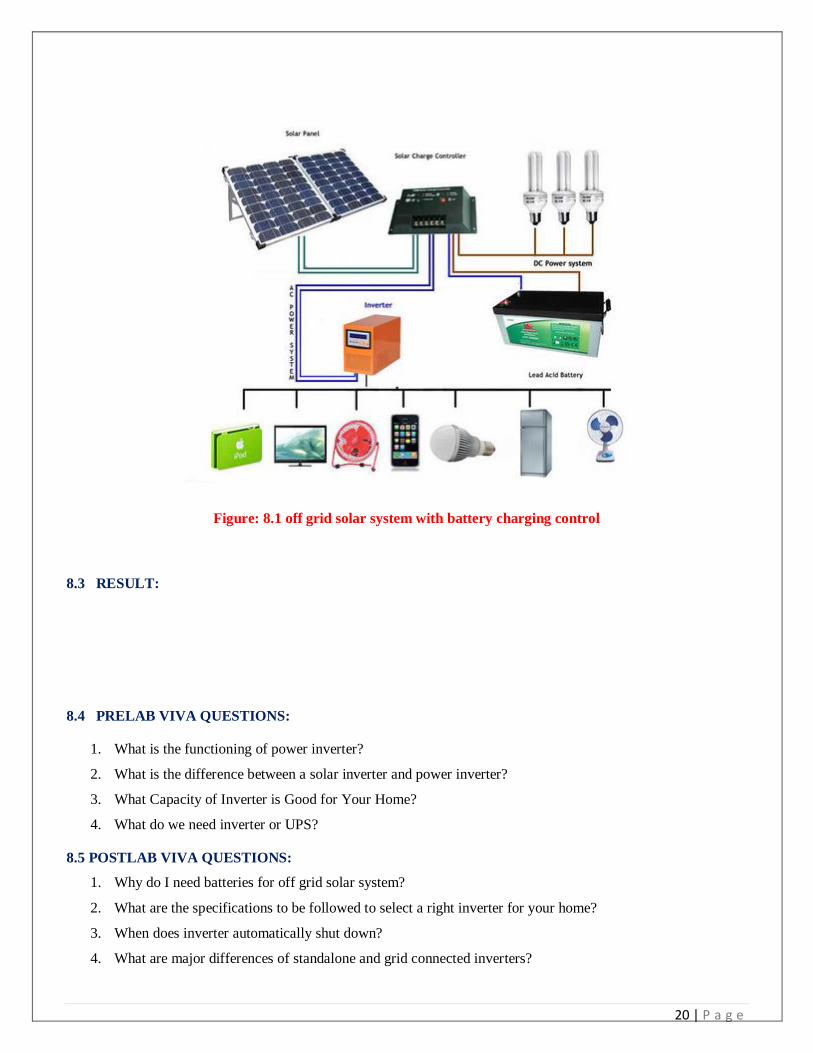
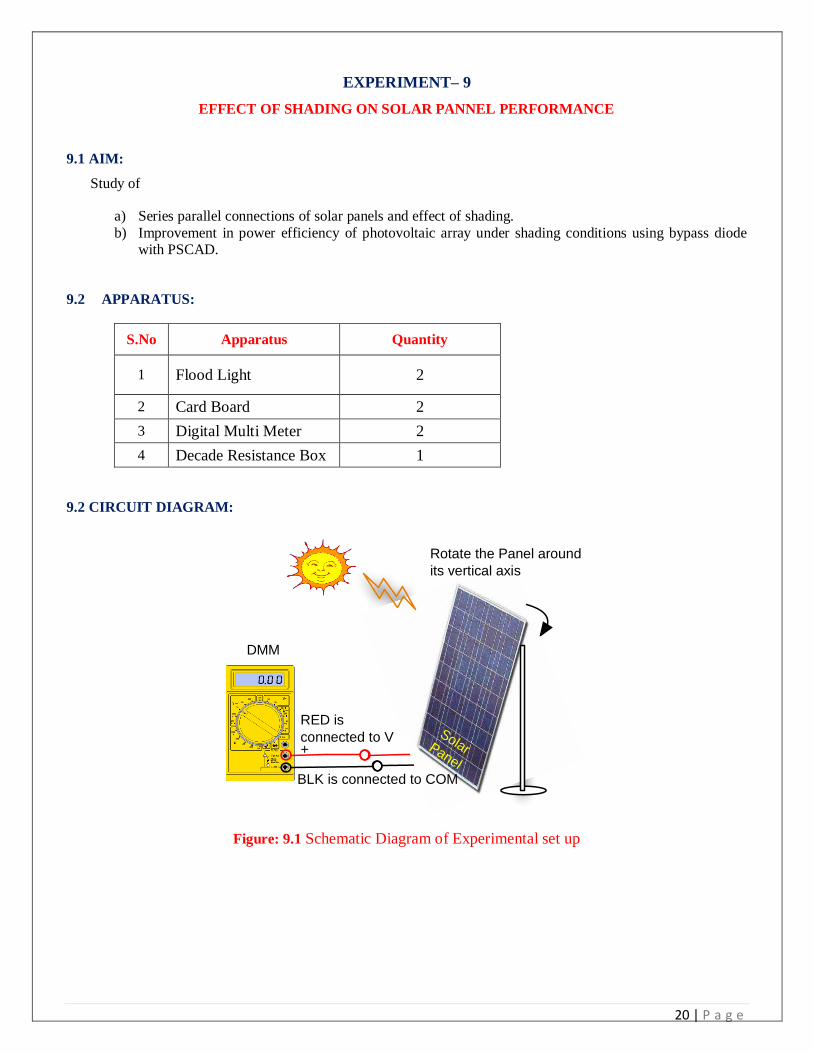
Figure: 9.1 Schematic Diagram of Experimental set up
Solar Panel
Rotate the Panel around
its vertical axis
DMM
+
RED is
connected to V
BLK is connected to COM
20 | P a g e
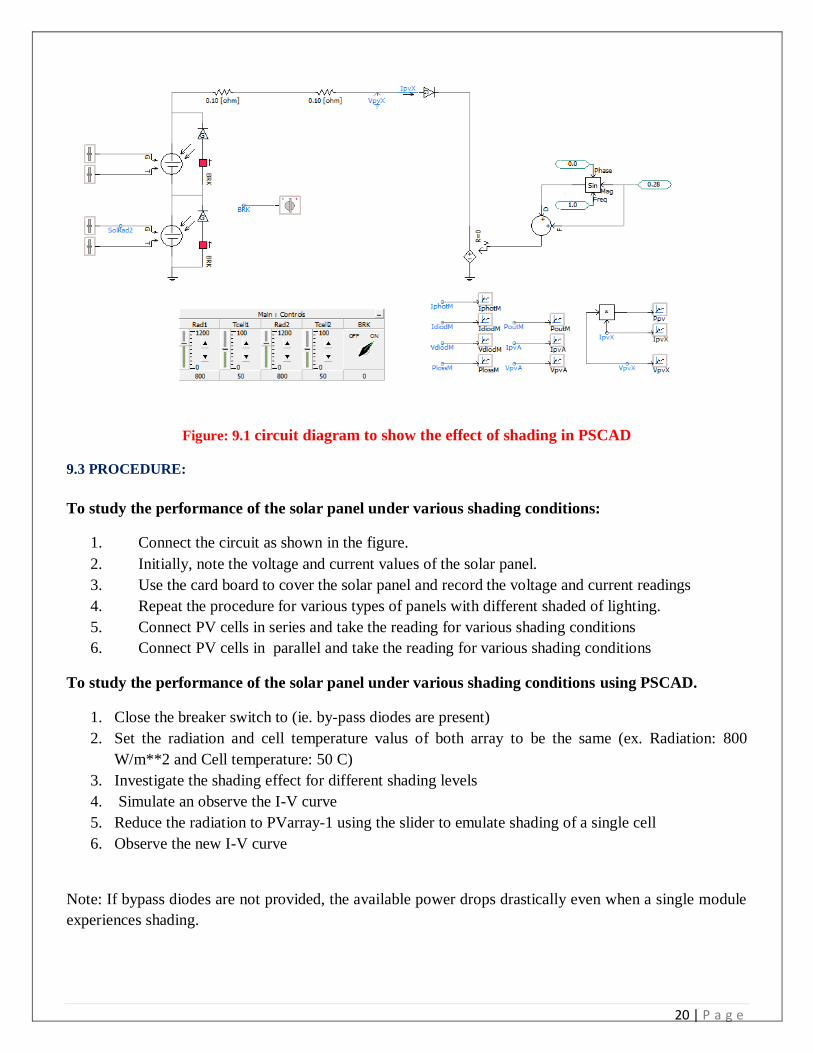
Figure: 9.1 circuit diagram to show the effect of shading in PSCAD
9.3 PROCEDURE:
To study the performance of the solar panel under various shading conditions:
1. Connect the circuit as shown in the figure.
2. Initially, note the voltage and current values of the solar panel.
3. Use the card board to cover the solar panel and record the voltage and current readings
4. Repeat the procedure for various types of panels with different shaded of lighting.
5. Connect PV cells in series and take the reading for various shading conditions
6. Connect PV cells in parallel and take the reading for various shading conditions
To study the performance of the solar panel under various shading conditions using PSCAD.
1. Close the breaker switch to (ie. by-pass diodes are present)
2. Set the radiation and cell temperature valus of both array to be the same (ex. Radiation: 800
W/m**2 and Cell temperature: 50 C)
3. Investigate the shading effect for different shading levels
4. Simulate an observe the I-V curve
5. Reduce the radiation to PVarray-1 using the slider to emulate shading of a single cell
6. Observe the new I-V curve
Note: If bypass diodes are not provided, the available power drops drastically even when a single module
experiences shading.
20 | P a g e
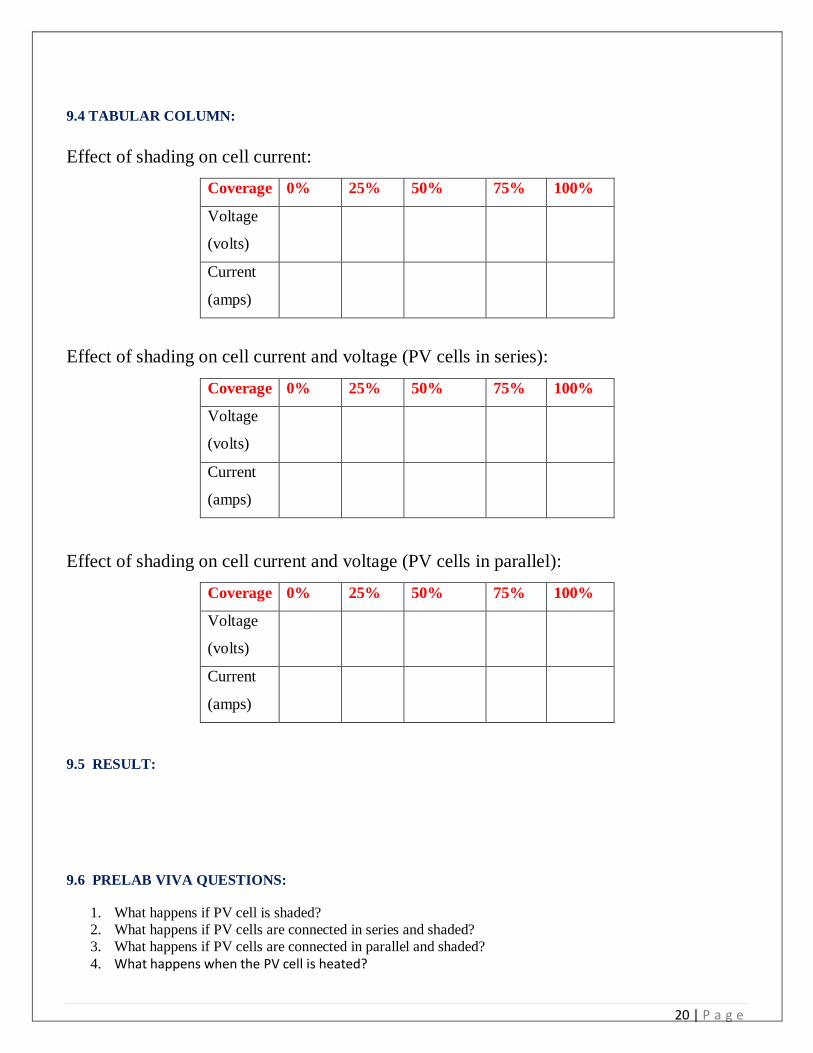
9.4 TABULAR COLUMN:
Effect of shading on cell current:
Coverage 0% 25% 50% 75% 100%
Voltage
(volts)
Current
(amps)
Effect of shading on cell current and voltage (PV cells in series):
Coverage 0% 25% 50% 75% 100%
Voltage
(volts)
Current
(amps)
Effect of shading on cell current and voltage (PV cells in parallel):
Coverage 0% 25% 50% 75% 100%
Voltage
(volts)
Current
(amps)
9.5 RESULT:
9.6 PRELAB VIVA QUESTIONS:
1. What happens if PV cell is shaded?
2. What happens if PV cells are connected in series and shaded?
3. What happens if PV cells are connected in parallel and shaded?
4. What happens when the PV cell is heated?

20 | P a g e
9.7 POSTLAB VIVA QUESTIONS:
1. Why is shade a problem in solar panel? 2. In what direction would you face a photovoltaic system being installed on your home? Explain
3. How could you increase the output of a PV cell during the day, when the angle of the sun‟s rays is
constantly changing? 4. What happens when the solar cell is moved closer to the light source?
20 | P a g e
EXPERIMENT– 10
EFFECT OF TEMPERATURE AND TILT ANGLE ON SOLAR PANNEL
10.1 AIM:
Study of effect of surrounding temperature and tilt angle on the performance solar PV panel.
10.2 APPARATUS:
S.No Apparatus Quantity
1 Flood Light 2
2 Digital Multi Meter 2
3 Decade Resistance Box 1
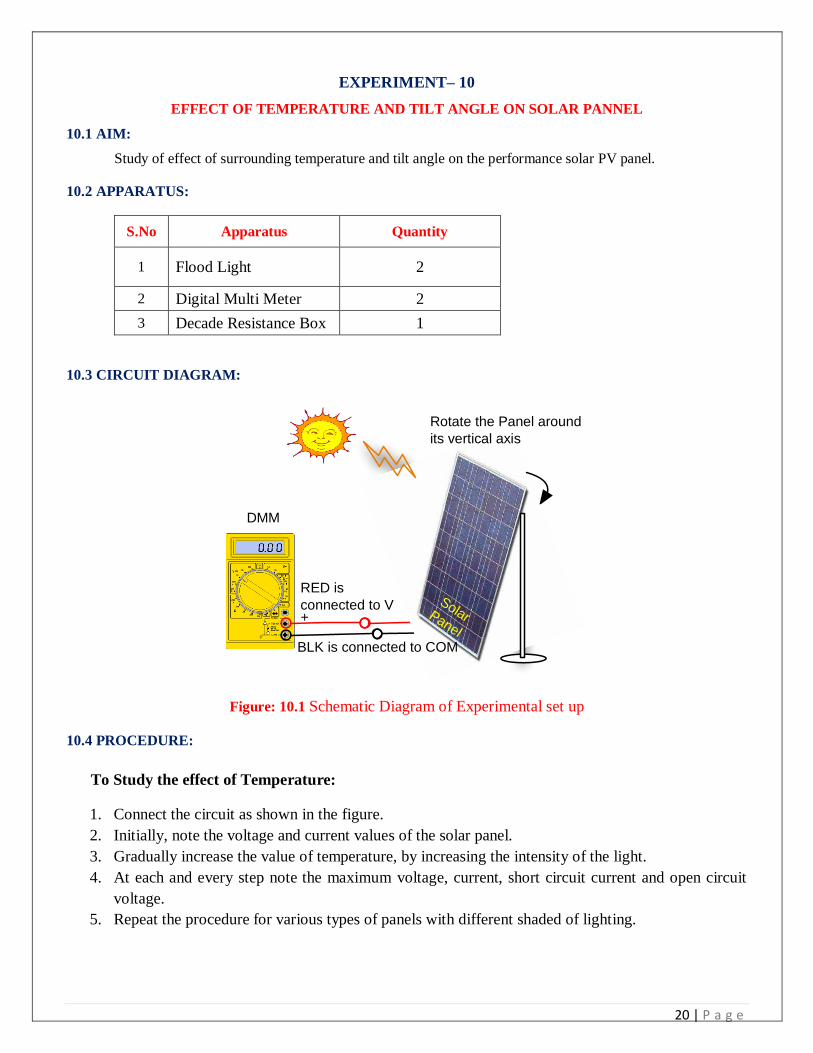
10.3 CIRCUIT DIAGRAM:
Figure: 10.1 Schematic Diagram of Experimental set up
10.4 PROCEDURE:
To Study the effect of Temperature:
1. Connect the circuit as shown in the figure.
2. Initially, note the voltage and current values of the solar panel.
3. Gradually increase the value of temperature, by increasing the intensity of the light.
4. At each and every step note the maximum voltage, current, short circuit current and open circuit
voltage.
5. Repeat the procedure for various types of panels with different shaded of lighting.
Solar Panel
Rotate the Panel around
its vertical axis
DMM
+
RED is
connected to V
BLK is connected to COM
20 | P a g e
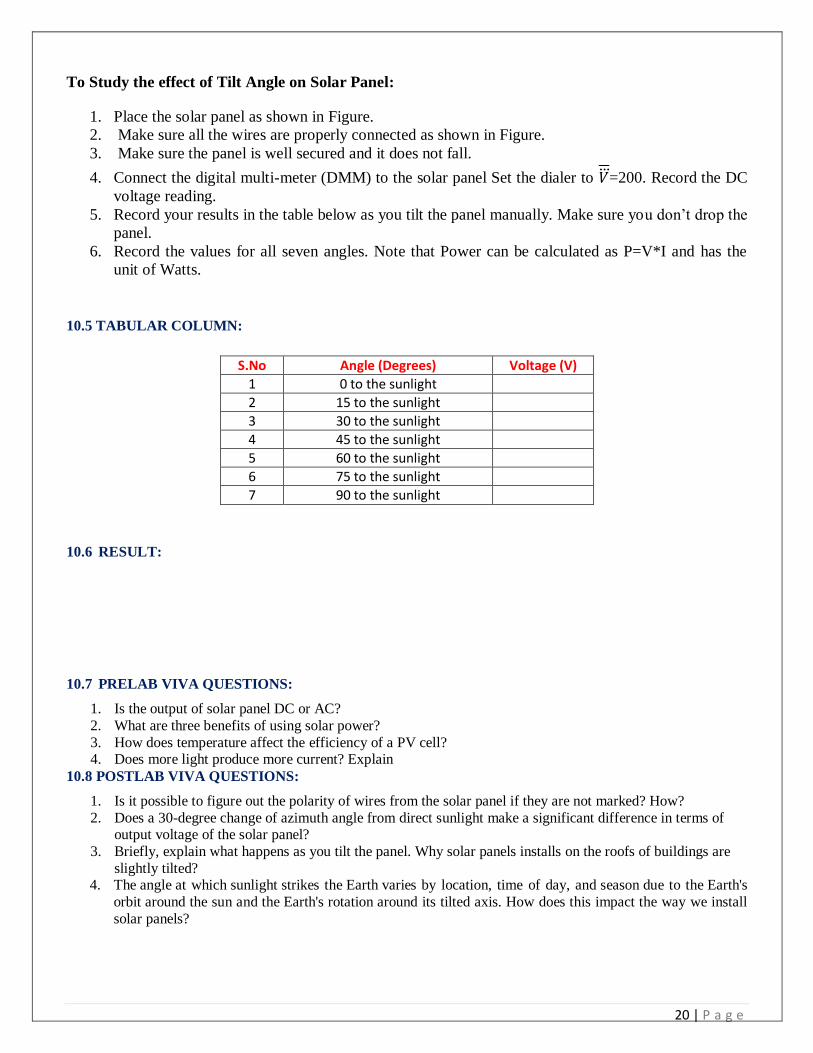
To Study the effect of Tilt Angle on Solar Panel:
1. Place the solar panel as shown in Figure.
2. Make sure all the wires are properly connected as shown in Figure.
3. Make sure the panel is well secured and it does not fall.
4. Connect the digital multi-meter (DMM) to the solar panel Set the dialer to 𝑉 =200. Record the DC
voltage reading.
5. Record your results in the table below as you tilt the panel manually. Make sure you don‟t drop the
panel.
6. Record the values for all seven angles. Note that Power can be calculated as P=V*I and has the
unit of Watts.
10.5 TABULAR COLUMN:
S.No Angle (Degrees) Voltage (V)
1 0 to the sunlight
2 15 to the sunlight
3 30 to the sunlight
4 45 to the sunlight
5 60 to the sunlight
6 75 to the sunlight
7 90 to the sunlight
10.6 RESULT:
10.7 PRELAB VIVA QUESTIONS:
1. Is the output of solar panel DC or AC?
2. What are three benefits of using solar power?
3. How does temperature affect the efficiency of a PV cell? 4. Does more light produce more current? Explain
10.8 POSTLAB VIVA QUESTIONS:
1. Is it possible to figure out the polarity of wires from the solar panel if they are not marked? How?
2. Does a 30-degree change of azimuth angle from direct sunlight make a significant difference in terms of output voltage of the solar panel?
3. Briefly, explain what happens as you tilt the panel. Why solar panels installs on the roofs of buildings are
slightly tilted? 4. The angle at which sunlight strikes the Earth varies by location, time of day, and season due to the Earth's
orbit around the sun and the Earth's rotation around its tilted axis. How does this impact the way we install
solar panels?
20 | P a g e
EXPERIMENT– 11
DESIGN OF SOLAR PANEL
11.1 AIM:
To study of solar panel design using solar cells by interconnecting them to get desired voltage and power
rating.
11.2 APPARATUS:
S.No Apparatus Function
1 PV module Converts sunlight into DC electricity
2 Solar charge controller
Regulates the voltage and current coming from the PV panels going
to battery and prevents battery overcharging and prolongs the battery
life
3 Inverter Converts DC output of PV panels or wind turbine into a clean AC
current for AC appliances or fed back into grid line.
4 Battery Stores energy for supplying to electrical appliances when there is a
demand.
5 Load Electrical appliances that connected to solar PV system such as lights,
radio, TV, computer,
6 Auxiliary energy
sources Diesel generator or other renewable energy sources.
11.3 CIRCUIT DIAGRAM:
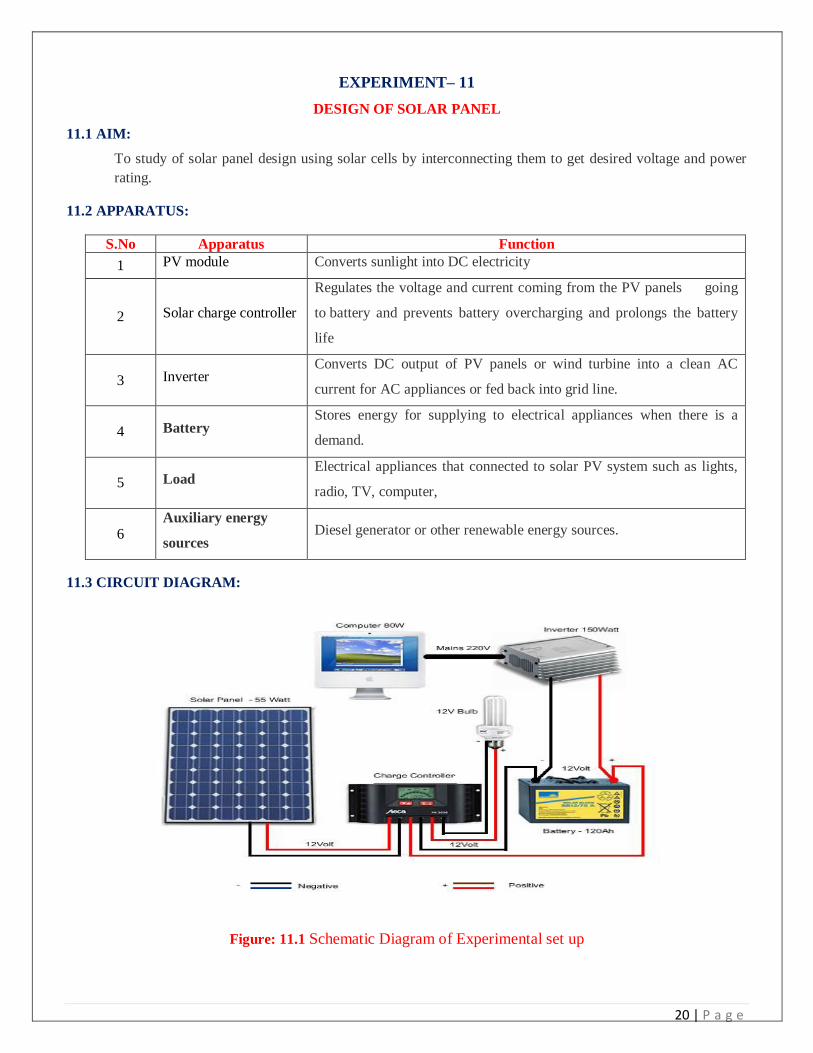
Figure: 11.1 Schematic Diagram of Experimental set up
20 | P a g e
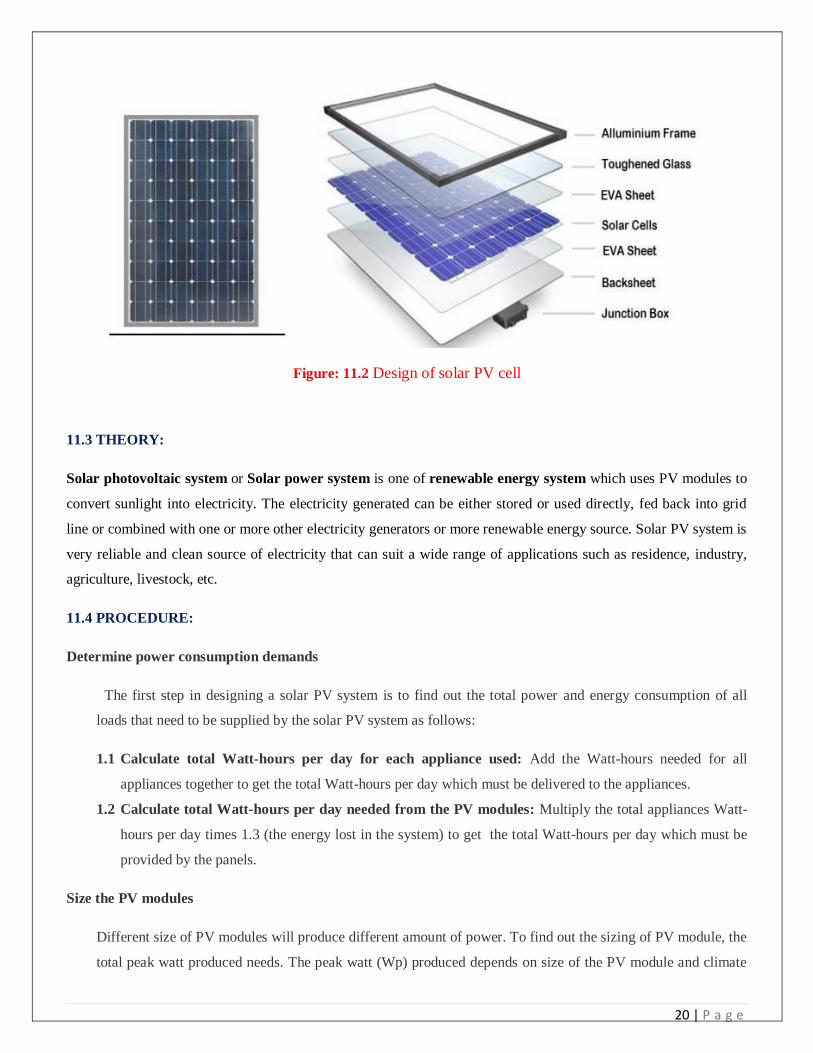
Figure: 11.2 Design of solar PV cell
11.3 THEORY:
Solar photovoltaic system or Solar power system is one of renewable energy system which uses PV modules to
convert sunlight into electricity. The electricity generated can be either stored or used directly, fed back into grid
line or combined with one or more other electricity generators or more renewable energy source. Solar PV system is
very reliable and clean source of electricity that can suit a wide range of applications such as residence, industry,
agriculture, livestock, etc.
11.4 PROCEDURE:
Determine power consumption demands
The first step in designing a solar PV system is to find out the total power and energy consumption of all
loads that need to be supplied by the solar PV system as follows:
1.1 Calculate total Watt-hours per day for each appliance used: Add the Watt-hours needed for all
appliances together to get the total Watt-hours per day which must be delivered to the appliances.
1.2 Calculate total Watt-hours per day needed from the PV modules: Multiply the total appliances Watt-
hours per day times 1.3 (the energy lost in the system) to get the total Watt-hours per day which must be
provided by the panels.
Size the PV modules
Different size of PV modules will produce different amount of power. To find out the sizing of PV module, the
total peak watt produced needs. The peak watt (Wp) produced depends on size of the PV module and climate
20 | P a g e
of site location. We have to consider “panel generation factor” which is different in each site location. For
Thailand, the panel generation factor is 3.43. To determine the sizing of PV modules, calculate as follows:
2.1 Calculate the total Watt-peak rating needed for PV modules: Divide the total Watt-hours per day
needed from the PV modules (from item 1.2) by 3.43 to get the total Watt-peak rating needed for the PV
panels needed to operate the appliances.
2.2 Calculate the number of PV panels for the system: Divide the answer obtained in item 2.1 by the rated
output Watt-peak of the PV modules available to you. Increase any fractional part of result to the next
highest full number and that will be the number of PV modules required.
Result of the calculation is the minimum number of PV panels. If more PV modules are installed, the system
will perform better and battery life will be improved. If fewer PV modules are used, the system may not work
at all during cloudy periods and battery life will be shortened.
Inverter sizing
An inverter is used in the system where AC power output is needed. The input rating of the inverter should
never be lower than the total watt of appliances. The inverter must have the same nominal voltage as your
battery.
For stand-alone systems, the inverter must be large enough to handle the total amount of Watts you will be
using at one time. The inverter size should be 25-30% bigger than total Watts of appliances. In case of
appliance type is motor or compressor then inverter size should be minimum 3 times the capacity of those
appliances and must be added to the inverter capacity to handle surge current during starting.
For grid tie systems or grid connected systems, the input rating of the inverter should be same as PV array
rating to allow for safe and efficient operation.
Battery sizing
The battery type recommended for using in solar PV system is deep cycle battery. Deep cycle battery is
specifically designed for to be discharged to low energy level and rapid recharged or cycle charged and
discharged day after day for years. The battery should be large enough to store sufficient energy to operate
the appliances at night and cloudy days. To find out the size of battery, calculate as follows:
Calculate total Watt-hours per day used by appliances.
Divide the total Watt-hours per day used by 0.85 for battery loss.
Divide the answer obtained in item 4.2 by 0.6 for depth of discharge.
Divide the answer obtained in item 4.3 by the nominal battery voltage.
20 | P a g e
Multiply the answer obtained in item 4.4 with days of autonomy (the number of days that you need the
system to operate when there is no power produced by PV panels) to get the required Ampere-hour capacity
of deep-cycle battery.
Battery Capacity (Ah) = Total Watt-hours per day used by appliances x Days of autonomy
(0.85 x 0.6 x nominal battery voltage)
5. Solar charge controller sizing
The solar charge controller is typically rated against Amperage and Voltage capacities. Select the solar charge
controller to match the voltage of PV array and batteries and then identify which type of solar charge
controller is right for your application. Make sure that solar charge controller has enough capacity to handle
the current from PV array.
For the series charge controller type, the sizing of controller depends on the total PV input current which is
delivered to the controller and also depends on PV panel configuration (series or parallel configuration).
According to standard practice, the sizing of solar charge controller is to take the short circuit current (Isc) of
the PV array, and multiply it by 1.3
Solar charge controller rating = Total short circuit current of PV array x 1.3
11.5 RESULT:
11.6 PRELAB VIVA QUESTIONS:
1. How can I generate electricity from a solar cell?
2. What is the life time of a solar PV module?
3. Why solar cell is reverse biased? 4. What is the difference between photo diode and a solar cell?
11.7 POSTLAB VIVA QUESTIONS: 1. How is energy generated in cloudy days?
2. How do I determine the size of solar panel?
3. What is the purpose of batteries for solar panel system? 4. How do you find efficiency of a solar cell?
20 | P a g e
EXPERIMENT– 12
DATA ACQUISITION USING DIGITAL SIMULATION
12.1 AIM:
Data acquisition using temperature, voltage and irradiation with sensors of solar panel using digital
simulation
12.2 APPARATUS:
S.No Apparatus Quantity
1 MATLAB/ simulink 1
12.3 CIRCUIT DIAGRAM:
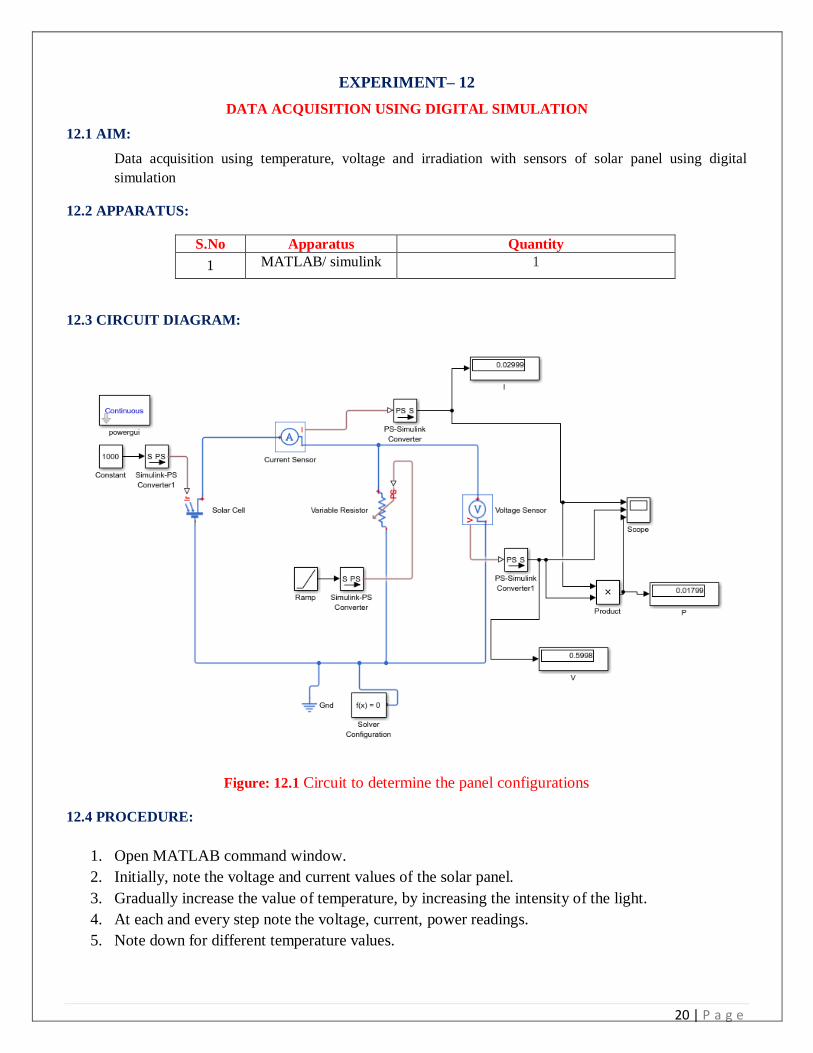
Figure: 12.1 Circuit to determine the panel configurations
12.4 PROCEDURE:
1. Open MATLAB command window.
2. Initially, note the voltage and current values of the solar panel.
3. Gradually increase the value of temperature, by increasing the intensity of the light.
4. At each and every step note the voltage, current, power readings.
5. Note down for different temperature values.
20 | P a g e
12.5 RESULT:
12.6 PRELAB VIVA QUESTIONS:
1. Explain the working of solar cell?
2. What is the effect of irradiance on solar cell parameters? 3. How does photon proceed in solar cell?
4. What are different layers of solar cell?
12.7 POSTLAB VIVA QUESTIONS:
1. What is fill factor? 2. What are the components that make up a solar system? 3. What are solar cell parameters? 4. How can you increase the efficiency of a solar cell?
20 | P a g e
EXPERIMENT– 13
MAXIMUM POWER POINT TRACKER USING DIGITAL SIMULATION / PSCAD
13.1 AIM:
1. Implementation of maximum power point tracker using perturbs and observe algorithm using digital
simulation.
2. Determine the mathematical model of PV cell, ensure MPPT algorithm using PSCAD.
13.2 APPARATUS:
S.No Apparatus Quantity
1 MATLAB/ simulink 1
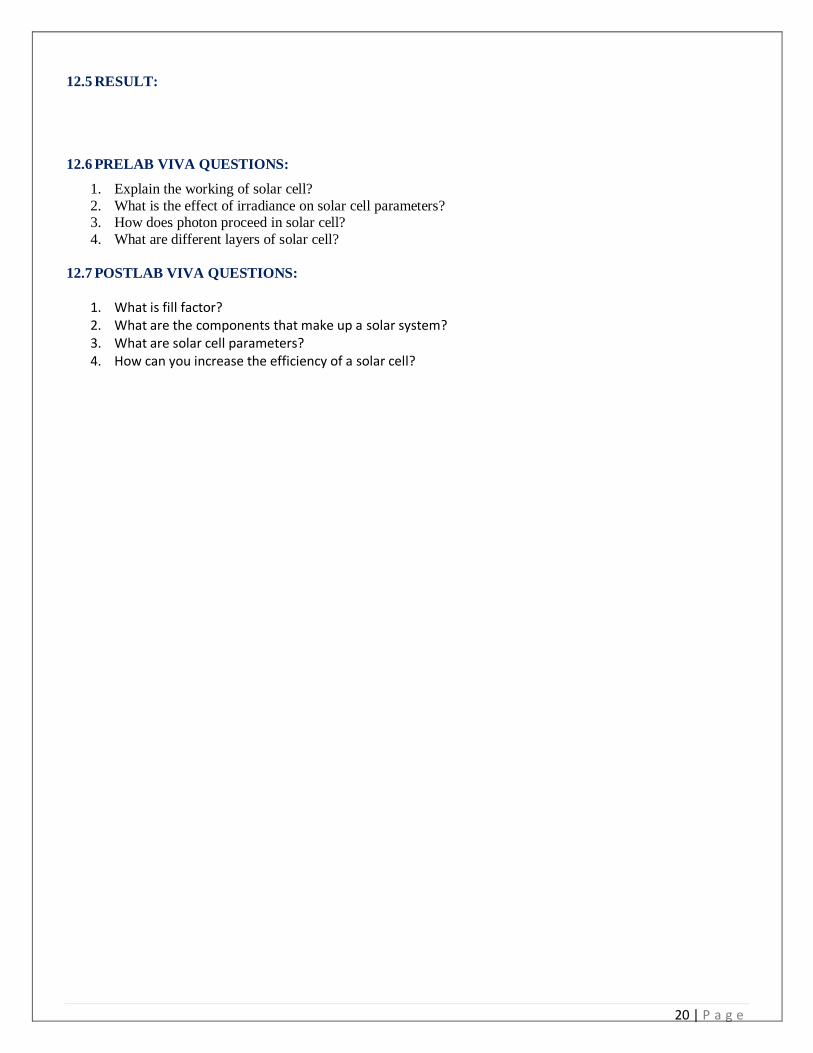
13.3 THEORY:
It is the simplest method of MPPT to implement. In this method only voltage is sensed, so it is easy to implement.
In this method power output of system is checked by varying the supplied voltage. If on increasing the voltage,
power is also increases then further „δ‟ is increased otherwise start decreasing the „δ'. Similarly, while decreasing
voltage if power increases the duty cycle is decreased. These steps continue Simulation and Analysis of Perturb and
Observe MPPT Algorithm for PV Array 221 till maximum power point is reached. The corresponding voltage at
which MPP is reached is known as reference point (Vref).
Figure: 13.1 Flow chart for P and O method of MPPT
20 | P a g e
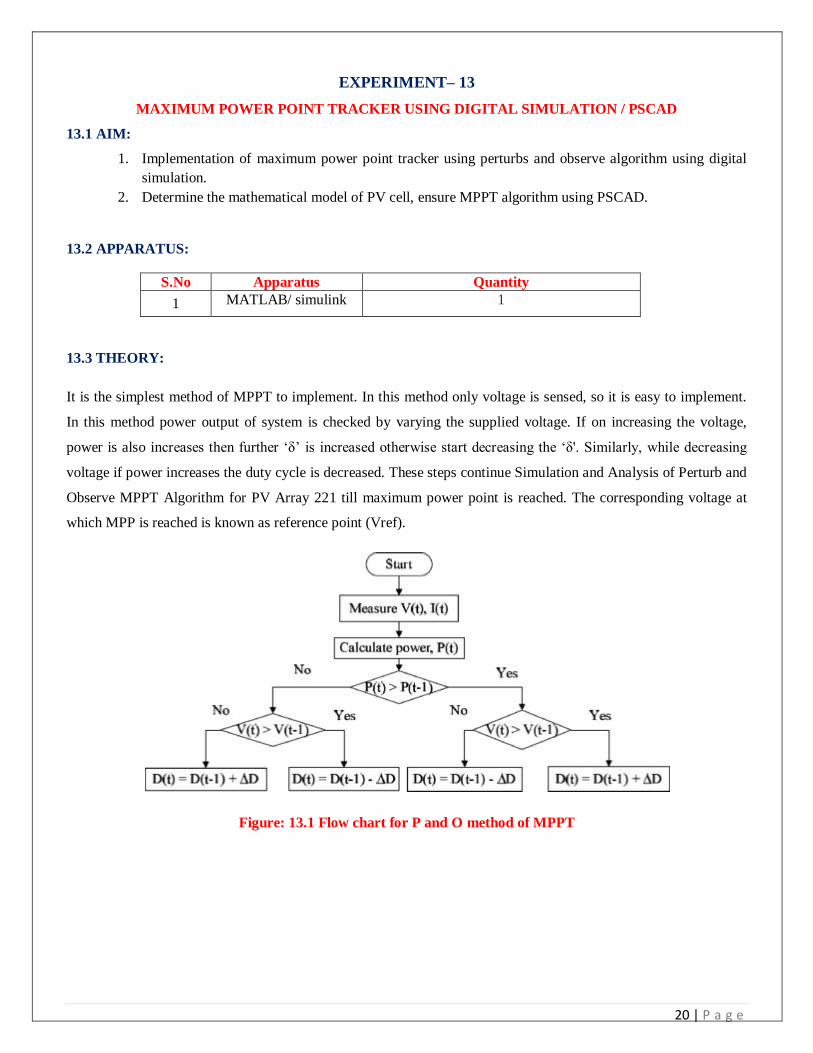
13.4 CIRCUIT DIAGRAM:
Figure: 13.2 P and O method of algorithm for MPPT for boost converter in MATLAB
Figure: 13.3 MPPT simulation diagram in PSCAD
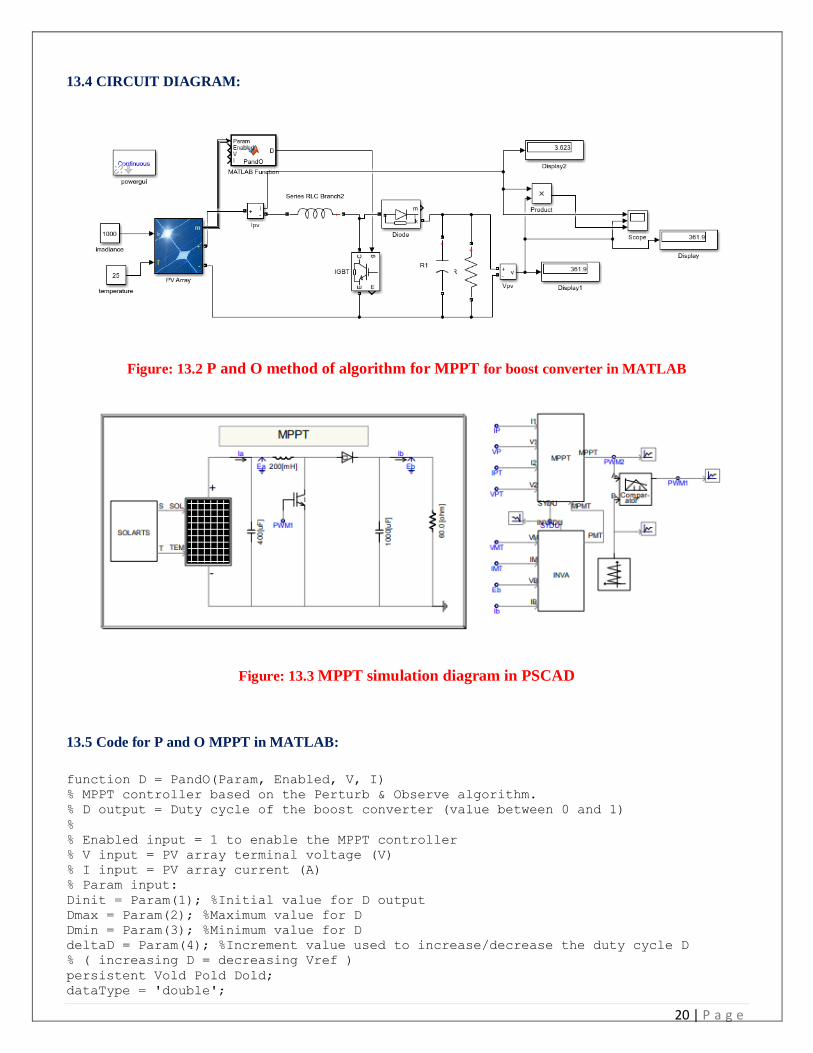
13.5 Code for P and O MPPT in MATLAB:
function D = PandO(Param, Enabled, V, I) % MPPT controller based on the Perturb & Observe algorithm. % D output = Duty cycle of the boost converter (value between 0 and 1) % % Enabled input = 1 to enable the MPPT controller % V input = PV array terminal voltage (V) % I input = PV array current (A) % Param input: Dinit = Param(1); %Initial value for D output Dmax = Param(2); %Maximum value for D Dmin = Param(3); %Minimum value for D deltaD = Param(4); %Increment value used to increase/decrease the duty cycle D % ( increasing D = decreasing Vref ) persistent Vold Pold Dold; dataType = 'double';
20 | P a g e
if isempty(Vold) Vold=0; Pold=0; Dold=Dinit; end P= V*I; dV= V - Vold; dP= P - Pold; if dP ~= 0 && Enabled ~=0 if dP < 0 if dV < 0 D = Dold - deltaD; else D = Dold + deltaD; end else if dV < 0 D = Dold + deltaD; else D = Dold - deltaD; end end else D=Dold; end if D >= Dmax | D<= Dmin D=Dold; end Dold=D; Vold=V; Pold=P;
13.5 PROCEDURE:
1. Open MATLAB command window.
2. Construct the block diagram as shown in the circuit diagram.
3. Double click on the MATLAB function (subsystem) block and write the code for P and O
algorithm using the flow chart.
4. Change the values of irradiance and temperature and observe the output.
Using PSCAD:
1. Connect the circuit as shown in above figu
2. Set the radiation and cell temperature values (ex. radiation 1000 W/m**2 and Cell temparature 250
C)
3. Simulate an observe the I-V curve
4. Vary the irradiance values and observe the new readings
.
13.6 RESULT:

20 | P a g e
13.7 PRELAB VIVA QUESTIONS:
1. What is working principle of boost converter?
2. What is meant by MPPT? 3. What are the different MPPT techniques used?
4. What is PWM?
13.7 POSTLAB VIVA QUESTIONS: 1. What is difference between PWM and MPPT
2. What is P and O method of MPPT?
3. What is an MPPT charge controller?
4. Explain the working principle of buck converter?
20 | P a g e
EXPERIMENT– 14
DETERMINATION OF PARAMETERS OF SOLAR CELL USING DIGITAL SIMULATION
14.1 AIM:
To study the characteristics of solar cell and determine its parameters using digital simulation.
14.2 APPARATUS:
S.No Apparatus Quantity
1 MATLAB/ simulink 1
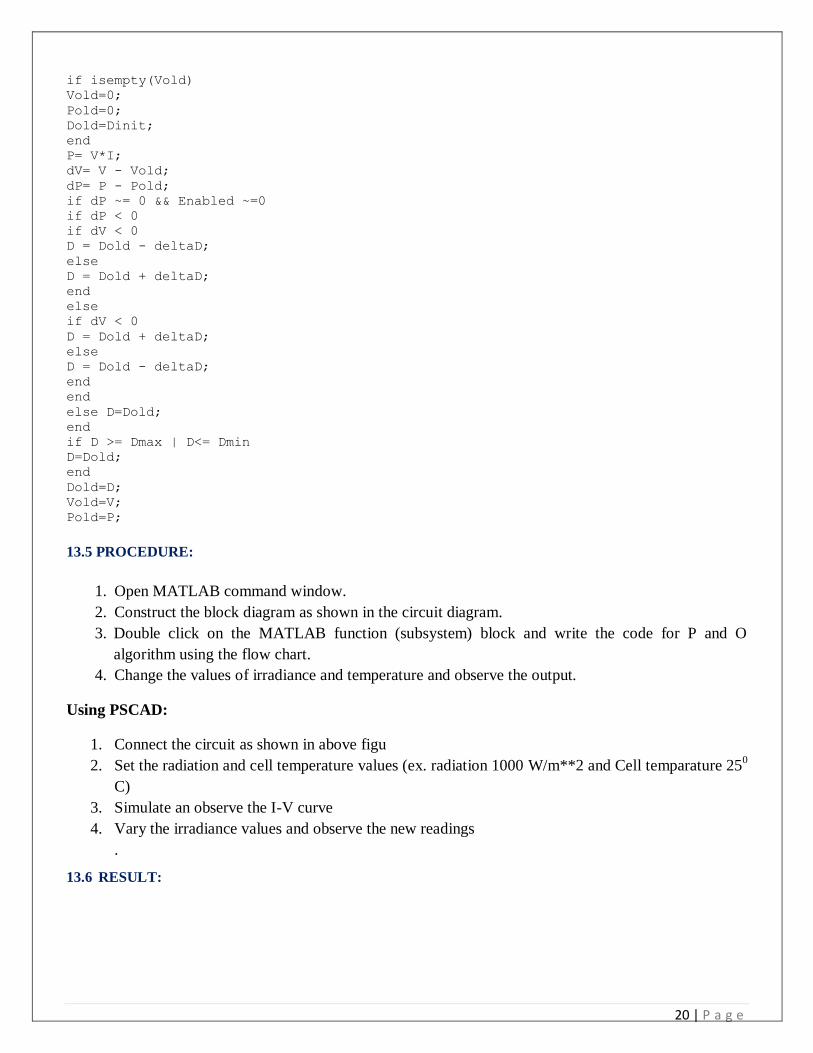
14.3 CIRCUIT DIAGRAM:
Figure: 14.1 circuit to find Iph
Figure: 14.2 circuit to find Io/ Iref
20 | P a g e
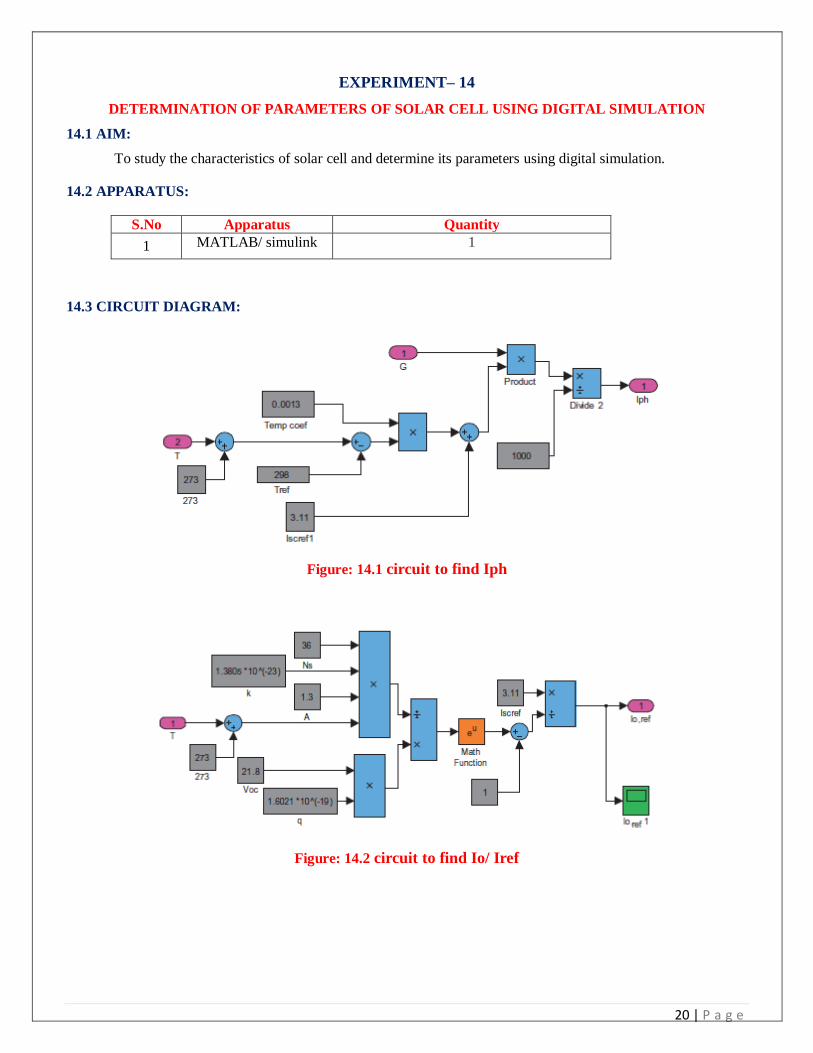
Figure: 14.3 circuit to find Io
Figure: 14.4 Digital Implementation with Rp term
20 | P a g e
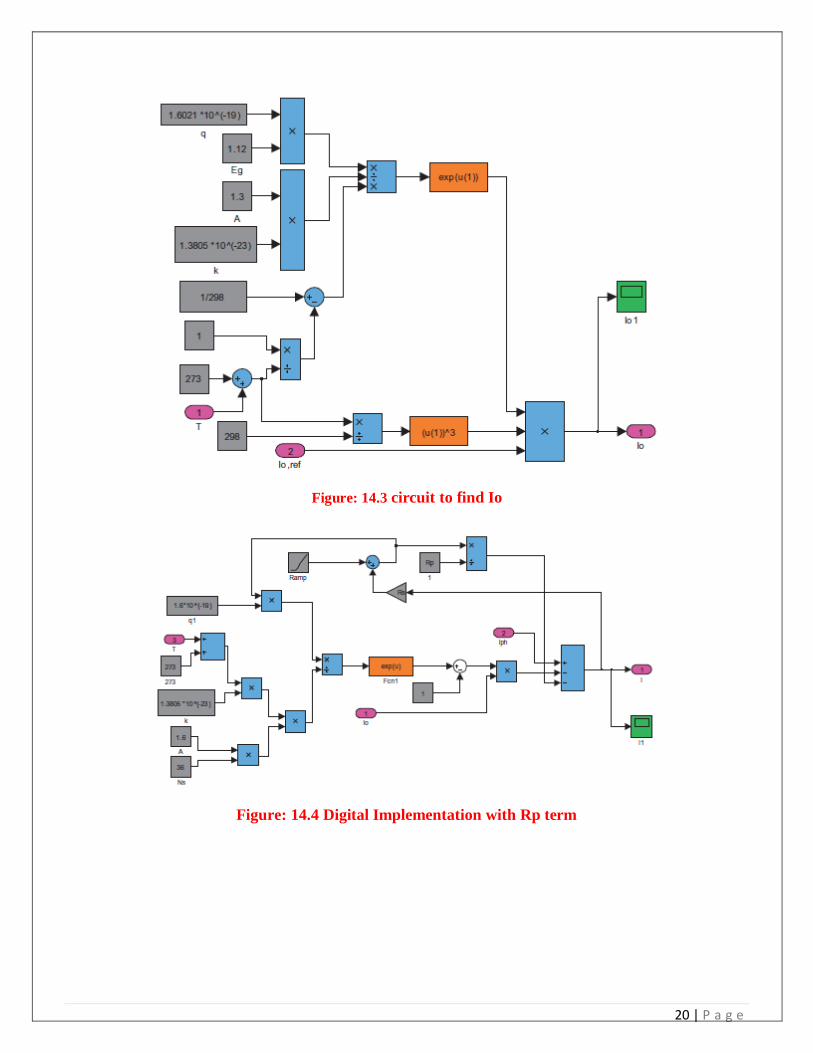
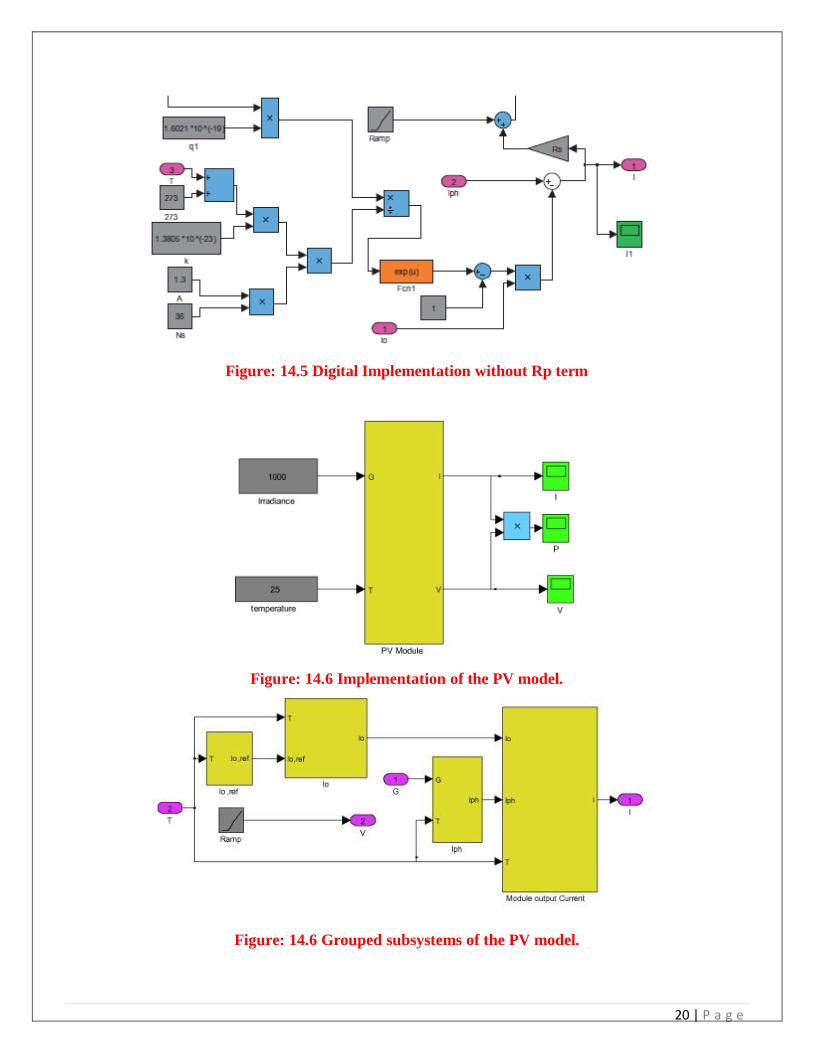
Figure: 14.5 Digital Implementation without Rp term
Figure: 14.6 Implementation of the PV model.
Figure: 14.6 Grouped subsystems of the PV model.
20 | P a g e
14.5 THEORY:
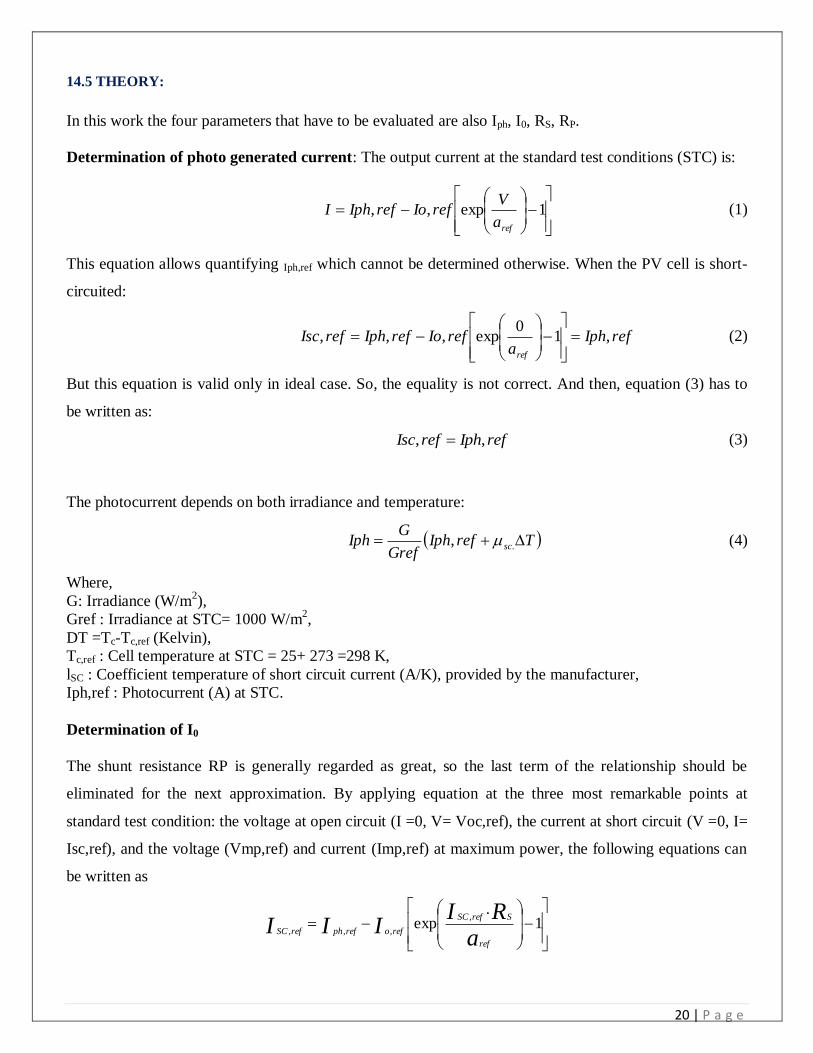
In this work the four parameters that have to be evaluated are also Iph, I0, RS, RP.
Determination of photo generated current: The output current at the standard test conditions (STC) is:
1exp,,
refa
VrefIorefIphI (1)
This equation allows quantifying Iph,ref which cannot be determined otherwise. When the PV cell is short-
circuited:
refIpha
refIorefIphrefIscref
,10
exp,,,
(2)
But this equation is valid only in ideal case. So, the equality is not correct. And then, equation (3) has to
be written as:
refIphrefIsc ,, (3)
The photocurrent depends on both irradiance and temperature:
TrefIphGref
GIph sc ., (4)
Where,
G: Irradiance (W/m2),
Gref : Irradiance at STC= 1000 W/m2,
DT =Tc-Tc,ref (Kelvin),
Tc,ref : Cell temperature at STC = 25+ 273 =298 K,
lSC : Coefficient temperature of short circuit current (A/K), provided by the manufacturer,
Iph,ref : Photocurrent (A) at STC.
Determination of I0
The shunt resistance RP is generally regarded as great, so the last term of the relationship should be
eliminated for the next approximation. By applying equation at the three most remarkable points at
standard test condition: the voltage at open circuit (I =0, V= Voc,ref), the current at short circuit (V =0, I=
Isc,ref), and the voltage (Vmp,ref) and current (Imp,ref) at maximum power, the following equations can
be written as
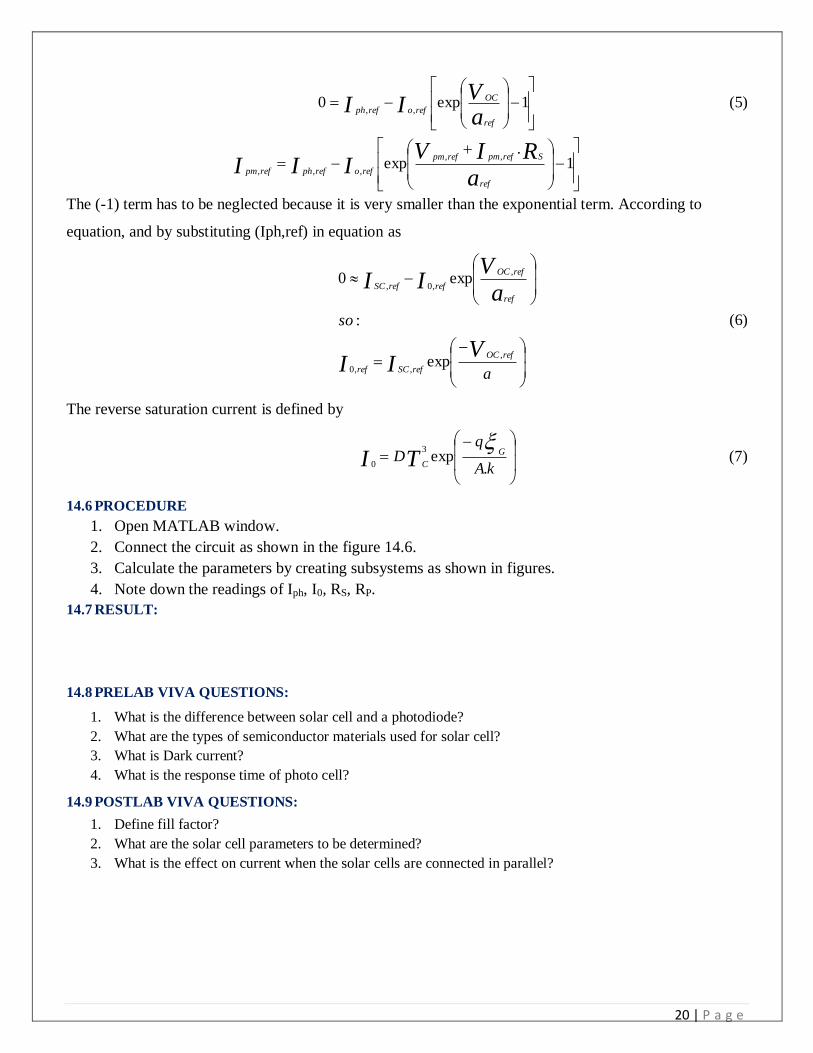
1
.exp
,
,,,
aRI
IIIref
SrefSC
reforefphrefSC
20 | P a g e
1exp0
,,
aV
IIref
OC
reforefph (5)
1
.exp
,,
,,,
aRIV
IIIref
Srefpmrefpm
reforefphrefpm
The (-1) term has to be neglected because it is very smaller than the exponential term. According to
equation, and by substituting (Iph,ref) in equation as
a
so
VII
aV
II
refOC
refSCref
ref
refOC
refrefSC
,
,,0
,
,0,
exp
:
exp0
(6)
The reverse saturation current is defined by
kA
qD G
CTI.
exp3
0
(7)
14.6 PROCEDURE
1. Open MATLAB window.
2. Connect the circuit as shown in the figure 14.6.
3. Calculate the parameters by creating subsystems as shown in figures.
4. Note down the readings of Iph, I0, RS, RP.
14.7 RESULT:
14.8 PRELAB VIVA QUESTIONS:
1. What is the difference between solar cell and a photodiode?
2. What are the types of semiconductor materials used for solar cell?
3. What is Dark current?
4. What is the response time of photo cell?
14.9 POSTLAB VIVA QUESTIONS:
1. Define fill factor?
2. What are the solar cell parameters to be determined?
3. What is the effect on current when the solar cells are connected in parallel?