Embed Size (px)
Citation preview
THIN
K.
CHAN
GE.
DO
ISF:
SUST
AIN
ABIL
ITY
2005
REPORT
INST
ITU
TE F
OR S
UST
AIN
ABLE
FU
TURE
S
ISF:
RES
EARC
HEX
PERT
WIT
NES
S RE
PORT
TO
THE
FRAN
KST
ON B
YPAS
S PA
NEL
m
AIN
REP
ORT

1
!"#$%&'()&*$++'%$#,%&',*'')*-./$-'&%011)/'2%,(&3'0*-')&+')4#5)/0&),*+'1,%'2%$$*3,.+$'20+'$4)++),*+'&,'&3$''6%0*7+&,*'89#0++':0*$5';*<.)%9''6 February 2009
My name is Dr Michelle E Zeibots.
My residential address is 29 Reuss Street, Leichhardt, NSW, 2040 and my workplace contact phone number is 02 9514 4900.
I am a Transport Planner and currently work as a Senior Research Consultant at the Institute for Sustainable Futures at the University of Technology, Sydney.
Qualifications of Dr Michelle Zeibots and relevant work experience
I have academic qualifications including a BSc(Arch) — Bachelor of Architectural Design Science (University of Sydney), conferred 1992; BA(Hons) — Honours Degree in Politics, Philosophy and Sociology (Murdoch University) that included original research for a dissertation entitled The economic role of cities, which was supervised by Prof Peter Newman, conferred 1995: PhD — Doctor of Philosophy in Sustainable Futures (University of Technology, Sydney) that included original research for a dissertation entitled Space, time, economics and asphalt: an investigation of induced traffic growth caused by urban motorway expansion and the implications it has for the sustainability of cities, which was supervised by Prof Stuart White and Dr Glenn Searle, conferred 2008.
I am a Chartered Member of the Chartered Institute of Logistics and Transport — Member No. 6459.
My area of specialty expertise is in the topic of induced traffic growth. My doctoral dissertation is focussed on this subject and includes original research articulating the causal mechanism for the phenomenon, empirical analysis of case studies in Australia and literature reviews that address why the phenomenon has been contested by government institutions and professionals in the past, a history of its study, methodological problems relating to measuring the phenomenon and theoretical explanations for why it occurs set within microeconomic and general systems theory frameworks and an outlined of how it features within current definitions of sustainable transport. In addition to my doctoral dissertation I have published several academic conference papers and technical reports on the subject. I am currently in the process of completing a three part report series on induced traffic growth for the NSW Department of Environment and Climate Change, RailCorp and the NSW Department of Planning. I have also worked as an expert referee for a research report on the subject commissioned by Transport New Zealand and undertaken by Booz, Allen & Hamilton NZ. I have worked as a part author and sub-consultant on a research report on induced traffic growth commissioned by VicRoads and undertaken by Ian Wallis Pty. Ltd. I have also recently completed a traffic analysis of the Roe 7 Hwy in Perth
2
for Main Roads Western Australia that identified the existence of induced traffic growth as part of a Triple-Bottom-Line (TBL) analysis of that project. I am currently supervising a PhD student on the topic of induced traffic reduction — the reverse process of induced traffic growth — and I am engaged with international research and debate on this subject with two academic journal papers currently in preparation on this topic.
In addition to my area of specialty expertise I have worked as an academic transport researcher and practitioner for 15 years. My most recent work experience includes completion of a TBL analysis of the Roe 7 Hwy in Perth for Main Roads WA, a working paper on operationalising sustainable transport principles to assist the preparation of a new spatial plan — Network City — for Perth for the West Australian Department of Planning and Infrastructure and coordination of a Masterclass at UTS to provide instruction on the production of Workplace Travel Plans for professionals. In the past I have worked on the Millennium Cities Database with Prof Jeff Kenworthy and Dr Felix Laube for the International Association of Public Transport Providers (UITP) and I have worked for several Non-Government Organisations assisting communities affected by urban motorway developments. In the early 1990s I was appointed as a community advisor to the NSW Traffic Noise Task Force by the NSW Ministers for Roads and Environment and also as a community advisor to the Public Transport Advisory Committee by the NSW Transport Minister.
Instructions to Dr Michelle Zeibots
I have been asked by Environment Victoria and the Environmental Defenders Office of Victoria to provide an assessment of the veracity of consideration given to the issue of induced traffic growth, or induced travel demand, in the EES and associated documents for the Frankston Bypass. I was also asked to comment on the implications this would have for greenhouse gas (GHG) emissions estimated for the project.
Documents and other materials considered
In preparation for this report I reviewed the EES Summary Report for the Frankston Bypass prepared by SEITA.
I also reviewed the Report for Frankston Bypass. Environment effects statement. Technical Report: greenhouse gas emissions assessment, prepared by GHD, and the Strategic Transport Modelling Technical Report, prepared by Maunsell Australia.
Other materials on the topic of induced traffic growth were also consulted and a list of these is provided at the end of this report in the reference section.
Statement of Expert Evidence
This report primarily focuses on the subject of induced traffic growth as related to the Frankston Bypass in the EES for the proposed project. In particular, it focuses on the decision not to include consideration of induced traffic growth in the assessment for the project — the reasons for which are outlined in the EES Summary Report for the Frankston Bypass — but which

3
stand in stark contrast to the overview and background information provided on the subject that appears in the Technical Report prepared by GHD on greenhouse gas emissions estimated for the project.
This primary focus is supported by general background information on induced traffic growth as well as suggestions — in addition to those outlined by GHD — as to how it could, and why it should, be incorporated into the technical analysis used to investigate the costs and benefits of constructing the Frankston Bypass.
This report concludes that until such analysis is incorporated into the EES for the Frankston Bypass, the basis on which a final decision is made will be deeply flawed, especially in relation to the estimate of travel time savings accruing from the project, its GHG emissions footprint and its potential to trigger and support future land-use development in the region that is car dependent and less able to sustain access in the future rather than transit orientated development that would be less vulnerable to energy price shocks and shortages.
4
Table of contents
1 A!brief!definition!of!induced!traffic!growth....................................................................................6
2 Induced!traffic!growth!in!the!EES!for!the!Frankston!Bypass ..........................................................9
3 Induced!traffic!growth!and!microeconomics................................................................................10
4 Commonsense!arguments!about!the!nature!of!road!traffic!growth ............................................15
5 The!significance!of!induced!traffic!growth!in!relation!to!the!Frankston!Bypass ..........................18
6 Sustainability!implications!of!increasing!relative!accessibility!for!car!traffic!by!building!the!Frankston!Bypass ..................................................................................................................................20
7 Concluding!remarks ......................................................................................................................21
8 References ....................................................................................................................................21
5
The following is a list of abbreviations used in the report:
ABS Australian Bureau of Statistics
BCR Benefit Cost Ratio
CBA Cost Benefit Analysis
CBD Central Business District
CURE Centre for Urban and Regional Ecology
EES Environmental Effect Statement
GHD Gutheridge Haskins & Davies
GHG greenhouse gas
HMSO Her Majesty’s Service Office
ISF Institute for Sustainable Futures
KPI Key Performance Indicator
OD Origin and Destination
RTA Roads & Traffic Authority of New South Wales
SACTRA Standing Advisory Committee on Trunk Route Assessment (UK)
SEITA Southern and Eastern Integrated Transport Authority
TDC NSW Transport Data Centre (Ministry of Transport)
UITP International Association of Public Transport Providers (UITP, Brussels)
UTS University of Technology, Sydney
VKT Vehicle Kilometers Travelled
VTP Victorian Transport Plan !
6
1 A!brief!definition!of!induced!traffic!growth!1. To begin, it is useful to provide a brief definition of what induced traffic growth is and why
it is significant when assessing the costs and benefits of transport infrastructure proposals like the Frankston Bypass.
2. Induced traffic growth refers to the new demand created for road travel following a reduction in travel times brought about by an increase in road capacity. This elasticity of demand with respect to travel time is significant because if not included in assessments for new projects it can lead to significant over estimates of the benefits attributable to a new project and significant underestimates of the additional greenhouse gas emissions that would be generated by the project.
3. The increase in travel speed that occurs after an increase in road capacity triggers several different forms of travel behaviour change that take place simultaneously, including:
Traffic reassignment: where some commuters may find that the new or improved road is more attractive than an old route and so switch from one to the other.
Mode-shifting: where people find that travel by car on a new or improved road is able to provide a faster trip than using parallel rail or public transport services and so shift from one mode to the other.
Trip rescheduling: where the increase in road capacity may also reduce congestion during peak travel periods and so encourage some people who had scheduled their trips outside the peaks to change their departure time, thereby increasing peak period traffic volumes.
Change in vehicle occupancy rates: where some commuters who were travelling as a passenger in another’s motor vehicle may choose to drive their own car.
Trip redistribution: where changes in prevailing travel speeds may also mean that preferred destinations that had previously taken too long a time to access fall within reasonable travel time budgets, inducing people to travel to more distant destinations.
Induced or generated trips: faster network speeds may also result in people choosing to make more trips as part of their standard travel routine or undertake trips where they had previously not travelled at all.
Development traffic: where districts that were once inconvenient to access because journey times were too long may become more attractive as places to locate once a network has been augmented with new capacity (SACTRA 1994, p. 20–22, 51 and 53).
4. Where these travel behaviour changes result in an increase in vehicle kilometres travelled (VKT) on the network as a whole, the additional travel is viewed as having been induced by the new road capacity and so is referred to as induced traffic growth.
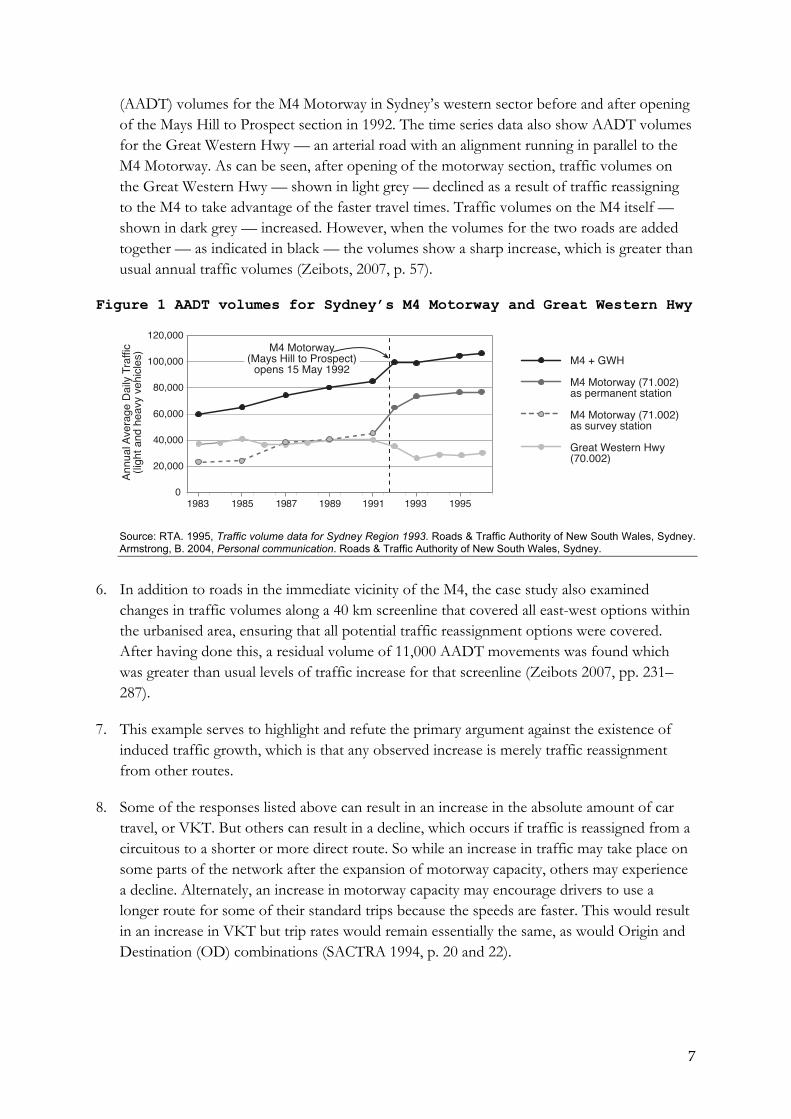
5. Figure 1 provides an example from an induced traffic growth case study that I have undertook as part of my doctoral research. It shows time series Annual Average Daily Traffic
7
(AADT) volumes for the M4 Motorway in Sydney’s western sector before and after opening of the Mays Hill to Prospect section in 1992. The time series data also show AADT volumes for the Great Western Hwy — an arterial road with an alignment running in parallel to the M4 Motorway. As can be seen, after opening of the motorway section, traffic volumes on the Great Western Hwy — shown in light grey — declined as a result of traffic reassigning to the M4 to take advantage of the faster travel times. Traffic volumes on the M4 itself — shown in dark grey — increased. However, when the volumes for the two roads are added together — as indicated in black — the volumes show a sharp increase, which is greater than usual annual traffic volumes (Zeibots, 2007, p. 57).
Figure 1 AADT volumes for Sydney’s M4 Motorway and Great Western Hwy
0
20,000
40,000
60,000
80,000
100,000
120,000
1985 1987 1989 1991 1993 19951983
M4 Motorway(Mays Hill to Prospect)
opens 15 May 1992
Annu
al A
vera
ge D
aily
Traf
fic(li
ght a
nd h
eavy
veh
icles
)
M4 + GWH
M4 Motorway (71.002)as permanent station
M4 Motorway (71.002)as survey station
Great Western Hwy(70.002)
!
Source: RTA. 1995, Traffic volume data for Sydney Region 1993. Roads & Traffic Authority of New South Wales, Sydney. Armstrong, B. 2004, Personal communication. Roads & Traffic Authority of New South Wales, Sydney.
6. In addition to roads in the immediate vicinity of the M4, the case study also examined changes in traffic volumes along a 40 km screenline that covered all east-west options within the urbanised area, ensuring that all potential traffic reassignment options were covered. After having done this, a residual volume of 11,000 AADT movements was found which was greater than usual levels of traffic increase for that screenline (Zeibots 2007, pp. 231–287).
7. This example serves to highlight and refute the primary argument against the existence of induced traffic growth, which is that any observed increase is merely traffic reassignment from other routes.
8. Some of the responses listed above can result in an increase in the absolute amount of car travel, or VKT. But others can result in a decline, which occurs if traffic is reassigned from a circuitous to a shorter or more direct route. So while an increase in traffic may take place on some parts of the network after the expansion of motorway capacity, others may experience a decline. Alternately, an increase in motorway capacity may encourage drivers to use a longer route for some of their standard trips because the speeds are faster. This would result in an increase in VKT but trip rates would remain essentially the same, as would Origin and Destination (OD) combinations (SACTRA 1994, p. 20 and 22).
8
9. Much of the past professional and scholarly debate over the definition of induced traffic growth was revealed in disputes over the merits of fixed-trip versus variable-trip matrixes1 in traffic models (SACTRA 1994, pp. 22–25). The key question in these disputes was whether or not changes to the transport network induce changes in the OD pairs and the patterns of linked trips that comprise the travel behaviour of any given population. For example, if motorway capacity is added to the network and changes prevailing road speeds, some people may choose to switch from using public transport to driving their cars. In this instance there is no change to OD pairs, or induced trips, as set out in the fixed matrix model, but there is induced traffic growth as the road induced individuals to change modes, which resulted in an increase in motor vehicle movements. The same is true if people choose to drive their own vehicles rather than travel as a passenger while someone else drives. The OD pairs remain the same, but traffic volumes and VKT increases.
10. Disputes over what constitutes induced traffic growth, whether the phenomenon is real and whether or not it should be included in the assessment methods for motorways was settled back in 1994 with the release of the SACTRA report. The Standing Advisory Committee on Trunk Route Assessment is a committee comprising specialists and professionals who are from time to time asked by the UK government to investigate pressing and contested matters that affect the road network. After the opening of the last link in London’s M25 orbital motorway, where traffic conditions were so remarkably worse than they were before opening, the SACTRA were asked by the then Transport Minister to investigate the issue. The resulting report was a highly lucid account of the problem using widely accepted and largely unremarkable investigation methods. What made the report remarkable however was the fact that a government institution had produced it where previously so many agencies had dismissed the significance of the phenomenon.
11. The definition that I use in my work and have endeavoured to outlined here is the definition suggested by SACTRA. In my experience, this is the definition used by most professionals and governments around the world when considering the issue.
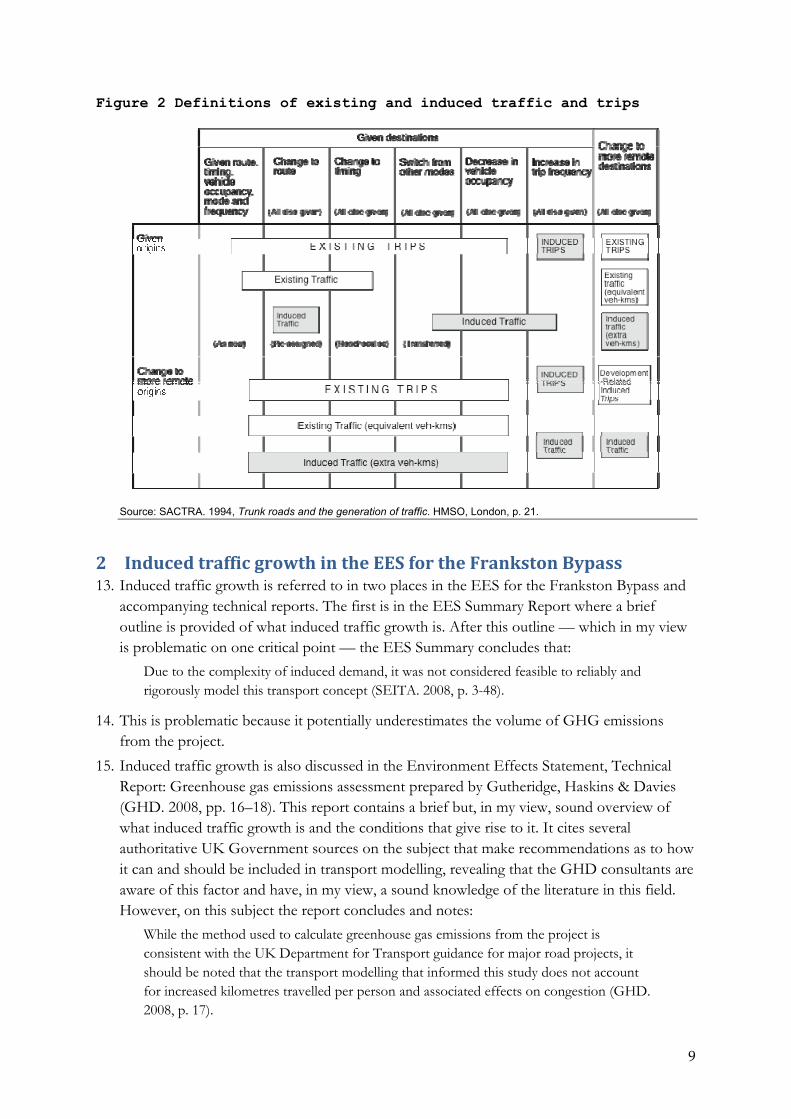
12. Figure 2 charts the various changes to travel behaviour listed in paragraph 15. The responses highlighted in grey correspond to those changes that generate an increase in either the number of trips or trip distances undertaken by car. Both generate an increase in VKT. The SACTRA identified these definitions after discussion with relevant government agencies, transport professionals and community organisations who made submissions to their inquiry (SACTRA 1994, pp. 20–21).
!!!!!!!!!!!!!!!!!!!!!!!!!!!!!!!!!!!!!!!!!!!!!!!!!!!!!!!!!!!!
1 A fixed-matrix model works on the basis that OD combinations will stay the same after changes to the transport network. By contrast, the variable-trip matrix model works on the basis that OD combinations will change. Variable-trip matrix models consequently incorporate algorithms to account for changes in travel behaviour that fixed-matrix models do not.
9
Figure 2 Definitions of existing and induced traffic and trips
Source: SACTRA. 1994, Trunk roads and the generation of traffic. HMSO, London, p. 21.
2 Induced!traffic!growth!in!the!EES!for!the!Frankston!Bypass!13. Induced traffic growth is referred to in two places in the EES for the Frankston Bypass and
accompanying technical reports. The first is in the EES Summary Report where a brief outline is provided of what induced traffic growth is. After this outline — which in my view is problematic on one critical point — the EES Summary concludes that:
Due to the complexity of induced demand, it was not considered feasible to reliably and rigorously model this transport concept (SEITA. 2008, p. 3-48).
14. This is problematic because it potentially underestimates the volume of GHG emissions from the project.
15. Induced traffic growth is also discussed in the Environment Effects Statement, Technical Report: Greenhouse gas emissions assessment prepared by Gutheridge, Haskins & Davies (GHD. 2008, pp. 16–18). This report contains a brief but, in my view, sound overview of what induced traffic growth is and the conditions that give rise to it. It cites several authoritative UK Government sources on the subject that make recommendations as to how it can and should be included in transport modelling, revealing that the GHD consultants are aware of this factor and have, in my view, a sound knowledge of the literature in this field. However, on this subject the report concludes and notes:
While the method used to calculate greenhouse gas emissions from the project is consistent with the UK Department for Transport guidance for major road projects, it should be noted that the transport modelling that informed this study does not account for increased kilometres travelled per person and associated effects on congestion (GHD. 2008, p. 17).
10
16. Unlike the general summary report, the technical report by GHD does not state that induced traffic growth is too complex to model. Indeed it provides background information and guidance on travel demand elasticity values:
The elasticity of travel volume with respect to travel time (or traffic with respect to main road infrastructure capacity) has been studied in various countries, the most well known being the 1994 UK SACTRA study. Various sources quote this study and interpret the findings differently — from ‘the elasticity of traffic demand in relation to roadway expansion is between 0 and 1 per cent’ to ‘the elasticity of travel volume with respect to travel time is -0.5 in the short term and -1.0 in the long term. This means that reducing travel time on a roadway by 20 per cent typically increases traffic volumes by 10 per cent in the short term and 20 per cent over the long term’ (where long term was defined as more than three years). No equivalent study appears to have been completed in Australia (GHD. 2008, p. 17).
17. The references cited by the GHD consultants in the quote above are the report prepared by Sir Rod Eddington on the East West Link needs assessment from 2008 and a paper by Tod Litman from the Victoria Transport Policy Institute in Canada on transport elasticities from 2007.
18. Given the lengths the GHD consultants went to in relation to the matter of induced traffic growth, it is unclear as to why consideration for it has not been included in their final calculations and report.
19. In light of these circumstances, I recommend the Panel seek further clarification as to why induced traffic growth has not been included in the evaluation for the Frankston Bypass given that the GHD consultants appear to be familiar with the issue and the technical points surrounding it and indirectly suggest a way in which it could have been included.
20. Before focussing attention more closely on the issue of induced traffic growth and how it should be approached in relation to the Frankston Bypass, it seems prudent to me to further outline general aspects of the issue, especially those relating to the use of microeconomics and induced traffic growth. I feel this is useful for several reasons. First, any remaining doubts that may arise as to whether induced growth is real, need to be allayed, and this can be done soundly with reference to basic microeconomic analysis principle. The second, it clarifies up-front and exposes the workings of the most easily applied method for incorporating induced traffic growth into the assessment of the project — the use of demand elasticities.
3 Induced!traffic!growth!and!microeconomics!21. From a microeconomic perspective the question of weather or not new motorways generate
additional traffic gets down to whether the demand curve for travel on the basis of travel time is flat or sloped (Goodwin & Noland 2003, p. 1452).
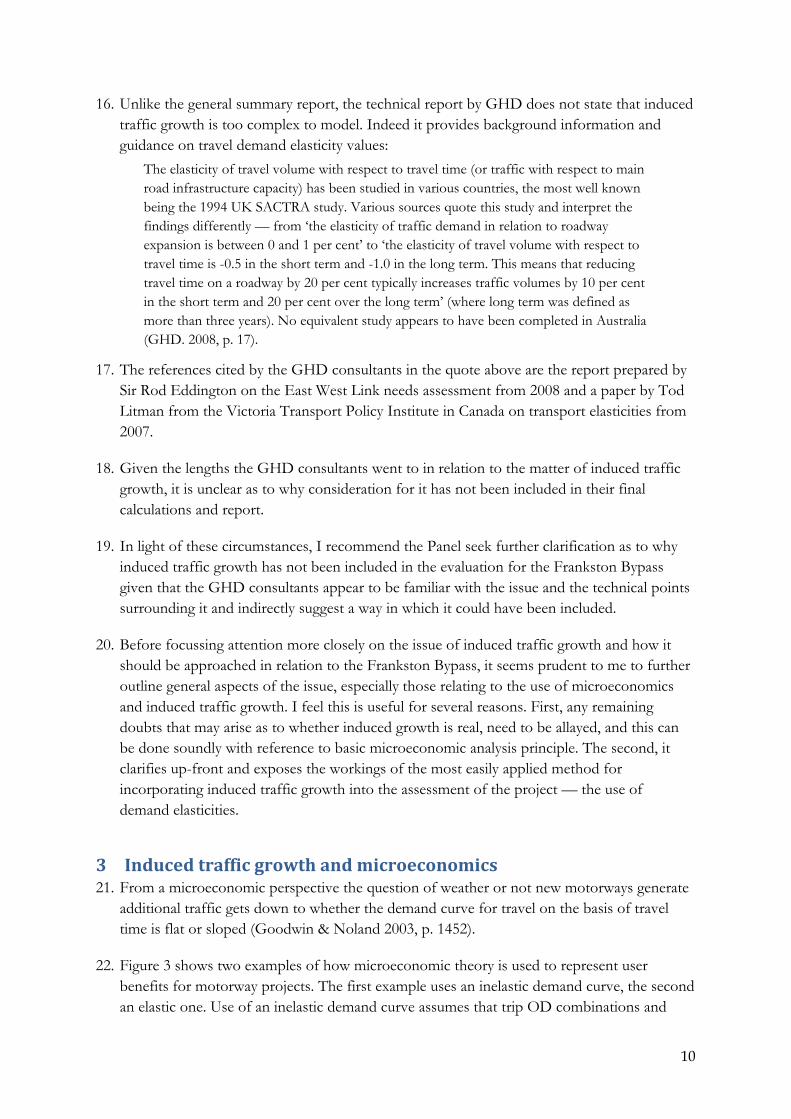
22. Figure 3 shows two examples of how microeconomic theory is used to represent user benefits for motorway projects. The first example uses an inelastic demand curve, the second an elastic one. Use of an inelastic demand curve assumes that trip OD combinations and
11
modes before a proposed motorway is opened will remain the same, as will trip volumes. Trip redistribution and induced trips mean that new and different OD combinations occur in response to the changed conditions. Other sources like mode-shifting and decline in vehicle occupancy result in an increase in the volume of trips, so that the demand curve is sloped. The first example does not recognise induced traffic growth, and estimates much larger reductions to the marginal cost, or unit cost, of trips for a proposal than is achieved in practice when induced traffic growth occurs.
Figure 3 Estimation of marginal cost savings arising from a proposed urban motorway
!
Adapted from: SACTRA. 1994, Trunk roads and the generation of traffic. HMSO, London, pp. 115–119.
23. In the second example, where an elastic demand curve is used, induced traffic growth is recognised. Reductions in individual travel-time savings are not as large because the additional traffic creates congestion. Consequently, reductions to the marginal cost of trips are smaller. Clearly, economic evaluation for an urban motorway within a framework such as that shown in the second example produces lower values for the benefits of a project and so, within the terms of CBA, might return a low BCR.
24. For roads and motorways, the basic characteristics of the infrastructure — or supply curve — are set alongside behavioural responses of the people using it, as represented by the demand curve. To derive the supply curve, the relationship is defined between the speed at which people are able to travel and another critical factor known as flow, or the number of vehicles able to pass a given point in the network. Figure 4 shows the form of this relationship.
12
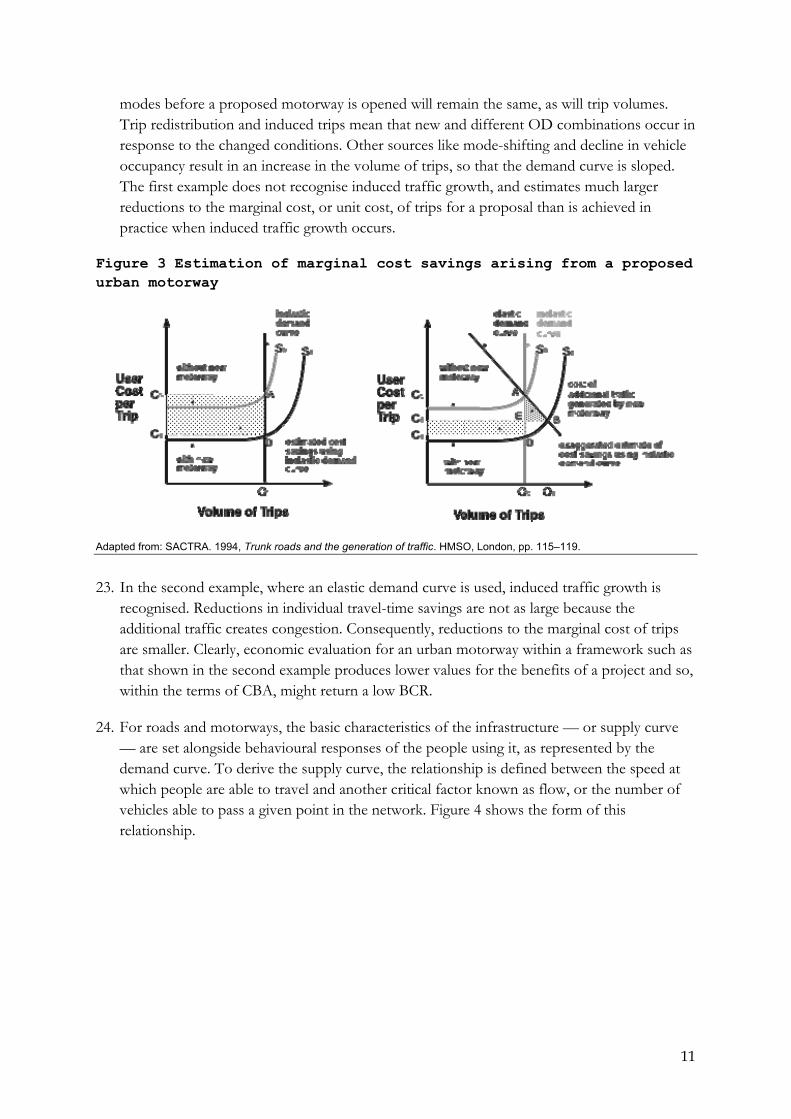
Figure 4 The Speed–Flow–Cost relationship
Source: SACTRA. 1994, Trunk roads and the generation of traffic. HMSO, London, p. 116.
25. When only a few vehicles are using a road facility, the speed at which they travel is set by a legal speed limit or the design speed of the road. The number of vehicles able to travel at this speed can vary, which is why section JK of the speed/flow curve remains flat. But once vehicles reach a critical number, as indicated at point K, the speed begins to fall. This occurs because the stopping distances, or necessary headways between vehicles, begin to encroach on one another. When this happens, drivers travel at slower speeds to reduce headways so that they can stop if necessary for safety reasons. As the number of vehicles increases, headways become very small and speeds low. Queues form, congestion occurs and delays accumulate rapidly throughout section LM as traffic flow deteriorates and becomes unstable (SACTRA 1994, p. 116).
26. The speed/flow curve shown in Figure 4 is equated with a cost curve. Costs for a trip remain the same between JK, irrespective of how many vehicles are on the road. These costs are defined as the operating cost of vehicles and people’s travel time. For most road appraisals, the value of travel-time savings is a critical factor comprising most of the monetised cost benefits which is usually more than 50 per cent and sometimes as high as 80 per cent (Goodwin 1981, p. 99; Rayner 2003, p. 1). As conditions become congested, costs begin to rise, as shown at KL. Where roads begin to reach saturation levels, costs rise more steeply, primarily because of increases in journey times, as indicated at LM. If a new motorway is built or a road is widened so that operating and travel time costs are reduced, the speed–flow relationship changes, as does the cost.
13
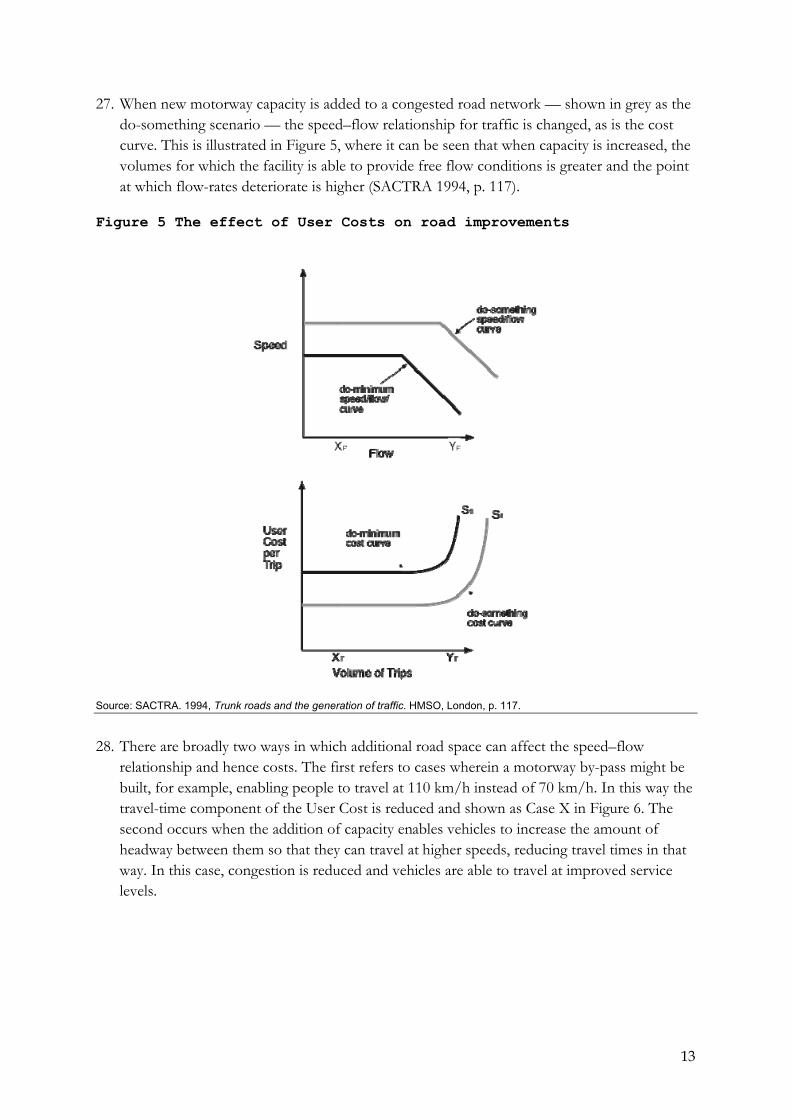
27. When new motorway capacity is added to a congested road network — shown in grey as the do-something scenario — the speed–flow relationship for traffic is changed, as is the cost curve. This is illustrated in Figure 5, where it can be seen that when capacity is increased, the volumes for which the facility is able to provide free flow conditions is greater and the point at which flow-rates deteriorate is higher (SACTRA 1994, p. 117).
Figure 5 The effect of User Costs on road improvements
Source: SACTRA. 1994, Trunk roads and the generation of traffic. HMSO, London, p. 117.
28. There are broadly two ways in which additional road space can affect the speed–flow relationship and hence costs. The first refers to cases wherein a motorway by-pass might be built, for example, enabling people to travel at 110 km/h instead of 70 km/h. In this way the travel-time component of the User Cost is reduced and shown as Case X in Figure 6. The second occurs when the addition of capacity enables vehicles to increase the amount of headway between them so that they can travel at higher speeds, reducing travel times in that way. In this case, congestion is reduced and vehicles are able to travel at improved service levels.
14
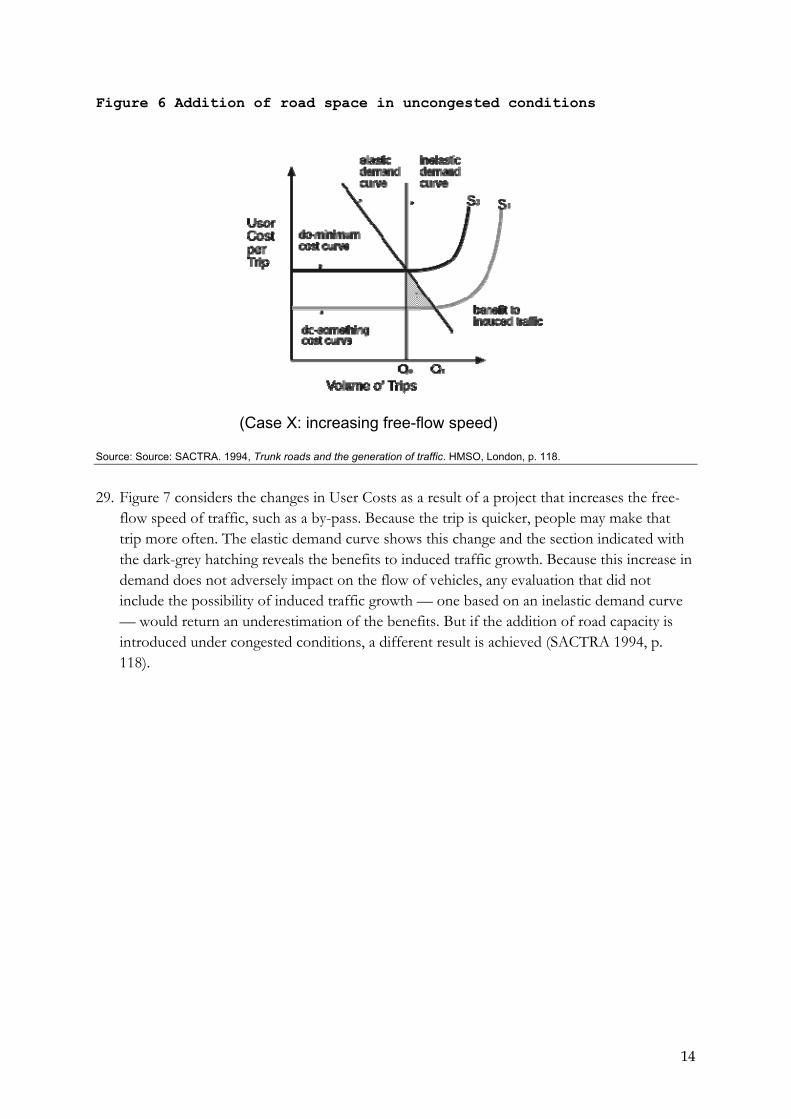
Figure 6 Addition of road space in uncongested conditions
(Case X: increasing free-flow speed)
Source: Source: SACTRA. 1994, Trunk roads and the generation of traffic. HMSO, London, p. 118.
29. Figure 7 considers the changes in User Costs as a result of a project that increases the free-flow speed of traffic, such as a by-pass. Because the trip is quicker, people may make that trip more often. The elastic demand curve shows this change and the section indicated with the dark-grey hatching reveals the benefits to induced traffic growth. Because this increase in demand does not adversely impact on the flow of vehicles, any evaluation that did not include the possibility of induced traffic growth — one based on an inelastic demand curve — would return an underestimation of the benefits. But if the addition of road capacity is introduced under congested conditions, a different result is achieved (SACTRA 1994, p. 118).
15
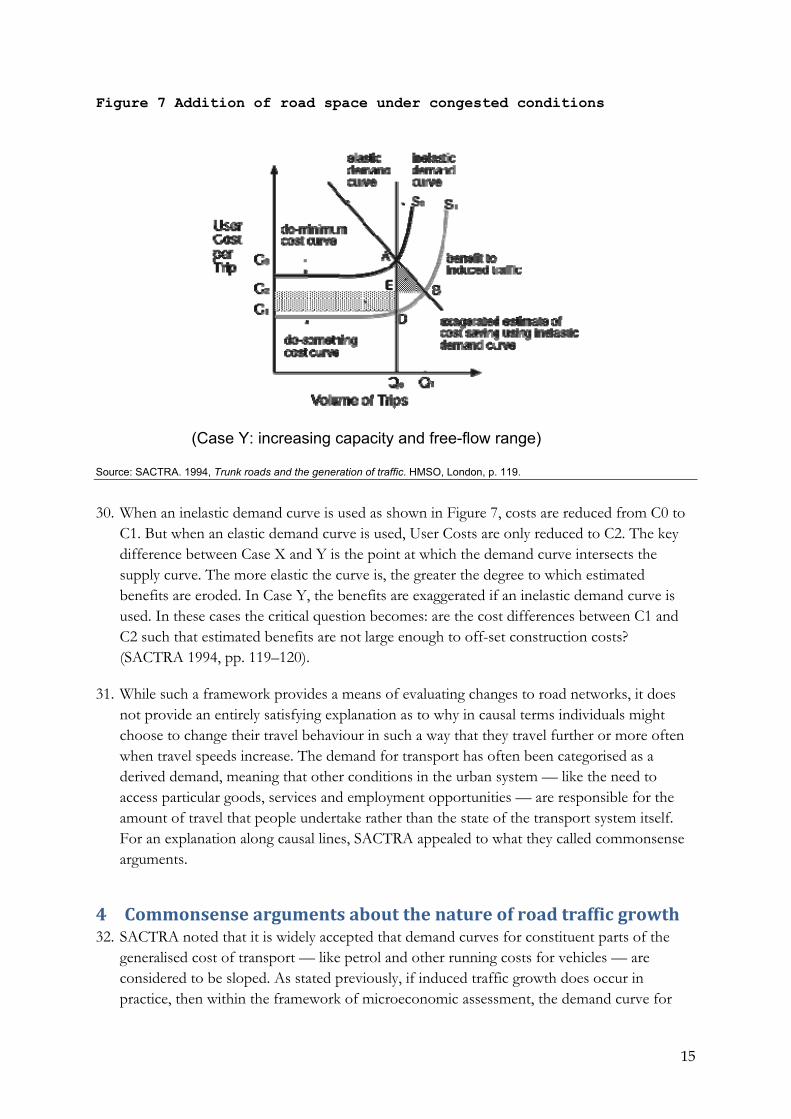
Figure 7 Addition of road space under congested conditions
(Case Y: increasing capacity and free-flow range)
Source: SACTRA. 1994, Trunk roads and the generation of traffic. HMSO, London, p. 119.
30. When an inelastic demand curve is used as shown in Figure 7, costs are reduced from C0 to C1. But when an elastic demand curve is used, User Costs are only reduced to C2. The key difference between Case X and Y is the point at which the demand curve intersects the supply curve. The more elastic the curve is, the greater the degree to which estimated benefits are eroded. In Case Y, the benefits are exaggerated if an inelastic demand curve is used. In these cases the critical question becomes: are the cost differences between C1 and C2 such that estimated benefits are not large enough to off-set construction costs? (SACTRA 1994, pp. 119–120).
31. While such a framework provides a means of evaluating changes to road networks, it does not provide an entirely satisfying explanation as to why in causal terms individuals might choose to change their travel behaviour in such a way that they travel further or more often when travel speeds increase. The demand for transport has often been categorised as a derived demand, meaning that other conditions in the urban system — like the need to access particular goods, services and employment opportunities — are responsible for the amount of travel that people undertake rather than the state of the transport system itself. For an explanation along causal lines, SACTRA appealed to what they called commonsense arguments.
4 Commonsense!arguments!about!the!nature!of!road!traffic!growth!32. SACTRA noted that it is widely accepted that demand curves for constituent parts of the
generalised cost of transport — like petrol and other running costs for vehicles — are considered to be sloped. As stated previously, if induced traffic growth does occur in practice, then within the framework of microeconomic assessment, the demand curve for
16
travel time should also be sloped. Consequently, questions arise as to what types of conditions and scenarios could be responsible for creating a sloped demand curve in relation to travel time and what types of behaviour should we be able to observe that would be indicative of this?
33. In answer to these questions SACTRA compiled several commonsense arguments, prompted by simple observations of travel behaviour changes in response to changes in travel times brought about by road capacity increases.
34. The first observation related to the role of congestion, which is reduced in the immediate aftermath of road capacity additions. If no allowance is made for the suppression of trips by congestion, the committee reasoned, the application of ordinary forecast growth rates would lead to the prediction of absurdly long queues which everyone knows does not happen in practice (SACTRA 1994, p. 34). These occurrences show that the demand for travel changes in accordance with prevailing travel times, so that time may be seen as a scarce resource which individuals must necessarily budget in the same way they allocate other resources which is why the demand curve with respect to travel time is sloped.
35. The second rather bald observation is that if there is no road space, there can be no road users and therefore no induced traffic growth (SACTRA 1994, p. 34). The logical inference being that the amount of road space must to some degree influence the amount of driving that takes place on the network. In this way, traffic volumes are the result of an interplay between supply and demand factors and not driven purely by a level of demand that is shaped by activities at destinations but also time factors arising from the transport supply conditions.
36. The third, admittedly exaggerated, argument is that if it were possible to construct a transport link capable of providing five-minute trips between London and Melbourne, for example, the amount of traffic between the two cities would increase in response (SACTRA 1994, p. 34). Such a condition suggests that demand can be created, or triggered, by a new supply where travel times are dramatically reduced.
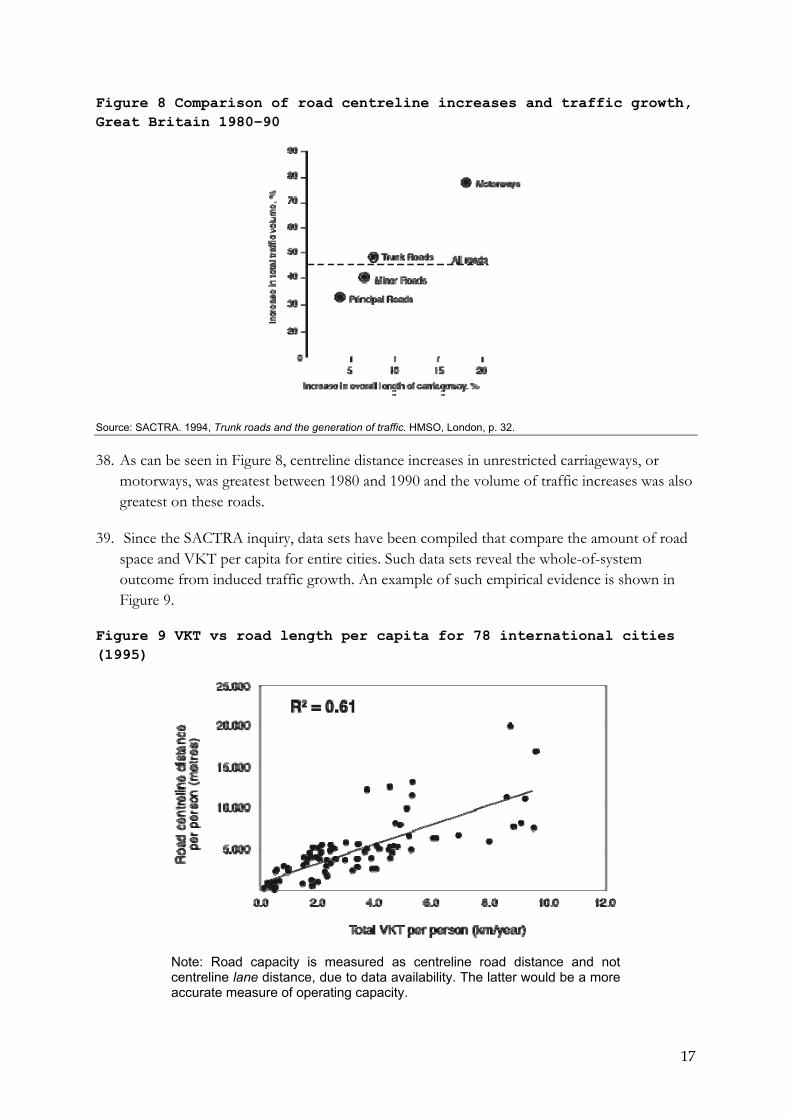
37. A submission from the Institution of Highways and Transportation to the SACTRA inquiry showed that the classes of roads in Britain with the highest rates of traffic growth are closely associated with those that have experienced the greatest increase in capacity (SACTRA 1994, p. 32). The results from that submission are shown in Figure 8.
17
Figure 8 Comparison of road centreline increases and traffic growth, Great Britain 1980–90
!
Source: SACTRA. 1994, Trunk roads and the generation of traffic. HMSO, London, p. 32.
38. As can be seen in Figure 8, centreline distance increases in unrestricted carriageways, or motorways, was greatest between 1980 and 1990 and the volume of traffic increases was also greatest on these roads.
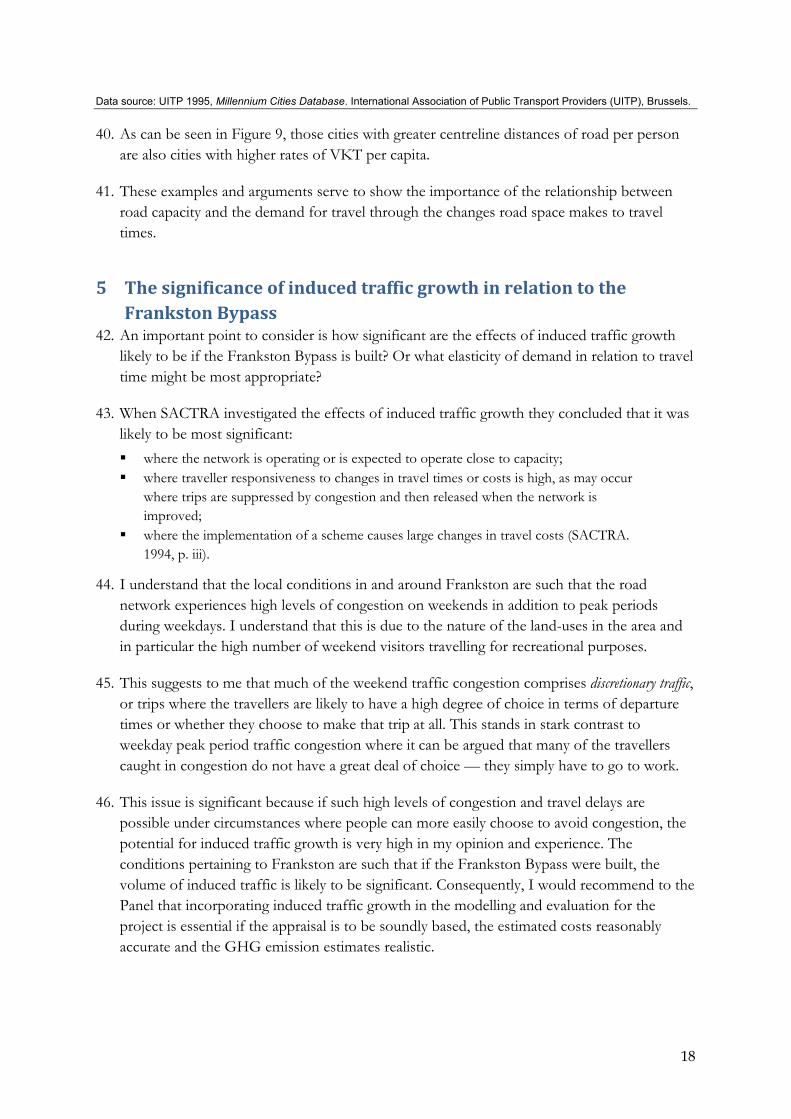
39. Since the SACTRA inquiry, data sets have been compiled that compare the amount of road space and VKT per capita for entire cities. Such data sets reveal the whole-of-system outcome from induced traffic growth. An example of such empirical evidence is shown in Figure 9.
Figure 9 VKT vs road length per capita for 78 international cities (1995)
!
Note: Road capacity is measured as centreline road distance and not centreline lane distance, due to data availability. The latter would be a more accurate measure of operating capacity.
18
Data source: UITP 1995, Millennium Cities Database. International Association of Public Transport Providers (UITP), Brussels.
40. As can be seen in Figure 9, those cities with greater centreline distances of road per person are also cities with higher rates of VKT per capita.
41. These examples and arguments serve to show the importance of the relationship between road capacity and the demand for travel through the changes road space makes to travel times.
5 The!significance!of!induced!traffic!growth!in!relation!to!the!Frankston!Bypass!
42. An important point to consider is how significant are the effects of induced traffic growth likely to be if the Frankston Bypass is built? Or what elasticity of demand in relation to travel time might be most appropriate?
43. When SACTRA investigated the effects of induced traffic growth they concluded that it was likely to be most significant: ! where the network is operating or is expected to operate close to capacity; ! where traveller responsiveness to changes in travel times or costs is high, as may occur
where trips are suppressed by congestion and then released when the network is improved;
! where the implementation of a scheme causes large changes in travel costs (SACTRA. 1994, p. iii).
44. I understand that the local conditions in and around Frankston are such that the road network experiences high levels of congestion on weekends in addition to peak periods during weekdays. I understand that this is due to the nature of the land-uses in the area and in particular the high number of weekend visitors travelling for recreational purposes.
45. This suggests to me that much of the weekend traffic congestion comprises discretionary traffic, or trips where the travellers are likely to have a high degree of choice in terms of departure times or whether they choose to make that trip at all. This stands in stark contrast to weekday peak period traffic congestion where it can be argued that many of the travellers caught in congestion do not have a great deal of choice — they simply have to go to work.
46. This issue is significant because if such high levels of congestion and travel delays are possible under circumstances where people can more easily choose to avoid congestion, the potential for induced traffic growth is very high in my opinion and experience. The conditions pertaining to Frankston are such that if the Frankston Bypass were built, the volume of induced traffic is likely to be significant. Consequently, I would recommend to the Panel that incorporating induced traffic growth in the modelling and evaluation for the project is essential if the appraisal is to be soundly based, the estimated costs reasonably accurate and the GHG emission estimates realistic.
19
47. This conclusion raises the issues of how induced traffic growth might best be included in the modelling and project evaluation, to which aspects of the project would it be especially relevant and what resources would be needed to do this in a reliable and rigorous manner.
48. From a modelling perspective there are two general approaches that can be taken. The first would be to make allowance for induced demand in the algorithms that make up the structure of the transport model. Such an option would take various factors into account in an attempt to replicate the new travel structure for trips made in the region. This is not my area of expertise and so I will not discuss this in detail in this report, except to say that I would be happy to offer suggestions as to independent experts who could be contacted to discuss this aspect of induced traffic growth analysis should the Panel see that as appropriate.
49. The second way to incorporate induced traffic growth into the evaluation is to identify an appropriate elasticity of demand with respect to travel time as raised in the technical report for GHG emissions produced by GHD. This method would not require a large investment of resources and would make the assessment more rigorous than current estimates for traffic volumes and GHG emissions.
50. If this method is pursued, then an important question is what elasticity value should be used?
51. As indicated by the references in the GHD report, a wide variety of elasticity values have been calculated for demand with respect to travel time on the basis of empirical observations of conditions before and after a motorway opening. I am unaware of any comprehensive studies that have been undertaken to establish what factors are responsible for the variation in results, but generally these appear to be caused by differences in the structure of urban systems — the position of — and the geometry of the transport network.
52. In my experience of induced traffic growth case studies, where there is a high degree of trip suppression, traffic volumes rise after the opening of a motorway until they reach a level of congestion commensurate with previous levels. The point in the network at which this occurs shifts to the new choke-point, or point of least capacity in the network.
53. Given the highly discretionary nature of traffic in the Frankston area, it is likely that the volume of induced traffic growth is likely to be high and so ultimately would be constrained by the new network configuration. Given these circumstances, it would seem reasonable to identify what the capacity of the new choke point in the network would be after opening of the Frankston Bypass, calculate the volume of traffic that would be needed to push that section of the network to say Level of Service C and D, and consider these as likely induced traffic growth estimates.
54. In addition to this method, it would also seem reasonable to examine average demand elasticities for travel time and compare these with the elasticity derived using the method suggested in paragraph 64. I would recommend to the Panel, that each of these approaches be considered.
20
6 Sustainability!implications!of!increasing!relative!accessibility!for!car!traffic!by!building!the!Frankston!Bypass!
55. In the definition of induced traffic growth outlined in the EES Summary Report, it would appear that what was defined as development traffic in paragraph 15 of this report, was not considered to be classified as induced traffic growth as revealed in the statement:
Sir Rod Eddington (2008) notes that most travel behaviour changes occur soon after the opening of a new or improved road. However, in the longer-term population growth, land development and social and economic changes also occur. The travel associated with these factors is often mistakenly identified as ‘induced travel’, when it is really the consequences of changing patterns of residential, business and jobs growth. Due to the complexity of induced demand, it was not considered feasible to reliably and rigorously model this transport concept (SEITA. 2008, p. 3-48).
56. However, in previous explanations the EES Summary Report lists one of the various responses that give rise to induced traffic growth in the following way:
Newly generated trips: a)where people decide to undertake a trip that may not have been considered worthwhile before the provision of the new road, and b) where changes to land use patterns and increased economic activity result in additional trips in areas accessed by the new road (SEITA. 2008, p. 3-47).
57. In this, the definition of induced traffic growth outlined in the EES Summary Report is ambiguous. It cites the Eddington Report in relation to changes in patterns of land-use development induced by additional capacity — which is consistent with the SACTRA Report — and yet concludes that people confuse this with induced traffic growth, which suggests the authors do not consider these responses consistent with the outcomes associated with induced demand.
58. By contrast, the GHD report unambiguously includes development traffic in its definition of induced traffic growth. In this, the GHD report is consistent with the definition set by SACTRA and consequently the standards for project appraisal that grew out of SACTRA that are now used in the UK and which the GHD consultants used to guide their assessment of GHG emissions for the project. I assume the reason for the GHD consultants doing this is the relative lack of guidance provided by government on these matters for development in Australia.
59. In light of this ambiguity, I would like to recommend that the Panel ask for clarification on this point. I feel this is critical because construction of the Frankston Bypass is likely to have far reaching implications for patterns of building form and land-use development within the Frankston area and surrounding districts that will in turn have significant implications for the long term sustainability credentials and economic viability of development in the area.
60. This last point begins to move beyond the scope and resources of this report. I have not had the time and resources to examine Melbourne 2030 — Planning for Sustainable Growth and thereby understand the way in which sustainable development has been defined or the empirical grounds and reference points that have been used to substantiate the broad strategic direction selected. However, it is important to consider and be aware of the way in
21
which the logistical properties of different transport modes affect land-use development and therein hardwire particular travel behaviour patterns into the urban system. Once the requisite resources required to ensure access to jobs and services under these conditions is jeopardised, access is difficult to sustain. It is also very difficult to retrofit such forms of development with transport infrastructures and services that have inherently different logistical properties at a later date.
61. If these aspects have not been considered and incorporated into the assessment of the Frankston Bypass, then actual outcomes are likely to vary widely from the results expected to date. I also feel that maintaining access throughout the area — both local and regional — will become increasingly difficult in the future as pressures from rising energy prices and eventual shortages affect the transport sector over the next decade.
7 Concluding!remarks!62. In summary, I hope that I have been able to emphasise the importance of including induced
traffic growth in the assessment for road proposals for Melbourne and Victoria generally, and the Frankston Bypass specifically and that the Panel will advise the project proponents to recalculate the estimated traffic volumes for the project and GHG emission levels.
63. When included, induced demand will affect the current BCR for the project. In all likelihood, it will lower the value given reductions in travel times owing to higher congestion levels in some parts of the network than is the case for current calculations. The costs associated with GHG emission levels will also be higher once allowance for induced traffic growth is made.
64. The reduction in BCR may or may not be great enough to significantly impact on the financial viability of the project. I am unable to provide advise on this aspect of the analysis as it is not within my capacity given the resources available to undertake that. However, such a task is well within the abilities of the consultants asked to assess the Frankston Bypass and it is vital that it be done given the network and land-use conditions that apply to the project.
65. I have made all the inquiries that I believe are desirable and appropriate and that no matters of significance which I regard as relevant have to my knowledge been withheld from the Panel.
8 References!Armstrong, B. 2004, Personal communication. Roads & Traffic Authority of New South Wales, Sydney
GHD. 2008, Report for Frankston Bypass. Environment effects statement. Technical Report: greenhouse gas emissions assessment. Southern and Eastern Integrated Transport Authority, Melbourne.
Goodwin, P. & Noland, R.B. 2003, 'Building new roads really does create extra traffic: a response to Prakash et al.' in Applied Economics, Vol. 35, No. 13, pp. 1451–1457.
Goodwin, P.B. 1981, 'The usefulness of travel budgets', in Transportation Research A, Vol. 15A, pp. 97–106.
22
Maunsell Australia, 2008, Strategic Transport Modelling Technical Report, Southern and Eastern Integrated Transport Authority, Melbourne.
Rayner, T. 2003, 'The access to Hastings multi-modal transport study', REGIONET Workshop III: evaluation methods and tools for regional sustainable development, CURE, Manchester University, Manchester.
RTA. 1995, Traffic volume data for Sydney Region 1993. Roads & Traffic Authority of New South Wales, Sydney.
SACTRA. 1994, Trunk roads and the generation of traffic. HMSO, London.
SEITA. 2008, EES for Frankston Bypass: Summary Report. Southern and Eastern Integrated Transport Authority, Melbourne.
UITP 1995, Millennium Cities Database. International Association of Public Transport Providers (UITP), Brussels.
Zeibots, M. E. 2007, Space, time, economics and asphalt: an investigation of induced traffic growth caused by urban motorway expansion and the implications it has for the sustainability of cities. Doctoral dissertation. Institute for Sustainable Futures, University of Technology, Sydney.